delft climate kic 070212 part 2
TRANSCRIPT
How to Fail Less
Business Models and Customer Development
Steve Blankwww.steveblank.com
@sgblank

Agenda – Day One
• 9:00 - 11:00 Introduction to Customer Development• 11:00 - 11:30 break
• 11:30 - 13:00 value proposition
customer segments• 13:00 – 14:30 lunch working session
Students prepare first version of business model canvas• 14:30 – 16:00 Student presentation of business
model canvas• 16:00 – 16:15 break
• 16:15 – 17:00 distribution channels

Agenda – Day One
• 9:00 - 11:00 Introduction to Customer Development• 11:00 - 11:30 break
• 11:30 - 13:30 value proposition
customer segments• 12:30 – 13:30 lunch working session
Students prepare first version of business model canvas• 13:30 – 15:00 Student presentation of business
model canvas• 15:00 – 15:15 break
• 15:30 – 16:30 distribution channels
Homework: 1) update your canvas
2) develop a customer discovery action plan

Agenda – Day Two
• 9:00 - 10:30 Student presentations on customer discovery action plan
• 10:30 - 11:30 customer relationships (get/keep/grow)• 11:30 – 12:00 break
• 12:00 - 13:00revenue streams• 13:00 – 14:00 lunch working session
Students present• 13:30 – 14:15 partners• 14:15 - 15:00resources, activities, costs• 15:00 – 15:15 break
• 15:30 – 16:30 Customer Development Manifesto

The Lean LaunchPad
Lecture 4: Distribution Channels
How does your Product Get to Customers?
Version 6/22/12

Channels
How does your Product Get to Customers?

© 2012 Steve Blank
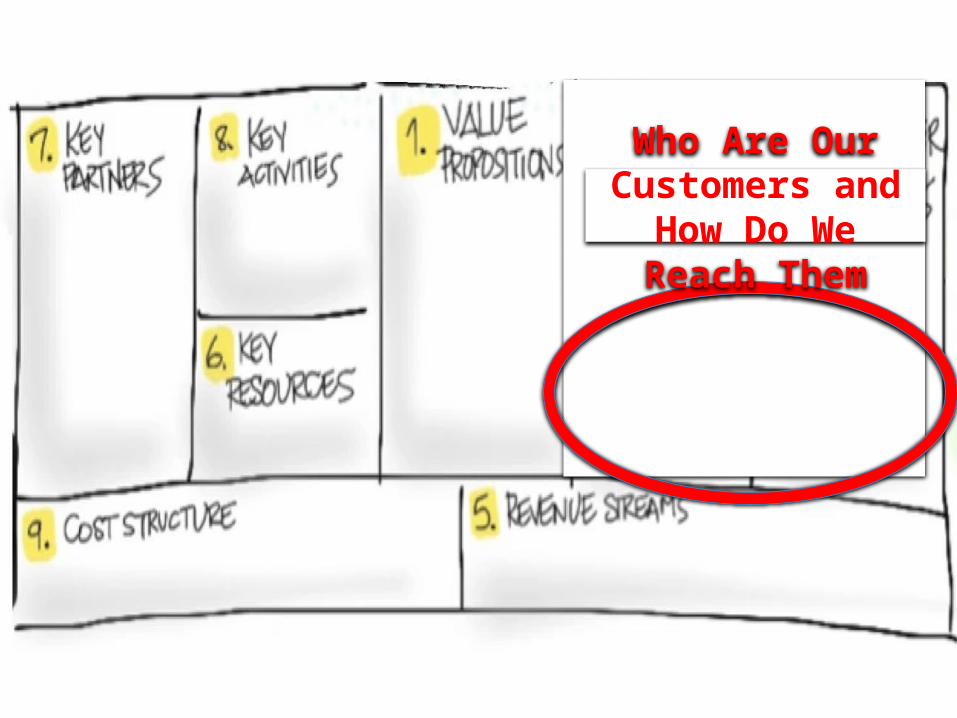
Who Are Our Customers and How Do We Reach Them

Physical versus Virtual Channels


How Do You Want Your Product to Get to Your Customer?
11
Yourself
Through someone else
Retail
Wholesale
Bundled with other goods or services
üüüüü
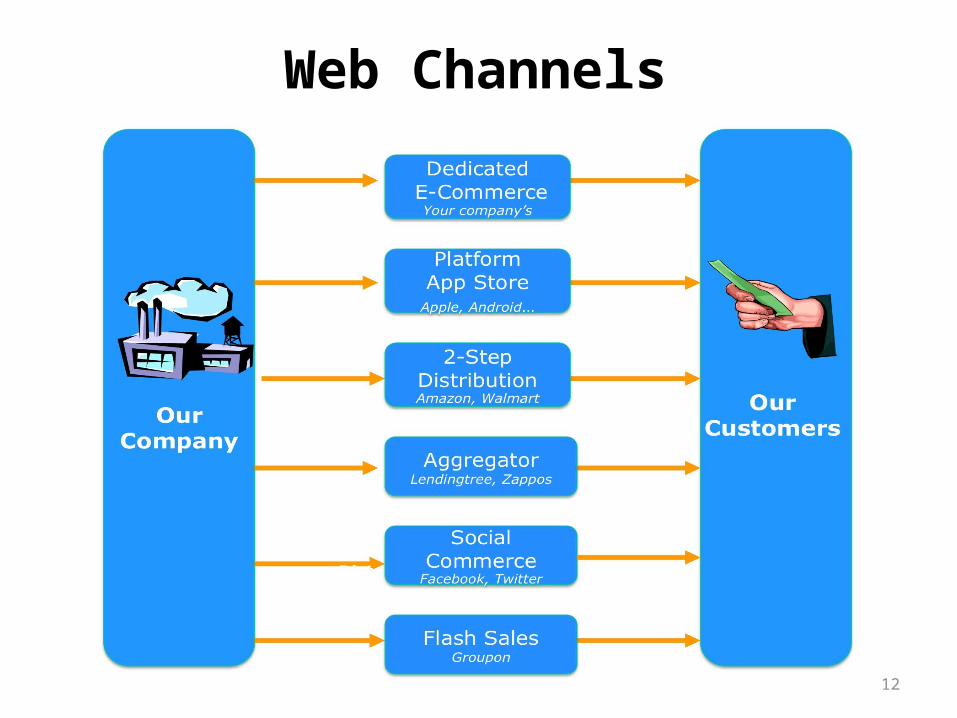
Web Channels
12
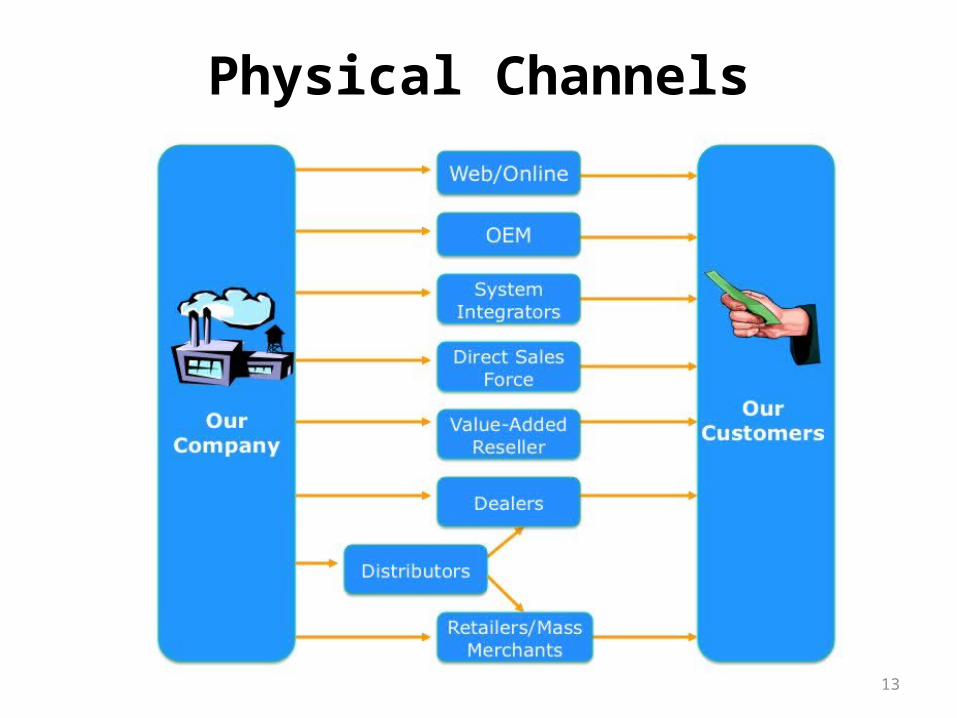
Physical Channels
13
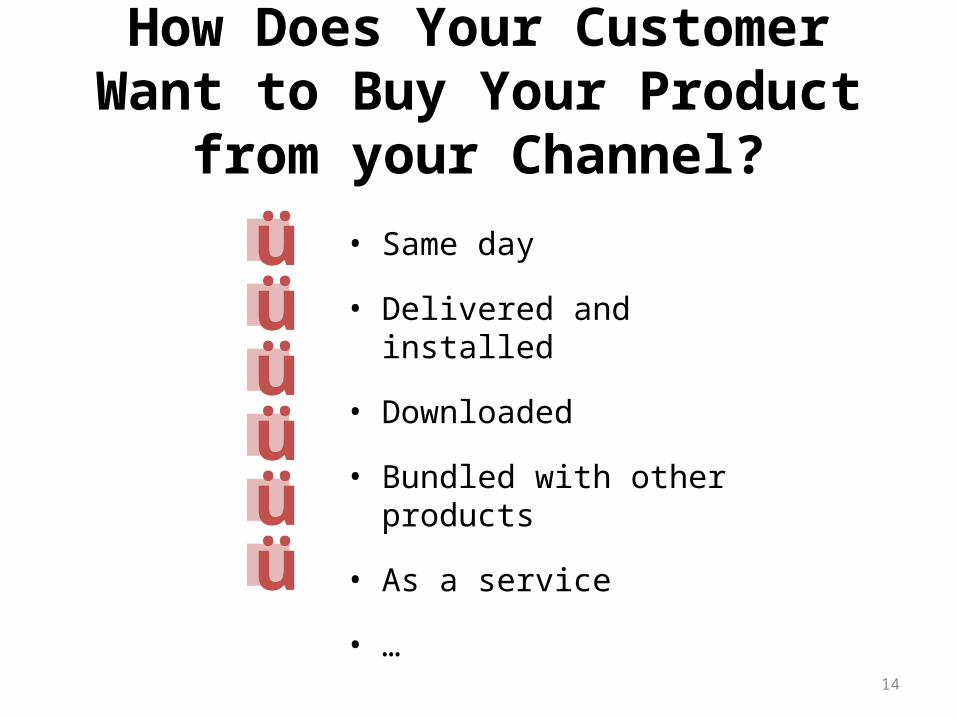
How Does Your Customer Want to Buy Your Product from your Channel?
14
• Same day
• Delivered and installed
• Downloaded
• Bundled with other products
• As a service
• …
üüüüüü

Types of Channels
15
– OEM– VAR– Reseller– Distributor
Direct Indirect Licensing

Distribution Complexity
16
Evangelists
ServiceTechnicians
Higher Value Added
Higher Volume
Direct Sales
VARs
Retail
Web, Telesales
Systems Integrators
Mainframes
MinisLANs
PC ServersDesktop PCs
PrintersKeyboards
Toner
WANs
Global Systems
Solution Complexity
Ma
rke
tin
g C
om
ple
xity

How Do the Economics Work in Different Sales Channel?
How Are Channels Compensated?
18
– Commission
– Percentage of sales price
– Discounted pre-purchase
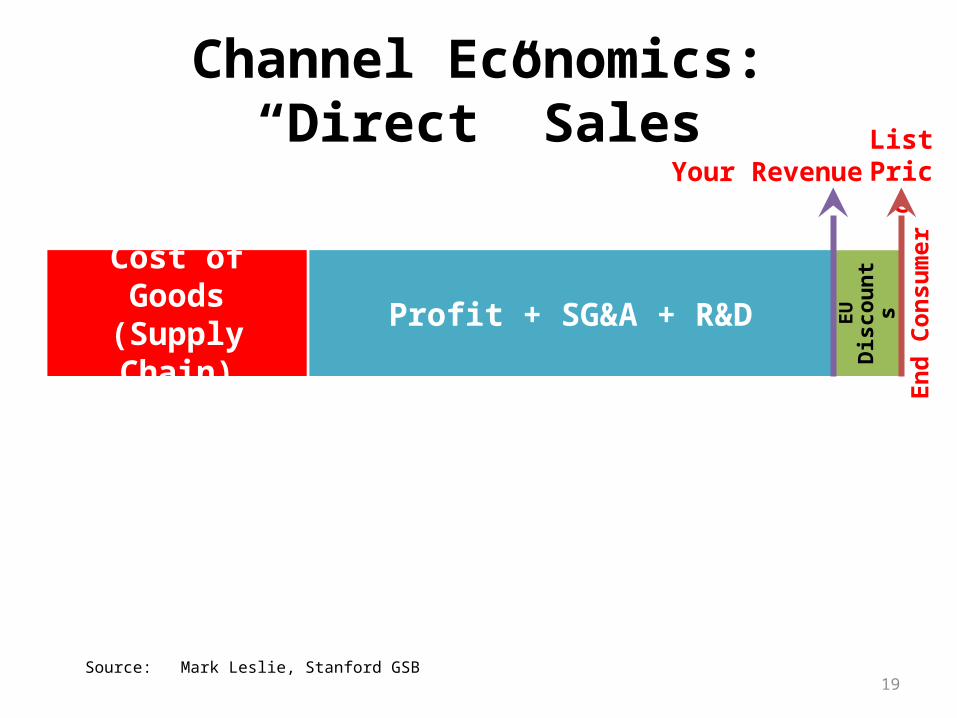
Channel Economics: “Direct” Sales
19
Profit + SG&A + R&D
En
d C
on
sum
er
EU
D
isco
un
ts
Your RevenueList
Price
Source: Mark Leslie, Stanford GSB
Cost of Goods(Supply Chain)

Channel Economics: Resellers
20
Cost of Goods(Supply Chain)
Profit + SG&A + R&D
En
d C
on
sum
er
EU
D
isco
un
ts
Reseller
Your RevenueList
Price
Source: Mark Leslie, Stanford GSB

Profit + SG&A + R&D
Channel Economics: Distributors/Resellers
21
En
d C
on
sum
er
EU
D
isc
ou
nts
Reseller
Dis
trib
uto
r
Your RevenueList
Price
Source: Mark Leslie, Stanford GSB
Cost of Goods(Supply Chain)

The Channel as a Customer
22
– Some products are embedded in others (OEM)
– Some products are resold by others (VARs)
– Some products are distributed by others
– Who’s the customer?

Channel Economics: OEM or IP Licensing
23
Your Product Becomes Your Customer’s Cost of Goods Source: Mark Leslie, Stanford GSB
En
d C
on
sum
er
ResellerProfit + SG&A
+ R&D
Cost of Goods
(Supply Chain)
EU
D
isc
ou
nts
Reseller
Dis
trib
uto
r
Mas
ter
Dis
trib
uto
r
Profit + SG&A + R&D
Cost of Goods(Supply Chain)
Your RevenueList
Price
How Are Channels Motivated or Incented?
24
– Money! – what makes them the most?
– Training
– Marketing to the channel
– SPIF
Book Publishing Channel Example

Example: Book Publishing
26
PublisherNational
DistributorPrinter Wholesaler Retailer Customer

Book Publishing
27
•Percent of
Retail
• You get- 35% of retail- the distributor gets 10%- the wholesaler gets 15% - the retailer gets 40%
- less any discount they offer the customer
PublisherNational
WholesalerDistributor Retailer Customer
35% 15% 10% 40%
$7.00 $3.00 $2.00 $8.00 $20.00
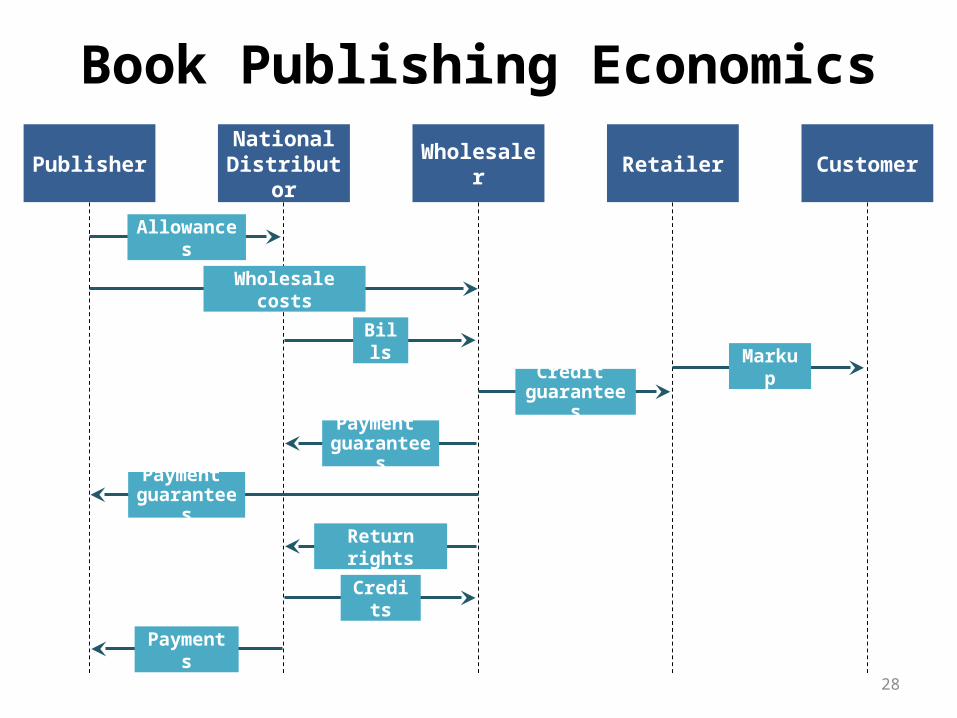
Book Publishing Economics
28
PublisherNational
DistributorWholesaler Retailer Customer
Wholesale costs
Markup
Allowances
Payment guarantees
Payments
Bills
Credit guarantees
Payment guarantees
Return rights
Credits

Book Publishing Delivery
29
PublisherNational
DistributorPrinter Wholesaler Retailer
Merchandise titles
Sell magazines
Acknowledge returns
Determine allocations
Dispose of returns
Prepare film (content)
Establish identity
Create demand
Prepare galleys
Receive Schedules Print orders Bundle
counts Film
Print and ship magazines
Deliver orders

Medical Device Channel Example

Patients
Product flow/Channel
Fluid SynchronyElectronic
Health Records
.Partners/
OEMS
Hospitals(AnesthesiologistsNeurosurgeons)
Pain Clinic(AnesthesiologistsNeurosurgeons)
Pump + Controller
Support Services
Bundled Kits
Electronic Records

Channels (Direct)
• Direct to institutions• Some formularies involved in purchase decisions• Some doctors make purchase decision directly
• Device company/Doctor relationship is key • Heavily influenced by :
• Clinical study results • Regulatory approval• Reimbursement
Hospitals
Pain Clinics
Farm Sensor IndustryChannel Example
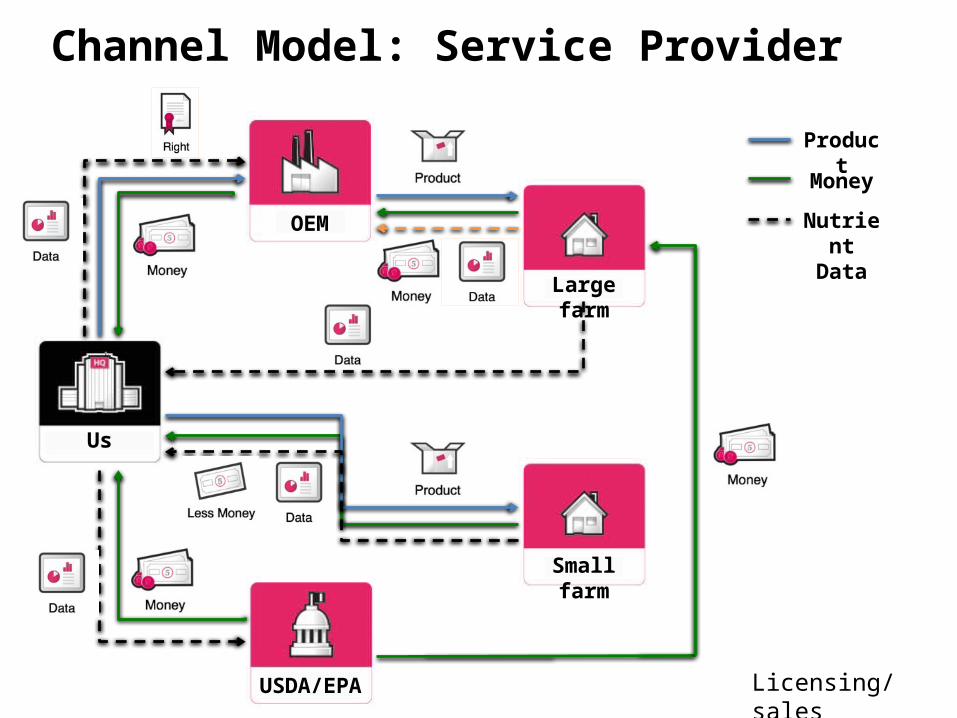
Channel Model: Service Provider
OEM
Us
Large farm
USDA/EPA
Small farm
Product
Money
Nutrient Data
Licensing/sales

Channel Model: Service Provider
OEM
Us
Large farm
USDA/EPA
Small farm
Product
Money
Nutrient Data
Licensing/sales
Product
Service
Dental ProductChannel Example

COST / PROFIT ANALYSIS
R&D Maintaining IP
End
user
Our revenue 4-8% revenues List price
Per unit cost and profit estimation
Licensing Revenue Model
Raw materials
Manufacturing &
Packaging
License fee Distribution
37
Univ.License
fee

End User
Health-Care Providers:Hospitals
PractitionersClinics
InsuranceAgencies
Customer segment: Large
corporationsJ&J, GSK, 3M
DMXR&D
ProductsProcedures
IPs
$$$
~$40
$$
University
4-8% royalty
2-4% license fee
Licensing of Technology Ecosystem
38

Medical Device Channel Example 2

IndividualDoctors
Purchasing Administrato
rs
High value medical products
(e.g. cardiovascular stents)
Commodity medical products
(e.g. latex gloves)
• Doctor education• Direct feedback from doctors• Very expensive
• No doctor education• No customer feedback• Inexpensive
Direct Sales
Distributors
MammOpticsChannel Strategies and Costs
Individual Doctors
Purchasing Administrato
rs

Channel Strategies and CostsMammOptics
5 dedicated sales people$150,000 each/year
Hire nurses or technicianswith establishedrelationships
Early adopter feedback
Continue with core group of sales people
Use women’s healthcare equipment distributor
Already established network of customers
Sales strategy 1 Sales strategy 2

Dental Product 2Channel Example
Private PracticeDentist
PurchasingDepartment
Big Distributors
InstitutionalDentist
Direct Sales
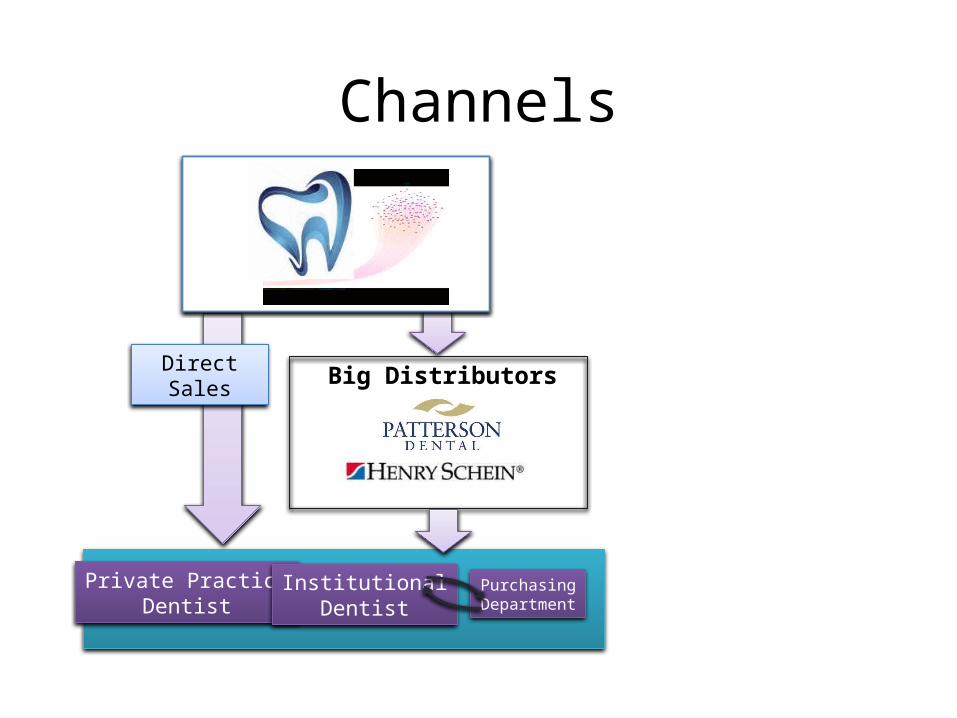
Channels
Private PracticeDentist
PurchasingDepartment
Big Distributors
InstitutionalDentist
Direct Sales
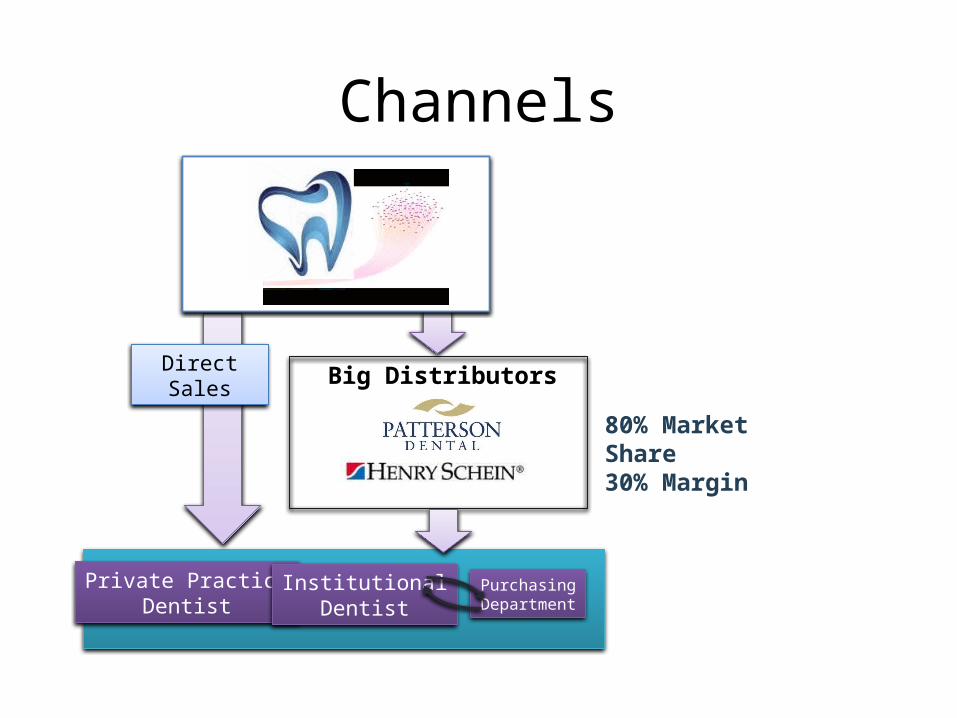
Channels
80% Market Share30% Margin

Private PracticeDentist
PurchasingDepartment
Big Distributors
InstitutionalDentist
Direct Sales
Channels
80% Market Share30% Margin
ContinuingEducationCourses
Magazines& Email
TradeShows
Online RentalChannel Example

47
Listings Provider
Tenants
Landlords
PropertyManagers
Service Providers
Potential Landlords
Realtors
Web Info
Show, Advise, Valuate
Sell, Advise
MaintenanceFurnishing
Listings,ChecksRent Payment
Moving
CraigslistPadmapper.com
Rent.comApartment.com
Forrent.com
Credit ChecksSafetenantcheck.c
Erenter.com
Payment FacilitatorRentpayment.com
Clearnow.comOnline Cheque
Listings, ChecksRent Payment
Maintenance FindingZoospi.com
Redbeacon.comTaskrabbit.com
Schedule Tools
Yelp.com
Angie’s List
Setster.com
Find information
Servicemagic.com
Zoospi.com
Rentpost.comRentjuice.com
Buildium.comRentingsmart.co
Propertyware.com
Rentjuice.comPropertyware.co
Rentingsmart.co
Buildium.com
propertymanagemnt360
Maintenance Ratings
Trulia.com
PM Tools

Dental Product 3Channel Example

COST / PROFIT ANALYSIS
Raw active ingredient
Manufacturing &Packaging
Profit + R&D + License fee Distributor
$40 *$27%32 cut
$6 ? ($5) ~$11 ~$13
End
user
Our revenue List pricePer unit cost and profit estimation
Direct Sales Revenue Model
49
* Competition• NuPro prophy paste (Novamin $50)• NuPro desensitizer (Novamin $93)• MI varnish (Recaldent $100)• Gluma desensitizer (Glutaraldehyde $130)• Health-Dent desensitizer (Fluoride $49)
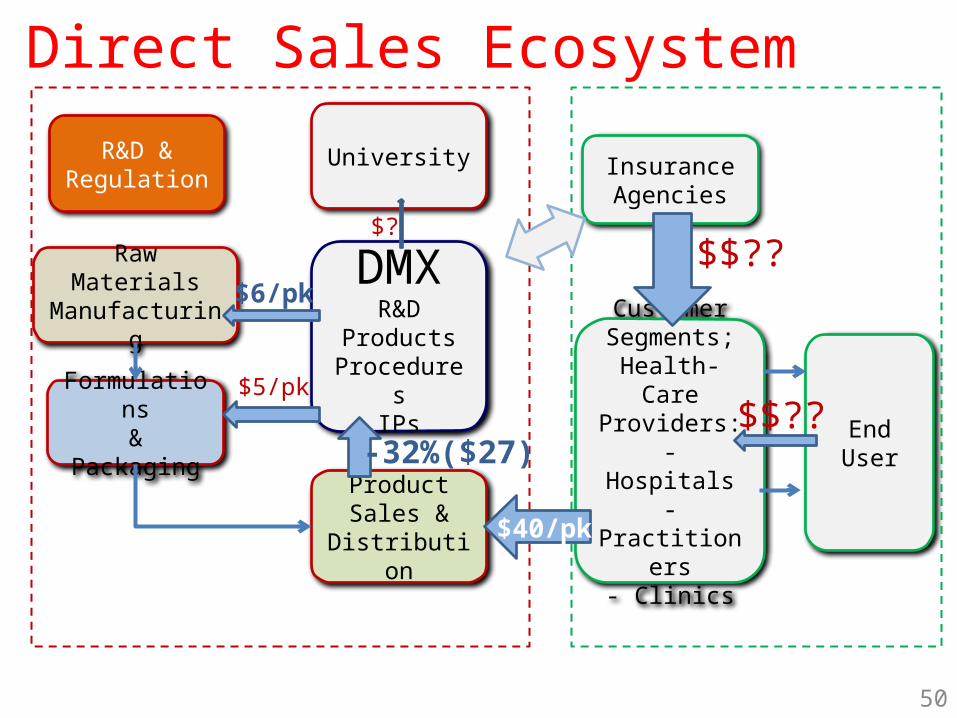
End User
Customer Segments;
Health-Care Providers:- Hospitals
- Practitioners- Clinics
InsuranceAgencies
Product Sales &
Distribution
Formulations& Packaging
Raw MaterialsManufacturing
DMXR&D
ProductsProcedures
IPs
$$??$6/pk
$5/pk$$??
University
-32%($27)
$?
Direct Sales Ecosystem
R&D &Regulation
$40/pk
50
Channel Example

Distribution Food Chain
52
Precursor Synthesis
Finished product
Precursor in Cassette
Cassette (device)
I-Corps Final Presentation 12/14/11

Channel Example

Travel IndustryChannel Example

Travel Services:Impact of Changing Technology

The Advent of GDS Systems (1980 -1995)
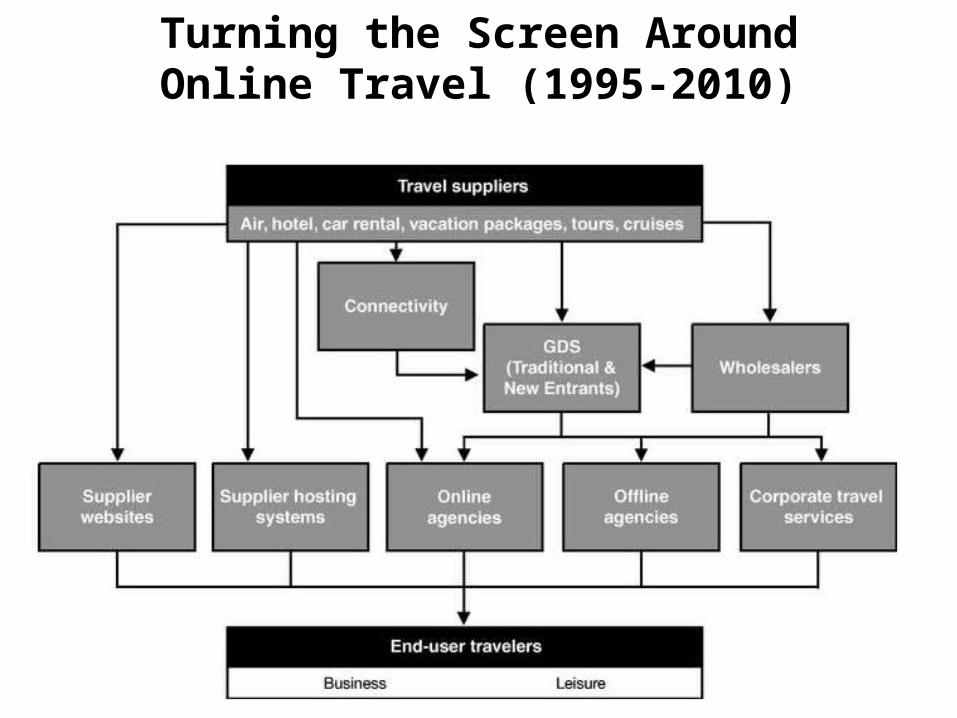
Turning the Screen AroundOnline Travel (1995-2010)

The Lean LaunchPad
Lecture 5 Customer Relationships
Version 6/13/12
How Do You Get/Keep/Grow Customers?

Customer Relationships
How do you Get, Keep and Grow Customers?

© 2012 Steve Blank

Customer Relationships Physical & Web Mobile Are Different
© 2012 Steve Blank

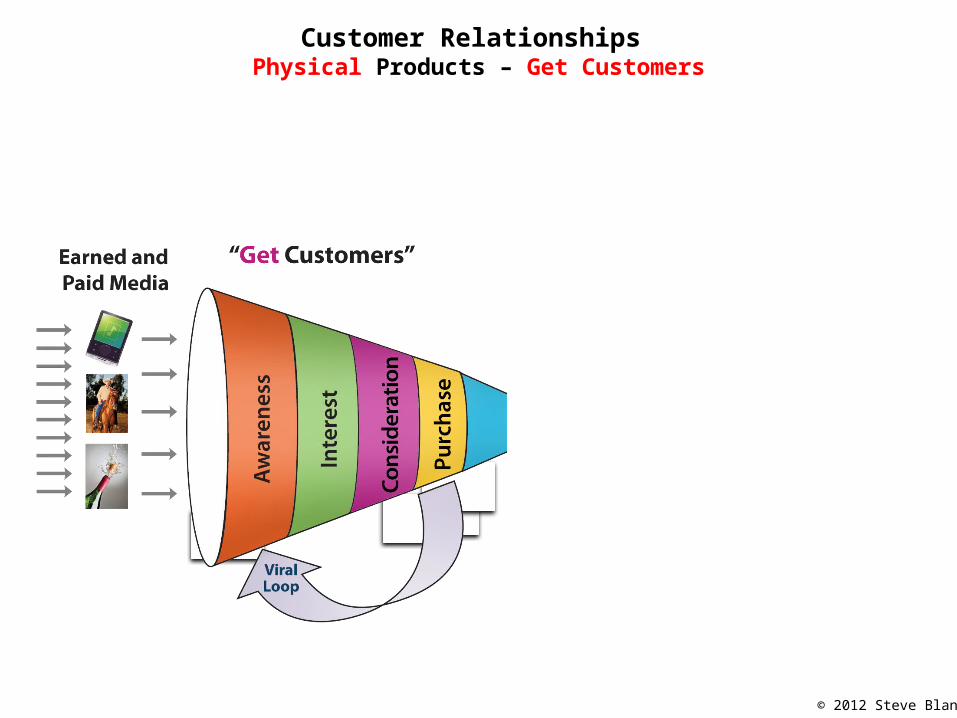
Customer Relationships Physical Products – Get Customers
© 2012 Steve Blank

Customer Archetypes Drive Get/Keep/Grow
• What’s their role?– How this person is evaluated / promoted /
compensated?
• Who are they?– Buyer’s name– Position / title / age / sex
• How do they buy?– Discretionary budget (name of budget and
amount)
• What matters to them?– What motivates them?
• Who influences them?– What do they read/who do they listen to?
Lab Manager: Brian

Paid Demand Creation Activities“Paid” Media
• Public Relations• Advertising• Trade Shows• Webinars• Email marketing• On-line SEM • Biz Dev
Demand Creatio
n

Free Demand Creation Activities“Earned” Media
• Publications in journals• Conference speeches/papers• Educational seminars• Public relations• Blogging / Sharable content• Social Media• Communities
Demand Creation
Customer Relationships Physical Products – Get Customers
© 2012 Steve Blank

Customer Relationships Physical Products – Get Customers
© 2012 Steve Blank
CAC = Customer Acquisition Cost
Customer Acquisition Cost versus Sales Complexity
Rough Estimates of Cost of Customer Acquisition (CAC)
Source: David Skok Matrix Partners

Customer Relationships Physical Products – Keep Customers
© 2012 Steve Blank

Customer Relationships Physical Products – Keep Customers
© 2012 Steve Blank
Attrition/Churn

Customer Relationships Physical Products – Grow Customers
© 2012 Steve Blank
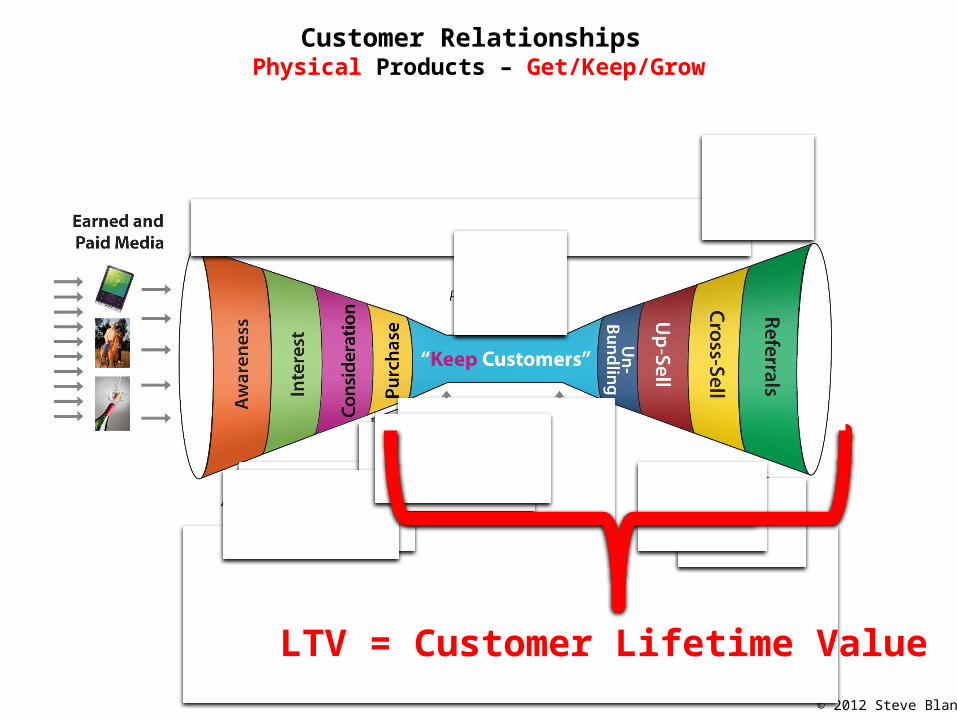
Customer Relationships Physical Products – Get/Keep/Grow
© 2012 Steve Blank
LTV = Customer Lifetime Value
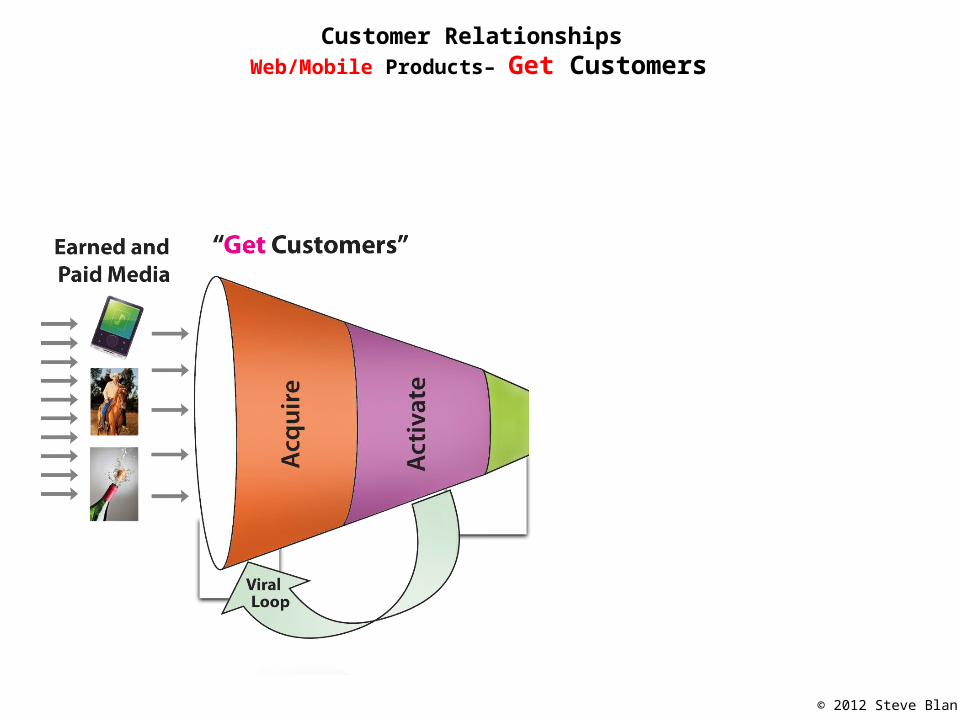
Customer Relationships Web/Mobile Products– Get Customers
© 2012 Steve Blank

Web/Mobile Products– Get Customers
© 2012 Steve Blank
CPM = cost per thousand hits

Web/Mobile Products– Get Customers
© 2012 Steve Blank
CPA = Cost per Action

SaaS Products– Get Customers
© 2012 Steve Blank
Organic Traffic, SEM, Other Paid
Sources
Raw Leads
Registered Visitors
Qualified Leads
Inside SalesClosed Deal

Web/Mobile Products– Keep Customers

Our Example Marketing Funnel
Quick Marketing Calculation 50% amount of traffic that is organic versus paid
$1.50 cost per paid visitor (Google AdWords, etc.) $ 0.75 Cost per visitor (both paid and unpaid)
3% visitors convert to raw leads 20% number of raw leads that turn into qualified leads
1 qualified lead 5 raw leads required
167 visitors required $125 Cost of visitors (also = Cost per qualified lead)
Source: David Skok Matrix Partners

Our Example Marketing Funnel
Quick Marketing Calculation 50% amount of traffic that is organic versus paid
$1.50 cost per paid visitor (Google AdWords, etc.) $ 0.75 Cost per visitor (both paid and unpaid)
3% visitors convert to raw leads 20% number of raw leads that turn into qualified leads
1 qualified lead 5 raw leads required
167 Visitors required $125 Cost per qualified lead
Source: David Skok Matrix Partners

Our Example Marketing Funnel
Cost per Qualified Lead $125 Leads to closed deal 10Marketing Costs per closed deal $1,250
Source: David Skok Matrix Partners
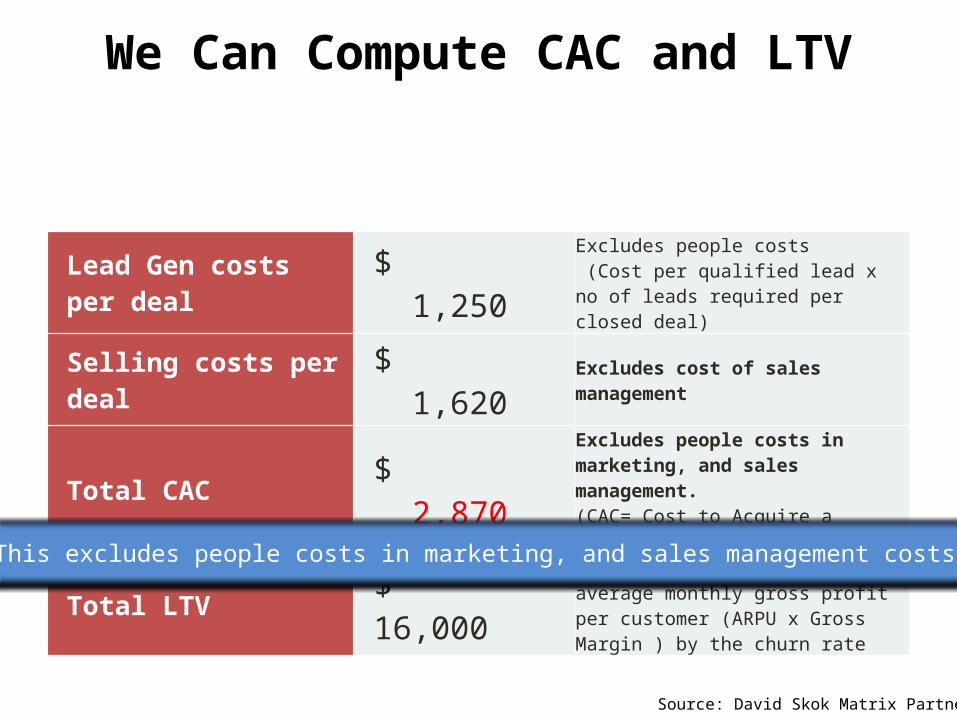
We Can Compute CAC and LTV
Lead Gen costs per deal $ 1,250 Excludes people costs (Cost per qualified lead x no of leads required per closed deal)
Selling costs per deal $ 1,620 Excludes cost of sales management
Total CAC $ 2,870 Excludes people costs in marketing, and sales management. (CAC= Cost to Acquire a Customer)
Total LTV $ 16,000 Calculated by dividing average monthly gross profit per customer (ARPU x Gross Margin ) by the churn rate
This excludes people costs in marketing, and sales management costs
Source: David Skok Matrix Partners

Balancing CAC/LTV in a SaaS model
LTV CAC> 3x
Months to recover CAC < 12 months
Required for Capital Efficiency
Source: David Skok Matrix Partners

What Investors are Looking For
Monetization(LTV)
Cost toAcquire aCustomer
(CAC)
A well balanced business model
Source: David Skok Matrix Partners

The Balancing Act
Monetization(LifeTime Value LTV)
Cost to Acquire a Customer (CAC)
• Viral effects• Inbound Marketing• Free or Freemium• Open Source• Free Trials• Touchless conversion• Inside Sales• Channels• Strategic partnerships
• Scalable Pricing• Cross Sell/Upsell• Product line expansion• Lead Gen for 3rd parties
Source: David Skok Matrix Partners

The Balancing Act
Monetization(LifeTime Value LTV)
Cost to Acquire a Customer (CAC)
• Viral effects• Inbound Marketing• Free or Freemium• Open Source• Free Trials• Touchless conversion• Inside Sales• Channels• Strategic partnerships
• Field Sales• Outbound
Marketing
• Scalable Pricing• Cross Sell/Upsell• Product line expansion• Lead Gen for 3rd parties
• High Churn Rates• Low customer
satisfaction
Source: David Skok Matrix Partners

Customer Relationships Web/Mobile Products– Keep Customers
© 2012 Steve Blank

How Churn affects LTV
• Average customer lifetime in months =
1 / Monthly Churn
Source: David Skok Matrix Partners

How Churn affects Lifetime
1% 2% 5%0
20
40
60
80
100
120
100
50
20
Lifetime vs Churn RateMonths
Monthly Churn
Source: David Skok Matrix Partners

How Churn affects LTV
Lifetime Value
Monthly Churn
Source: David Skok Matrix Partners

Impact of lowering Churn
Month 1
Month 3
Month 5
Month 7
Month 9
Month 11
Month 13
Month 15
Month 17
Month 19
Month 21
Month 23
Month 25
Month 27
Month 29
Month 31
Month 33
Month 35
$(400,000)
$(200,000)
$-
$200,000
$400,000
$600,000
$800,000
$1,000,000
$1,200,000
Net Profit
Churn 1.25% Churn 2.5%
Month 1
Month 3
Month 5
Month 7
Month 9
Month 11
Month 13
Month 15
Month 17
Month 19
Month 21
Month 23
Month 25
Month 27
Month 29
Month 31
Month 33
Month 35
$(4,000,000)
$(2,000,000)
$-
$2,000,000
$4,000,000
$6,000,000
$8,000,000
Cumulative Net Profit
Churn 1.25% Churn 2.5%
• Impact of lowering the churn rate is felt more heavily in the later years, as expected• It has a significant impact on the long term profitability of the business
Source: David Skok Matrix Partners

Churn
• 1% to 2.5% churn per month is acceptable • Higher than that, you are filling a leaky bucket
– Need to understand why you have low customer satisfaction and address the problem
Source: David Skok Matrix Partners

Customer Relationships Web/Mobile Products– Grow Customers
© 2012 Steve Blank
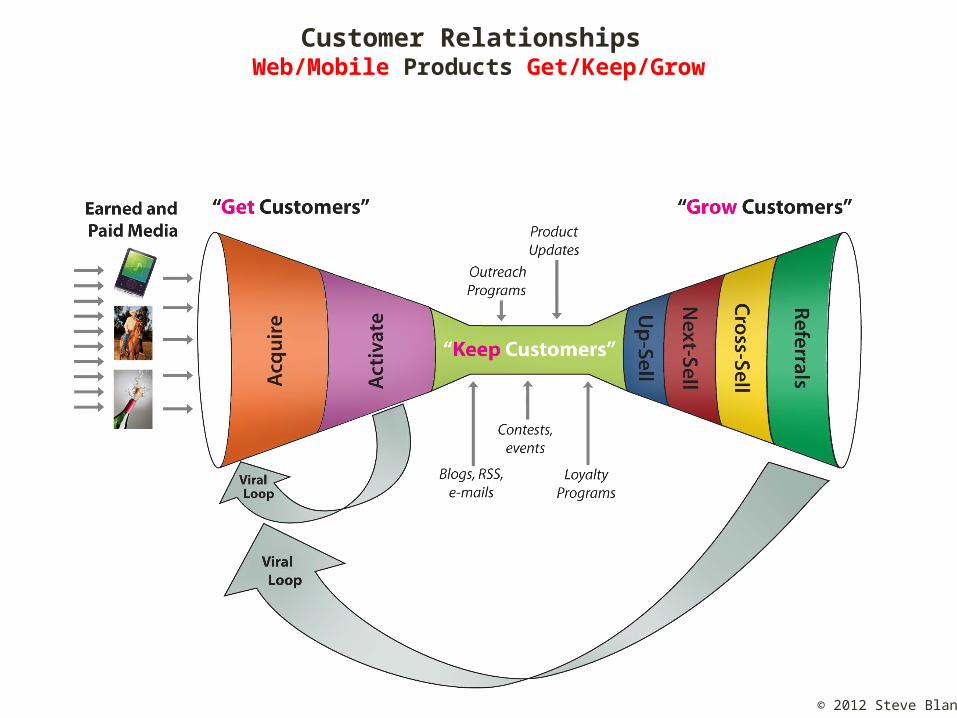
Customer Relationships Web/Mobile Products Get/Keep/Grow
© 2012 Steve Blank
Ag Robot Customer Relationships Example
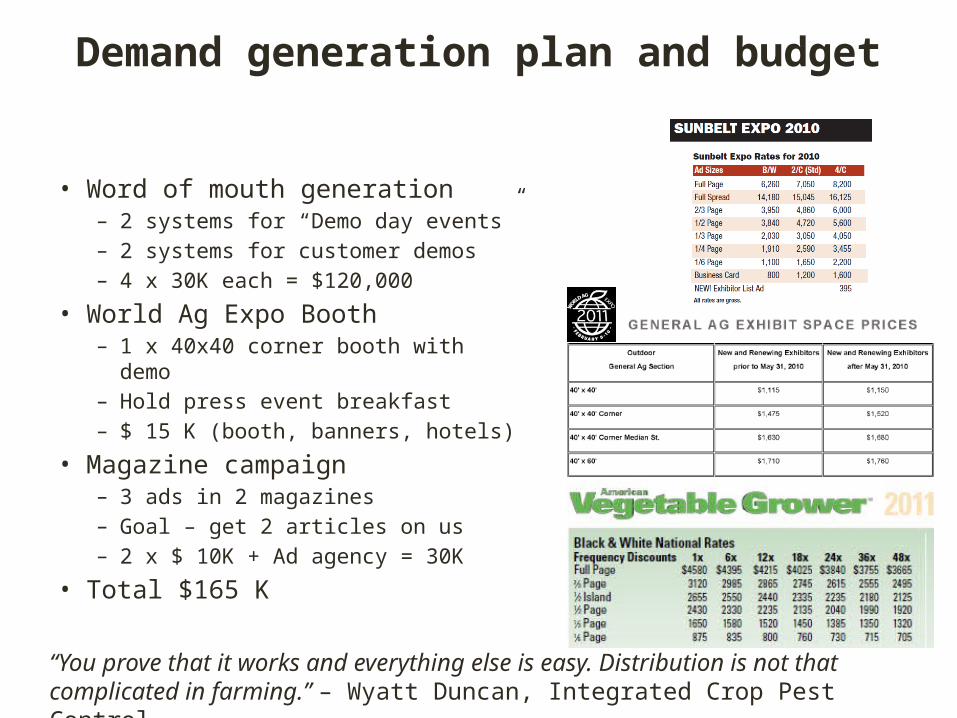
Demand generation plan and budget
• Word of mouth generation – 2 systems for “Demo day events”– 2 systems for customer demos– 4 x 30K each = $120,000
• World Ag Expo Booth – 1 x 40x40 corner booth with demo – Hold press event breakfast – $ 15 K (booth, banners, hotels)
• Magazine campaign – 3 ads in 2 magazines – Goal – get 2 articles on us– 2 x $ 10K + Ad agency = 30K
• Total $165 K“You prove that it works and everything else is easy. Distribution is not that complicated in farming.” – Wyatt Duncan, Integrated Crop Pest Control

Medical Device Customer Relationships Example

MammOpticsMarketing
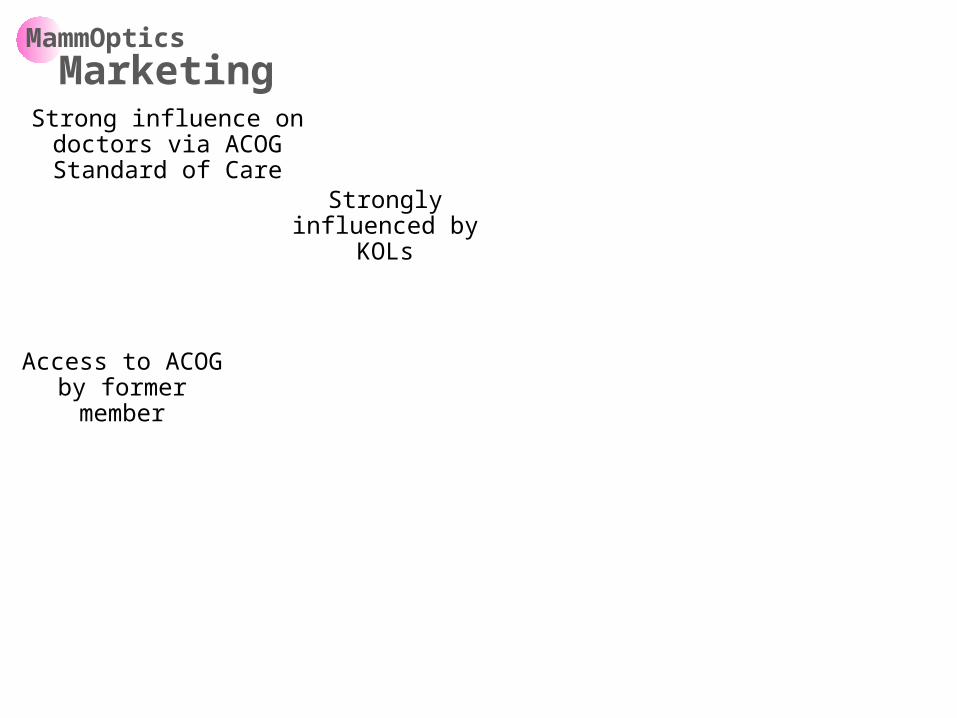
Access to ACOG by former member
Strong influence on doctors via ACOG Standard of Care
Strongly influenced by
KOLs
MammOpticsMarketing

Researchers conducting
important clinical trials
Researchers with numerous
publications
Outsourced survey research
Researchers with strong peer
recommendations
MammOpticsMarketing

Focus on prominent journals Need two big
publications
Choose KOL as Principal Investigators
(PI)
MammOpticsMarketing

Effective method for educating
doctors
Doctors required to attend
workshops
Workshop must be approved by ACOG
Taught by objective medical
experts
MammOpticsMarketing

ACOG Annual Clinical
Meeting
Miami Breast Cancer Conference
Opportunity for feedback from
doctors
MammOpticsMarketing
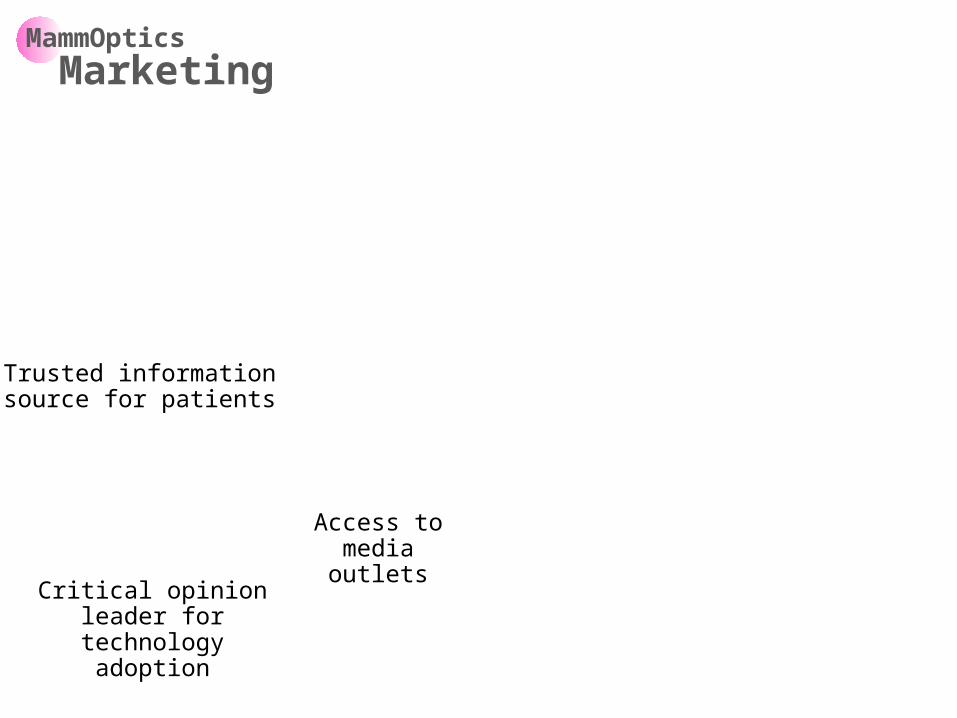
Trusted information source for patients
Critical opinion leader for
technology adoption
Access to media outlets
MammOpticsMarketing
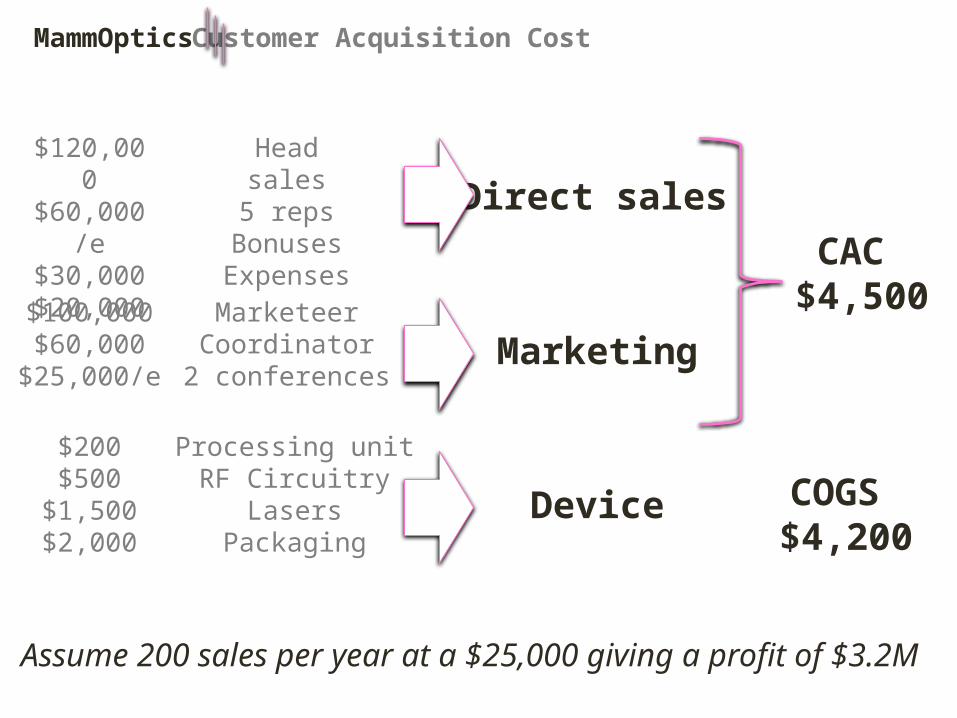
MammOpticsCustomer Acquisition Cost
Direct sales
Marketing
Device
Head sales5 reps
BonusesExpenses
MarketeerCoordinator
2 conferences
Processing unitRF Circuitry
LasersPackaging
$120,000
$60,000/e
$30,000$20,000$100,000$60,000
$25,000/e
$200$500
$1,500$2,000
Assume 200 sales per year at a $25,000 giving a profit of $3.2M
CAC $4,500
COGS $4,200
Housing AppCustomer Relationship Example
107
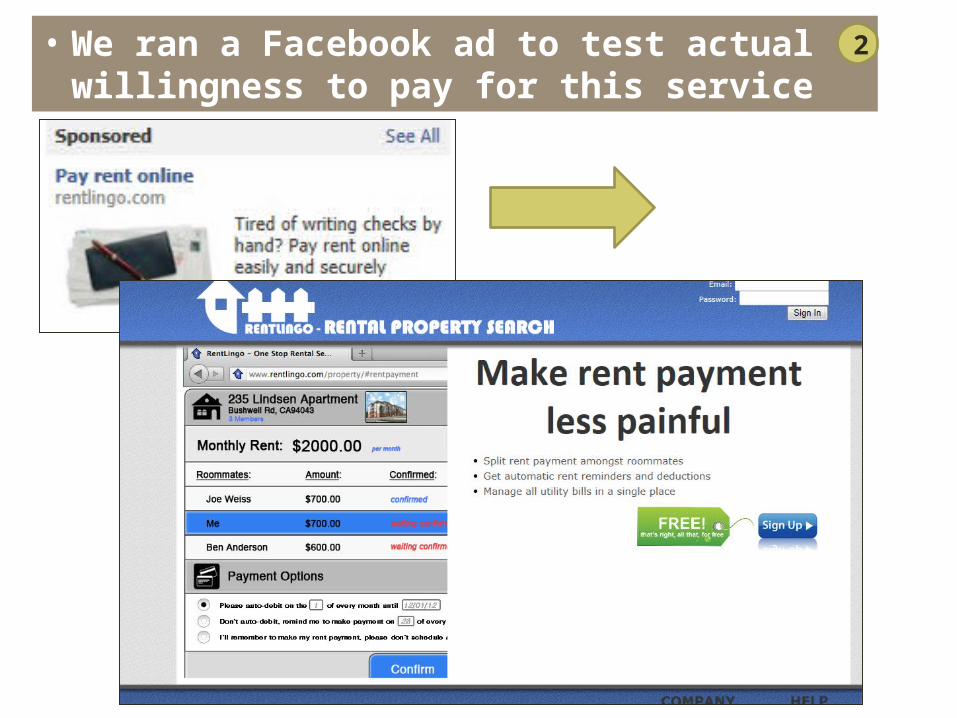
• We ran a Facebook ad to test actual willingness to pay for this service
2

108
• To test willingness to pay we used threeidentical ads with three different landing pages
2

109
• To test willingness to pay we used threeidentical ads with three different landing pages
2
Ad Sign-ups Clicks Ad spend
Free 0 23 $25
$1/household 0 25 $25
$1/user 0 24 $25
• Unfortunately, test results only proved users did not trust our site for payments
• Facebook traffic on this campaign was on our page for 4 seconds on average
• Roommate campaign had a 1:37 site time average• Outstanding question: can we win trust in other ways and then engage
users to pay rent through us?
110
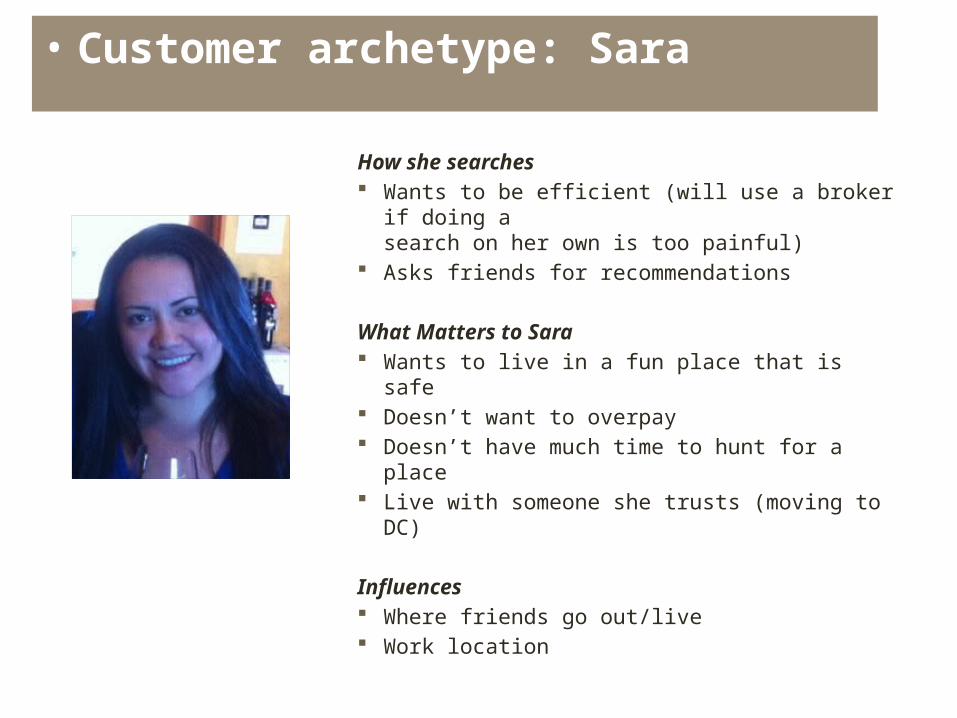
• Customer archetype: Sara
How she searches Wants to be efficient (will use a broker if doing a
search on her own is too painful) Asks friends for recommendations
What Matters to Sara Wants to live in a fun place that is safe Doesn’t want to overpay Doesn’t have much time to hunt for a place Live with someone she trusts (moving to DC)
Influences Where friends go out/live Work location
Online DatingCustomer Relationships Example
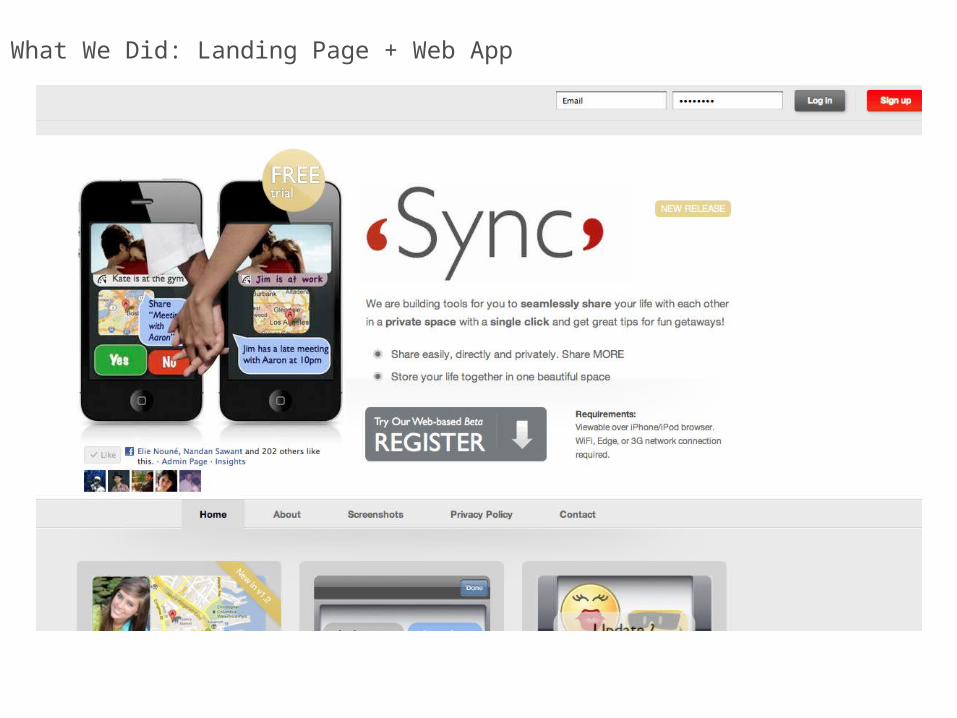
What We Did: Landing Page + Web App

4 day progress report
What We Found: High referral traffic
Overall Signup progress
31 filled 5-min survey
1258
136
10.8%

Hypothesis: Women-in-relationships are likelier to click through, irrespective of distance status
Tested for $30 Facebook click through & conversion from FB impressions
Demand generation testWhat we did: Targeted women, all couples
Ad-1
Ad-4
Ad-3
Ad-2

What we found: women click more ...................................but not clear who will pay!
II Women likelier to click through irrespective of distance status
Couples will pay subscription if they find more sharing during free trial valuable
Subscription model test
LDRs
SLRs 4
6
Good if free
1
Paid
1
Takeaway: “More sharing” without convenience will have to be free.
LOCATION Impressions Men Women Women-in-rel
87140
Click Through rates
Demand generation test

Funnel: “Couples” campaign
Demand generation testWhat we found: Clicks, no web app usage
$ 29.7 this week
304,286 impressions
122 uniques85 new
30 sign-up clicks
0.01 c
0.35 c/new
0.99 c24.6% conversion
but one used web app
Online SalesCustomer Relationships Example

Referenced to our web site
Fill out savings calculator
Send request to sales
Reconnection with viable customer
Visit to site
Close sale
50%
20%
30%
80%
10%
Year 1 Year 5
70%
30%
30%
80%
20%
Total Revenue Total Revenue
1.44 million 18.14 million
100 000 hits 300 000 hits
Web funnel

Mobile App Customer Relationships Example

Success Depends on Virality > Churn
Ratio of early stage virality rate to churn rate = 2.00x
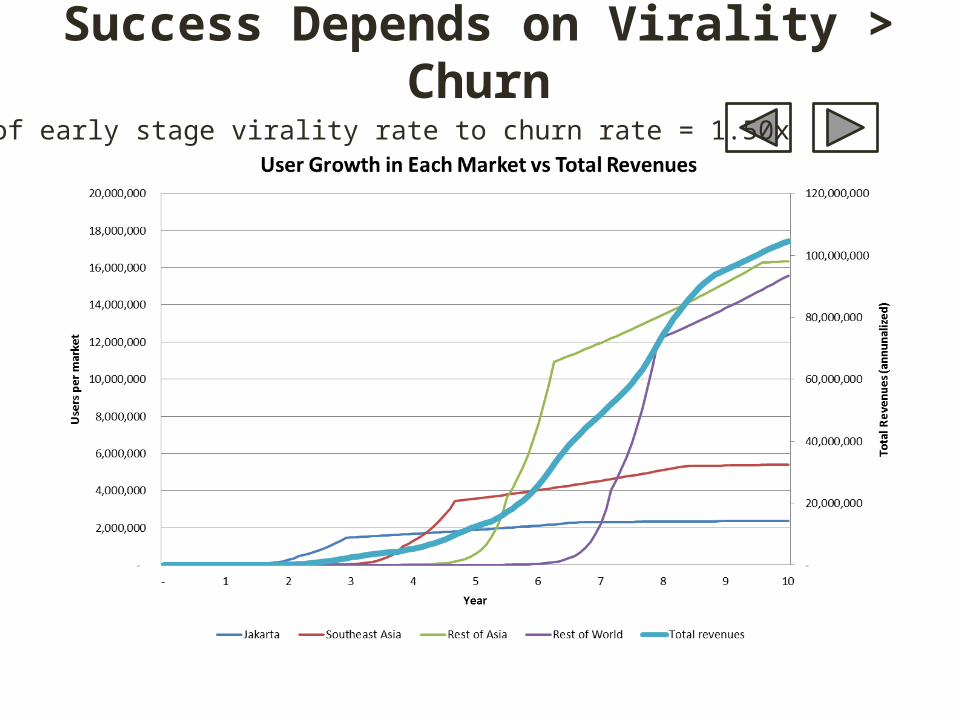
Success Depends on Virality > Churn
Ratio of early stage virality rate to churn rate = 1.50x

Success Depends on Virality > Churn
Ratio of early stage virality rate to churn rate = 1.0x

Demand creation via website
“Not a landing page”No Indonesian version
1 32
Doesn’t show the product
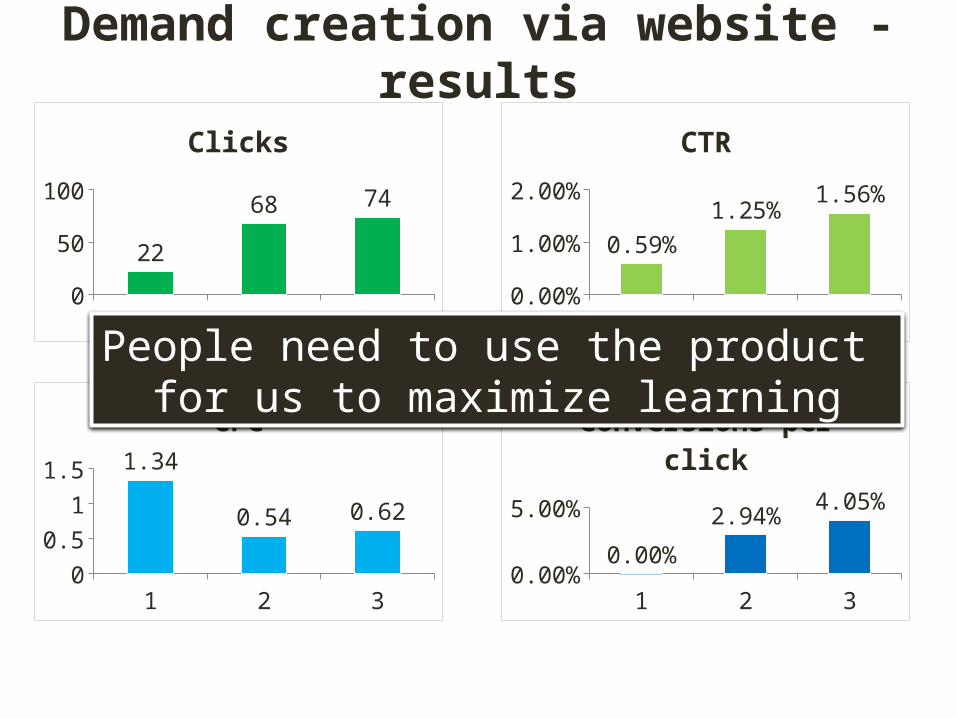
Demand creation via website - results
1 2 30
20406080
22
68 74Clicks
1 2 30.00%0.50%1.00%1.50%2.00%
0.59%
1.25%1.56%
CTR
1 2 30
0.5
1
1.5 1.34
0.54 0.62
CPC
1 2 30.00%1.00%2.00%3.00%4.00%5.00%
0.00%
2.94%4.05%
Conversions per click
People need to use the product for us to maximize learning

Software Reference Tool Customer Relationships Example

AdWords Testing
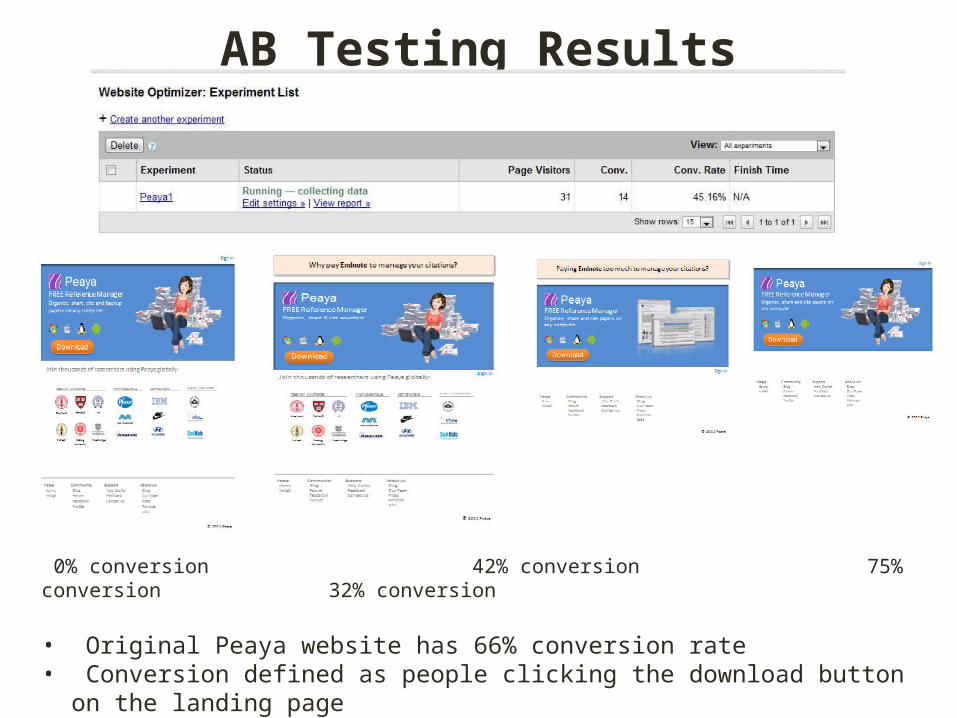
AB Testing Results
0% conversion 42% conversion 75% conversion 32% conversion
• Original Peaya website has 66% conversion rate• Conversion defined as people clicking the download button on the landing page• Experiment still underway; too few data points for drawing conclusions

Google & Facebook campaigns
• Keywords: free endnote, reference manager, pdf manager, Itunes for digital content, I tunes, manage pdf, organize paper, paper manager, citation manager, paper citation, cite pdfs
• 24 impressions, 2 clicks on google adwords• Clicks on free endnote and organize paper• No Facebook response• 1 Post on ResearchGate drew 7 visitors
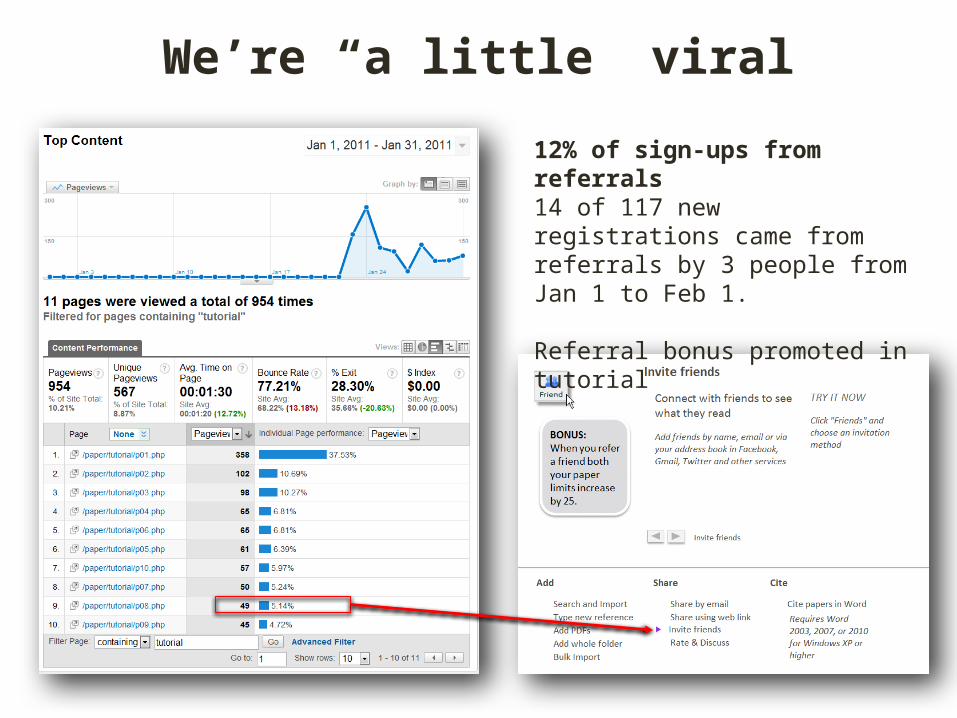
We’re “a little” viral
12% of sign-ups from referrals14 of 117 new registrations came from referrals by 3 people from Jan 1 to Feb 1.
Referral bonus promoted in tutorial

Collaboration doesn’t “pop”…. yet
“Rate & Discuss” is least interesting tutorial screen so far
However:1) we can test different messages (ie
“collaborate”) 2) experiment is slightly biased in
ordering, we need further testing
Customer Relationships Example
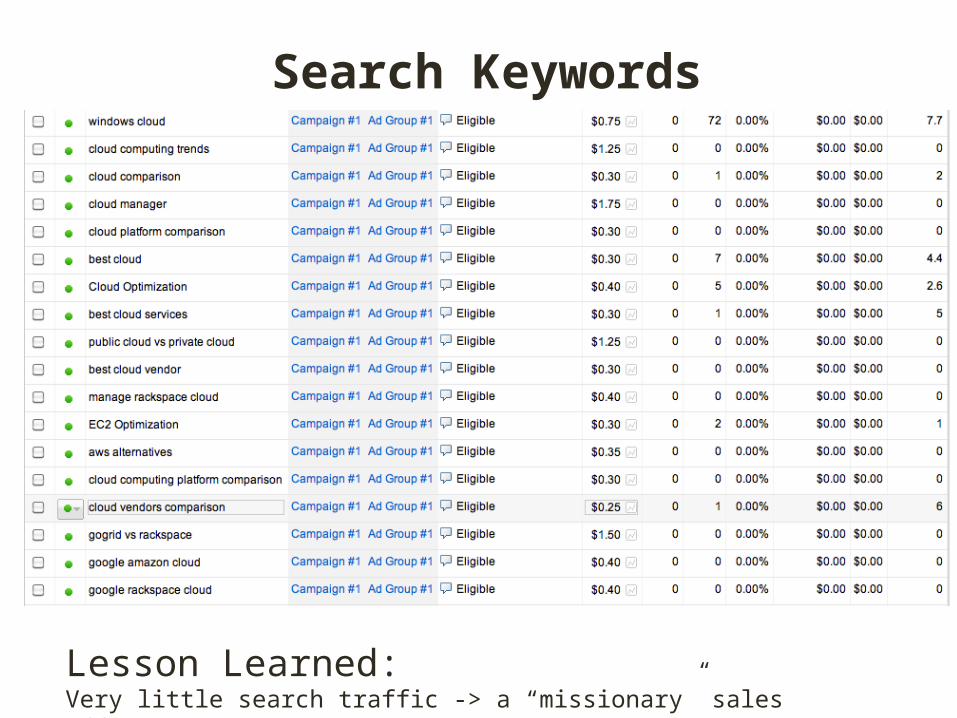
Search Keywords
Lesson Learned:Very little search traffic -> a “missionary” sales effort

Highly Competitive Keywords
Lesson Learned:AdWords (paid SEM) is not going to be an efficient channel with these keywords

Medical Device Customer Relationships Example
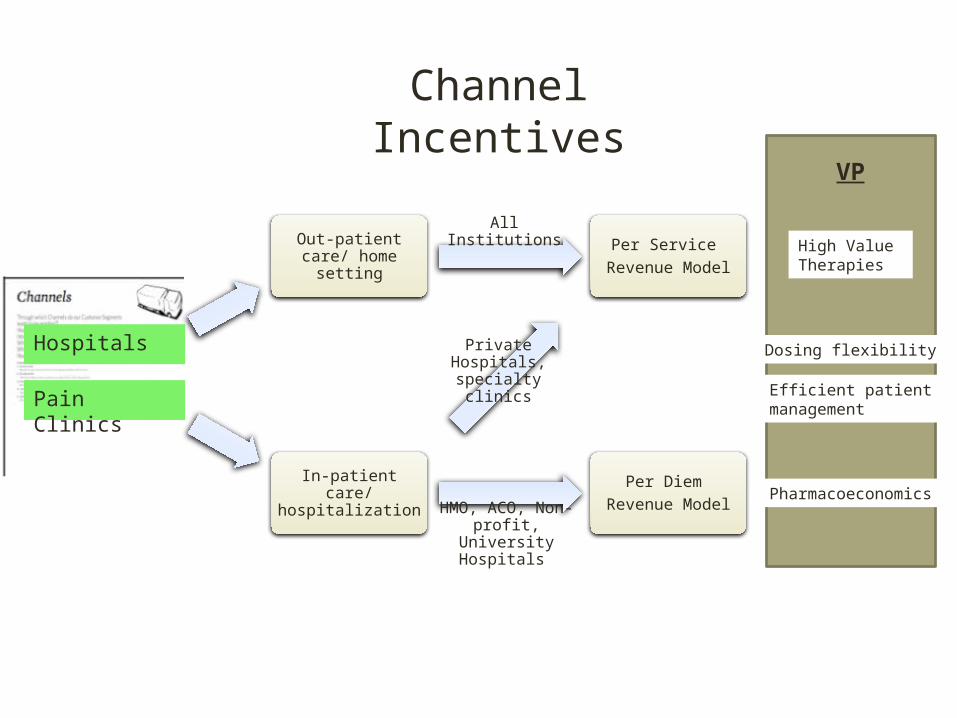
Channel Incentives
Hospitals
Pain Clinics
Per Diem Revenue Model
Per Service Revenue Model
In-patient care/ hospitalization
Out-patient care/ home setting
Private Hospitals, specialty clinics
HMO, ACO, Non-profit, University Hospitals
All Institutions
VP
High Value Therapies
Pharmacoeconomics
Dosing flexibility
Efficient patientmanagement

Demand Creation
Budget ~ $300 k/year

NSF I-CorpsThe Lean LaunchPad
Lecture 6: Revenue Streams
How Do You Make Money?
Version 6/22/12
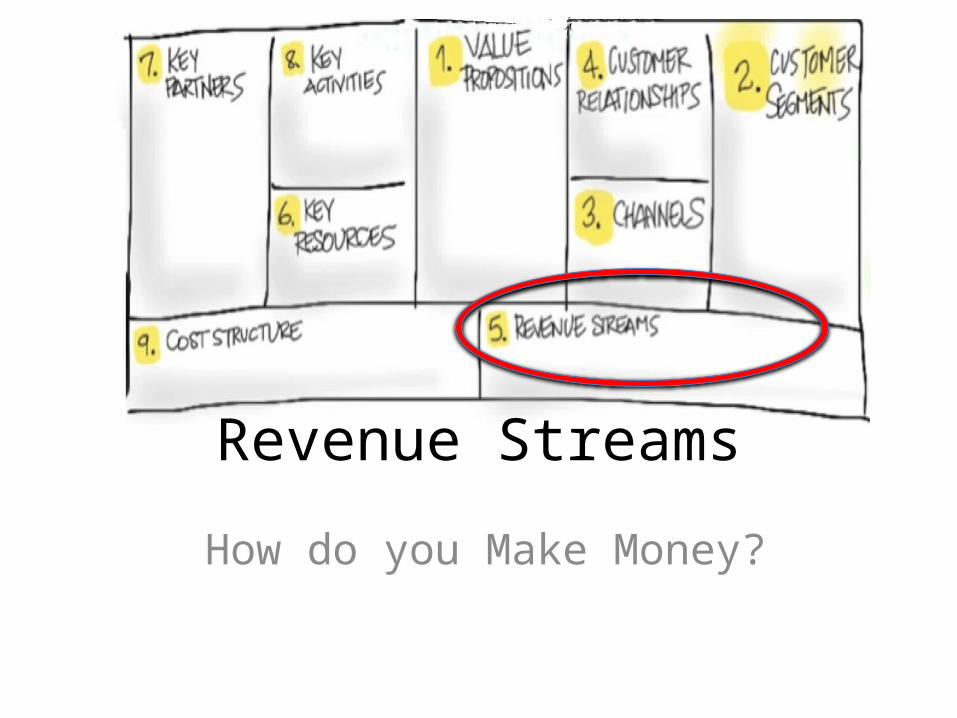
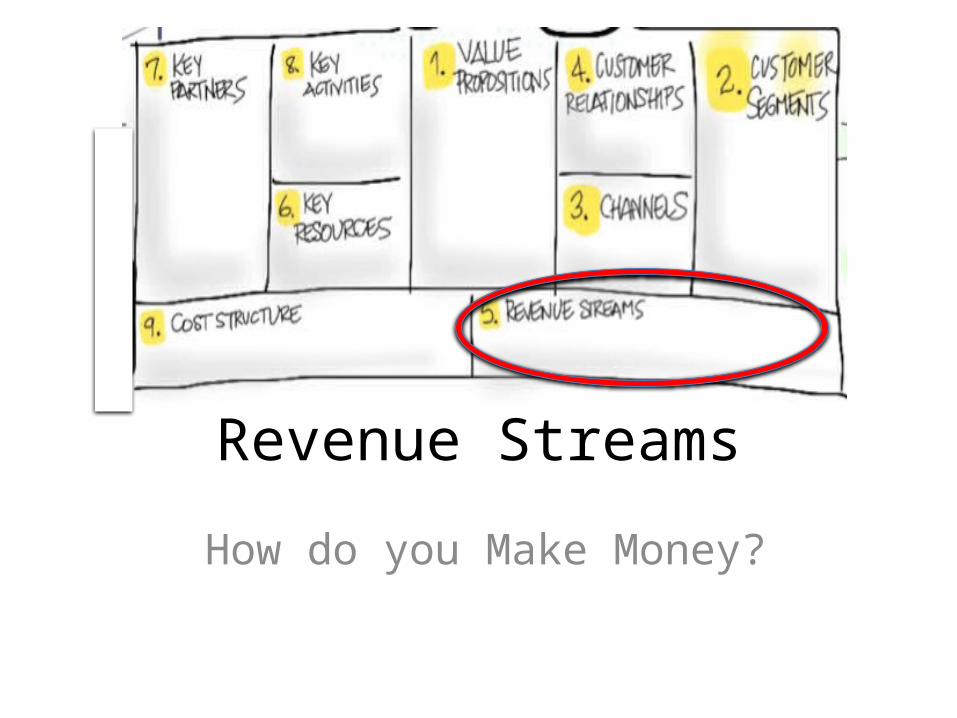
Revenue Streams
How do you Make Money?

© 2012 Steve Blank
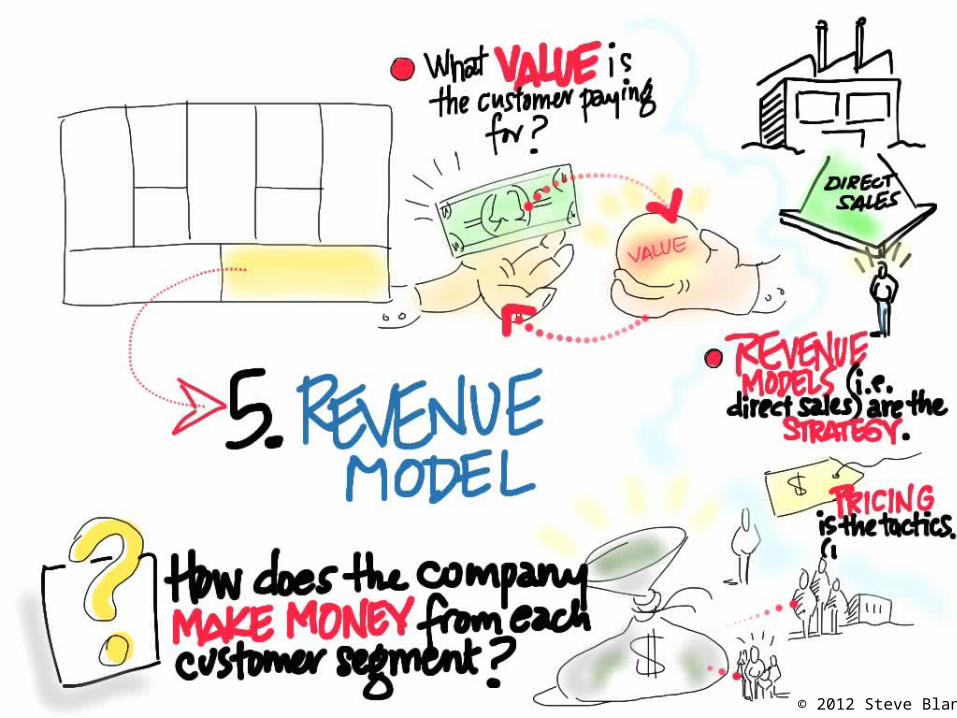
The Two Key Questions• What’s my revenue model?• Within the revenue model – how do I
price the product?
Revenue Model =
the strategy the company uses to generate cash from each customer
segment

Revenue Streams
1.How many will we sell?2.Where/who is the money coming from?3.How do we price the product?4.Does this add up to a
business worth doing?

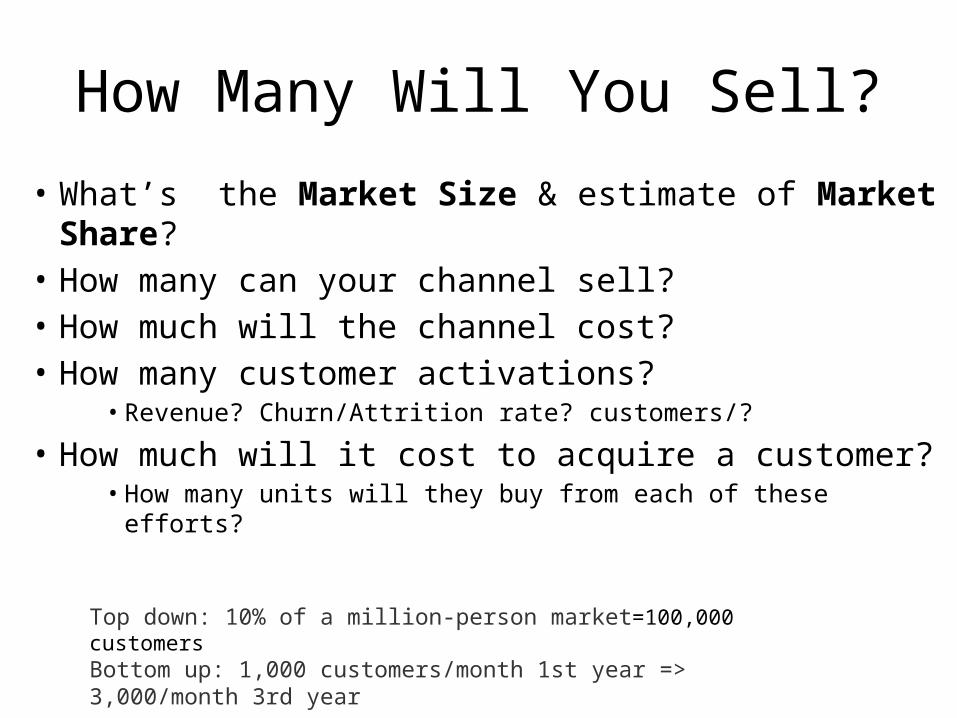
How Many Will You Sell?
• What’s the Market Size & estimate of Market Share?
• How many can your channel sell?• How much will the channel cost?• How many customer activations?
• Revenue? Churn/Attrition rate? customers/?
• How much will it cost to acquire a customer?• How many units will they buy from each of these efforts?
Top down: 10% of a million-person market=100,000 customersBottom up: 1,000 customers/month 1st year => 3,000/month 3rd year

Where is the money coming from?Revenue Model Choices
Bits
Physical
Product
Web Physical
Channel
Direct Sales Products License Subscription Upsell/Next Sell
Ancillary Sales:• Referral revenue • Affiliate revenue• E-mail list rentals• Back-end offers
Direct Sales Products Service Upsell/Next Sell
Referrals Leasing
Direct Sales Products Subscription Add-on services Upsell/Next Sell
Referrals
Key Revenue Model Questions• What are my customers paying for?• What capacity do my customers have to
pay?• How will you package your product ?• How will you price the offerings?

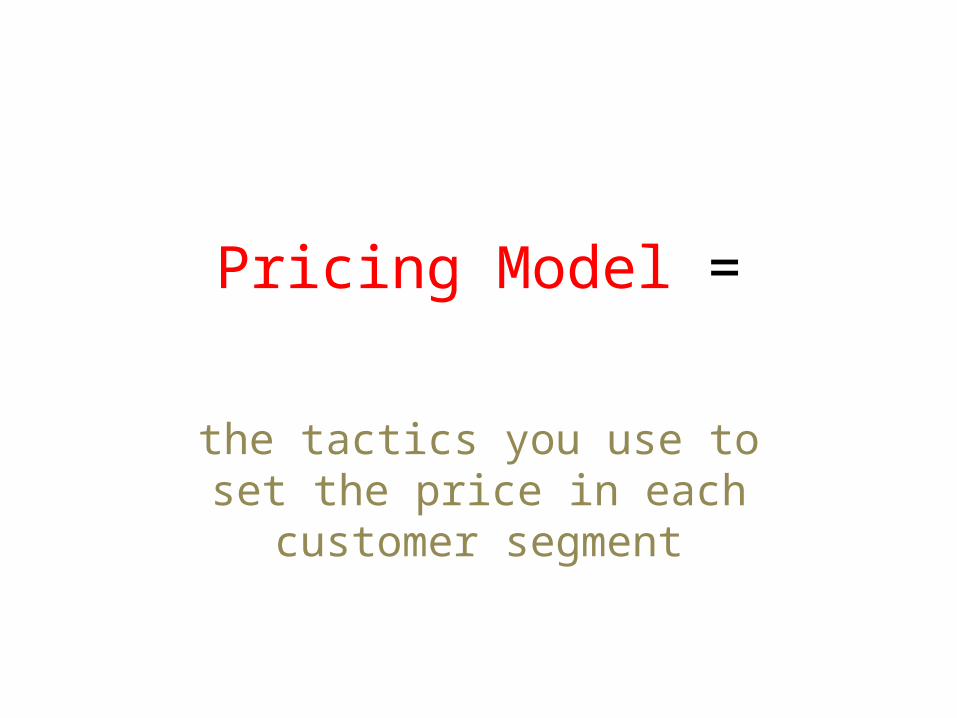
Pricing Model =
the tactics you use to set the price in each customer segment

How to price the product?
• Cost plus• Competitive pricing• Volume pricing• Value pricing• Portfolio pricing
• “Razor/razor blade” model• Subscription• Time/Hourly Billing• Leasing
Pricing Models - Physical

Common approaches to pricing Cost + markup Typically not a strategic way to price Driven by internal economics and not
customer insight
Cost based
Value based
Based on buyer’s perception of value (e.g. time saved, new efficiency created, etc.)
Customers don’t necessarily feel that they want to pay this way

Additional components of pricing
• Exclusive vs. non-exclusive• What do you price? What do you give away
for free?• How does cost vary at different production
levels?

Competition as an influence
• Pure competition• Oligopoly• Monopoly
Nature of Market
How they will react?
What is their product? What are their costs and prices? “What pricing will make them feel
the worst?”

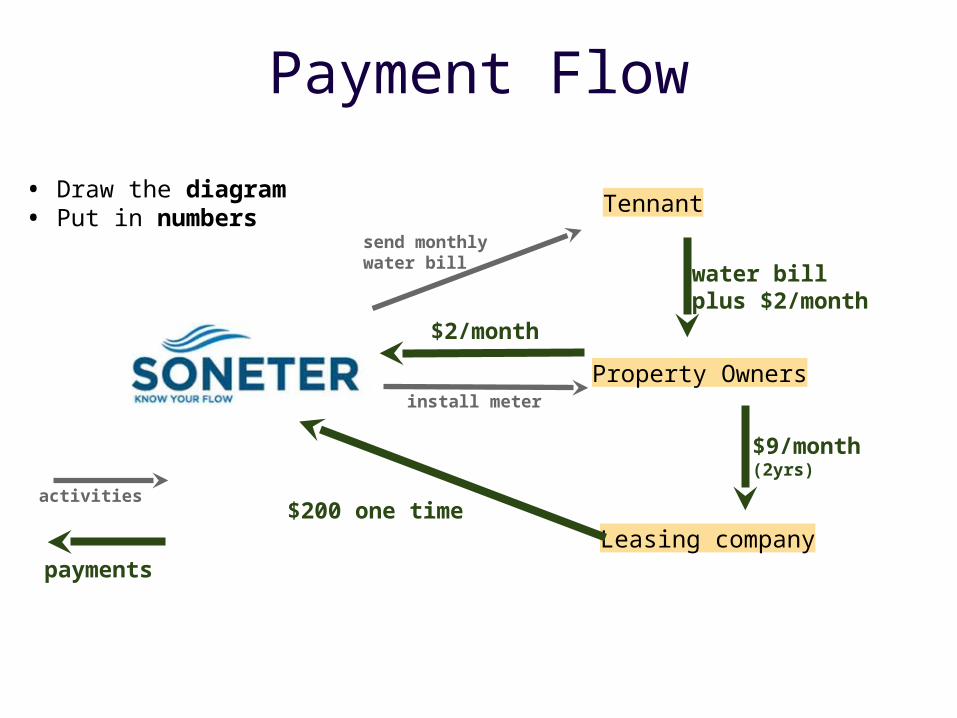
Payment Flow
Leasing company
Tennant
Property Ownersinstall meter
send monthlywater bill
$9/month(2yrs)
$200 one time
water billplus $2/month
$2/month
activities
payments
• Draw the diagram• Put in numbers

Single versus Multi-sided Markets

Single/Multi-side Markets
• Single-sided markets care about revenues
• Multi-sided markets may care about users first, revenues second– Often Web-based

“Users First” Companies
If you say your business is advertising based:
• How do you get to 10M monthly users?• How do you become one of the top 5 websites
visited?• How much do the “payers” actually pay?

“Revenue First” Companies
• Time to doublings for monthly revenues• Key questions:• When will I get to $100k/month in revenues?• When will I get to $1M/month in revenues?• What assumptions about my business am I
making when I reach these milestones?

Market Type and Revenue

Other Issues
• Distribution channel affects revenue streams
• Market type affects revenue streams• Demand curve affects revenue streams• Consider lifetime value

New Market Revenue Forecast
New Market Sales Curve
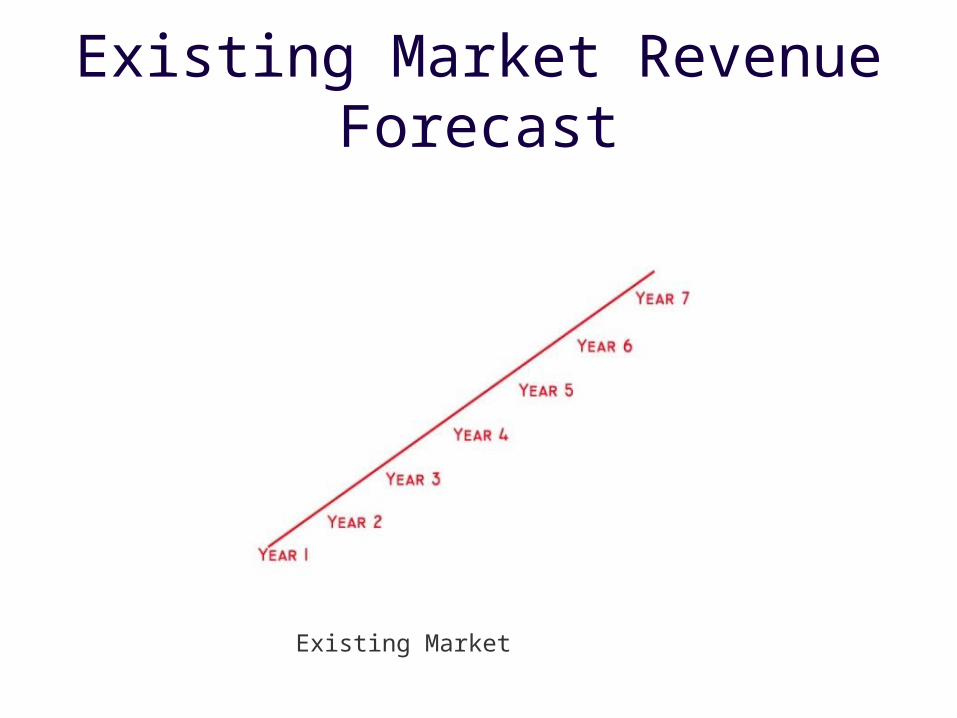
Existing Market Revenue Forecast
Existing Market

Resegmented Market Revenue Forecast
Common categories of Web/Mobile revenue models

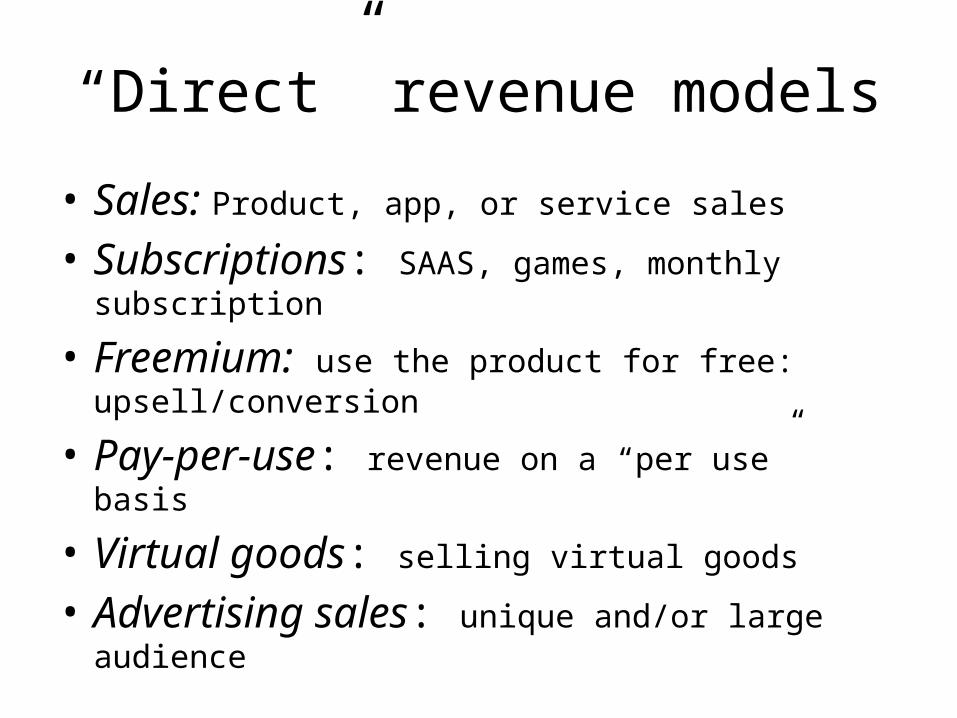
“Direct” revenue models
• Sales: Product, app, or service sales
• Subscriptions: SAAS, games, monthly subscription
• Freemium: use the product for free: upsell/conversion
• Pay-per-use: revenue on a “per use” basis
• Virtual goods: selling virtual goods
• Advertising sales: unique and/or large audience

“Ancillary” revenue models
• Referral revenue: pay for referring traffic/customers to other web or mobile sites or products.
• Affiliate revenue: finder’s fees/commissions from other sites for directing customers to make purchases at the affiliated site
• E-mail list rentals: rent your customer email lists to advertiser partners
• Back-end offers: add-on sales items from other companies as part of their registration or purchase confirmation processes, or “sell” their existing traffic to a company that strives to monetize it and share the resulting revenu3
Asset Sale• Sale of ownership right to a physical
product

Usage Fee• Usage of service. Fee is proportional to
the usage of the service.

Subscription Fee
• Fee for continuous access to a service

Renting
• Fee for temporary access to a good or service

Licensing
• Fee for use of some IP (including software)

Intermediation Fee
• Often found in marketplaces of various types, a fee for bringing together two or more parties involved in a transaction
Advertising
• Fee paid by brands and companies to get in front of potential customers

Revenue Model Summary
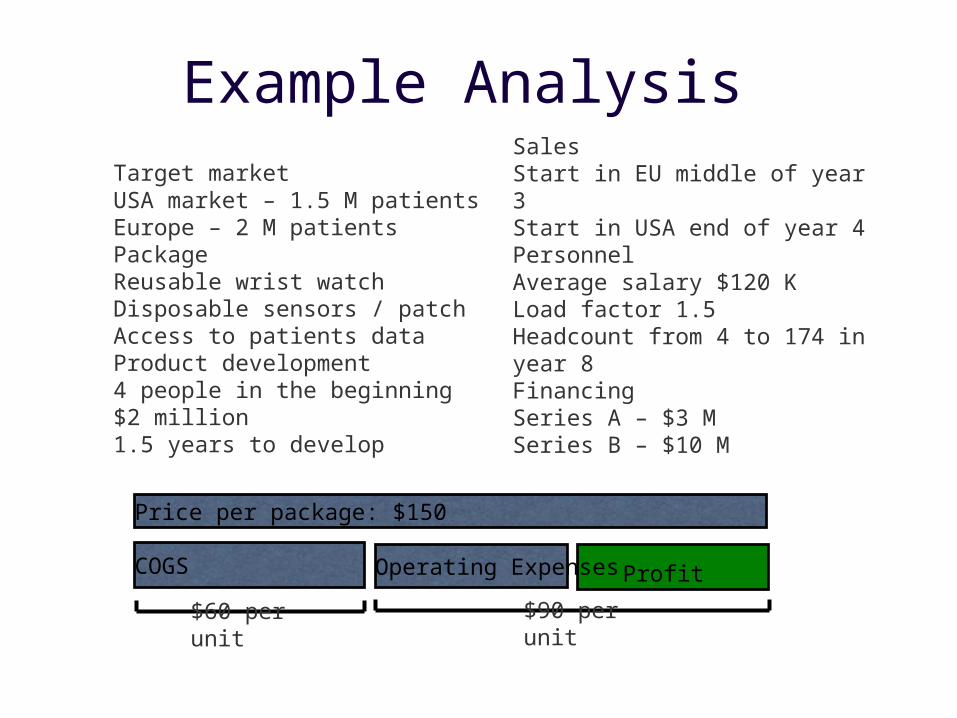
Example AnalysisTarget marketUSA market – 1.5 M patientsEurope – 2 M patientsPackageReusable wrist watchDisposable sensors / patchAccess to patients dataProduct development4 people in the beginning$2 million1.5 years to develop
SalesStart in EU middle of year 3Start in USA end of year 4Personnel Average salary $120 KLoad factor 1.5Headcount from 4 to 174 in year 8Financing Series A – $3 MSeries B – $10 M
Price per package: $150
COGS Profit$60 per unit $90 per unit
Operating Expenses

Does it add up?
1. Is revenue adequate to cover costs in the short term?
2.Are you confident revenue will grow materially if not dramatically over time?
3.Does profitability improve as the revenues get bigger?

Thought experiment
• Time to doublings for monthly revenues• Key questions:
– When will I get to $100k/month in revenues?
– When will I get to $1M/month in revenues?– What assumptions about my business am I
making when I reach these milestones?

Optical Equipment Revenue Model Example
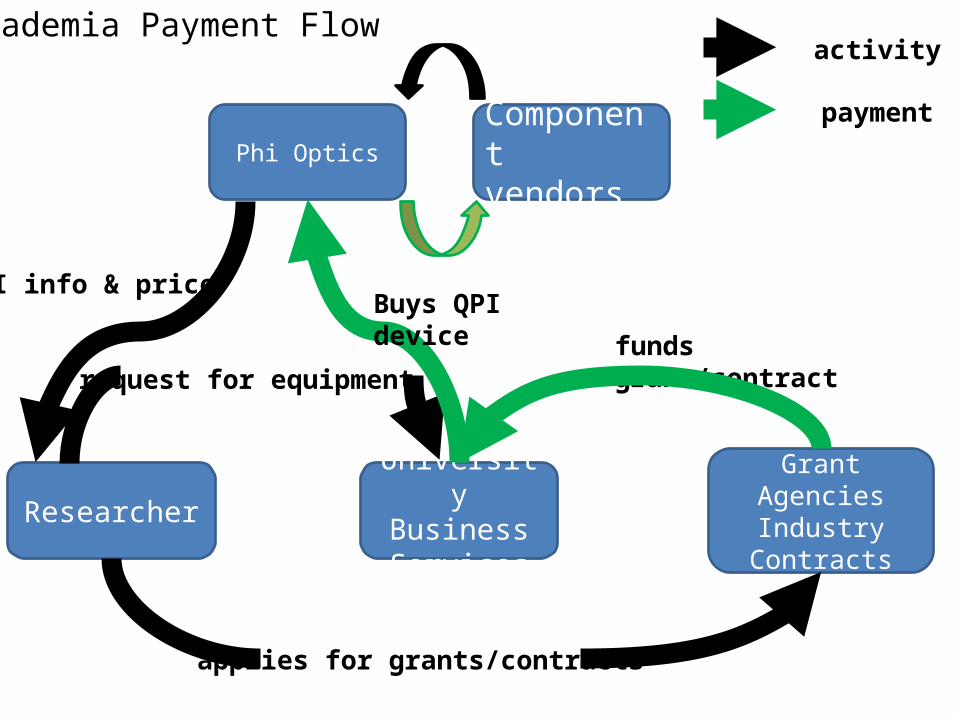
Phi OpticsComponent vendors
University Business Services
Researcher Grant AgenciesIndustry Contracts
applies for grants/contracts
funds grant/contractrequest for equipment
QPI info & price
activity
payment
Academia Payment Flow
Buys QPI device

Phi OpticsComponent vendors
Purchasing Dept.Researcher CTO
VP for R&D
Justifies need for equipment
Includes equipment in the budget
QPI specs + price
activity
payment
Bio-Pharma Payment Flow
Buys QPI device

Phi OpticsEquipment suppliers
Accounting Dept.
Product Dev Engineers +
Business Dev ($) + Legal Dept (royalties)
CTOVP for R&D
Justifies QPI integration in OEM systemSuggests co-development deal
Allocates funds in the budget
QPI specs + price+ SOW
activity
payment
OEM Payment Flow
Funds SOWPays royalties/sub-licensing/other recurring fees

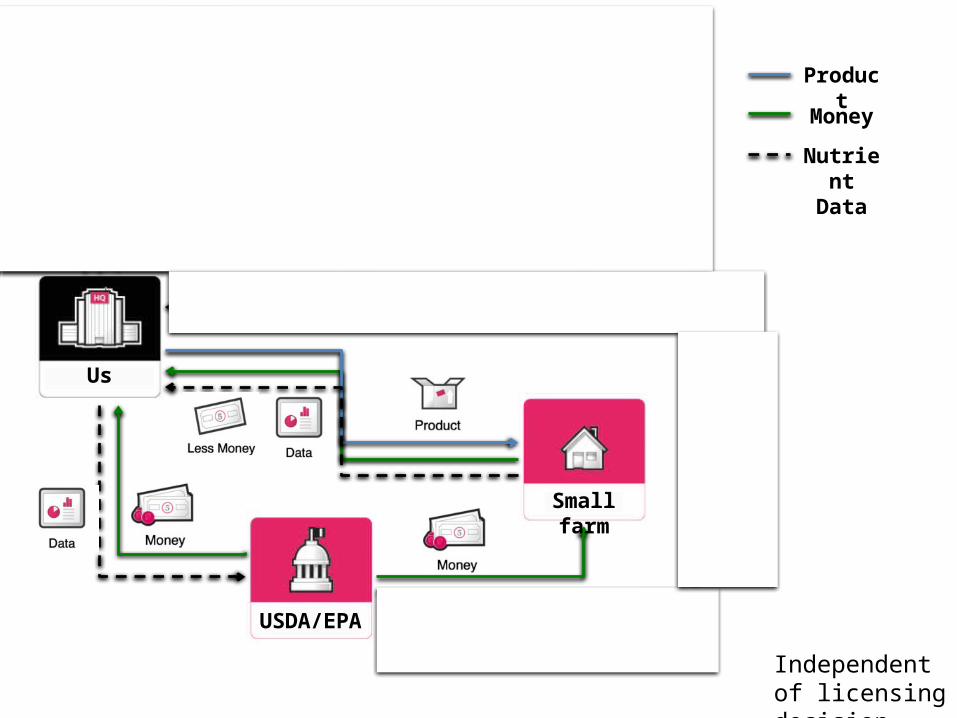
Nitrate SensorRevenue Model Example

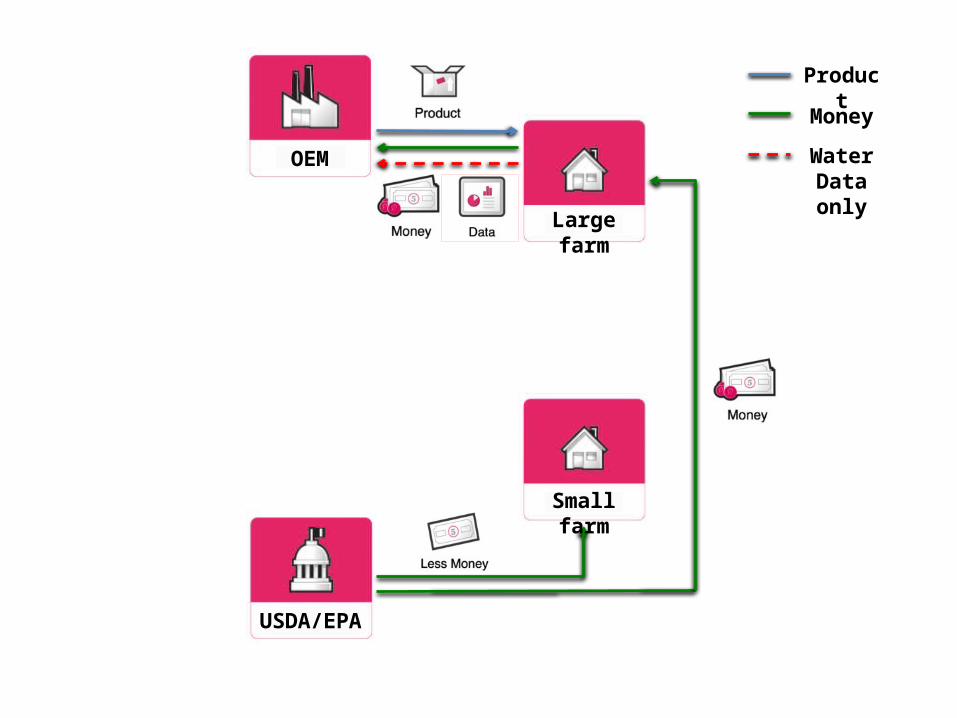
OEM
Large farm
USDA/EPA
Small farm
Product
Money
Water Data only
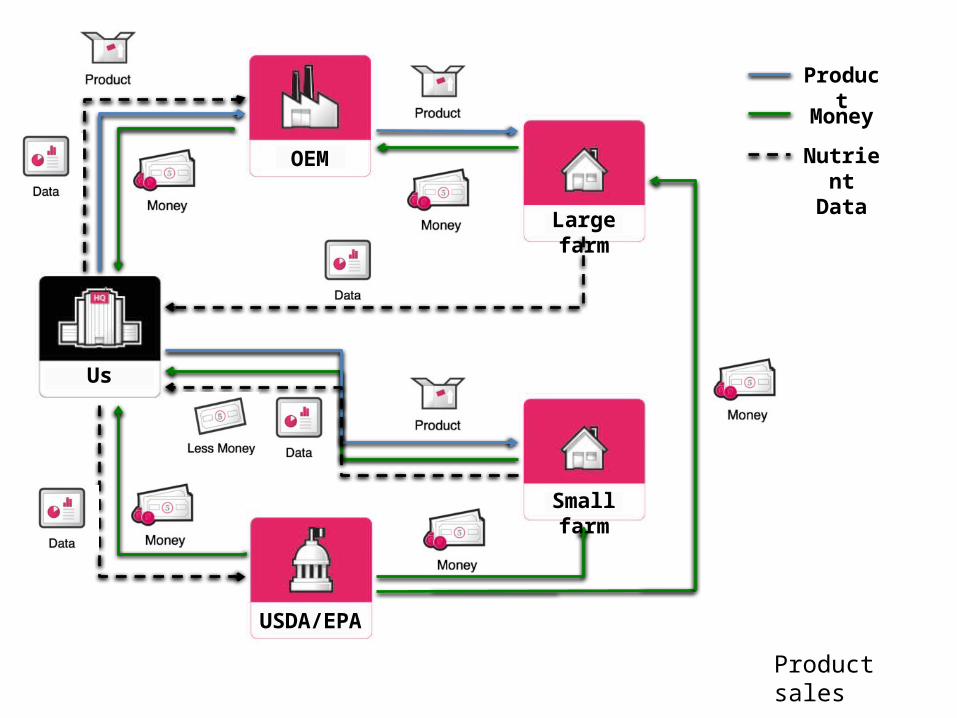
OEM
Us
Large farm
USDA/EPA
Small farm
Product
Money
Nutrient Data
Product sales

OEM
Us
Large farm
USDA/EPA
Small farm
Product
Money
Nutrient Data
Licensing/sales

OEM
Us
Large farm
USDA/EPA
Small farm
Product
Money
Nutrient Data
Independent of licensing decision

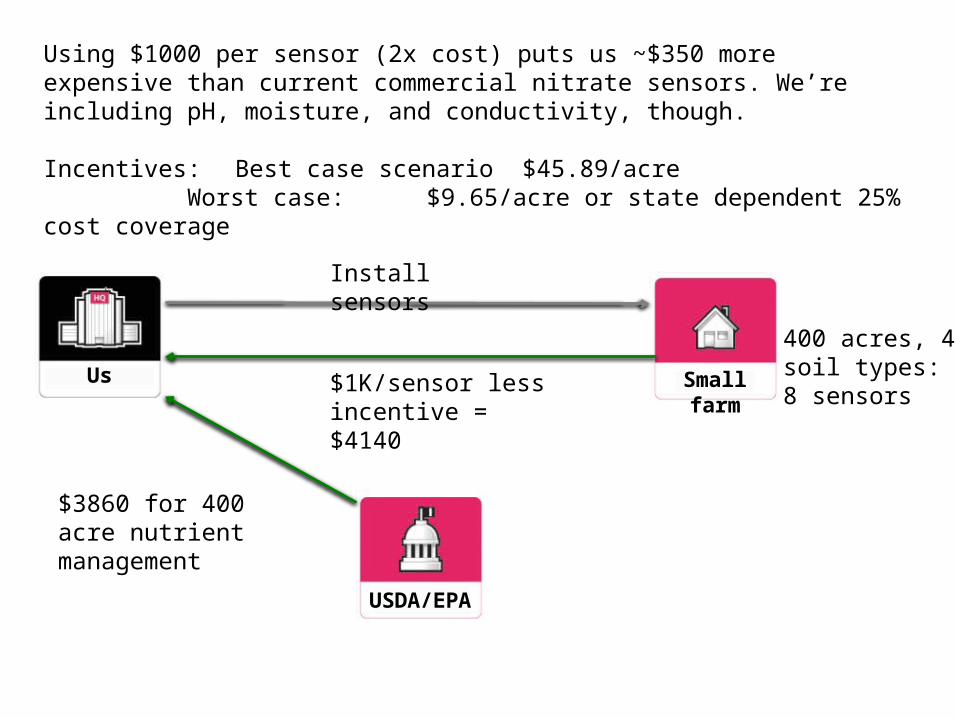
Us
USDA/EPA
Small farm
400 acres, 4 soil types: 8 sensors
Install sensors
$1K/sensor less incentive = $4140
Using $1000 per sensor (2x cost) puts us ~$350 more expensive than current commercial nitrate sensors. We’re including pH, moisture, and conductivity, though.
Incentives: Best case scenario $45.89/acreWorst case: $9.65/acre or state dependent
25% cost coverage
$3860 for 400 acre nutrient management
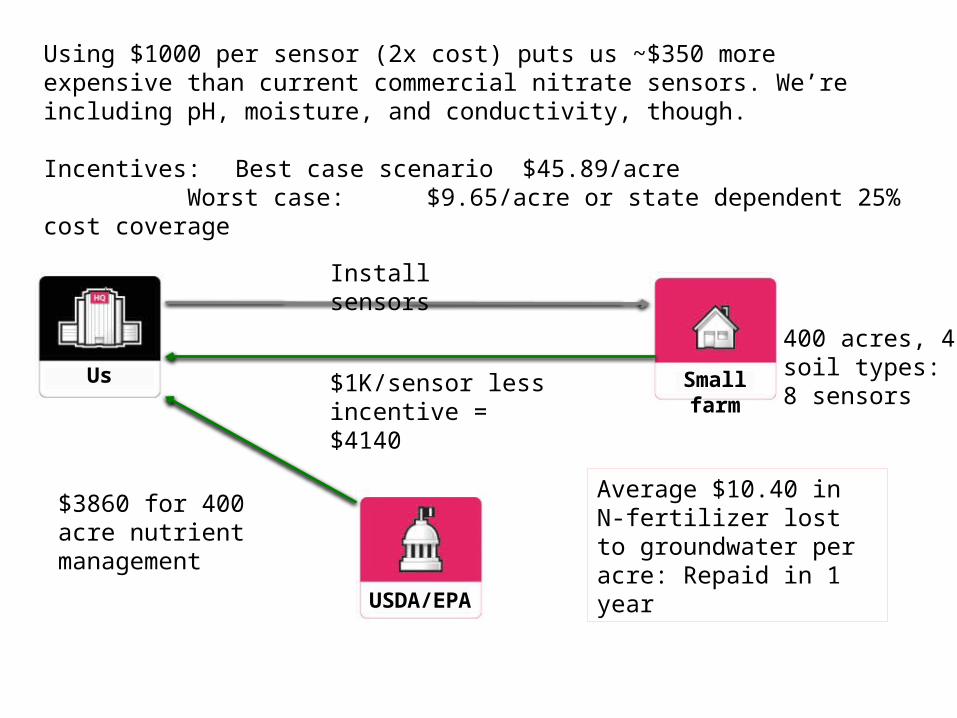
Average $10.40 in N-fertilizer lost to groundwater per acre: Repaid in 1 year

Bio-Based Chemical IntermediatesRevenue Model Example

Here’s what we hypothesized…
Distributor
Monomer manufacturer
Surfactant formulator
Surfactant user
Consumer facingcompany
Consumer Market Pull(Sustainability agenda)
Revenue model: Hypothesis
Biomass supplier Biomass 15 c/lbBiomass Range 5-20c/lb
Monomer ?Detergent alcohols 80c/lb
Formulation ?Formulated Surfactant
90c/lb
Surfactant 100 c/lbFormulated Detergent
100c/lb
Detergent 200 c/lb10% Surfactant in
Detergent
Product
Decision Makers
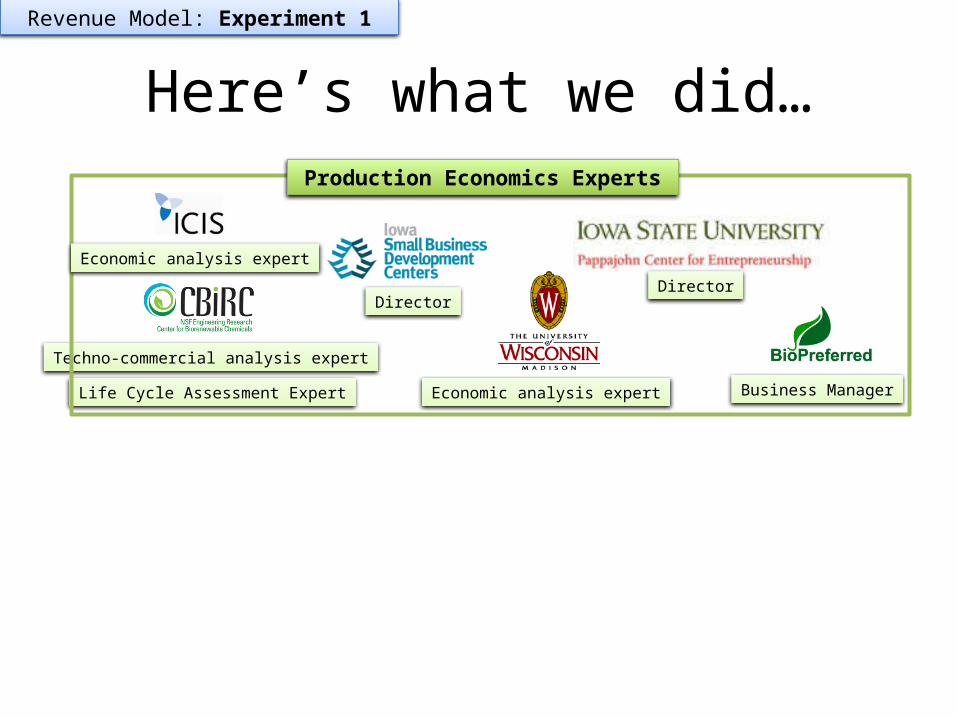
Here’s what we did…
Techno-commercial analysis expert
Revenue Model: Experiment 1
Life Cycle Assessment Expert Economic analysis expert
DirectorDirector
Production Economics Experts
Business Manager
Economic analysis expert

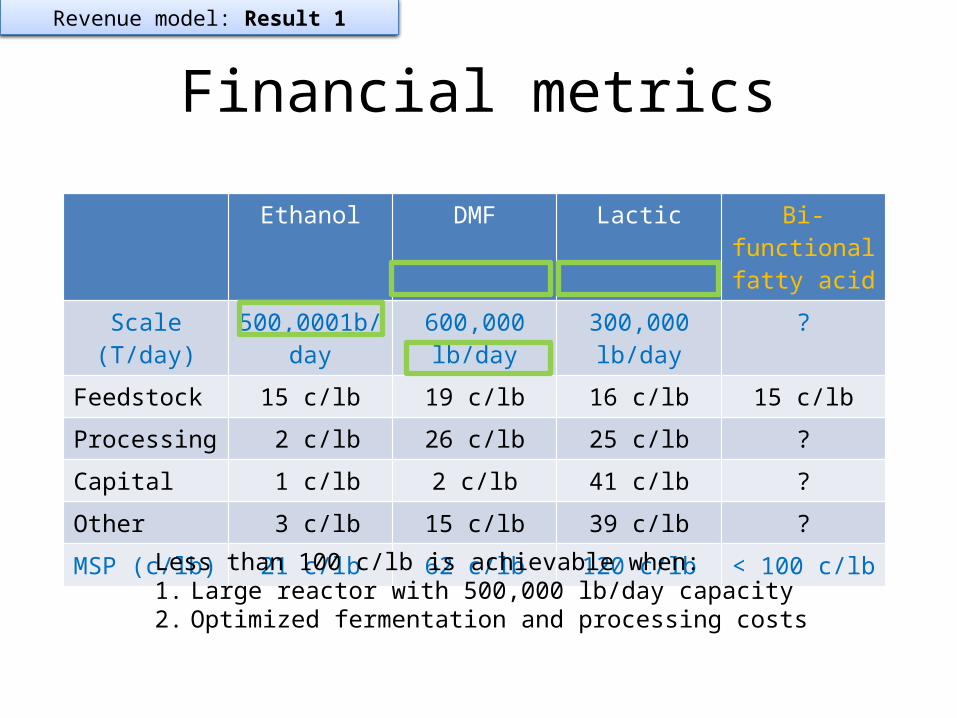
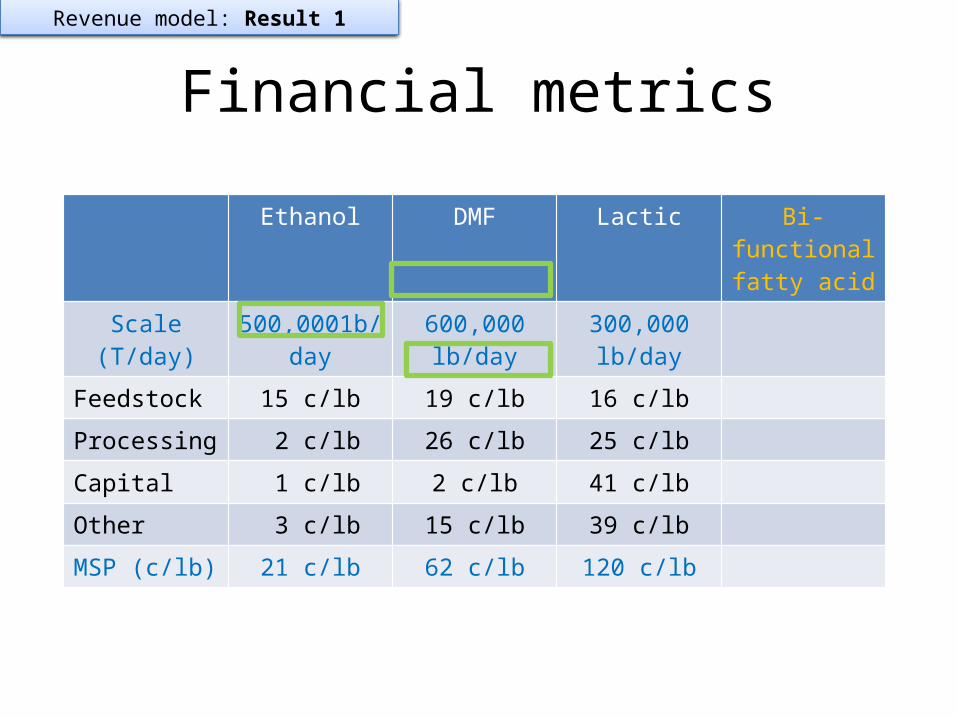
Financial metrics
Ethanol DMF Lactic Bi-functional fatty acid
Scale (T/day) 500,0001b/day
600,000 lb/day
300,000 lb/day
Feedstock 15 c/lb 19 c/lb 16 c/lb
Processing 2 c/lb 26 c/lb 25 c/lb
Capital 1 c/lb 2 c/lb 41 c/lb
Other 3 c/lb 15 c/lb 39 c/lb
MSP (c/lb) 21 c/lb 62 c/lb 120 c/lb
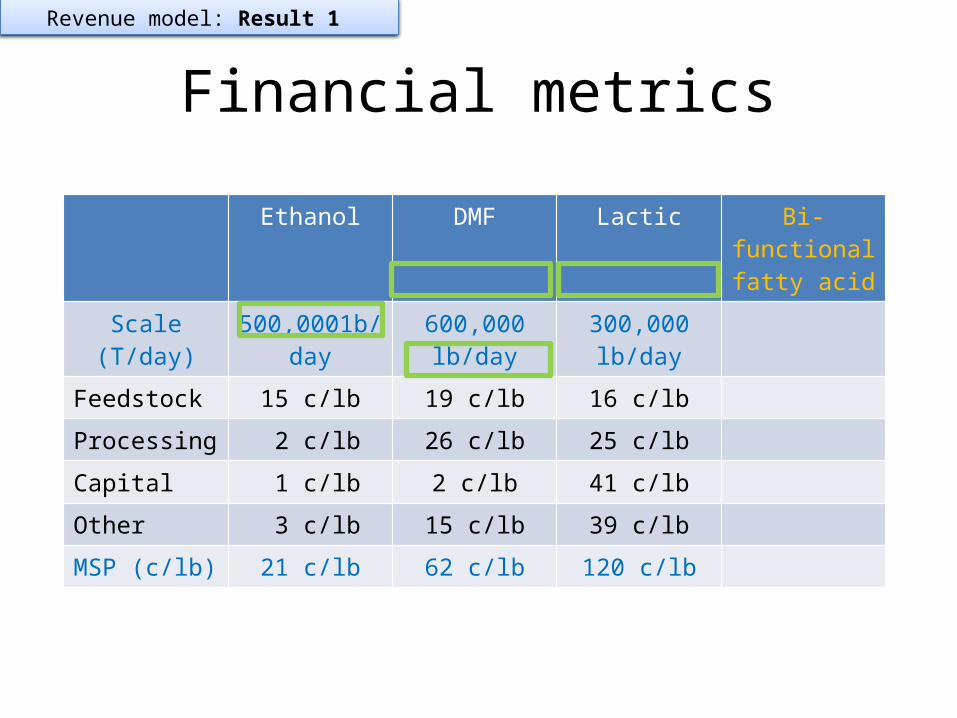
Revenue model: Result 1

Financial metrics
Ethanol DMF Lactic Bi-functional fatty acid
Scale (T/day) 500,0001b/day
600,000 lb/day
300,000 lb/day
Feedstock 15 c/lb 19 c/lb 16 c/lb
Processing 2 c/lb 26 c/lb 25 c/lb
Capital 1 c/lb 2 c/lb 41 c/lb
Other 3 c/lb 15 c/lb 39 c/lb
MSP (c/lb) 21 c/lb 62 c/lb 120 c/lb
Revenue model: Result 1
Financial metrics
Ethanol DMF Lactic Bi-functional fatty acid
Scale (T/day) 500,0001b/day
600,000 lb/day
300,000 lb/day
?
Feedstock 15 c/lb 19 c/lb 16 c/lb 15 c/lb
Processing 2 c/lb 26 c/lb 25 c/lb ?
Capital 1 c/lb 2 c/lb 41 c/lb ?
Other 3 c/lb 15 c/lb 39 c/lb ?
MSP (c/lb) 21 c/lb 62 c/lb 120 c/lb < 100 c/lb
Revenue model: Result 1
Less than 100 c/lb is achievable when:1. Large reactor with 500,000 lb/day capacity2. Optimized fermentation and processing costs

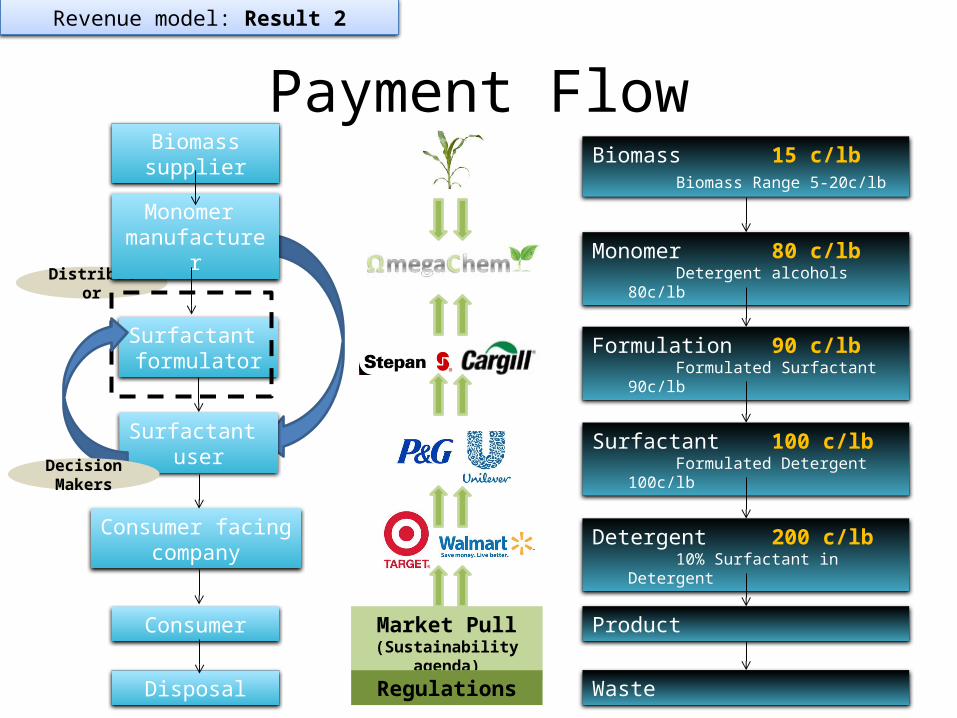
Payment Flow
Distributor
Monomer manufacturer
Surfactant formulator
Surfactant user
Consumer facingcompany
Consumer Market Pull(Sustainability agenda)
Revenue model: Result 2
Biomass supplier Biomass 15 c/lbBiomass Range 5-20c/lb
Monomer 80 c/lbDetergent alcohols 80c/lb
Formulation 90 c/lbFormulated Surfactant
90c/lb
Surfactant 100 c/lbFormulated Detergent
100c/lb
Detergent 200 c/lb10% Surfactant in
Detergent
Product
Decision Makers
Disposal WasteRegulations
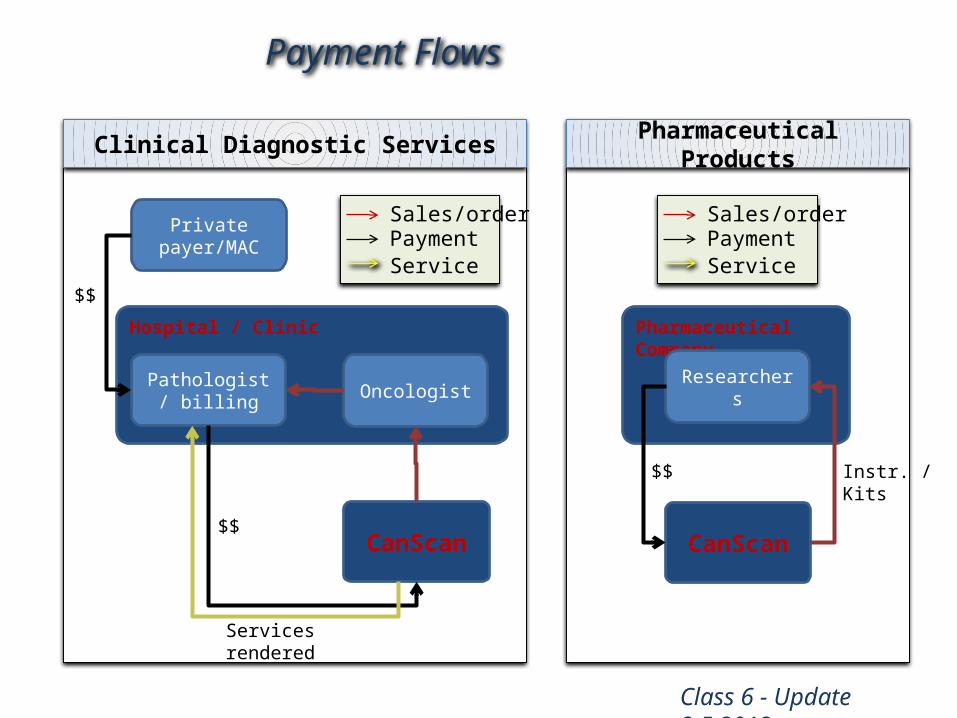
Payment Flows Example

CanScan Payment Flows
Class 6 - Update 3.5.2012
CanScan
Hospital / Clinic
Oncologist
Private payer/MAC
Pathologist/ billing
Sales/orderPaymentService
Services rendered
$$
$$
Clinical Diagnostic Services
CanScan
Pharmaceutical Company
Researchers
Sales/orderPaymentService
$$
Pharmaceutical Products
Instr. /Kits

Medical DevicePricing Example

MammOpticsPricing Strategy
Equipment Lease model
Per-use model
Consumable
Cost of the device
Service per year
Per-use fee
Consumable
$50,000
$3,000
0
0
$5,000
$10,000
0
0
$5,000
0
$50
0
$25,000
0
0
$20

MammOpticsPricing Strategy
Equipment Lease model
Per-use model
Consumable
Cost of the device
Service per year
Per-use fee
Consumable
$50,000
$3,000
0
0
$5,000
$10,000
0
0
$5,000
0
$50
0
$25,000
0
0
$20
Approved by
customers and
investors

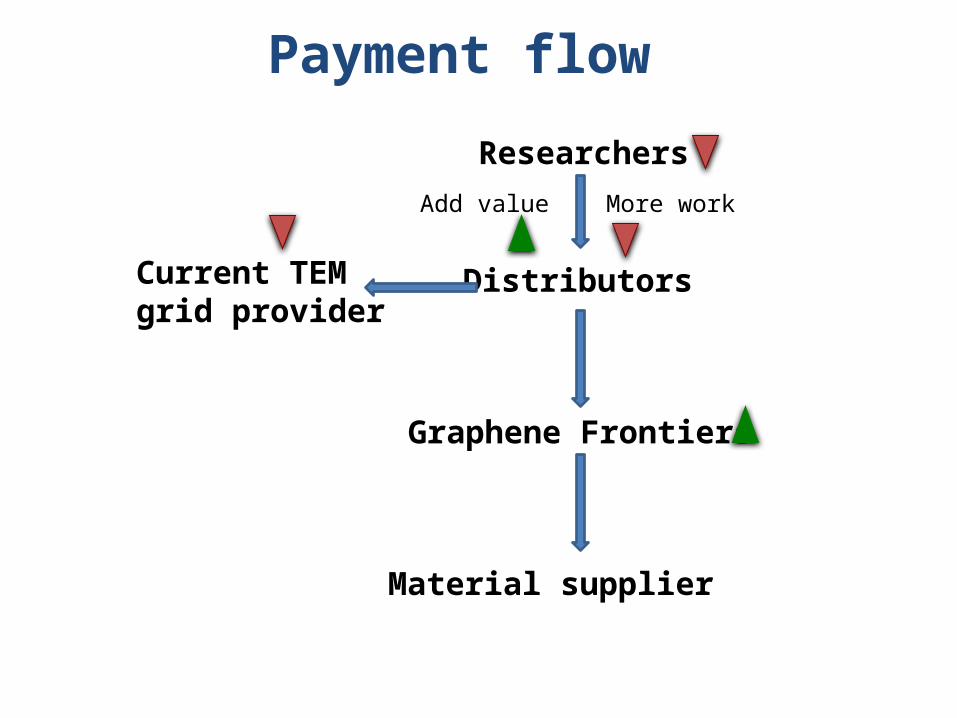
GrapheneRevenue Model Example

Distributors
Researchers
Graphene Frontiers
Current TEM grid provider
More workAdd value
Material supplier
Payment flow

Distributors
Graphene Frontiers
Material supplier
Flexible display manufacturer
Electronic User
Research, cost
E-reader manufacturer Parts suppliers
Parts suppliers
Payment flow

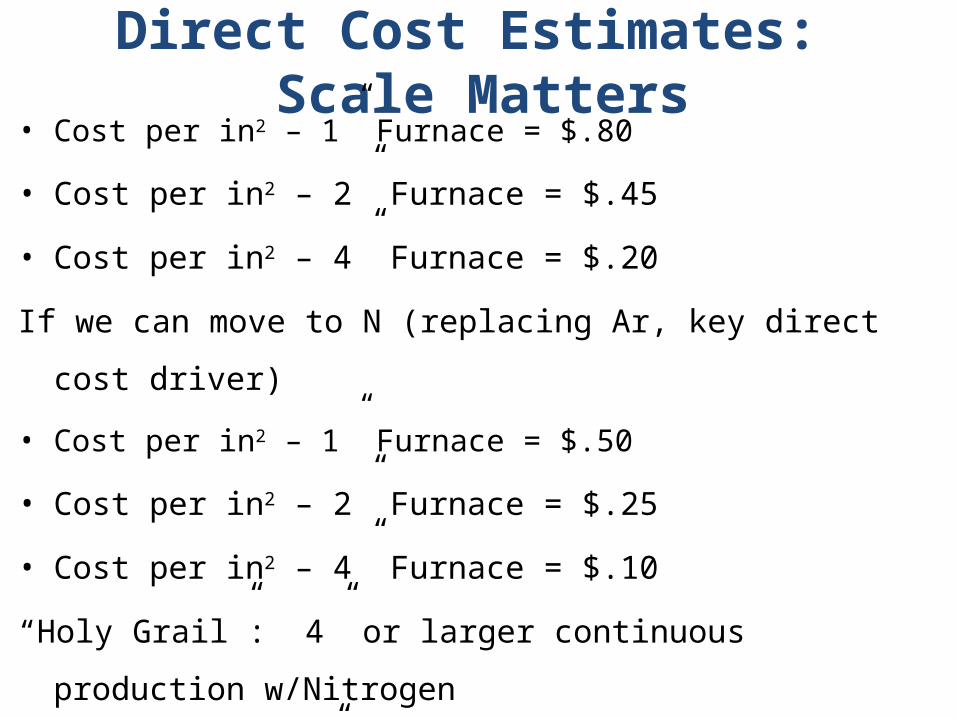
Direct Cost Estimates: Scale Matters• Cost per in2 – 1” Furnace = $.80
• Cost per in2 – 2” Furnace = $.45
• Cost per in2 – 4” Furnace = $.20
If we can move to N (replacing Ar, key direct cost driver)
• Cost per in2 – 1” Furnace = $.50
• Cost per in2 – 2” Furnace = $.25
• Cost per in2 – 4” Furnace = $.10
“Holy Grail”: 4” or larger continuous production w/Nitrogen
Cost per in2 – 4” Furnace, Batch/Continuous = … $.05

SensorPricing Tactics Example

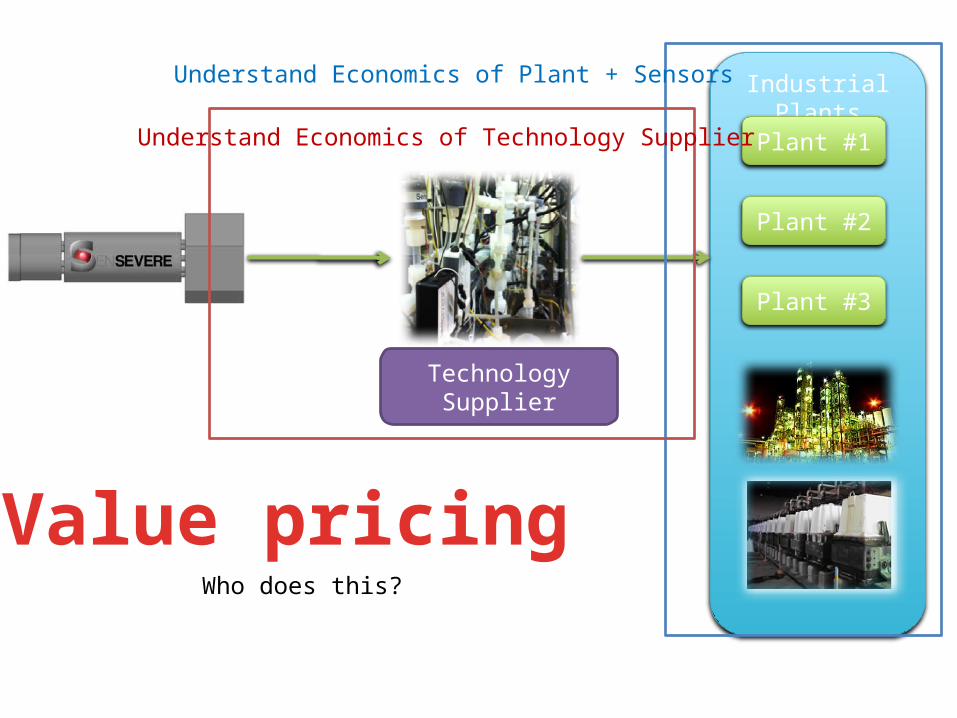
Technology Supplier
Industrial Plants
Plant #1
Plant #2
Plant #3
Understand Economics of Plant + Sensors
Understand Economics of Technology Supplier
Value pricingWho does this?

205Diaphragm Membrane
$240/MT Cl2
Cost of damages + downtime per incident per year
Operational conditions Capital cost per incident Downtime per incident # of cells protected Time between incidents Number of cells, US and worldwide
Diaphragm Membrane Membrane Header
$2,500 $270 $10,600
Value per unit per year

206
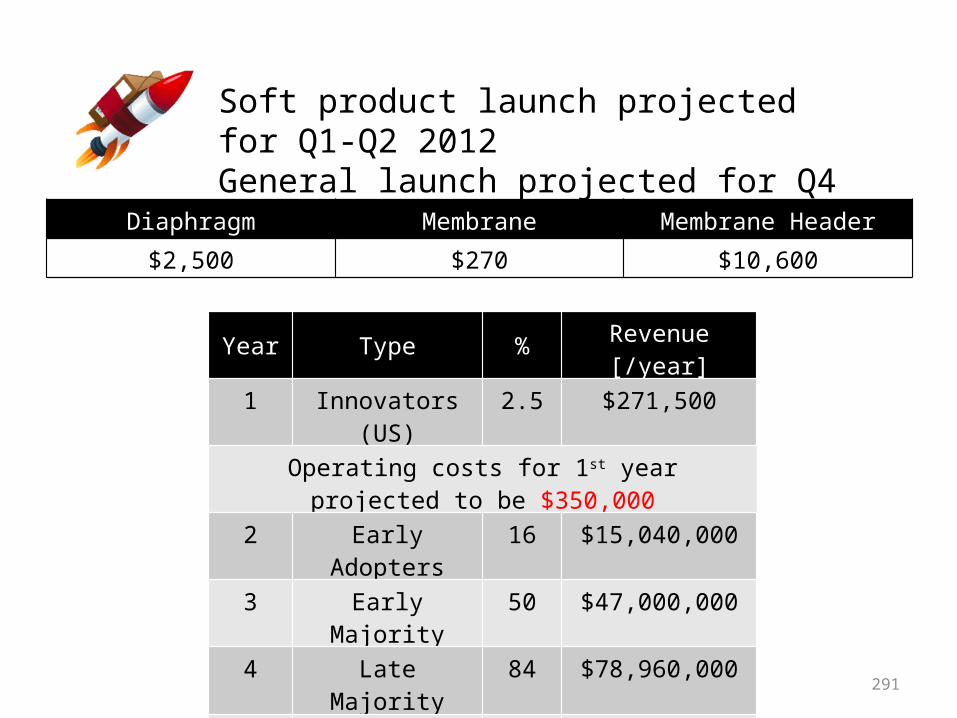
Soft product launch projected for Q1-Q2 2012General launch projected for Q4 2012
Year Type % Revenue [/year]1 Innovators (US) 2.5 $271,500
Operating costs for 1st year projected to be $350,000
2 Early Adopters 16 $15,040,000
3 Early Majority 50 $47,000,000
4 Late Majority 84 $78,960,000
Full Penetration 100 $94,000,000
Diaphragm Membrane Membrane Header
$2,500 $270 $10,600

Medical DeviceRevenue Model Example

What we make
DentistDentalOptics
~$2000
Device cost (one time)
~$2.50 per patient
Disposables

What the dentist normally makes
Dentist Patient
Insurance
Co-pay
Membership
$250
$250
Equipment / Variable Costs
Note: Assumes 50/50 copay-insurance split

What we’d add for the dentist
Dentist PatientDentalOptics
Insurance
Co-pay
Membership
~$2000
$250
Device cost (one time)
$250
~$2.50 per patient
Disposables
Equipment / Variable Costs
Device creates
additional periodontal procedures
Note: Assumes 50/50 copay-insurance split
Farm Nitrate SensorRevenue Model Example

Us
USDA/EPA
Small farm
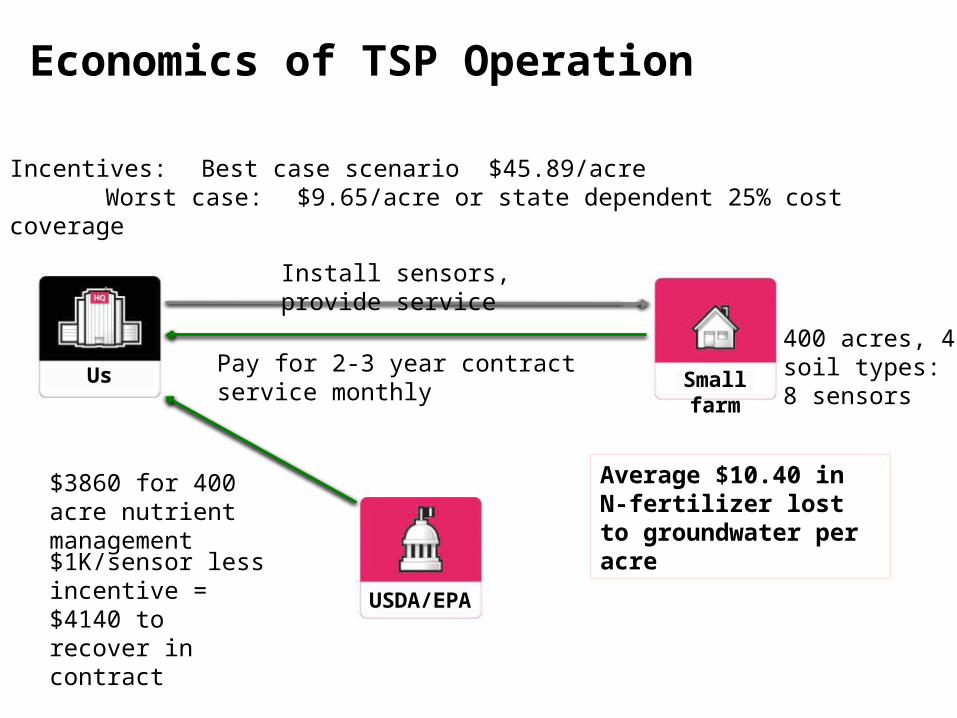
400 acres, 4 soil types: 8 sensors
Install sensors, provide service
$1K/sensor less incentive = $4140 to recover in contract
Incentives: Best case scenario $45.89/acreWorst case: $9.65/acre or state dependent 25% cost coverage
$3860 for 400 acre nutrient management
Average $10.40 in N-fertilizer lost to groundwater per acre
Pay for 2-3 year contract service monthly
Economics of TSP Operation

Us
USDA/EPA
Small farm
400 acres, 4 soil types: 8 sensors
Install sensors, provide service
$1K/sensor less incentive = $4140 to recover in contract
Incentives: Best case scenario $45.89/acreWorst case: $9.65/acre or state dependent 25% cost coverage
$3860 for 400 acre nutrient management
Onion Case Study (44K acres): Cost: DAP - $700/ton + $25/aRate: 280lb/a for 400a farm
= $39K
30% Improvement: $13K savedCharge: $6K/season
= $660K/yr contract revenue
Pay for 2-3 year contract service monthly
Economics of TSP Operation

Biofactories for TherapeuticsRevenue Model Example
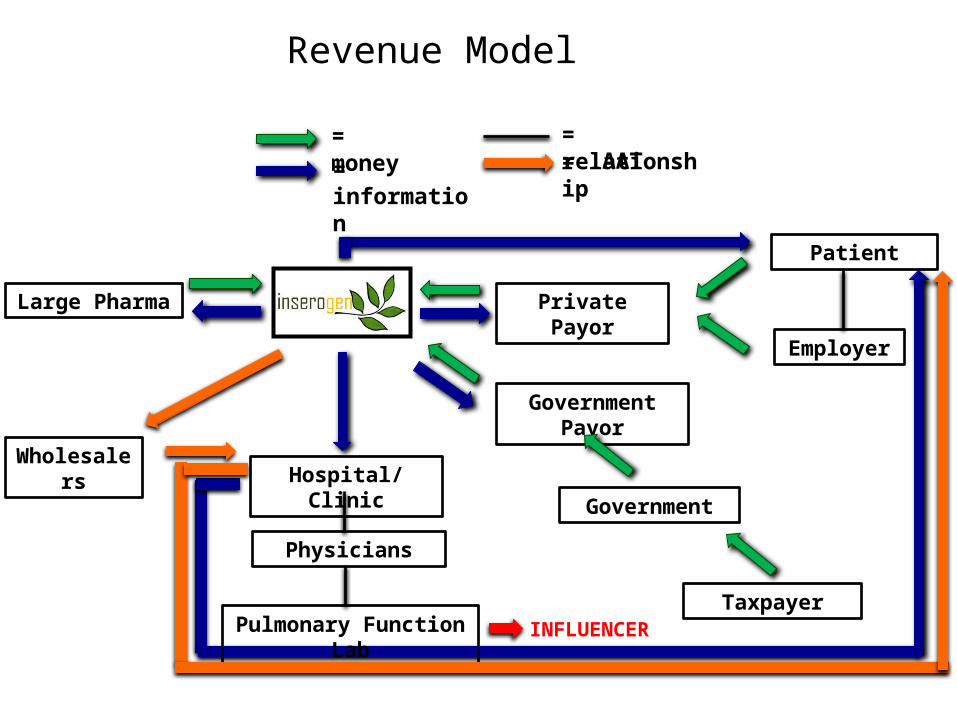
Revenue Model
= money= information
= relationship
Large Pharma
INFLUENCER
Hospital/Clinic
Physicians
Patient
Employer
Government
Taxpayer
Government Payor
Private Payor
Pulmonary Function Lab
Wholesalers
= AAT
Optics Design CompanyRevenue Model Example

Quantity purchase of components for prototype &
mass production .
Revenue Model & Payment Flows
217
LighTip™ Advanced Illumination Engineering
™
Reflector
Desired target
Light source
Customer:LED company
Key Partner:Optical Manufacturer
Customer’s final product
Our deliverabl
ePrototype & High Volume Production (0.25%-8% commission)
Engineering contract ($150-300/hour)
5/23/2012
Complex Sensor NetworksRevenue Model Example
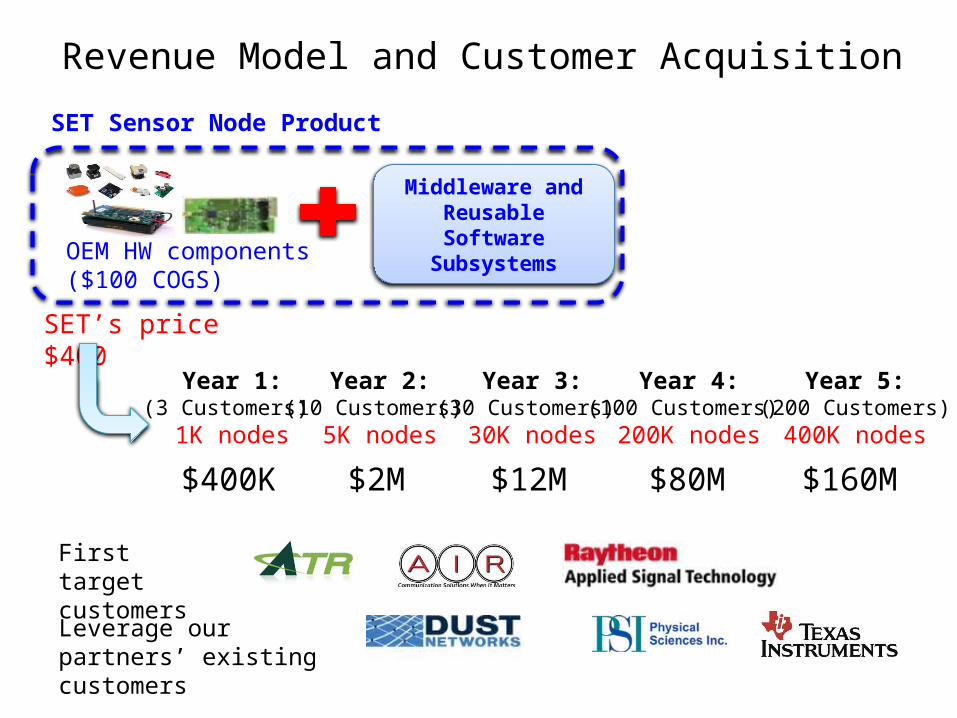
Revenue Model and Customer Acquisition
Year 1:(3 Customers)
1K nodes
Year 3:(30 Customers)
30K nodes
Year 4:(100 Customers)
200K nodes
SET’s price $400
$400K $12M $80M
Year 5:(200 Customers)
400K nodes
$160M
Middleware and Reusable Software
Subsystems
SET Sensor Node Product
OEM HW components ($100 COGS)
Year 2:(10 Customers)
5K nodes
$2M
First target customers
Leverage our partners’ existing customers

Healthcare SoftwareRevenue Model Example
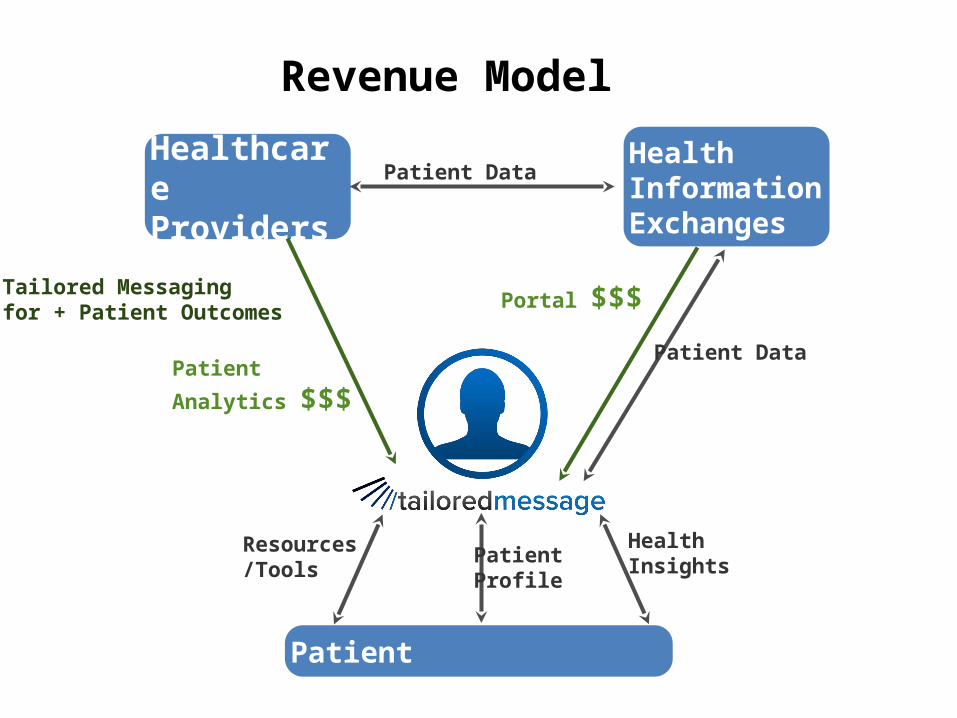
Revenue Model
Healthcare Providers
Health Information Exchanges
Patient
Patient Data
Patient Data
Portal $$$Tailored Messagingfor + Patient Outcomes
Patient Analytics $$$
Health Insights
Resources/Tools Patient Profile

The Lean LaunchPad
Lecture 6: Revenue Streams
How Do You Make Money?
Version 6/22/12
Revenue Streams
How do you Make Money?
© 2012 Steve Blank

The Two Key Questions• What’s my revenue model?• Within the revenue model – how do I
price the product?

Revenue Model =
the strategy the company uses to generate cash from each customer
segment

Revenue Streams
1.How many will we sell?2.Where/who is the money coming from?3.How do we price the product?4.Does this add up to a
business worth doing?
How Many Will You Sell?
• What’s the Market Size & estimate of Market Share?
• How many can your channel sell?• How much will the channel cost?• How many customer activations?
• Revenue? Churn/Attrition rate? customers/?
• How much will it cost to acquire a customer?• How many units will they buy from each of these efforts?
Top down: 10% of a million-person market=100,000 customersBottom up: 1,000 customers/month 1st year => 3,000/month 3rd year

Where is the money coming from?Revenue Model Choices
Bits
Physical
Product
Web Physical
Channel
Direct Sales Products License Subscription Upsell/Next Sell
Ancillary Sales:• Referral revenue • Affiliate revenue• E-mail list rentals• Back-end offers
Direct Sales Products Service Upsell/Next Sell
Referrals Leasing
Direct Sales Products Subscription Add-on services Upsell/Next Sell
Referrals

Key Revenue Model Questions• What are my customers paying for?• What capacity do my customers have to
pay?• How will you package your product ?• How will you price the offerings?
Pricing Model =
the tactics you use to set the price in each customer segment

How to price the product?
• Cost plus• Competitive pricing• Volume pricing• Value pricing• Portfolio pricing
• “Razor/razor blade” model• Subscription• Time/Hourly Billing• Leasing
Pricing Models - Physical

Common approaches to pricing Cost + markup Typically not a strategic way to price Driven by internal economics and not
customer insight
Cost based
Value based
Based on buyer’s perception of value (e.g. time saved, new efficiency created, etc.)
Customers don’t necessarily feel that they want to pay this way
Additional components of pricing
• Exclusive vs. non-exclusive• What do you price? What do you give away
for free?• How does cost vary at different production
levels?

Competition as an influence
• Pure competition• Oligopoly• Monopoly
Nature of Market
How they will react?
What is their product? What are their costs and prices? “What pricing will make them feel
the worst?”
Payment Flow
Leasing company
Tennant
Property Ownersinstall meter
send monthlywater bill
$9/month(2yrs)
$200 one time
water billplus $2/month
$2/month
activities
payments
• Draw the diagram• Put in numbers

Single versus Multi-sided Markets
Single/Multi-side Markets
• Single-sided markets care about revenues
• Multi-sided markets may care about users first, revenues second– Often Web-based

“Users First” Companies
If you say your business is advertising based:
• How do you get to 10M monthly users?• How do you become one of the top 5 websites
visited?• How much do the “payers” actually pay?
“Revenue First” Companies
• Time to doublings for monthly revenues• Key questions:• When will I get to $100k/month in revenues?• When will I get to $1M/month in revenues?• What assumptions about my business am I
making when I reach these milestones?

Market Type and Revenue

Other Issues
• Distribution channel affects revenue streams
• Market type affects revenue streams• Demand curve affects revenue streams• Consider lifetime value

New Market Revenue Forecast
New Market Sales Curve

Existing Market Revenue Forecast
Existing Market

Resegmented Market Revenue Forecast

Common categories of Web/Mobile revenue models
“Direct” revenue models
• Sales: Product, app, or service sales
• Subscriptions: SAAS, games, monthly subscription
• Freemium: use the product for free: upsell/conversion
• Pay-per-use: revenue on a “per use” basis
• Virtual goods: selling virtual goods
• Advertising sales: unique and/or large audience

“Ancillary” revenue models
• Referral revenue: pay for referring traffic/customers to other web or mobile sites or products.
• Affiliate revenue: finder’s fees/commissions from other sites for directing customers to make purchases at the affiliated site
• E-mail list rentals: rent your customer email lists to advertiser partners
• Back-end offers: add-on sales items from other companies as part of their registration or purchase confirmation processes, or “sell” their existing traffic to a company that strives to monetize it and share the resulting revenu3

Asset Sale• Sale of ownership right to a physical
product

Usage Fee• Usage of service. Fee is proportional to
the usage of the service.

Subscription Fee
• Fee for continuous access to a service

Renting
• Fee for temporary access to a good or service
Licensing
• Fee for use of some IP (including software)

Intermediation Fee
• Often found in marketplaces of various types, a fee for bringing together two or more parties involved in a transaction

Advertising
• Fee paid by brands and companies to get in front of potential customers

Revenue Model Summary

Example AnalysisTarget marketUSA market – 1.5 M patientsEurope – 2 M patientsPackageReusable wrist watchDisposable sensors / patchAccess to patients dataProduct development4 people in the beginning$2 million1.5 years to develop
SalesStart in EU middle of year 3Start in USA end of year 4Personnel Average salary $120 KLoad factor 1.5Headcount from 4 to 174 in year 8Financing Series A – $3 MSeries B – $10 M
Price per package: $150
COGS Profit$60 per unit $90 per unit
Operating Expenses

Does it add up?
1. Is revenue adequate to cover costs in the short term?
2.Are you confident revenue will grow materially if not dramatically over time?
3.Does profitability improve as the revenues get bigger?

Thought experiment
• Time to doublings for monthly revenues• Key questions:
– When will I get to $100k/month in revenues?
– When will I get to $1M/month in revenues?– What assumptions about my business am I
making when I reach these milestones?

Optical Equipment Revenue Model Example

Phi OpticsComponent vendors
University Business Services
Researcher Grant AgenciesIndustry Contracts
applies for grants/contracts
funds grant/contractrequest for equipment
QPI info & price
activity
payment
Academia Payment Flow
Buys QPI device

Phi OpticsComponent vendors
Purchasing Dept.Researcher CTO
VP for R&D
Justifies need for equipment
Includes equipment in the budget
QPI specs + price
activity
payment
Bio-Pharma Payment Flow
Buys QPI device

Phi OpticsEquipment suppliers
Accounting Dept.
Product Dev Engineers +
Business Dev ($) + Legal Dept (royalties)
CTOVP for R&D
Justifies QPI integration in OEM systemSuggests co-development deal
Allocates funds in the budget
QPI specs + price+ SOW
activity
payment
OEM Payment Flow
Funds SOWPays royalties/sub-licensing/other recurring fees
Nitrate SensorRevenue Model Example
OEM
Large farm
USDA/EPA
Small farm
Product
Money
Water Data only

OEM
Us
Large farm
USDA/EPA
Small farm
Product
Money
Nutrient Data
Product sales

OEM
Us
Large farm
USDA/EPA
Small farm
Product
Money
Nutrient Data
Licensing/sales
OEM
Us
Large farm
USDA/EPA
Small farm
Product
Money
Nutrient Data
Independent of licensing decision
Us
USDA/EPA
Small farm
400 acres, 4 soil types: 8 sensors
Install sensors
$1K/sensor less incentive = $4140
Using $1000 per sensor (2x cost) puts us ~$350 more expensive than current commercial nitrate sensors. We’re including pH, moisture, and conductivity, though.
Incentives: Best case scenario $45.89/acreWorst case: $9.65/acre or state dependent
25% cost coverage
$3860 for 400 acre nutrient management
Average $10.40 in N-fertilizer lost to groundwater per acre: Repaid in 1 year
Bio-Based Chemical IntermediatesRevenue Model Example

Here’s what we hypothesized…
Distributor
Monomer manufacturer
Surfactant formulator
Surfactant user
Consumer facingcompany
Consumer Market Pull(Sustainability agenda)
Revenue model: Hypothesis
Biomass supplier Biomass 15 c/lbBiomass Range 5-20c/lb
Monomer ?Detergent alcohols 80c/lb
Formulation ?Formulated Surfactant
90c/lb
Surfactant 100 c/lbFormulated Detergent
100c/lb
Detergent 200 c/lb10% Surfactant in
Detergent
Product
Decision Makers

Here’s what we did…
Techno-commercial analysis expert
Revenue Model: Experiment 1
Life Cycle Assessment Expert Economic analysis expert
DirectorDirector
Production Economics Experts
Business Manager
Economic analysis expert

Financial metrics
Ethanol DMF Lactic Bi-functional fatty acid
Scale (T/day) 500,0001b/day
600,000 lb/day
300,000 lb/day
Feedstock 15 c/lb 19 c/lb 16 c/lb
Processing 2 c/lb 26 c/lb 25 c/lb
Capital 1 c/lb 2 c/lb 41 c/lb
Other 3 c/lb 15 c/lb 39 c/lb
MSP (c/lb) 21 c/lb 62 c/lb 120 c/lb
Revenue model: Result 1
Financial metrics
Ethanol DMF Lactic Bi-functional fatty acid
Scale (T/day) 500,0001b/day
600,000 lb/day
300,000 lb/day
Feedstock 15 c/lb 19 c/lb 16 c/lb
Processing 2 c/lb 26 c/lb 25 c/lb
Capital 1 c/lb 2 c/lb 41 c/lb
Other 3 c/lb 15 c/lb 39 c/lb
MSP (c/lb) 21 c/lb 62 c/lb 120 c/lb
Revenue model: Result 1

Financial metrics
Ethanol DMF Lactic Bi-functional fatty acid
Scale (T/day) 500,0001b/day
600,000 lb/day
300,000 lb/day
?
Feedstock 15 c/lb 19 c/lb 16 c/lb 15 c/lb
Processing 2 c/lb 26 c/lb 25 c/lb ?
Capital 1 c/lb 2 c/lb 41 c/lb ?
Other 3 c/lb 15 c/lb 39 c/lb ?
MSP (c/lb) 21 c/lb 62 c/lb 120 c/lb < 100 c/lb
Revenue model: Result 1
Less than 100 c/lb is achievable when:1. Large reactor with 500,000 lb/day capacity2. Optimized fermentation and processing costs
Payment Flow
Distributor
Monomer manufacturer
Surfactant formulator
Surfactant user
Consumer facingcompany
Consumer Market Pull(Sustainability agenda)
Revenue model: Result 2
Biomass supplier Biomass 15 c/lbBiomass Range 5-20c/lb
Monomer 80 c/lbDetergent alcohols 80c/lb
Formulation 90 c/lbFormulated Surfactant
90c/lb
Surfactant 100 c/lbFormulated Detergent
100c/lb
Detergent 200 c/lb10% Surfactant in
Detergent
Product
Decision Makers
Disposal WasteRegulations

Payment Flows Example
CanScan Payment Flows
Class 6 - Update 3.5.2012
CanScan
Hospital / Clinic
Oncologist
Private payer/MAC
Pathologist/ billing
Sales/orderPaymentService
Services rendered
$$
$$
Clinical Diagnostic Services
CanScan
Pharmaceutical Company
Researchers
Sales/orderPaymentService
$$
Pharmaceutical Products
Instr. /Kits

Medical DevicePricing Example

MammOpticsPricing Strategy
Equipment Lease model
Per-use model
Consumable
Cost of the device
Service per year
Per-use fee
Consumable
$50,000
$3,000
0
0
$5,000
$10,000
0
0
$5,000
0
$50
0
$25,000
0
0
$20

MammOpticsPricing Strategy
Equipment Lease model
Per-use model
Consumable
Cost of the device
Service per year
Per-use fee
Consumable
$50,000
$3,000
0
0
$5,000
$10,000
0
0
$5,000
0
$50
0
$25,000
0
0
$20
Approved by
customers and
investors

GrapheneRevenue Model Example
Distributors
Researchers
Graphene Frontiers
Current TEM grid provider
More workAdd value
Material supplier
Payment flow

Distributors
Graphene Frontiers
Material supplier
Flexible display manufacturer
Electronic User
Research, cost
E-reader manufacturer Parts suppliers
Parts suppliers
Payment flow
Direct Cost Estimates: Scale Matters• Cost per in2 – 1” Furnace = $.80
• Cost per in2 – 2” Furnace = $.45
• Cost per in2 – 4” Furnace = $.20
If we can move to N (replacing Ar, key direct cost driver)
• Cost per in2 – 1” Furnace = $.50
• Cost per in2 – 2” Furnace = $.25
• Cost per in2 – 4” Furnace = $.10
“Holy Grail”: 4” or larger continuous production w/Nitrogen
Cost per in2 – 4” Furnace, Batch/Continuous = … $.05
SensorPricing Tactics Example
Technology Supplier
Industrial Plants
Plant #1
Plant #2
Plant #3
Understand Economics of Plant + Sensors
Understand Economics of Technology Supplier
Value pricingWho does this?

290Diaphragm Membrane
$240/MT Cl2
Cost of damages + downtime per incident per year
Operational conditions Capital cost per incident Downtime per incident # of cells protected Time between incidents Number of cells, US and worldwide
Diaphragm Membrane Membrane Header
$2,500 $270 $10,600
Value per unit per year
291
Soft product launch projected for Q1-Q2 2012General launch projected for Q4 2012
Year Type % Revenue [/year]1 Innovators (US) 2.5 $271,500
Operating costs for 1st year projected to be $350,000
2 Early Adopters 16 $15,040,000
3 Early Majority 50 $47,000,000
4 Late Majority 84 $78,960,000
Full Penetration 100 $94,000,000
Diaphragm Membrane Membrane Header
$2,500 $270 $10,600

Medical DeviceRevenue Model Example

What we make
DentistDentalOptics
~$2000
Device cost (one time)
~$2.50 per patient
Disposables

What the dentist normally makes
Dentist Patient
Insurance
Co-pay
Membership
$250
$250
Equipment / Variable Costs
Note: Assumes 50/50 copay-insurance split

What we’d add for the dentist
Dentist PatientDentalOptics
Insurance
Co-pay
Membership
~$2000
$250
Device cost (one time)
$250
~$2.50 per patient
Disposables
Equipment / Variable Costs
Device creates
additional periodontal procedures
Note: Assumes 50/50 copay-insurance split

Farm Nitrate SensorRevenue Model Example
Us
USDA/EPA
Small farm
400 acres, 4 soil types: 8 sensors
Install sensors, provide service
$1K/sensor less incentive = $4140 to recover in contract
Incentives: Best case scenario $45.89/acreWorst case: $9.65/acre or state dependent 25% cost coverage
$3860 for 400 acre nutrient management
Average $10.40 in N-fertilizer lost to groundwater per acre
Pay for 2-3 year contract service monthly
Economics of TSP Operation

Us
USDA/EPA
Small farm
400 acres, 4 soil types: 8 sensors
Install sensors, provide service
$1K/sensor less incentive = $4140 to recover in contract
Incentives: Best case scenario $45.89/acreWorst case: $9.65/acre or state dependent 25% cost coverage
$3860 for 400 acre nutrient management
Onion Case Study (44K acres): Cost: DAP - $700/ton + $25/aRate: 280lb/a for 400a farm
= $39K
30% Improvement: $13K savedCharge: $6K/season
= $660K/yr contract revenue
Pay for 2-3 year contract service monthly
Economics of TSP Operation

Biofactories for TherapeuticsRevenue Model Example

Revenue Model
= money= information
= relationship
Large Pharma
INFLUENCER
Hospital/Clinic
Physicians
Patient
Employer
Government
Taxpayer
Government Payor
Private Payor
Pulmonary Function Lab
Wholesalers
= AAT

Optics Design CompanyRevenue Model Example

Quantity purchase of components for prototype &
mass production .
Revenue Model & Payment Flows
302
LighTip™ Advanced Illumination Engineering
™
Reflector
Desired target
Light source
Customer:LED company
Key Partner:Optical Manufacturer
Customer’s final product
Our deliverabl
ePrototype & High Volume Production (0.25%-8% commission)
Engineering contract ($150-300/hour)
5/23/2012

Complex Sensor NetworksRevenue Model Example

Revenue Model and Customer Acquisition
Year 1:(3 Customers)
1K nodes
Year 3:(30 Customers)
30K nodes
Year 4:(100 Customers)
200K nodes
SET’s price $400
$400K $12M $80M
Year 5:(200 Customers)
400K nodes
$160M
Middleware and Reusable Software
Subsystems
SET Sensor Node Product
OEM HW components ($100 COGS)
Year 2:(10 Customers)
5K nodes
$2M
First target customers
Leverage our partners’ existing customers
Healthcare SoftwareRevenue Model Example

Revenue Model
Healthcare Providers
Health Information Exchanges
Patient
Patient Data
Patient Data
Portal $$$Tailored Messagingfor + Patient Outcomes
Patient Analytics $$$
Health Insights
Resources/Tools Patient Profile
The Lean LaunchPad
Lecture 7: Partners
Version 6/13/12
Who are your Partners and Suppliers?

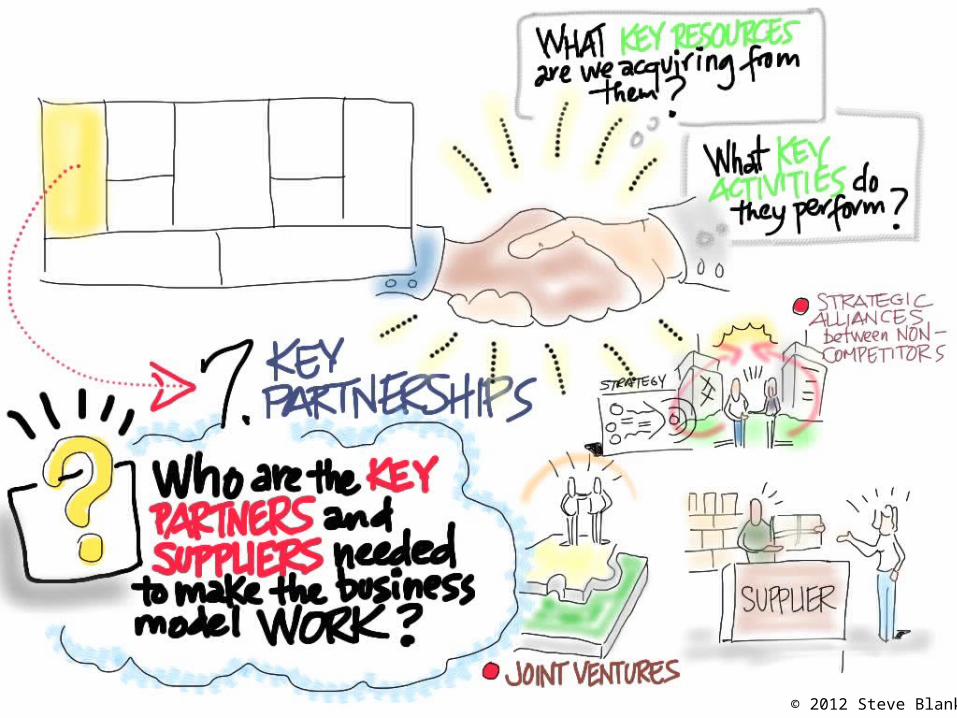
Key Partners
Who are your Partners and Suppliers?
© 2012 Steve Blank

What defines a “Partner?”
• Shared economics
• Mutual success / failure
• Co-development/invention
• Common customer
But remember - you’re a startup
Why Have Partners?
311
● Faster time to market
● Broader product offering
● More efficient use of capital
● Unique customer knowledge or expertise
● Access to new markets

312
Types of Partners
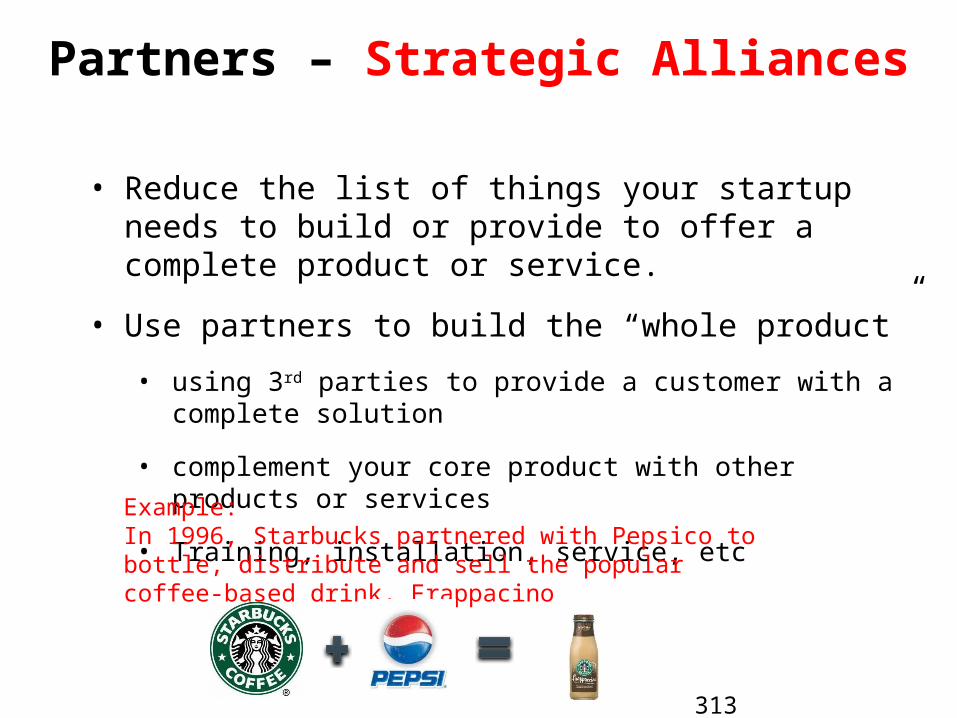
Partners – Strategic Alliances
313
• Reduce the list of things your startup needs to build or provide to offer a complete product or service.
• Use partners to build the “whole product”
• using 3rd parties to provide a customer with a complete solution
• complement your core product with other products or services
• Training, installation, service, etc
Example: In 1996, Starbucks partnered with Pepsico to bottle, distribute and sell the popular coffee-based drink, Frappacino

Partners – Joint Business Development
• Joint promotion of complementary products• Share advertising, marketing, and sales programs
• One may be the dominant player
Example: Intel offered advertising fees to PC Vendors
315
Startup mistakeStrategic alliances and joint partnerships
Not needed for EarlyvangelistsAre needed for Mainstream customers
Usually fail
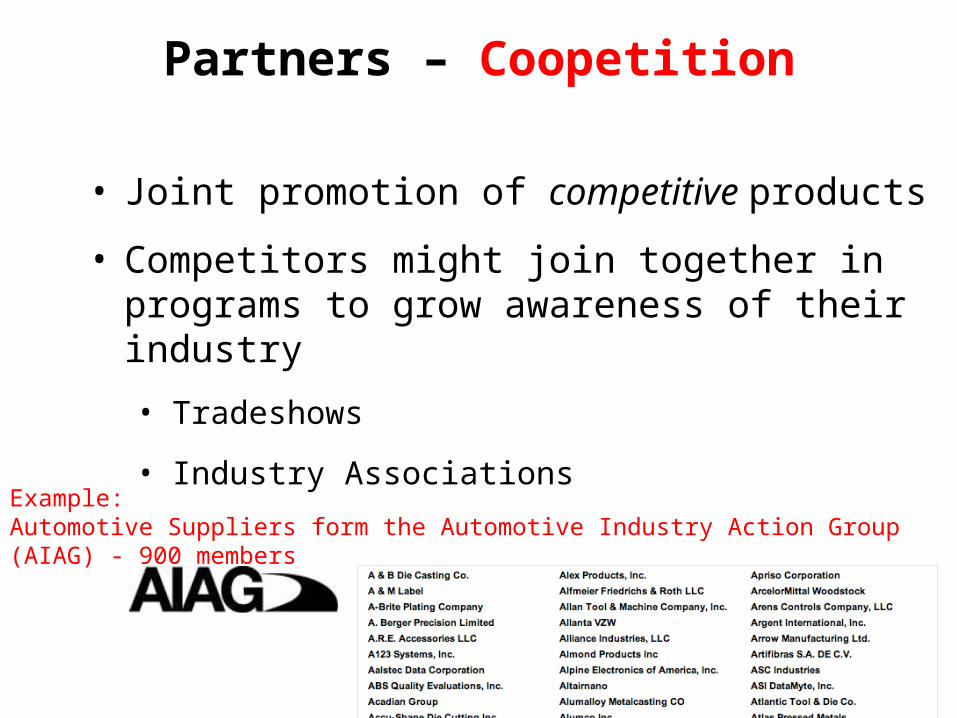
Partners – Coopetition
316
• Joint promotion of competitive products
• Competitors might join together in programs to grow awareness of their industry
• Tradeshows
• Industry Associations
Example: Automotive Suppliers form the Automotive Industry Action Group (AIAG) - 900 members
Partners – Key Suppliers
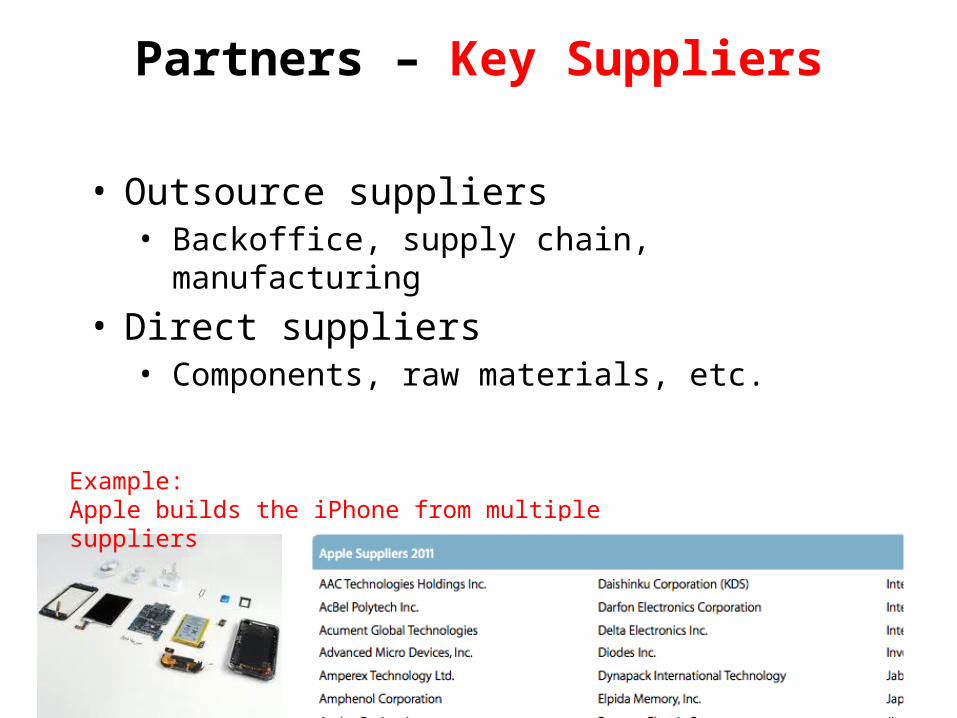
317
• Outsource suppliers• Backoffice, supply chain, manufacturing
• Direct suppliers• Components, raw materials, etc.
Example: Apple builds the iPhone from multiple suppliers
Traffic Partners – Virtual Channels
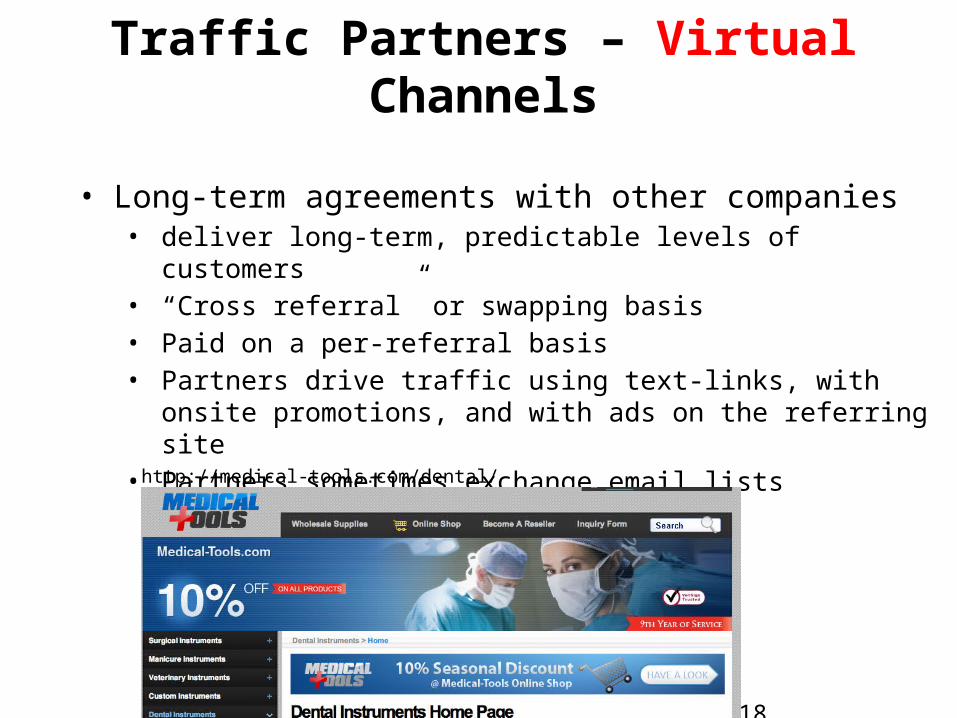
318
• Long-term agreements with other companies • deliver long-term, predictable levels of customers • “Cross referral” or swapping basis• Paid on a per-referral basis• Partners drive traffic using text-links, with onsite promotions, and with
ads on the referring site• Partners sometimes exchange email lists
http://medical-tools.com/dental/

319
Partner Risks

Partnership Disaster: Boeing
320
CollaborativeLooked great on paper.
Worst business decision of the 21st century
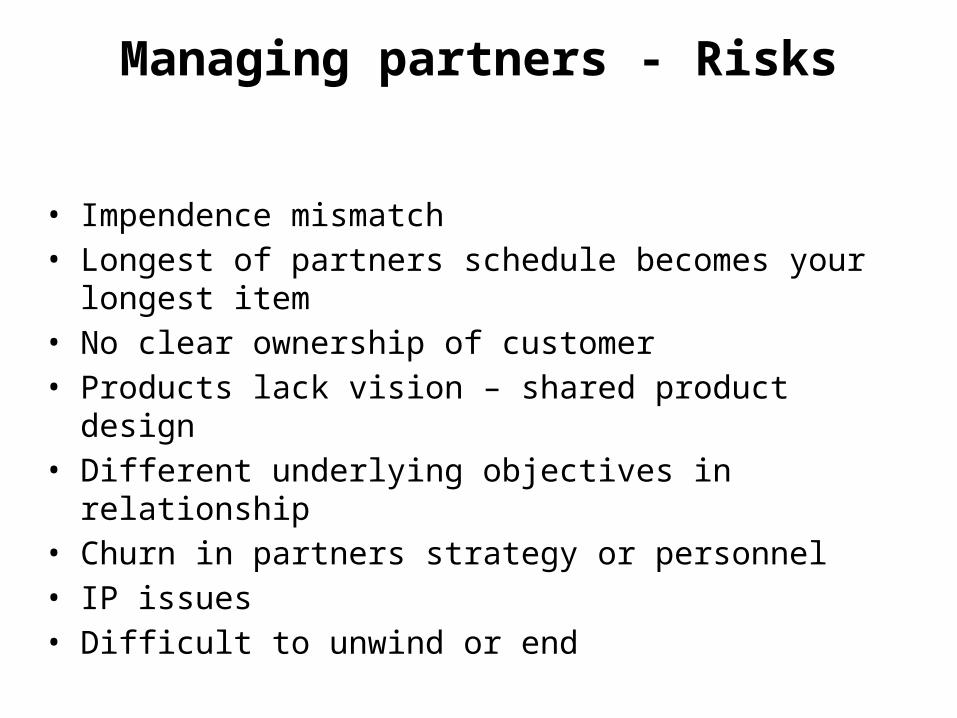
Managing partners - Risks
• Impendence mismatch• Longest of partners schedule becomes your longest item• No clear ownership of customer• Products lack vision – shared product design• Different underlying objectives in relationship• Churn in partners strategy or personnel• IP issues • Difficult to unwind or end
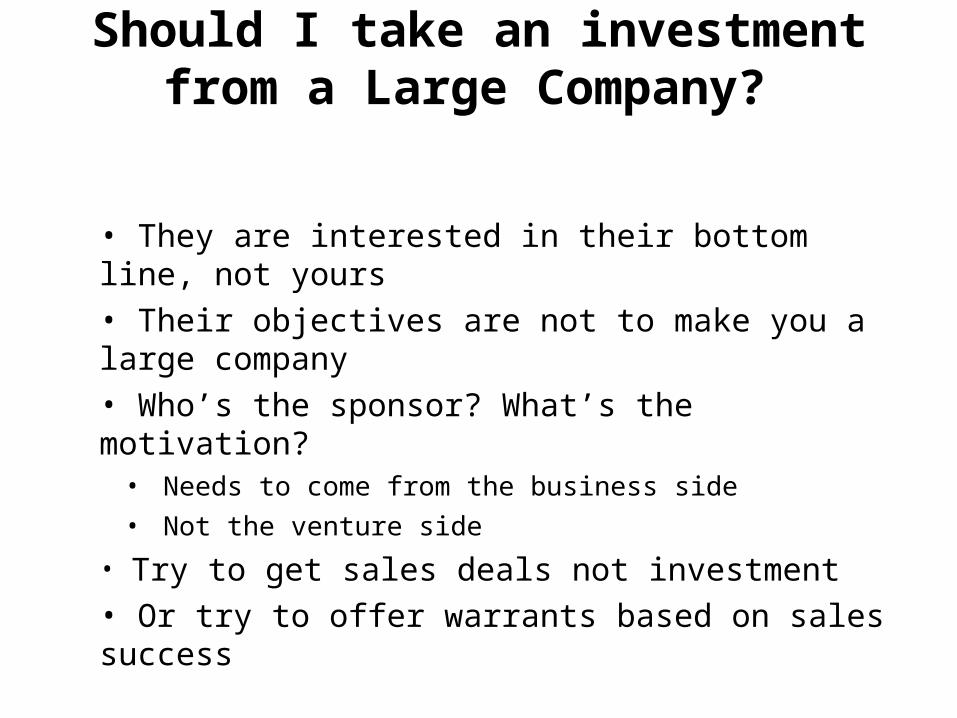
Should I take an investment from a Large Company?
• They are interested in their bottom line, not yours• Their objectives are not to make you a large company• Who’s the sponsor? What’s the motivation?
• Needs to come from the business side• Not the venture side
• Try to get sales deals not investment• Or try to offer warrants based on sales success

Startup Partner Strategies
323
• Don’t confuse partners for Earlyvangelists vs. mainstream• Don’t confuse big company partnering with startup strategy• Find the one that gives you an unfair advantage• Recognize you don’t matter to a large partner

324
CatalystsPartner Examples
Partners:Hypothesis and Experiments
T3
Thru-Pore Technologies
Research Catalysts, Inc.
326
Materials CoatingPartner Examples

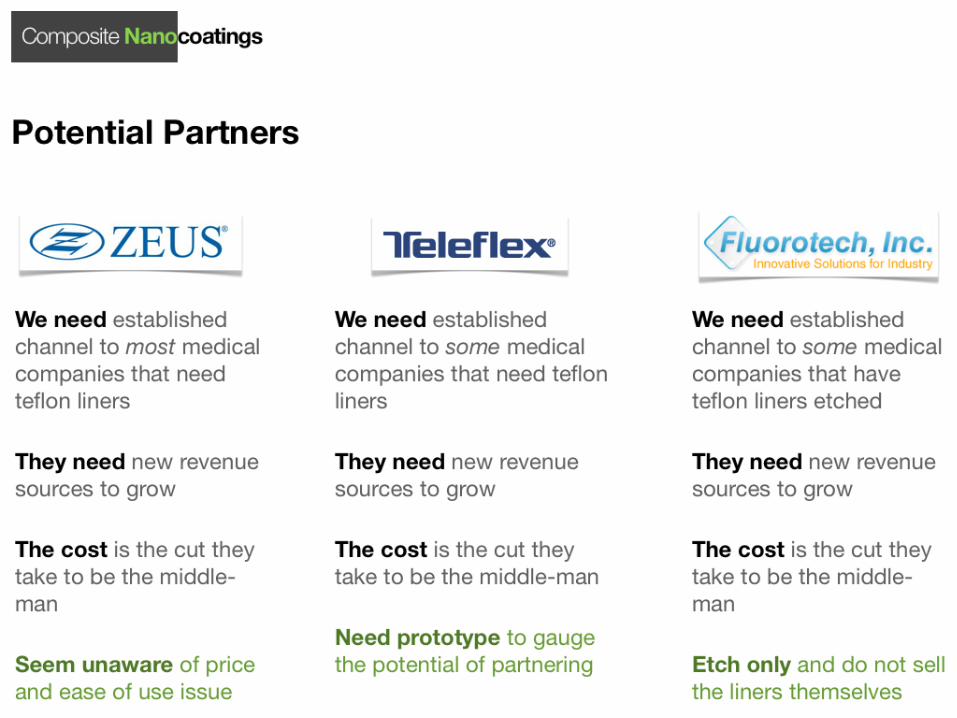

331
Molecular DiagnosticsPartner Examples

Chip Manufacturers
Partners
LiquiLume
Hospitals
OEMs
Packaging
Reagents (IDT, Fisher)
Sample Prep (not for RUO)
Shippers (UPS, FedEx)
Distributors (Fisher)
Doctors
Clinical Labs
Dx Test Company
Research Labs
Back End Front End
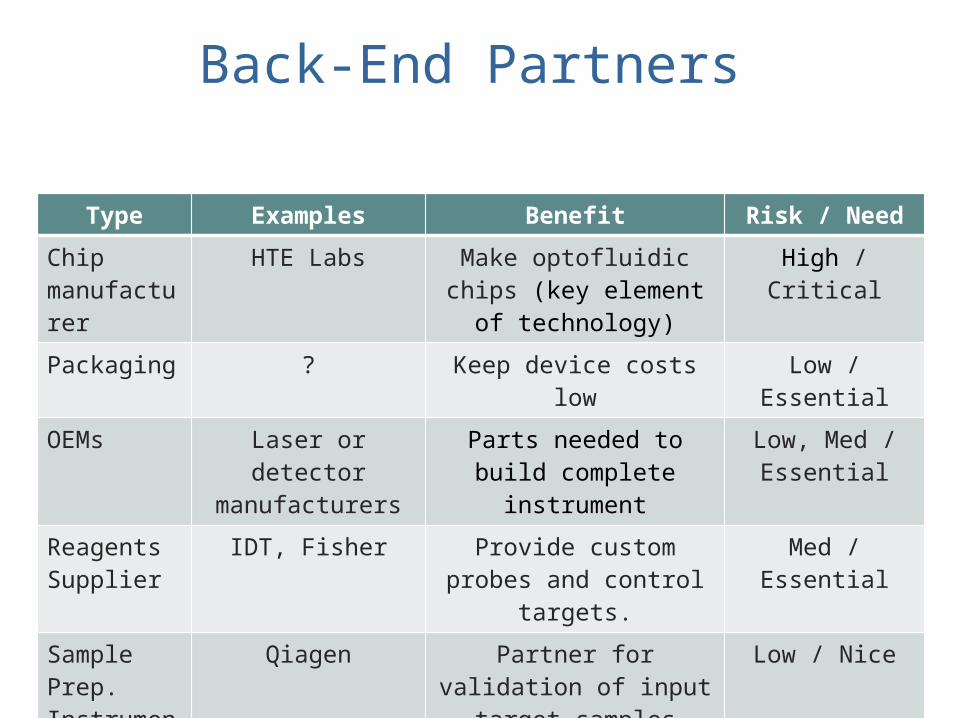
Back-End Partners
Type Examples Benefit Risk / Need
Chip manufacturer
HTE Labs Make optofluidic chips (key element of technology)
High / Critical
Packaging ? Keep device costs low Low / Essential
OEMs Laser or detector manufacturers
Parts needed to build complete instrument
Low, Med / Essential
Reagents Supplier
IDT, Fisher Provide custom probes and control targets.
Med / Essential
Sample Prep. Instrument
Qiagen Partner for validation of input target samples
Low / Nice

Front-End Partners
Type Examples Benefit Risk / Need
Distributor Fisher Sell chips, reagents Low / Not critical for RUO
Research labs UCSF oncologists, Stanford MDx Lab, UCSF Micro. Lab
Will validate technology; publish; develop assays
Low / Critical during phase I
Dx test company
Genentech;Companion Dx w
pharma and biotechs;Specialty Dx test cos.
Possibly unique test on unique platform, partner
develops assayStrategic alliance
Low / Synergistic
Clinical labs Quest, LabCorp Help develop CLIA-waived application; 510(k); clinical
trials
Med / Crucial during phase II

335
Complex Sensor NetworksPartner Examples

Universe of PartnersSensor device/network co’s Embedded platform makers
Application specialists
SET

Potential Partnerships
SET
Sensor device/network co’s Embedded platform makers
Application specialists

Medical DevicePartner Examples
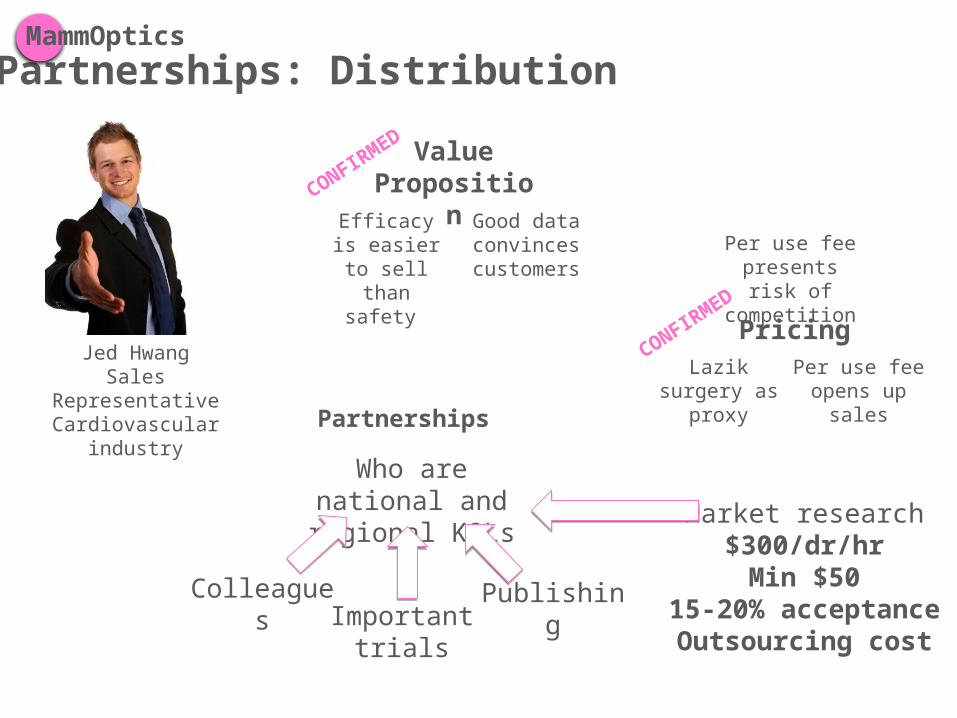
Partnerships: DistributionMammOptics
Jed HwangSales
RepresentativeCardiovascular
industry
Value Proposition
Efficacy is easier to sell than safety
Good data convinces customers
PricingLazik
surgery as proxy
Per use fee opens up
sales
Per use fee presents risk
of competition
Partnerships
Who are national and regional KOLs
PublishingColleaguesImportant
trials
CONFIRMED
CONFIRMED
Market research$300/dr/hr
Min $5015-20% acceptanceOutsourcing cost
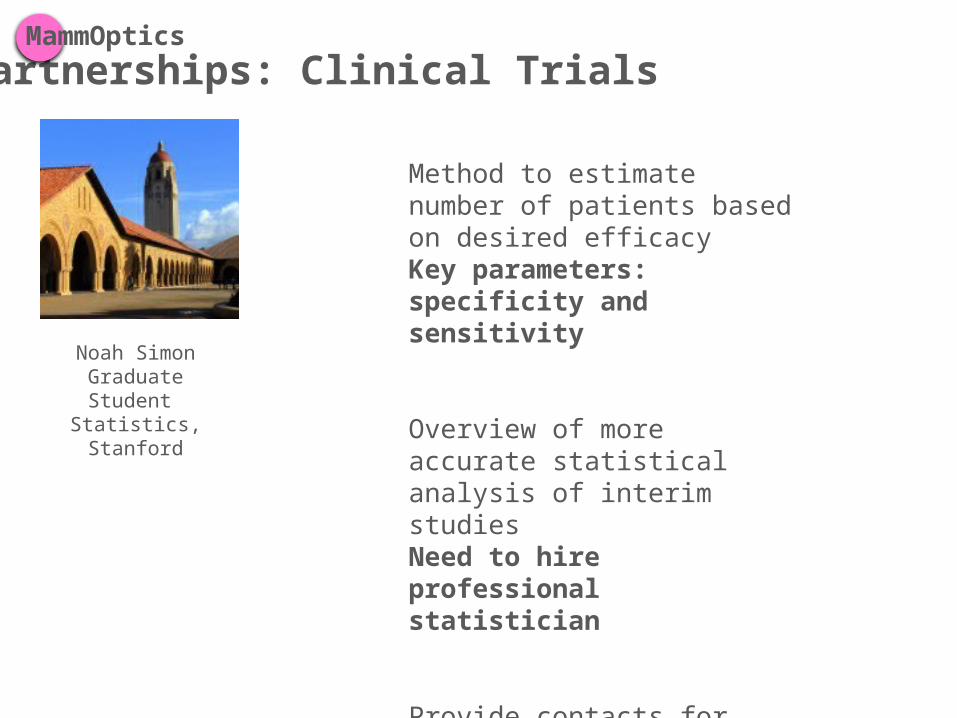
Partnerships: Clinical TrialsMammOptics
Noah SimonGraduate Student
Statistics, Stanford
Method to estimate number of patients based on desired efficacyKey parameters: specificity and sensitivity
Overview of more accurate statistical analysis of interim studiesNeed to hire professional statistician
Provide contacts for hiring appropriate statisticians

Partnerships: ReimbursementsMammOptics
Shannon BergstedtCardioDX
Reimbursement Office
Doctor Patient
Insurance
Provides service
Pays membership
Pays for procedure
Startup
Notifies of procedure
Reimbursement officer
“The reimbursement environment is complex,
somewhat hazy, and can be hostile”1) Codes
2) Coverage3) Payment

Partnerships: ManufacturingMammOptics
Don Archambault, Director of Business Development, Omnica Corporation: specialized in MEDICAL DEVICE DESIGN, product engineering and product development.
Scanning Device, 75% Gross margin- Initial Discounts to gain adoption
9 Inches
~5 lbs
COGS$4-5k per
unit
Gross Profit12-15k per unit
Gross Profit
Discounts for Initial Market
COGS$4-5k per
unit
DSP
RFIC
Photo probe
Disposable head

The Lean LaunchPad
Lecture 8: Resources, Activities & Costs
Version 6/22/12

Key Activities
What’s Most Important for the Business?

© 2012 Steve Blank

Key Resources
What’s Are Your Most Important Assets?

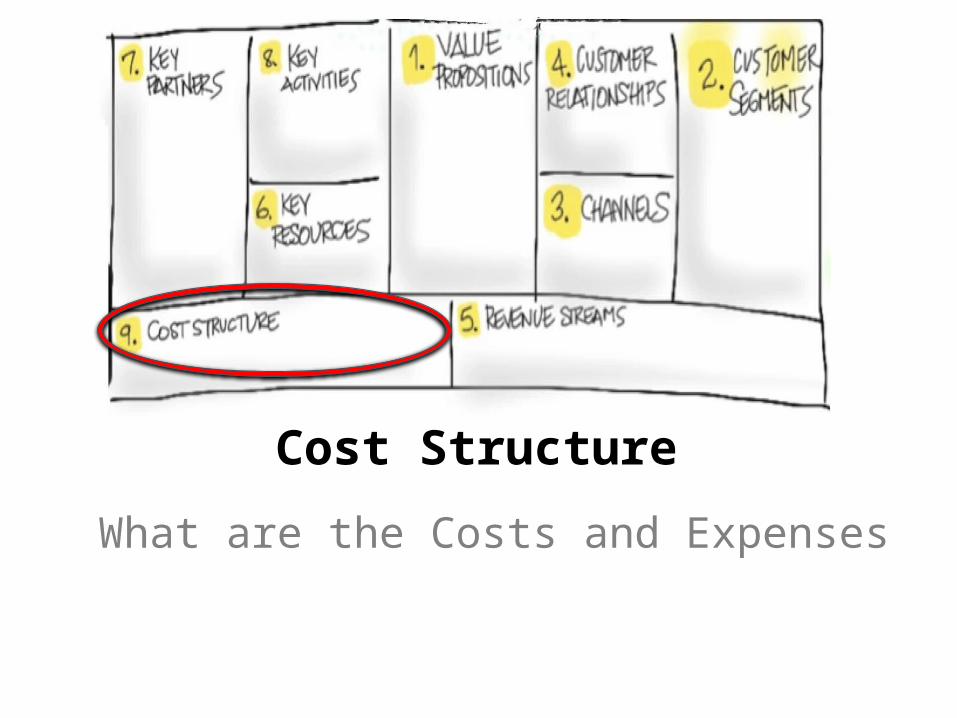
Cost Structure
What are the Costs and Expenses

© 2012 Steve Blank

How You Make Money
<

Key Resources
Four Critical Resources
• Physical• Financial• Human• Intellectual
Physical Resources
• company facilities– office space, company location
• product/services – supply of silicon wafers or iron ore, or
thousands of feet of warehouse space?
• Many physical goods are capital intensive

Financial Resources
• Friends and Family• Crowdfunding• Angels• Venture Capital• Corporate partners • Others: SBA or SBIR grants• Lease-lines• Factoring• Vendor-financing

Human Resources
• qualified employees• mentors, teachers, coaches, advisors

Mentors, Teachers, Coaches
• Mentors, teachers, coaches advance your personal career– If you want to learn a specific subject find a teacher– If you want to hone specific skills or reach an exact
goal hire a coach – If you want to get smarter and better over your career
find someone who cares about you enough to be a mentor

Advisors
• Advisors are people you need to help advance your company’s success– Founders fail when they believe their visions are facts– Listening to experienced advice can help you sort
through whether your vision is a hallucination– Getting an advisory board (by expanding your circle of
accumulated wisdom past their investors) is so important that it’s an explicit step in the Customer Development process
Qualified Employees/Culture
• Are the difference between a good idea that never went anywhere and a billion dollar firm


360
MBA295F Customer Development
in the High-Tech Enterprise Spring
2007
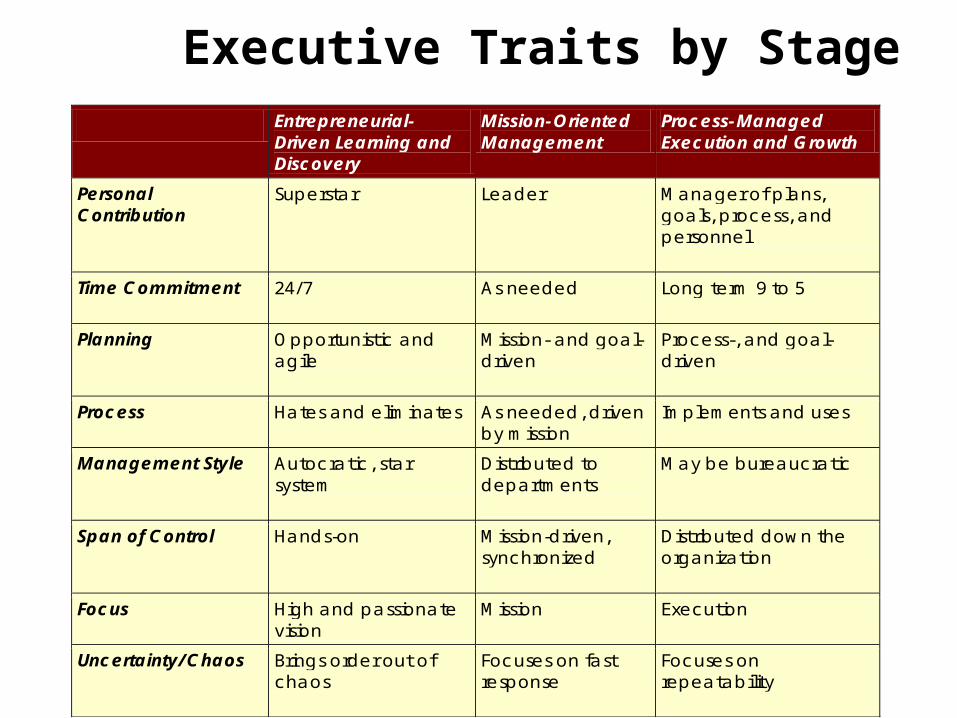
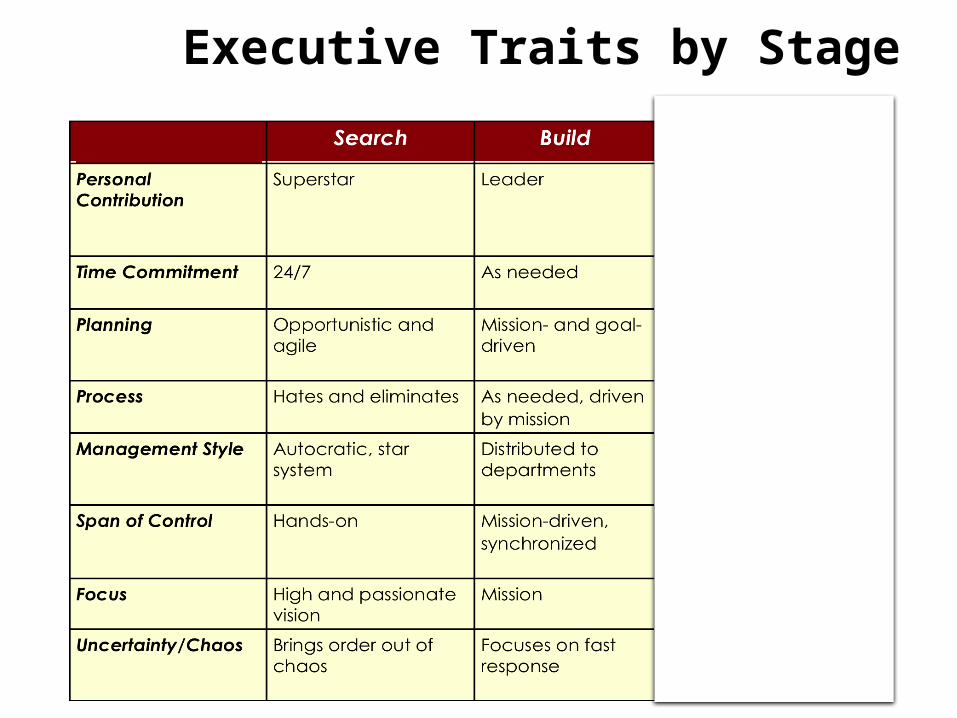
Executive Traits by Stage
Entrepreneurial- Driven Learning and Discovery
Mission-Oriented Management
Process-Managed Execution and Growth
Personal Contribution
Superstar Leader Manager of plans, goals, process, and personnel
Time Commitment 24/7 As needed Long term 9 to 5
Planning Opportunistic and agile
Mission- and goal-driven
Process-, and goal-driven
Process Hates and eliminates As needed, driven by mission
Implements and uses
Management Style Autocratic, star system
Distributed to departments
May be bureaucratic
Span of Control Hands-on Mission-driven, synchronized
Distributed down the organization
Focus High and passionate vision
Mission Execution
Uncertainty/Chaos Brings order out of chaos
Focuses on fast response
Focuses on repeatability

Executive Traits by Stage
Executive Traits by Stage
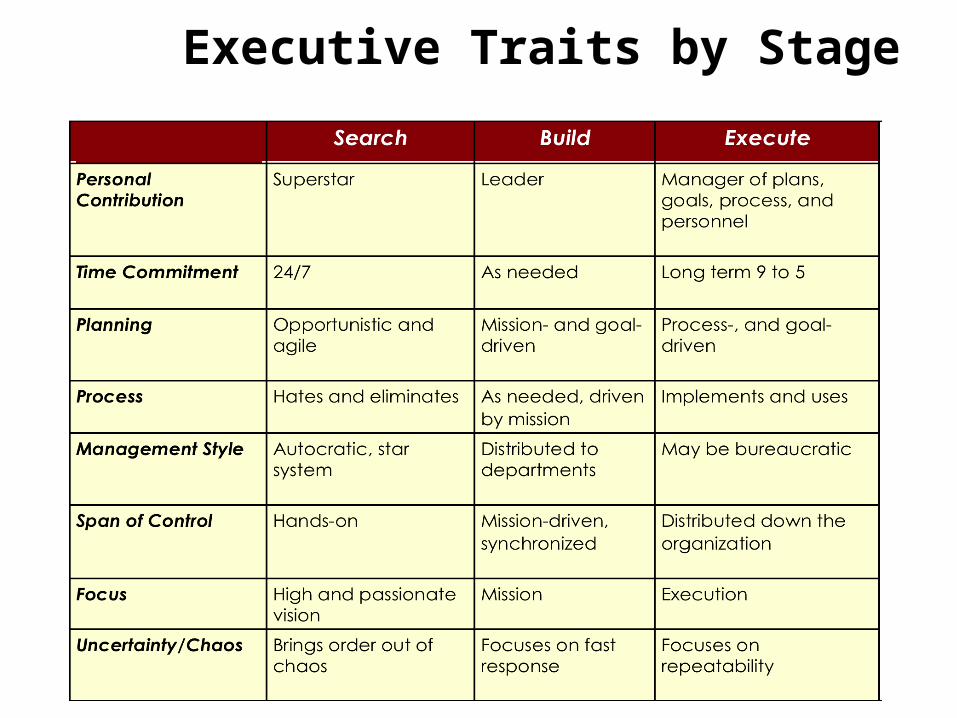
Executive Traits by Stage
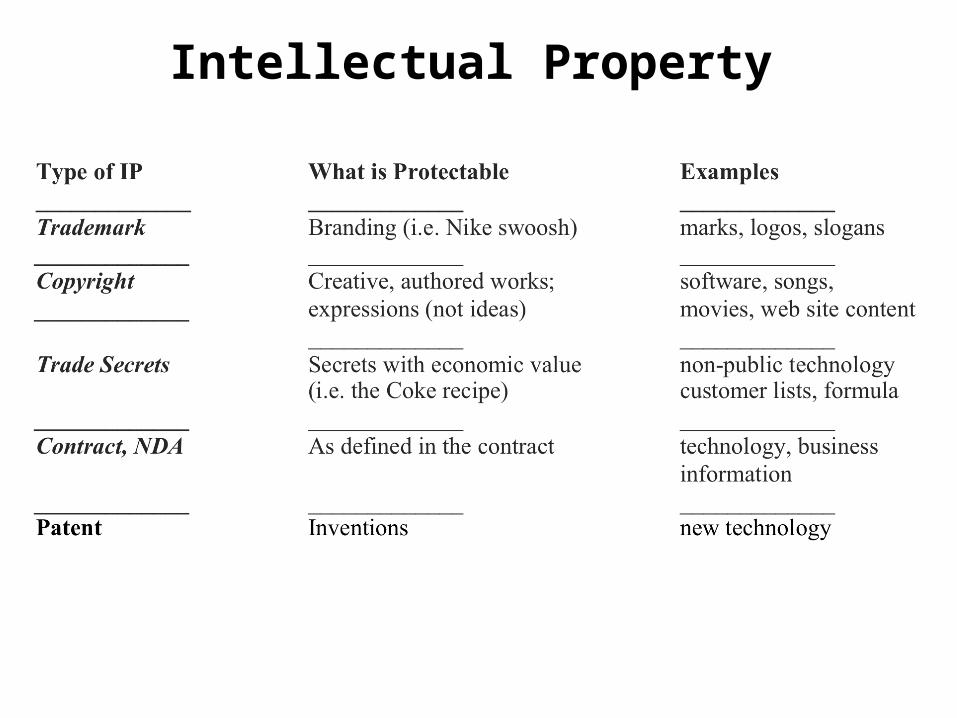
Intellectual Property
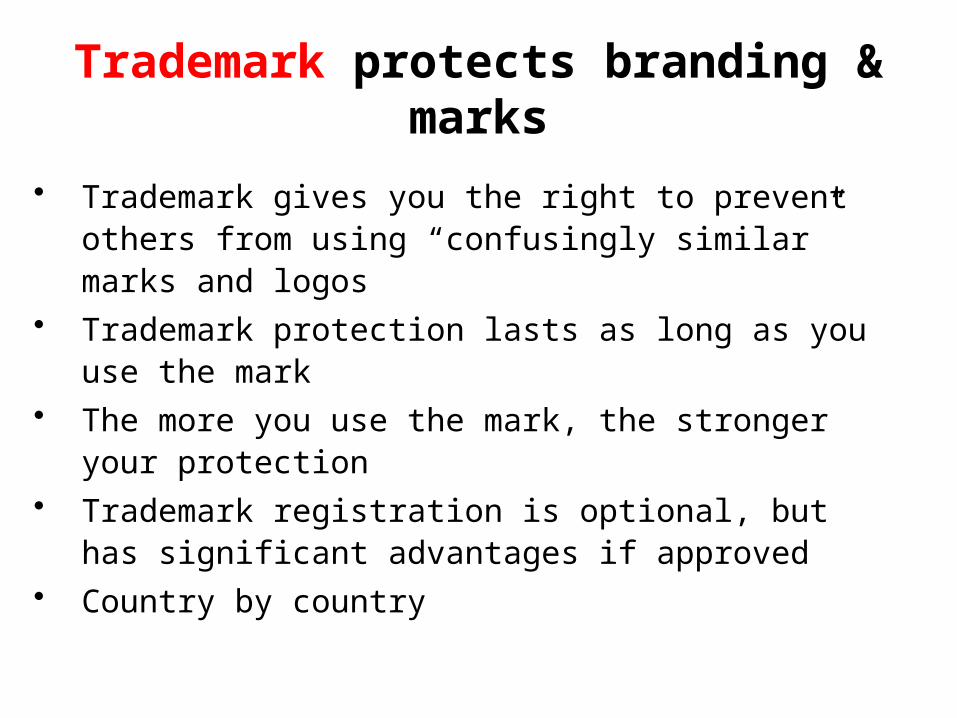
Trademark protects branding & marks
• Trademark gives you the right to prevent others from using “confusingly similar” marks and logos
• Trademark protection lasts as long as you use the mark• The more you use the mark, the stronger your protection• Trademark registration is optional, but has significant
advantages if approved • Country by country

Copyright protects creative works of authorship
• Copyright gives right to prevent others from copying, distributing or making derivatives of your work
– Protects “expressions” of ideas but does not protect the underlying ideas
• (Way) more than just technology: – songs, books, movies, photos, etc.
• Copyright protection lasts practically forever• Copyright does not prevent independent development• Registration is optional, but is required to sue for
infringement

Trade Secrets
• Information that is kept secret and has economic value to the business
• Coke recipe, customer lists, product road maps.• No registration required• Can last for as long as you take reasonable
steps to keep confidential

Contract
• Protection agreed to by contract
• No registration process
• You have whatever protection is defined in the contract (e.g., NDA gives you certain rights to protection of your confidential information)
• The protection lasts for the time period defined in the contract
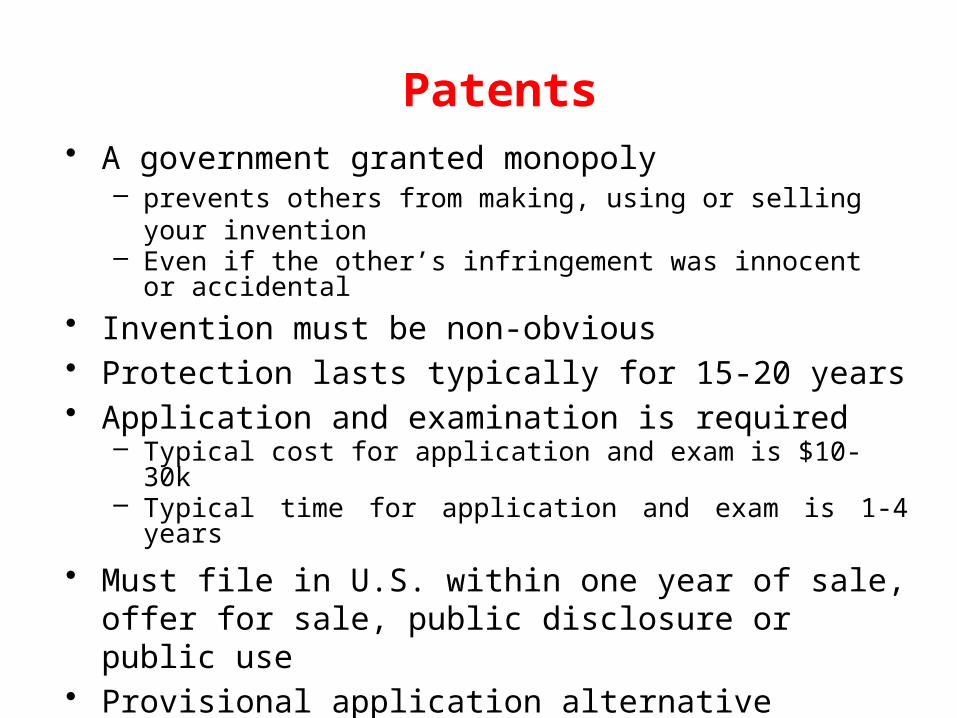
Patents• A government granted monopoly
– prevents others from making, using or selling your invention– Even if the other’s infringement was innocent or accidental
• Invention must be non-obvious• Protection lasts typically for 15-20 years• Application and examination is required
– Typical cost for application and exam is $10-30k– Typical time for application and exam is 1-4 years
• Must file in U.S. within one year of sale, offer for sale, public disclosure or public use
• Provisional application alternative

What Can be Patented?
• Just about anything . . .– Circuits, hardware– Software, applied algorithms– Formulas, designs– User interfaces– Applications, systems– Business processes (sometimes)
• But not these . . . – Scientific principles– Pure mathematical algorithms
• And, pending Supreme Court Case raises concerns regarding patentability of “methods” inventions

CostsMetrics that Matter

Search vs. Execution Metrics
• Existing companies execute plans
• Startups search for them
• Income Statement, Balance Sheet, etc are execution documents
• You first need to derive the metrics that matter

Metrics That Matter
• Value proposition: product cost, mkt size/share, competition?
• Customer Relationships: customer acquisition costs, conversion rates, lifetime value?
• Market Type: revenue curves
• Operating Costs: basic operating costs of the business?
• Channel: Channel margin, promotion, shelf-space charges?
• Revenue Streams: average selling price, # of customers/year, achievable revenue?
• Burn Rate: per month? When will the company run out of cash?

Life Science Intellectual Property Example
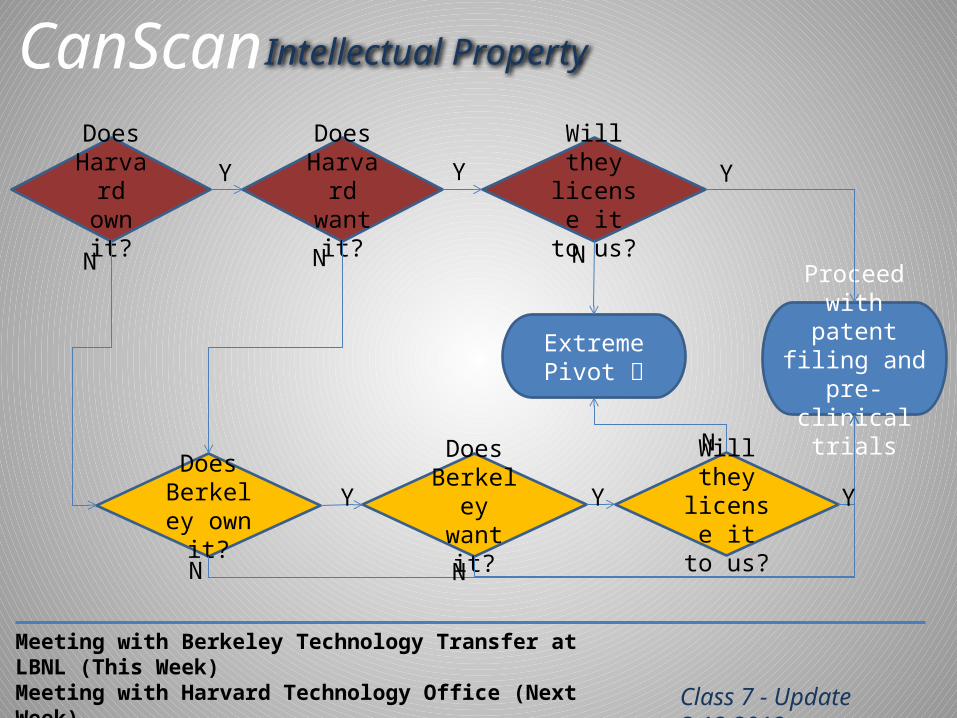
CanScan Intellectual Property
Does Harvard own it?
Does Harvard want it?
Does Berkeley want it?
Does Berkeley own it?
Will they license it
to us?
Will they license it
to us?
Proceed with patent filing
and pre-clinical trials
Extreme Pivot
Y
N
Y
N N
N
Y
Y
N N
Y Y
Class 7 - Update 3.12.2012
Meeting with Berkeley Technology Transfer at LBNL (This Week)Meeting with Harvard Technology Office (Next Week)

Robotic AgricultureResource, Activities Example

We’ve hit our first milestones
Jun 2011 Dec 2011 Jun 2012Mar 2013First unit
Seed Round
Confidential
Technology Track
Customer Discovery Track
Finance Track
Post-processed Image recognition
Prototype First unit
Series A
Customer trial and customer order
Real-time image recognition
Select 1st target crop
Friends and family round
Applied for grants
Testing agreement with top producer
$125 KF&F
$800 KSeed
$3-5 MSeries A

Medical DeviceResource, Activities & Cost Example

$10M
$15M
2012
Series A $3.5 MM
Cash
Rese
rve
Clin
ical
Mile
stones
$5M
Initialize
Desi
gn
Mile
stones
Reg
ula
tory
/ IP
M
ilest
ones
Q1 Q2 Q3 Q4
2013Q1 Q2 Q3 Q4
2014Q1 Q2 Q3 Q4 Q1 Q2 Q3 Q4 Q1 Q2 Q3 Q4
2015 2016
Series B $9 MM
System
2017Q1 Q2Q1 Q2 Q3 Q4
2018Q3
Launch
Series C $30.5 MM
$30M
$20M
Regulatory / Clinical
Series D $35
MM
M&A / IPO $50 MM
$40M
380 12/4/2009
Proof of Concep
t
Pilot Studie
s
IC and Processing Patents
Marketable Product
Provisional Patent
Beta-Versio
n Testin
g
Application and
System Patents
IRB / IDE
Clinical Results
Second Release
Initial Product Launch
Specific Codes (Cat. I CPT / APC)
Non-Specific Codes
1st Release
Test
2nd Release Test
Publication
Post-Market Clinical Studies
Beta Prototype
US Interim Trials
FDA – Class II – 510 (k) with Clinical Trials
Publication
Financial / Operations Timeline
Cat III
CPT
US Pivotal Clinical Trials
Laboratory
Prototype
Technology
Licensing
MammOpticsMammOptics
Financial timeline
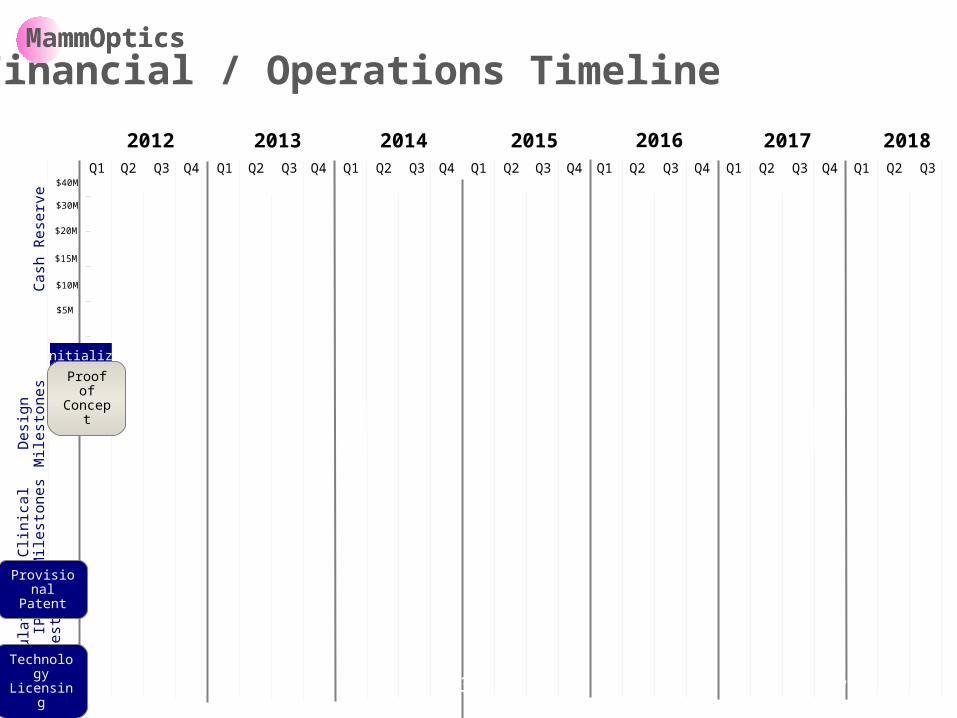
$10M
$15M
2012
Cash
Rese
rve
Clin
ical
Mile
stones
$5M
Initialize
Desi
gn
Mile
stones
Reg
ula
tory
/ IP
M
ilest
ones
Q1 Q2 Q3 Q4
2013Q1 Q2 Q3 Q4
2014Q1 Q2 Q3 Q4 Q1 Q2 Q3 Q4 Q1 Q2 Q3 Q4
2015 2016 2017Q1 Q2Q1 Q2 Q3 Q4
2018Q3
$30M
$20M
$40M
381 12/4/2009
Proof of Concep
t
Provisional Patent
Financial / Operations Timeline
Technology
Licensing
MammOpticsMammOptics

$10M
$15M
2012
Series A $3.5 MM
Cash
Rese
rve
Clin
ical
Mile
stones
$5M
Initialize
Desi
gn
Mile
stones
Reg
ula
tory
/ IP
M
ilest
ones
Q1 Q2 Q3 Q4
2013Q1 Q2 Q3 Q4
2014Q1 Q2 Q3 Q4 Q1 Q2 Q3 Q4 Q1 Q2 Q3 Q4
2015 2016
System
2017Q1 Q2Q1 Q2 Q3 Q4
2018Q3
$30M
$20M
$40M
382 12/4/2009
Proof of Concep
t
Provisional Patent
Beta-Versio
n Testin
g
Laboratory
Prototype
Beta Prototype
Technology
Licensing
Financial / Operations Timeline
Pilot Studie
s
MammOpticsMammOptics

$10M
$15M
2012
Series A $3.5 MM
Cash
Rese
rve
Clin
ical
Mile
stones
$5M
Desi
gn
Mile
stones
Reg
ula
tory
/ IP
M
ilest
ones
Q1 Q2 Q3 Q4
2013Q1 Q2 Q3 Q4
2014Q1 Q2 Q3 Q4 Q1 Q2 Q3 Q4 Q1 Q2 Q3 Q4
2015 2016
Series B $9 MM
System
2017Q1 Q2Q1 Q2 Q3 Q4
2018Q3
$30M
$20M
$40M
383 12/4/2009
IC and Processing Patents
Marketable Product
Beta-Versio
n Testin
g
Application and
System Patents
IRB / IDE
Beta Prototype
Financial / Operations Timeline
Pilot Studie
s
Regulatory / Clinical
Laboratory
Prototype
MammOpticsMammOptics
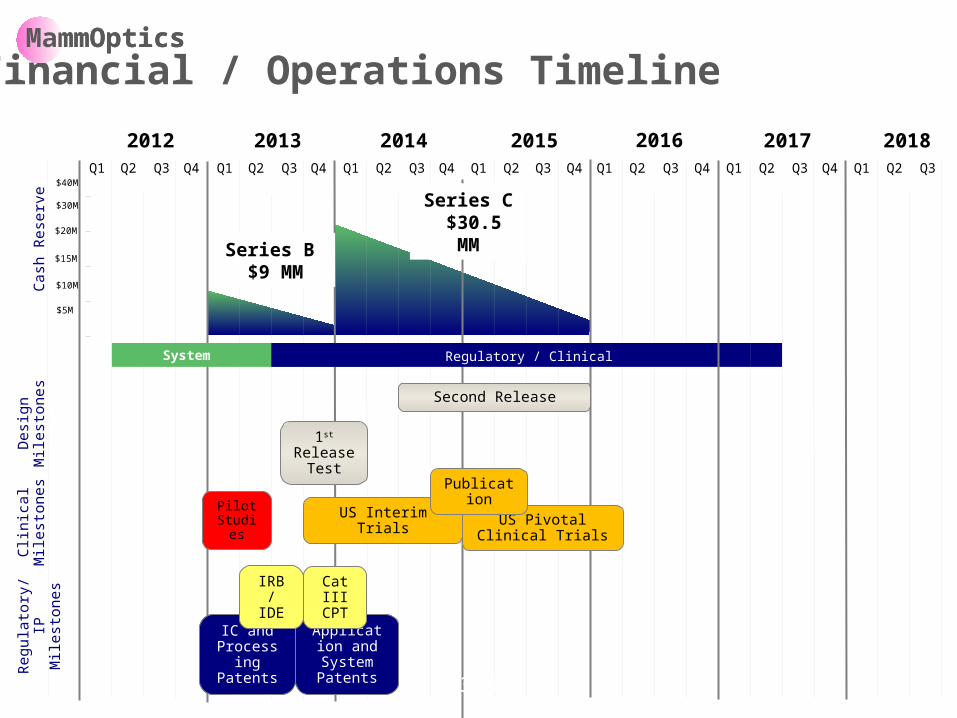
$10M
$15M
2012
Cash
Rese
rve
Clin
ical
Mile
stones
$5M
Desi
gn
Mile
stones
Reg
ula
tory
/ IP
M
ilest
ones
Q1 Q2 Q3 Q4
2013Q1 Q2 Q3 Q4
2014Q1 Q2 Q3 Q4 Q1 Q2 Q3 Q4 Q1 Q2 Q3 Q4
2015 2016
Series B $9 MM
System
2017Q1 Q2Q1 Q2 Q3 Q4
2018Q3
Series C $30.5 MM
$30M
$20M
Regulatory / Clinical
$40M
384
IC and Processing Patents
Application and
System Patents
IRB / IDE
Cat III
CPT
Second Release
1st Release
Test
US Interim Trials US Pivotal Clinical Trials
Publication
Financial / Operations Timeline
Pilot Studie
s
MammOpticsMammOptics

$10M
$15M
2012
Cash
Rese
rve
Clin
ical
Mile
stones
$5M
Desi
gn
Mile
stones
Reg
ula
tory
/ IP
M
ilest
ones
Q1 Q2 Q3 Q4
2013Q1 Q2 Q3 Q4
2014Q1 Q2 Q3 Q4 Q1 Q2 Q3 Q4 Q1 Q2 Q3 Q4
2015 2016 2017Q1 Q2Q1 Q2 Q3 Q4
2018Q3
Launch
Series C $30.5 MM
$30M
$20M
Regulatory / Clinical
Series D $35
MM
$40M
385 12/4/2009
Clinical Results
Second Release
Initial Product Launch
Non-Specific Codes
2nd Release Test
Publication
US Interim Trials
FDA – Class II – 510 (k) with Clinical Trials
Publication
Financial / Operations Timeline
US Pivotal Clinical Trials
MammOpticsMammOptics
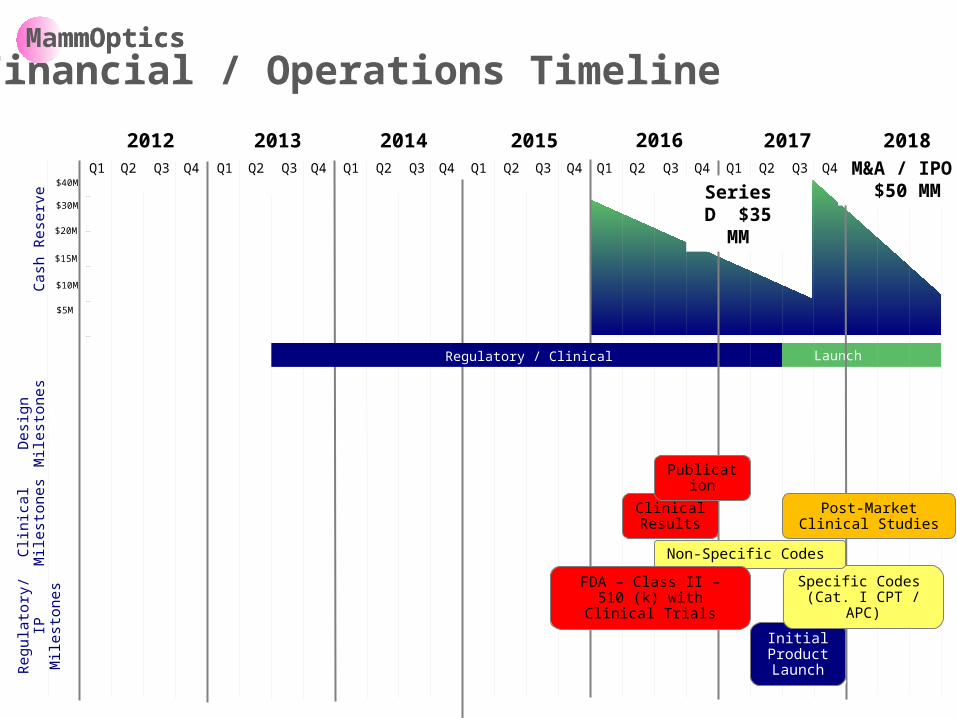
$10M
$15M
2012
Cash
Rese
rve
Clin
ical
Mile
stones
$5M
Desi
gn
Mile
stones
Reg
ula
tory
/ IP
M
ilest
ones
Q1 Q2 Q3 Q4
2013Q1 Q2 Q3 Q4
2014Q1 Q2 Q3 Q4 Q1 Q2 Q3 Q4 Q1 Q2 Q3 Q4
2015 2016 2017Q1 Q2Q1 Q2 Q3 Q4
2018Q3
Launch
$30M
$20M
Regulatory / Clinical
Series D $35
MM
M&A / IPO $50 MM
$40M
12/4/2009
Clinical Results
Initial Product Launch
Specific Codes (Cat. I CPT / APC)
Non-Specific Codes
Publication
Post-Market Clinical Studies
FDA – Class II – 510 (k) with Clinical Trials
Financial / Operations TimelineMammOpticsMammOptics
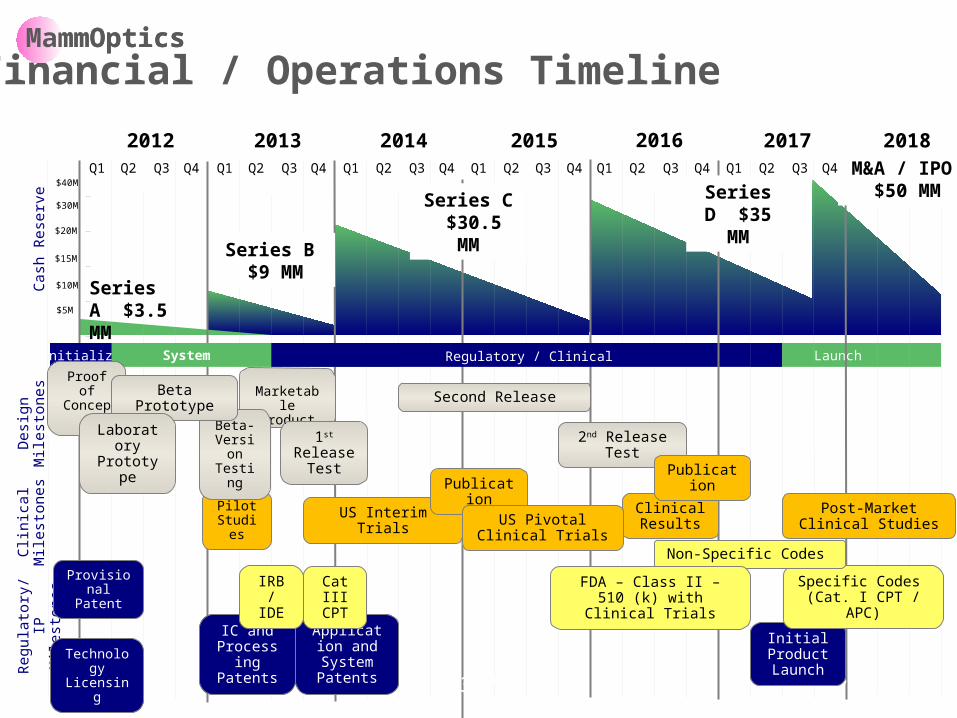
$10M
$15M
2012
Series A $3.5 MM
Cash
Rese
rve
Clin
ical
Mile
stones
$5M
Initialize
Desi
gn
Mile
stones
Reg
ula
tory
/ IP
M
ilest
ones
Q1 Q2 Q3 Q4
2013Q1 Q2 Q3 Q4
2014Q1 Q2 Q3 Q4 Q1 Q2 Q3 Q4 Q1 Q2 Q3 Q4
2015 2016
Series B $9 MM
System
2017Q1 Q2Q1 Q2 Q3 Q4
2018Q3
Launch
Series C $30.5 MM
$30M
$20M
Regulatory / Clinical
Series D $35
MM
M&A / IPO $50 MM
$40M
387 12/4/2009
Proof of Concep
t
Pilot Studie
s
IC and Processing Patents
Marketable Product
Provisional Patent
Beta-Versio
n Testin
g
Application and
System Patents
IRB / IDE
Clinical Results
Second Release
Initial Product Launch
Specific Codes (Cat. I CPT / APC)
Non-Specific Codes
1st Release
Test
2nd Release Test
Publication
Post-Market Clinical Studies
Beta Prototype
US Interim Trials
FDA – Class II – 510 (k) with Clinical Trials
Publication
Financial / Operations Timeline
Cat III
CPT
US Pivotal Clinical Trials
Laboratory
Prototype
Technology
Licensing
MammOpticsMammOptics

AppleResource, Activities & Cost Example
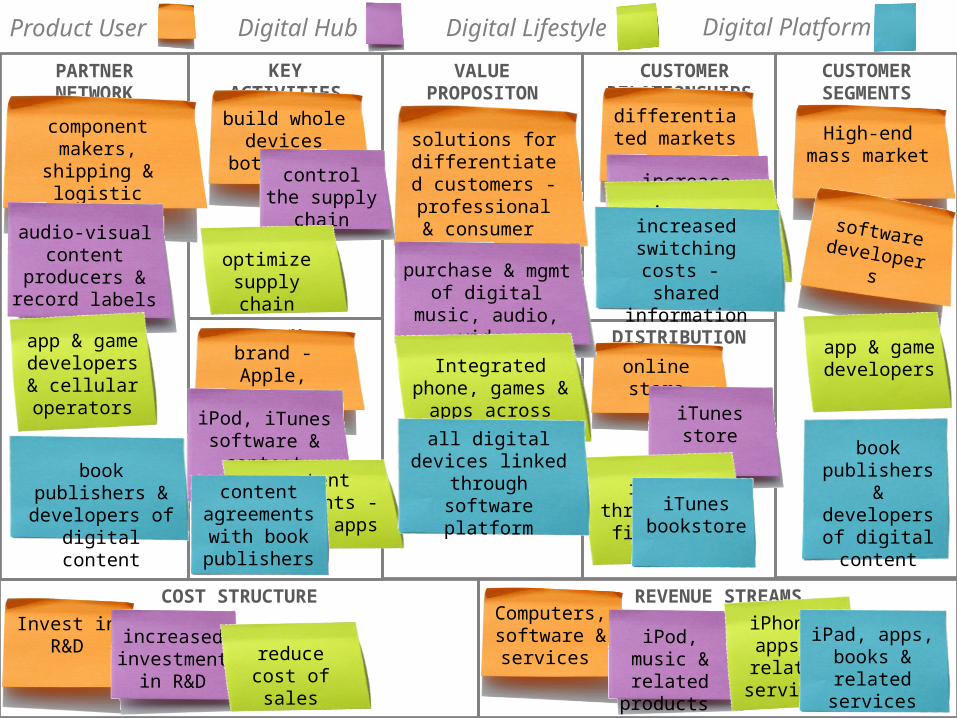
KEYRESOURCES
VALUEPROPOSITON
DISTRIBUTION CHANNELS
CUSTOMER RELATIONSHIPS
CUSTOMERSEGMENTS
REVENUE STREAMSCOST STRUCTURE
KEYACTIVITIES
PARTNERNETWORK
Product User Digital Hub Digital Lifestyle Digital Platform
Invest in R&D
solutions for differentiated customers -
professional & consumer
High-end mass market
software developers
online store
brand - Apple,
PowerMac, iMac
component makers, shipping
& logistic suppliers
build whole devices both
h/w & s/w
differentiated markets
Computers, software & services
audio-visual content
producers & record labels
iPod, iTunes software &
content agreements
purchase & mgmt of digital music,
audio, video
increase switching costs
iTunes store
control the supply chain
increased investment
in R&D
iPod, music & related products
Integrated phone, games &
apps across devices
reduce cost of sales
increase switching costs -
integrationoptimize supply chain
content agreements - games & apps
iTunes through wi-fi
access
app & game developers &
cellular operators
app & game developers
iPhone, apps & related services
book publishers & developers of digital content
content agreements with book publishers
all digital devices linked through
software platform
increased switching costs -
shared information
iTunes bookstore
iPad, apps, books & related services
book publishers & developers of digital content
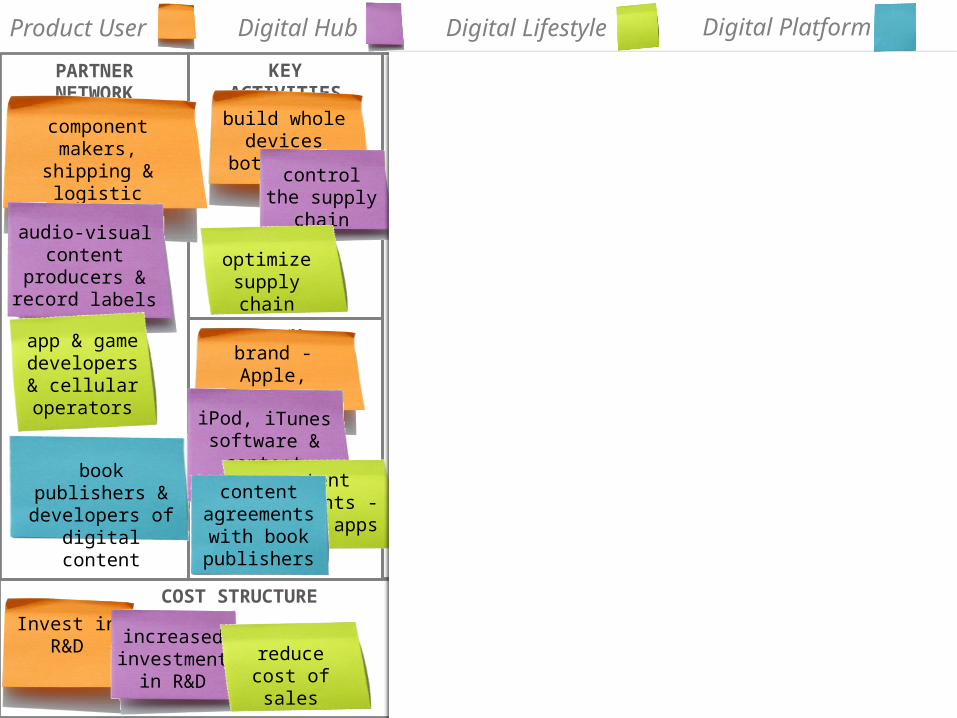

KEYRESOURCES
VALUEPROPOSITON
DISTRIBUTION CHANNELS
CUSTOMER RELATIONSHIPS
CUSTOMERSEGMENTS
REVENUE STREAMSCOST STRUCTURE
KEYACTIVITIES
PARTNERNETWORK
solutions for differentiated customers -
professional & consumer
High-end mass market
software developers
Wholesalers, retailers, re-
sellers
online store
brand - Apple,
PowerMac, iMac
innovative designers
IP & patents & agreement
s
component makers
Shipping & logistic
suppliers
build whole devices both
h/w & s/w
software developers
differentiated markets
Invest in R&D
Computers, software & services
Product User
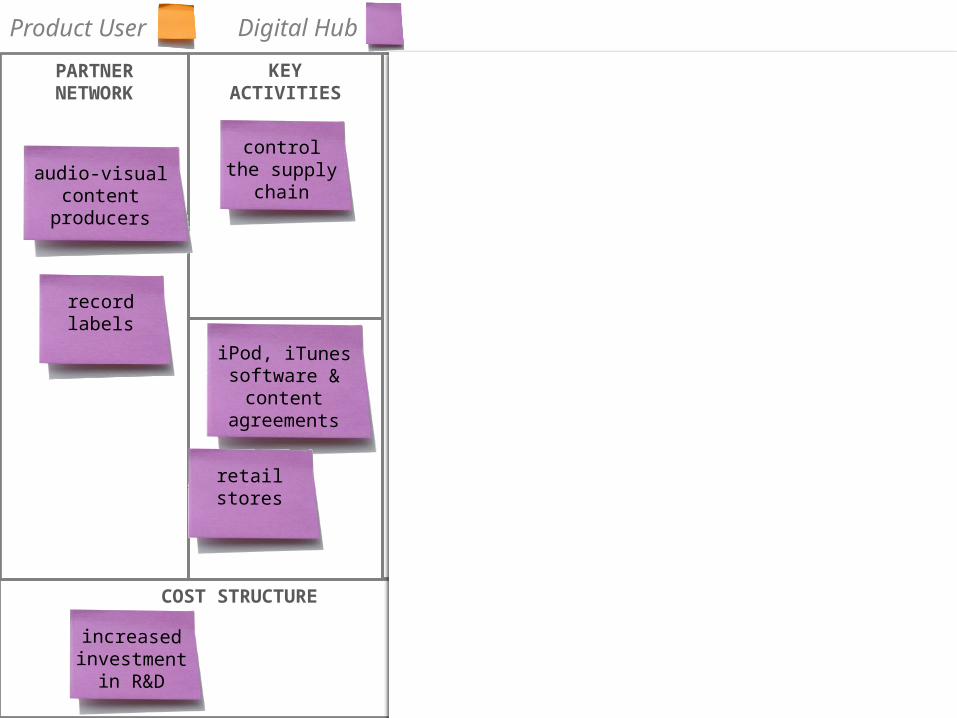
KEYRESOURCES
VALUEPROPOSITON
DISTRIBUTION CHANNELS
CUSTOMER RELATIONSHIPS
CUSTOMERSEGMENTS
REVENUE STREAMSCOST STRUCTURE
KEYACTIVITIES
PARTNERNETWORK
audio-visual content
producers
recordlabels
iPod, iTunes software &
content agreements
retail stores
purchase & mgmt of digital music, audio,
video
integration of information
across devices
control buying
experience
increase switching
costs
iTunes store
chain of owned stores
control the supply chain
increased investment
in R&D
iPod, music & related products
Product User Digital Hub
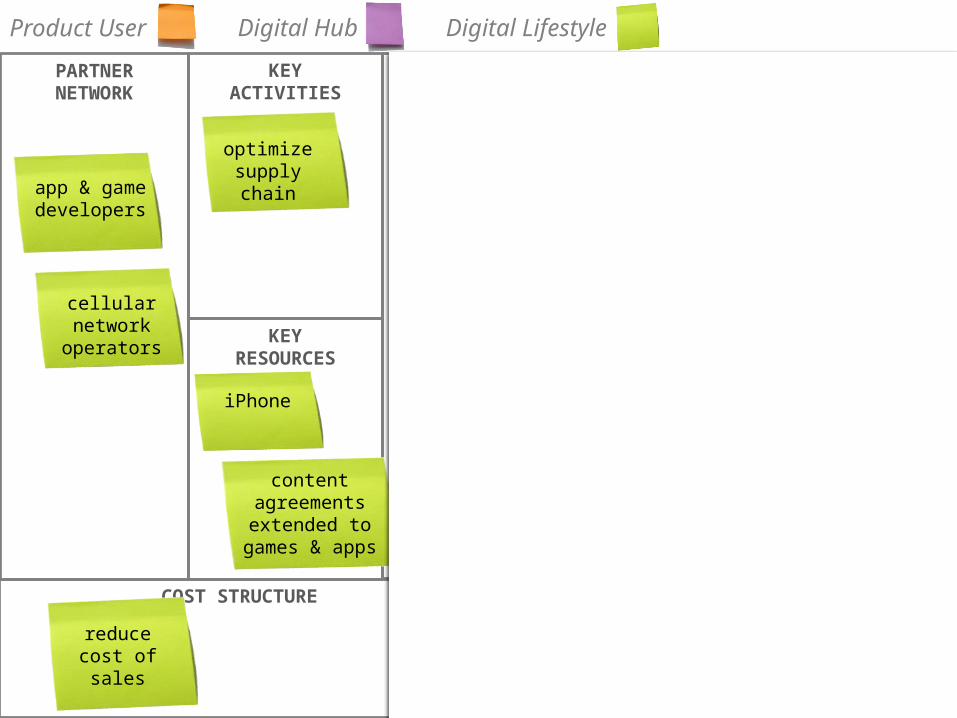
KEYRESOURCES
VALUEPROPOSITON
DISTRIBUTION CHANNELS
CUSTOMER RELATIONSHIPS
CUSTOMERSEGMENTS
REVENUE STREAMSCOST STRUCTURE
KEYACTIVITIES
PARTNERNETWORK
games & apps across devices
easy access & purchase
through iTunes
reduce cost of sales
increase switching costs -
integration
specialized services in retail stores
optimize supply chain
integrated phone
iPhone
content agreements extended to
games & apps
iTunes through wi-fi
access
app & game developers
app & game developers
cellular network
operators
iPhone, apps & related services
Product User Digital Hub Digital Lifestyle

KEYRESOURCES
VALUEPROPOSITON
DISTRIBUTION CHANNELS
CUSTOMER RELATIONSHIPS
CUSTOMERSEGMENTS
REVENUE STREAMSCOST STRUCTURE
KEYACTIVITIES
PARTNERNETWORK
Product User Digital Hub Digital Lifestyle
content agreements with book publishers
Digital Platform
all digital devices linked through
software platform
Premium re-sellers
book publishers
3rd party developers of
digital content
developers of
digital content
book publishers
premium resellers
control customer
experience in resellers’ stores
increased switching costs -
shared information
iPad & related services
iTunes bookstore
iPad, apps, books & related services

The Customer Development Manifesto
15 Rules to Live By

A Startup is:A temporary organization
designed to search for a repeatable and scalable business model

1. There are No Facts Inside Your Building

2. Pair Customer Development with Agile Development

3. Failure is an Integral Part of Search

4. Continuous Iteration and Pivots

5. No Business Plan Survives First Contact with Customers

6. Validate Hypotheses with Experiments
7. Market Type Changes Everything
8. Startup Metrics are Different

9. Fast and Fearless Decision-Making
9. Cycle Time, Speed and Tempo

10. Startup Job Titles Are Very Different from a Large Company’s

11. Preserve Cash While Searching
12. Spend When It’s a Repeatable Model
13. Communicate and Share Learning

14. Startups demand Comfort with Chaos, Uncertainty and Change

15. It’s Not A Job, It’s All About Passion
