delft university of technology financial instruments and ... · financial instruments and...
TRANSCRIPT

Delft University of Technology
Financial Instruments and Territorial Cohesion - Applied Research -Final Report
Wishlade, Fiona; Michie, Rona; Moodie, John; Penje, Oskar; Norlen, Gustaf; Korthals Altes, Willem;Assirelli Pandolfi, Chiara ; de la Fuente Abajo, Ana
Publication date2019Document VersionFinal published version
Citation (APA) Wishlade, F., Michie, R., Moodie, J., Penje, O., Norlen, G., Korthals Altes, W., ... de la Fuente Abajo, A.(2019). Financial Instruments and Territorial Cohesion - Applied Research -Final Report. Luxembourg:ESPON.
Important noteTo cite this publication, please use the final published version (if applicable).Please check the document version above.
CopyrightOther than for strictly personal use, it is not permitted to download, forward or distribute the text or part of it, without the consentof the author(s) and/or copyright holder(s), unless the work is under an open content license such as Creative Commons.
Takedown policyPlease contact us and provide details if you believe this document breaches copyrights.We will remove access to the work immediately and investigate your claim.
This work is downloaded from Delft University of Technology.For technical reasons the number of authors shown on this cover page is limited to a maximum of 10.

Financial Instruments
and Territorial Cohesion
Applied Research
Final Report
30/08/2019

This applied research activity is conducted within the framework of the ESPON 2020 Cooperation
Programme.
The ESPON EGTC is the Single Beneficiary of the ESPON 2020 Cooperation Programme. The Single
Operation within the programme is implemented by the ESPON EGTC and co-financed by the European
Regional Development Fund, the EU Member States and the Partner States, Iceland, Liechtenstein,
Norway and Switzerland.
This delivery does not necessarily reflect the opinion of the members of the ESPON 2020 Monitoring
Committee.
Authors
Fiona Wishlade, Rona Michie, European Policies Research Centre (UK)
John Moodie, Oskar Penje, Gustaf Norlen, Nordregio (Sweden)
Willem Korthals Altes, TU Delft (Netherlands)
Chiara Assirelli Pandolfi, Ana de la Fuente Abajo, Red2Red Consultadores (Spain)
Advisory Group
Project Support Team: Cristina Wallez Cuevas, General Commission for Territorial Equality, France;
Adriana May, Lombardia Region, Italy; Joerg Lackenbauer, European Commission
ESPON EGTC: Zintis Hermansons (Project expert) and Akos Szabo (Financial expert).
Information on ESPON and its projects can be found on www.espon.eu.
The web site provides the possibility to download and examine the most recent documents produced by
finalised and ongoing ESPON projects.
© ESPON, 2019
Printing, reproduction or quotation is authorised provided the source is acknowledged and a copy is
forwarded to the ESPON EGTC in Luxembourg.
Contact: [email protected]
ISBN 978-99959-55-97-7

Financial Instruments and Territorial Cohesion

ESPON 2020 i
Table of contents
List of Maps ............................................................................................................................... iii
List of Figures ............................................................................................................................ iii
List of Tables ............................................................................................................................. iv
List of Boxes ............................................................................................................................... v
Executive summary .................................................................................................................. vii
1 Introduction ........................................................................................................................ 1
1.1 The rationale and aims of financial instruments ........................................................ 1
1.2 Financial instruments are complex and diverse ........................................................ 2
1.3 The territorial dimension to financial instruments...................................................... 2
1.4 Scope of the study .................................................................................................... 3
1.5 Structure of the report ............................................................................................... 4
2 Objectives of the study and approach to the research questions ..................................... 5
2.1 Research questions .................................................................................................. 5
2.2 Task 1: currents debate on Cohesion policy and ESIF financial instruments ........... 6
2.3 Task 2: territorial analysis and mapping of the regional distribution of ESIF financial instruments ................................................................................................................ 7
2.3.1 An overview and assessment of existing data. ................................................ 7
2.3.2 Data collection. ................................................................................................ 8
2.3.3 Data analysis and mapping .............................................................................. 9
2.4 Task 3: A methodology for measuring added value ................................................. 9
2.4.1 Development of a regional typology .............................................................. 10
2.4.2 A framework for analysis ................................................................................ 14
2.5 Task 4: The added value of financial instruments at territorial level ....................... 15
2.6 Task 5: Case studies ............................................................................................... 16
2.7 Task 6: Policy proposals ......................................................................................... 17
3 Financial instruments: definitions and rationales ............................................................ 18
3.1 What are financial instruments? .............................................................................. 18
3.2 The rationale for intervention and the role of financial instruments ........................ 19
3.3 The potential benefits of financial instruments over grants ..................................... 21
4 The territorial dimension of financial instruments ............................................................ 24
4.1 The importance of spatial considerations ............................................................... 24
4.2 The geography of finance ....................................................................................... 25
4.3 Quality of government and administrative capacity ................................................ 27
4.4 Financial instruments and territorial disadvantage ................................................. 28
5 Financial instruments in Cohesion policy: scale and governance ................................... 31
5.1 Definitions and structures of financial instruments in Cohesion policy ................... 31
5.2 Scale of financial instruments in Cohesion policy ................................................... 33
5.3 The governance arrangements for financial instruments in Cohesion policy ......... 35
5.4 Comparative perspectives? ..................................................................................... 38
6 The territorial distribution of FIs ....................................................................................... 40
6.1 Introduction.............................................................................................................. 40
6.2 The scope and governance of Operational Programmes offering financial instruments .............................................................................................................. 41

ESPON 2020 ii
6.3 The regional distribution of financial instrument investment ................................... 45
6.3.1 How does expenditure on financial instruments compare with grants? ........ 46
6.3.2 How important are FIs in real terms? ............................................................. 48
6.3.3 How are financial instruments targeted? ....................................................... 49
6.3.4 Which financial products are used where? .................................................... 53
6.3.5 Types of final recipients ................................................................................. 55
6.3.6 Identifying regions with high and low uptake of financial instruments ........... 58
7 Added value and impact at territorial level of ESIF financial instruments ....................... 60
7.1 Added value and impact: definitions ....................................................................... 61
7.2 Uptake and choice of financial instruments ............................................................ 62
7.2.1 Revisiting the typology of regions .................................................................. 62
7.2.2 Use of Cohesion policy FIs across the regional types ................................... 65
7.2.3 Defining high and low uptake of FIs ............................................................... 69
7.3 High and low uptake of FIs in the different region types ......................................... 69
7.3.1 Convergence/Phasing-Out regions ................................................................ 71
7.3.2 Regional Competitiveness and Employment/Phasing-In regions .................. 73
7.4 Geography of fund managers ................................................................................. 75
7.5 Management costs and fees ................................................................................... 76
7.6 Leverage effect ....................................................................................................... 76
7.6.1 The Commission’s definition of leverage and the impact of the co-financing rate ................................................................................................................. 76
7.6.2 Data on the leverage generated by guarantees ............................................ 77
7.7 Legacy ..................................................................................................................... 78
7.8 Impact ...................................................................................................................... 80
7.8.1 Final recipients ............................................................................................... 80
7.8.2 Jobs created .................................................................................................. 81
7.9 Analysing added value and impact based on the regional typology ...................... 81
7.9.1 Convergence and Phasing-Out areas ........................................................... 81
7.9.2 RCE and Phasing In areas ............................................................................ 83
7.10 Summary ................................................................................................................. 85
8 Financial instruments and territorial cohesion: insights from practice ............................. 88
9 Policy proposals for the debate on financial instruments in EU Cohesion policy post-2020 ............................................................................................................................... 104
10 Bibliography and References ........................................................................................ 112

ESPON 2020 iii
List of Maps
Map 0-1: ‘Uptake’ of financial instruments – investment in final recipients (EU amounts) ......... x
Map 2-1: Convergence and Phasing Out (C+PO) and Regional Competitiveness and
Employment and Phasing-In (RCE+PI) ................................................................................... 12
Map 2-2: Quality of government, financial system and urban-rural classification ................... 13
Map 5-1: Operational Programmes offering financial instruments at NUTS 2 ........................ 38
Map 6-1: National Operational Programmes offering financial instruments (by NUTS scope) 44
Map 6-2: Regional Operational Programmes offering financial instruments (by NUTS scope)
................................................................................................................................................. 45
Map 6-3: Financial instruments in total ERDF and ESF spend ............................................... 47
Map 6-4: Financial instruments invested in final recipients as a percentage of regional GDP
(2007-13) (EU amounts) .......................................................................................................... 49
Map 6-5: Investment in final recipients – financial instruments for enterprises (EU amounts) 51
Map 6-6: Investment in final recipients: financial instruments for urban and energy-related
investments (EU amounts) ...................................................................................................... 53
Map 6-7: Dominant financial product types by amount invested in final recipients (EU
amounts) .................................................................................................................................. 55
Map 6-8: High and low uptake of financial instruments (EU amounts) ................................... 59
Map 7-1: Regional typology: quality of government, financial system and urban-rural
classification ............................................................................................................................ 64
Map 7-2: Convergence / Phasing Out and Regional Competitiveness & Employment /
Phasing-In Regions ................................................................................................................. 65
Map 7-3: Regional typology and level of uptake of financial instruments ............................... 70
Map 7-4: Legacy as a proportion of investment in final recipients (EU amounts) ................... 80
Map 8-1: Case study areas ..................................................................................................... 90
Map 8-2: GHS population grid 2015 and Case Study areas ................................................... 91
Map 8-3: Urban-rural typology at NUTS 3 and Case study areas ........................................... 92
List of Figures
Figure 2-1: Project tasks and relationships ............................................................................... 6
Figure 2-2: Model regions for the analysis of financial instruments ........................................ 14

ESPON 2020 iv
Figure 2-3: Financial instruments and territorial cohesion: a framework for analysis ............. 16
Figure 3-1: The potential for financial instruments in ESI Fund programmes ......................... 20
Figure 3-2: Target recipients, market imperfections and rationales for FI............................... 21
Figure 5-1: Financial flows under grants and financial instruments ........................................ 33
Figure 5-2: The relative importance of Cohesion policy FIs, 2007-13 (EU amounts only) ...... 35
Figure 6-1: Amounts disbursed to final recipients (€m) and share of total at closure ............. 50
Figure 7-1: Share of FI uptake among Convergence Regions ................................................ 73
Figure 7-2: Legacy as % of investment in final recipients (SF amounts) by eligibility and QoG
................................................................................................................................................. 79
Figure 7-3: Reported jobs created through financial instruments, by Member State (2007-13)
................................................................................................................................................. 81
List of Tables
Table 2-1: Summary of survey responses ................................................................................. 8
Table 2-2: Availability of data at NUTS 2 and use of proxies .................................................... 9
Table 2-3: Factors affecting the uptake and implementation of financial instruments ............ 11
Table 2-4: Number of NUTS 2 regions in each regional typology ........................................... 11
Table 4-1: Financial market systems and SME financing ....................................................... 26
Table 5-1: Number of financial instruments (funding agreements) – EU28 (2007-13) ........... 32
Table 5-2: Measuring the significance of OP contributions to FIs (EU amounts) ................... 34
Table 5-3: National governance of ESIF FIs only (2007-13) ................................................... 36
Table 5-4: Regional governance of ESIF FIs only (2007-13) .................................................. 36
Table 5-5: National and subnational governance of ESIF FIs (2007-13) ................................ 37
Table 6-1: Geographical scope of Operational Programmes offering financial instruments (no.
of OPs) ..................................................................................................................................... 42
Table 6-2: National and regional OPs depending on geographical coverage (EU amounts, €
million) ..................................................................................................................................... 43
Table 6-3: OP contributions reaching final recipients and remaining in funds 2007-13 (€m at
closure) .................................................................................................................................... 46
Table 6-4: Use of financial instruments under the European Social Fund 2007-13 ................ 48
Table 6-5: FI investments in urban development and energy projects, EU amounts (€m) 2007-
13 ............................................................................................................................................. 52
ESPON 2020 v
Table 6-6: Number and scale of financial products offered by policy objective (2007-13) ...... 54
Table 6-7: data availability on number of final recipients by number of funds and investment in
final recipients .......................................................................................................................... 56
Table 6-8: Target final recipients by type – support for enterprises (Article 44a) ................... 57
Table 6-9: Target final recipients by type – support for urban and energy
efficiency/renewables projects (Article 44b/c) ......................................................................... 58
Table 7-1: Regional typology: Number of NUTS 2 regions in each regional type ................... 63
Table 7-2: NUTS 2 regions in EU and regional typology (number and % for each element of
typology) .................................................................................................................................. 66
Table 7-3: Regional typology: regional types using Cohesion policy FIs (2007-13) ............... 66
Table 7-4: Allocation of Financial Instruments and Structural Funds by element of typology
(NUTS 2) .................................................................................................................................. 67
Table 7-5:, Uptake of financial instruments by national financial context and urban/rural
classification ............................................................................................................................ 67
Table 7-6: Share of FI product type by Quality of Government ............................................... 68
Table 7-7: High and low financial instrument uptake regions .................................................. 69
Table 7-8: Convergence and Phasing Out high and low FI uptake region types .................... 72
Table 7-9: RCE and Phasing In high and low FI uptake region types ..................................... 74
Table 7-10: Use of guarantees and loan guarantee ratio by eligibility and urban/rural
classification ............................................................................................................................ 78
Table 7-11: Added value and impact for C+PO regions .......................................................... 82
Table 7-12: Added value and impact for RCE+PI * ................................................................. 84
Table 8-1: Typology of case study regions .............................................................................. 92
Table 8-2: Overview of case study financial instruments ........................................................ 93
Table 8-3: Investments declared as ineligible ......................................................................... 96
List of Boxes
Box 5-1: What is a financial instrument in Commission reporting? ......................................... 32
Box 8-1: Two examples of the importance of the Financial Intermediary role : the case of
Mellersta Norrland region and Norway. ................................................................................... 99

ESPON 2020 vi
Abbreviations
CF Cohesion Fund
COSME EU programme for the Competitiveness of Enterprises and Small and Medium-sized Enterprises
COCOF Committee of the Coordination of Funds
CPR Common Provisions Regulation
CS Case Study
EAPB European Association of Public Banks
EAFRD European Agricultural Fund for Rural Development
EAGGF European Agricultural Guidance and Guarantee Fund
EC European Commission
ECA European Court of Auditors
EFSI European Fund for Strategic Investments
EGTC European Grouping of Territorial Cooperation
ERDF European Regional Development Fund
ESF European Social Fund
ESIF European Structural and Investment Funds
ESPON European Territorial Observatory Network
EU European Union
EWRC European Week of Regions and Cities
FI Financial Instruments
FIR Final Implementation Report
FTE Full Time Equivalent
JEREMIE Joint European resources for Micro to Medium Enterprises
JESSICA Joint European Support for Sustainable Investment in City Areas
LAU Local Administrative Unit
MA Managing Authority
MOP Multiregional Operational Programme
NOP National Operational Programme
NPB National Promotional Bank
NUTS Nomenclature of Territorial Units for Statistics
OP Operational Programme
PMC Programme Monitoring Committee
PST Project Support Team
QoG Quality of Government
RCE Regional Competitiveness and Employment
ROP Regional Operational Programme
SF Structural Funds
SFC System for Fund Management in the European Union
SME Small and Medium Sized Enterprises
SWOT Strengths, Weaknesses, Opportunities, Threats
TO Thematic Objective

ESPON 2020 vii
Executive summary
Background
There has been a significant and sustained increase in the use of repayable financial
instruments (FIs) in Cohesion policy over the 2007-13 and 2014-20 programme periods.
Repayable instruments are relatively new tools in the European Structural and Investment
Funds (ESIF), particularly under the ESF, EAFRD and the Cohesion Fund. What does the
increasing shift to using financial instruments imply for territorial cohesion? What evidence is
there on the effectiveness of using financial instruments as a complement to grants, in terms
of added value for territorial development?
The objective of this ESPON study is to provide a territorial analysis of the impacts of ESIF
financial instruments in 2007-13 (and where data allows, 2014-20). To assess the evidence
and undertake the analysis, the study has involved a literature review, an extensive data
collection and regionalisation exercise, data analysis and mapping, development of a
methodology for measuring the added value of financial instruments and the analysis of the
territorial added value and impact of FIs. Five case studies provide an in-depth picture of
selected financial instruments implemented in regions in Italy, Spain, Poland, Sweden and
Norway.
Definitions and rationales
Financial instruments have had a high profile in Cohesion policy in the 2007-13 and 2014-20
programming periods. However, they remain a comparatively small policy tool. For 2007-13,
the amount of Structural Funds committed to FIs at closure was just under €11.5 billion,
equivalent to about 3.7 percent of total commitments. Even if ambitions for 2014-20 are
realised, FIs would still account for less than six percent of total ESIF commitments.
Financial instruments comprise very diverse financial products - loans, guarantees and equity
– which are implemented in different ways. These products have many variants and have little
in common with one another, save the principle that the capital is repayable (unlike grants).
FIs are used to address a range of different geographies and policy targets. In 2007-13, the
main policy targets addressed using ESIF financial instruments were enterprise support,
urban development projects and energy efficiency/renewable energy projects.
The main rationale for public intervention in economic development policy is to support
activities that the market will not undertake alone or at all. In this context, publically-funded
financial instruments are a niche policy tool which are only suitable in certain circumstances:
for a limited range of policy objectives; where they generate enough revenue or savings to
repay the capital advanced, and where commercial funding would not cover any or all of the
cost.

ESPON 2020 viii
Evidence suggests that financial instruments can add value and complement grants in a
variety of ways:
• FIs generate a legacy that can be used in the region again; in some countries that have
used ESIFs FIs since 2000-06, this legacy is still being recycled.
• FIs can help generate better quality projects than grants alone, partly because the
project promoter or entrepreneur shares the risk.
• FIs can help address a ‘subsidy culture‘ among businesses. Reflecting this, a number of
countries are moving away from domestic grant support for SME development.
• They can provide an important signal to the private sector and sometime trigger private
sector investment that would not have happened otherwise.
• They can help develop regional capital markets and business angels.
• In the specific context of the crisis, FIs were valuable in sustaining investment in
businesses that could no longer access bank finance.
Main findings – territorial distribution of FIs
The increasing emphasis on financial instruments under the Structural Funds has a number of
implications for territorial cohesion. This partly arises because Cohesion policy now extends
to all regions, so Structural Fund financial instruments can be offered in all regions. At the
same time, many of the obstacles to development in more disadvantaged regions also make
the implementation of financial instruments more challenging. This includes lower quality of
government and lack of administrative capacity, as well as limited regional economic
dynamism and the absence of a thriving business ecosystem. The tendency for the banking
sector to become more centralised and more reliant on automated credit rating systems has
also had direct implications for the quality of local knowledge in the sector, as has a decline in
‘relationship’ banking, especially in rural areas.
Little has hitherto been known about the spatial incidence of FIs in Cohesion policy. Financial
instruments have more complex reporting and operational structures than grants, with
implications for data availability. Analysing the regional distribution of financial instrument
spend is complex because the geography and governance of FIs varies and regional data is
not always available.
Twenty-five Member States used Structural Fund financial instruments in 2007-13. Some €17
billion in OP contributions was committed to FIs (including €11.5 billion of Structural Funds),
of which €15.2 billion reached final recipients. Italy accounted for almost 30 percent of all
contributions to financial instruments in 2007-13. The use of financial instruments also varies
widely between countries (and within them) in terms of scale, product types, policy objectives
and governance.
On average, EU Member States committed €426 million (EU amounts) to financial
instruments in 2007-13, amounting to 3.4 percent of total Cohesion policy allocations, 0.013
percent of GDP and €23 per head. There are wide variations around these averages: Italy
ESPON 2020 ix
committed over €3 billion in Structural Funds to FIs, amounting to over 10 percent of its
Cohesion policy allocation; in Lithuania, FIs amounted to around 0.2 percent of GDP in 2007-
13.
This study has mapped the use of Structural Funds financial instruments in the 2007-13
period at a subnational level. This mapping shows substantial variations in the use of co-
financed financial instruments in different countries. Comparing FIs to grants, regions within
Italy, Belgium, Denmark the UK and Greece invested the largest shares of Structural
Funds in the form of FIs (but there are marked internal differences within these countries).
There are marked differences between regions in levels of investment in enterprises,
with, in general, much higher levels in the Convergence regions than elsewhere (not
including co-financing). Investment in urban development and energy projects accounts for
only a small proportion (about 15 percent) of overall FI expenditure, and is concentrated in a
few countries.
In terms of the use of different financial products, countries and regions differ in their choices,
with some offering all three types (loans, guarantees and equity). In general, there is a
dominance of loan finance in central and eastern Europe, the Baltic countries, Belgium
Denmark, Greece and Spain; a dominance of equity in Portugal and Sweden; a mix of
loans and equity in the UK; a mix of all three product types in Germany, and France;
and a mix of loans and guarantees in Italy.
In terms of FI ‘uptake’, there are ‘pockets’ of high absolute and high relative uptake in a
number of regions in Italy, the United Kingdom, Belgium, Greece, Bulgaria and
Germany (see Map 0-1). By contrast, the regions where there is low absolute and low
relative uptake are extensive, covering France, Sweden, Finland, much of Germany and
Denmark, as well as parts of Spain and Romania.

ESPON 2020 x
Map 0-1: ‘Uptake’ of financial instruments – investment in final recipients (EU amounts)
Source: authors. Note: The thresholds used to identify regions as high or low absolute and relative uptake are €20 million and 10 percent of OP expenditure, respectively
The geographies of finance and of administrative capacity are important to the understanding
of the territorial dimension of FIs - financial systems are inherently spatial, characterised by
complex institutional geographies that both reflect and influence their functioning. This, in
turn, affects the ability of entrepreneurs to access finance, typically to the disadvantage of
peripheral regional economies. This implies the need for policy explicitly to focus on regional
disparities in access to finance. However, under many FIs there is evidence to suggest that
pressure to spend within the lifecycle of the Operational Programme (governed by
ESIF rules) is a more important driver of spend than regional equity.
There are numerous models of governance for financial instruments, partly reflecting the
scope of the OPs that offer them, but also involving more complex arrangements than grants.
Financial instruments have been implemented through a wide variety of institutional structures
at national and subnational levels. In most countries, FIs are offered from a (sometimes
overlapping) mix of national, multiregional and regional OPs. In some regions, financial
instruments are offered within the region from up to five different OPs, often for similar
purposes.

ESPON 2020 xi
A key issue for the study has been to gain insights into the territorial distribution of national
and multiregional financial instruments. This is an important issue for territorial cohesion since
it raises the question of whether the incidence of expenditure on FIs is simply demand-led (by
the regional presence of SMEs) or whether FIs proactively seek to address regional
disparities in access to finance. The latter seems comparatively rare and may be partly
related to pressures to spend within the lifecycle of the Operational Programmes. In general,
it does appear that FIs are mainly demand-led. However, the governance structure for
financial instruments can help offset this tendency by, for example, seeking to ensure the
involvement of regional and local intermediaries.
Among ESIF managing authorities (MAs) that opted not to use FIs, the drivers for this
decision are not primarily territorial, but related to the content and scale of their
Operational Programmes and decisions about the relationship with domestic policy.
Conversely, other MAs justify the use of FIs on the basis of the limited budget and the
importance of generating a legacy. Other key factors in the decision are also not necessarily
territorial, and include perceived obstacles such as culture, lack of experience, complexity,
administrative capacity, lack of critical mass, domestic competition and a view that existing
commercial finance provision is adequate.
Main findings – added value and impact of FIs
The added value of financial instruments relates to criteria such as sustainability, efficiency,
quality, development of local financial markets and the impact on a subsidy culture. This is
different from impact, for which the two most commonly reported indicators are jobs created
and numbers of firms supported. However, it should be noted that within the existing data,
even some basic measures of spend are unreported or implausible and the level of
expenditure almost everywhere is too small to lend itself to econometric analyses of its
effects. Moreover, collection of quantified data related to the impact of financial instruments is
not consistent between managing authorities. Many MAs do provide data on job creation (this
is the most common impact indicator recorded), but definitions of this diverge even within
countries. Beyond job creation (where relevant), the vast majority of MAs do not collect any
data on FI implementation other than that which had to be reported to meet regulatory
requirements (and even this is often incomplete and inconsistent). In short there is no basis
on which to build a wide-ranging comparative assessment of the impacts and added
value of financial instruments.
To analyse differences in added value and impact for this study, a typology of European
NUTS 2 regions was developed on the basis of eligibility for Structural Funds, financial
systems, quality of government and urban/rural categorisation. This has found that FIs were
used in 28 different types of NUTS 2 region in 2007-13. The relative share of FIs in relation to
ERDF and ESF funding was the highest in urban regions with a market based financial
system, the lowest is in rural regions with a market based financial system. This strong
urban-rural gradient is not found in regions with bank-based or former-socialist financial

ESPON 2020 xii
systems. A total of 77 percent of all Structural Funds contributions to final recipients through
FIs was allocated in Convergence/Phasing Out regions. About 16 percent of all Structural
Funds invested in final recipients through FIs is accounted for by a single
Convergence region type – low QoG, bank-based financial system, urban – comprising
three regions (Campania, Sicilia and Attiki).
The geography of fund managers differs widely between EU Member States, varying between
highly centralised and more regionalised. There is a concentration of fund management in
urban areas. Legacy (the repayment of funds to be used again) is higher in regions
with a lower quality of government. This may be because financial markets work less well
in these regions and FIs are financing less risky project than in areas with high quality of
government. In areas with a low quality of government, more final recipients are reached by
the same investment, than in regions with a higher quality of government, largely owing to the
wider use of guarantees and loans.
Job creation data reflects national differences in reporting, and is often of doubtful quality and
thus is of limited value in assessing impact. At the same time, it is worth noting that job
creation is anyway often not a key objective of financial instruments so that while job creation
data is more widely available than other indicators, it does not really capture the impact that
FIs can have.
Regions which have a high uptake of FIs are more efficient in relation to management costs
and fees and have higher rates of return than low uptake regions. In most types of regions,
high uptake of FIs results in larger investments in relatively fewer final recipients.
Main findings - Insights from practice
The study provided insights from the operation of FIs in five case study areas: Lombardia,
Mellersta Norrland, Andalucía, Wielkopolskie and Norway. Most of the FIs generated a
positive impact in terms of diversification of sources of financing both for firms and urban
projects, especially in those regions that suffered from strong financial constraints during the
financial crisis. Demand outstripped supply in most cases, but particularly for loan and
guarantee products. There is no evidence of cannibalisation effects, either with other public or
private sources of finance.
Governance and administrative arrangements were found challenging in the case study
regions during the implementation and execution phases in 2007-13. Here financial
intermediaries and international financial institutions such as the EIB/EIF have played an
important role. The process of selecting, screening and managing the relationship with
intermediaries has proven to be a key element for the success of FIs. FIs appear to be
more effective where Financial Intermediaries have a clearly focused investment strategy,
fully coherent with the FI targets. There is an opportunity for skills to be transferred between
more and less experienced actors, for example, between national promotional banks or the
EIB/EIF and local actors.

ESPON 2020 xiii
The case studies highlighted the trade-off required between different targets of FIs:
absorption capacity, promotion of innovation and sophistication of economic activity, and
territorial cohesion within the regions, and noted that these are not always compatible. Most
of the instruments placed less emphasis on territorial factors within the region than on
other priorities. The outcome is that FIs were concentrated in zones with better economic
performance. It can be concluded that FIs have not contributed to overcoming territorial
imbalances, raising the question as to whether this is coherent with regional policy objectives.
It is notable that there is an almost universal lack of ex post evidence of territorial and
economic impact measured using quantitative and systematic evaluation methods within the
case study regions. Only the Norwegian case carried out continuous econometric impact
evaluations. Field and econometric impact evaluation practices are crucial in order to
continuously improve the performance and impact of FIs.
However, one of the key positive outcomes found is the generation of innovative and
entrepreneurial culture and know-how transfer among the actors involved. While this
immaterial capital is difficult to measure, the case studies highlighted this effect as one of the
most positive ones, which can be relevant to the long-term economic performance of the
regions.
Policy recommendations
The data analysis has highlighted how small a proportion of Cohesion policy spend FIs
represent and the study has revealed both the paucity of the data available and its lack of
comparability. These shortcomings are a significant obstacle to a fine-grained assessment of
the added value and impact of FIs. That said, it is clear that FIs do have positive effects.
Although frequently used for working capital rather than to fund investment, FIs have helped
mitigate the impact of financial crisis in many regions. There is evidence that they have led to
a more sophisticated and diversified financial market for SMEs, generated substantial
leverage and legacy for reinvestment and enabled knowledge transfer and capacity building.
In terms of informing the discussion on the use of financial instruments in future programming
periods, several policy recommendations can be highlighted.
EU regulatory issues are a significant reason for MAs not to use FIs, there is therefore a need
to ensure that administrative requirements are not a disincentive to use FIs rather than
grants. It is worth noting that the draft regulations for the 2021-27 period propose additional
simplifications.
Some regulatory requirements have the potential to undermine the effectiveness of financial
instruments. The combination of the seven-year programming period (which is relatively short
in financial product terms) and the requirements to ensure that funding is spent quickly can
conspire to make managing authorities more risk-averse. Care should be taken to ensure
that regulatory requirements do not undermine policy objectives.

ESPON 2020 xiv
Partly related to the above, financial instruments have the potential simply to reinforce
existing spatial disparities in access to finance because of the pressure to disburse budgets
and avoid decommitment. Perhaps as a result (and also due to the absence of delineated
assisted areas for Structural Funds since 2000-2006), there appear to be comparatively few
examples of FIs that proactively target disadvantaged areas. There is a need to ensure that
financial instruments do not reinforce existing disparities in access to finance, with
potential negative consequences for territorial cohesion. In context of territorial cohesion,
there is a need to be clear about what the policy objectives actually are, and potentially
accept that there may be a trade-off between a focus on disadvantaged regions and some of
the benefits of financial instruments e.g. FIs may be more costly to implement in more remote
regions. In short, publicly-backed FIs should not largely replicate what the private sector can
do, but rather intervene where it cannot or is unwilling to at the scale required.
Policymakers point to the importance of policy learning, experience and progressing from
simple to more sophisticated financial products. This study focuses on the data available for
the 2007-13 period, as implementation of FIs in the 2014-20 period has been slow and many
Member States and regions have so far reported little data. Since the closure of the 2007-13
period, the issue of administrative capacity has been receiving increased attention at EU
level. Specifically relevant to financial instruments, EU level Technical Assistance platforms
such as fi-compass were introduced in 2014-20, and have made significant efforts to increase
capacity within the field of financial instruments.
Consideration should be given to the role of data collection and reporting for financial
instruments to improve the understanding of policy effects and added value. The data
currently available for analysis of the added value and impact of financial instruments, even
after a comprehensive survey of MAs for data collected at regional level, and any additional
indicator data collected, is insufficient to assess the complementarity of financial instruments
and grants.
Implementation of ESIF financial instruments certainly involves a steep learning curve for
managing authorities, and the case studies have emphasised the key role which international
financial institutions such as the EIB/EIF, national and regional promotional banks and
financial intermediaries with local knowledge and relevant expertise can play. There is an
ongoing need for capacity building in FI implementation, and governance structures need to
combine financial expertise and local knowledge if they are to address territorial cohesion.

ESPON 2020 1
1 Introduction
Key points
• Financial instruments have developed a high profile in Cohesion policy, but only
accounted for about 3 percent of spend in 2007-13; even if ambitions for 2014-20 are
realised, FIs would amount to less than 6 percent of Cohesion policy expenditure.
• The high profile of FIs partly owes to Commission and EIB strategies to encourage their
use, but is also due to implementation challenges for domestic stakeholders.
• The rationale for financial instruments is that they are more sustainable and more
efficient than grants, and have the capacity to produce better quality projects.
• Financial instruments are a niche policy tool, but are far from homogenous; they
comprise very diverse financial products – loans, guarantees and equity – implemented
in different ways and addressing an array of aims and objectives.
• Little is known about how this diversity plays out in geographical terms and what
implications this might have for territorial cohesion.
• The focus of the study is on FIs in 2007-13 where FIs were principally used to support
enterprises, but also investment in urban development and energy efficiency and
renewables.
• With 2007-13 programmes closed and preparations underway for 2021-27, this is an
opportune time to contribute to debates on the future directions of policy.
The term ‘financial instrument’ (FI) has become firmly embedded in the lexicon of EU
Cohesion policy and FIs now have a high profile in the European Structural and Investment
Funds (ESIF) implementation. The main type of financial instrument or product are loans,
guarantees and equity. These have grown significantly in importance as policy delivery tools
in Cohesion policy: in 1994-99, ERDF spend in the form of FIs was estimated at just €300
million, rising to some €1.2 billion in 2000-06 (CSES, 2007); for 2007-13, Structural Fund
commitments to FIs reached almost €11.5 billion (European Commission, 2017); and
indications from the 2014-20 Operational Programmes (OPs) are that ESIF commitments to
FIs could rise to over €20 billion. That said, while the growth in the use of FIs is striking, these
sums remain very modest in relation to overall Cohesion policy spend: in 2007-13
commitments to FIs were just over 3 percent of Cohesion policy allocations; even if the 2014-
20 ambitions to further increase the use of FIs were achieved, FIs would still represent less
than 6 percent of OP indicative allocations.
1.1 The rationale and aims of financial instruments
Three main arguments have been advanced for the use of financial instruments as a
complement to or in place of grants (European Commission, 2012).
First, sustainability: because funds are, in principle, repaid, they can generate a legacy to be
reinvested. Second, efficiency: financial instruments can leverage-in private capital (for
example, a public guarantee may encourage a bank to lend where they otherwise would not)

ESPON 2020 2
thus supporting higher investment with less public funds. Third, quality: support has to be
repaid, so firms and project promoters may be more committed to project success than for
grant-aided investments. In addition, the due diligence required from financial intermediaries
may result in improved project quality.
1.2 Financial instruments are complex and diverse
The high profile accorded to FIs partly owes to their relative novelty in Cohesion policy1 and
their active promotion by the European Commission and the EIB Group, but also, more
notoriously, to the challenges involved in their operationalisation. These complexities
have resulted in FIs becoming a distinct strand of Cohesion policy implementation from a
regulatory and reporting perspective. In addition, the expertise required of policy practitioners,
together with the involvement of financial intermediaries in policy implementation, has often
meant that FIs have become the preserve of specialist stakeholders.
The emergence of FIs as a ‘niche’ tool of Cohesion policy has arguably contributed to the
impression of homogeneity. In fact, ESIF ‘financial instruments’ are highly diverse. They
embrace an array of financial products – loans, guarantees, counter-guarantees, venture
capital, quasi-equity, mezzanine funds and combinations of products - that not only operate in
completely different ways, but can be of widely differing scales, address a variety of policy
objectives, use various modes of governance and function within diverse socio-economic and
institutional contexts. For instance, a counter guarantee scheme that benefits several
thousand microenterprises annually has little in common with an urban development fund that
makes a handful of investments over the programming period; the only commonality is the
intent that the capital involved should be released or repaid for reinvestment.
1.3 The territorial dimension to financial instruments
Little has been written about how this diversity in use and type of financial instruments
plays out in territorial terms. Cohesion policy FIs are implemented in a variety of ways that
affect their use 'on the ground'. This owes to a number of factors, in particular:
• Operational Programmes that fund financial instruments may be regional,
multiregional or national in scope
• Domestic structures and traditions – such as the presence of national and regional
promotional banks or the role of the private sector – differ widely and affect both the
type of financial products used and how they are implemented
• The role of the EIB group differs between countries and regions, partly, though not
wholly as a function of the degree of domestic experience and expertise with FIs
1 Though they have long been used in domestic and international development and economic
strategies.

ESPON 2020 3
• The scale of Cohesion policy funding varies considerably between regions and
countries, affecting Managing Authority decisions about whether and how to channel
Cohesion policy funds into financial instruments
• The presence of domestic instruments also plays a role in decisions whether and how
to use FIs in Cohesion policy. For instance, Cohesion policy may be used essentially
to boost the funds available under existing financial products, or may be used to set
up entirely new financial products.
While these factors affect the territorial dimension of FIs, the focus on the regulatory aspects
of implementation has meant that many substantive granular questions remain unanswered.
For example:
• What types of financial product are used where, and why?
• What is the incidence of investment through FIs in different geographies?
• How do modes of governance differ between territories, and does this matter for the
performance of financial instruments?
• What can be said about the impact of financial instruments in different territorial
contexts?
• What insights can regions with experience of financial instruments offer for the
operationalisation of financial instruments in other geographies?
The aim of this study is to address these and other related questions.
1.4 Scope of the study
The timing of this study is such that the focus is on experiences with Cohesion policy FIs in
the 2007-13 programming period. Reporting for this period is now closed, enabling an
assessment of patterns of spend, outcomes and impacts. In 2007-13, financial instruments
could be used only to support enterprises, urban development projects and energy efficiency
and renewable energy investment. Most use was made by the ERDF, with both fewer
countries and very modest spend under the ESF. EAFRD spend on FIs was smaller still and
the Cohesion Fund did not allow for the use of FIs in the 2007-13 period.
In 2014-20, FIs can be used for any thematic objective and by any of the Funds. That said,
indications from the Operational Programmes and early implementation are that enterprises
remain the main target of FI support, and that their use beyond the thematic objectives for
SME competitiveness (TO3) and low carbon economy (TO4) are limited; ERDF remains the
main source of FI funding under Cohesion policy. While progress in 2014-20 does not yet
permit an analysis of expenditure, a growing body of literature and insights from stakeholders
gathered as part of this study does enable the experiences of both periods to contribute to
debates on the future of FIs in Cohesion policy post-2021. Experience so far in the 2014-20
period is discussed in the Scientific Report which accompanies this report.

ESPON 2020 4
1.5 Structure of the report
Against this background, this report is structured as follows. Chapter 2 sets out the
objectives and approach of the study. It outlines the methodology for the research, which
builds on the Terms of Reference, and involves both quantitative and qualitative dimensions.
The quantitative component involves the construction of regional typologies against which
differences in policy and performance might be assessed. The qualitative component involves
five case studies of regions / financial instruments where there is substantial experience.
Chapter 3 explains the concept of, and rationales for, financial instruments in the wider
context of economic development policy. Chapter 4 explores the territorial dimension to
financial instruments, focusing on the geographies of finance at national and subnational
levels, the role of administrative capacity in policy implementation and the relationship
between financial instruments and territorial disadvantage. Chapter 5 sets the scene for these
analyses by providing a comparative overview of the scale and governance of FIs under
Cohesion policy, principally at Member State level. This provides a basis for understanding
the more fine-grained regional-level analyses in Chapter 6, which assess territorial patterns
of commitment, investment, product and policy objectives under financial instruments
within Operational Programmes. This data is explored further in Chapter 7 which analyses the
added value and impact of financial instruments using the regional typologies
constructed. This is complemented by an overview of the case studies in Chapter 8. These
draw on five different experiences with financial instruments, looking in-depth at the
operation of specific Cohesion policy financial products in Andalucía (Spain), Lombardia
(Italy), Mellestra Norrland (Sweden) and Wielkopolskie (Poland) together with long-standing
domestic experience with FIs for regional development in Norway. Chapter 9 draws together
elements from all these analyses against the backdrop of current debates on financial
instruments in Cohesion policy post-2021.2 It seeks to contribute to those debates by drawing
policy conclusions and recommendations from the analysis in this study. The Appendix
includes the list of regions and their categorisation in the regional typology.
2 The regulatory proposals for the 2021-27 period relating to financial instruments are discussed in the
Scientific Report accompanying this report.

ESPON 2020 5
2 Objectives of the study and approach to the research questions
Key points
• The objective of the study is to provide evidence on the added value of Cohesion
policy financial instruments at the territorial level.
• The methodology for the study has comprised both quantitative and qualitative
elements.
• An extensive data collection exercise was undertaken to complement existing data.
This included a survey of managing authorities. Where regionalized data did not exist,
the data was regionalized on the basis of relevant proxies.
• This was followed by mapping of the data, the construction of regional typologies and
an assessment of the added value of financial instruments.
• Five case studies examine FI implementation in regions with different territorial
characteristics.
• Input from stakeholders was gathered at two EWRC events in October 2018.
2.1 Research questions
The overall aim of this study is to ‘provide evidence on what the increasing shift to using
financial instruments implies for the objective of territorial cohesion and whether using
financial instruments as a complement to grants is a more effective way to implement ESI
Funds in terms of added value for territorial development.’ More specifically, the study aims to
address a number of key policy questions:3
• What added value do ESIF financial instruments produce and how are the benefits
distributed across countries and regions?
• Where and how are financial instruments being implemented and what are the main
territory-related drivers and obstacles?
• What does the increasing shift to financial instruments imply for the objective of territorial
cohesion?
• Is using financial instruments as a complement to grant schemes an effective way to
implement European Structural and Investment Funds in terms of added value for
territorial development?
• How are different territorial features, governance mechanisms and administrative
capacities supporting or hindering the use of financial instruments in this new setting in
terms of regional development?
The Terms of Reference for the study also specified six tasks through which these questions
should be addressed. These and the links between them are summarised in Figure 2-1 and
discussed in the sections that follow.
3 ESPON EGTC (2017) Terms of Reference: “Financial Instruments and Territorial Cohesion”.

ESPON 2020 6
Figure 2-1: Project tasks and relationships
Source: Authors from ESPON EGTC Terms of Reference
2.2 Task 1: currents debate on Cohesion policy and ESIF financial instruments
Current debates on Cohesion policy are set against the background of wider reappraisals of
the future directions of the EU,4 its financing5 and the negotiation of the post-2020 financial
framework.6 Although financial instruments are a small percentage of overall Cohesion policy
spend, they have a high profile in policy debates, partly owing to the challenges in
implementation. A key question is whether these operational aspects themselves have a
territorial dimension. In exploring these issues, this task comprised two main elements:
1. A review and analysis of the literature on financial instruments, with particular
emphasis on the geography of FIs, the role of governance and their implications for
territorial Cohesion.
2. Consultation with key stakeholders on the experience with financial instruments in
2007-13 and 2014-20. In addition to insights from various fora, two stakeholder events
were organised at the European Week of Regions and Cities in October 2018. The first, a
4 European Commission ( 2017) White paper on the Future of Europe: Reflections and Scenarios for the EU27 by 2025: https://ec.europa.eu/commission/sites/beta-political/files/white_paper_on_the_future_of_europe_en.pdf
5 High Level Group on Own Resources (2016) Future Financing of the EU:
http://ec.europa.eu/budget/mff/hlgor/library/reports-communication/hlgor-report_20170104.pdf
6 A Modern Budget for a Union that Protects, Empowers and Defends – the Multiannual Financial
Framework for 2021-2027, COM(2018) 321 final, 2 May 2018.

ESPON 2020 7
practitioner event mainly involving Managing Authorities, and the second, arranged in
liaison with ESPON EGTC, involving key institutions (European Commission, EIB and
ECA).
The outputs from Task 1 informed both the regional typologies developed in Task 3 and the
policy proposals in Task 6.
2.3 Task 2: territorial analysis and mapping of the regional distribution of ESIF financial instruments
The overall objective of this task was to analyse and map the way in which FIs are used in the
implementation of ESI Funds. This included the identification of the different financial products
used (loans, guarantees, equity), the distribution of FIs compared to grant expenditure and
the policy objectives addressed through FIs. The aim was to analyse the distribution at NUTS
2 level, and NUTS 3 if feasible. Task 2 involved three elements:
2.3.1 An overview and assessment of existing data.
The main source of information on the implementation of ESIF FIs is the Summary of Data
(European Commission, 2017), which is European Commission summary of the data
provided annually by managing authorities on FIs. Some of this data is public; with the
support of ESPON EGTC and the European Commission (DG Regio), the project team also
obtained access to the unpublished data submitted by the Managing Authorities. The team
also assessed other resources, such as the European Commission's project categorisation
data.7 In principle, this dataset classifies ESIF investment by priority theme, sector, territory,
location and form of finance, at the level of ERDF and Cohesion Fund OPs. In practice,
however, this dataset had many shortcomings for the present study: location data is often
absent; the definitions of financial instrument do not coincide with the Summary of Data
definitions; the sector codes are not applied meaningfully in the case of repayable instruments
(i.e. managing authorities typically report data on financial intermediaries rather than the type
of final recipient targeted); and the priority themes do not coincide with policy target aims
defined for financial instruments (namely enterprises, urban development and energy
efficiency and renewables). Reporting on core indicators8 was also reviewed, but this lacks
information on location (other than the relevant OP – many of which are national or
multiregional) or by form of finance. Collectively, the various datasets presented some key
shortcomings and challenges, including but not limited to:
• NUTS 2 data only available where the OP coincides with NUTS 2 (about 46 percent of
total financial commitments to FIs); no NUTS 3 data
7 2007-2013 ERDF CF Categorisation Project Selection AIR2014 Raw: https://cohesiondata.ec.europa.eu/2007-2013/2007-2013-ERDF-CF-Categorisation-Projectselection-/b5xq-38ds
8 2007-2013 ERDF CF achievements – core indicators by programme: https://cohesiondata.ec.europa.eu/2007-2013/2007-2013-ERDF-CF-achievements-core-indicators-BY-/dsvh-4gnx

ESPON 2020 8
• reporting errors and gaps in compulsory data; much more serious shortcomings in
voluntary data
• lack of consistency between datasets in definition of financial instruments and policy
objectives
• no reporting on core indicators disaggregated by form of finance.
2.3.2 Data collection.
Reflecting the outcome of the data assessment, the team launched a major survey of all
Managing Authorities offering FIs in 2007-13, with data requests tailored to each Managing
Authority, seeking three inputs:
a) validation/correction of the data on financial instruments submitted by Managing
Authorities to the Commission at the time of programme closure
b) additional data on the contribution made by financial instruments to OP indicators
(e.g. reduction of CO2 emissions) or other impacts
c) regionalised data – geographical information below the level of the OP, and NUTS 3
regions if possible.
A total of 190 Managing Authorities were contacted by email. Up to four reminders were sent,
with priority given to telephone follow-up for Managing Authorities with particularly high levels
of FIs commitment. This is reflected in the outcome of the survey which shows that
respondents accounted for 45 percent of the total number of OPs, but about 55 percent of
spending commitments on FIs and of investments in final recipients.
Table 2-1: Summary of survey responses
Number €m committed to FIs
2007-13
€m invested in final
recipients 2007-13
OPs offering
FIs 190 11,165 10,250
Survey
Respondents 86 6,196 5,587
Respondents as a percent
of total
45.2% 55.5% 54.5%
Source: authors
Of the 86 respondents:
• 8 MAs provided corrections to the data provided through the Final Implementation
Report (FIR) process
• 47 stated that indicators other than those in the FIR were collected. These were only
provided in a few cases, and in practice did not always prove to be additional to FIR
reporting.
Regarding the territorial dimension, the picture was more complex reflecting the different
geographical scope of the OPs:

ESPON 2020 9
Table 2-2: Availability of data at NUTS 2 and use of proxies
Approach to regionalisation Number
of OPs
% of
OPs
EU amounts invested in final recipients
(€m)
% of EU amounts invested in final
recipients
OPs corresponding
to NUTS 2
n.a. 139 73.2 5222 50.9
Multiregional and nationwide
OPs
Regionalisation based on official data (response from MA, FIRs, national experts,
Ex. ante evaluations, project categorisation data, previous
knowledge)
29 15.3 3298 32.2
Regionalisation using proxy variables (regional proportions of employed in SMEs; GDP or
total population)
22 11.6 1730 16.9
190 100 10250 100
Source: authors
• Some 50.9 percent of investment in final recipients is de facto regionalised since the
OPs operate at NUTS 2
• 32.2 percent of investment was regionalised on the basis of official data or specific
knowledge (such as the location of urban development programmes)
• For 22 OPs (16.9 percent of investment) no official data was available and proxies were
used. For enterprise support FIs, the main proxy used was the regional share of
employment in SMEs; for urban development, regional shares of population was used in
the absence of other data.
Regarding regionalisation below NUTS 2, only 26 respondents collected this data (amounting
to investment of around €1,986 million (about 19 percent of the total invested in final
recipients). Of this investment amount over 75 percent was accounted for by five OPs.
2.3.3 Data analysis and mapping
In a third stage, which involved further quality control and plausibility checks, the data was
analysed in order to map a number of dimensions, including
• the scale of FIs investment in final recipients at the regional level
• the type of financial product deployed
• numbers of OPs engaged in offering FIs in a given region
• the relative importance of FIs in a given region both in relation to grants and in relation to
the regional economy
• the type of policy objectives addressed through FIs
2.4 Task 3: A methodology for measuring added value
The aim of this task was to provide a methodology to help measure what added value
different types of projects financed by ESIF FIs have for different types of territories. To this
end, the Terms of Reference required the development of a regional typology.

ESPON 2020 10
2.4.1 Development of a regional typology
The range of factors discussed later in this report (see Chapter 4) in relation to the geography
and governance of financial instruments points to a complex and multidimensional framework.
At national level, the extent to which mature financial markets and institutions exist, and the
nature of those institutions, affects not only the type of financing typically sought by firms and
public authorities in order to invest, but also the institutional frameworks available to deliver
ESIF co-financed FIs – for instance the presence of promotional or development banks. The
national context is important: access to finance is conditioned by broad models of capitalism
and the role of the State in investment finance. Specific characteristics related to access to
finance can be identified, notably the sophistication of financial markets, the role of banks, the
development of venture capital, the availability of patient capital and the role of public
intervention. Looking specifically at how national financial systems influence SME finance
Moritz et al, (2015) distinguish between bank-based, market-based and former socialist
countries.
Bank-based Market-based Former socialist
AT BE CY DE ES FI FR GR IE IT LU NO PT
FI NL SE UK BG CZ EE HR HU LT LV PL RO SI SK
The national financial context affects issues such as availability of finance per se, but it also
provides the institutional framework for the implementation of FIs. The domestic landscape
for FIs is complex, varied and opaque (Wishlade et al 2017). Some countries have
longstanding sophisticated structures which provide experienced mechanisms for disbursing
ESIF cofinanced FIs. In others, new national promotional banks (NPBs) are in the process of
being established in response to the aftermath of the financial crisis. In some central and
eastern European countries ESIF funding is the mainstay of economic development policy
and may also be a significant component of the resources of NPBs. Elsewhere the picture is
more fragmented, with niche funds, regional and sectoral banks and other financial
institutions playing various roles.
At the regional level, the interplay of a number of factors is relevant to the implementation
and impact of FIs:
• Eligibility for ESI Funds and levels of regional development. Designation as a
Convergence (or Less Developed Region (LDR) in 2014-20) region reflects levels of
economic development as measured in GDP(PPS) per head. As a measure of economic
development, GDP per head is not ideal, but its importance in the present context also
lies in the scale and intensity of ESIF financing, which has a bearing on the use of FIs.
The methodology therefore distinguishes between Convergence and Phasing-out
regions, on the one hand, and Regional Competitiveness and Employment regions and
Phasing-in regions on the other.
• Geography of finance. Access to finance has a strong spatial component, partly arising
from physical distance and partly from the geographies of financial institutions. This
implies that regions that are more distant from agglomerations tend to be more
disadvantaged with respect to access to finance. The methodology distinguishes

ESPON 2020 11
between urban, intermediate and rural areas to reflect this assumption, adapting existing
approaches to produce a classification at NUTS 2.
• Quality of government. The capacity of public policy to respond to regional
disadvantage is partly contingent on the quality of government. This is especially
pertinent in the context of financial instruments given the implementation challenges
experienced by many Managing Authorities. The methodology uses a Quality of
Government index to distinguish high, medium and low quality of government regions.
Using these factors - ESIF eligibility, finance system, quality of government, and urban-rural
classification – a typology of regions using FIs was developed as summarised in Table 2-3,
which shows the main criteria and Table 2-4, which shows the number of regions falling within
each regional typology (this also shows that large numbers of regions fall within the same
type, and some types are merely hypothetical). The methodology for each criterion is
described further in the Scientific Annex to this study.
Table 2-3: Factors affecting the uptake and implementation of financial instruments
Factor Relevance Indicator Elements
National financial
context
Type of financial institutions and main patterns in sources of
finance for SMEs
National system of
finance
Bank-based
Market based
Former socialist
Cohesion policy
eligibility
Broadly reflects level of development (GDP-PPS per head as % of EU average). Different designations reflect different intensities of Cohesion policy
support
2007-13 Cohesion policy
categories
Convergence and Phasing-
out (C+PO)
Phasing-in and Regional Competitiveness and Employment (RCE+PI)
Non-EU ESPON 4 (NEE)
Geography
of finance
Degrees of agglomeration reflect development of local financial
markets
Urban, intermediate, rural
classification
Urban
Intermediate
Rural
Quality of
government
Affects administrative capacity to implement FI, which are generally acknowledged to be more
complex than grants
Quality of government
index
High
Medium
Low
Source: authors
Table 2-4: Number of NUTS 2 regions in each regional typology
Eligibility Quality of
government
Financial context and geography of finance
Bank based market based former socialist
Urban Inter-
mediate
Rural urban Inter-
mediate
rural urban Inter-
mediate
rural
C+PO High QoG 1 3
Medium QoG 9 9 7 2 1 4 9 20
Low QoG 3 3 10 3 4 13
RCE+PI High QoG 14 13 23 24 11 8
Medium QoG 21 21 10 11 5 1
Low QoG 3 5 2
NEE High QoG 1 3 5 2 5
Medium QoG
Low QoG
Source: authors based on Official Journal of the European Union, 6.9.2006, L243; 28.3.2007, L87; Moritz, Block and Heinz, 2015; Masiak, Moritz and Lang, 2017; Demirguc-Kunt and Levine, 1999;. Charron, Dijkstra and Lapuente, 2015; Teorell et al, 2017; De Beer et al., 2014

ESPON 2020 12
For clarity, these typologies are illustrated in two separate maps. See Map 2-1 for eligibility
criteria and Map 2-2 for the criteria relating to financial systems, quality of government and
urban and rural classification.
Map 2-1: Convergence and Phasing Out (C+PO) and Regional Competitiveness and Employment and Phasing-In (RCE+PI)

ESPON 2020 13
Map 2-2: Quality of government, financial system and urban-rural classification
Source: authors

ESPON 2020 14
2.4.2 A framework for analysis
The Terms of Reference also specified a framework to analyse in a comparative way the
outcomes produced by financial instruments. This is replicated below.
Figure 2-2: Model regions for the analysis of financial instruments
Based on the geographical specificities (urban, rural, etc.) level of development and
financial situation, available infrastructure and governance mechanisms
Cluster /group 1 Cluster /group 2 Cluster /group 3
Model region
A
Model region
B
Model region
A
Model region
B
Model region
A
Model region
B
High uptake
of FI
Low uptake of
FI
High uptake
of FI
Low uptake of
FI
High uptake
of FI
Low uptake of
FI
ESPON EGTC – Terms of Reference
The intention of this model is understood to be to compare regions of the same 'type' but
distinguishing between high and low 'uptake' regions with a view to isolating – in Task 4 - the
impact that the use of financial instruments has had.
The notion of 'uptake' is not defined in the Terms of Reference, but for the purposes of the
study has been understood in two ways:
• the absolute scale of financial instruments measured by the EU amount invested by
FIs in final recipients in the region
• the relative importance of financial instruments measured by the EU amount invested
by FIs in final recipients in the region as a proportion of total payments under the
relevant OP.
In practice, a number of factors render this matched pairing approach to assessing the impact
of financial instruments problematic – indeed, early assessments of the data made clear that
the approach outlined in the Terms of Reference could not yield credible results. This for a
number of reasons. First, the overall scale of financial instruments is small – too small to
conclude that their use has had any discernible macro effects. Second, specific indicators on
financial instruments are only rarely collected and available; where they are available their
quality and definition does not lend itself to generalization across a cluster or group of
regions. Third, 'uptake' of financial instruments is comprised of expenditure on financial
products of different types operating over different timescales and, notwithstanding the
development of regional typologies, varying economic, institutional and political contexts,
none of which can readily be controlled for in assessing the potential impacts of instruments
with very modest levels of spend.
Notwithstanding these issues, the regional typologies are a useful way to explore differences
in the uptake of financial instruments, the key drivers, the policy choices made and the added
value achieved; however, the basis for analysis focuses on the differences between groups,
where distinct patterns emerge, and not within groups of the same type.

ESPON 2020 15
2.5 Task 4: The added value of financial instruments at territorial level
The overall aim of this study is to ‘provide evidence on what the increasing shift to using
financial instruments implies for the objective of territorial cohesion and whether using
financial instruments as a complement to grants is a more effective way to implement ESI
Funds in terms of added value for territorial development.’
A first step was to explore the concepts of added value and impact as they apply to financial
instruments. The analysis of the added value of financial instruments focuses on issues of
sustainability, efficiency and quality, these being the main rationales for using financial
instruments, as opposed to grants (see Section 3.3 below). In terms of quantitative measures,
legacies and returns are suitable indicators for sustainability, and management costs and fees
and leverage for efficiency. For quality, no comparative quantitative measures are available,
but this was considered in the case studies (see 2.6).
As regards impact, the number of jobs created is the only measure for which data is widely
available. Other data that measure impact of financial instruments specifically are only
quantified for a relatively small selection of funds and programmes, as identified in the
managing authority survey. This information can provide anecdotal insights, but does not lend
itself to quantitative analysis owing to definitional, comparative and quality issues.
In addition, the achievement of ‘softer’ policy outcomes specific to FIs such as changing
subsidy culture and developing local financial markets can be important outcomes from the
use of financial instruments – and past studies show that such effects are real and valued.
However, they cannot readily be quantified and may take different timespans to achieve in
different regions. The key elements are summarised in Figure 2-3.

ESPON 2020 16
Figure 2-3: Financial instruments and territorial cohesion: a framework for analysis
National context
Economic culture and structures, and financial institutions
Regional dimension
ESIF eligibility
Geography of finance
Quality of government
FI implementation structures
Potential value-added of financial instruments (compared to grants)
SustainabilityProject quality
EfficiencyMarket building
Subsidy culture shift
Impacts associated with financial instruments (and grants)
Job creation Investment Start-upsGreenhouse
gas reductions
Other measureable outcomes?
Source: authors.
2.6 Task 5: Case studies
Given the complexities of financial instruments and the absence of comprehensive
quantitative data, the qualitative component of the study is important. Five case studies were
carried out on regions with experience with ESIF FIs which could provide insight on what
might be expected elsewhere in Europe. The case studies were selected in consultation with
ESPON EGTC and the Project Support Team and are as follows:
1. Italy: FI within the ROP Lombardia 2007-13;
2. Sweden: FI within the Mellersta Norrland OP 2007-13;
3. Spain: FI within the ERDF ROP Andalucía 2007-13;
4. Norway: providing a non-EU perspective within the ESPON membership;
5. Poland: FI within the ROP Wielkopolskie 2007-13;
The case studies were prepared using desk research and face to face interviews with
stakeholders. The approach was tailored on a case-by-case basis, as the financial
instruments selected represent a heterogeneous group. While all selected cases apart from
Norway have experience with ESIF FIs,9 they have been selected to ensure representation of
9 Represented by high levels of commitments to financial instruments, either in absolute terms or as a
percentage of OP Programme expenditure.

ESPON 2020 17
different types of regions/cluster type, a geographical balance across the EU, and different
types of FIs in terms of thematic coverage. Each of the case studies can be considered as an
‘outlier’, in the sense of being a leading user of FIs, a ‘pioneer’, or an innovator in terms of the
use of FIs.
2.7 Task 6: Policy proposals
Task 6 draws on the various elements of the study. The desk research, survey work, analysis
of added value and case studies were complemented by two events organised by the project
team at the European Week of Regions and Cities in October 2018. The events provided both
a ‘bottom up’ practitioner perspective on experience with FIs and hopes for the future, and a
‘top-down’ institutional perspective on the FI reforms under debate.

ESPON 2020 18
3 Financial instruments: definitions and rationales
Key points
• The term ‘financial instrument’ is used quite loosely, but includes an array of financial
‘products’ – loans, guarantees and equity.
• These products have many variants and have little in common with one another, save
the principle that unlike grants the capital is repayable.
• The main rationale for public intervention in economic development policy is to
support activities that the market will not undertake alone or at all.
• Financial instruments are only suitable as tools of public intervention where the
investment is potentially income generating or cost saving.
• Financial instruments have a number of benefits over grants.
• They are more sustainable because capital is repaid and can be reinvested.
• They may generate higher quality projects because of the commitment to repay funds
and through the due diligence of commercially-oriented fund managers.
• They may make more efficient use of public funds if they can attract private sector
investment.
• Financial instruments may offer wider benefits, such as helping the development of
local capital markets and challenging a ‘subsidy culture’.
3.1 What are financial instruments?
The term financial instrument is used quite loosely, and often interchangeably with financial
product. The conventional breakdown of financial products distinguishes loans, guarantees
and equity, but there are variants on these and scope to combine them. In practice, the only
commonality between the three groups of products is that, unlike grants, funding is in principle
repayable and can be recycled.
Loans are comparatively easy to administer from a public administration perspective. The
implementation of a loan fund can be “outsourced” to financial intermediaries or financial
allocations can be used to increase the finance available through sources such as national
and regional promotional banks. Loan products can help address credit rationing, as well as
cost-of-credit issues (through interest rate subsidies or easier terms). Loans are often
preferred by SMEs because there is no loss of control or ownership, but they can lack the
flexibility required by young firms.
Guarantees are arguably the most straightforward financial product to design, implement and
recalibrate as economic development needs change. They have most potential for impact
where collateral-based lending is the norm and the business population is not asset-rich. The
use of guarantees (in domestic and Cohesion Policy) is significant in only a few countries, and
the sums covered are, on average, often modest, partly because they are frequently

ESPON 2020 19
combined with loans in microfinance packages for start-ups and young firms. However, where
they are used, their reach can be significant in terms of the numbers of final recipients.
Publicly backed equity or venture capital is the least used of the three conventionally
defined financial products and is often regarded as a specialist product for potentially fast-
growing and/or innovative firms. Unlike in the US, equity and venture capital are not
prominent sources of finance for SMEs in Europe, especially smaller ones. Equity products
can provide significant amounts of medium- to long-term capital, but imply at least some loss
of management control by founders and are typically more difficult to manage for public
authorities.
3.2 The rationale for intervention and the role of financial instruments
In broad terms the justification for public intervention in economic development policy is to
support activities that the market cannot or will not undertake alone, but which are considered
in the wider public interest. The situations in which this can arise can be grouped into four
main categories (Meiklejohn, 1999; Wishlade et al, 2017), though two or more of these may
be present at once.
First, the provision of public goods – those that are considered ‘non-excludable’, i.e. access
to goods and benefits from which cannot be restricted to those who fund them, so there is no
efficient private market for them. Classic examples include street-lighting and lighthouses.
Second, the supply of merit goods – those goods and services where public authorities
consider they need to intervene to ensure provision at optimal levels. Examples include
aspects of education, culture, health services, museums and libraries.
Third, the presence of externalities – the idea that the actions of an individual or a firm have
spillovers which affect others, but which are not reflected in market prices. In other words,
commercial assessments of returns on investment do not necessarily capture the wider
societal or longer term benefits. Conventional examples are: research and development,
where undertakings may be deterred from spending on R&D because they cannot reap all the
gains from their investment (assuming it is successful at all), but others might ‘free-ride’ on
their innovation; and vocational training, where the incentive to invest in firms’ staff skills may
be limited because it increases the likelihood of employees being ‘poached’ by others.
Last, imperfect information – situations where certain types of project cannot obtain private
finance at all or at affordable cost because banks or investors have insufficient information to
assess risks accurately, or the costs of obtaining that information make transaction costs too
high. Information asymmetries can be particularly acute among start-ups, who have no track
record and new firms in high technology sectors, where the risks are difficult to assess
precisely because their activities are innovative. Such firms often lack the collateral needed to
secure capital, or the cost of capital is too high because of their risk profile; as a result,
access to finance is likely to be especially difficult for certain categories of SME, notably start-
ups, small and/or young firms and high tech enterprises (Siedschlag et al, 2014).
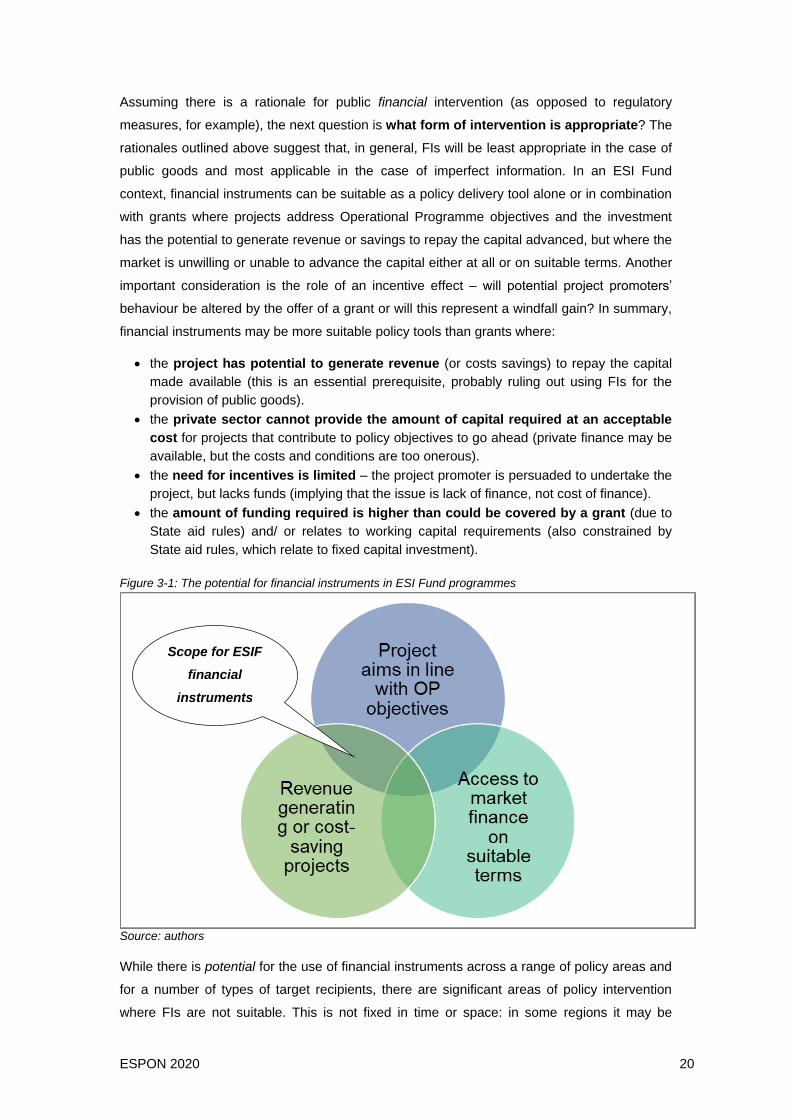
ESPON 2020 20
Assuming there is a rationale for public financial intervention (as opposed to regulatory
measures, for example), the next question is what form of intervention is appropriate? The
rationales outlined above suggest that, in general, FIs will be least appropriate in the case of
public goods and most applicable in the case of imperfect information. In an ESI Fund
context, financial instruments can be suitable as a policy delivery tool alone or in combination
with grants where projects address Operational Programme objectives and the investment
has the potential to generate revenue or savings to repay the capital advanced, but where the
market is unwilling or unable to advance the capital either at all or on suitable terms. Another
important consideration is the role of an incentive effect – will potential project promoters’
behaviour be altered by the offer of a grant or will this represent a windfall gain? In summary,
financial instruments may be more suitable policy tools than grants where:
• the project has potential to generate revenue (or costs savings) to repay the capital
made available (this is an essential prerequisite, probably ruling out using FIs for the
provision of public goods).
• the private sector cannot provide the amount of capital required at an acceptable
cost for projects that contribute to policy objectives to go ahead (private finance may be
available, but the costs and conditions are too onerous).
• the need for incentives is limited – the project promoter is persuaded to undertake the
project, but lacks funds (implying that the issue is lack of finance, not cost of finance).
• the amount of funding required is higher than could be covered by a grant (due to
State aid rules) and/ or relates to working capital requirements (also constrained by
State aid rules, which relate to fixed capital investment).
Figure 3-1: The potential for financial instruments in ESI Fund programmes
Source: authors
While there is potential for the use of financial instruments across a range of policy areas and
for a number of types of target recipients, there are significant areas of policy intervention
where FIs are not suitable. This is not fixed in time or space: in some regions it may be
Scope for ESIF
financial
instruments

ESPON 2020 21
feasible to fund some types of investment through FIs whereas in others grant funding is
needed; over time the use of FIs may become more mainstream, and / or more sophisticated,
and ultimately may be replaced with more private sector finance.
Importantly, the rationales for intervention, the nature of the market imperfection and their
impact on target recipients vary widely between policy objectives, so financial products (loans,
guarantees, equity etc.) must be tailored to the needs of target recipients (Figure 3-2).
Figure 3-2: Target recipients, market imperfections and rationales for FI
Source: Wishlade et al (2017).
3.3 The potential benefits of financial instruments over grants
Three main arguments have been advanced by the European Commission for the use of
financial instruments in ESI Funds, in place of grants (European Commission, 2012).
Sustainability. Because funds are, in principle, repaid, they can be reinvested for the same
purpose in the region, generating the same or similar gains for the locality more than once,

ESPON 2020 22
unlike grants which not only may involve a windfall gain, but are also, by definition, not repaid.
That said, the sustainability of FIs depends on a number of factors, including projects being
sufficiently successful to repay the funds and management costs and fees at a level that do
not erode returns, at least excessively.
Efficiency. Because financial instruments may have the capacity to attract private sector
capital, they may increase the efficiency of public spending by leveraging in private capital.
They may also cost the public sector less to administer than grants because of the
involvement of financial intermediaries. On the other hand, the capacity to attract private
capital may be doubled-edged – success in attracting private capital may be indicative of
crowding-out private markets.
Quality. Because support has to be repaid, project promoters may undertake more robust
analyses of project viability and be more committed to project success than for non-
reimbursable support. In addition, the due diligence required from financial intermediaries
may result in improved project quality and greater contributions to OP objectives. At the same
time, tightly drawn funding agreements with financial intermediaries may result in project
selection criteria that are scarcely different from commercial terms, limiting the added value
induced by publicly-funded FIs.
In addition, some ‘softer’ benefits from financial instruments can also be claimed. In particular,
FIs may contribute to the development of local financial markets, particularly when
combined with other instruments such as those supporting the development of business angel
networks. Also, use of close-to-market measures and involvement of financial intermediaries
may stimulate local financial markets to step in, lowering the need for public intervention
longer term. The ex-post evaluation of ERDF financial instruments for SMEs (Wishlade,
Michie, Familiari, Schneidewind and Resch, 2016) found that long-term use of FIs in the
north-east of England had supported the emergence of a distinct regional financial
intermediary sector in a disadvantaged part of England; and in Estonia, ERDF cofinanced
housing renovation loans were discontinued in 2014-20 because the private sector had
stepped in having observed a market opportunity developed during 2007-13 where none was
perceived to have existed before (Wishlade, Michie and Vernon, 2017). In addition, a shift
towards financial instruments may also result in a cultural change away from subsidy
dependency towards greater acceptance of market-based finance. Such effects are more
difficult to quantify, but evidence from recent studies supports their existence (Wishlade,
Michie, Familiari, Schneidewind and Resch, 2016).
The effects, or potential effects, outlined above are specific to FIs. In addition, FIs would also
be expected to generate the same types of outputs in relation to OP objectives as
grants, including job creation, investment, new business starts, greenhouse gas reductions.
Clearly the nature of such outputs will differ according to the projects financed. However,
there is currently no analysis of the extent to which different instruments are associated with
different outputs, and the absence of systematic collection of indicators by instrument means

ESPON 2020 23
it is unclear whether the form of intervention itself has an impact on meeting these aims.
While there is no a priori reason to suppose that a euro spent in the form of a financial
instrument would generate more jobs than a euro invested in the form of a grant for the same
purpose, it can be argued that even if the outputs are the same, FIs have more impact
because of their revolving nature.
The relationship between grants and financial instruments is rarely well articulated in
policy. FIs are often perceived as a solution for difficulties in accessing finance, rather than as
an alternative, or complementary policy delivery tool. FIs are only suitable for projects which
generate revenue or cost savings, hence the focus on business support, urban development
and low carbon economy; grants can only partially cover investment requirements, owing to
State aid rules, but can provide an incentive to alter behaviour, for instance by funding
feasibility studies or subsidising investments considered in the wider public interest. There is
a need for the support offer to be coordinated (e.g. FIs will not be attractive when grants are
available for similar purposes) and a plethora of schemes causes confusion for recipients
(Evans, 2013). While the grant-FI relationship has not received much attention in the past,
there are signs that this is rising up the agenda following the wider use of FIs in 2007-13.
Some MAs perceived FIs as improving the capacity of Cohesion policy to meet targets, with a
key benefit being the deterrence of grant dependency, the development of an “entrepreneurial
culture” and support for (niche) market development. (Wishlade et al, 2016).

ESPON 2020 24
4 The territorial dimension of financial instruments
Key points
• Little is known about the spatial incidence of Cohesion policy financial instruments.
• The geographies of finance and of administrative capacity are important to the
exploration of the territorial dimension of FIs.
• At national level the geography of finance is shaped by domestic institutional financial
contexts like the role of the public and private sectors in providing investment capital.
• There are significant differences in the geography of finance within countries with more
remote and rural areas typically being disadvantaged.
• Administrative capacity is key to the ability to implement financial instruments, but quality
of government tends to be lower in more disadvantaged areas.
4.1 The importance of spatial considerations
Much has been written about the implementation of financial instruments (FIs) under
Cohesion policy since they rose to prominence in 2007-13. However, this has focused on the
challenges involved in their implementation and little of it has had an explicitly spatial
dimension. In part, this owes to the relative novelty of FIs as a delivery mechanism, leading to
a steep learning curve for Managing Authorities (MAs) in setting up FIs, so that debates have
been dominated by issues of process rather than of substance. This study is an opportunity
to address the ‘territorial gap’ in financial instrument research.
Although Cohesion policy applies in all regions, the emphasis is on those facing obstacles to
development. Typically these include low administrative capacity, a low rate of
entrepreneurship, underdeveloped financial markets, and low density population. Central to
this study is the hypothesis that many of the obstacles to development in disadvantaged
regions are precisely those that make the delivery of policy through FIs challenging. In short,
the implementation of FIs and their contribution to territorial cohesion lies at the nexus of the
geography of finance and the quality of government. This study eschews an explicit definition
of territorial cohesion which has been studied in depth through ESPON already (ESPON,
2013), focusing instead on a range of spatial dimensions relevant to FIs in Cohesion policy.
Importantly, in the context of this study, the territorial component of Cohesion policy was
diluted from 2007 when it became an ‘all-region’ policy, more explicitly addressing horizontal
objectives linked to the European 2020 agenda. Cohesion policy still retains a spatial
dimension, reflected in the scale and intensity of funding for the less-developed regions, but
the fine-grained discrimination outside these regions has disappeared. This is important, and
especially so in the context of financial instruments, because little is known about the spatial
incidence of FIs. There are, however, reasons to think that the uptake of FIs within an
Operational Programme (OP) may be skewed towards the more developed areas – with the

ESPON 2020 25
risk of both crowding-out the private sector in such areas, as well as exacerbating existing
infra-regional or infra-national disparities, depending on the spatial scope of the OP.
4.2 The geography of finance
At a general level, access to finance is inherently spatial. This is true at national and
subnational levels. The national context is important: access to finance is conditioned by
broad models of capitalism and the role of the State in investment finance. In their seminal
work Hall and Soskice (2001) develop a framework to understand commonalities and
differences between institutions in different economies. They distinguish liberal market
economies (LMEs), epitomised in Europe by the United Kingdom, and coordinated market
economies (CMEs), such as Germany, and suggest that a Mediterranean cluster might also
be distinguished. Nölke and Vliegenthart (2009) expanded the typology to include dependent
market economies (DMEs) typified by the VISEGRAD countries, but potentially including
Romania (Ban, 2013). Others have suggested that the Baltic countries constitute a ‘state-
crafted neoliberal model’ (tending towards the LME model), while Slovenia follows a neo-
corporatist pattern (Bohle and Greskovits, 2007) more akin to coordinated market economies.
Among other things, these models differ according to the primary means of raising investment
capital, with LMEs more reliant on capital markets, CMEs tending towards domestic bank
lending and internal funding, and DMEs drawing more on foreign direct investment and
foreign-owned banks.
Alternative approaches have also been proposed. Amable (2003), pre-dating eastern
enlargement, distinguishes market-based, continental, social democratic and Mediterranean
capitalism. Specific characteristics related to access to finance are identified, notably the
sophistication of financial markets, the role of banks, the development of venture capital, the
availability of patient capital and the role of public intervention. The resulting clusters are not
watertight or geographically comprehensive but they illustrate the diversity of institutional
financial contexts. Looking specifically at how national financial systems influence SME
finance Moritz et al, (2015) distinguish between bank-based, market-based and former
socialist countries, covering EU28 (except Malta) and Norway (see Table 4-1). They show
that SME financing differs more between these country groups than by firm, product or
industry-specific characteristics. They also argue that government support programmes can
only be effective if they take account of both SME characteristics and national supply-side
conditions. In short, national financial systems matter.
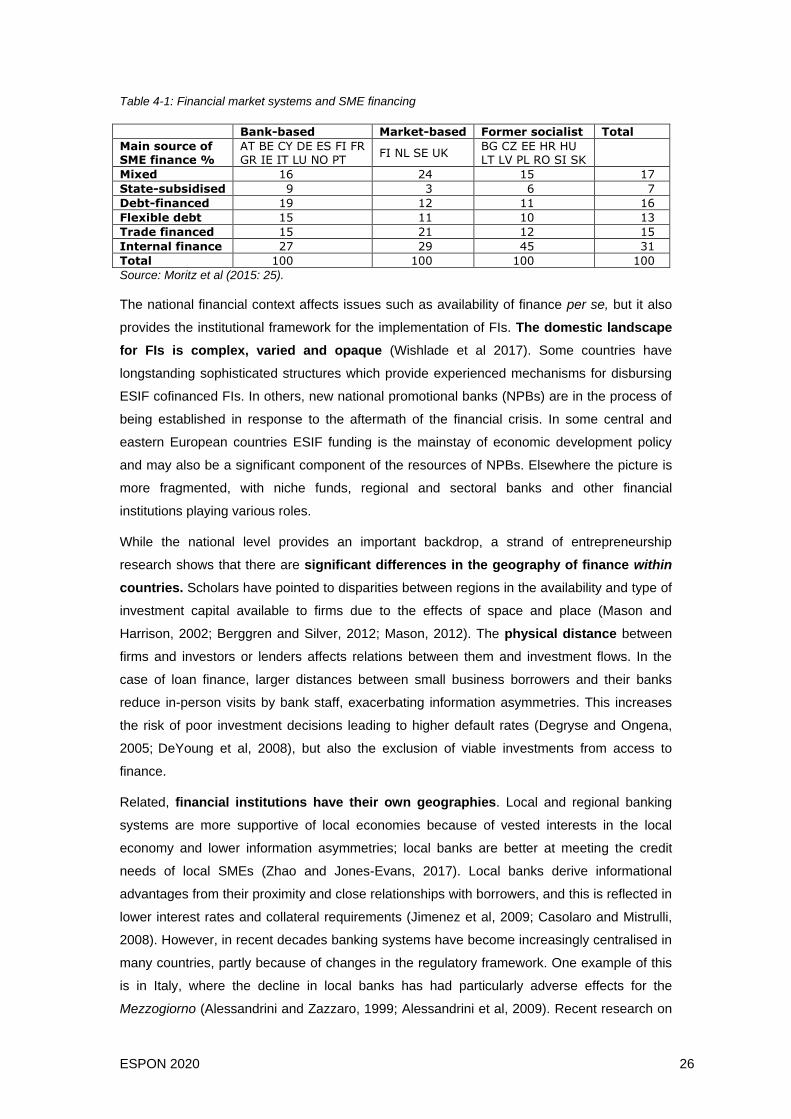
ESPON 2020 26
Table 4-1: Financial market systems and SME financing
Bank-based Market-based Former socialist Total
Main source of SME finance %
AT BE CY DE ES FI FR GR IE IT LU NO PT
FI NL SE UK BG CZ EE HR HU LT LV PL RO SI SK
Mixed 16 24 15 17
State-subsidised 9 3 6 7
Debt-financed 19 12 11 16
Flexible debt 15 11 10 13
Trade financed 15 21 12 15
Internal finance 27 29 45 31
Total 100 100 100 100
Source: Moritz et al (2015: 25).
The national financial context affects issues such as availability of finance per se, but it also
provides the institutional framework for the implementation of FIs. The domestic landscape
for FIs is complex, varied and opaque (Wishlade et al 2017). Some countries have
longstanding sophisticated structures which provide experienced mechanisms for disbursing
ESIF cofinanced FIs. In others, new national promotional banks (NPBs) are in the process of
being established in response to the aftermath of the financial crisis. In some central and
eastern European countries ESIF funding is the mainstay of economic development policy
and may also be a significant component of the resources of NPBs. Elsewhere the picture is
more fragmented, with niche funds, regional and sectoral banks and other financial
institutions playing various roles.
While the national level provides an important backdrop, a strand of entrepreneurship
research shows that there are significant differences in the geography of finance within
countries. Scholars have pointed to disparities between regions in the availability and type of
investment capital available to firms due to the effects of space and place (Mason and
Harrison, 2002; Berggren and Silver, 2012; Mason, 2012). The physical distance between
firms and investors or lenders affects relations between them and investment flows. In the
case of loan finance, larger distances between small business borrowers and their banks
reduce in-person visits by bank staff, exacerbating information asymmetries. This increases
the risk of poor investment decisions leading to higher default rates (Degryse and Ongena,
2005; DeYoung et al, 2008), but also the exclusion of viable investments from access to
finance.
Related, financial institutions have their own geographies. Local and regional banking
systems are more supportive of local economies because of vested interests in the local
economy and lower information asymmetries; local banks are better at meeting the credit
needs of local SMEs (Zhao and Jones-Evans, 2017). Local banks derive informational
advantages from their proximity and close relationships with borrowers, and this is reflected in
lower interest rates and collateral requirements (Jimenez et al, 2009; Casolaro and Mistrulli,
2008). However, in recent decades banking systems have become increasingly centralised in
many countries, partly because of changes in the regulatory framework. One example of this
is in Italy, where the decline in local banks has had particularly adverse effects for the
Mezzogiorno (Alessandrini and Zazzaro, 1999; Alessandrini et al, 2009). Recent research on

ESPON 2020 27
Spain highlights a decline of 30 percent in the number of bank branches since the financial
crisis, with potentially significant regional impact. The decline in bank branches is partly due
to the conversion of Cajas into for-profit banks. Cajas had been established as not-for-profit
entities in the 19th century with a social and economic development mandate in the regions,
and played an important role in microfinance, especially in rural areas with low demand
density and low-income communities (Martin-Oliver, 2019).
Different forms of finance have different territorial patterns: the concentration of venture
capital investors in particular regions means that the local business community has much
more knowledge of the role of venture capital and ways to access it, thus stimulating demand,
whereas in regions with few venture capital firms knowledge is weak and incomplete,
reducing demand and the prospects of success for those firms that do seek venture capital
(Martin et al, 2005). Business angels and venture capital are also characterised by localised
investing because of the need for ‘soft’ information that cannot readily be standardised or
automated (Mason, 2007; Cumming and Dai, 2010; Avdeitchikova, 2009; Harrison et al,
2010). Longer distance flows of venture capital do happen, but generally through syndication
with local investors. As a result, such flows gravitate towards regions that already have
significant sources of their own (Florida and Smith, 1991; Sorenson and Stuart, 2001).
4.3 Quality of government and administrative capacity
The capacity of public policy to respond to regional disadvantage in the geography of finance
is contingent on quality of government. Recent research has highlighted wide divergences
in the quality of government within countries, as well as across the European regions as a
whole. There is a broad correlation between levels of economic development and quality of
government (Charron et al, 2013). Places with weak and/or inefficient institutions suffer from a
variety of problems including corruption, rent-seeking, clientelism and nepotism and principal-
agent or information problems. These lead to imperfectly functioning markets, lower efficiency
and growth potential, and to institutional and government failure, affecting the capacity of
governments to design and deliver public goods and policies. Moreover, where Cohesion
expenditure is higher, the importance of quality of government also increases so that in
regions where support is highest – over €120 per head per annum - the most efficient way to
achieve greater economic and social cohesion is by improving the quality of government
(Rodriguez-Pose and Garcilazo, 2015).
Issues of quality of government are especially pertinent in the context of financial instruments
because of the challenges involved in their implementation. These have been well-
documented generally (Mazars et al 2013; Nyikos 2016), in the context of support for SMEs
(Wishlade et al, 2016) and in the case of FIs for energy efficiency and renewables where the
challenges are even greater because of the specialist technical expertise also required
(Wishlade et al, 2017). Managing authorities across the EU, irrespective of quality of
government and including those with substantial experience of running co-financed FIs, find
aspects of FI implementation difficult. Because of the correlation between quality of
ESPON 2020 28
government and levels of economic development, disadvantaged regions are doubly
disadvantaged: access to finance is generally harder in the more disadvantaged areas, and
these same regions may lack the administrative capacity to implement public policy measures
to compensate for shortcomings in the geography of finance.
Also relevant is the tier of administration at which FIs are managed and implemented. In
many countries FIs are funded from regional OPs and, self-evidently, apply to that region. In
others, FIs are implemented under national or multiregional OPs and therefore straddle
several regions; under other arrangements, several OPs contribute to nationally-managed
funds. In addition, the 2014-20 Common Provisions Regulation introduced an option for MAs
effectively to pool some of their resources into EU-level or joint instruments such as the SME
Initiative where implementation is ‘delegated up’ to the EIB group. Such pooling or
centralisation can help address some of the administrative and regulatory challenges of FI
implementation. However, a clear lesson from evaluations and past studies is that FIs must
be tailored to local needs and conditions (Veugelers, 2011; Tykvová et al 2012; Berggren and
Silver 2012; Michie and Wishlade 2011). A key policy question is whether and how it is
possible to reconcile centralised administration and local responsiveness.
Comparatively little is currently known about the spatial incidence of ESIF and other EU
financial instruments; indeed, it is an objective of this study to understand this better.
However, there are reasons to think that the combined effects of the pressure to absorb
funds, together with the greater density of investible projects might lead to investments being
concentrated in the more prosperous areas within an OP area; the extension of Cohesion
policy to all regions arguably increases this likelihood. There is an analogous situation in the
European Fund for Strategic Investment (EFSI), under which, reflecting the market-led nature
of the instrument, a larger share of investments is located in the more prosperous Member
States (ECA, 2019), even though investment policy is ostensibly spatially neutral. There is
also at least anecdotal evidence of crowding out of commercial finance.10 At the same time,
the regulatory requirements for EFSI and EU level instruments, such as COSME, are less
demanding than for FIs under shared management, so that, perversely from a Cohesion
perspective, regions where ESIF are the main funding source for FIs are subject to tougher
rules.
4.4 Financial instruments and territorial disadvantage
This links to the role of financial instruments in disadvantaged regions, how the
advantages claimed for FIs play out in different conditions and what this might mean for the
roles of and relationship between grants and FIs. There are several aspects to this.
First, it is important to note that the term ‘financial instruments’ encompasses financial
products that have little in common among themselves except that, unlike grants, the
10 As discussed at EAPB workshop on the role of public banks in supporting smart and resilient
infrastructure as part of the European Week of Cities and Regions, 11 October 2017, Brussels.

ESPON 2020 29
capital advanced is repayable; this is turn means, of course, that FIs are only suitable for
investments that are at least potentially revenue-generating or cost-saving.
Second, there is evidence that different types of publicly-backed financial products can
have limitations in terms of supporting disadvantaged regions. This is most evident in
the case of regional venture capital funds where the typical approach of governments has
been to establish hybrid funds with private sector fund managers which comprise a mixture of
public and private money, with private investors given certain incentives (Murray, 2007).
However, it is debatable whether constraining funds by restricting their investments regionally
is good practice (Veugelers, 2011), mainly because this typically results in small amounts of
capital under management, in spite of generous incentives for private sector investors
(Murray, 1998; Mason and Harrison, 2003 Growth Analysis, 2011). Small funds generally
have a number of disadvantages, including relatively high management costs, limited scope
to diversity and spread risk, and constraints on follow-on investment (ECA, 2012). However, it
has also been argued that the real problem facing regional public sector venture capital funds
is one of ‘thin’ markets in disadvantaged regions - these regions lack an appropriate eco-
system to support venture capital investing. In other words, it is not simply a problem of
demand or supply (Nightingale, 2009).
Third, and in contrast, some types of publicly-backed financial product may have more
positive effects in disadvantaged areas than in more prosperous ones. For instance, a
study of Small Business Administration guaranteed lending in the US showed a correlation
between the level of guaranteed lending and the level of employment in a local market (Craig
et al, 2009). Crucially, this correlation was only significant in low income markets, perhaps
suggesting a crowding-out effect in more prosperous areas. This also supports arguments for
regionally-discriminating guarantee schemes, though these are alleged to be less attractive to
commercial lenders.11
A further issue is that the profile of firms in disadvantaged regions is different from that
in thriving regions. This has direct implications for the perceived benefits of FIs, and for the
role of grant support, specifically:
Sustainability: default rates may be higher in more deprived areas, reducing the size of the
legacy available for reinvestment in those regions, while more prosperous regions benefit
from recycled funds.
Quality: proposed investments or enterprises may be of poorer quality in more disadvantaged
areas - evaluations of enterprise creation initiatives in disadvantaged areas in the UK suggest
that they are successful in encouraging start-ups, but that those businesses tend to be small,
marginal and few of them generate a living wage (Rouse and Jayawarna, 2011).
11 As claimed anecdotally at DG REGIO workshop on ‘Financial instruments as a delivery mechanism
for ESIF post-2020’, European Week of Cities and Regions, 10 October 2017, Brussels.

ESPON 2020 30
Efficiency: it may be more difficult to attract private finance in problem regions and
management costs and fees may be relatively higher. Is there a trade-off between leverage
and the ability to generate returns? If so, does this trade-off have particular spatial patterns?
Disparities between regions are reflected in Cohesion policy FIs. A Managing Authority
survey in peripheral maritime regions showed that while 73 percent of respondents in
Regional Competitiveness and Employment regions were satisfied with the result of FI
implementation in 2007-13, only 44 percent of respondents in Convergence regions felt the
same (CPMR, 2016). However, peripheral sparsely-populated areas located in more
developed regions still reported poor uptake of FIs.

ESPON 2020 31
5 Financial instruments in Cohesion policy: scale and governance
Key points
• Financial instruments have more complex reporting and operational structures than
grants; this has implications for data availability.
• The use of financial instruments varies widely between countries (and within them) in
terms of scale, product types, policy objectives and governance.
• 25 Member States used financial instruments in 2007-13.
• Some €17 billion in OP contributions was committed to FIs (including €11.5 of
Structural Funds), of which €15.2 billion reached final recipients.
• Italy accounted for almost 30 percent of all contributions to financial instruments in
2007-13.
• On average, EU Member States committed €426 million (EU amounts) to financial
instruments, amounting to 3.4 percent of total Cohesion policy allocations, 0.013
percent of GDP and €23 per head over the period 2007-13.
• There are wide variations around these averages: Italy committed over €3 billion in
Structural Funds to FIs, amounting to over 10 percent of its Cohesion policy
allocation; in Lithuania, FIs amounted to around 0.2 percent of GDP in 2007-13.
• There are numerous models of governance for financial instruments, partly reflecting
the scope of the OPs that offer them, but also involving more complex arrangements
than grants.
• In some regions, up to five different OPs offer financial instruments, often for similar
purposes.
5.1 Definitions and structures of financial instruments in Cohesion policy
A broad overview of the definition of financial instruments was provided in Chapter 2. A
complexity of the present study is that reporting on financial instruments under Cohesion
policy is framed around the activities undertaken in Operational Programmes and the
conclusion of funding agreements between Managing Authorities and fund managers.
Commission analysis of financial instruments distinguishes between holding funds and
specific funds – with both ‘counted’ as financial instruments in the Commission’s Summary
of data (European Commission, 2017). The investment activity is at the level of the specific
fund which may offer one or more financial products (i.e. loans, guarantees, equity); in
other words, the number of specific funds is not the same as the number of financial products
offered.

ESPON 2020 32
Table 5-1: Number of financial instruments (funding agreements) – EU28 (2007-13)
Number of financial
instruments
Holding Funds
(HF)
Specific Funds
(SF)
SF implemented
directly
SF implemented
under HF
1058 77 981 469 512
Source: European Commission (2017) Summary of data on the progress made in implementing financial instruments (at closure).
Box 5-1: What is a financial instrument in Commission reporting?
Quantifying the use of financial instruments is not straightforward. FIs were not defined precisely in the 2007-13 Structural Funds regulations. The General Regulation stated that to qualify as a financial engineering instrument, an OP contribution must target the specific final recipients/type of investments referred to in Article 44 (enterprises and urban development funds) and take the form of repayable investments (i.e. equity, loans and/or guarantees). Article 43(2) of the Implementing Regulation specified that co-financed financial engineering instruments must be set up either as independent legal entities governed by agreements between the co-financing partners or shareholders, or as a separate block of finance within a financial institution.
The template monitoring report provided with the February 2012 revised COCOF note (Guidance Note on Financial Engineering Instruments under Article 44 of Council Regulation (EC) No 1083/2006 COCOF_10-0014-05-EN (12/02/2012)) supplied a form for managing authorities to complete and submit with their AIRs. This invited information on Holding Funds (Form I) and on Financial Engineering Instruments /Financial Intermediaries and provided a box for the ‘total number of financial engineering instruments supported (no. of agreements signed)’. Member States have reported different circumstances in different ways:
• funding from two different OPs into one instrument has been reported variously as one FI (e.g.
Hungary) or two FIs (e.g. UK).
• some entries represent different tranches of funding to the same FI, but were reported separately,
perhaps because they involved a new funding agreement, e.g. Poland.
• a fund implemented locally with the same terms and conditions by many financial intermediaries is
reported as many FIs, though it may essentially be only one ‘financial product’ – e.g. Hungary.
The notion of ‘expenditure’ is more complex for financial instruments than for grants. This is
illustrated in Figure 5-1. For grants, commitments are made to the selected firm or project,
and this is the beneficiary of ultimate payments. For financial instruments, commitments are
made to holding funds and/or specific funds and these funds are the beneficiaries. The firms
or projects which ultimately receive the loan, equity or guarantee from the financial
intermediary are the final recipients of support.
This distinction partly accounts for the over-capitalisation of financial instruments early in the
2007-13 period; Managing Authorities could avoid, or at least postpone the prospect of
decommitment under N+2/3 by committing funds to financial instruments. Related, by the end
of the 2007-13 period, levels of commitment to FIs in some countries were substantially lower
than they had been in previous years. (Wishlade, 2018). This in turn has implications for the
concept of ‘uptake’ which is explored in this study.

ESPON 2020 33
Figure 5-1: Financial flows under grants and financial instruments
Enterprises & projects
Specific fund Specific fund
Enterprises & projects
Grants
Holding fund (optional)
Specific fund
Enterprises & projects Enterprises & projects
Financial instruments
Managing Authority Managing Authority
Commitments
Investments in final recipients
Beneficiaries
Source: authors
This distinction between beneficiaries and final recipients is also important for the data
analysis. A critical issue concerns the limited obligations on reporting below the level of
beneficiaries: for grants, fine-grained information is available on location, sector, size and
other characteristics of the ‘target’ – not least because there are State aid compliance
obligations to be met. By contrast, for financial instruments, the information available is much
more limited, with very basic information such as the number of final recipients often not
systematically reported.
5.2 Scale of financial instruments in Cohesion policy
In terms of data analysis, the focus of this study is on 2007-13, largely reflecting that this
programme period has closed and therefore improved data availability. The following
‘headline’ figures emerge from this period (European Commission, 2017):12
• 25 Member States had established co-financed FIs in 2007-13 (Croatia, Ireland and
Luxembourg had not) involving support from 192 OPs (including one cross-border-
cooperation OP).
12 Note that this data was said still to be subject to change as not all final closure reports had been
approved by the time of the Summary of data report publication.

ESPON 2020 34
• Some €17 billion in OP contributions had been committed to FIs (including €11.5 of
Structural Funds), of which €15.2 billion had reached final recipients – an overall
‘absorption rate’ of almost 93 percent of OP contributions, an increase of 20 percent
compared to what was reported at the end of 2015.
• 77 holding funds and 981 ‘specific’ funds had been set up.
• Most of the funds provided support to enterprises – and all Member States using FIs
supported enterprises; 11 Member States financed urban development and 9 Member
States supported energy efficiency.
There are wide variations between Member States, both in their use of FIs (commitments)
and levels of absorption (investment in final recipients):
• Italy alone accounted for over 29 percent of all OP contributions paid to FIs (€4.9 billion)
by end March 2017.
• Other large Member States had also made significant payments to FIs by end March
2017 including Germany (€1.7 billion) and the UK (€1.6 billion); however, payments are
not directly related to country size, with Greece and Poland also each paying over €1
billion, but France just €442 million.
• In 18 countries, over 90 percent of monies paid to FIs had been invested in final
recipients, with Belgium, France, Lithuania Portugal and Romania all achieving full
absorption. The lowest absorption rates are found in Spain (60 percent) and the
Netherlands (74 percent), while the cross-border programme FI reported zero
absorption.
More generally, there are significant differences in the importance of FIs. On average, EU
Member States committed €426 million (EU amounts) to financial instruments, amounting to
3.4 percent of total Cohesion policy allocations, 0.013 percent of GDP and €23 per head over
the period 2007-13. No clear pattern emerges from Table 5-2 which considers different
measures of the significance of FIs in relation to EU averages.
Table 5-2: Measuring the significance of OP contributions to FIs (EU amounts)
Above EU av. contributions to
FIs (€m)
Above EU av. contributions to FIs as % of Cohesion
policy allocations
Above EU av. contributions to FIs as % of GDP 2007-
13
Above EU av contributions to FIs
€ per head 2007-13
EU av 462 EU av 3.4 EU av 0.013 EU av 23
IT 3114 IT 11.1 LT 0.193 LT 135
PL 1113 BE 8.1 BG 0.120 GR 98
DE 1101 DK 7.7 EE 0.108 EE 93
GR 1081 UK 7.3 HU 0.108 SI 80
ES 768 LT 6.2 LV 0.107 HU 76
HU 759 GR 5.3 GR 0.071 LV 76
UK 722 BG 4.9 SK 0.069 SK 60
SE 4.7 SI 0.064 IT 52
DE 4.3 PL 0.044 BG 44
SI 4.0 IT 0.030 PT 35
EE 3.7 MT 0.028 PL 29
LV 3.5 RO 0.022 MT 25
CZ 0.021
CY 0.015
Source: Authors’ calculations from European Commission (2017); https://cohesiondata.ec.europa.eu/

ESPON 2020 35
Nevertheless, it can be said that:
• Italy and Greece made ‘above average’ OP contributions to FIs on all measures.
• Finland, France, the Netherlands and Austria made below average contributions to FIs
on all measures (and Ireland, Luxembourg and Croatia made no OP contributions to
FIs).
• This dispersed ‘pattern’ is reflected in Figure 5-2, which plots the relative economic
importance of FI contributions (percent of GDP) against the share of FIs in the
Operational Programme, while illustrating the absolute scale of contributions for each
country.
Figure 5-2: The relative importance of Cohesion policy FIs, 2007-13 (EU amounts only)
EU €3000m
€1500m
€500m
IT
PL
DE
GR
ES
HU
UK
LT
PT
SK
BG
FR
RO
BE
SILV
CZ
EE
SE
FI
DK
NL
CY
AT
MT
0
2
4
6
8
10
12
0.00 0.05 0.10 0.15 0.20OP c
om
mitm
ents
to F
is a
s %
of
Cohesio
n
policy a
llocations
OP commitments to FIs as % of GDP
Scale and relative scale of Cohesion policy FIs 2007-13
Note: FIs are not offered in all parts of Belgium, Austria or the Netherlands.
Source: Authors’ calculations from European Commission (2017); https://cohesiondata.ec.europa.eu/
5.3 The governance arrangements for financial instruments in Cohesion policy
ESIF FIs are implemented using different governance models which operate at different
territorial scales, reflecting the territorial remits of the Operational Programmes but also
more complex institutional relations, such as contributions from regional OPs to nationwide
FIs. Three categories can be identified, namely those where:
• FIs are operated under national governance only – i.e. through OPs where the
Managing Authority is part of central government
• FIs are operated under regional governance only – i.e. through OPs where the
Managing Authority is a subnational authority
• FIs are operated under both national and regional governance.
In seven Member States, FIs in 2007-13 were only offered under national OPs, reflecting the
absence of regional OPs, and governance was on a nationwide basis in the sense that there

ESPON 2020 36
was no devolution of responsibility to subnational authorities or explicit earmarking of funds
between regions. With the exception of Cyprus, all the countries concerned were covered by
the Convergence objective. Within this group there are, however, considerable variations in
the use of holding funds, the extent to which ESF is used (in the Baltic countries and
Slovenia), the number of funds and the number of OPs offering financial instruments (the
Baltic countries and Slovenia all offering FIs under more than one OP).
Table 5-3: National governance of ESIF FIs only (2007-13)
MS National OPs offering
FIs
CY 1 national JEREMIE HF comprising 4 specific funds 1
EE No holding funds. 5 ERDF and 1 ESF specific funds 3
LT 1 ESF HF comprising 1 specific fund; 1 JESSICA (ERDF) HF comprising 7 specific funds; 1 ERDF HF comprising 16 specific funds; 1 JEREMIE
comprising 5 specific funds; 1 specific fund
3
LV 1 national JEREMIE HF with 10 specific funds; 3 national ERDF specific
funds; 1 national ESF specific fund 2
MT 1 national JEREMIE HF with 1 specific fund 1
RO 1 national JEREMIE HF with 3 specific funds 1
SI 1 national HF comprising 2 ESF and 3 ERDF specific funds; 1 specific fund 2
Source: Authors, using European Commission (2017) data.
In seven countries, the governance of FIs was at the regional level only. In France, Sweden
and the United Kingdom, this resulted in nationwide availability of FIs through a single ROP in
the region. By contrast, in Austria, Belgium and the Netherlands, the policy choices made by
ROP managing authorities meant that FIs were not made available in all regions. In Denmark,
two national OPs financed FIs, but the implementation of them was at the regional level.
Table 5-4: Regional governance of ESIF FIs only (2007-13)
MS Regional/Sub-national/other Coverage
AT 2 ROPs with ERDF specific funds Partial: 2 Länder out of
9
BE 3 ROPs – 2 in Wallonia (8 specific funds) and 1 in Brussels (1 specific
fund)
Partial: no FIs in Flanders
ROP
DK 2 national OPs (1 ESF, 1 ERDF) fund 9 regional specific funds (4 ESF, 5
ERDF) Nationwide
FR All ROPs have HF and/or specific funds Nationwide
NL 3 ROPs: 1 JESSICA HF comprising 2 specific funds; 7 specific funds Partial: 3 out
of 4 ROPs
SE 8 ROPs operate specific funds Nationwide
UK All ROPs have HF and/or specific funds Nationwide
Source: Authors, using European Commission (2017) data.
In the remaining countries the situation was more complex. Both national and subnational
financial instruments were in place in 2007-13. In some cases, such as Italy and Greece, the
‘national’ financial instruments only covered part of the territory – this is the case for two

ESPON 2020 37
significant Italian multiregional OPs (MOPs) managed by national ministries, but applicable
only to the Convergence regions in the Mezzogiorno. Similarly, in Greece and Poland, for
example, some financial instruments were managed by national authorities under OPs that
covered several NUTS 2 regions, but not the entire national territory. Elsewhere, national OPs
offering FIs covered the entire national territory (for example Germany and Spain), but FIs
could also be operated at the subnational level providing total or partial coverage of FIs under
ROPs.
Table 5-5: National and subnational governance of ESIF FIs (2007-13)
MS National Regional/Sub-national/other
BG National JEREMIE HF with 5 specific
funds
A JESSICA with 2 Urban Development Funds
(UDF), one specifically for Sofia
CZ 2 FIs under the national ‘enterprises and innovation’ OP, which does not
cover Prague
JESSICA Moravia-Silesia, with 2 UDFs
JESSICA Fund for Prague (housing)
DE 4 national ESF FIs
ERDF FIs offered by 14 Lander
Includes a JESSICA Fund in Hessen, also other
city-based FIs such as 5 FIs in Berlin
EL Most FIs set up through HFs with contributions from a combination of national (Convergence region only),
fully national and regional OPs
Most FIs set up through HFs with contributions from a combination of national (Convergence
region only), fully national and regional OPs
ES 1 national OP with FIs FIs under regional OPs
FI 1 national FI to which 4 regional OPs
contribute.
1 regional FI (Oulu)
IT Several central government managed multi-regional OPs in Convergence regions (Puglia, Campania, Calabria
and Sicilia) offer FIs
Many ROPs offer FIs
JESSICA UDFs in Campania and Sicily
HU The NOP Economic Development (which covers six regions and excludes central Hungary) and the Central Hungary (inc. Budapest) ROP
both contribute to a HF.
7 regional OPs contribute to a centrally
managed FI
PL ESF NOP with FIs implemented via regional bodies. 1 ERDF NOP supporting FIs, 1 ERDF MOP Eastern
Poland only
Many FIs under regional OPs
4 JESSICA FIs (Slaskie, Wielkopolska,
Pomorskie, Zachodniopomorskie)
PT 1 NOP with FIs (Thematic factors of competitiveness) - covers
Convergence regions only
4 regional OPs with FIs
5 regional OPs contribute to a JESSICA HF
SK 1 JEREMIE HF with 12 specific funds (funded from 3 OPs – one of which covers the Convergence regions only, one of which covers Bratislava only
and one nationwide)
See previous – one specific fund under JEREMIE
is for Bratislava region only
JESSICA fund funded from 3 OPs, one for Western Slovakia, Eastern Slovakia and Central Slovakia, one for Bratislava and from the
Competitiveness and Economic Growth OP for
the Convergence regions
Source: Authors, using European Commission (2017) data.
The overall picture in terms of the number of Operational Programmes offering financial
instruments is both complex and inconsistent. Moreover, in the national (Table 5-3) and mixed

ESPON 2020 38
governance categories (Table 5-5), in particular, multiple Operational Programmes may be
offering financial instruments in a given NUTS 2 region, often with similar investment targets
and sometimes also with similar financial products. The extent to which multiple OPs offered
FIs in the same region is illustrated in Map 5-1. This shows that in Germany, much of central
and eastern Europe, and most of southern Europe, at least two OPs are involved in offering
FIs. In reality, there may be limited or no overlap, for instance where one programme
addresses urban development and another enterprise support.
Map 5-1: Operational Programmes offering financial instruments at NUTS 2
Source: authors
5.4 Comparative perspectives?
There is scant discernable or consistent pattern to the scale and governance of Structural
Funds financial instruments across the Member States in 2007-13. The extent to which they
are used, and how, is the product of a range of factors related to the size of OP allocations,
experience with Structural Funds implementation, the presence of subnational structures to
implement Structural Funds, domestic use of financial instruments, the existence financial
institutions, such as national or regional promotional banks, as well as diverse policy choices
and OP priorities.

ESPON 2020 39
In practical terms, these factors play out in different way in different countries (and within
them). For example, under some OPs the modest scale of allocations led managing
authorities to dismiss the use of FIs because of their perceived complexity, as in Flanders
(BE), whereas in London the very fact that the ERDF budget was small underpinned the
decision to use most of it in the form of FIs that would generate a legacy. Similarly, in some
Member States the approach to FIs was to introduce new instruments operationalized through
new implementation mechanisms, whereas in others, Structural Funds funding was used to
augment existing domestic funding streams under existing domestic institutional
arrangements.
ESPON 2020 40
6 The territorial distribution of FIs
Key points
• Analysing the regional distribution of financial instrument spend is complex because the
geography and governance of FIs varies and regional data is not always available.
• In most countries, FIs are offered from a (sometimes overlapping) mix of national,
multiregional and regional OPs.
• The focus of the study is on investment in final recipients – firms, urban development
projects etc.
• Comparing FIs to grants, regions within Italy, Belgium, Denmark the UK and Greece
invested the largest shares of Structural Funds in the form of FIs (but there are marked
internal differences within these countries).
• There are marked differences between regions in levels of investment in enterprises,
with, in general, much higher levels in the Convergence regions than elsewhere (not
including co-financing).
• Investment in urban development and energy projects accounts for a small proportion
(about 15 percent) of overall FI expenditure and is concentrated in a few countries only.
• In terms of the use of different financial products, countries and regions differ in their
choices, with some offering all three types. In general, there is a preponderance of loan
finance in central and eastern Europe, the Baltic countries, Belgium Denmark, Greece
and Spain; a dominance of equity in Portugal and Sweden; a mix of loans and equity in
the UK; a mix of all three product types in Germany, and France; and a mix of loans and
guarantees in Italy.
• In terms of FI ‘uptake’, there are ‘pockets’ of high absolute and high relative uptake in a
number of regions in Italy, the United Kingdom, Belgium, Greece, Bulgaria and
Germany. By contrast, the regions where there is low absolute and low relative uptake
are extensive, covering France, Sweden, Finland, much of Germany and Denmark, as
well as parts of Spain and Romania.
6.1 Introduction
Analysing the regional distribution of financial instruments is an important but complex task.
The complexity arises from a number of conceptual and practical issues.
The notion of a ‘financial instrument’. As described in Chapter 2, the term ‘financial
instrument’ is used quite loosely and often interchangeably with ‘financial product’ (loan,
guarantee, equity). Different types of reporting to the Commission use different classifications
of form of finance.
The geographical scope of the Operational Programmes (OPs) and the financial
instruments funded from them differs between countries and sometimes within them. Most
OPs offering financial instruments cover a single NUTS 2 region; however, in financial terms

ESPON 2020 41
these account for less than half of total commitments to FIs and investments in final
recipients.
Partly related to issues of geographical scope, governance arrangements for FIs differ.
The norm is for regional programmes to be managed at the subnational level, but some
nationally-managed programmes cover all or multiple NUTS 2 regions, as discussed in
Chapter 5. Beyond this, implementation arrangements vary considerably with direct
implications for data availability and analysis.
The concept of ‘expenditure’ is more complex for financial instruments than for grants.
For grants, commitments are made to the selected firm or project, and this is the beneficiary
of ultimate payments. For financial instruments, commitments are made to holding funds
and/or specific funds and these funds are the beneficiaries. The firms or projects which
ultimately receive the loan, equity or guarantee from the financial intermediary are the final
recipients.
6.2 The scope and governance of Operational Programmes offering financial instruments
The analysis and mapping of the geographical distribution of expenditure is an important part
of this study. A crucial issue is that many of the Operational Programmes offering financial
instruments do not coincide with single NUTS 2 regions (though this is the ‘norm’ in terms of
number of programmes). This would be the simplest and ‘ideal’ scenario from the perspective
of a territorial analysis. However, as Table 6-1 shows, this occurs in only nine of the 25
countries offering FIs; of these nine, five are Member States where the NUTS 2 and NUTS 0
levels coincide (CY, EE, LT, LV, MT). In the majority countries the geographical scope of OPs
offering FIs is either mixed and or overlapping.
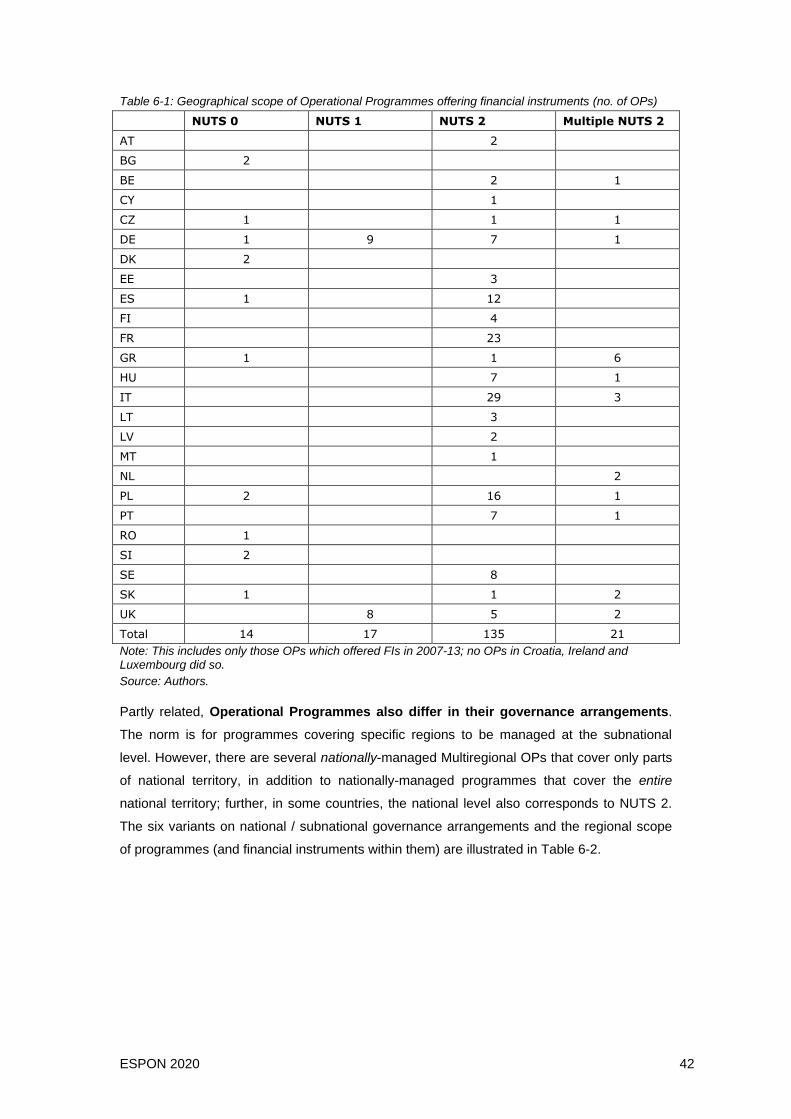
ESPON 2020 42
Table 6-1: Geographical scope of Operational Programmes offering financial instruments (no. of OPs) NUTS 0 NUTS 1 NUTS 2 Multiple NUTS 2
AT 2
BG 2
BE 2 1
CY 1
CZ 1 1 1
DE 1 9 7 1
DK 2
EE 3
ES 1 12
FI 4
FR 23
GR 1 1 6
HU 7 1
IT 29 3
LT 3
LV 2
MT 1
NL 2
PL 2 16 1
PT 7 1
RO 1
SI 2
SE 8
SK 1 1 2
UK 8 5 2
Total 14 17 135 21
Note: This includes only those OPs which offered FIs in 2007-13; no OPs in Croatia, Ireland and Luxembourg did so.
Source: Authors.
Partly related, Operational Programmes also differ in their governance arrangements.
The norm is for programmes covering specific regions to be managed at the subnational
level. However, there are several nationally-managed Multiregional OPs that cover only parts
of national territory, in addition to nationally-managed programmes that cover the entire
national territory; further, in some countries, the national level also corresponds to NUTS 2.
The six variants on national / subnational governance arrangements and the regional scope
of programmes (and financial instruments within them) are illustrated in Table 6-2.

ESPON 2020 43
Table 6-2: National and regional OPs depending on geographical coverage (EU amounts, € million)
Gov_Geo
code
Definition Commitment / payment to
FIs
% of total
payments
Investments in final
recipients
% of total investments in final
recipients
National Operational Programmes
C_N0 Nationwide
NOPs
1371 12.3 1081 10.7
C_N2 NOPs where NUTS 0 and NUTS 2 are
coterminous
713 6.4 681 6.7
C_MN2 National Multiregional OPs (cover only some NUTS 2
regions)
3304 29.7 2897 28.6
Regional Operational Programmes
R_N1 Regional OPs at
NUTS 1 level
1082 9.7 1063 10.5
R_N2 Regional OPs at
NUTS 2 level
4451 39.9 4239 41.8
R_MN2 Regional OPs covering groups of NUTS
2 regions
224 2.0 180 1.8
Note: For the ‘orange’ OP types data there is no published reporting at NUTS 2.
Source: authors.
The national OPs offering financial instruments in 2007-13 are illustrated in Map 6-1. An
important issue for the study was that the scale of expenditure where there is no
published reporting at NUTS 2 is large. Nationwide Operational Programmes (C_N0) and
Multiregional OPs (C_MN2) account for around 40 percent of all commitments to financial
instruments and investment from those FIs in final recipients (see Table 6-2). The OPs
concerned are heavily concentrated in eastern and southern Europe and in some cases
account for all or most financial instrument expenditure in that country. For example, in
Bulgaria, Romania, the Czech Republic, Greece, Hungary, Portugal and Slovakia, over 60
percent of investment in final recipients was under multiregional OPs. Most significant in
overall financial terms are the Italian national OPs offering financial instruments in the
Mezzogiorno regions. These Italian OPs account for around 10 percent of all investments in
final recipients in the form of financial instruments in the EU.

ESPON 2020 44
Map 6-1: National Operational Programmes offering financial instruments (by NUTS scope)
Source: authors.
Regional OPs offering financial instruments are illustrated in Map 6-2. These are mainly
NUTS 2 regions, but different geographies apply in the Netherlands and Belgium, as well as
in parts of Germany and the UK. In addition, Malta, Cyprus, Estonia, Latvia and Lithuania are
NUTS 2 areas.

ESPON 2020 45
Map 6-2: Regional Operational Programmes offering financial instruments (by NUTS scope)
Source: authors.
6.3 The regional distribution of financial instrument investment
There are different ways of assessing the use or ‘uptake’ of financial instruments. As
mentioned before, spending on financial instruments is a two-stage process: first, the
commitment or payment of funds to an FI – essentially a managed fund; and second, the
investment of those monies for the benefit of final recipients (firms, urban development
projects, etc).
The focus of the discussion below is on the investment in final recipients. This is partly
because it is only at this level that spend can have an impact, but also because there was no
earmarking of funds for commitments under national Operational Programmes, so no analysis
of regional commitments for these programmes is possible. Most countries achieved relatively
high levels of absorption of financial instruments by the time of programme closure so the
differences between commitments and investment in final recipients is generally limited.
Indeed, for all three policy areas, over 90 percent of the sums allocated had been invested by
the time of programme closure (see Table 6-3).

ESPON 2020 46
Table 6-3: OP contributions reaching final recipients and remaining in funds 2007-13 (€m at closure)
OP contributions paid to HF or specific
funds (€m)
OP contributions paid to final recipients
(€m)
OP contributions remaining in
funds (€m)
Absorption at
closure (%)
Absorption at end 2015
(%)
Enterprises 14058 13058 1000 92.8 76.9
Urban
development
1596 1438 157 90.1 68.6
Energy
Efficiency 730 696 34 95.3 50.5
Source: Wishlade (2018).
In part, this suggests a considerable acceleration of activity in the final stages of the
programmes, since only around 75 percent of funds committed had been invested by the end
of 2015,13 and much less in the case of urban development and energy efficiency and
renewables. On the other hand, some countries decommitted fairly substantial sums from OP
contributions to FIs. For example, in Greece, the commitment reported in 2015 was €1,789
million, but at closure was €1,081 million. Similarly, in Spain commitments were reduced from
€1,273 million to €989 million and in Portugal from €854 million to €610 million.
As described earlier, regionalised information on financial instrument investment in final
recipients is not reported for FIs implemented on a nationwide or multiregional basis. The
Managing Authority survey described in Chapter 2 yielded regionalised information for a
significant share of expenditure under national and multiregional financial instruments. Where
this information was not available, expenditure data was regionalised on the basis of relevant
proxies.
6.3.1 How does expenditure on financial instruments compare with grants?
Comparisons of financial instrument spend between countries and regions are complicated by
the very different orders of magnitude of Structural Fund spending and differentiated
cofinancing rates. This can partly be addressed by setting investment in final recipients
(Structural Fund amounts) against total spend under the ERDF and ESF. This is illustrated in
Map 6-3. This shows very varied patterns of investment between countries, but in some cases
also within them.
Italy, Belgium, Denmark the United Kingdom and Greece all committed significantly
more than the EU average on financial instruments as a share of Cohesion policy
allocations (see Figure 5-2 in Chapter 5). Not surprisingly, regions within these countries are
amongst those that invested the largest shares of Structural Funds in the form of FIs.
However, there are very marked internal differences. For example:
13 European Commission (2016) Summary of data on the progress made in financing and implementing financial engineering instruments reported by the managing authorities in accordance with Article 67(2)(j) of Council Regulation (EC) No 1083/2006.

ESPON 2020 47
• In Italy, in Abruzzo, Molise and Sardegna, over 25 percent of Structural Funds
payments were in the form of FIs, but in Basilicata and Marche FIs only accounted for
3-5 percent of spend.
• In Belgium, FIs are not offered at all in Flanders and spend is very modest in the
Brussels region. However, within the Wallonia Regional Competitiveness and
Employment (RCE) OP which covers four NUTS 2 regions, there are substantial
differences in the use of FIs, with FIs in Liège accounting for over 25 percent of
Structural Fund payments, but just 3-5 percent in the neighbouring province of
Luxembourg.
• In the United Kingdom, in Manchester and London more than 25 percent of Structural
Fund spend was in the form of financial instruments, but in some regions, no
investment at all was made in the form of FIs.
Map 6-3: Financial instruments in total ERDF and ESF spend
Source: authors.
The vast majority of Structural Fund expenditure on financial instruments is under the ERDF;
the European Social Fund accounted for only 4.3 percent of Structural Funds invested
in final recipients through financial instruments. Eight countries used the ESF to finance
FIs in 2007-13 (all also used the ERDF), but the amount invested in final recipients from the

ESPON 2020 48
ESF amounted to just €438 million, compared with €9,686 million under the ERDF. Almost 80
percent of the ESF spend was accounted for by Germany and Italy (see Table 6-4). All three
Baltic countries operated ESF financial instruments in 2007-13, while Poland and Italy had a
large number of modestly sized funds. Given the very small size of the funds allocated to
financial instruments under the ESF, and the fact that their objectives in this area overlap with
the ERDF (support for enterprises, typically microenterprises and/or individuals starting up in
business), ESF FIs are not considered separately in this report.
Table 6-4: Use of financial instruments under the European Social Fund 2007-13
Number of specific
funds
Average fund size
(ESF amounts) €m
ESF OP contributions invested in final
recipients (€m)
Germany 4 33 114
Denmark 4 6 20
Estonia 1 6 6
Italy 17 15 232
Lithuania 1 14 12
Latvia 1 13 10
Poland 24 1 33
Slovenia 2 11 10
Source: European Commission (2017)
6.3.2 How important are FIs in real terms?
As Map 6-3 shows, there are significant differences in the importance of financial instruments
relative to overall Structural Fund spend – with investment in final recipients in a number of
regions exceeding 15 percent of Structural Fund payments (against an average of around 3.4
percent). However, relative to the wider economy, spend on financial instruments is not
significant: on average it amounted to 0.013 percent of GDP, and in only a few countries and
regions – Lithuania and parts of Hungary, Greece, Bulgaria and Italy – does it exceed 0.1
percent of regional GDP (see Map 6-4).

ESPON 2020 49
Map 6-4: Financial instruments invested in final recipients as a percentage of regional GDP (2007-13) (EU amounts)
Source: Authors.
6.3.3 How are financial instruments targeted?
The General Regulation indicated that OP contributions could be used for financial products
such as loans, guarantees and equity in certain policy areas. More specifically, Article 44 (as
amended) envisaged that:
“As part of an operational programme, the Structural Funds may finance
expenditure in respect of an operation comprising contributions to support any
of the following:
a) financial engineering instruments for enterprises, primarily small and
medium-sized ones, such as venture capital funds, guarantee funds
and loan funds;14
b) urban development funds, that is, funds investing in public-private
partnerships and other projects included in an integrated plan for
sustainable urban development;15
14 These were sometimes referred to as JEREMIE, typically, but not systematically, when the European
Investment Fund was involved in their design or implementation.
15 These were usually referred to as JESSICA funds.

ESPON 2020 50
c) funds or other incentive schemes providing loans, guarantees for
repayable investments, or equivalent instruments, for energy
efficiency and use of renewable energy in buildings, including in
existing housing.”
In the Commission Summary of data (European Commission, 2017), financial instruments are
classified as Article 44 a, b or c. In practice, however, the differences are not always clear cut,
with funds to energy efficiency in urban areas sometimes classified as 44b and support for
firms investing energy efficiency sometimes classed as 44a and sometimes 44c.
More importantly in terms of contrasting the use of financial instruments and grants, these
three Article 44 groups do not map directly to the classifications used elsewhere in reporting
to the Commission; this makes comparisons of the use financial instruments with, or as a
complement to, grants virtually impossible. A brief overview is provided in the Scientific
Annex, but definitional differences and misunderstandings in data reporting undermine the
scope for a fine-grained analysis for the 2007-13 period. Alignment of definitions and a focus
on Thematic Objectives in 2014-20 is likely to facilitate such comparisons. Nevertheless, the
specific circumstances in which financial instruments are suitable policy tools (see Figure 3-1
and discussion on the rationale for FIs) is still likely to make this challenging.
Taking the three policy targets set out in Article 44 of the CPR – a) support for enterprises; b)
urban development and c) energy efficiency and renewables - support for enterprises
accounts for the vast majority. Indeed, some 85 percent of FI investment in final recipients is
accounted for by Article 44a. Of this, around half is in the form of loans.
Figure 6-1: Amounts disbursed to final recipients (€m) and share of total at closure
Source: authors from European Commission 2017.
The amounts invested in enterprises in absolute terms is illustrated in Map 6-5. This shows a
rather different perspective from the share of FIs in total Structural Funds spend (see Map 6-3

ESPON 2020 51
above). This is partly because the much higher Cohesion policy allocations to Convergence
regions conceals the scale of spend.
Map 6-5: Investment in final recipients – financial instruments for enterprises (EU amounts)
Source: authors.
In absolute terms, there are marked differences between regions in levels of investment in
enterprises, with, in general, much higher levels in the Convergence regions than elsewhere.
To this extent, the regional distribution partly reflects the availability of funding. As a result,
and looking at countries where FI investment is a significant share of Structural Funds
spend, the following points emerge:
• In Italy, Sardegna is prominent in terms of absolute investment through financial
instruments for enterprises (as well as relative to Structural Funds as a whole), with
more that €250 million invested through FIs in 2007-13; however, spend in Molise
and Abruzzo is less significant in absolute than relative terms, and investments in
Campania, Sicilia and Puglia are more significant.
• In Belgium, investments in the Walloon RCE programme are less significant in
absolute terms than those under the Walloon Convergence programme for Hainaut.
• In Greece, Map 6-5 also suggests pockets of high in certain regions – notably Attiki.

ESPON 2020 52
• In the United Kingdom, FI investment is overall less significant when viewed in
absolute terms, but in West Wales and the Valleys, the absolute spend is more
prominent reflecting its Convergence region status.
• Elsewhere, high absolute levels of investment through FIs to enterprises emerge in
Sachsen-Anhalt and Lithuania.
These data need to be treated with caution as they give only a partial perspective on
expenditure, and this for two reasons. First, the data only concern the EU amounts of spend;
these sums must be cofinanced by the Member States, and rates of cofinancing differ
between countries and regions, ranging from 50 percent in most RCE regions to 85 percent in
most Convergence regions. This in turn means that total OP investments in FIs would be
doubled in, for example, the French, Finnish and Swedish regions, whereas in countries such
as the Baltic states, Poland and Hungary, the inclusion of national contributions would
increase absolute amount by only around 17 percent. Second, this presentation of the data
takes no account of the underlying regional economy.
Turning to investment in urban development and energy projects, as noted above, this
accounts for a small proportion (about 15 percent) of overall FI expenditure and is
concentrated in a few countries only. At national level, the Structural Fund amounts invested
in final recipients are shown in Table 6-5. As can be seen, overall levels of spend are modest
with a total of just over €1.5 billion spent over 2007-13.
Table 6-5: FI investments in urban development and energy projects, EU amounts (€m) 2007-13
Urban development Energy efficiency
and renewables Total
Bulgaria 25.6 25.6
Czech Republic 37.9 37.9
Germany 28.8 5.5 34.3
Denmark 6.8 6.8
Estonia 17.7 17.7
Greece 98.2 88.8 187
Spain 116.0 116
France 0.5 0.5
Italy 185.6 54.0 239.6
Lithuania 132.6 132.6
Netherlands 5.9 4.8 10.7
Poland 242.4 242.4
Portugal 97.8 97.8
Slovakia 208 208
United Kingdom 105.4 56.6 162
Total 1076 443 1519
Source: European Commission, 2017.
The scale of investments in urban development and energy projects at regional level is
illustrated in Map 6-6. This shows that, in practice, such projects are concentrated in a few

ESPON 2020 53
regions. This is scarcely surprising given the nature of the projects targeted through urban
development funds.
In absolute terms, the most prominent are Lithuania, Wielkopolskie and Ṥląskie (PL), eastern
and western Slovakia, Campania and Sicilia (IT), Andalucía (ES) and London (UK).
Map 6-6: Investment in final recipients: financial instruments for urban and energy-related investments (EU amounts)
Source: authors.
6.3.4 Which financial products are used where?
As described in Chapter 2, financial products offered through Cohesion policy FIs differ widely
in their application and mode of implementation. This results in widely varying numbers and
scales of financial products (see Table 6-6). More specifically:
• Guarantees are the most used product in terms of number of financial products
offered, though they are not used at all in some countries; although guarantees
account for 53 percent of the number of products offered, they only account for 25
percent of the amount invested in final recipients (in this context, the amounts set
aside to cover potential loan defaults).

ESPON 2020 54
• Loans are much more widely used than guarantees in the sense that most countries
offering FIs offer loan products, but also insofar as they account for 57 percent by
value of investment in final recipients.
• Equity is the least used financial product in numerical terms – accounting for just 18
percent of all investment in final recipients; however, the average investment is
substantially higher – almost €0.5 million in the case of equity investment in
enterprises and over €2 million for urban development projects.
Table 6-6: Number and scale of financial products offered by policy objective (2007-13)
Enterprises Urban Energy Total
No. €m Av. € No. €m Av. € No. €m Av. € No. % €m %
L 110,539 6498 58,785 1,613 1348 835,710 52019 646 12,419 164,171 45 8492 57
G 193,095 3717 19,250
193,095 53 3717 25
E 5,319 2631 494,642 26 54 2,076,923 23 9 377,826 5,368 1 2694 18
Note: L, G and E refer to loans, guarantees and equity, respectively.
Source: Authors’ calculations from European Commission, 2017.
These averages conceal quite wide variations between Operational Programmes – although
the overall pattern is consistent: that there are large number of guarantees, but their value is
low; there are few equity investments, but their value is generally high.
Countries and regions differ in their choice of financial product, with some offering all three
types. Map 6-7 provides an overview, based on the financial products that account for the
largest share of investment in final recipients. This shows:
• a preponderance of loan finance in central and eastern Europe, the Baltic countries,
Belgium Denmark, Greece and Spain;
• dominance of equity in Portugal and Sweden;
• a mix of loans and equity in the UK; a mix of all three product types in Germany and
France; and a mix of loans and guarantees in Italy.

ESPON 2020 55
Map 6-7: Dominant financial product types by amount invested in final recipients (EU amounts)
Source: authors.
6.3.5 Types of final recipients
Data on numbers of final recipients is not published in the Summary report (European
Commission, 2017). It is sought from Managing Authorities as part of the reporting process,
but only on a voluntary basis. As well as a total figure for number of final recipients, reporting
also seeks the number of final recipients of the following types:
• Large enterprises
• SMEs, of which microenterprises
• Individuals
• Urban projects
• Other recipients

ESPON 2020 56
In practice, the number of final recipients supported was not reported systematically (in just
59 percent of specific funds was this done). As shown in Table 6-7, for only 75 percent of total
investment are the number of final recipients known and the figures plausible.16
Table 6-7: data availability on number of final recipients by number of funds and investment in final recipients
Number of specific funds (with
or without holding funds
Investment in final recipients
(EU amount) €m
Total 1437 €10242
Data on number of final
recipients 849 €7726
Availability of data 59 percent 75 percent
Source: authors' calculations from Commission Summary of Data (voluntary information).
Focusing only on those funds reporting plausible information on number of final recipients,
Table 6-8 illustrate the breakdown of information available on support for enterprises.
16 For example, in several instances, the number of final recipients was very small in relation to the level of investment in final recipients and closer investigation of the instrument suggested that the number of financial intermediaries had been reported instead.

ESPON 2020 57
Table 6-8: Target final recipients by type – support for enterprises (Article 44a)
Large
enterprises
Micro-
enterprises
Other
SMEs
Individuals Urban
projects
Other Ave.
investment
per final
recipient
€'000 (SF
amount)
AT
33 262
BE 3846 487 39
BG 2 4111 3877 35
CY 353 156 31
CZ 259 3774 25
DE 37 1528 3142 158
DK 11 85 126
EE 14 529 276 138 104
ES 203 2197 2150 68
FI 15 6195 4
FR 2838 8974 1463 11
GR
10299
51
IT 166 52641 44568 31039 3 15
LT
2152 5211 223 35
LV 20 610 1648 62
MT 516 137 14
NL 75 163 50
PL 23348 6044 3239 452 20
PT 4 3857 6958 24
RO
2094 2919 42
SE 1 284 53 181
SI 2743 1967 31
SK 359 558 97
UK 358 2958 1 119
Note: (i) Italy reports three final recipients as urban projects; this may or may not be a reporting error (ii) the total of microenterprises and other SMEs can be considered an accurate count of SMEs, but it is not clear whether reporting systematically subdivided SME assistance to account for microenterprises.
Source: authors' calculations from Commission Summary of Data (voluntary information).
In practice, across the financial instruments for which data is reported, over 85 percent of final
recipients are either microenterprises or larger SMEs. However, large firms do feature in
some countries and in Estonia account for over 4 percent of final recipients; in Italy, Poland
and France individuals make up a significant share of final recipients.
For urban development FIs (Article 44b), the data on final recipients is not particularly
illuminating – almost all final recipients are classified as 'urban projects' or 'other recipients'.
This means that there is no scope to identify, for example, the extent to which urban
development programmes provide support through FIs to public or private organisations.
Table 6-9 illustrates the breakdown of information available on support for urban and energy
efficiency/renewables projects.

ESPON 2020 58
Table 6-9: Target final recipients by type – support for urban and energy efficiency/renewables projects (Article 44b/c)
Large
enterprises
Micro-
enterprises
Other
SMEs Individuals Urban
projects Other Ave.
investment
per final
recipient
€m
BG 34
0.753
CZ 5 1 5 148 0.238
DE 18 12 0.959
GR 21 4.674
IT 21 4.560
LT
779 0.170
NL 8 22 0.196
PL 5 2 8 101 1.193
PT 158 0.619
UK 8 0 36 2.396
Source: authors' calculations from Commission Summary of Data (voluntary information).
6.3.6 Identifying regions with high and low uptake of financial instruments
The methodology for the study requires the identification of regions that are considered to
have high and low 'uptake' of financial instruments; uptake has been interpreted as referring
to the investment in final recipients in the form of financial instruments using Structural
Funds.17 The widely differing scales of Cohesion policy contributions complicate this task
since a comparatively high absolute amount may not be significant where the spend in a
given region is high; conversely, absolute amounts may be small, but represent a large
proportion of total spend. In order to address this, the definition of high and low uptake takes
account of both absolute amounts and the share of those amounts in total Structural Funds
payments. The following thresholds are applied:
• High absolute: investment in the form of financial instruments exceeding €20 million;
• High relative: investment in form of financial instruments exceeding 10 percent of
Structural Fund payments.
The resulting pattern is shown in Map 6-8. This shows ‘pockets’ of high absolute and high
relative uptake in a number of regions in Italy, the United Kingdom, Belgium, Greece,
Bulgaria and Germany.
By contrast, the regions where there is low absolute and low relative uptake are extensive,
covering France, Sweden, Finland, much of Germany and Denmark, as well as parts of Spain
and Romania.
17 This corresponds to "SF contributions invested in final recipients" defined as "Structural Funds (ERDF or ESF) financial support provided to final recipients through the FEI operations" – see Summary of data (European Commission, 2017).

ESPON 2020 59
Map 6-8: High and low uptake of financial instruments (EU amounts)
Source: authors.

ESPON 2020 60
7 Added value and impact at territorial level of ESIF financial instruments
Key points
• The 'uptake' (investment in final recipients) and added value of financial instruments
may differ between types of regions, depending on Structural Funds eligibility,
financial systems, quality of government (QoG) and urban/rurality.
• A single type of Convergence region (low quality of government, bank based,
urban) accounts for 16 percent of all FI uptake; this region type comprises just
three regions: Sicilia, Campania and Attiki.
• Regions in market-based financial systems spend a higher share of Structural Funds
through FIs than those in bank-based or former socialist countries.
• The added value of financial instruments, compared to grants, can be considered in
relation to: sustainability – the extent to which they generate a legacy; and
efficiency – how far FIs generate leverage and fund management costs The
regional distribution of fund managers is also a relevant factor in terms of the
scope for FIs to develop local financial markets.
• Legacy appears higher in regions with low QoG – perhaps because financial
markets work less well and FIs are financing less risky project than elsewhere.
• Although leverage is not easily measured with available data, it can be seen that
guarantees offer significant leverage, more so in urban than rural areas.
• High uptake regions tend to be more efficient in relation to management costs and
fees and have higher rates of legacy than low uptake regions, confirming the view
that critical mass is important.
• Fund managers are concentrated in urban regions, and often in capital regions in
former socialist countries, however, in Poland and Hungary fund management is
more decentralised.
• The 'reach' of financial instruments is greatest in regions with low QoG – ie.
more final recipients are reached by the same amount of funds invested, largely
because loans and guarantees are more likely to be used than equity in regions with
low QoG.
• An exploration of 'model regions' suggests that uptake and added value is sui
generis rather than being capable of offering transposable outcomes or
impacts.
• The key drivers of 'uptake' do not appear to be primarily territory related but the
result of a complex mix of policy choices at national and regional levels.
The focus of this chapter is on exploring the added value that financial instruments can offer
in different types of regions compared to grants. It builds on the regional typology described in
Section 2.4.1 above and uses the regionalised data gathered from the Commission's

ESPON 2020 61
Summary of Data (European Commission, 2017), including the available voluntary data18 and
the information gathered from the Managing Authority survey.
7.1 Added value and impact: definitions
For the purposes of this study, the added value of financial instruments concerns the effects
that financial instruments can have compared to grants. This reflects the rationale for the use
of FIs in place of, or as a complement to grants, discussed in Chapter 3 above. In this
context, the key dimensions of added value that FIs have the potential to offer concern the
following:
• Sustainability. Financial instruments are revolving funds that can be spent again; by
contrast, grants are non-repayable. As such, the legacy reported by Managing
authorities – the sum available for reinvestment is a measure of the added value that
FIs can offer compared to grants. The size of this legacy in relation to funds allocated
to final recipients is therefore a measure for the sustainability of the programme.
• Efficiency. Financial instruments have the capacity to attract funds from sources
beyond the Operational Programme, most obviously in the case of guarantees where
OP funding is earmarked to cover potential defaults on loans, but the loan itself is not
financed from the OP, but rather by a commercial lender. As such, financial
instrument can offer added value, compared to grants, through the leverage of
additional finance, resulting in higher investment. Leverage is a measure of the
efficiency of the financial instrument. At the same time, fund managers require
remuneration so administering financial instruments carries an external expense that
grants do not, as the costs are absorbed by the public administration. Management
costs and fees can be an indicator of the efficiency of the financial instrument.
• Quality. Because support disbursed through financial instruments has to be repaid,
project promoters may undertake more robust analyses of project viability and be
more committed to project success than for non-reimbursable support. In addition, the
due diligence required from financial intermediaries may result in improved project
quality and greater contributions to OP objectives. No quantitative measures are
available to assess project quality, but the case studies provide insights into these
more qualitative aspects and existing studies tend to support the view that financial
instruments can generate better quality projects than grants.
• Development of local financial markets. The development of financial markets
differs by location in the EU. The governance of financial instruments can contribute
to the development of local or regional financial markets. Data on the location of fund
managers is used to establish the extent to which financial intermediaries are
centralised. The case studies also provide insights into this dimension.
• Impact on subsidy culture. FIs can be regarded as promoting a more
entrepreneurial attitude than grants, which may even fuel a dependency on subsidies.
Quantitative data cannot provide an insight into the development of subsidy culture.
However, the data do show that current use of FIs is relatively minor. The vast
18 Which covers all countries except Hungary, albeit with very varying degrees of completeness
between financial instruments.

ESPON 2020 62
majority of ESIF funds are being awarded as grants and FI represent 20 percent of all
ESIF funds in only two NUTS 2 regions (both in Italy: Molise: 20 percent and
Sardegna: 25 percent). Therefore, quantitatively, it cannot be expected that FI could
achieve more than an entrepreneurial niche alongside a dominant subsidy culture.
The effects, or potential effects, outlined above represent an added value that is specific to
FIs. A further issue is the impact of financial instruments, FIs would also be expected to
generate the same types of outputs in relation to OP objectives as grants, including job
creation, investment, new business starts, greenhouse gas reductions. However, the absence
of systematic collection of indicators by instrument means it is unclear whether the form of
intervention in and of itself has an impact on meeting these aims. Outputs are only rarely
attributed directly to FIs by managing authorities as such the availability of impact-related
indicators for financial instruments is extremely limited; there is a dearth of detailed time-
series data and considerable difficulties in defining the counterfactual situation.
The two most commonly reported impact indicators relate to:
• Jobs created, which is the most widely available measure of impact; and
• Number of final recipients.
Both of these indicators were collected as part of the voluntary reporting in the Final
Implementation Report. Even these basic indicators are problematic: managing authorities
use different definitions of jobs created, and data on number of final recipients is often
implausible, missing or has been confused with number of beneficiaries (i.e. financial
intermediaries). These shortcomings limit the usefulness of these measures for assessing
impact and as such the discussion here focuses more on the added value of FIs as described
above. That said, the case studies conducted for this report provide more qualitative insights
on issues such as development of financial markets and capacity building. Further the
Scientific Annex provides an overview of the availability of data gathered by managing
authorities on core and OP indicators relating to financial instruments.
7.2 Uptake and choice of financial instruments
7.2.1 Revisiting the typology of regions
The development of a typology of regions was described in 2.4.1 above. In broad terms, this
takes account of a number elements which are considered likely to affect the uptake and
efficiency of financial instruments in different ways. These elements are as follows:
1. The national financial context (three categories - bank based, market based or
former socialist);
2. The degree of rurality (three categories - urban, intermediate or rural);
3. The quality of government – QoG (three categories - high, medium or low); and
4. The eligibility status for Cohesion policy (three categories -
Convergence/Phasing-Out, Regional Competitiveness & Employment/Phasing-In or
non-EU ESPON).

ESPON 2020 63
Combining these elements and categories yields a theoretical 81 types of regions.19 In reality,
only 36 of these include actual NUTS 2 regions (see Table 7-1). A total of 31 types of regions
are located in the EU, with the remainder in the non-EU ESPON countries.
Table 7-1: Regional typology: Number of NUTS 2 regions in each regional type
Cohesion
policy
Eligibility
Quality of
government
Financial context and geography of finance
bank based market based former socialist
urba
n
Inter-
mediate
rural urban Inter-
mediate
rural urban Inter-
mediate
rural
C+PO
High QoG 1 3
Medium QoG 9 9 7 2 1 4 9 20
Low QoG 3 3 10 3 4 13
RCE+PI
High QoG 14 13 23 24 11 8
Medium QoG 21 21 10 11 5 1
Low QoG 3 5 2
Non-EU
High QoG 1 3 5 2 5
Medium QoG
Low QoG
Source: authors based on Official Journal of the European Union, 6.9.2006, L243; 28.3.2007, L87; Moritz, Block and Heinz, 2015; Masiak, Moritz and Lang, 2017; Demirguc-Kunt and Levine, 1999;.Charron, Dijkstra and Lapuente, 2015; Teorell et al, 2017; De Beer et al., 2014
The NUTS 2 regions classified according to first three elements of this typology (quality of
government, financial system and urban-rural classification) are shown in Map 7-1; the same
colour-coding is applied as in Table 7-1. The fourth element – regional eligibility for Cohesion
policy funding – shown on Map 7-2.
19 3x3x3x3=81.

ESPON 2020 64
Map 7-1: Regional typology: quality of government, financial system and urban-rural classification
Source: authors

ESPON 2020 65
Map 7-2: Convergence / Phasing Out and Regional Competitiveness & Employment / Phasing-In Regions
Source: European Commission
7.2.2 Use of Cohesion policy FIs across the regional types
A key issue for this study is the extent to which regions of different type use Cohesion policy
financial instruments. Of the 289 NUTS 2 regions making up the ESPON area, 271 were
eligible for EU Cohesion policy funding in 2007-13.20 Within these 271 regions, Structural
Funds were used to co-finance financial instruments in 239 regions (Table 7-2).
20 Croatia became an EU Member State in July 2013 and is not included among the eligible regions.

ESPON 2020 66
Table 7-2: NUTS 2 regions in EU and regional typology (number and % for each element of typology)
Elements of typology No. of NUTS 2
regions using FI
No. of NUTS 2
regions not using FI
No. Of NUTS 2
regions Total
# % # % #
Finance
bank based 136 87.7% 19 12.3% 155
market based 50 80.6% 12 19.4% 62
former socialist 53 98.1% 1 1.9% 54
Urban/rural
urban 81 85.3% 14 14.7% 95
intermediate 67 85.9% 11 14.1% 78
rural 91 92.9% 7 7.1% 98
Quality of
government
High QoG 71 73.2% 26 26.8% 97
Medium QoG 124 95.4% 6 4.6% 130
Low QoG 44 100.0% 0 0.0% 44
Eligibility
Convergence and
phasing out 98 99.0% 1 1.0% 99
RCE and phasing
in 141 82.0% 31 18.0% 172
Total 239 88.2% 32 11.8% 271
Note: excludes Croatia
Source: authors
FIs are used in 30 of the 31 types of EU NUTS 2 regions; the exception is the typology
RCE+PI, medium QoG, former socialist, urban – this type contains only the Prague region.
Table 7-3: Regional typology: regional types using Cohesion policy FIs (2007-13)
Cohesion
policy
Eligibility
Quality of
government
Financial context and geography of finance
bank based market based former socialist
urban Inter-
mediate
rural urban Inter-
mediate
rural urban Inter-
mediate
rural
C+PO
High QoG
Medium QoG
Low QoG
RCE+PI
High QoG
Medium QoG
Low QoG
Source: authors, from Table 7-1.
On average, financial instruments invested in final recipients only account for 4.1 percent of
all payments under the Structural Fund (Table 7-4). When the distribution of FIs and
Structural Funds across NUTS 2 regions is examined, the following points emerge:
• Regarding financial context, the share of Structural Funds invested in final
recipients as FIs is higher in market-based regions, and lower in former socialist
regions.
• Regarding rurality, the share of Structural Funds invested in final recipients as FIs is
marginally higher in urban regions than in rural regions.
• Regarding quality of government, perhaps surprisingly, the share of financial
instruments is relatively high in regions that have a low quality of government. The
absolute use of FIs is also higher in regions that have a low quality of government.
Importantly, however, such patterns must be treated with caution since high levels of spend in
a few regions can distort the picture for the type as a whole.

ESPON 2020 67
Table 7-4: Allocation of Financial Instruments and Structural Funds by element of typology (NUTS 2)
Elements of typology SF contributions invested in
final recipients as FIs
ERDF and ESF expenditure 2007-
2013
€m av (€m) per
NUTS2
region
using FI
% of ERDF and ESF
expenditure
€m average (€m) per
NUTS2
region
Finance
bank based 6,063 45 4.7% 129,376 789
market based 700 14 5.0% 14,016 203
former socialist 3,470 65 3.2% 108,155 1,931
Urban/rural
urban 3,732 46 4.5% 83,191 849
intermediate 2,913 43 4.2% 69,028 803
rural 3,588 39 3.6% 99,329 946
Quality of
government
High QoG 852 12 3.6% 23,687 210
Medium QoG 4,912 40 3.2% 155,865 1,199
Low QoG 4,470 102 6.2% 71,995 1,565
Eligibility
Convergence and
phasing out 7,849 80 4.0% 195,827 1,939
RCE and phasing
in 2,384 17 4.3% 55,720 324
Total 10,233 43 4.1% 251,547 921
Source: authors
The literature suggests that the uptake of financial instruments is likely to be relatively higher
in agglomerations, as urban areas provide the financial services necessary to manage
financial instruments. This analysis shows that the uptake of FIs is only marginally higher
in urban regions (4.25 percent) and marginally lower in rural regions (4.18 percent)
compared to the average (4.20 percent). A closer look at the data shows that this
relationship is primarily in market-based financial systems (Table 7-5). In bank-based systems
the situation is the reverse and the uptake in rural areas (5.11 percent) is higher than in urban
areas (3.34 percent).
Table 7-5:, Uptake of financial instruments by national financial context and urban/rural classification
Urban/rural bank-based market-based former socialist total
Urban 3.34% 6.01% 2.62% 4.25%
Intermediate 3.99% 4.45% 4.31% 4.15%
Rural 5.11% 2.46% 3.02% 4.18%
Total 4.20% 5.04% 3.25% 4.20%
Note: Uptake of financial instruments refers to investments in final recipients – Structural Fund amount) as % of ERDF and ESF programmes
Source: authors based on Member State data provided by the European Commission
Turning to the use of different financial products, as noted in earlier discussions, loans are the
most widespread product in the sense that all Member States using financial instruments use
loans; however, the choice of financial instrument varies by quality of government. In
particular, the use of guarantees and equity/venture capital is closely related to the
quality of government in the region (Table 7-6).
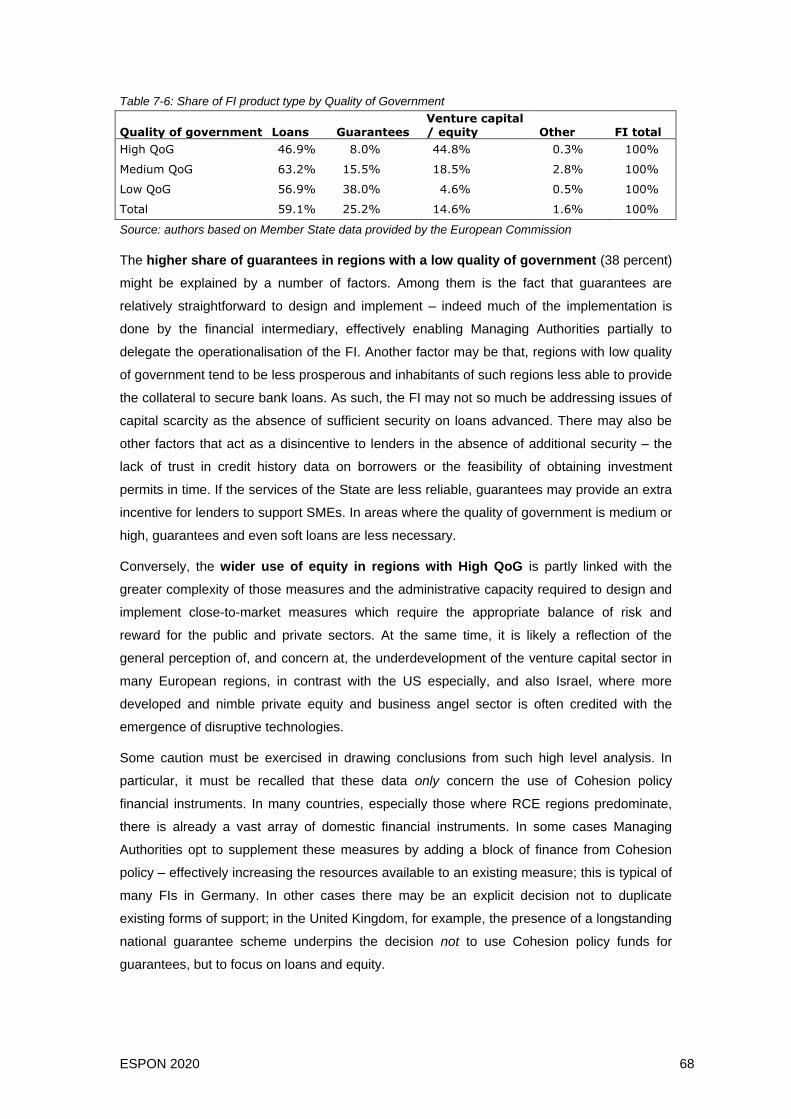
ESPON 2020 68
Table 7-6: Share of FI product type by Quality of Government
Quality of government Loans Guarantees Venture capital / equity Other FI total
High QoG 46.9% 8.0% 44.8% 0.3% 100%
Medium QoG 63.2% 15.5% 18.5% 2.8% 100%
Low QoG 56.9% 38.0% 4.6% 0.5% 100%
Total 59.1% 25.2% 14.6% 1.6% 100%
Source: authors based on Member State data provided by the European Commission
The higher share of guarantees in regions with a low quality of government (38 percent)
might be explained by a number of factors. Among them is the fact that guarantees are
relatively straightforward to design and implement – indeed much of the implementation is
done by the financial intermediary, effectively enabling Managing Authorities partially to
delegate the operationalisation of the FI. Another factor may be that, regions with low quality
of government tend to be less prosperous and inhabitants of such regions less able to provide
the collateral to secure bank loans. As such, the FI may not so much be addressing issues of
capital scarcity as the absence of sufficient security on loans advanced. There may also be
other factors that act as a disincentive to lenders in the absence of additional security – the
lack of trust in credit history data on borrowers or the feasibility of obtaining investment
permits in time. If the services of the State are less reliable, guarantees may provide an extra
incentive for lenders to support SMEs. In areas where the quality of government is medium or
high, guarantees and even soft loans are less necessary.
Conversely, the wider use of equity in regions with High QoG is partly linked with the
greater complexity of those measures and the administrative capacity required to design and
implement close-to-market measures which require the appropriate balance of risk and
reward for the public and private sectors. At the same time, it is likely a reflection of the
general perception of, and concern at, the underdevelopment of the venture capital sector in
many European regions, in contrast with the US especially, and also Israel, where more
developed and nimble private equity and business angel sector is often credited with the
emergence of disruptive technologies.
Some caution must be exercised in drawing conclusions from such high level analysis. In
particular, it must be recalled that these data only concern the use of Cohesion policy
financial instruments. In many countries, especially those where RCE regions predominate,
there is already a vast array of domestic financial instruments. In some cases Managing
Authorities opt to supplement these measures by adding a block of finance from Cohesion
policy – effectively increasing the resources available to an existing measure; this is typical of
many FIs in Germany. In other cases there may be an explicit decision not to duplicate
existing forms of support; in the United Kingdom, for example, the presence of a longstanding
national guarantee scheme underpins the decision not to use Cohesion policy funds for
guarantees, but to focus on loans and equity.

ESPON 2020 69
7.2.3 Defining high and low uptake of FIs
Based on the regionalisation of data and the criteria used for the typology of NUTS 2 regions,
differences in uptake of financial instruments (EU amounts invested in final recipients using
FIs) among the regions can be analysed. For the purposes of this study, high absolute uptake
is defined as above €20 million of Structural Funds contributions invested as FIs in final
recipients. High relative uptake is defined as where the amount of Structural Funds invested
as FIs in final recipients is higher than 10 % of the ERDF and ESF expenditure in the region.
The number of NUTS 2 regions falling into each category are shown in Table 7-7.
Table 7-7: High and low financial instrument uptake regions
Uptake Regions High relative uptake Low relative uptake
High absolute uptake 107 regions 24 83
Low absolute uptake 132 regions 4 128
No uptake 50 regions (including regions outside EU in Iceland, Liechtenstein,
Norway and Switzerland)
Note: Numbers of NUTS 2 regions with high and low absolute (above or below € 20 million) or relative (above or below 10 %) uptake of FIs, compared to total investment of ERDF and ESF programmes
Source: authors based on Member State data provided by the European Commission
7.3 High and low uptake of FIs in the different region types
Uptake of FIs differs between regions depending on their Structural Funds eligibility, partly
owing to the much larger scale of funds available to the Convergence regions. The interaction
between levels of uptake and other elements of the typology – national financial systems,
urban-rural typology and quality of government is illustrated in Map 7-3. This interaction is far
from clear cut. For example, Map 7-3 shows that there has been both high absolute and
relative uptake of financial instruments in the following region types:
• low quality of government, bank based, urban and intermediate region type
• medium quality of government, bank based, urban and intermediate region type
• low quality of government, former socialist, intermediate region type
• high quality of government, market based, intermediate region type.
In other words, there are examples of high uptake regions among all region types, except
rural.

ESPON 2020 70
Map 7-3: Regional typology and level of uptake of financial instruments
Source: authors

ESPON 2020 71
The following sections highlight some of the key points emerging from the analysis of FI
uptake among the different regional types, based on Structural Funds eligibility. 21
7.3.1 Convergence/Phasing-Out regions
Structural Funds contributions to final recipients in the form of FIs in Convergence or Phasing
Out regions amount to €7.8 billion, 77 percent of the total EU amount invested in final
recipients through financial instruments.
The breakdown by type of region is shown in Table 7-8. This shows that of the 101
Convergence/PO regions, only three NUTS 2 do not use financial instruments.22
In terms of FI uptake among those that do use FI, notable points include:
• The region type low quality of government, bank based, urban accounts for about 21
percent (€1,655 million) of Structural Funds invested in final recipients using FIs in
the Convergence / PO regions – see also Figure 7-1. Strikingly, just three regions
make up this category - Sicilia, Campania and Attiki and together they account
for 16 percent of all Structural Funds invested through FIs. Campania alone
invested €920 million of Structural Funds as FIs in final recipients. As such,
Campania is the EU region with the highest amount of Structural Funds invested in
final recipients through financial instruments in 2007-13.
• All but one of the region type medium QoG, former socialist, rural has a high
absolute uptake of FIs (although a low relative uptake). The region with highest
absolute uptake in this category is Wielkopolskie (€158 million), one of the case
studies.
• In some of the Convergence/Phasing Out types, uptake is concentrated in only a
few regions, and some of the quantitatively very high uptake regions (e.g. Norte,
Andalucía) allocate relatively little of their Structural funding to FIs.
21 See also annex to Scientific Report for the full list of regions, including their type, and uptake of
financial instruments, and a more detailed discussion in the Scientific Report.
22 Two in Croatia, and Guadeloupe (FR) which did not report any investment in final recipients in the
Summary of Data.

ESPON 2020 72
Table 7-8: Convergence and Phasing Out high and low FI uptake region types
Type of NUTS 2
region: quality of
government,
financial
context,
geography
No of
NUTS 2
regions
in type
Uptake: Absolute
above € 10 m
Uptake:
Absolute below
€ 10 m
No
uptake
FIs to
final
recipients
(€m)
FIs
relative
to
ERDF +
ESF
ERDF +
ESF
(€m)
Relative
above
10%
Relative
below
10%
Relative
above
10%
Relative
below
10%
Low QoG, bank
based, urban 3 2 1 1654.60 11.16% 14820.44
Medium QoG,
former socialist,
rural 20 19 1 1422.58 3.41% 41699.89
Medium QoG,
former socialist,
intermediate 9 8 1 791.08 3.90% 20264.27
Medium QoG, bank
based,
intermediate 9 1 6 1 1 665.84 3.39% 19655.59
Low QoG, bank
based, rural 10 9 1 621.85 4.63% 13419.22
Low QoG, bank
based,
intermediate 3 1 2 574.20 8.95% 6412.93
Medium QoG, bank
based, urban 9 1 3 5 423.62 2.61% 16206.07
Medium QoG, bank
based, rural 7 5 2 407.48 3.01% 13538.67
Low QoG, former
socialist, rural 13 7 4 2 335.29 2.43% 13801.96
Low QoG, former
socialist,
intermediate 4 1 2 1 320.60 4.90% 6549.35
Low QoG, former
socialist, urban 3 3 248.92 2.77% 8976.46
Medium QoG,
former socialist,
urban 4 3 1 216.36 1.82% 11861.22
High QoG, bank
based, rural 3 2 1 89.01 1.81% 4927.39
Medium QoG,
market based,
intermediate 2 1 1 56.51 2.23% 2537.07
High QoG, bank
based,
intermediate 1 1 18.15 1.95% 931.47
Medium QoG,
market based,
rural 1 1 2.43 1.08% 225.24
Total 101 6 71
21 3 7848.51 4.01% 195827.26
Note: Typology of regions at NUTS 2 level and uptake of financial instruments, both absolute and relative to programme, inclusive of grants
Source: authors

ESPON 2020 73
Figure 7-1: Share of FI uptake among Convergence Regions
Low QoG, bank based, urban - 3
regions, 21%
Medium QoG, former socialist,
rural - 20 regions, 18%
Medium QoG, former socialist, intermediate - 9
regions, 10%
Other region types -66 regions, 51%
Note: The largest share - Low QoG, bank based urban - comprises Sicilia, Campania and Attiki.
Source: authors
7.3.2 Regional Competitiveness and Employment/Phasing-In regions
Structural Funds contributions to final recipients in the form of FIs in RCE/PI regions amount
to €2.3 billion, 23 percent of the total EU amount invested in final recipients through financial
instruments.
The breakdown by type of region is shown in Table 7-9. This shows that of the 172 RCE/PI
regions, 31 do not use financial instruments.

ESPON 2020 74
Table 7-9: RCE and Phasing In high and low FI uptake region types
Type of NUTS 2
region: quality of
government,
financial
context,
geography
NUTS 2
regions
in type
Uptake: Absolute
above € 10m
Uptake:
Absolute below
€ 10m
No
uptake
FIs to
final
recipients
(€m)
FIs
relative
to
ERDF +
ESF
ERDF +
ESF
(€m)
Relative above 10%
Relative below 10%
Relative above 10 %
Relative below 10%
Low QoG, bank
based, rural 5 3 1 1 446.56 17.48% 2555.40
Medium QoG, bank based, urban 21 1 3 15 2 358.10 2.40% 14940.00
High QoG, market based, urban 24 5 1 11 7 326.97 7.70% 4245.74
Medium QoG, bank based, intermediate 21 3 2 15 1 310.79 4.27% 7270.87
Medium QoG, market based, urban 11 3 8 155.61 6.40% 2429.60
Low QoG, former
socialist, urban 2 2 135.42 3.69% 3672.81
Low QoG, bank based, urban 3 1 1 1 132.09 7.39% 1786.56
High QoG, bank based, rural 23 1 17 5 125.10 2.91% 4300.59
High QoG, bank
based, urban 14 1 1 8 4 80.74 2.76% 2922.55
Medium QoG, bank based, rural 10 1 8 1 79.28 2.90% 2735.54
High QoG, market based, intermediate 11 1 2 4 4 77.86 6.07% 1282.62
High QoG, bank based, intermediate 13 1 7 5 75.83 2.57% 2952.53
High QoG, market
based, rural 8 7 1 29.72 2.22% 1337.56
Medium QoG, market based, intermediate 5 5 22.04 1.88% 1171.38
Medium QoG, former socialist, urban 1 1 0.00 0.00% 1329.19
Total 172 18 12 4 107 31 2356.12 4.29% 54932.92
Note: Typology of regions at NUTS 2 level and uptake of financial instruments, both absolute and relative to programme, inclusive of grants
Source: authors
In terms of FI uptake among RCE/Phasing-In regions, notable points include:
• The low QoG and bank-based rural. type has the largest allocation of Structural
Funds to final recipients in the form of FIs (€446.56m). This category includes the
regions of Sardegna, Molise and Abruzzo. The high uptake of this category can be
attributed to the region of Sardegna (€310 million; accounting for 69 percent of this
regional type). After Sardegna, the other Italian regions in this type, Molise and
Abruzzo, both invested more than 30 percent of ERDF and ESF in final recipients via
FIs.
• Outside Italy, there is high relative uptake in some UK regions (eg Manchester and
East Anglia) and Liege (Belgium).

ESPON 2020 75
7.4 Geography of fund managers
An interesting dimension of the added value of FIs – certainly in the longer term - is the
development of local financial markets. The geography of fund management can provide
some insight into the potential contribution of the location of fund managers to this.
Fund managers manage specific funds or holding funds and are remunerated directly or
indirectly for this activity. A fund manager is not necessarily located in the same NUTS 3
region as the region in which the fund itself is available. The location of the fund managers in
different Member States, as well as the amount of money paid to these fund managers
related to these different locations, has been analysed. These data reveal some insights into
the territorial dimension of the governance of financial instruments. Except for the European
Investment Bank and the European Investment Fund, which are institutionally based in
Luxembourg but operate Europe-wide with offices in the Member States, all fund managers
are located in the Member State in which they operate.
The data shows large differences in the territorial distribution of fund managers between
Member States:23
• Hungary and Poland have extensive and decentralised territorial coverage by
fund managers. In Hungary this was considered an important dimension of
implementing a micro-credit scheme owing to the perceived need to build up capacity
in the region and development relationship banking and support (Nyikos, 2015).
• Urban regions have the highest share of regions with fund managers. In some
Member States fund managers are only located in the capital region, which is
usually an urban NUTS 3 area. (eg Czech Republic, Slovakia, Romania and
Bulgaria),
• In countries where regional low QoG is low there tend to be more national
programmes and fewer regionally-managed programmes. This suggests that the
promotion of local financial markets in practice starts with having a certain threshold
value of quality of government before local parties are trusted to manage financial
instruments.
Such a centralised versus more regionalised structure of fund managers may have an impact
on independent regional governance capacity in relation to investments. By choosing
regionalised fund managers, regionalised knowledge must be developed, which may
contribute to the development of local financial markets and in turn contribute to the added
value of financial instruments. Alternatively, national fund managers may use local branch
offices to manage a large part of the work locally. In such a practice, however, the ultimate
decision-making power may still be centralised and central management may correct local
branches if they do not conform with centralised management rules. This would therefore
result in less local autonomy in the financial market than with local fund managers.
23 See scientific report.

ESPON 2020 76
7.5 Management costs and fees
The Implementing Regulation (Article 43(4)) sets limits on management costs and fees as an
annual average percentage of the capital contributed from the OP to the financial instruments.
These are 2 percent for holding funds and for guarantee funds, 3 percent for loan and equity
funds and 4 percent for microcredit instruments. These rates can be exceeded where
competitive tendering shows that higher rates are necessary.
Data on management costs and fees is only available for around 80 percent of financial
instruments; where there is no reporting or a zero return, it is unclear whether no fees at all
are charged, or whether they have been met by the final recipient. Taking only those products
where data is available, and eliminating implausible data, the Commission estimates that
management costs and fees for loans amount to around 6.1 percent of OP contributions,
those for guarantees to around 3.3 percent and those for equity to around 10 percent.
However, these amounts exclude management costs and fees at the levels of holding funds,
which may contain a mix of products, and therefore cannot be subdivided by product; overall,
however, fees at the level of holding funds amount to around 4.4 percent for those reporting.
At a territorial level, average management costs and fees for rural regions appear lower than
for urban regions. This might be explained by the fact that some urban regions, like capital
regions, house large national programmes that consequently have higher management costs.
Rural areas usually only house managers for funds that are restricted to their own area.
However, a key factor is likely to be the regional incidence of different financial products. For
example, equity products, which charge higher fees on average, are less prevalent in rural
areas where the business 'ecosystem' is less suited to their use. Overall, however, it is
different to make clear comparisons between region types partly owing to the role holding
funds and partly due to data gaps in reporting.
7.6 Leverage effect
Financial instruments may be a more efficient policy tool than grants because of their capacity
to attract additional finance. In practice, only a partial view of the leverage achieved by
Cohesion policy FIs can be obtained. This is because very few OPs report private
contributions at OP level, and while there may be private investment at fund level, or at the
level of the final recipient – such as bank loans associated with guarantees or equity co-
financing - this information is not collected systematically.
7.6.1 The Commission’s definition of leverage and the impact of the co-financing rate
Using the Commission’s approach to leverage24 and the available data, the figures suggest
that there are only small differences in leverage within the C+PO eligibility regions relating to
24 The Commission’s approach to measuring leverage is to divide total OP contributions to final recipients by the Structural Funds contribution. A complication of this approach is that OP co-financing rates differ between countries and regions, depending on their eligibility status i.e.

ESPON 2020 77
geographic location. This may result from differences in eligibility between regions within the
set. Overall, these data suggest that most OPs in C+PO regions make maximal use of
Structural Funds in cofinancing FIs – in other words, using the Commission approach, in
Convergence regions apparent leverage at the level of the OP is no more that the
impact of the co-financing rate.
The position is different in the RCE+PI areas. In rural areas especially, and to some extent
in intermediate areas, ‘leverage’ is higher than that which would result simply from the
co-financing rate. The leverage effect has also a distinctive relationship with quality of
government: low quality of government regions show a lower leverage effect in C+PO
regions, although the relationship is less clear in RCE+PI regions.
7.6.2 Data on the leverage generated by guarantees
A more conventional approach to analysing leverage is to look at the extent to which the OP
funding is linked to the generation of external finance. Data gaps in reporting mean that there
is no scope to provide a comprehensive view, but there is some data on loan funding linked to
co-financed guarantees. Cohesion-policy funded guarantees can support the granting of
loans to final recipients from other public and private sector sources. One quarter (€ 2,525
million) of the Structural Funds’ contributions to final recipients using FIs are actually funding
set aside to cover defaults on loans supported under guarantee contracts. Loans secured
through the use of guarantees amount to €24,763 million in 2007-2013. This is 9.8 times
higher than Structural Funds contributions blocked for the guarantee contracts.
The extent to which guarantees are used varies between regions (Table 7-10). In market-
based financial systems, co-financed guarantees are hardly used (sometimes because public
guarantees already exist using domestic funding). The exceptions are a few small
programmes in Finland and the Netherlands; these show extremely high leverage, as €3.8
million of guarantees were used to secure €135.2 million of loans (35.4 times the guarantees).
Guarantees are mostly (75% of all guarantees) used in bank-based systems and are used to
secure 10.1 times as large loan portfolios. In former socialist systems (24.9% of all
guarantees) this ratio is a little lower at 8.7.
Convergence/Phasing-Out regions have higher-co-financing rates (and therefore lower rates of match funding must be sought). This implies that a certain rate of leverage is achieved when the requisite match funding is obtained, which varies between countries and regions.

ESPON 2020 78
Table 7-10: Use of guarantees and loan guarantee ratio by eligibility and urban/rural classification
Eligibility Measure Urban Intermediate Rural Total
C+PO
Share of all guarantees 35.0% 21.0% 22.0% 78.0%
Share of secured loans 39.2% 17.0% 16.6% 72.8%
Loan to guarantee ratio 11.1 7.9 7.3 9.1
RCE+PI
Share of all guarantees 5.0% 5.0% 12.0% 22.0%
Share of secured loans 14.2% 4.7% 8.4% 27.2%
Loan to guarantee ratio 26.8 10.0 6.7 12.2
Total
Share of all guarantees 40.0% 26.0% 34.0% 100%
Share of secured loans 53.4% 21.7% 25.0% 100%
Loan to guarantee ratio 13.1 8.3 7.1 9.8
Notes: Refers to use of Structural Fund co-financed guarantees and ratio between loans and guarantees that secure these loans. Excludes Hungary
Source: Authors based on Member State data as provided by the European Commission
The amount of loans that can be secured by a co-financed guarantee is higher in urban areas
than in rural areas (Table 7-10). The loan to guarantee ratio is also higher in areas that have
higher GNP (and are therefore eligible for less Structural Funds funding). This has potential
implications for territorial cohesion. Urban areas, and especially prosperous urban areas,
have better access to finance and so guarantees result in much higher levels of
leverage than in rural areas, where guarantees secure fewer loans.
7.7 Legacy
Legacy are the Structural Funds invested from Operational Programmes (OP) in final
recipients that are repaid and returned to the managing authorities for reinvestment.25 Data
provided on contributions from OPs to final recipients are always provided at the level of
specific funds; however, in the closure summary data, legacy is reported at the level of
holding funds or at the level of specific funds, if managing authorities have not used a holding
fund. For this and other reasons it is not possible to reach firm conclusions about the scale of
legacy at the levels of financial products or territorial scales. The European Commission’s
summary of data (2017) indicates that in total €8,464.12 million of legacy has been returned
to managing authorities.26 Although reporting on legacy was mandatory at closure, in practice
significant numbers of funds (about one-third, excluding Hungary) reported either zero legacy
or made no return.
The legacy generated is larger in NUTS 2 regions eligible for C+PO funding than in
RCE+PI regions (Figure 7-2). The differences in legacy may be explained by the way
25 According to the Commission closure reporting instructions, total amount of ERDF/ESF resources returned to the operation from investments undertaken by financial engineering instruments as defined in Article 44 or left over after all guarantees have been honoured. This amount should be the sum of: 1) gains that have been returned; PLUS 2) resources paid back to FI (and possibly already reused for new loans, or guarantees not called); PLUS 3) the value of resources at final recipient level which have yet to be paid back, which is the amount of potential legacy. Depending on the arrangements of winding up these amounts may be accrued on the level of specific fund or on the level of the managing authority.
26 This data is based on responses for all Member States except Austria and the CBC OPs.

ESPON 2020 79
financial instruments work. These instruments are market instruments and can also be
obtained, in most cases, through the market. In high Structural Funds eligibility regions
(C+PO regions), markets are more reluctant to step in and so good projects do not get
funded. Co-financed FIs are therefore used to fund viable (good) projects which would not
otherwise go ahead.
Figure 7-2: Legacy as % of investment in final recipients (SF amounts) by eligibility and QoG
Source: authors based on Member State data
Considerable caution should be exercised in interpreting the data on legacy because the data
include 'potential' legacy, which may not materialise in practice; it is not known to what extent
the figures supplied by managing authorities comprise actual or potential legacy. Another
factor likely to influence the scale of legacy is the type of product used. For example, equity
products may take longer to generate returns since these result from exits or sales of shares,
while repayments on loans may begin shortly after they are drawn down. In addition, many
holding funds contain different products, and mixed specific funds do not report legacy
separately. There is evidence of substantial differences in the rate of legacy achieved or
anticipated in different regions (see Map 7-4), but given the comments above it would be
unwise to draw firm conclusions from this data.

ESPON 2020 80
Map 7-4: Legacy as a proportion of investment in final recipients (EU amounts)
7.8 Impact
As mentioned earlier, the available data on the impact of FIs is extremely limited, and none of
it is comprehensive in coverage. Availability of data on core indicators is discussed further in
Chapter 6 of the Scientific Annex. The two most commonly reported impact indicators are
number of final recipients and jobs created, but neither were mandatory.
7.8.1 Final recipients
The impact of FI can relate to the number of final recipients supported. As discussed earlier,
the number of final recipients supported is only known in respect of around 75 percent of
investment; in other words, it is not clear how many final recipients were supported with the
remaining €2.5 billion. For the FIs where data is available, this shows that some 259,889 final
recipients were supported, (almost half of which were in Italy alone). The vast majority of final
recipients (85 percent) are SMEs and 48 percent of these are microenterprises.
Number of final recipients is a difficult indicator to interpret (higher may not necessarily be
'better') but measured as the number of final recipients for a given amount of OP contributions
invested, impact is considerably lower in intermediate regions than in urban or rural regions.
More striking is that impact is much lower in areas with high quality of government;
conversely, impact is higher in regions with a low quality of government. This effect is

ESPON 2020 81
not related to the Structural Funds eligibility of the regions but results from high QoG regions
in Germany and the UK making relatively large investments in relatively few recipients, and
low QoG regions in Italy and elsewhere where the number of final recipients related to OP
contributions is high.
7.8.2 Jobs created
Member States could voluntarily report on jobs created by financial instruments. Reporting of
this data was very limited, and available data is unreliable.27 Available data suggests that 60%
of jobs created through ESIF Financial Instruments are in Bulgaria and France (Figure 7-3),
which may suggest that these figures predominantly reflect differences in reporting practice
rather than differences in impact.
Figure 7-3: Reported jobs created through financial instruments, by Member State (2007-13)
Source: Authors based on information from Member States
Although job creation reported is implausibly high in many Member States, many OPs do not
report any data at all on job creation.
7.9 Analysing added value and impact based on the regional typology
7.9.1 Convergence and Phasing-Out areas
The measures of leverage, legacy, the number of final recipients relative to OP funds and
Structural Funds invested in final recipients and the management costs and fees relative to
Structural Funds contributions to final recipients differ by type of regions (Table 7-11).
Regional types are ranked in order of investment in final recipients. However, as noted
before, caution must be exercised in interpreting these results, especially where the use of
27 See Scientific report for more detail.

ESPON 2020 82
financial instruments is relatively low for the regional type as a whole since outcomes may be
skewed by the situation in a small number of regions.
In most of the groups, well above 60% legacy is reported. Legacy of over 80% can be found
in some low QoG areas, this might suggest that FI play an important role in promoting good
investment opportunities, such as, in the bank based, rural areas of Calabria (Italy) and in
Ipeiros and Thessalia (Greece). The number of final recipients per €1 million of total OP
contributions varies widely.28 Loans and guarantees often involve relatively small OP
contributions. On average, these amount to several tens of thousands of euros per final
recipient, consistent with the fact that FIs are primarily geared towards supporting SMEs. In
low QoG regions in particular, the number of final recipients that can be supported
with one million euro is relatively large. In bank based, medium QoG areas investment
tended to be larger, and, self-evidently fewer recipients are supported for the same sums
Table 7-11: Added value and impact for C+PO regions
Type of NUTS 2 region: quality of government, financial context, geography
Leverage effect
Recipients per 1 million of
Legacy related to OP contri-butions to final recipients
Management cost and fees relative to SF contributions to final recip-ients*
OP contri
butions
SF contri
butions
Low QoG, bank based, urban 1.23 29.70 36.46 68.4% 8.5%
Medium QoG, former socialist, rural 1.25 12.59 15.79 62.6% 8.4%
Medium QoG, former socialist,
intermediate 1.43 20.38 29.16 63.4% 8.8%
Medium QoG, bank based,
intermediate 1.43 7.20 10.32 61.8% 10.2%
Low QoG, bank based, rural 1.14 53.58 60.84 81.3% 9.4%
Low QoG, bank based, intermediate 1.26 34.51 43.38 73.8% 5.6%
Medium QoG, bank based, urban 1.59 9.81 15.57 61.5% 8.2%
Medium QoG, bank based, rural 1.48 9.62 14.23 37.4% 4.8%
Low QoG, former socialist, rural 1.17 17.81 20.85 80.0% 6.0%
Low QoG, former socialist,
intermediate 1.28 16.41 20.96 84.9% 11.5%
Low QoG, former socialist, urban 1.07 7.62 8.17 30.1% 8.9%
Medium QoG, former socialist, urban 1.21 31.86 38.68 83.8% 7.4%
High QoG, bank based, rural 1.45 5.69 8.27 73.2% 8.6%
Medium QoG, market based,
intermediate 1.95 4.81 9.41 36.7% 3.9%
High QoG, bank based, intermediate 1.47 11.51 16.90 25.6% 35.2%
Medium QoG, market based, rural 2.50 1.32 3.29 0.0% 3.7%
Total 1.30 20.92 27.22 65.3% 7.7%
Note: Regions are ranked by Structural Funds contributions to final recipients *Excluding Hungary
Source: Authors based on information Member States
28 Whether OP funds are from EU or other sources makes no difference to the final recipient.

ESPON 2020 83
It is interesting to consider whether high-uptake regions show more added value and more
impact and may be more efficient relating to management costs and fees related to Structural
Funds contributions.
Impact measured as number of final recipients per € million OP and SF contributions shows a
very divergent picture. In some regional types, larger programmes are used to address an
even larger number of final recipients. In other, often bank-based regions, larger programmes
are used to invest large amounts of money in fewer recipients. Differences in legacy are
usually rather small, but they are generally positive. This may be because in regions with
more FI, more funds are revolving and become available for reinvestment by the managing
authority. Management costs and fees do not differ to a great degree, but are generally a little
lower for high-uptake regions. This may suggest that there are efficiency gains from
managing larger regional FI programmes, but the impact of different financial products is
also likely to be a factor, with loans and guarantees attracting lower management costs than
equity.
The analysis of model regions with high uptake versus other regions in the C+PO eligibility
regions shows a highly diverging picture (see Scientific annex). In some of the model regions,
high uptake seems to confirm economies of scale. The NUTS 2 region of Hainaut (BE) has,
for example, lower management costs and fees relative to contributions to final recipients
than other regions of its type which have a lower uptake of FI. Hainaut also has a higher
legacy than low uptake regions and the leverage of guarantees is higher than in other
regions. However, this is not the case in all C+PO high uptake regions. In the high uptake
region of Sachsen-Anhalt (DE) management costs and fees are remarkably high. In
Campania (IT), the region with the highest uptake of FI in the 2007-2013 period, management
costs and fees seem to show economies of scale. In the NUTS 2 region of Campania,
management costs and fees are lower than in than in the comparable NUTS 2 region of
Sicilia. Management costs and fees are even lower in the even larger nationally-managed
programme for the Mezzogiorno area (which covers Puglia and Calabria as well as Campania
and Sicilia).
The comparative analysis of Campania versus Sicilia shows that the uptake of financial
instruments depends on the uptake by local actors as enterprises (i.e. it is demand driven)
and that this can differ between regions even if they are addressed by the same programme.
These differences are not fully explained by differences in the number of enterprises between
the regions. Other factors therefore also play a role.
7.9.2 RCE and Phasing In areas
In RCE and Phasing In areas the amount of Structural Funds provided is significantly lower
per region, and there are large differences between regions (Table 7-12). In addition, the
Phasing-In regions qualify for a higher co-financing rate, which artificially lowers the leverage
effect compared to RCE regions. There are also very large differences in impact measured in
the number of recipients per million OP or Structural Funds contributions. RCE+PI, medium

ESPON 2020 84
QoG, bank based, rural NUTS 2 regions have the largest amount of recipients per million
funds. This relates to a very large number of guarantees in the Italian region of Marche. The
use of financial instruments in RCE+PI areas is rather thin, so that one outlier in a region has
a direct impact on the scores of a type containing several regions. Differences between
regions largely reflect differences in policy choices between regions.
Table 7-12: Added value and impact for RCE+PI *
Type of NUTS 2 region: quality of government, financial context,
geography
Leverage effect
Recipients per 1 million of
Legacy related to
OP contri-butions to final recipients
Management cost and fees
relative to SF contributions to final recip-ients*
OP contri-butions
SF contri-butions
Low QoG, bank based, rural 1.44 18.80 27.12 31.0% 7.6%
Medium QoG, bank based, urban 2.02 31.04 62.83 39.7% 12.6%
High QoG, market based, urban 2.09 3.48 7.25 39.1% 20.7%
Medium QoG, bank based,
intermediate 2.43 13.33 32.33 23.7% 7.3%
Medium QoG, market based, urban 2.66 7.50 19.93 26.7% 53.1%
Low QoG, bank based, urban 2.23 67.21 149.70 76.4% 7.9%
High QoG, bank based, rural 2.26 2.72 6.13 30.2% 14.6%
High QoG, bank based, urban 1.99 12.99 25.88 44.9% 15.8%
Medium QoG, bank based, rural 3.25 69.67 226.25 23.4% 9.3%
High QoG, market based,
intermediate 2.73 2.03 5.55 36.4% 14.7%
High QoG, bank based, intermediate 2.41 4.85 11.69 22.0% 15.1%
High QoG, market based, rural 2.06 46.18 95.23 41.4% 29.2%
Medium QoG, market based,
intermediate 2.39 11.36 27.16 29.0% 21.6%
Total 2.13 20.88 44.49 34.8% 15.3%
Note: Regions are ranked by SF contributions to final recipients *Excluding low QoG, former socialist, urban
Source: Authors based on information from Member States
Regions with a high relative uptake are more common in RCE+PI regions than in C+PO
regions. This means that a higher percentage of scarce regional funds are used for FIs (Table
7-12). Although there are, as in the case of C+PO regions, considerable and diverging
differences between relatively high-uptake regions, there is more of a common line. There
are generally fewer recipients per €1 million of OP or Structural Funds contributions,
legacy is higher and management costs and fees are lower. This suggests that more
added value can be created by allocating a higher share of funding to FI in these
regions.
A comparative analysis of high-uptake RCE+PI model regions and regions with a lower
uptake of financial instruments (see Scientific Annex) shows that there is a considerable
diversity in FI practices in RCE+PI regions. There is a substantial number of low- and even no
uptake regions and managing authorities have taken different choices on using the much
more scarce ERDF (and ESF) funding. In most of the comparative analysis, economies of
scale can be found in management costs and fees. A notable exception are the costs for

ESPON 2020 85
some of the equity/venture capital investments, which has resulted in very high
management costs in several regions. However, in other regions these costs were
moderate. The comparative analysis of legacy also shows that in many regional types the
high uptake regions showed higher legacy, but exceptions were also found here, showing that
there is no automatic relationship between higher uptake and higher legacy.
Guarantees were not used in all of the regional types. In the regional types where guarantees
were used, it appears that fewer loans can be guaranteed per euro of Structural Funds in
higher QoG regions than in areas with low QoG.
7.10 Summary
The added value of financial instruments, such as their sustainability because of the revolving
nature of the instruments and the role they may have in the development of local financial
markets, may be distinguished from their impact, such as the creation of new jobs. To explore
whether differences in added value and impact differ between region types, a typology of
European NUTS 2 regions was developed using the criteria of eligibility for regional funding,
the national financial system, the regional quality of government and the geography of region
as urban, intermediate or rural. Financial instruments are used in 28 types of regions.
The relative share of financial instruments in relation to ERDF and ESF funding is the highest
in urban regions with a market based financial system. The lowest share is in rural regions
with a market based financial system. This strong urban-rural gradient cannot be found in
regions with bank-based or former-socialist financial systems.
Financial instruments can be categorized as loans, guarantees venture capital/equity capital
and other financial instruments. Loans are the most often used type of FI, followed by venture
capital/equity in areas with a higher quality of government and guarantees in areas with a
lower quality of government. This reflects the different context for SMEs in these areas.
A total of 77% of all Structural Fund contributions to final recipients via FIs is allocated in
regions with higher eligibility to European regional funding (Convergence and Phasing Out
regions). About 9% of all Structural Funds in FI is contributed to final recipients in Campania
in Italy. Some 16% of all Structural Funds investment through FIs is accounted for by a single
region type comprising Attiki, Sicilia and Campania. Another large group consists of 20
regions in former socialist rural areas with a medium quality of government. There are several
other individual regions in which a relatively large share of financial instruments is invested.
The uptake of financial instruments therefore differentiates within a single type of region. An
even more differentiated picture is shown in the RCE and Phasing-In regions. Here a wide
range of levels of uptake of financial instruments can be found, including a number of regions
with no uptake at all.
Managing authorities implemented financial instruments either via a holding fund or directly
through specific funds. Both holding funds and specific funds have fund managers for which
management costs and fees must be paid. The geography of fund managers differs widely

ESPON 2020 86
between EU Member States. In some countries they can almost exclusively be found in the
national capital region or, as in the case of Germany, in the regional capital. In other
countries, such as Poland and Hungary, fund managers can be found in most or even all
NUTS 3 regions. A more centralised or decentralised structure of management may have an
impact on the way economic decision-making develops in the Member States. More funds are
managed in urban areas, and the average amount of funds managed per area in which funds
are managed is higher. Thus, there is an urban concentration of fund management services.
An important issue of added value is leverage. The data on leverage shows the impact of EU
co-financing rates, which largely determines the calculation of leverage in the regions. Most
variance in leverage can be found in regions in which less Structural Funds are provided.
There is also variance in the ratio between the size of loan portfolios guaranteed and the
amount of SF blocked to guarantee these portfolios. The data suggests that in areas in which
the financing situation is more difficult, the leverage of guarantees is much larger. Guarantees
are also probably more needed in these areas, as in other areas the loans would be provided
without guarantees.
Legacy, the return of funds to the managing authority after being used by the final recipients,
is higher in regions with a lower quality of government. This may relate to the fact that in
these regions financial markets work less well and financial instruments fund investments that
can be financed through regular channels in areas with a higher quality of government.
FI have a different impact in different regions when impact is measured as the number of final
recipients supported. In intermediate areas, fewer final recipients are reached by the
investment, compared to urban or rural areas. Also, in areas with high quality of government,
fewer final recipients are reached by the same investment than in regions with a lower quality
of government. The choice of instruments (products) has a major impact on the number of
final recipients that can be reached. The amount of Structural Funds used per guarantee is
lower than for a loan and much lower than is used to support one enterprise in the form of
equity/venture capital. As there are large regional differences in the uptake of different
instrument types (products), this suggests that many more recipients are reached in areas
with low QoG (where more guarantees are used), than in areas with a high QoG (where more
equity/venture capital is used).
Reporting on jobs created was voluntary for managing authorities, and the data shows that
there are national differences in reporting. The data reveals more about the variation in
national reporting practices than on differences in impact. Data reported on job creation
through FI is even higher in some Member States than the total aggregate jobs reported for
the programmes as a whole, including both grants and FI.
Comparing high uptake versus average regional outcomes suggests that high uptake regions
work more efficiently in relation to management costs and fees. Regions that have spent
more than € 20 million in FI also show higher legacy values. More funds are revolving; the
fundamental rationale for FI is therefore better accomplished. However, a more refined

ESPON 2020 87
analysis of model regions with a specific type of NUTS regions shows that this general
principle is not followed in all regions or type of regions. There is a wide variety of practices in
the use of FI, resulting in a diverse picture of added value and impact. The number of final
recipients per € 1 million invested shows a varied picture. However, in most types of regions
high uptake has been used to enable larger investments in relatively fewer final recipients.

ESPON 2020 88
8 Financial instruments and territorial cohesion: insights from practice
Key points
• Most case study FIs had a positive impact on the development and diversification of
financial markets for SMEs, especially in regions that suffered from financial constraints
in the financial crisis. The additional security provided by public sector involvement
generated a higher capacity to attract private finance. The multiplier effect was highest
for guarantees.
• FIs have supported the development of more sophisticated financial markets, with new
supplies of non-traditional sources of SME finance being generated, such as private
equity, mezzanine funding and risk finance.
• Demand outstripped the finance supply in most cases, but particularly for loan and
guarantee products.
• There is no evidence of cannibalisation effects, either with other public or private
sources of finance.
• The relationship with financial intermediaries is key to the success of Financial
Instruments, based on their capacity, territorial presence and market interests.
• FIs have enabled skills transfer between actors such as national and local promotional
banks and the EIB/EIF.
• The tension between absorption capacity, the need for financial returns and market
profitability and regional policy goals has not been resolved. This affects the final
effectiveness of FIs in terms of regional policy: in most case study regions, FIs were
concentrated in zones with better economic performance, limiting their contribution to
overcoming territorial imbalances within that region.
• FIs have generated an innovative and entrepreneurial culture and knowledge transfer
among actors in the case study regions; this intangible benefit is difficult to measure, but
is valuable for the long-term economic performance of the regions.
• There is an almost unanimous lack of ex post evidence of territorial and economic
impact measured with quantitative and systematic methods. Only the Norwegian case
carried out continuous econometric impact evaluations.
The case studies examine in more depth the implementation of FIs during 2007-13 within five
regions. They thus provide some insight into what might be expected elsewhere in Europe.
The case studies cover the following regions:
• Italy: FI within the ROP Lombardia 2007-13;
• Poland: FI within the ROP Wielkopolskie 2007-13;
• Spain: FI within the ERDF ROP Andalucía 2007-13;
• Sweden: FI within the Mellersta Norrland OP 2007-13;
• Norway: providing a non-EU perspective within the ESPON membership.
This section starts with an introduction to the case studies, and then discusses in turn the
common conclusions which have been drawn relating to the impact of FIs on territorial
ESPON 2020 89
cohesion. These concern: the added value in the financial market for SMEs and urban
projects; governance and administrative challenges; the role of the Financial Intermediary;
geographic distribution within regions; and the impact on the entrepreneurial and innovative
culture of the SME ecosystem. The section ends with a brief conclusions section.
8.1 Introduction
The case studies carried out cover a wide range of different regions which are geographically,
economically and socially diverse. In spite of this diversity, key issues can be highlighted in
order to extract some relevant lessons learned.
As shown in Map 8-1, the case studies have been as follows:
• In Lombardia, the FI “Made in Lombardy” Guarantee Fund (MIL), co-funded by the ROP
ERDF 2007-2013, was set up in October 2008 to improve the overall rating of the credit
portfolio of companies and ameliorate the financial conditions to improve access to the
capital market. The MA entrusted implemented of the fund to regional financial agency
Finlombarda, which selected the financial intermediary. An initial €33 million was
transferred to the fund, guaranteeing a coverage of €500 million with an expected
leverage effect of 15. In terms of coverage, while Finlombarda’s financial commitment
was €100 million, the financial intermediary assumed a total commitment in the amount
of €400 million.
• Andalucía was a pioneer in Spain in establishing Financial Instruments during the 2007-
2013 period: the JEREMIE Fund aimed at promoting innovation and industrial
development through a multi-product strategy and the JESSICA Fund targeted urban
development projects. The JEREMIE Andalucía portfolio has an allocation of €398.7
million, which is broken down into €329 million in debt instruments and €63.45 million in
risk capital. For the JESSICA Fund, the JHFA invested €72.5 million, or 89.1% of the
total amount, in nine projects.
• The Mellersta Norrland region in Sweden was the location of one of the first regional
venture capital funds implemented under the 2000-06 ERDF programmes. The main
reason for the establishment of the co-investment funds, operating pari passu to
strengthen the availability of private capital, was to reduce the capital-equity gap in the
region caused by an imbalance between the private financial resources available and
the demand by SMEs for funding and support. In Mellersta Norrland, there are two
venture capital funds co-financed by ERDF. The combined assets of the two public co-
investment funds are €33 million, and of the €73 million invested in SMEs in the region,
€45 million have been attracted from private co-investors.
• Wielkopolskie was a leading region implementing FIs in Poland in 2007-13. The main
use of FI implementation in Wielkopolskie was through the ROP 2007-13, which
specified two instruments for which regional management systems were set up:
JESSICA and JEREMIE. The overall sum of loans and credits acquired with the support
of FI in the ROP 2007-2013 was PLN 1.8 billion (€422 million).
• In Norway, the Regional Risk Loan is an important and long-standing instrument of
regional policy. For 2017 some NOK 396 million (c€40 million) was allocated to the
Regional Risk Loan loss fund and the associated Regional Investment Grant - almost
30% percent of the regional policy budget. The loan scheme is restricted to designated
regional aid areas (the districts); these cover most of Norway, but only around a quarter
of the population.

ESPON 2020 90
Map 8-1: Case study areas
Source: authors.
According to the geographical distribution of population, as shown in Map 8-2, three of the
case studies have been carried out in ‘connectivity’ regions located in the EU’s demographic
and economic centre, in particular the area which extends from London to Milan (Lombardia
and Wielkopolskie). The other two case study regions are located in the European periphery,
with a lower population density – Andalucía and Mellersta Norrland. In order to provide a non-
EU perspective within the ESPON membership, the Norway Regional Risk Loan completes
the case studies, with special reference to the Nordland region. Moreover, only one of the
abovementioned regions can be considered part of the traditionally referred to “blue banana”
(Lombardia), while the others surround this area with different degrees of connectivity with the
EU economic and demographic centre.

ESPON 2020 91
Map 8-2: GHS population grid 2015 and Case Study areas
Source: authors.
As shown in Map 8-3, urban-rural diversity has been also taken into account: while three of the
case studies cover urban and intermediate regions, three cover rural areas. The
Wielkopolskie case study covers a predominantly rural region with an urban centre (Poznań).

ESPON 2020 92
Map 8-3: Urban-rural typology at NUTS 3 and Case study areas
Source: authors.
The classification of these case studies using the regional typology developed as part of this
study can be seen in Table 8-1.
Table 8-1: Typology of case study regions
Country Region Classification in regional typology (ESIF eligibility, Quality of Government, financial
context, geography)
ES Andalucía C+PO, low QoG, bank based, urban
IT Lombardia RCE+PI, low QoG, bank based, urban
PL Wielkopolskie C+PO, low QoG, former socialist, rural
SE Mellersta Norrland RCE+PI, medium QoG, market based, rural
NO N/A Non-EU ESPON, high QoG, bank based
Source: authors

ESPON 2020 93
Table 8-2: Overview of case study financial instruments
Country Region FI amount spent 2007-13
(€m)
Product type Policy Focus
PL Wielkopolskie 422.00 JESSICA and
JEREMIE
Regional economic fabric development and urban
development projects
ES Andalucía
168.52 JESSICA (€72.5 ) and JEREMIE (€398.7 both risk
capital and debt)
Promoting innovation and industrial development and urban
development projects
SE Mellersta
Norrland
33.00 Co-investment
funds
Regional venture capital funds
applied to Innovative projects
IT Lombardia 33.00 “Made in Lombardy” Guarantee Fund
(MIL)
Improve the access of companies
to the capital market
NO Norway 40.00 Regional Risk Loan ICT and innovative projects
Source: authors
Because of this diversity, the FI cannot be assessed under a methodology which solely takes
into account the typology of the regions, as they all have different and specific characteristics
related to their economic, financial and competitiveness backgrounds.
In spite of this, several common conclusions can be identified, relevant for explaining the
impact of Financial Instruments on territorial cohesion. These transversal key elements can
be classified as follows:
• the added value in the financial market for SMEs and urban projects;
• governance and administrative challenges;
• the role of the Financial Intermediary;
• geographic distribution within regions; and
• the impact on the entrepreneurial and innovative culture of the SME ecosystem.
In the following sections, each of these aspects is analysed in turn.
8.2 Added value in terms of financial markets
Most of the case studies confirm the relevant and positive impact generated by Financial
Instruments on the development and diversification of financial markets for SMEs within
the Case Study regions. While the causes and rationale for implementing FI were similar, the
financial constraints generated by the financial crisis evolved in different ways in the regions.
Both Andalucía and Lombardia lacked available funds not only for new investments, but also
for the regular functioning of firms. In Wielkopolskie, access to commercial finance was
difficult for many companies, especially start-ups. The cases of Mellersta Norrland and the
target areas for the Regional Risk Loan in Norway are closely related to the particular
structural conditions in these remote, very sparsely inhabited territories. Starting from these
different contexts, FI achieved a high degree of diversification of financial sources of funding
for SMEs, and facilitated the development of new urban development projects.

ESPON 2020 94
Multiplier effects of the funds were related to the type of financial product offered, and while
venture capital investments and loans tended to generate a lower multiplier effect,
guarantees increased the multiplier effect. In most cases, SME demand outstripped
supply, avoiding any cannibalisation effect with other public support instruments. In
Wielkopolskie, for example, both grants and loans for SMEs under the ROP were in very high
demand and did not compete with each other, as they responded to different SME needs. The
lack of alternative grant-based support for urban regeneration helped avoid this phenomenon
in the case of JESSICA, along with the entrepreneurial culture in the region.
In financial terms, therefore, FIs generated a more sophisticated financial market for
SMEs, with a higher capacity to attract private finance, thanks to the additional security
provided by the public sector involvement. Risk sharing schemes have been proven to be
effective in attracting private finance to projects and firms which otherwise could not have
accessed appropriate sources of funding. For instance, the amount of funding invested in
JESSICA and JEREMIE projects in Wielkopolskie, and the additional capital mobilised to fund
the investment, generated a substantial leverage effect, making the region a FI leader in
Poland. JESSICA supported 37 loans and JEREMIE supported 8,406 projects, accounting for
65% of total employment generated by the ROP (and 13.5% of all jobs created in the region
between 2007 and 2015). Similarly, high levels of investment were induced in Lombardia,
where 116 projects benefited from the MIL guarantee fund, with a confirmed multiplier effect
of 11.5.
In some cases, the instruments also generated a new supply of non-traditional sources of
SME finance, such as private equity, mezzanine funding and risk finance. This supply
diversified the sources of finance in the region. This was the case in Andalucía, where the
multi-instrument fund and venture capital fund portfolios provided funds for 174 projects,
allowing firms in the region to access funding in a flexible and tailored way, and generating an
induced investment with a multiplier of up to 3.3.
A similar effect was produced in Sweden, where the funds set up in Mellersta Norrland had
a diverse and substantive impact on the region – a remote region where the availability and
utilisation of private risk capital have traditionally been sparse. The co-investment funds have
contributed to a more diversified economy by supporting sectors that have few alternative
sources of funding, and have helped strengthen the local supply of private capital by
attracting private sector partners that would not otherwise have invested. The co-investment
funds have substantially strengthened local entrepreneurship and growth potential,
particularly among early-stage firms, in a number of sectors where equity investment is a
suitable but a regionally scarce source of capital. These are predominantly enterprises that
adopt scalable business models for growth and for whom early-stage capital is much easier to
raise through equity than by other means such as loans. Co-investment into ICT firms is
reported to have contributed in several cases to keeping ICT employers in the Mellersta
Norrland region instead of relocating to capital-rich ICT clusters. Moreover, because

ESPON 2020 95
expected returns are much lower by default in Mellersta Norrland than in metropolitan areas,
the co-investment funds have kept an open mind and invested more diversely in, for
example, the tourism sector, which has clear growth potential in many regions but which often
gets outcompeted by high-technology startups with faster growth predictions in larger finance
hubs. Additionally, the risk threshold for the co-investment funds’ operations is lower than for
fully private investments, as the former have no formal profit requirement, thus the
intervention has contributed to the growth of new ventures at an earlier stage than
private investors commonly fund emerging start-ups.
In Norway, where a complete and systematic evaluation has been carried out, the
additionality effect has been assessed as very high - research suggests that two-thirds of
projects would not have gone ahead on the same basis without it.
A caveat on the potential impact of ESIF FIs on levels of investment was expressed in several
regions. In Wielkopolskie, most of the expenditure in JEREMIE in the region (and across
Poland more generally) concerned the provision of working capital and supporting SMEs’
ongoing expenses, rather than investment. In Andalucía, the crisis caused a change in the
type of financing demanded - instead of demanding financing for investment, companies
demanded financing for debt refinancing and working capital. Although the FI mitigated the
closing of financial markets, the initial scope – investment financing – did not fully respond to
companies’ real needs.
Added value of FIs was not only aimed at improving the financial conditions in each
region: knowledge transfer and capacity building was another of the key elements of
additionality. For instance, in Norway, the financial support allowed the FI manager to
maintain a long-term relationship with final recipients, creating the opportunity for a better
engagement in the projects, compared to those supported with grants. The Swedish case
also confirms the experience of knowledge transfer. In Mellersta Norrland, the co-investments
funds’ ‘active’ form of capital investment brought useful support structures to enhance the
growth of start-ups and early-stage companies. The public and private equity investors
brought considerable competence and experience to the board of directors of aspiring
businesses and thereby brought crucial insight to development and expansion processes.
The co-investment funds also have extensive business networks both within and outside
the region and helped portfolio companies connect with other investors and businesses for
potential future collaboration. There has also been a significant educational role within the
region about processes related to risk finance, which has led to maturing of the local
private investment supply and the establishment of several new private investment
stakeholders. For example, the emergence in 2010 of Startkapital I Norr, a consortium of
private investors spread around northern Sweden, was inspired by its founders’ observation
of the opportunities created by the increase in public risk finance in the region. In Andalucía,
knowledge transfer with the EIF on setting up the JEREMIE Fund was considered key to its

ESPON 2020 96
success. In Lombardia, the experience has enabled the MA to improve their understanding
of the benefits of FIs and strengthened their competences, and those of the fund manager.
In a further example of added value, repaid JEREMIE funding has provided a financial and
institutional basis for the development of Wielkopolskie’s own domestic regional policy. This
has been initially through the establishment of the Wielkopolskie Development Fund
(WFR), set up to manage returning JEREMIE funding and reinvest it in SMEs through loan
products which complement existing JEREMIE products, then over the longer-term with the
WFR set to develop into a regional investment bank.
8.3 Governance and administrative challenges
The regions have used varying governance arrangements to implement the FIs.
However, a common issue noted was that, even in those regions where there was previous
experience in managing Financial Instruments, the administrative burden associated with FIs
and the associated governance requirements were found to be challenging. Time dedicated
to setting up the instruments was considerable and, in some cases, the initial market
assessment was no longer entirely relevant by the time the instrument was operational. For
instance, in Lombardia, the setting up process took more than eight months for only the
selection of the financial intermediary.
Most of the case studies identified the lack of clear interpretation of the 2007-13 implementing
regulations as a challenge: in Andalucía, the lack of clarity in management and audit rules
was identified as a key problem, while Lombardia pointed out that the lack of proper
guidelines led to non-eligible applications. Some of the final recipients in Lombardia
expressed their concern regarding the administrative burden related to the economic
justification of investments.
The loss of absorption has been cause for concern in both Lombardia and Andalucía, where
an important proportion of the investments had to be declared as ineligible, as shown in the
table below (see Table 8-3). The high number of ineligible applications in Lombardia
absorbed the time of the fund manager and financial intermediary, and also had a doubly
negative effect on enterprises, by affecting their confidence and willingness to apply for FIs.
Table 8-3: Investments declared as ineligible
Case study Initial ROP allocation Final eligible execution
Andalucía JEREMIE €235 million €113 million
Lombardia JEREMIE €33 million €9.6 million
Source: authors
This is not just a specific issue for FIs, as it can also be a problem for grant schemes when
quality of government is low. In contrast, in terms of administrative burden, loans under
JEREMIE were noted to offer an advantage over grants in Wielkopolskie, in that it was
possible to apply without waiting for a call for applications, and it was not necessary to factor

ESPON 2020 97
in the criteria for that call, offering much more flexibility to entrepreneurs that could not afford
a commercial loan.
Some absorption pressure has been associated with the constraints imposed by the ESIF
programming period. In Norway, where these constraints are not relevant as the FI is open-
ended and not funded by ERDF, calendar pressures do not affect the implementation of the
funds and eligibility has not been an issue. Trust between actors, institutional expertise and
long experience in managing the fund has facilitated smooth delivery.
Governance challenges include aligning the different interests of public and private
actors. As private actors do not have a mandate for territorial policy, and they conduct
themselves on a financial returns basis, the alignment of different aims has not always been
easy. In Mellersta Norrland, for example, there has been some tension over finding the right
balance between the main objectives of FI intervention. On one hand, the public funds should
work towards the objective of company growth and new job creation, while on the other, they
should also aim at more long-term regional growth and enhancing the establishment of a
lasting private venture capital presence. While admitting that this two-part objective has
prompted questions about how the two ambitions should be prioritised, both co-investment
funds in Mellersta Norrland emphasized that this has not hindered to their day-to-day
operations nor investment decisions. The assessment of companies in which to invest is
made on a purely economic basis and without considering regional policy implications or
external factors, in the same way that private venture capital investors operate (although the
co-investment funds have no formal profit requirement). The objective of long-term regional
stability and growth is understood by the managers of the public funds to already be inherent
in the market-complementing intervention itself (and is also pursued through the reinvestment
of returns in the region).
The combination of absorption capacity, the need for financial returns and market
profitability and regional policy goals was not as smooth as desired, affecting the final
effectiveness of the instruments in terms of regional policy. In Lombardia, one major
reason for the decision to discontinue the FI before the end of the programming period was
that the financial intermediary prioritised other commercial interests over the promotion of the
Made in Lombardy guarantee fund. The combination of administrative burden, an evolving
financial climate and the fact that they could offer other, more profitable, tailor-made financial
products dissuaded them from promoting the FI - so much so, that some final recipients
observed that the financial intermediary’s approach was not very proactive when requesting
additional information.
As a result, long term processes aimed at building confidence between actors, capacity
building and previous experience of fund management can be identified as key for
success in the implementation and governance of FI.

ESPON 2020 98
8.4 The role of the Financial Intermediary
The role of the Financial Intermediaries has been proven to be critical in all the case studies.
As the FIs relied on private Financial Intermediaries, their capacity, territorial presence and
market interests have been proven to be one of the key factors for the success of
Financial Instruments.
In the case of Lombardia, acting with only one Financial Intermediary seemed to be one of
the weaknesses of the instrument. The election of just one Financial Intermediary whose
investment strategy was not fully aligned with the ROP and the FI aims became a problem
once execution started. While the initial allocation of funding was €33 million, only €9 million
was spent, and the FI was discontinued before the end of the programming period. Lessons
have been learned, in that in the 2014-20 programming period, the selection of financial
intermediaries is no longer restricted to one main player.
In contrast, in Andalucía, the MA decided to work with multiple Financial Intermediaries
aligned with the overall strategy. In the case of the JESSICA initiative, the European
Investment Bank decided to change one of the Financial Intermediaries due to their lack of
capacity to guarantee the proper delivery of the funds. In this case, the role of the Financial
Intermediary has been much more important, as the final Financial Intermediary acted not
only as source of funding, but as an actual fund promoter, providing advisory services to
recipients. The Financial Intermediary helped the final recipients to design, calculate and
model the projects, and also helped to find additional funding.
Despite initial difficulties, Andalucía fund managers identified that a strong and diversified
network of Financial Intermediaries was one of the keys to success. This has also been
highlighted as one of the strengths in the Wielkopolskie case, where the Financial
Intermediary was recognised as one of the driving elements to build a culture for the use of
the ESIF Funds.
Moreover, in the case of the Mellersta Norrland region, the importance of the Financial
Intermediary role is also confirmed. The extensive personal and professional networks
among local authorities, investors, and entrepreneurs in Mellersta Norrland are crucial
in helping overcome territorial challenges. This underlines the importance of the co-
investment funds being physically present in the different parts of the region, and the
Mellersta Norrland funds have succeeded in this by hosting different kinds of networking
events and raising awareness among industry networks about their presence in the region.
Private co-financers have also played an important role in overcoming territorial
challenges by creating pan-regional consortia and collaborations between private
investors, tackling the critical-mass challenge by ‘pooling’ both the supply of and
demand for risk finance capital from the entire region. Another example can be found in
Norway, where the structure of Innovation Norway with their regional presence has also
been a key feature of successful FI implementation. For many businesses in remote
areas, Innovation Norway is the main source of finance and advisory services, and their

ESPON 2020 99
presence is maintained in circumstances that the private sector is unable to sustain for
commercial reasons. There is a nevertheless even here a tension noted between
maintaining a regional presence in remote regions and having sufficient critical mass.
Box 8-1: Two examples of the importance of the Financial Intermediary role : the case of Mellersta Norrland region and Norway.
The extensive personal and professional networks among local authorities, investors and
entrepreneurs in Mellersta Norrland are crucial in helping overcome territorial challenges.
This underlines the importance of the co-investment funds being physically present in the
different parts of the region, and the Mellersta Norrland funds have succeeded in this by
hosting different kinds of networking events and raising awareness among industry networks
about their presence in the region. Private co-financers have also played an important role in
overcoming territorial challenges by creating pan-regional consortia and collaborations
between private investors, tackling the critical-mass challenge by ‘pooling’ both the supply of
and demand for risk finance capital from the entire region.
Another example can be found in Norway, where the structure of Innovation Norway with
their regional presence has also been a key feature of successful FI implementation. For
many businesses in remote areas, Innovation Norway is the main source of finance and
advisory services, and their presence is maintained in circumstances that the private sector is
unable to sustain for commercial reasons. There is a nevertheless even here a tension noted
between maintaining a regional presence in remote regions and having sufficient critical
mass.
Source: authors
8.5 Geographical allocation of funds
While one of the main goals for ESIF co-financed Financial Instruments is supporting
territorial cohesion between regions, most of the case studies noted a lack of territorial
focus within the regions. Most of the investments were allocated in the sub-regional
areas with highest economic activity.
In the case of Wielkopolskie, the JEREMIE Fund operated in a spatially-blind manner. The
MA had considered focusing JEREMIE interventions on counties with higher unemployment
and poor socio-economic conditions, however, this territorial focus was ultimately
abandoned. While loans and guarantees reached all sub-regions of Wielkopolskie, the
distribution was skewed towards the region’s capital city (Poznań) and its county, where most
economic activity is concentrated. For the JESSICA Fund, the territorial focus included broad
swathes of cities to ensure maximum eligibility and uptake. It is worth noting that in
Wielkopolskie, this concentration has encouraged the managing authority to consider a more
targeted approach in 2014-20 to promote loans in the lagging sub-regions, and that the
management of the new Wielkopolskie Development Fund, which uses revolved JEREMIE
and JESSICA funds, aims to take a more place-based approach.

ESPON 2020 100
There was also geographical concentration noted in Andalucía, where the capital province
of Seville accounted for 47% of total JEREMIE allocations. In the case of Lombardia, two
provinces (Brescia and Milano) received almost 50% of the funds, as most of the
manufacturing sector (the target of the Made in Lombardy Fund) is concentrated in these
provinces. The Mellersta Norrland case also highlighted a degree of concentration in the
main urban areas where the demand for risk finance was higher. The focus of investments
under the co-investment funds, measured both in the number of beneficiaries and in the
volume of the invested capital, was centred in the main urban areas rather than in rural
municipalities, and also along the Western Baltic coast rather than in sparsely-populated
inland areas. This partly relates to the supply of private co-investors: in some cases there
may be promising entrepreneurial activity with high growth potential, but few private co-
investors available in that part of the programme area. In addition, part of the regional
variation in demand can be explained by the variation in interest and need for risk capital
between different sectors.
The concentration in those areas where economic activity is higher is a logical outcome of the
agglomeration of firms within the territory. Firms tend to be established in the areas where
most of the economic and business services are located, including financial services, utilities,
professional services and logistic capacities. The territorial allocation of demand for
Financial Instruments is heavily affected by this agglomeration, and this is even more
notable where the sophistication of the financial instrument is higher. While loans and
guarantees can be delivered to a wide range of businesses, only a very small group of
high growth firms are able to properly absorb risk capital finance, and they tend to be
concentrated in urban areas rather than in intermediate or rural ones, as was found in
Andalucía and Mellersta Norrland.
The existence of an existing ecosystem for this kind of businesses has been
highlighted as one of the key elements for Financial Instrument deployment. The aims
of promoting regional innovation and territorial cohesion are not always fully correlated, as
innovation requires a proper ecosystem which tends to be territorially concentrated. Unless
there is a clear mandate for investing in the most deprived areas - as in the case of the
Regional Investment Fund in Norway - market dynamics tend to promote concentration
in specific areas. The aim of the Norwegian scheme is to facilitate access to finance in rural
and remote areas as part of the wider economic development strategy for the sparsely-
populated regions, and the scheme has an explicit territorial dimension, insofar as Innovation
Norway seeks to support projects outside the main population centres where the private
banking presence is limited.
The drive for absorption also affects territorial focus. In the case of Wielkopolskie, the
territorial focus became a subordinate aim to the drive to ensure absorption and the return
and reinvestment of funds. If absorption is in the driving seat of the Financial Instrument,
territorial balance can be jeopardized.

ESPON 2020 101
It is also important to note that, during the 2007-13 period, ESIF FIs were aimed solely at
enterprise support and urban areas/energy efficiency and renewables, and this is reflected in
their geographic distribution. In the 2014-20 period, scope to use FIs has been extended to all
thematic objectives and all ESI Funds, including EAFRD and EMFF. In theory, this could
broaden the scope for FIs to address, for example, the needs of businesses in more rural
areas.
8.6 Impact on entrepreneurial and innovative culture of the SME ecosystem
Most of the case studies reflect the positive effect of FIs on the innovative and
entrepreneurial culture in the region. Financial Instruments provided specific finance for
investments which, due to the risk aversion of commercial operators, was not previously
being developed. Therefore, firms were able to increase their capacity to undertake complex
investment projects in fields such as R&D. At the same time, the provision of funds
encouraged the entrepreneurial culture in some areas of the regions. In this way, Financial
Instruments supported the creation of a kind of knowledge transfer among the
involved actors: public administrations, Financial Intermediaries, co-investors and
firms.
While it is difficult to measure the contribution of the instruments to this immaterial capital, it
has been identified in most of the case studies. The know-how of the Financial Intermediaries
was transferred to the Financial Instruments and then to firms and entrepreneurs, thus
increasing the sophistication and complexity of the economic and social dynamics at a
territorial level. This kind of intellectual capital must not be underestimated, as most modern
economic growth theory signals this factor as one of the key elements for regional
competitiveness and performance.
As an example, the Financial Intermediary in the JESSICA fund in Andalucía was committed
to advising local authorities and promoters in the structuring and operation of complex
infrastructure projects, using Public-Private Partnerships and other project finance modalities,
which are far from the more traditional modalities of infrastructure and urban projects. This
generation of knowledge is a valuable outcome of the JESSICA fund.
Similar experiences can be identified in other case studies. Knowledge transfer - for example
from the large national and international banks BGK and EIB, who have a great deal of
experience with FI implementation - was also highlighted by the Wielkopolskie case study.
The Lombardia case study noted the importance of the Financial Intermediary in the capacity
building of the Financial Instrument, allowing the Managing Authority to achieve a better
understanding of the financial industry. This effect was also transmitted to final recipients. In
this case, the FI promoted a combination with grants that generated a specific additionality, as
the Made in Lombardy initiative was accompanied by a grant in the form of a voucher to
assist with business counselling or business plan preparation.

ESPON 2020 102
Scope to combine instruments and forms of support in this way is a notable feature of the
Norwegian case, where grants are sometimes offered as part of the package, if it can help to
bring a private bank on board, for example, if a bank is concerned that risk of default is too
high because financing is wholly in the form of debt. This may involve putting together a
package of finance involving the Regional Risk Loan, Innovation Norway commercial loans,
and possibly small scale grant funding. Applicants often approach Innovation Norway
accompanied by commercial banks with the aim of assembling a funding package and
securing the involvement of private banks through risk-sharing. An interesting point to
note is that, on occasion, the involvement of Innovation Norway in projects in which
commercial banks had been initially uninterested can lead to banks financing projects in their
entirety. Even though there is ultimately no loan transaction with Innovation Norway, this is
regarded as a success in policy terms.
It is important to note that the level of experience in FI implementation varied widely within the
regions. In Lombardia, for example, this was the first time the regional administration or fund
manager had managed a fund of such a size, and the FIs were ‘pioneer’ programmes in
Andalucía. In the case of the Swedish and the Norwegian FIs, the learning curve was perhaps
less steep, as there was long-term experience to draw upon.
8.7 Conclusions
According to the key common elements among the case studies, the following main
conclusions can be drawn:
• There is a trade-off between the different targets of Financial Instruments -
absorption capacity, promotion of innovation and sophistication of economic activity, and
territorial cohesion - within the case study regions that does not appear to be fully
compatible. The results of most of the case studies noted a lack of territorial focus within
the regions, as most of the instruments placed less emphasis on territorial factors
within the region than on other priorities. The outcome is that in these cases FIs
were concentrated in zones with better economic performance. It can be concluded
that FIs have not contributed (in these cases) to overcoming territorial imbalances.
• Most of the Financial Instruments generated a positive impact in terms of
diversification of sources of financing both for firms and urban projects. This is
particularly relevant in the case of those regions that suffered from strong financial
constraints during the financial crisis. Multiplier effects of the funds were related to the
type of financial product offered, and while venture capital investments and loans tended
to generate a lower multiplier effect, guarantees increased the effect. Demand
outstripped the finance supply in most cases, but particularly for loan and guarantee
products. The revolving nature of the instruments has also allowed their financial impact
to be increased, reaching higher number of firms and supporting the creation of
employment and new enterprises.
• Governance and administrative arrangements have been challenging during the
implementation and execution phases. Heavy administrative burdens have eroded
the effectiveness of the instruments, producing a lack of security in the execution and
audit phases. In several regions, a significant part of the demand was ineligible. Lack of

ESPON 2020 103
legal security on the management of the funds in 2007-13 has been considered as
a weakness, especially in those regions with less existing institutional capacity.
• Furthermore, aligning the different interests of public and private actors has been
challenging and therefore the combination of absorption capacity, the need for financial
returns and market profitability and regional policy goals was not as smooth as desired,
affecting the final effectiveness of the instruments in terms of regional policy.
• The role of Financial Intermediaries is very important especially in regions where
there is weak institutional capacity. The process of selecting, screening and
managing the relationship with them has proven to be a key element for the success of
Financial Instruments. Financial Instruments appear to be more effective where
Financial Intermediaries have a clearly focused investment strategy, in full coherence
with the FI targets. There is an opportunity for skills to be transferred between more and
less experienced actors, for example, between national promotional banks or the
EIB/EIF and local actors.
• One of the key positive outcomes of the instruments is the generation of innovative
and entrepreneurial culture and know-how transfer among the actors. While this
immaterial capital is difficult to measure, the case studies highlighted this effect as one
of the most positive ones, which can be relevant to the long-term economic performance
of the regions.
• It is notable that there is an almost universal lack of ex post evidence of territorial
and economic impact measured with quantitative and systematic methods. Only the
Norwegian case carried out continuous econometric impact evaluations. Field and
econometric impact evaluation practices are crucial in order to continuously improve the
performance and impact of FIs.

ESPON 2020 104
9 Policy proposals for the debate on financial instruments in EU Cohesion policy post-2020
These conclusions and policy proposals draw on the data analysis and the case studies
carried out for this project, as well as the wider literature and discussions held during the
EWRC events in October 2018. Before turning to these, some general remarks are in order.
A first general point to emphasise is the heterogeneity of financial instruments. Financial
instruments in Cohesion policy have come to be referred to en bloc – largely because specific
regulatory arrangements apply to them. In reality, the commonalties across the range of
policy tools classed as FIs are few. The single shared characteristic is that financial
instruments involve repayable funds. Beyond this, the scale of intervention ranges from
measures exceeding €500 million and operating over wide geographical areas, to those with
budgets as low as €10,000 operating very locally. The instruments discussed in the case
studies exemplify this range – from the two co-investment funds in Mellersta Norrland with
combined assets of €33 million, to the allocation of nearly €400 million to the JEREMIE fund
in Andalucía. Governance arrangements involve diverse institutions and structures, from the
EIB group and national promotional banks, to public financial institutions at the regional level,
private intermediaries and associations such as chambers of commerce. For enterprises,
financial products range from large scale generic business loan schemes, to small-scale
equity funds focused on specific activities, sectors or classes of enterprise; urban
development and energy efficiency FIs can involve complex integrated financial packages to
upgrade particular districts, but also simple householder loan schemes to improve residential
insulation. This diversity is featured in the case studies – even within regions FIs funded very
different projects: in Andalucía typical JEREMIE projects involved expanding SMEs and
improving their performance, with a special focus on start-ups and tech firms, while JESSICA
projects mainly involved large-scale pubic infrastructure facilities.
Financial instruments are also diverse in territorial terms. Cohesion policy FIs differ
widely in scope, partly linked to the OPs through which they are financed. They may cover a
single regional OP corresponding to NUTS 2 and a population of a few hundred thousand,
several NUTS 2 regions under a multiregional OP or a national OP covering a population of
several tens of millions. Moreover, as the study shows, up to five OPs may offer Cohesion
policy FIs in the same region, often for quite similar purposes. These disparate geographies
and overlapping jurisdictions complicate any analysis of the distribution of spend.
Another important territorial dimension to the diversity of FIs is the spatial focus. Most
financial instruments are ostensibly spatially neutral; however, in practice, this means
that they are demand-led, with investment tending to be concentrated in the more
economically-developed areas within their territory. By contrast, a few FIs explicitly seek to
offset regional or local disadvantage, such as the Regional Risk Loan in Norway. From a
national perspective, the separate regional co-investment funds in Sweden can also be
viewed as seeking to address regional disadvantage, by using a regional breakdown to

ESPON 2020 105
provide an element of ring-fencing. In the main, however, financial instruments are demand-
led and a spatial focus is rare.
Financial instruments differ widely in domestic importance. In some instances co-financed
FIs are an additional credit line in an existing institution so that ESIF essentially reinforces
existing domestic budgets for the same purpose (this is the case for some FIs operated by
German Lander). Elsewhere, they are operated as free-standing new instruments, sometimes
on a pilot or experimental basis to maximise the use of modest OP budgets (as in the London
Green Fund). Alternatively, cofinanced FIs may account for a significant share of public
repayable finance for SMEs, as in Lithuania, for example.
A second key point to highlight is that financial instruments are only suitable for some
policy objectives and where the investment will generate revenues and cost-savings
enabling the initial capital advanced to be repaid. The use of financial instruments varies
according to the wider economic context – the case studies for Andalucía and Lombardia
show how important Cohesion policy FIs were in the aftermath of the financial crisis; similarly,
the Norway case study noted how the Regional Risk Loan supported the fishing sector when
commercial banks were unwilling to. In this sense, publicly-backed FIs can address a gap in
access to finance that may vary over time, as well as (partially) replacing grants as a
mechanism to promote investment. The heterogeneity of FIs is therefore a strength since a
mix of financial products can respond flexibly to local conditions. That said, even in policy
areas such as SME development where financial instruments are prevalent and their role is
self-evident, grants often have an essential part to play. The data analysis highlights how
small a proportion of Cohesion policy spend FIs represent, even in policy areas where they
might be considered most relevant.
A third general point concerns the quality of the evidence base. A major challenge for the
study has been the collection of relevant data. The data gathering process exposed both the
paucity of the data available and its lack of comparability. These shortcomings are a
significant obstacle to a fine-grained assessment of the added value and impact of FIs.
Moreover, the different ‘forms of finance’ reported by managing authorities do not map directly
to financial instruments, and the policy priority codification in the Implementation Regulation
do not correspond to the policy targets addressed by financial instruments in 2007-13. As a
result, it is in most cases impossible to assess the complementarity of grants and financial
instruments. The role of data gathering and reporting is given further consideration below.
Moving on to policy recommendations, a key theme that emerges is that of managing the
tensions between potentially conflicting objectives: should the bureaucracy surrounding FIs
be 'lighter touch' than for grants given that the sums are (in principle) repayable? Should
reporting on FIs be less onerous with a view to encouraging their use, or does data gathering
for audit and evaluation take precedence? How important is the performance of an FI in terms
of using the funds available and generating returns and how is this balanced with taking risks

ESPON 2020 106
that strictly commercial investors will not? And, in the present context, how do these tensions
play out in territorial terms?
There is a need to ensure that administrative requirements are not a disincentive to
use FIs rather than grants.
The regulatory framework for FIs in Cohesion policy has been challenging for the Commission
and managing authorities alike. The issues have been documented in detail elsewhere and
centre on the complexity of the rules, especially in relation to State aid and public
procurement, the status of guidance in the context of audit and wider concerns at the extent
of reporting.
There are additional layers in the ‘chain of command’ for ESIF FIs compared to purely domestic
financial instruments and compared to ESIF grant schemes. This means that the
implementation of ESIF FIs requires a degree of commitment on the part of managing
authorities, and/or a conviction that the potential wider benefits of using financial instruments
instead of grants will indeed materialise. Research on the uptake of financial instruments in
2014-20 suggests that even in the area of SME support, EU regulatory issues are a
significant reason for MAs not to use FIs (European Commission, 2017a). It is worth noting,
however, that the adoption of the Omnibus Regulation during the 2014-20 period introduced a
number of simplifications and the draft regulations for the 2021-27 period propose additional
simplifications; both were generally welcomed by managing authorities.29
Care should be taken to ensure that regulatory requirements do not undermine policy
objectives.
Some regulatory requirements have the potential to undermine the effectiveness of financial
instruments. The combination of the short programming period and the N+3 requirements can
conspire to make managing authorities more risk-averse. In operating ESIF there is
considerable emphasis on actually disbursing funds in order to ensure they are not lost. This
can result in the prioritisation of “shovel ready” or “safe” projects rather than riskier
investments. This may perversely encourage a situation where co-financed financial instruments
are more likely to crowd-out private funding because fund managers have an incentive to
support ‘easy’ projects rather than insist that funds be restricted to projects that had been
rejected by commercial funders.
The seven-year programming period also impedes the operation of FIs; this timescale is
arbitrary and short, especially given the delays involved in the planning and approval of
operational programmes – progress in implementing FIs has been slow in 2014-20, even
among managing authorities with longstanding experience of operating FIs. From an
economic development perspective, there is no logic to the need to close funds at the end of
29Michie R, Mendez C and Gal F (2018) Results, Review and Reform: Delivering programme objectives while preparing for the post-2020 Cohesion policy, IQ-Net Review Paper 43(1), European Policies Research Centre Delft.

ESPON 2020 107
the programming period, and retender for fund managers. The management of the Norwegian
Regional Risk Loan offers some lessons here. In particular, the loss fund budget provided by
the Ministry (KMD) to back the scheme is not reimbursed or clawed back, but rolled over from
one year to the next on a continuous basis. As such, there is no incentive to use up year-end
monies and because Innovation Norway requires that applicants have exhausted commercial
funding options before approaching it for support, this promotes a more policy-focused use of
funds, rather than one driven by absorption pressures.
There is a need to ensure that financial instruments do not reinforce existing
disparities in access to finance, with potential negative consequences for territorial
cohesion.
Partly related to the above, financial instruments have the potential simply to reinforce
existing spatial disparities in access to finance because of the pressure to disburse budgets
and avoid decommitment. Perhaps as a result (and also due to the absence of delineated
assisted areas for ESIF since 2000-06), there are few examples of FIs that proactively target
disadvantaged areas. In the current ESIF period, the JESSICA programme for Rotterdam is
one such example, focused on deprived urban areas through an ITI (Integrated Territorial
Investment); in 2007-13 the BRUSOC fund in the Brussels region targeted entrepreneurs in
the former Objective 2 areas. Outside the EU, the Norwegian Regional Risk Loan is restricted
to designated aid areas, and even within these, seeks explicitly to target funding outside the
main population centres. By contrast, the Wielkopolskie case study showed that ambitions to
focus on deprived areas can in practice be stymied by wider regulatory complexities and the
pressures of short timescales with the result that positive discrimination in favour of
disadvantaged areas is diluted or lost.
The ex ante assessment is an important innovation in the 2014-20 Regulations and has
generally been welcomed by domestic policymakers for giving greater clarity to policy
objectives and better insights into funding requirements. In the context of territorial cohesion
there is a need to be clear about what the policy objectives actually are, and potentially
accept that there may be a trade-off between a focus on disadvantaged regions and some of
the benefits of financial instruments e.g. FIs may be more costly to implement in more remote
regions. In short, publicly-backed FIs should not largely replicate what the private sector can
do, but rather intervene where it cannot or is unwilling to at the scale required.
It is also worth bearing in mind that during 2007-13, the focus of FIs was restricted to SME
support, and to a much lesser degree urban and energy efficiency projects. This may have a
bearing on the location of investment. The widening of thematic coverage of FIs in 2014-20
may change investment patterns, though early indications from Commission reporting on the
2014-20 period suggest that implementation in areas other than SME support has been very
slow.

ESPON 2020 108
Policymakers point to the importance of policy learning, experience and progressing
from simple to more sophisticated financial products.
Co-financed financial instruments tend to follow one of two models. First, an existing domestic
mechanism is provided with an additional block of funding (for instance, a national
promotional bank establishes an additional credit line), which is essentially disbursed along
the same or similar lines as existing domestic funding. Second, a bespoke fund is established
in response to specific identified needs. The first option might be regarded as somewhat
mundane since ESIF FIs are simply supplementing domestic funding streams, but this is not
only a relatively quick and “safe” route to implementation, it also takes advantage of existing
institutional and administrative capacity. The second approach is considerably more risky from
the managing authority’s point of view, and more time-consuming, though the outcome might
be more innovative. It may also be necessary, since there may not be an existing domestic
vehicle to which it can be linked. The Commission's ex post evaluation of 2007-13 FIs found
that those which performed best were those that were able to draw extensively on the
experience either of existing systems and structures, or past programmes, while committing
funding allocations that could realistically be absorbed. In similar vein, policymaker debates at
the 2018 EWRC stressed the value of 'starting simple' – beginning with straightforward and
standardised financial products that use existing structures and moving to more complex
forms of intervention as experience grows.
Since the period under study (2007-13), administrative capacity has been a focus of attention
within the debates on Cohesion policy implementation more generally. Specifically relevant to
financial instruments, EU level Technical Assistance platforms such as fi-compass have been
introduced in 2014-20, and made significant efforts to increase capacity within the field of
financial instruments.
Consideration should be given to the role of data collection and reporting for financial
instruments to improve the understanding of policy effects and added value.
The scale and complexity of reporting on financial instruments is a source of frustration to
many managing authorities. However, in spite of the administrative burden involved in data
collection, it still yields insufficient information to enable an assessment of the effectiveness of
financial instruments as a policy instrument.
The quality of the data collected on financial instruments, even in mandatory annual reporting,
is poor: the information is often incomplete, error-prone or cannot easily be reconciled with
other indicators. Reporting of voluntary information is even more sparse. Few managing
authorities collected any performance-related data on the operation of financial instruments.
The most common indicator collected is job creation, but the definitions vary between
countries (sometimes within them) and it is unclear to what extent jobs can genuinely be
attributed to the FI, thus precluding any credible assessment of impact on employment. This
raises the wider issue of the relationship between reporting, accountability and impact. It can
be argued that the delegation of implementation to financial intermediaries requires more and

ESPON 2020 109
better reporting of information in order to ensure that investments are made in line with OP
priorities. Conversely, as financial instruments are repayable, it can be argued that reporting
should be less onerous for FIs than for grants, except in cases where the capital advanced is
not recovered or guarantees are called in. This is not to suggest that losses per se should be
a source of concern – if public FIs are targeted appropriately they are likely to incur losses
since they are targeting investments rejected by commercial investors – but simply that the
loss of public funds should be justified and subject to appropriate audit procedures.
That said, it remains clear that FIs do have positive effects. Although frequently used for
working capital rather than to fund investment, FIs have helped mitigate the impact of
financial crisis in many regions. There is also evidence that they have led to a more
sophisticated and diversified financial market for SMEs, generated substantial leverage and
legacy for reinvestment and enabled knowledge transfer and capacity building. The wider
literature also shows the importance of time and experience in policy evolution, and how that
carries through into policy performance (European Commission, 2016).
Governance structures need to combine financial expertise and local knowledge if they
are to address territorial cohesion.
Implementation of ESIF financial instruments typically involves a steep learning curve for
managing authorities. The case studies have emphasised the key role which national and
regional promotional banks and financial intermediaries with local knowledge play in
successful implementation. However, local expertise may not always be present. In some
central and eastern European countries – notably Hungary – there has been an explicit
strategy to involve local financial intermediaries in Cohesion policy FIs, contributing to the
building-up of local financial markets, but in others, such as Romania and Bulgaria
implementation is more centralised. A potentially growing challenge in the centralisation of the
commercial banking sector and the decline local branch networks, especially in remote and
rural areas. In Norway the regionalised network of Innovation Norway offices seeks in part to
compensate for this trend and is testament to the importance of long-term strategies to
address access to finance in remote regions. More generally, other case studies also
emphasise the building of trust and confidence between actors as key to success in FI
implementation.
Given the focus of this report, it is appropriate to reflect on what can be said about the
contribution of Cohesion policy financial instruments to territorial cohesion. Major
complications in addressing this question arise from the heterogeneity of financial instruments
described at the start of this chapter. Nevertheless, there are some insights from the territorial
distribution of FIs, the analysis of added value and the case studies.
It is clear that most financial instruments are 'spatially-blind', in other words there is generally
no geographical focus to intervention within the jurisdiction in which they are available. This
means they have the potential to reinforce existing spatial disparities in access to finance
within a country or region, which tends to disadvantage rural and remote regions. It may well

ESPON 2020 110
be that this is even more likely in the context of financial instruments than grants - if financial
intermediaries are risk-averse or have limited incentive to develop markets beyond the main
urban centres, investment may be disproportionately concentrated - but there is insufficient
data to substantiate this.
Few financial instruments proactively target disadvantaged areas. Such FIs typically involve
more effort, more risk and higher costs: it may be more difficult to find financial intermediaries
willing and able to target disadvantaged regions, so management costs may be higher;
projects may be riskier, leading to poorer returns on the investment and smaller legacies; and
it may simply be harder to identify viable projects against the time pressures imposed by the
OP schedule, which tends to prioritise absorption of funds. In short, while there is evidence
that FIs which target disadvantaged regions can work well, there may be a trade-off between
a focus on disadvantaged regions and some of the benefits of using FIs in terms of costs and
legacy.
Factors such as Cohesion policy eligibility, quality of government, financial context and
geography have an impact on the patterns of uptake of financial instruments. However, these
factors are interrelated and, fundamentally, are influenced by both the scale of Cohesion
policy funding and, related, the presence or absence of domestic FIs.
• In terms of financial context, regions in market-based financial systems spend a
higher share of Structural Funds through FIs than those in bank-based or former
socialist countries. However, this pattern is partly a function of lower absolute levels
of Cohesion policy funding in these regions and the relative absence of OP priorities
(such as basic infrastructure) for which FIs are not suited.
• Uptake of FIs in absolute terms is highest in regions with a low quality of
government; this is mainly because quality of government is quite closely linked to
levels of economic development, and poorer regions qualify for larger Cohesion
policy allocations.
• The 'reach' of FIs, measured in terms of numbers of financial recipients, is also
greatest in regions with low quality of government. This is primarily a function of the
choice of product type, which tends to be loans or guarantees rather than equity.
Caution should be exercised in drawing conclusions from these patterns which can easily be
influenced by the impact of high spend on FIs in just a few regions; differences between
regions often just reflect different policy choices. For example, a managing authority may opt
to assign a large part of it budget to FIs, because the budget is small, but will generate a
legacy; conversely, a managing authority may eschew the use of FIs because the budget is
small, so the administrative effort is considered disproportionate. Of key importance here, this
study has only considered Cohesion policy FIs – and these typically represent only a very
small part of the overall economic development funding jigsaw.

ESPON 2020 111
Last, it is interesting to note that the relationship between financial instruments and
territorial cohesion is very much on the current policy agenda. Commission proposals for
financial instruments in 2021-2730 do not substantially alter the framework for Cohesion policy
FIs, but tend in the direction of simplification and continuity, which has broadly been
welcomed by managing authorities; however, one innovation is the scope to allocate ESIF
funds to the new InvestEU initiative. Proposals for InvestEU involve a significant reshaping of
the current EU level FI landscape. The geography of EU level FIs has been a matter of some
debate in the past, and in recent negotiations the European Parliament, the Committee of the
Regions and some domestic stakeholders have expressed concern at the link between ESIF
funds and the new InvestEU programme, and at the spatial targeting of InvestEU itself. This
has emphasised the need for newer and smaller promotional banks to play a larger role and
for the efforts of more and less experienced financial institutions to be combined in order to
improve geographical diversification. It remains to be seen how and whether the scope to
allocate ESIF funds to InvestEU will be taken up, and what the territorial implications of this
will be.
30 See Scientific Annex for discussion of these proposals.

ESPON 2020 112
10 Bibliography and References
Alessandrini P and Zazzaro A (1999) A ‘possibilist’ approach to local financial systems and regional development: the Italian experience. In Martin, R (ed.) Money and the Space Economy, Chichester: Wiley, pp 71-92.
Alessandrini P, Presbitero, A and Zazzaro A (2009) Banks, distances and firms’ financing constraints, Review of Finance, 13 (2) 261-307.
Amable B (2003) The Diversity of Modern Capitalism. Oxford: Oxford University Press.
Applica, Ismeri Europa and Cambridge Economic Associates (2016) Country report France - Work Package 1 Ex post evaluation of Cohesion Policy programmes 2007-2013, focusing on the European Regional Development Fund (ERDF) and the Cohesion Fund (CF), European Commission, Brussels, https://ec.europa.eu/regional_policy/sources/docgener/evaluation/pdf/expost2013/wp1_fr_report_en.pdf (accessed 22/05/2019)
Avdeitchikova S (2009) False expectations: reconsidering the role of informal venture capital in closing the regional equity gap, Entrepreneurship and Regional Development, 21 (2) 99-130.
Azevedo F (2015) Economic, Social and Territorial Situation of Sicily: in-depth analysis, Policy Department B: Structural and Cohesion Policies, European Parliament, Brussels, http://www.europarl.europa.eu/RegData/etudes/IDAN/2015/540372/IPOL_IDA(2015)540372_EN.pdf (accessed 22/05/2019)
Bachtler J, Martins J O, Wostner P and P Zuber (2017) Towards Cohesion policy 4.0 Structural Transformation and Inclusive Growth, Regional Studies Association, http://www.regionalstudies.org/uploads/documents/Cohesion_Policy_4.0_-_Structural_Transformation_and_Inclusive_Growth.pdf
Ban C (2013) From Cocktail to Dependence: Revisiting the foundations of Dependent Market Economies, GEGI Working Paper, 3, Centre for Finance Law and Policy, Boston University.
Berggren B and Silver L (2012) Financing Entrepreneurship in Different Regions: the failure to decentralise financing to regional centres in Sweden, Journal of Small Business and Enterprise Development, 17(2).
Bohle D and Greskovits B (2007) The State, Internationalization, and Capitalist Diversity in Eastern Euope, Competition & Change, 11(2): 89-114.
Casolaro L and Mistrulli P (2008) Distance, lending technologies and interest rates, SSRN, available at SSRN: http://ssrn.com/abstract=1243402
Centre for Strategy and Evaluation (CSES) (2007) Comparative Study of Venture Capital and Loan Funds Supported by the Structural Funds, Final Report, August 2007.
Charron, N, Dijkstra L and Lapuente V (2014) Regional Governance Matters: Quality of Government within European Union Member States, Regional Studies, 48(1), 68-90.
Charron, N, Dijkstra L and Lapuente V (2015) Mapping the Regional Divide in Europe: A Measure for Assessing Quality of Government in 206 European Regions. Social Indicators Research 122(2): 315–346
Commissioner Creţu (2015) Speech at the 55th Congress of the European Regional Science Association in Lisbon, Portugal, 28 August 2015.
Committee of the Regions (2016) Opinion on EFSI 2, http://cor.europa.eu/en/activities/opinions/Pages/opinion-factsheet.aspx?OpinionNumber=CDR%205690/2016
Committee of the Regions (2016) Results of Committee of the Regions online consultation on obstacles to investments at local and regional level, https://portal.cor.europa.eu/europe2020/news/Pages/survey-results-obstacles.aspx
Conference of Peripheral and Maritime Regions (CPMR) (2016) Position Paper on the future of EU Cohesion Policy, 3 November 2016
Conference of Peripheral and Maritime Regions (CPMR) (2016) The Territorial Dimension of Cohesion Policy Financial Instruments, Brussels: Conference of Peripheral Maritime Regions of Europe.
Conference of Peripheral and Maritime Regions (CPMR) (2017) Update on CPMR work on post-2020 Cohesion policy, Technical Note February 2017
Council of European Municipalities and Regions (2017) The future of Cohesion Policy. A simplified and integrated territorial approach,

ESPON 2020 113
http://www.ccre.org/img/uploads/piecesjointe/filename/CEMR_position_paper_future_of_cohesion_policy_EN.pdf
Craig B, Jackson W and Thomson B (2008) Credit market failure intervention: Do government sponsored small business credit programs enrich poorer areas? Small Business Economics, 30, 345-360.
Cumming D and Dai N (2010) Local bias in venture capital investments, Journal of Empirical Finance, 17, 362-380
De Beer, J, Van der Gaag, N. and Van der Erf, R. (2014) New classification of urban and rural NUTS 2 regions in Europe, Working paper no. 2014/3, NIDI, The Hague
Degryse H and Ongena S (2005) Distance, lending relationships and competition, Journal of Finance, 60, 231-266.
Demirguc-Kunt, A. and Levine R. (1999) Bank-based and market-based financial systems - cross-country comparisons, Policy Research Working Paper 2143, The World Bank Development Research Group, Washington DC
DeYoung R, Glennon D and Nigro P (2008) Borrower-lender distance, credit scoring, and loan performance: evidence from informational-opaque small business borrowers, Journal of Financial Intermediation, 17, 113-143.
Dijkstra L. and Poelman H (2008) Remote Rural Regions: How proximity to a city influences the performance of rural regions, Regional Focus 1/2008, http://ec.europa.eu/regional_policy/sources/docgener/focus/2008_01_rural.pdf (accessed 10/10/2017)
EPP Group in the European Parliament (undated) The Future of Cohesion policy, http://cpmr.org/wpdm-package/the-future-of-cohesion-policy-epp-group-position-paper/?wpdmdl=10039&ind=2k2Yo8QdgkNqGiDreu2Iu7NFCbVdjIbQ9raHVqZtO6yELj3TcwMOGjhUrOtSIdnTno865uir9coQYhV14LMiIw
Ernst & Young (2016) Ad-hoc audit of the application of the Regulation 2015/1017 (the EFSI Regulation), Final Report 14 November 2016
ESPON (2013) INTERCO: Indicators of Territorial Cohesion, ESPON, Luxembourg.
ESPON (2014) ESPON Atlas 'Mapping European Territorial Structures and Dynamics', https://www.espon.eu/sites/default/files/attachments/ATLAS-ESPON-2013_0.pdf (accessed 13/01/2019)
European Commission (2009) Working Document No. 7. Indicative Guidelines on evaluation methods: Reporting on core indicators for the European Regional Development Fund and the Cohesion Fund, https://ec.europa.eu/regional_policy/sources/docoffic/2007/working/wd7_indicators_en.pdf (accessed 18/02/2019)
European Commission (2012) Financial Instruments in Cohesion Policy, SWD(2102)36 final, 27 February 2012.
European Commission (2016) 2007-2013 ERDF-CF achievements - core Indicators **BY COUNTRY, available online: https://cohesiondata.ec.europa.eu/2007-2013/2007-2013-ERDF-CF-achievements-core-Indicators-BY-/w9mt-s8si/data (accessed 23/05/2019)
European Commission (2016) Evaluations of the 2007-2013 programming period. Ex Post Evaluation of the ERDF and CF: Key outcomes of Cohesion Policy in 2007-2013. DG Regio http://ec.europa.eu/regional_policy/it/policy/evaluations/ec/2007-2013/
European Commission (2016) Financial instruments under the European Structural and Investment Funds Summaries of the data on the progress made in financing and implementing the financial instruments for the programming period 2014-2020 in accordance with Article 46 of Regulation (EU) No 1303/2013 of the European Parliament and of the Council Situation as at 31 December 2015, European Commission, Brussels.
European Commission (2017) Summary of data on the progress made in financing and implementing financial engineering instruments reported by the managing authorities in accordance with Article 67(2)(j) of Council Regulation (EC) No 1083/2006 Programming period 2007-2013, Situation as at 31 March 2017 (at closure), European Commission, http://ec.europa.eu/regional_policy/sources/thefunds/fin_inst/pdf/closure_data_fei_2017.pdf (accessed March 2019)
European Commission (2017a) My Region, My Europe, Our Future, Seventh Report on Economic, Social and Territorial Cohesion, http://ec.europa.eu/regional_policy/sources/docoffic/official/reports/cohesion7/7cr.pdf

ESPON 2020 114
European Commission (2017b) Reflection Paper on EU Finances, https://ec.europa.eu/commission/sites/beta-political/files/reflection-paper-eu-finances_en.pdf
European Council (2015) Outcome of the Council Meeting, 3401st Council meeting, General Affairs, Luxembourg, 23 June 2015.
European Court of Auditors (2012) Cost-effectiveness of Cohesion Policy Investments in Energy Efficiency, ECA Report 21/2012.
European Court of Auditors (2014) Cohesion policy funds support to renewable energy generation — has it achieved good results?, ECA Special Report 06.
European Court of Auditors (2016) Implementing the EU budget through financial instruments — lessons to be learnt from the 2007-2013 programme period Special Report no 19-2016. http://publications.europa.eu/webpub/eca/special-reports/financial-instruments-19-2016/
European Court of Auditors (2016) Opinion No 2/2016 (pursuant to Article 287(4) of the Treaty on the Functioning of the European Union (TFEU)) concerning the proposal for a Regulation of the European Parliament and of the Council amending Regulations (EU) No 1316/2013 and (EU) 2015/1017 and the accompanying Commission evaluation in accordance with Article 18(2) of Regulation (EU) 2015/1017 — EFSI: an early proposal to extend and expand, Official Journal of the European Communities C465; 13 December 2016.
European Court of Auditors (2019) European Fund for Strategic Investments: Action needed to make EFSI a full success, Special Report 03.
European Parliament (2015) European Parliament resolution of 28 October 2015 on cohesion policy and the review of the Europe 2020 strategy, http://www.europarl.europa.eu/sides/getDoc.do?type=TA&reference=P8-TA-2015-0384&language=EN&ring=A8-2015-0277
European Parliament (2017) Motion for a EP resolution on building blocks for a post-2020 EU Cohesion policy, http://www.europarl.europa.eu/sides/getDoc.do?pubRef=-//EP//TEXT+REPORT+A8-2017-0202+0+DOC+XML+V0//EN
European Policies Research Centre (2016) Evolution or Revolution? Exploring new ideas for Cohesion Policy 2020+, EoRPA Paper 16(4), EPRC, University of Strathclyde, Glasgow. http://www.eprc.strath.ac.uk/eorpa/Documents/EoRPA_16_Conf/EoRPA_Paper_16_4%20-%20Final.pdf
EUROSTAT (2013) Updated urban-rural typology: integration of NUTS 2010 and the latest population grid, Statistics in focus 16/2013, http://ec.europa.eu/eurostat/statistics-explained/index.php/Archive:Urban-rural_typology_update (accessed 10/10/2017)
Evans D (2013) Access to Finance Review: Stage 1 Report & Stage 2 Report, Welsh Government
Florida R and Smith D (1991) Venture capital formation, investment, and regional industrialisation, Annals of the Association of American Geographers, 83, 434-451.
Growth Analysis (2016) Effects & experiences – final evaluation of the Swedish regional co-investment funds 2009–15
Hall P and Soskice D (2001) Varieties of Capitalism: The Institutional Foundations of Comparative Advantage. Oxford: Oxford University Press.
Harrison R, Mason C and Robson, P (2010) Determinants of long-distance investing by business angels in the UK, Entrepreneurship and Regional Development, 22 (2) 113-137.
High Level Group on Own Resources (2016) Future Financing of the EU http://ec.europa.eu/budget/mff/hlgor/library/reports-communication/hlgor-report_20170104.pdf
Jiménez G, Salas V and Saurina J (2009) Organisational distance and use of collateral for business loans, Journal of Business and Banking, 31, 234-243.
Martin R (1999) Money and the Space Economy, Chichester: Wiley.
Martin R, Berndt C, Klagge B and Sunley P (2005) Spatial proximity effects and regional equity gaps in the venture capital market: evidence from Germany and the United Kingdom, Environment and Planning A, 37, 1207-1231;
Martin-Oliver, A (2019) Financial exclusion and branch closures in Spain after the Great Recession, Regional Studies 53(4) pp562-573.
Masiak C, Moritz A and Lang F (2017) Financing patterns of European SMEs revisited: an updated empirical taxonomy and determinants of SME financing clusters, EIF Working Paper 2017/40.

ESPON 2020 115
Mason C (2007) Venture capital: a geographical perspective in H Landström (ed.) Handbook of Research on Venture Capital, Cheltenham: Edward Elgar, pp 86-112;
Mason C and Harrison R (2002) The geography of venture capital investments in the UK, Transactions of the Institute of British Geographers, 27, 427-451.
Mason C, Michie R and Wishlade F (2012) Access to finance in Europe's disadvantaged regions: Can 'new' financial instruments fill the gap? EoRPA Paper 12/6, Report for the EoRPA Regional Research Consortium http://www.eprc-strath.eu/eorpa/research-papers/thematic-papers.html
Mason, C and Harrison, R (2003) Closing the regional equity gap? A critique of the Department of Trade and Industry's Regional Venture Capital Funds initiative, Regional Studies, 37, 855-868
Mazars, Ecorys and EPRC (2013) Financial Instruments: A Stock-taking Exercise in Preparation for the 2014-2020 Programming Period, Final Report to European Investment Bank, Luxembourg: EIB.
Meiklejohn, R. (1999) The Economics of State Aid, in ‘State aid and the Single Market’, European Economy, 3.
Mendez C and Bachtler J (2015) Permanent Revolution in Cohesion Policy: Restarting the Reform Debate, EoRPA Paper 15/4, EPRC, University of Strathclyde, Glasgow. http://www.eprc.strath.ac.uk/eorpa/Documents/EoRPA_15_Conf/EPRP%2093.pdf
Michie R and Wishlade F (2011) ‘Between Scylla and Charybdis: Navigating financial engineering instruments through Structural Fund and State aid requirements’, IQ-Net Thematic Paper No. 29(2), European Policies Research Centre, University of Strathclyde, Glasgow.
Michie R, Wishlade F and Gloazzo C (2014), Guidelines for the Implementation of Financial Instruments: Building on FIN-EN – sharing methodologies on FINancial ENgineering for enterprises, Final Report to Finlombarda SpA
Moritz A, Block J and Heinz A (2015) Financing Patterns of European SMEs: An Empirical Taxonomy, EIF Working Paper 2015/30, Luxembourg.
Murray, G C (1998) A policy response to regional disparities in the supply of risk capital to new technology-based firms in the European Union, Regional Studies, 32, 405-419.
Murray, G C (2007) Venture capital and government policy, in H Landström (ed) Handbook of Research on Venture Capital, Cheltenham: Edward Elgar, pp 113-151
Nightingale, P et al (2009) From Funding Gaps to Thin Markets: Designing Hybrid VC Schemes for the 21st century, SPRU, University of Sussex for BVCA and NESTA.
Nilsson Jan-Evert (2012) Expert evaluation network delivering policy analysis on the performance of Cohesion policy 2007-2013, Year 2 – 2012, Task 1: Financial engineering Sweden, Final Report to the European Commission, Directorate-General Regional Policy
Nölke A and Vliegenthart A (2009) Enlarging the Varieties of Capitalism: The Emergence of Dependent Market Economies in East Central Europe, World Politics 61(4), 670–702.
Núñez Ferrer J et al for HLGOR (2016) Study on the potential and limitations of reforming the financing of the EU budget, http://ec.europa.eu/budget/mff/hlgor/library/highlights/hlgor-studies-external-studyonfinancingofeu-budget-june-2016_en.pdf
Nyikos, G (2015) The role of financial instruments in improving access to finance: Combined microcredit in Hungary, EStIF 2, 105.
Nyikos G (2016) Financial Instruments in the 2014-20 Programming Period: First Experiences of the Member States, Research for the REGI Committee, European Parliament.
Ramboll and IEEP (2015) Ex post evaluation of Cohesion policy programmes, focusing on the European Regional Development Fund (ERDF) and Cohesion Fund (CF), Work Package 8: Energy efficiency in public and residential buildings, Final Report to the European Commission.
Rodríguez-Pose A and Garcilazo E (2015) Quality of Government and the Returns of Investment: Examining the Impact of Cohesion Expenditure in European Regions, Regional Studies, 49(8), 1274-1290.
Rouse J and Jayawarna D (2011) Structures of exclusion from enterprise finance, Environment and Planning C: Government and Policy 29, 659-676.
Siedschlag, I et al (2014) Access to External Financing and Firm Growth, background study for the European Competitiveness Report 2014, ESRI.
Sorsenson O. and T Stuart (2001) ‘Syndication networks and the spatial distribution of venture capital investments’, American Journal of Sociology, 106 (6), 1546-1588.

ESPON 2020 116
Teorell, Jan, Staffan Kumlin, Stefan Dahlberg, Sören Holmberg, Bo Rothstein, Anna Khomenko & Richard Svensson. 2017. The Quality of Government OECD Dataset, version Jan17. University of Gothenburg: The Quality of Government Institute, http://www.qog.pol.gu.se doi:10.18157/QoGOECDJan17
Tykvová T, Borell M and Kroencke TA (2012) Potential of Venture Capital in the European Union, European Parliament, Directorate-General for Internal Policies, Policy Department A, Economic and Scientific Policy.
University of Bergen (2017) Regionalisation of ESIF payments 1989-2015, Report to the European Commission, https://publications.europa.eu/en/publication-detail/-/publication/cd2133d5-1d04-11e8-ac73-01aa75ed71a1/language-en/format-PDF/source-68135162
University of East Anglia (2008) University of East Anglia corporate plan 2008-2012 http://www.uea.ac.uk/documents/3154295/0/UEA+Corporate+Plan+2008-2012.pdf/7fe412e5-d6db-4e4c-8a1f-1ab6e3e3bb65 (accessed 25/05/2019)
University of East Anglia (2011) Financial Statements 2010 – 2011, https://portal.uea.ac.uk/documents/6207125/7082556/2010-2011FinancialStatements.pdf/ (accessed 25/05/2019)
University of East Anglia (2014) Financial Statements 2013 – 2014, https://portal.uea.ac.uk/documents/6207125/7082556/FinStatement1314_Final5.pdf/14392128-7061-4a44-ba67-f04ff24a3aaa (accessed 25/05/2019)
Veugelers R (2011) Mind Europe’s early equity gap, Bruegel policy contribution, Issue 2011/18. December 2011
WIIW (2016) Consolidation of Financial Data 1989-2013, report to European Commission, DG Regio https://publications.europa.eu/en/publication-detail/-/publication/31c556d1-e394-11e6-ad7c-01aa75ed71a1/language-en/format-PDF/source-68135194
Wishlade F (2018) Financial Instruments in ESIF: Past, present and future conditional, European Structural and Investment Funds Journal, Volume 6 (2018), Issue 2.
Wishlade F, Michie R and Gloazzo C (2014) Guidelines for the Implementation of Financial Instruments: Building on FIN-EN – sharing methodologies on FINancial ENgineering for enterprises http://www.fin-en.eu/files/9114/1355/7888/FIN-EN_Guidelines_EN.pdf
Wishlade F, Michie R and Vernon P (2017) Financial instruments for energy efficiency and renewable energy, Research for the REGI Committee, Brussels: European Parliament.
Wishlade F, Michie R, Familiari G, Schneidewind P and Resch A (2016) Financial Instruments for enterprise support Final Report Work Package 3 Ex post evaluation of Cohesion Policy programmes 2007-2013, focusing on the European Regional Development Fund (ERDF) and the Cohesion Fund (CF), Report to the European Commission, http://ec.europa.eu/regional_policy/sources/docgener/evaluation/pdf/expost2013/wp3_exec_summary.pdf
Wishlade F, Michie R, Robertson P and Vernon P (2017) Improving the take-up and effectiveness of financial instruments, Report to the European Commission, http://ec.europa.eu/regional_policy/en/information/publications/studies/2017/improving-the-take-up-and-effectiveness-of-financial-instruments
Wishlade, F and Michie R (2015) Financial instruments in EU Cohesion policy: what do we know about the regional incidence of financial instruments and why might it matter? Paper to RSA conference, Piacenza, Italy.
Wishlade, F, et al (2016) Financial Instruments under Cohesion Policy 2007-13: How have Member States and Selected Financial Institutions Respected and Preserved EU Financial Interests?, Report prepared for the European Parliament Committee on Budgetary Control.
Zhao T and Jones-Evans D (2017) SMEs, banks and the spatial differentiation of access to finance, Journal of Economic Geography, 17, 791-824.

ESPON 2020 117
ESPON 2020 – More information
ESPON EGTC 4 rue Erasme, L-1468 Luxembourg - Grand Duchy of Luxembourg Phone: +352 20 600 280 Email: [email protected] www.espon.eu, Twitter, LinkedIn, YouTube
The ESPON EGTC is the Single Beneficiary of the ESPON 2020 Cooperation Programme. The Single Operation within the programme is implemented by the ESPON EGTC and co-financed by the European Regional Development Fund, the EU Member States and the Partner States, Iceland, Liechtenstein, Norway and Switzerland.