delft university of technology volume loss in shallow
TRANSCRIPT

Delft University of Technology
Volume loss in shallow tunnelling
Vu, M.N.; Broere, Wout; Bosch, Johan
Publication date2016Document VersionAccepted author manuscriptPublished inTunnelling and Underground Space Technology
Citation (APA)Vu, M. N., Broere, W., & Bosch, J. (2016). Volume loss in shallow tunnelling. Tunnelling and UndergroundSpace Technology, 59, 77-90.
Important noteTo cite this publication, please use the final published version (if applicable).Please check the document version above.
CopyrightOther than for strictly personal use, it is not permitted to download, forward or distribute the text or part of it, without the consentof the author(s) and/or copyright holder(s), unless the work is under an open content license such as Creative Commons.
Takedown policyPlease contact us and provide details if you believe this document breaches copyrights.We will remove access to the work immediately and investigate your claim.
This work is downloaded from Delft University of Technology.For technical reasons the number of authors shown on this cover page is limited to a maximum of 10.

Volume loss in shallow tunnelling
Minh Ngan Vua,b,∗, Wout Broerea, Johan Boscha
aDelft University of Technology, Geo-Engineering Section, Stevinweg 1, 2628 CN Delft,
the NetherlandsbHanoi University of Mining and Geology, Faculty of Civil Engineering, Vietnam
Abstract
Although volume loss has an important effect in estimating the ground move-ments due to tunnelling in the design stage, this parameter is often deter-mined by experience. This makes it difficult to estimate the impact on vol-ume loss when changing project parameters like soil conditions, depth of thetunnel or sensitivity of the surroundings. This paper investigates the rela-tionship between volume loss and cover-to-diameter C/D ratio in shallowtunnelling. Based on a number of (empirical) relations from literature, suchas the stability number method and an analysis of the bentonite and groutflows, volume loss at the face, along the shield and at the tail is determined.Long-term volume loss behind the shield is also estimated by means of con-solidation. In this way a band width of achievable volume loss for futureprojects is derived.
Keywords: cover-to-diameter ratio; volume loss; TBM; tail void; shallowbored tunnel
1. Introduction
Tunnelling often leads to settlements of the soil surface due to over-excavation, soil relaxation and inefficient tail void filling. The magnitudeof volume loss is influenced by tunnelling management, characteristics of thetunnel boring machines (TBM), and the geotechnical conditions. In pre-dictions of surface settlement (Peck, 1969) and subsurface settlement (Mairet al., 1993), the volume loss is often determined by engineering experience
∗Corresponding author: Tel.:+31 15 278 1930; Fax:+31 15 278 1189Email address: [email protected]/[email protected] (Minh Ngan Vu)
Preprint submitted to Tunnelling and Underground Space Technology March 25, 2016
© 2018 Manuscript version made available under CC-BY-NC-ND 4.0 licensehttps://creativecommons.org/licenses/by-nc-nd/4.0/

and data from previous cases. This makes it difficult to correctly assess thevolume loss for a future project under radically different conditions like ashallow depth of the tunnel and/or very different soil parameters. A groundmovement analysis in Vu et al. (2015a) shows the important role of volumeloss for settlement calculations and in predicting the effects on existing build-ings induced by tunnelling. Especially for (very) shallow tunnels near build-ing foundations, the impact of changes in volume loss is large. Most previousstudies on volume loss start from a given volume loss and establish defor-mation patterns from that or correlate surface observations to volume lossat the tunnel for specific projects. Mair et al. (1982); Attewell et al. (1986);Macklin (1999); Dimmock and Mair (2007) studied the volume loss witha summary of projects in overconsolidated clay relating to the volume lossat the tunnelling face. Verruijt and Booker (1996); Verruijt (1997); Strack(2002) applied analytical methods for predicting the ground loss around thetunnel. Loganathan (2011) proposed volume loss calculations but only ap-proximated volume loss along the shield with the worst case, and does nottake the consolidation into account. Meanwhile, Bezuijen and Talmon (2008)showed the effect of grouting pressure on the volume loss around the TBMbut none of these includes a detailed method to estimate volume loss alongthe TBM. This paper aims to estimate the volume loss when tunnelling withlimited C/D ratios (i.e. less than 1) in various soils with a focus on slurryshield tunnelling.On the basis of the studies by Attewell and Farmer (1974), Cording andHansmire (1975) and Mair and Taylor (1999), the volume loss in the tun-nelling progress can be estimated by the sum of the following components asshown in Figure 1:- Volume loss at the tunnelling face: soil movement towards the excavationchamber as a result of movement and relaxation ahead of the face, dependingon the applied support pressures at the tunnelling face;- Volume loss along the shield: the radial ground loss around the tunnel shielddue to the moving soil into the gap between the shield and surrounding soil,which can be caused by overcutting and shield shape. The bentonite used inthe tunnelling face flows into the gap, while the grout used in the shield tailalso flows in the opposite direction. Due to the drop of bentonite and groutflow pressures in a constrained gap, soil can still move into the cavity whenthe soil pressure is larger than the bentonite pressure or grout pressure;- Volume loss at the tail: when precast segments are placed, the advance ofthe shield results an annular cavity between the segments and surrounding
2

Figure 1: Volume loss components
soil. Grout is used in order to prevent surrounding soil moving into the gap.Volume loss at the tail depends on applied grouting pressure at the tail andproper volume control, where high grout volume and pressure may lead tolocal heave and low volume to increase settlements as indicated in Figure 1;- Volume loss behind the shield tail due to consolidation: in this void alongthe tunnel lining, grout consolidates and forms a grout cake, and the stresschanges induced in the soil may lead to long-term consolidation settlementsin soil volume above the tunnel. Other causes of volume loss are shrinkageof grout and long-term lining deformations. However, their contributions tothe total volume loss are small comparing to the above factors.The total volume loss VL in tunnelling progress can be given as:
VL = VL,f + VL,s + VL,t + VL,c (1)
where VL,f is volume loss at the tunnelling face, VL,s is volume loss along theshield, VL,t is volume loss at the tail, and VL,c is volume loss due to consoli-dation.To illustrate the impact of the different contributions in different soil condi-tions, estimates are made for a number of ideal soil profiles which are derivedfrom Amsterdam North-South metro line project (Gemeente-Amsterdam,
3

2009), consisting of a single soil type with most important properties asdefined in Table 1, where γ is volumetric weight, ϕ is the friction angle, K isthe initial coefficient of lateral earth pressure, c is cohesion, Cs is compressionconstant, Cswel is swelling constant, ν is Poisson’s ratio and Es is the stiffnessmodulus of the ground.
Table 1: Soil parameters used in design of Amsterdam North-South metro line project(Bosch and Broere, 2009; Gemeente-Amsterdam, 2009)
Soil type γ(kN/m3) ϕ(o) K(−) c(kN/m2) Cs(−) Cswel(−) ν(−) Es(kN/m2)Sand 20 35 0.5 - - - 0.2 20000Clayey sand 17.9 35 0.4 2 - - 0.2 12000Clay 16.5 33 0.5 7 100 1000 0.15 10000Organic clay 15.5 20 0.65 5 80 800 0.15 5000Peat 10.5 20 0.65 5 25 250 0.15 2000
2. Volume loss at the tunnelling face
When tunnelling, the soil ahead of the excavation chamber generally hasthe trend to move into the cavity which is created by the tunnelling machine.The soil volume moving towards the face depends on applied support pres-sures and can be controlled by adjusting the support pressures. In stabilityanalysis for tunnelling, the stability number N proposed by Broms and Ben-nermark (1967) is widely used. By studying the relationship between thisstability number and volume loss at tunnelling face, Attewell et al. (1986),Mair et al. (1982), Mair (1989), Macklin (1999) and Dimmock and Mair(2007) presented a method to determine the expected volume loss based onobserved data.The stability number N is given by:
N =γ (C +D/2)− s
cu(2)
where s is the support pressure at the tunnelling face and cu is undrainedshear strength of the soil.In shallow tunnelling, the support pressure at the tunnelling face shouldbe high enough to avoid the collapse to the excavation chamber but alsolimited to prevent blow-out and fracturing. Firstly, the required support
4

pressure must be higher than or at least equal to the total of water pressureand horizontal effective soil pressure taking into account three dimensionalarching effects. The wedge model, which was studied by Anagnostou andKovari (1994), Jancsecz and Steiner (1994) and Broere (2001), is commonlyapplied to determine the minimum support pressure smin. In the case ofshallow tunnelling, the minimum support pressure smin can be derived fromthe wedge model, as follows:
smin = σ,h + p = σ,
vKA3 + p = γ,zKA3 + p (3)
where p is pore pressure and KA3 is the three dimensional earth pressurecoefficient determined in Jancsecz and Steiner (1994).Secondly, the maximum support pressures are often estimated as to avoidblow-out and fracturing. According to Vu et al. (2015b), the maximumsupport pressures in the case of blow-out are given by:
s0,t,max = γ(
H −π
8D)
+ 2H
D
(
c+1
2HKyγ
′tanϕ
)
−aD
4(4)
s0,b,max = γ(
H −π
8D)
+ 2H
D
(
c+1
2HKyγ
′tanϕ
)
+ γTπd+aD
4(5)
where s0,t,max and s0,b,max are the maximum support pressures at the top andbottom of the tunnel.In normally consolidated soil, according to Mori et al. (1991), the maximumpressure in the case of fracturing is presented as:
sf = σ,vK + p+ cu (6)
However, field data show that the higher allowable support pressures are of-ten applied in the tunnelling face, according to NEN-3650 (2012) and reportsby BTL (Boren van Tunnels en Leidingen), in the Netherlands. Therefore,the support pressures boundaries are determined with the minimum supportpressure and the maximum support pressure in the case of blow-out as indi-cated in Equations 4 and 5 above.Figure 2 shows the relationship between the required support pressures andthe C/D ratio with the tunnel diameter D = 6m in clay. We will elabo-rate the calculation method for these conditions and present overall resultsfor different diameters and soil conditions later in Figure 10. According toVu et al. (2015b), only C/D ratios larger than 0.4 are studied, as less cover
5

0.4 0.6 0.8 1 1.2 1.4 1.6 1.8 20
50
100
150
200
250
300
350
400
450
C/D
supp
ort p
ress
ure(
kN/m
2 )
s
min
s0,t,max
s0,b,max
sfracturing
Figure 2: The range of support pressures at the tunnelling face of a tunnel with a diameterD = 6m in clay
would lead to unreasonable large volume loss, and the upper 3 to 4 meterof soil in urban areas are often taken up by various utilities and thereforewould not be available for tunnelling. The support pressures calculated hereare the minimum support pressure from a wedge model and the maximumsupport pressures for fracturing and blow-out at the top and the bottom ofthe tunnel.Figure 3 shows the calculated stability number N for these support pres-sures. Since the applied support pressures are derived from the wedge sta-bility model, fracturing and blow-out conditions, N values in this figure aresmaller than 2. It means that the tunnelling face is stable with these supportpressures.O’Reilly (1988) indicated that a relation exists between the volume loss attunnelling face VL,f and the load factor LF , which is estimated by the ratioof working stability number N and the stability number at collapse NTC , asfollows:
LF =N
NTC
(7)
6

C/D0.4 0.6 0.8 1 1.2 1.4 1.6 1.8 2
N
0
0.2
0.4
0.6
0.8
1
1.2
1.4
1.6
1.8
2
with smin
with s0,t,max
with sfracturing
Figure 3: The range of stability number N for a tunnel with a diameter D = 6m in clay
where NTC is estimated according to Mair and Taylor (1999) as:For 0 ≤ C/D ≤ 1:
NTC = 2 + 2ln
(
2C
D+ 1
)
For 1 ≤ C/D ≤ 1.8:
NTC = 4ln
(
2C
D+ 1
)
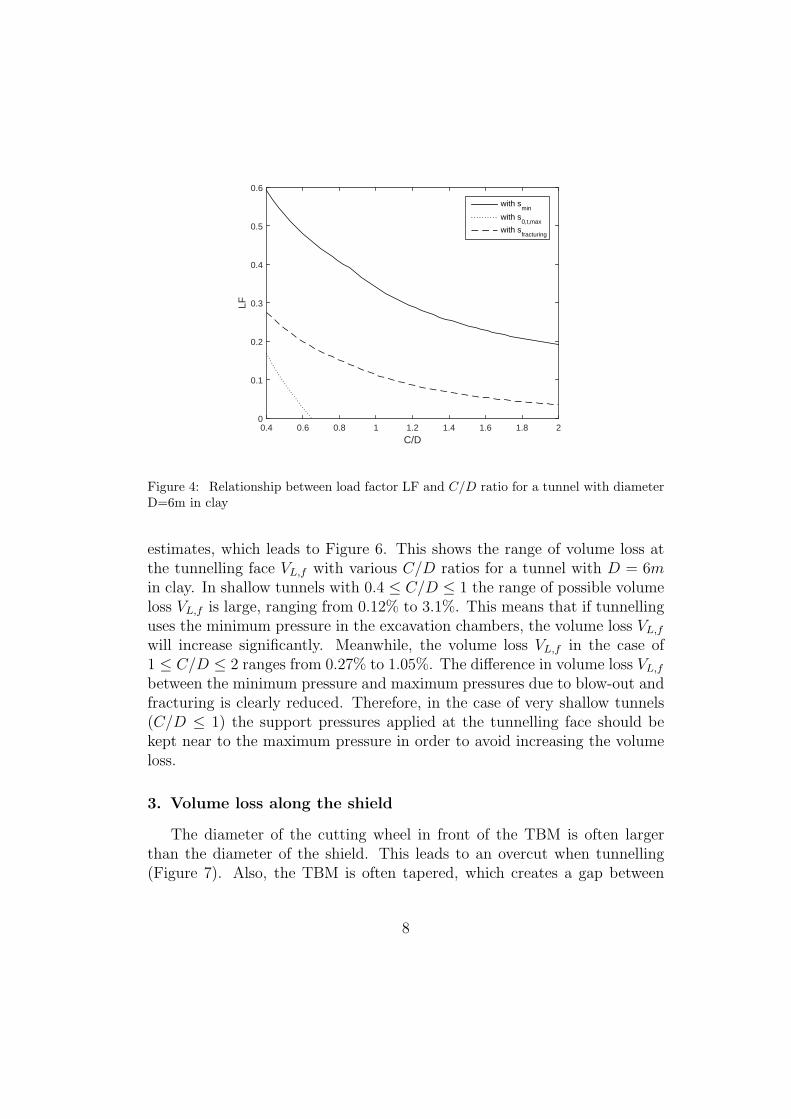
Figure 4 shows the relationship between the load factor LF and the C/Dratio. The load factor is less than 0.6 for the minimum support pressure andhas the trend of reducing when the C/D ratio increases. This means thatthe tunnel becomes safer with regards to estimating the support pressureswhen the C/D ratio becomes larger.From the analysis of case history data of the load factor LF and the volumeloss at the tunnelling face (Figure 5), Macklin (1999) presented a formula tocalculate the volume loss at the tunnelling face VL,f as:
VL,f (%) = 0.23e4.4LF (8)
Equation 8 can be used to convert the load factor LF to the volume loss VL,f
7
C/D0.4 0.6 0.8 1 1.2 1.4 1.6 1.8 2
LF
0
0.1
0.2
0.3
0.4
0.5
0.6
with smin
with s0,t,max
with sfracturing
Figure 4: Relationship between load factor LF and C/D ratio for a tunnel with diameterD=6m in clay
estimates, which leads to Figure 6. This shows the range of volume loss atthe tunnelling face VL,f with various C/D ratios for a tunnel with D = 6min clay. In shallow tunnels with 0.4 ≤ C/D ≤ 1 the range of possible volumeloss VL,f is large, ranging from 0.12% to 3.1%. This means that if tunnellinguses the minimum pressure in the excavation chambers, the volume loss VL,f
will increase significantly. Meanwhile, the volume loss VL,f in the case of1 ≤ C/D ≤ 2 ranges from 0.27% to 1.05%. The difference in volume loss VL,f
between the minimum pressure and maximum pressures due to blow-out andfracturing is clearly reduced. Therefore, in the case of very shallow tunnels(C/D ≤ 1) the support pressures applied at the tunnelling face should bekept near to the maximum pressure in order to avoid increasing the volumeloss.
3. Volume loss along the shield
The diameter of the cutting wheel in front of the TBM is often largerthan the diameter of the shield. This leads to an overcut when tunnelling(Figure 7). Also, the TBM is often tapered, which creates a gap between
8

Figure 5: Volume loss VL,f and load factor LF (Macklin, 1999)
9

C/D0.4 0.6 0.8 1 1.2 1.4 1.6 1.8 2
Vl(%
)
0
0.5
1
1.5
2
2.5
3
3.5
with smin
with s0,t,max
with s0,b,max
with sfracturing
Figure 6: Volume loss at tunnelling face for a tunnel with diameter D = 6m in clay
the shield skin and the surrounding soil. Additional gapping can also oc-cur when the TBM moves in curves as indicated in Festa et al. (2015). Inthis study, the effect of curves is not included. This gap is often filled bybentonite, which flows from the tunnelling face and/or grout which comesfrom the shield tail. In practice, the grout and bentonite pressures are oftenlarger than the vertical soil pressure at the tunnelling face and tail. From theobservation of Bezuijen (2007), there are three possible bentonite and groutflows that can occur along the shield when tunnelling. Firstly, the bentoniteflows from the tunnelling face to the tail and pushes the grout at the jointbetween the tail and the TBM. Secondly, the grout flows from the tail to thetunnelling face and pushes the bentonite away. Thirdly, the grout flows fromthe tail to the tunnelling face and the bentonite also flows in the oppositedirection. The flows of bentonite and grout were also simulated in Nagel andMeschke (2011). In shallow tunnelling, due to the possibility of blow-out andfracturing, there is a limitation of applied grout and bentonite pressures atthe tunnelling face and the tail.According to Bezuijen (2007), both liquids, the grout in the shield tail andthe bentonite applied at the tunnelling face are assumed to behave as the
10

Figure 7: Bentonite and grout flows along the shield and lining segments
Table 2: Input parameters of tunnel boring machine
Diameter of shield D 6mLength-to-diameter P/D ratio of the shield 1Reduction of shield diameter a 0.2%Overcutting hovercut 0.015mShear strength of grout τgrouty 1.6kPaShear strength of bentonite τ bentonitey 0.8kPa
Bingham liquids, such that the yield stress is governing in the flow behaviour.The flow pressures in grout and bentonite reduce along the shield as in Fig-ure 7. The reduction of grout pressure along the shield is given by:
∆p =∆x
wj
τy (9)
where ∆p is the change of the pressure due to flow, ∆x is a length incrementalong the TBM, wj is the joint width between the tunnel and the surroundingsoil and τy is a shear strength of the grout around the TBM.In this study, the volume loss along the shield is calculated with input pa-rameters as indicated in Table 2 with the following approach.As an example, the calculation is carried out with a case of tunnel with
11

distance from tail (m)
0 1 2 3 4 5 6
gro
ut
pre
ssu
re (
kN/m
2)
0
20
40
60
80
100
120
140
grout pressure
bentonite pressure
soil pressure
smin
sfracturing
s0,t,max
VL=0.7% VL=0.64%
VL=0.56%
Figure 8: Bentonite and grout pressures along a shield with D = 6m in clay
D = 6m and C/D = 0.75 in clay. Figure 8 shows the change of grout pres-sure and bentonite pressure along the shield. It is assumed that when thegrout pressure and bentonite pressure are less than the vertical soil pressure,the soil is moving into the cavity. The volume loss is estimated as the voidvolume that is filled by soil. The volume loss will not occur if the groutpressure and the bentonite pressure are larger than the vertical soil pressure.In that case, the gap along the shield is assumed to be completely filled bygrout and bentonite. From this figure, the volume loss along the shield de-pends on the bentonite pressure, which is applied at the tunnelling face andthe grout pressure at the tail. When the bentonite and grout pressures areequal to the minimum required pressure as calculated in previous section,the volume loss will be maximal. On the other hand, when the maximumallowable pressures are applied, there is no volume loss along the shield.In order to investigate the effect of grout pressure on the shield in differentsoils, we assume the bentonite pressure applied at the tunnelling face is theaverage of the minimum support pressure and the maximum support pres-sure for fracturing. Figure 9 shows the change of volume loss with differenttunnel diameters in various soils. When the C/D ratio increases, the range of
12

C/D
0.2 0.4 0.6 0.8 1 1.2 1.4 1.6 1.8 2
vo
lum
e lo
ss(%
)
0
0.1
0.2
0.3
0.4
0.5
0.6
0.7
D=8
D=10
D=6
(a) in sand
C/D
0.2 0.4 0.6 0.8 1 1.2 1.4 1.6 1.8 2
vo
lum
e lo
ss (
%)
0.1
0.2
0.3
0.4
0.5
0.6
0.7
D=8
D=10
D=6
(b) in clayey sand
C/D
0.4 0.6 0.8 1 1.2 1.4 1.6 1.8 2
vo
lum
e lo
ss(%
)
0.1
0.2
0.3
0.4
0.5
0.6
0.7
D=8
D=10
D=6
(c) in clay
C/D
0.4 0.6 0.8 1 1.2 1.4 1.6 1.8 2
vo
lum
e lo
ss(%
)
0.25
0.3
0.35
0.4
0.45
0.5
0.55
0.6
0.65
0.7
D=8
D=10
D=6
(d) in organic clay
C/D
0.4 0.6 0.8 1 1.2 1.4 1.6 1.8 2
vo
lum
e lo
ss(%
)
0.4
0.45
0.5
0.55
0.6
0.65
0.7
D=8
D=10
D=6
(e) in peat
Figure 9: Volume loss along the shield in various soils
13

the volume loss along the shield VL,s is larger. With a particular C/D ratioof the tunnel, the larger the tunnel diameter is, the smaller the volume lossVL,s is with the constant overcut parameter of the shield. In the case of tun-nelling in sand, the upper boundary of the volume loss VL,s increases nearlylinearly with the C/D ratio from 0.4 to 0.8, then becomes almost constantwhen the C/D ratio increases whereas the lower boundary reduces linearlywhen the C/D ratio increases. This also appears in the cases of tunnellingin clay and organic clay. At this point, basically, the entire annulus is filledby the surrounding soil, leading to a maximum attainable volume loss alongthe tail. In the case of tunnelling in peat, in the range of this analysis with0.4 ≤ C/D ≤ 2, the upper boundary of the volume loss VL,s lightly rises andthe lower boundary linearly decreases. It is noted that the maximum upperboundary volume loss along the shield VL,s is the same for a given tunneldiameter. Regardless of soil conditions, for a tunnel with D = 6m, it followsthat VL,s,max = 0.7%, with D = 8m, VL,s,max = 0.57% and with D = 10m,VL,s,max = 0.5%.Figure 10 shows the boundary of the volume loss along the shield VL,s in rela-tionship with C/D ratios for different tunnel diameters in different soils. Theupper boundary for 0.4 ≤ C/D ≤ 0.6 corresponds to the case of tunnelling inpeat in all three tunnel diameters. When tunnelling with 0.6 ≤ C/D ≤ 1, theupper boundary is given by tunnelling in organic clay and when tunnellingwith the C/D ratio larger than 1, the upper boundary becomes constant anddepends on the tunnel diameter D. The maximum volume loss along theshield VL,s is about 0.7% for D = 6m, VL,s,max = 0.57% for D = 8m andVL,s,max = 0.5% for D = 10m. For the lower boundary, there is a decreasingtrend of the minimum volume loss along the shield VL,s when the C/D ratioincreases. In the case of D = 6m the maximum VL,s of the lower boundary isabout 0.47% when C/D = 0.5. The maximum volume loss along the shieldVL,s of the lower boundary is about 0.38% with D = 8m and 0.32% withD = 10m when C/D = 0.5. When C/D = 2, VL,s,max = 0.2% for D = 6m,VL,s,max = 0.13% for D = 8m and VL,s,max = 0.09% for D = 10m.
4. Volume loss behind the shield
When precast segments are placed, the advance of the shield results inan annular cavity between the segments and the surrounding soil due to theshape of the TBM and the overcut as discussed above. Grout is injected
14

C/D
0.4 0.6 0.8 1 1.2 1.4 1.6 1.8 2
vo
lum
e lo
ss(%
)
0.2
0.25
0.3
0.35
0.4
0.45
0.5
0.55
0.6
0.65
0.7
lower boundary
upper boundary
in peat
in sand
in clay
(a) D = 6m
C/D
0.4 0.6 0.8 1 1.2 1.4 1.6 1.8 2
vo
lum
e lo
ss(%
)
0.1
0.15
0.2
0.25
0.3
0.35
0.4
0.45
0.5
0.55
0.6
lower boundary
upper boundary
in peat
in sand
in clay
(b) D = 8m
C/D
0.4 0.6 0.8 1 1.2 1.4 1.6 1.8 2
vo
lum
e lo
ss(%
)
0.05
0.1
0.15
0.2
0.25
0.3
0.35
0.4
0.45
0.5
lower boundary
upper boundary
in peat
in sand
in clay
(c) D = 10m
Figure 10: Volume loss along the shield with different tunnel diameters15

rapidly in order to prevent the surrounding soil to move into the gap. Itis assumed that the void is filled by the grout. The injected grout pressureinduces the loading on the soil around the tunnel lining. This might lead toimmediate displacements and long-term consolidation of the soil. These aretwo components of the volume loss behind the shield: the volume loss at thetail and the volume loss due to consolidation.
4.1. Volume loss at the tail
When the grout is injected with high pressures at the tail, the groundaround the tunnel will be deformed. In order to estimate the surface set-tlement induced by tunnelling, there are some analytical solutions proposedby Sagaseta (1988); Verruijt (1997); Strack (2002) based on cavity expansionand taking the influence of a free surface into account. However, the effect ofthe range of support pressures has not taken into account in these methodsand resulting solutions, for instance expressed as a Laurent series expansionin the case of Verruijt (1997), require an increasing number of terms for astable numerical integration if the distance between free surface and tunnelreduces. On the other hand, the cavity expansion developed for the case ofa cavity in infinite medium has been implemented in tunnelling studies byTaylor (1993); Yu (2013) and results in far more elegant and practical solu-tion for a first estimate of the effect of grout pressures on soil stresses anddeformations around the TBM. To determine the effect of grouting at thetail on volume loss at the tail and consolidation, in this study, the cavity ex-pansion method for tunnelling, which is proposed by Yu (2013), is thereforeapplied as a simplified method. In this cavity-expansion theory, it is assumedthat the soil around the tunnel is a Tresca medium. The stresses in the soiland the settlement at the surface can be calculated by the cavity-expansiontheory. According to Yu (2013), the plastic zone will deform around thetunnel wall, as can be seen in Figure 11, with the radius Rp of the plasticzone estimated from the following equation:
Rp =D
2exp
(
p0−s
Y−
k1+k
k
)
(10)
where p0 is the pre-tunnelling pressure; k = 1 or 2 corresponding to cylindri-cal or spherical cavity models; Y = 2cu or −2cu corresponding to the case ofcontraction or expansion of the tunnel.
16

Similar to Yu (2013) and Taylor (1993), the pre-tunnelling pressure p0 canbe estimated as:
p0 = γ
(
C +D
2
)
(11)
The soil displacement us in the elastic zone is given by:
Figure 11: Deformations around a shallow tunnel at the tail
us = −Y r
2(k + 1)G
(
Rp
r
)1+k
(12)
where r is the distance from the calculated point to the tunnel centre andG = E/2(1 + ν) is the shear modulus of soil.The soil displacement us in the plastic zone is given by:
us = −Y
2(k + 1)G
(
D
2r
)kD
2exp
(
(1 + k)(p0 − s)
kY− 1
)
(13)
In this case, the effect of grouting pressures at the tail is analysed with acylindrical cavity model and is calculated with the minimum and maximum
17

support pressures. Thus, in Equation 10, k equals 1.It can be assumed that the volume loss around the tunnel due to groutingat the tail equals the volume of ground settlement at the surface. In orderto identify the contribution of soil deformation at the tail on the total vol-ume loss, the displacement of the ground surface is estimated. Accordingto assumptions in Yu (2013), the tunnel will collapse when the plastic zoneexpands to the ground surface. It means that when the tunnel is stable, theradial displacement of ground us at the surface is in the elastic zone and canbe calculated with Equation 12.The surface settlement at the tail can be estimated from:
ut = us sin θ (14)
where θ is the angle between the calculated point to the tunnel centre andthe horizontal axis (see Figure 11).The volume loss at the tail VL,t can be estimated as:
VL,t =Vs,t
π(D/2)2(15)
where Vs,t is the volume of the surface settlement due to grouting pressuresat the tail (see Figure 11).Figure 12 shows the boundaries of the volume loss at the tail VL,t in varioussoils for tunnels with D = 6, 8 and 10m with the range of the support pres-sures from the vertical soil stress to the maximum support pressure at thetop of the tunnel derived from Equation 4. The figure shows that the largerthe tunnel diameter is, the larger the range of volume loss VL,t is. When thesupport pressure equals the vertical soil stress at the top of the tunnel lining,there is a contraction in the cavity and this leads to positive values of thelower boundary of volume loss at the tail. When a high support pressure isused, the cavity will expand. The negative volume loss VL,t values indicatethat the soil above the tunnel lining is pushed upward and there might beheave at the ground surface. In practice, this heave might not be observedbecause the settlement due to volume loss at the tunnelling face and along theshield could be larger. When a high support pressure is applied at the tail,a heave can occur in order to compensate the volume loss at the tunnellingface and along the TBM as can be seen in Figures 12a, 12b, 12c and 12d.However, in the case of very shallow tunnelling, there is no heave due to thesmall margin in the range of allowable support pressures as indicated in Vu
18

C/D
0.4 0.6 0.8 1 1.2 1.4 1.6 1.8 2
vo
lum
e lo
ss a
t th
e t
ail
VL
,t(%
)
-1.2
-1
-0.8
-0.6
-0.4
-0.2
0
0.2
0.4lower boundary for D=10m
lower boundary for D=8mlower boundary for D=6m
upper boundary for D=10m
upper boundary for D=8m
upper boundary for D=6m
(a) in sand
C/D
0.4 0.6 0.8 1 1.2 1.4 1.6 1.8 2
vo
lum
e lo
ss a
t th
e t
ail
VL
,t(%
)
-1
-0.5
0
0.5lower boundary for D=10m
lower boundary for D=8mlower boundary for D=6m
upper boundary for D=10m
upper boundary for D=8m
upper boundary for D=6m
(b) in clayey sand
C/D
0.4 0.6 0.8 1 1.2 1.4 1.6 1.8 2
vo
lum
e lo
ss a
t th
e t
ail
VL
,t(%
)
-2
-1.5
-1
-0.5
0
0.5
1
lower boundary for D=10m
lower boundary for D=8mlower boundary for D=6m
upper boundary for D=10m
upper boundary for D=8m
upper boundary for D=6m
(c) in clay
C/D
0.4 0.6 0.8 1 1.2 1.4 1.6 1.8 2
vo
lum
e lo
ss a
t th
e t
ail
VL
,t(%
)
-2
-1
0
1
2
3
4
lower boundary for D=10m
lower boundary for D=8m
lower boundary for D=6m
upper boundary for D=10m
upper boundary for D=8m
upper boundary for D=6m
(d) in organic clay
C/D
0.4 0.6 0.8 1 1.2 1.4 1.6 1.8 2
vo
lum
e lo
ss a
t th
e t
ail
VL
,t(%
)
0
20
40
60
80
100
120
140
160
180
lower boundary for D=10m
lower boundary for D=8m
lower boundary for D=6m
upper boundary for D=10m
upper boundary for D=8m
upper boundary for D=6m
(e) in peat
Figure 12: Volume loss at the tail with different tunnel diameters in various soils
19

et al. (2015b). In Figure 12e, when tunnelling in peat, the volume loss at thetail is positive with a high value, especially in the case of a tunnel diameterD = 10m. It means that shallow tunnelling with a large diameter in peatmight be difficult due to the large expected volume loss. This conclusioncoincides with the conclusion indicated in Vu et al. (2015b) for the range ofsupport pressure for shallow tunnelling in peat with low C/D ratios.Figure 13 shows the dependence of VL,t values on soils in various tunnel di-ameters. When tunnelling in peat, the range of VL,t values is significantlylarge compared to tunnelling in sand, clay and organic clay, especially in thecase of tunnels with large diameters as indicated above.
4.2. Volume loss due to consolidation
For the volume loss due to consolidation, in the cavity behind the tail,two consolidation processes occur along the tunnel lining. Firstly, the newlyinjected grout is consolidating and forms a consolidated grout cake in thecavity along the tunnel lining (Talmon and Bezuijen, 2009). In the case oftunnelling in clay, the consolidation in grout might not occur (Bezuijen andTalmon, 2013) and the length of liquid grout on the lining is much longer.Although the grout pressure decreases along the lining, the injected groutmay flow along 2 to 3 following segments and the appearance of the groutcake will prevent the movement of the soil above. It is often assumed thatthere is no volume loss in the grout consolidating. The other volume loss isdue to the subsequent shrinkage of grout, which is estimated at about 7 to10 percent of total tail gap according to Loganathan (2011). However, thecontribution of this volume loss to the total volume loss is small comparingto the other volume losses. This volume loss, therefore, is not taken intoaccount in this study.The second process is the consolidation of the soil volume above the tunnelbehind the tail. When grout is applied at the tail, the soil stress in theabove soil volume will change. This will induce consolidation in the longterm behind the tail. The volume loss due to consolidation VL,c is derivedfrom the consolidation settlement of the soil volume above tunnel lining. Inthe case of tunnelling in sand, consolidation of soil will probably not occur orbe minimal. For tunnels in clay or peat, this may be a notable contribution.The consolidation settlement of the soil can be estimated from Terzaghi’sformula, as follows:
uc = −1
Cs
ln
(
σsoil
σ0
)
(16)
20

C/D
0.4 0.6 0.8 1 1.2 1.4 1.6 1.8 2
vo
lum
e lo
ss a
t th
e t
ail
VL
,t(%
)
-2
0
2
4
6
8
10
12
14
in peat
in sand
in clay
(a) D = 6m
C/D
0.4 0.6 0.8 1 1.2 1.4 1.6 1.8 2
vo
lum
e lo
ss a
t th
e t
ail
VL
,t(%
)
-10
0
10
20
30
40
50
60
in peat
in sand
in clay
(b) D = 8m
C/D
0.4 0.6 0.8 1 1.2 1.4 1.6 1.8 2
vo
lum
e lo
ss a
t th
e t
ail
VL
,t(%
)
-20
0
20
40
60
80
100
120
140
160
180
in peat
in sand
in clay
(c) D = 10m
Figure 13: Volume loss at the tail with different tunnel diameters21

Figure 14: Soil stresses at the tail
where Cs is the compression constant depending on soil type (as can be seenin Table 1), σsoil is the vertical stress in the soil and σ0 is the initial verticalstress in the soil.In case the vertical stress is lower than the initial vertical stress, unloadingoccurs and Equation 16 would be modified to:
uc = −1
Cswel
ln
(
σsoil
σ0
)
(17)
where Cswel is the swelling constant depending on soil type (as can be seenin Table 1).The stress in the soil σsoil is estimated from the radial and tangential stressesderived by the cavity expansion theory as can be seen in Figure 14. Accordingto Yu (2013), the stresses in the elastic zone are given by:
σr = −p0 +kY
1 + k
(
Rp
r
)(1+k)
(18)
σθ = −p0 −Y
1 + k
(
Rp
r
)(1+k)
(19)
22

where σr and σθ are the radial and tangential stresses as shown in Figure 14.In the plastic zone, the stresses are given by:
σr = −p0 +kY
1 + k+ kY ln
Rp
r(20)
σθ = −p0 −Y
1 + k+ kY ln
Rp
r(21)
In order to estimate the consolidation settlement, the soil volume above thetunnel lining is divided into n layers. The final consolidation settlement isderived by summing deformations of these layers, which are calculated byEquations 16 and 17.The final consolidation settlement is given by:
ujc =
n∑
i=1
u(j,i)c ∆z (22)
where u(j,i)c and ∆z(i) are the deformation due to consolidation and the depth
of the ith layer at the jth location along the surface.Figure 15 shows settlement troughs in the case of tunnelling in clay with adiameter D = 10m and the ratio of C/D = 1, as an example. It can beseen that a heave and a settlement can occur depending on what particularsupport pressure is applied.By integrating the final consolidation settlements over the surface, the volumeof consolidation settlement at the surface Vcons can be estimated as:
Vcons =m∑
j=1
u(j)c ∆x (23)
where ∆x is a length increment along the surface consolidation settlementand m is the increment number.The volume loss due to consolidation settlement is then estimated as:
VL,c =Vcons
π(D/2)2(24)
Figure 16 shows the relationship between the consolidation volume loss VL,c
and the C/D ratio for tunnels with different diameters in clay, organic clayand peat. With 0.4 ≤ C/D ≤ 1.3 in the case of tunnelling in clay and
23

distance to the tunnel axis(m)0 50 100 150 200 250 300
cons
olid
atio
n se
ttlem
ent(
m)
-0.025
-0.02
-0.015
-0.01
-0.005
0
0.005
lower boundary support pressureupper boundary support pressure
Figure 15: Consolidation settlement troughs when tunnelling in clay with D = 10m andC/D = 1
0.4 ≤ C/D ≤ 1.7 in the case of tunnelling in organic clay, it can be seenthat the maximum support pressure applied at the tail can lead to a heaveon the surface. The volume loss due to consolidation VL,c when maximumsupport pressure is applied becomes smaller than when minimum supportpressure is applied. An example shown in Figure 15 shows that the volumeof consolidation settlement Vcons when applying lower boundary of supportpressure is smaller than the value of Vcons when applying the maximum sup-port pressure. When the tunnel is located at a deeper level, the volume lossVL,c when applying the maximum support pressure is higher than the volumeloss VL,c in the case of applying minimum support pressure.The dependence of the volume loss due to consolidation VL,c on soil type isshown in Figure 17 for tunnels with diameters D = 6, 8, and 10m. It canbe seen that the volume loss VL,c in the case of tunnelling in peat is muchhigher compared to tunnelling in clay and organic clay.
24

0.4 0.6 0.8 1 1.2 1.4 1.6 1.8 20
0.2
0.4
0.6
0.8
1
1.2
1.4
upper boundary for D=10m
upper boundary for D=8m
upper boundary for D=6m
lower boundary for D=8m
lower boundary for D=10m
lower boundary for D=6mv
olu
me
loss
at
the
ta
il V
L,c
(%)
C/D
(a) in clay
0.4 0.6 0.8 1 1.2 1.4 1.6 1.8 20
0.5
1
1.5
2
2.5
upper boundary for D=10m
lower boundary for D=10m
lower boundary for D=8m
lower boundary for D=6m
upper boundary for D=8m
upper boundary for D=6m
vo
lum
e lo
ss a
t th
e t
ail
VL
,c(%
)
C/D
(b) in organic clay
0.4 0.6 0.8 1 1.2 1.4 1.6 1.8 20
5
10
15
20
25
30
35
upper boundary for D=10m
lower boundary for D=10m
lower boundary for D=8m
lower boundary for D=6m
upper boundary for D=8m
upper boundary for D=6m
vo
lum
e lo
ss a
t th
e t
ail
VL
,c(%
)
C/D
(c) in peat
Figure 16: Volume loss due to consolidation VL,c with different tunnel diameters in varioussoils
25

0.4 0.6 0.8 1 1.2 1.4 1.6 1.8 20
2
4
6
8
10
12
14
16
in peat
in clay
in organic clay
vo
lum
e lo
ss a
t th
e t
ail
VL
,c(%
)
C/D
(a) D = 6m
0.4 0.6 0.8 1 1.2 1.4 1.6 1.8 20
0.5
1
1.5
2
2.5
3
3.5
4
4.5
5
in peat
in clay
in organic clay
(b) D = 6m (in detailed)
0.4 0.6 0.8 1 1.2 1.4 1.6 1.8 20
5
10
15
20
25
in peat
in clay
in organic clay
vo
lum
e lo
ss a
t th
e t
ail
VL
,c(%
)
C/D
(c) D = 8m
0.4 0.6 0.8 1 1.2 1.4 1.6 1.8 20
0.5
1
1.5
2
2.5
3
3.5
4
4.5
5
in peat
in clay
in organic clay
(d) D = 8m (in detailed)
0.4 0.6 0.8 1 1.2 1.4 1.6 1.8 20
5
10
15
20
25
30
35
in peat
in clay
in organic clay
vo
lum
e lo
ss a
t th
e t
ail
VL
,c(%
)
C/D
(e) D = 10m
0.4 0.6 0.8 1 1.2 1.4 1.6 1.8 20
0.5
1
1.5
2
2.5
3
3.5
4
4.5
5
in peat
in clay
in organic clay
(f) D = 10m (in detailed)
Figure 17: Volume loss due to consolidation VL,c with various tunnel diameters
26

5. Total volume loss and case studies
5.1. Total volume loss
From Equation 1, the total volume loss is derived by summing the volumeloss of tunnelling face, along the shield, at the tail and due to consolidation.Figures 18 and 19 show the total volume loss in the case of shallow tunnellingin sand and clayey sand. It can be seen that the range of the total volumeloss decreases with the increase of the C/D ratio and the tunnel diameter D.In the case of a C/D ratio from 0.4 to 1, a volume loss in shallow tunnellingof less than 0.5% can be achieved with the condition of careful monitoring.The highest expected volume loss in this range of the C/D ratio is about3.7% for tunnelling in sand and 5% for tunnelling in clayey sand when lessoptimal but still stable support and grout pressures are applied. When theC/D ratio larger than 1, the maximum volume loss is less than 1.5% withthe range of support pressures in this study. These figures also show that aresult of no volume loss can be achieved when tunnelling with C/D ≥ 2.Figure 20 shows the relationship between the total volume loss VL and C/D
C/D
0.4 0.6 0.8 1 1.2 1.4 1.6 1.8 2
tota
l vo
lum
e lo
ss(%
)
0
0.5
1
1.5
2
2.5
3
3.5
4
upper boundary for D=10m
upper boundary for D=8m
upper boundary for D=6m
lower boundary for D=10m
lower boundary for D=8m
lower boundary for D=6m
Figure 18: Total volume loss for tunnelling in sand with various diameter D
27

C/D
0.4 0.6 0.8 1 1.2 1.4 1.6 1.8 2
tota
l vo
lum
e lo
ss(%
)
0
0.5
1
1.5
2
2.5
3
3.5
4
4.5
5
5.5
upper boundary for D=10m
upper boundary for D=8m
upper boundary for D=6m
lower boundary for D=10m
lower boundary for D=8m
lower boundary for D=6m
Figure 19: Total volume loss for tunnelling in clayey sand with various diameter D
ratios when tunnelling in clay. The total volume loss VL when tunnellinghas just finished (not taking into account the consolidation) is shown in Fig-ure 20a. It can be seen that a total volume loss VL less than 0.5% aftertunnelling is feasible even with C/D ≤ 1. This figure also shows that forvery shallow tunnelling with C/D ≤ 0.6, a tunnel with a large diameterhas a larger range of expected volume loss. With deeper tunnelling when1 ≤ C/D ≤ 2, the maximum value of the total volume loss reduces andbecomes less than 2%.Figure 20b shows the total volume loss VL for tunnelling with various diam-eters D = 6, 8 and 10m in clay including consolidation of soil layers abovethe tunnel. It also follows that the lower the C/D ratio is, the larger therange of volume loss is. The total volume loss of tunnelling in clay wouldbe at maximum about 6% with D = 10m, 5.5% with D = 8m and 5% withD = 6m when C/D = 0.4. The lower boundary corresponding with theminimum support pressure applied has a reducing trend when the C/D ratioincreases. This means there might be a larger volume loss when the tunnelbecomes shallower. At the upper boundary of the total volume loss, corre-sponding with the maximum support pressure applied, the final volume loss
28

of tunnelling with D = 6m can reach just over 0% after consolidation hasbeen taken into account.
5.2. Case studies
Tables 3 and 4 show a summary of volume loss in case histories for tun-nelling in sand and clay with the C/D ratio less than 2. In Table 3, thereare two case studies the Ayshire Joint Drainage Scheme and WNTDC LumbBrook Sewer, derived from the study of O’Reilly and New (1982) and threecase studies Second Heinenoord Tunnel, Botlek Railway Tunnel and SophiaRailway Tunnel, derived from Netzel (2009). Table 4 shows volume loss datafrom various projects all over the world including Madrid Metro Extension,Heathrow Express Trail Tunnel, Waterloo, Garrison Dam test tunnel, Baulos25, Barcelona Subway and London Transport Experimental Tunnel.The data in Table 3 are plotted in Figure 21a in order to compare the volumeloss derived from this analysis to field data in the case of shallow to mediumdeep tunnelling in sand. It can be seen that most of field data falls in theboundaries of volume loss in Figure 21a.Figure 21b shows the validation of the calculated volume loss to the field datain Table 4 in the case of shallow tunnelling in clay. It also shows that allthe field data is in agreement with the boundaries of volume loss derived inthis study. Only the Madrid Metro Extension which is known as a successfultunnelling project has one data point below the lower boundary of volumeloss for a low C/D ratio.The agreement between derived boundaries of volume loss in sand and clayand field data shows that the approach of estimating volume loss in thisstudy can successfully predict volume loss in shallow tunnelling.
29

C/D
0.4 0.6 0.8 1 1.2 1.4 1.6 1.8 2
tota
l vo
lum
e lo
ss(%
)
0
0.5
1
1.5
2
2.5
3
3.5
4
4.5
5
5.5
upper boundary for D=10m
upper boundary for D=8m
upper boundary for D=6m
lower boundary for D=10m
lower boundary for D=8m
lower boundary for D=6m
(a) not including consolidation of soil layers above the tunnel
C/D
0.4 0.6 0.8 1 1.2 1.4 1.6 1.8 2
tota
l vo
lum
e lo
ss(%
)
0
1
2
3
4
5
6
lower boundary for D=10m
upper boundary for D=10m
upper boundary for D=8m
upper boundary for D=6m
lower boundary for D=8m
lower boundary for D=6m
(b) including consolidation of soil layers above the tunnel
Figure 20: Total volume loss for tunnelling in clay with various diameter D
30

C/D
0.4 0.6 0.8 1 1.2 1.4 1.6 1.8 2
tota
l vo
lum
e lo
ss(%
)
0
0.5
1
1.5
2
2.5
3
3.5
4
Ayrshire Joint Drainage Scheme
WNTDC Lumb Brook Sewer
Second Heinenoord Tunnel
Botlek Railway Tunnel
Sophia Railway Tunnel
lower boundary for D=10m
lower boundary for D=8m
lower boundary for D=6m
upper boundary for D=10m
upper boundary for D=8m
upper boundary for D=6m
(a) in sand
C/D
0.4 0.6 0.8 1 1.2 1.4 1.6 1.8 2
tota
l vo
lum
e lo
ss(%
)
0
0.5
1
1.5
2
2.5
3
3.5
4
4.5
5
5.5
Madrid Metro Extension
Heathrow Express Trail Tunnel
Waterloo
Garrison Dam test tunnel
Baulos 25
Barcelona Subway
London Transport experimental tunnel
lower boundary for D=10m
lower boundary for D=8m
lower boundary for D=6m
upper boundary for D=10m
upper boundary for D=6m
upper boundary for D=8m
(b) in clay
Figure 21: Validation for volume loss in shallow tunnelling
31

Case H(m) C(m) D(m) C/D VL(%)Soil conditions ReferenceAyrshire Joint DrainageScheme
6.25 4.8 2.9 1.66 0.7 fine to medium slightly siltysand; loose and medium density
O’Reilly and New(1982)
WNTDC Lumb Brook Sewer 6.5 4.7 3.6 1.31 0.5 medium/dense sands andgravel with a little clay
O’Reilly and New(1982)
Second Heinenoord Tunnel 14.5 10.37 8.3 1.25 0.21 dense sand Netzel (2009)15.0 10.8 8.3 1.31 0.2215.0 10.8 8.3 1.31 0.715.7 11.6 8.3 1.39 0.4416.7 12.6 8.3 1.51 0.3816.7 12.6 8.3 1.51 0.5520.0 15.8 8.3 1.91 1.2
Botlek Railway Tunnel 13.1 8.3 9.65 0.86 1.11 Holoceen and Pleistoceen sand Netzel (2009)18.5 13.7 9.65 1.42 0.521.7 16.9 9.65 1.75 0.5
Sophia Railway Tunnel 12.4 7.6 9.5 0.8 0.55 Pleistoceen sand Netzel (2009)14.9 10.1 9.5 1.1 0.2114.9 10.1 9.5 1.1 0.719.4 14.7 9.5 1.5 0.1519.4 14.7 9.5 1.5 0.519.9 15.1 9.5 1.6 0.2519.9 15.1 9.5 1.6 0.9421.3 16.6 9.5 1.7 0.1421.5 16.75 9.5 1.8 0.6521.5 16.75 9.5 1.8 1.2
Table 3: Volume loss of tunnelling in sand projects
32

Case H(m) C(m) D(m) C/D VL(%)Soil conditions ReferenceMadrid Metro Extension 10.3 5.9 8.88 0.66 0.54 stiff clay Melis et al. (2002)
12.43 8 8.88 0.9 0.8714.61 10.17 8.88 1.15 0.615.7 11.26 8.88 1.27 0.8416.12 11.68 8.88 1.32 0.8316.7 12.27 8.88 1.38 0.519.23 14.79 8.88 1.67 0.58
Heathrow Express Trail Tun-nel
21 16.67 8.66 1.9 1.15 London clay Bowers et al. (1996)
Waterloo 11.7 8.45 6.5 1.3 1.1 London clay Harris et al. (1994)Garrison Dam Test Tunnel 11 8.25 5.5 1.5 0.9 clay-shale and lignite Peck (1969)Baulos 25 8.45 5.2 6.5 0.8 1.8 Frankfurt clay Macklin (1999)Barcelona Subway 10 6 8 0.75 1.2 red and brown clay with some
gravelLedesma and Romero(1997)
London Transport Experi-mental Tunnel
10 7.9 4.15 1.91 1 dense sandy gravel overlainwith made ground of soft claywith sand and gravel
O’Reilly and New(1982)
Table 4: Volume loss of tunnelling in clay projects
33

6. Conclusion
Volume loss is a major parameter in the calculation of ground movementby tunnelling. The range of attainable volume loss can be estimated by com-bining stability analysis at tunnelling face, along and behind the shield. Inthis theoretical study, it is found that in the case of tunnelling with C/D ≤ 1,the volume loss at the tunnelling face has a major impact in total volumeloss.The volume loss along the shield can be optimized by selecting optimal ben-tonite and grout pressures applied at tunnelling face and tail. The proposedcalculation method estimates attainable upper and lower boundaries of vol-ume loss along the shield for a particular tunnel.This paper also presents methods to identify the volume loss behind theshield. The volume loss at the tail when tunnelling in peat has a large im-pact, especially in the case of shallow tunnels (C/D ≤ 1). The volume lossbehind the tail was estimated by the volume loss due to shrinkage of groutand consolidation of above soil volume. The volume loss due to consolidationdepends on the surrounding soil and the C/D ratio.The total volume losses for tunnelling in sand, clayey sand and clay arederived and have a good agreement with case studies. Overall, the range ofvolume loss increases when tunnelling with shallower overburden. By control-ling the applied support pressure at the tunnelling face and tail, the volumeloss can be minimized. Still, a direct volume loss around 1% is a reasonableminimum for very shallow tunnels (C/D = 0.4) where for deeper tunnels novolume loss should be attainable. If pressure control is less optimal but stillcontrolled, a direct volume loss up to 5.5% is not unreasonable to expect forvery shallow tunnels.Analysis also shows that consolidation after the TBM has passed can con-tribute considerably to the final surface settlements and can be of this sameorder as direct volume loss effects in clay and even larger in very soft soilslike peat. This effect, however, is more pronounced in deeper tunnels, whereit could easily double the direct volume loss.
References
Anagnostou, G., Kovari, K., 1994. The face stability of slurry-shield-driventunnels. Tunnelling and Underground Space Technology 9 (2), 165–174.
34

Attewell, P., Farmer, I., 1974. Ground disturbance caused by shield tun-nelling in a stiff, overconsolidated clay. Engineering Geology 8 (4), 361–381.
Attewell, P. B., Yeates, J., Selby, A. R., 1986. Soil movements induced bytunnelling and their effects on pipelines and structures. Methuen, Inc.,New York, NY.
Bezuijen, A., 2007. Bentonite and grout flow around a tbm. In: UndergroundSpace–The 4th Dimension of Metropolises, Three Volume Set+ CD-ROM:Proceedings of the World Tunnel Congress 2007 and 33rd ITA/AITESAnnual General Assembly, Prague, May 2007. CRC Press, p. 383.
Bezuijen, A., Talmon, A., 2008. Processes around a tbm. In: Proceedings ofthe 6th International Symposium on Geotechnical Aspects of UndergroundConstruction in Soft Ground (IS-Shanghai 2008). pp. 10–12.
Bezuijen, A., Talmon, A., 2013. Grout properties and their influence onback fill grouting. In: Proceedings of the 5th International Symposiumon Geotechnical Aspects of Underground Construction in Soft Ground. p.187.
Bosch, J. W., Broere, W., 2009. Small incidents, big consequences. leakageof a building pit causes major settlement of adjacent historical houses.amsterdam north-south metro line project. In: Safe Tunnelling for theCity and Environment: ITA-AITES World Tunnel Congress, 23-28 May2009, Budapest, Hungary. Hungarian Tunneling Association.
Bowers, K., Hiller, D., New, B., 1996. Ground movement over three yearsat the heathrow express trial tunnel. In: Proceedings of the internationalsymposium on geotechnical aspects of underground construction in softground, London. pp. 557–562.
Broere, W., 2001. Tunnel face stability & new cpt applications. Ph.D. thesis,Delft University of Technology.
Broms, B. B., Bennermark, H., 1967. Stability of clay at vertical openings.Journal of Soil Mechanics & Foundations Div.
35

Cording, E. J., Hansmire, W., 1975. Displacements around soft ground tun-nels. In: 5th Pan American Congress on Soil Mechanics and FoundationEngineering. Vol. 4. Buenos Aires, pp. 571–633.
Dimmock, P. S., Mair, R. J., 2007. Estimating volume loss for open-facetunnels in london clay. Proceedings of the ICE-Geotechnical Engineering160 (1), 13–22.
Festa, D., Broere, W., Bosch, J., 2015. Kinematic behaviour of a tunnelboring machine in soft soil: Theory and observations. Tunnelling and Un-derground Space Technology 49, 208–217.
Gemeente-Amsterdam, 2009. Geotechnical base report alternative designdeep stations and risk assessment bored tunnel. Tech. rep., ProjectbureauNoord/Zuidlijn.
Harris, D., Mair, R., Love, J., Taylor, R., Henderson, T., 1994. Observationsof ground and structure movements for compensation grouting during tun-nel construction at waterloo station. Geotechnique 44 (4), 691–713.
Jancsecz, S., Steiner, W., 1994. Face support for a large mix-shield in het-erogeneous ground conditions. In: Tunnelling94. Springer, pp. 531–550.
Ledesma, A., Romero, E., 1997. Systematic backanalysis in tunnel excava-tion problems as a monitoring technique. In: Proceedings of the Interna-tional Conference on Soil Mechanics and Foundation Engineering- Inter-national Society for Soil Mechanics and Foundation Engineering. Vol. 3.AA BALKEMA, pp. 1425–1428.
Loganathan, N., 2011. An innovative method for assessing tunnelling-inducedrisks to adjacent structures. New York: Parsons Brinckerhoff Inc. One PennPlaza New York.
Macklin, S., 1999. The prediction of volume loss due to tunnelling in overcon-solidated clay based on heading geometry and stability number. Groundengineering 32 (4), 30–33.
Mair, R., 1989. Discussion leaders report on session 9: Selection of designparameters for underground construction. In: Proceedings of the 12th In-ternational Conference on Soil Mechanics and Foundation Engineering, Riode. Vol. 5. pp. 2891–2893.
36

Mair, R., Gunn, M., O’REILLY, M., 1982. Ground movement around shallowtunnels in soft clay. Tunnels & Tunnelling International 14 (5).
Mair, R., Taylor, R., 1999. Theme lecture: Bored tunnelling in the urbanenvironment. of XIV ICSMFE [131], 2353–2385.
Mair, R., Taylor, R., Bracegirdle, A., 1993. Subsurface settlement profilesabove tunnels in clays. Geotechnique 43 (2).
Melis, M., Medina, L., Rodrıguez, J. M., 2002. Prediction and analysis ofsubsidence induced by shield tunnelling in the madrid metro extension.Canadian Geotechnical Journal 39 (6), 1273–1287.
Mori, A., Tamura, M., Kurihara, K., Shibata, H., 1991. A suitable slurrypressure in slurry-type shield tunneling. Proc Tunnelling ’91, London, 361–369.
Nagel, F., Meschke, G., 2011. Grout and bentonite flow around a tbm: Com-putational modeling and simulation-based assessment of influence on sur-face settlements. Tunnelling and Underground Space Technology 26 (3),445–452.
NEN-3650, 2012. NEN 3650-2012 nl Eisen voor buisleidingsystemen.
Netzel, H. D., 2009. Building response due to ground movements. TU Delft,Delft University of Technology.
O’Reilly, M., 1988. Evaluating and predicting ground settlements caused bytunnelling in london clay. In: Tunnelling. Vol. 88. pp. 231–241.
O’Reilly, M., New, B., 1982. Settlements above tunnels in the unitedkingdom-their magnitude and prediction. Tech. rep., Institution of Miningand Metallurgy.
Peck, R. B., 1969. Deep excavations and tunnelling in soft ground. In: Proc.7th Int. Conf. on SMFE. pp. 225–290.
Sagaseta, C., 1988. Analysis of undrained soil deformation due to groundloss. Geotechnique 38 (4).
Strack, O. E., 2002. Analytic solutions of elastic tunneling problems. Ph.D.thesis, Delft University of Technology.
37

Talmon, A., Bezuijen, A., 2009. Simulating the consolidation of tbm groutat noordplaspolder. Tunnelling and Underground Space Technology 24 (5),493–499.
Taylor, R., R., 1993. Prediction of clay behaviour around tunnels using plas-ticity solutions. In: Predictive Soil Mechanics: Proceedings of the WrothMemorial Symposium Held at St. Catherine’s College, Oxford, 27-29 July1992. Thomas Telford, p. 449.
Verruijt, A., 1997. A complex variable solution for a deforming circular tunnelin an elastic half-plane. International Journal for Numerical and AnalyticalMethods in Geomechanics 21 (2), 77–89.
Verruijt, A., Booker, J., 1996. Surface settlements due to deformation of atunnel in an elastic half plane. Geotechnique 46 (4), 753–756.
Vu, M. N., Broere, W., Bosch, J. W., 2015a. Effects of cover depth on groundmovements induced by shallow tunnelling. Tunnelling and UndergroundSpace Technology 50, 499–506.
Vu, M. N., Broere, W., Bosch, J. W., 2015b. The impact of shallow cover onstability when tunnelling in soft soils. Tunnelling and Underground SpaceTechnology 50, 507–515.
Yu, H.-S., 2013. Cavity expansion methods in geomechanics. Springer Science& Business Media.
38