delinquency in florida’s schools: an eight-year study · delinquency on school grounds has...
TRANSCRIPT

FLORIDA DEPARTMENT OF JUVENILE JUSTICE
Delinquency in Florida’s Schools: An Eight-Year Study
(FY 2004-05 through FY 2011-12)
OFFICE OF PROGRAM ACCOUNTABILITY Rick Scott, Governor Bureau of Research and Planning Wansley Walters, Secretary

i
DELINQUENCY IN FLORIDA’S SCHOOLS: EIGHT YEARS OF IMPROVEMENT
ii
DELINQUENCY IN FLORIDA’S SCHOOLS: AN EIGHT-YEAR STUDY
(2004-05 THROUGH 2011-12)
Florida Department of Juvenile Justice Bureau of Research and Planning
January 2013
Electronic copies of this report are available at the Department’s Research Web site:
http://www.djj.state.fl.us/Research/index.html
Mark A. Greenwald, M.J.P.M Chief of Research and Planning
Florida Department of Juvenile Justice 2737 Centerview Drive
Tallahassee, Florida 32399-3100 www.djj.state.fl.us
DELINQUENCY IN FLORIDA’S SCHOOLS: EIGHT YEARS OF IMPROVEMENT
iii

DELINQUENCY IN FLORIDA’S SCHOOLS: EIGHT YEARS OF IMPROVEMENT
iv
A MESSAGE FROM SECRETARY WANSLEY WALTERS
On behalf of the employees of the Florida Department of Juvenile Justice (DJJ) and all whom we serve, I
am pleased to present Delinquency in Florida’s Schools: An Eight-Year Study for the Florida Department
of Juvenile Justice (DJJ).
This report was produced by DJJ’s Bureau of Research and Planning as part of our ongoing efforts to
reduce juvenile delinquency and turn around the lives of troubled youth. It contains analyses of
delinquency in Florida’s public schools between Fiscal Year (FY) 2004-05 and FY 2011-12.
The report also reflects my commitment to improve our accountability and help DJJ become a more data-
driven organization, with measurable performance and outcomes. The people of Florida should expect
nothing less from the state agencies that serve them.
State law requires school districts in Florida to examine their discipline policies for minor offenders.
There have been substantial reductions in school offenses over the last eight years. Specifically,
delinquency on school grounds has declined 50 percent. There were also 48 percent fewer youth arrested
in schools.
While these improvements are the result of strong commitment and collaboration among many agencies
and stakeholders, there is much work to be done as thousands of youth continue to be arrested in schools
around the state. For a substantial proportion of the youth arrested in schools last year (51%), the arrest
was the youth’s first delinquent charge.
We in Florida have a rare opportunity to implement needed reforms that keep youth from entering the
juvenile justice system in the first place. Community and school-based diversionary efforts – chief
among which is statewide civil citation – will give children the help and guidance they need. Working
together, we will reduce the number of young people entering the juvenile justice system. This goal is
consistent with our proposed Roadmap to System Excellence.
Providing the right services to the right youth at the right time
The DJJ Roadmap to System Excellence

DELINQUENCY IN FLORIDA’S SCHOOLS: EIGHT YEARS OF IMPROVEMENT
v
TABLE OF CONTENTS
EXECUTIVE SUMMARY ...................................................................................... 1
HOW THE FLORIDA DEPARTMENT OF JUVENILE JUSTICE TRACKS AND REPORTS DELINQUENCY IN SCHOOLS ............................................................................... 2
WHO ARRESTS YOUTH FOR DELINQUENCY IN SCHOOLS? ................................. 2
WHAT AFFECTS SCHOOL ARRESTS AND ARREST RATES? ................................... 2
SCHOOL-RELATED DELINQUENCY ARRESTS ....................................................... 3
SCHOOL ARRESTS BY COUNTY ........................................................................... 4
SCHOOL ARREST RATES BY COUNTY .................................................................. 5
SCHOOL ARREST RATES RELATIVE TO STUDENT POPULATION .......................... 6
SCHOOL ARREST DEMOGRAPHICS ..................................................................... 7
TYPES OF DELINQUENCY IN SCHOOLS ............................................................... 8
CASE OUTCOMES (DISPOSITIONS) FOR SCHOOL OFFENSES ............................ 10
DEMOGRAPHICS AND CASE OUTCOMES FOR SCHOOL OFFENSES .................. 11
DIFFERENTIAL OFFENSE PATTERNS BASED ON DEMOGRAPHICS .................... 12
SCHOOL OFFENSES AS GATEWAYS TO THE JUVENILE JUSTICE SYSTEM ........... 13
STUDENT STATUS AND SCHOOL ARRESTS ....................................................... 14
DEFINITION OF TERMS AND DATA SOURCES ................................................... 15

DELINQUENCY IN FLORIDA’S SCHOOLS: EIGHT YEARS OF IMPROVEMENT
Page 1
EXECUTIVE SUMMARY This report summarizes delinquency arrests received by the Department of Juvenile Justice (DJJ) for
offenses occurring on school grounds, a school bus (or bus stop), or at an official school event between
FY2004-05 and FY2011-12.
• Delinquency arrests for school-related offenses declined 50% and resulted in 48% fewer youth being arrested in Florida’s schools over the past eight years.
• School-related delinquency arrests during FY2011-12 accounted for 14% of all the cases handled by DJJ, which is down from 19% during FY 2004-05.
• A statewide average of 10 school-related delinquency arrests were received by DJJ for every 1,000 public school students (grades 6-12).
• While only representing 21% of the youth ages 10-17 in Florida, black males and females accounted for almost half (47%) of all school‐related arrests.
• The differences are substantial between white youth and their nonwhite counterparts in case outcomes for school-related offenses. For example, black males were substantially more likely to receive commitment dispositions or to have their cases transferred to adult court. In addition, black youth were more likely to have their cases ultimately dismissed than their white counterparts.
• Misdemeanor “assault and battery” and “disorderly conduct” accounted for 39% of all school‐related delinquency arrests. [Including “misdemeanor violation of drug laws ” increases this to 56%]
• Drug and weapon offenses accounted for 27% of all school‐related arrests.
• Misdemeanors accounted for 67% of school‐related arrests.
• First time delinquents accounted for 51% of the youth receiving school-related arrests during FY2011-12. This is down 7% from the previous year.
• School-related delinquency arrests that were ultimately dismissed/not filed or received some type of diversion service totaled 65% during FY2011-12.
• Of youth that were referred from schools, 83% had at least one previous out-of-school suspension.
• Of youth referred from schools, 29% were identified as Exceptional Student Education (ESE) students. This is down 5% from the previous year.

DELINQUENCY IN FLORIDA’S SCHOOLS: EIGHT YEARS OF IMPROVEMENT
Page 2
HOW THE FLORIDA DEPARTMENT OF JUVENILE JUSTICE TRACKS AND REPORTS
DELINQUENCY IN SCHOOLS The Department of Juvenile Justice (DJJ) monitors the number of youth arrests received for delinquent
offenses that were identified as occurring on school grounds, a school bus (or bus stop), or at an official
school event. Generally, this information is provided to the Department by law enforcement as part of
the delinquency intake process and is recorded in the Department’s Juvenile Justice Information System
(JJIS). This information is then extracted from JJIS and reported to the public annually through the
Department’s “Delinquency in Florida’s Schools” analysis.
WHO ARRESTS YOUTH FOR DELINQUENCY IN SCHOOLS? With few exceptions, local law enforcement (police officers and sheriff’s deputies) are responsible for
arresting youth for alleged acts of delinquency in school. In many communities, local police officers or
sheriff deputies serve as school resource officers and are based at the schools. These school resource
officers may be a part of an existing law enforcement agency or, in some communities, may make up
their own distinctive law enforcement entity.
WHAT AFFECTS SCHOOL ARRESTS AND ARREST RATES? Numerous factors can influence whether or not a youth is arrested for delinquency in schools. Each
school district in Florida maintains its own distinctive progressive response or “discipline” plan that
outlines how everything from misbehavior to actual crimes should be handled. In addition, law
enforcement agencies in each school district have their own policies regarding how to respond and deal
with delinquency in schools. Availability and use of alternatives to arrest can have a substantial impact
on the number of youth referred to the Department of Juvenile Justice. For example, two of the state’s
largest school districts (Miami-Dade and Palm Beach) aggressively use alternatives to arrests, and these
districts subsequently have school arrests rates that are much lower than the general statewide average.

DELINQUENCY IN FLORIDA’S SCHOOLS: EIGHT YEARS OF IMPROVEMENT
Page 3
Fiscal YearDelinquency
Arrests Received2
Delinquent
Youth Received
School-Related
Arrests Received
School-Related
Youth Received
2004-05 150,687 95,263 28,008 24,189
2005-06 150,104 94,244 25,708 23,070
2006-07 146,765 91,497 22,926 20,736
2007-08 144,705 89,776 21,289 19,362
2008-09 138,372 85,527 20,223 18,256
2009-10 121,689 75,382 18,467 16,784
2010-11 109,813 66,934 16,377 14,758
2011-12 96,518 58,173 13,870 12,520
8-Year Change -36% -39% -50% -48%
Table 1: Delinquency and School-Related Arrest
and Youth Trends (Statewide)1
1 Source : Florida Department of Juveni le Justice, Juveni le Justice Information System (JJIS).
2 As reported in previous school arrest s tudies , and may not match the most recent Del inquency Profi le.
SCHOOL-RELATED DELINQUENCY ARRESTS Delinquency arrests in Florida’s schools decreased 50% between FY2004-05 and FY2011-12. In addition,
over the past eight years, 48% fewer youth were arrested for an offense that occurred on school
grounds. The reductions in school-related arrests far outpaced the reductions in general delinquency
arrests for an offense occurring somewhere other than school grounds. During FY2011-12, school-
related delinquency arrests accounted for 14% of all the cases handled by the Department of Juvenile
Justice, which was down from 19% during FY2004-05.

DELINQUENCY IN FLORIDA’S SCHOOLS: EIGHT YEARS OF IMPROVEMENT
Page 4
CountySchool-
Related2
Not School-
Related3 Total4 %School-
RelatedCounty
School-
Related
Not School-
RelatedTotal
%School-
Related
ALACHUA 328 1,196 1,410 23% LAKE 265 1,352 1,560 17%
BAKER 40 122 160 25% LEE 254 2,441 2,647 10%
BAY 187 921 1,077 17% LEON 182 846 992 18%
BRADFORD 29 96 121 24% LEVY 28 130 152 18%
BREVARD 290 2123 2,352 12% LIBERTY 4 11 15 27%
BROWARD 1,062 8,323 9,108 12% MADISON 50 100 137 36%
CALHOUN 7 47 54 13% MANATEE 352 1,940 2,204 16%
CHARLOTTE 98 699 779 13% MARION 237 1,058 1,243 19%
CITRUS 82 364 437 19% MARTIN 153 506 624 25%
CLAY 100 1,002 1,084 9% MONROE 33 174 198 17%
COLLIER 197 931 1,090 18% NASSAU 32 226 250 13%
COLUMBIA 50 299 338 15% OKALOOSA 79 862 923 9%
DADE 552 6,744 7,137 8% OKEECHOBEE 61 205 255 24%
DESOTO 20 159 174 11% ORANGE 1,048 7,826 8,611 12%
DIXIE 10 27 37 27% OSCEOLA 349 1,635 1,923 18%
DUVAL 476 3,814 4,201 11% PALM BEACH 716 4,725 5,179 14%
ESCAMBIA 442 1,862 2,236 20% PASCO 316 2,048 2,274 14%
FLAGLER 101 435 512 20% PINELLAS 846 4,475 4,990 17%
FRANKLIN 3 62 64 5% POLK 1,050 5,516 6,236 17%
GADSDEN 25 186 205 12% PUTNAM 178 477 596 30%
GILCHRIST 11 46 56 20% ST JOHNS 103 692 767 13%
GLADES 18 27 44 41% ST LUCIE 379 1,506 1,769 21%
GULF 6 44 49 12% SANTA ROSA 53 585 631 8%
HAMILTON 6 53 59 10% SARASOTA 150 1,245 1,364 11%
HARDEE 26 177 196 13% SEMINOLE 340 1,901 2,153 16%
HENDRY 95 204 279 34% SUMTER 33 109 138 24%
HERNANDO 129 572 673 19% SUWANNEE 74 176 231 32%
HIGHLANDS 103 681 760 14% TAYLOR 11 62 73 15%
HILLSBOROUGH 1,046 6,890 7,696 14% UNION 8 66 73 11%
HOLMES 5 71 75 7% VOLUSIA 689 2,769 3,314 21%
INDIAN RIVER 111 595 672 17% WAKULLA 9 79 85 11%
JACKSON 19 135 150 13% WALTON 55 211 260 21%
JEFFERSON 4 33 37 11% WASHINGTON 11 88 97 11%
LAFAYETTE 3 6 9 33% OTHER5 41 1,185 1,213 3%
TOTAL 13,870 86,166 96,515 14%
Delinquency Referrals by Type and County
(Fiscal Year 2011-12)1
1Source: Florida Department of Juvenile Justice (DJJ), Juvenile Justice Information System (JJIS).2Number of delinquency arrests received by DJJ that were identified as “school‐related.”3Number of delinquency arrests received by DJJ that were not identified as “school‐related.”4Total number of delinquency arrests received by DJJ during fiscal year 2011-12.5Cases where the county of residence could not be determined.
SCHOOL ARRESTS BY COUNTY During FY2011‐12, school‐related arrests accounted for an average of 14% of all delinquency arrests handled by the Department of Juvenile Justice. Broward County, one of Florida’s larger school districts, recorded the highest actual number of school‐related arrests (1,062).

DELINQUENCY IN FLORIDA’S SCHOOLS: EIGHT YEARS OF IMPROVEMENT
Page 5
CountyStudent
Population1
School-
Related2 Rate3 CountyStudent
Population1School-Related Rate3
ALACHUA 14,218 328 23 LAKE 21,350 265 12
BAKER 2,422 40 17 LEE 43,075 254 6
BAY 13,171 187 14 LEON 16,509 182 11
BRADFORD 1,552 29 19 LEVY 2,894 28 10
BREVARD 38,237 290 8 LIBERTY 721 4 6
BROWARD 138,307 1,062 8 MADISON 1,369 50 37
CALHOUN 1,086 7 6 MANATEE 22,523 352 16
CHARLOTTE 9,491 98 10 MARION 22,408 237 11
CITRUS 8,504 82 10 MARTIN 9,985 153 15
CLAY 19,814 100 5 MONROE 4,336 33 8
COLLIER 22,370 197 9 NASSAU 6,059 32 5
COLUMBIA 4,717 50 11 OKALOOSA 15,501 79 5
DADE 185,678 552 3 OKEECHOBEE 3,369 61 18
DESOTO 2,197 20 9 ORANGE 94,328 1048 11
DIXIE 943 10 11 OSCEOLA 29,482 349 12
DUVAL 62,141 476 8 PALM BEACH 94,096 716 8
ESCAMBIA 20,293 442 22 PASCO 35,439 316 9
FLAGLER 7,139 101 14 PINELLAS 56,005 846 15
FRANKLIN 607 3 5 POLK 48,915 1050 21
GADSDEN 2,591 25 10 PUTNAM 5,302 178 34
GILCHRIST 1,333 11 8 ST JOHNS 17,369 103 6
GLADES 627 18 29 ST LUCIE 20,979 379 18
GULF 1,052 6 6 SANTA ROSA 14,001 53 4
HAMILTON 747 6 8 SARASOTA 22,209 150 7
HARDEE 2,392 26 11 SEMINOLE 35,681 340 10
HENDRY 3,404 95 28 SUMTER 3,893 33 8
HERNANDO 12,378 129 10 SUWANNEE 3,070 74 24
HIGHLANDS 6,162 103 17 TAYLOR 1,376 11 8
HILLSBOROUGH 101,388 1,046 10 UNION 1,197 8 7
HOLMES 1,668 5 3 VOLUSIA 33,403 689 21
INDIAN RIVER 9,489 111 12 WAKULLA 2,449 9 4
JACKSON 3,480 19 5 WALTON 3,745 55 15
JEFFERSON 460 4 9 WASHINGTON 1,804 11 6
LAFAYETTE 560 3 5 OTHER5 NA 41 NA
TOTAL 1,395,460 13,870 10
School Referral Rates by County
(Delinquency Referrals) FY 2011-12
1 Source : Florida Department of Education, 2011-12 Survey 2 Data. Population of public schools (excluding labs)
grades 6-12 during the 2011-12 school year.2 Source : Florida Department of Juvenile Justice. Juvenile Justice Information System (JJIS).3 Number of school related arrests per 1,000 students ((School Arrests/Student Population)*1,000).
SCHOOL ARREST RATES BY COUNTY During FY2011‐12, there was an average of 10 school‐related delinquency arrests to the Department of Juvenile Justice for every 1,000 students. Madison County experienced the highest rate of school‐related arrests (37 for every 1,000 students).

DELINQUENCY IN FLORIDA’S SCHOOLS: EIGHT YEARS OF IMPROVEMENT
Page 6
School Arrest Rates Relative to Student Population Fiscal Year 2011 - 12
Small School Districts1
Medium School Districts1
Large School Districts1
Arrest Rates Arrest Rates Arrest Rates
Low – Average4
High5
Low – Average4
High5
Low – Average4
High5
HOLMES CHARLOTTE CLAY HERNANDO SEMINOLE HILLSBOROUGH
WAKULLA COLUMBIA OKALOOSA MARION DADE ORANGE
FRANKLIN DIXIE SANTA ROSA LEON LEE PINELLAS
NASSAU HARDEE ST JOHNS OSCEOLA BREVARD VOLUSIA
LAFAYETTE INDIAN RIVER COLLIER LAKE PALM BEACH POLK
JACKSON FLAGLER BAY DUVAL
LIBERTY WALTON MANATEE BROWARD
GULF MARTIN ST LUCIE PASCO
WASHINGTON BAKER SARASOTA
CALHOUN HIGHLANDS ESCAMBIA
UNION OKEECHOBEE ALACHUA
MONROE BRADFORD
1 Districts with 10,000 or less middle & high school students
2 Districts with 10,000 to 29,999 middle & high school students
3 Districts with 30,000 or more middle & high school students
4 Districts whose arrest rate was less than or equal to 10 for every 1,000 students
5 Districts whose arrest rate was 11 or more for every 1,000 students
Sources Student Population Data are derived from Florida Department of Education
(DOE), 2011-12 Survey 2 Data; Population of public school students (excludes lab)
in grades 6 – 12 during the 2011-12 school year. School-related delinquency arrest
data are derived from the Florida Department of Juvenile Justice (DJJ), Juvenile
Justice Information System (JJIS).
TAYLOR SUWANNEE
HAMILTON HENDRY
GILCHRIST GLADES
SUMTER PUTNAM
JEFFERSON MADISON
DESOTO
CITRUS
GADSDEN
LEVY
School Arrest Rates by School District Size
District Size Low Rates High Rates
Small District 74% 26%
Medium District 81% 19%
Large District 85% 15%
SCHOOL ARREST RATES RELATIVE TO STUDENT POPULATION For the purpose of this analysis, a school district is considered to have a low to average arrest rate if its rate is less than or equal to the statewide average (10 arrests for every 1,000 students). School districts with an arrest rate higher than 10 for every 1,000 students are considered to have a high arrest rate. A review of Florida’s school arrest rates relative to student populations for FY2011‐12 revealed the following:
DELINQUENCY IN FLORIDA’S SCHOOLS: EIGHT YEARS OF IMPROVEMENT
Page 7
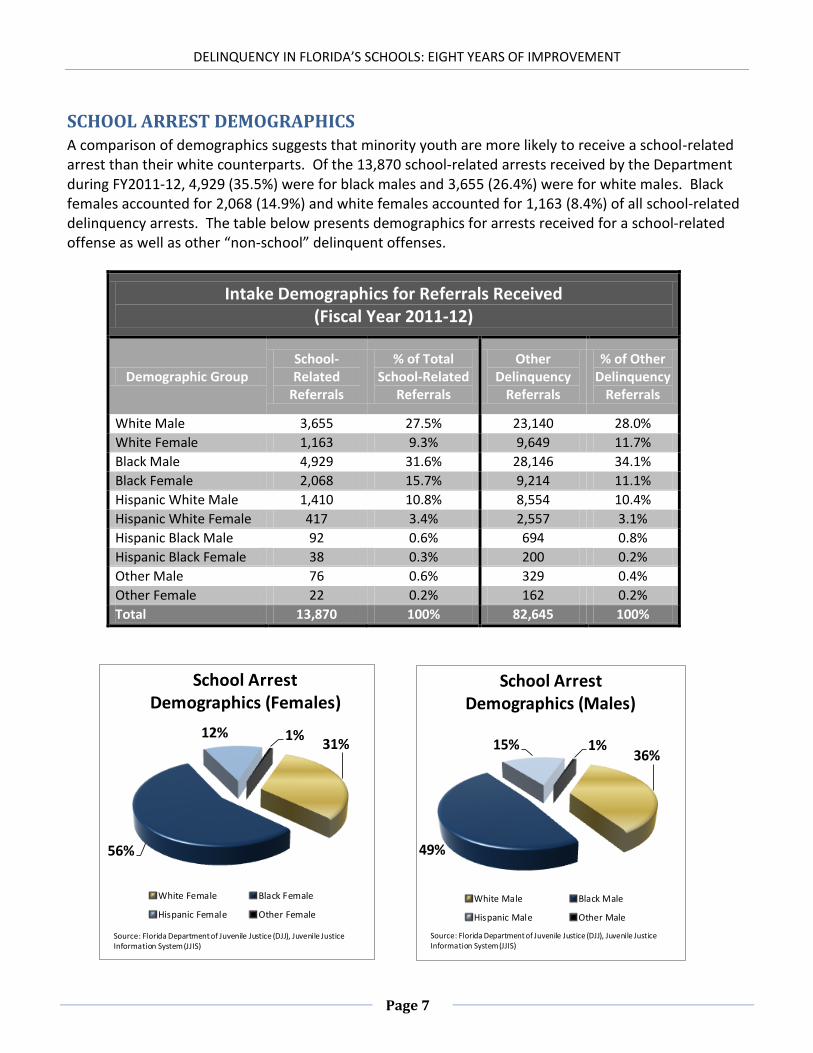
Intake Demographics for Referrals Received (Fiscal Year 2011-12)
Demographic Group School-Related
Referrals
% of Total School-Related
Referrals
Other Delinquency
Referrals
% of Other Delinquency
Referrals
White Male 3,655 27.5% 23,140 28.0%
White Female 1,163 9.3% 9,649 11.7%
Black Male 4,929 31.6% 28,146 34.1%
Black Female 2,068 15.7% 9,214 11.1%
Hispanic White Male 1,410 10.8% 8,554 10.4%
Hispanic White Female 417 3.4% 2,557 3.1%
Hispanic Black Male 92 0.6% 694 0.8%
Hispanic Black Female 38 0.3% 200 0.2%
Other Male 76 0.6% 329 0.4%
Other Female 22 0.2% 162 0.2%
Total 13,870 100% 82,645 100%
36%
49%
15% 1%
School Arrest Demographics (Males)
White Male Black Male
Hispanic Male Other Male
Source: Florida Department of Juvenile Justice (DJJ), Juvenile JusticeInformation System (JJIS)
31%
56%
12% 1%
School Arrest Demographics (Females)
White Female Black Female
Hispanic Female Other Female
Source: Florida Department of Juvenile Justice (DJJ), Juvenile JusticeInformation System (JJIS)
SCHOOL ARREST DEMOGRAPHICS A comparison of demographics suggests that minority youth are more likely to receive a school-related arrest than their white counterparts. Of the 13,870 school-related arrests received by the Department during FY2011‐12, 4,929 (35.5%) were for black males and 3,655 (26.4%) were for white males. Black females accounted for 2,068 (14.9%) and white females accounted for 1,163 (8.4%) of all school-related delinquency arrests. The table below presents demographics for arrests received for a school-related offense as well as other “non-school” delinquent offenses.

DELINQUENCY IN FLORIDA’S SCHOOLS: EIGHT YEARS OF IMPROVEMENT
Page 8
Assault /Battery (M)
DisorderlyConduct (M)
Violation ofDrug Laws (M)
AggravatedAssault/Battery
(F)
Trespassing
2,934
2,325 2,241
1,603
722
Most Common School-Related Delinquency Referrals Fiscal Year 2011-12
(M) = Misdemeaner (F) = Felony
32%
67%
1%
School Offense Categories
Fiscal Year 2011-12
Felony Misdemeanor Other
TYPES OF DELINQUENCY IN SCHOOLS The majority of school‐related offenses were for misdemeanor assault/battery and disorderly conduct laws (22% and 17%, respectively). Trespassing offenses accounted for 5.4% and drug or alcohol-related offenses accounted for 18% of school‐related arrests. The most common felony was aggravated assault/battery, representing 12% of all school arrests. During FY2011‐12, 49% of all delinquency arrests received by the Department were for misdemeanors, 29% were for felonies, and 22% were some other types of offenses (violation of ordinances, violation of probation, etc.). During the same period, 67% of school‐related arrests were for misdemeanors and 32% were for felonies. Other arrests accounted for less than 1% of school-related arrests.

DELINQUENCY IN FLORIDA’S SCHOOLS: EIGHT YEARS OF IMPROVEMENT
Page 9
TYPES OF DELINQUENCY IN SCHOOLS (Continued)
During FY2011-12, misdemeanors (67%) were the most common type of offense referred to the
Department. However, there are notable differences between counties, with the percentage of
misdemeanor arrests ranging from 25% to 100%. The table below presents school arrests by offense
category and county. The category of Other Arrests is not included in this table.
County Misd. Felony % % County Misd. Felony % %
Misd. Felony Misd. Felony
Alachua 248 79 76% 24% Lake 172 92 65% 35%
Baker 29 11 73% 28% Lee 191 63 75% 25%
Bay 152 35 81% 19% Leon 132 50 73% 27%
Bradford 18 11 62% 38% Levy 22 6 79% 21%
Brevard 183 107 63% 37% Liberty 1 3 25% 75%
Broward 754 306 71% 29% Madison 30 20 60% 40%
Calhoun 7 0 100% 0% Manatee 265 71 75% 20%
Charlotte 81 17 83% 17% Marion 160 76 68% 32%
Citrus 48 34 59% 41% Martin 125 28 82% 18%
Clay 68 31 68% 31% Monroe 25 8 76% 24%
Col l ier 148 48 75% 24% Nassau 11 21 34% 66%
Columbia 36 14 72% 28% Okaloosa 60 19 76% 24%
Dade 204 346 37% 63% Okeechobee 51 10 84% 16%
Desoto 15 5 75% 25% Orange 662 384 63% 37%
Dixie 6 4 60% 40% Osceola 217 132 62% 38%
Duval 212 263 45% 55% Palm Beach 429 286 60% 40%
Escambia 319 123 72% 28% Pasco 216 99 68% 31%
Flagler 79 22 78% 22% Pinel las 587 252 69% 30%
Frankl in 2 1 67% 33% Polk 784 261 75% 25%
Gadsden 15 10 60% 40% Putnam 119 58 67% 33%
Gi lchris t 10 1 91% 9% St Johns 62 41 60% 40%
Glades 15 3 83% 17% St Lucie 280 98 74% 26%
Gulf 4 2 67% 33% Santa Rosa 34 19 64% 36%
Hamilton 6 0 100% 0% Sarasota 108 33 72% 22%
Hardee 23 3 88% 12% Seminole 237 100 70% 29%
Hendry 77 17 81% 18% Sumter 21 12 64% 36%
Hernando 111 16 86% 12% Suwannee 56 18 76% 24%
Highlands 67 36 65% 35% Taylor 4 7 36% 64%
Hi l l sborough 669 376 64% 36% Union 7 1 88% 13%
Holmes 3 2 60% 40% Volus ia 503 183 73% 27%
Indian River 90 19 81% 17% Wakul la 6 3 67% 33%
Jackson 14 5 74% 26% Walton 38 17 69% 31%
Jefferson 2 2 50% 50% Washington 8 3 73% 27%
Lafayette 3 0 100% 0% Other 18 23 44% 56%
TOTAL 9,359 4,446 67% 32%
School Arrests by Type and County

DELINQUENCY IN FLORIDA’S SCHOOLS: EIGHT YEARS OF IMPROVEMENT
Page 10
DiversionServices
Dismissed,Not Filed,
Etc.
Probation OtherOutcomes
ResidentialCommitment
Transfer toAdult Court
40%
25%
17% 16%
2% 1%
School Referral Case DispositionsFiscal Year 2011-12
CASE OUTCOMES (DISPOSITIONS) FOR SCHOOL OFFENSES At the time of this report’s publication, not all school-related arrests had been disposed of by the court.
Primary court dispositions were available for 13,260 of the 13,870 school-related delinquency arrests
received by the Department during FY2011-12. Of the school-related delinquency arrests, 65% were
dismissed/not filed or received some type of diversion service.
Primary Case Dispositions Fiscal Year 2011-12
Disposition Number of
Cases % of Total
Diversion Services 5,333 40%
Dismissed, Not Filed, Etc. 3,281 25%
Probation 2,224 17%
Other Outcomes 2,095 16%
Residential Commitment 257 2%
Transfer to Adult Court 70 < 1%
Total: 13,260 100%

DELINQUENCY IN FLORIDA’S SCHOOLS: EIGHT YEARS OF IMPROVEMENT
Page 11
DEMOGRAPHICS AND CASE OUTCOMES FOR SCHOOL OFFENSES There are substantial differences in case outcomes for school offenses between white youth and their nonwhite counterparts. Black youth were substantially more likely to have their cases dismissed than their white counterparts. Black youth were involved in 54% of cases that were dismissed or not filed, compared to 32% for white youth. In addition, black males were much more likely to receive a commitment disposition or to have their cases transferred to adult court. Of the cases that resulted in a transfer to adult court, 63% involved a black youth versus 23% involved a white youth.
Case Disposition Demographics for School Referrals (Fiscal Year 2011-12)
Disposition Type White Male
White Female
Black Male
Black Female
Hispanic White Male
Hispanic White
Female
Hispanic Black Male
Hispanic Black
Female
Other Male
Other Female
Total
Diversion Services 1,539 549 1,460 804 626 200 25 16 41 13 5,273
Dismissed, Not Filed, Etc. 716 250 1,178 481 293 102 22 6 12 - 3,060
Probation 578 158 855 340 219 45 16 5 6 2 2,224
Other Outcomes 546 138 699 273 138 44 15 9 8 5 1,875
Residential Commitment 57 9 170 23 15 3 4 - - - 281
Transfer to Adult Court 16 - 43 1 8 - - - 2 - 70
Total Dispositions: 3,452 1,104 4,405 1,922 1,299 394 82 36 69 20 12,783
Case Disposition Demographics Percentages for School Referrals (Fiscal Year 2011-12)
Disposition Type White Male
White Female
Black Male
Black Female
Hispanic White Male
Hispanic White
Female
Hispanic Black Male
Hispanic Black
Female
Other Male
Other Female
Total
Diversion Services 29.2% 10.4% 27.7% 15.2% 11.9% 3.8% 0.5% 0.3% 0.8% 0.2% 100%
Dismissed, Not Filed, Etc. 23.4% 8.2% 38.5% 15.7% 9.6% 3.3% 0.7% 0.2% 0.4% 0.0% 100%
Probation 26.0% 7.1% 38.4% 15.3% 9.8% 2.0% 0.7% 0.2% 0.3% 0.1% 100%
Other Outcomes 29.1% 7.4% 37.3% 14.6% 7.4% 2.3% 0.8% 0.5% 0.4% 0.3% 100%
Residential Commitment 20.3% 3.2% 60.5% 8.2% 5.3% 1.1% 1.4% 0.0% 0.0% 0.0% 100%
Transfer to Adult Court 22.9% 0.0% 61.4% 1.4% 11.4% 0.0% 0.0% 0.0% 2.9% 0.0% 100%
% of Total Dispositions: 27.0% 8.6% 34.5% 15.0% 10.2% 3.1% 0.6% 0.3% 0.5% 0.2% 100%
Case Disposition by Race/Ethnicity Fiscal Year 2011-12
Disposition Type WHITE BLACK HISPANIC OTHER Total
Diversion Services 40% 43% 16% 1% 100%
Dismissed, Not Filed, Etc. 32% 54% 14% 0% 100%
Probation 33% 54% 13% 0% 100%
Other Outcomes 36% 52% 11% 1% 100%
Residential Commitment 23% 69% 8% 0% 100%
Transfer to Adult Court 23% 63% 11% 3% 100%
% of Total Dispositions: 36% 49% 14% 1% 100%
DELINQUENCY IN FLORIDA’S SCHOOLS: EIGHT YEARS OF IMPROVEMENT
Page 12
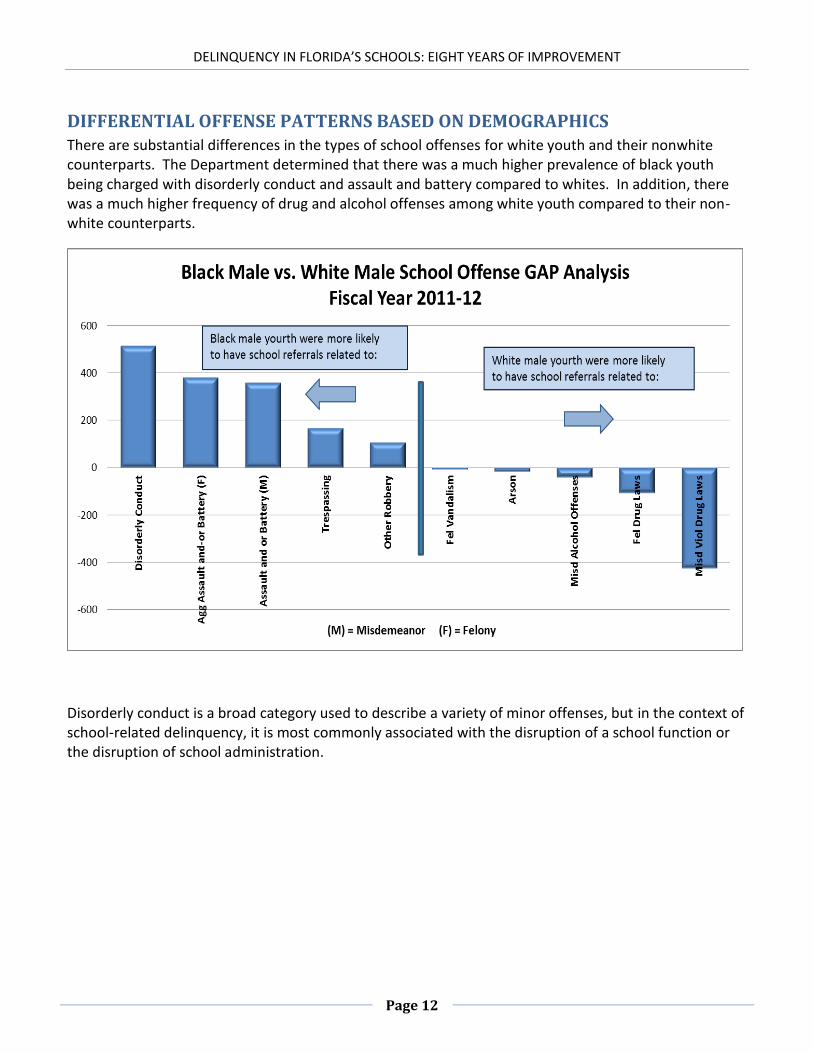
DIFFERENTIAL OFFENSE PATTERNS BASED ON DEMOGRAPHICS There are substantial differences in the types of school offenses for white youth and their nonwhite counterparts. The Department determined that there was a much higher prevalence of black youth being charged with disorderly conduct and assault and battery compared to whites. In addition, there was a much higher frequency of drug and alcohol offenses among white youth compared to their non-white counterparts.
Disorderly conduct is a broad category used to describe a variety of minor offenses, but in the context of school-related delinquency, it is most commonly associated with the disruption of a school function or the disruption of school administration.

DELINQUENCY IN FLORIDA’S SCHOOLS: EIGHT YEARS OF IMPROVEMENT
Page 13
CountySchool-Related
Youth1
First
Referral2% First
ReferralCounty
School-Related
Youth1
First
Referral2% First
Referral
ALACHUA 328 128 39% LAKE 265 150 57%
BAKER 40 30 75% LEE 254 146 57%
BAY 187 118 63% LEON 182 76 42%
BRADFORD 29 18 62% LEVY 28 14 50%
BREVARD 290 151 52% LIBERTY 4 4 100%
BROWARD 1,062 568 53% MADISON 50 29 58%
CALHOUN 7 5 71% MANATEE 352 192 55%
CHARLOTTE 98 64 65% MARION 237 108 46%
CITRUS 82 53 65% MARTIN 153 80 52%
CLAY 100 60 60% MONROE 33 13 39%
COLLIER 197 104 53% NASSAU 32 21 66%
COLUMBIA 50 30 60% OKALOOSA 79 44 56%
DADE 552 247 45% OKEECHOBEE 61 33 54%
DESOTO 20 12 60% ORANGE 1,048 571 54%
DIXIE 10 9 90% OSCEOLA 349 209 60%
DUVAL 476 267 56% PALM BEACH 716 276 39%
ESCAMBIA 442 295 67% PASCO 316 151 48%
FLAGLER 101 54 53% PINELLAS 846 307 36%
FRANKLIN 3 2 67% POLK 1,050 478 46%
GADSDEN 25 16 64% PUTNAM 178 77 43%
GILCHRIST 11 8 73% ST JOHNS 103 45 44%
GLADES 18 14 78% ST LUCIE 379 161 42%
GULF 6 4 67% SANTA ROSA 53 30 57%
HAMILTON 6 5 83% SARASOTA 150 74 49%
HARDEE 26 18 69% SEMINOLE 340 176 52%
HENDRY 95 55 58% SUMTER 33 25 76%
HERNANDO 129 78 60% SUWANNEE 74 43 58%
HIGHLANDS 103 55 53% TAYLOR 11 9 82%
HILLSBOROUGH 1,046 563 54% UNION 8 5 63%
HOLMES 5 4 80% VOLUSIA 689 380 55%
INDIAN RIVER 111 51 46% WAKULLA 9 5 56%
JACKSON 19 12 63% WALTON 55 43 78%
JEFFERSON 4 3 75% WASHINGTON 11 9 82%
LAFAYETTE 3 0 0% OTHER 41 19 46%
TOTAL 13,870 7,104 51%
1 Unduplicated number of youth received by DJJ with at least one school based delinquency referral.
2 Unduplicated number of youth received by DJJ whose school-based offense was their first delinquency referral.
School-Related Referrals for First-Time Offenders by County
Fiscal Year 2011-12
SCHOOL OFFENSES AS GATEWAYS TO THE JUVENILE JUSTICE SYSTEM A school offense was the gateway to the juvenile justice system for 7,104 youth (51% of all youth referred for a school offense) during FY2011-12. The percentage of school-related arrests that are for first-time offenders ranged from 0% to 100%.

DELINQUENCY IN FLORIDA’S SCHOOLS: EIGHT YEARS OF IMPROVEMENT
Page 14
STUDENT STATUS AND SCHOOL ARRESTS Analysts from the Department of Juvenile Justice (DJJ) and the Department of Education (DOE)
examined 12,520 youth who received a school-related arrest during FY 2011-12 to determine the extent
to which certain behaviors or statuses affect delinquency in schools. DOE analysts were able to match
9,145 of these youth to education status and discipline records. The results indicated that, for the youth
for whom this information was available, a large percentage of youth who received a school-related
delinquency arrest have a history of truancy or suspension. Smaller proportions of these youth were
identified in an Exceptional Student Education (ESE) status or were previously expelled from school.
OUT-OF-SCHOOLSUSPENSION
IN-SCHOOLSUSPENSION
CHRONICABSENTEEISM
ESE STUDENT PREVIOUSEXPULSION
83%
61%
52%
29%
4%
School Referral Students & SchoolStatus/History (FY 2011-12)
Source: Department of Education (DOE). Percentages reflect rates for only youth whose
school discipline and status data were available (n = 9,145 out of 12,520).

DELINQUENCY IN FLORIDA’S SCHOOLS: EIGHT YEARS OF IMPROVEMENT
Page 15
DEFINITION OF TERMS AND DATA SOURCES CHRONICALLY ABSENT – refers to a youth with 21 or more absences during a school year and within two years of being referred to the Department of Juvenile Justice for school-related delinquency. Data Source: Florida Department of Education.
DELINQUENCY ARREST RECEIVED – refers to a “case” involving a youth that has been received by the
Florida Department of Juvenile Justice. Local, state and federal law enforcement arrest and refer youth
to the Department. Data Source: Florida Department of Juvenile Justice, Juvenile Justice Information
System (JJIS).
DELINQUENT YOUTH RECEIVED – refers to the unduplicated number of youth received by the
Department of Juvenile Justice during the fiscal year. Some youth may be arrested and referred to the
Department multiple times over the course of a single year. A youth with multiple delinquency arrests is
only counted once in this category. Data Source: Florida Department of Juvenile Justice, Juvenile Justice
Information System (JJIS).
DISMISSED, NOT FILED, ETC – refers to cases that were ultimately dismissed, not filed or otherwise not
pursued by the juvenile or adult court. Data Source: Florida Department of Juvenile Justice, Juvenile
Justice Information System (JJIS).
DIVERSION SERVICES – refers to cases disposed by the court to diversion services. Examples of
diversion services include but are not limited to: civil citation, teen court, intensive delinquency
diversion services (IDDS), and juvenile alternative services program (JASP). Data Source: Florida
Department of Juvenile Justice, Juvenile Justice Information System (JJIS).
EXCEPTIONAL STUDENT EDUCATION (ESE) – refers to a student enrolled in or eligible for enrollment in the public schools in a district that requires special instruction. This can include services to take full advantage of or respond to educational programs and opportunities because of a physical, mental, emotional, social or learning exceptionality. Data Source: Florida Department of Education. FIRST ARREST – refers to youth whose first delinquency arrest was school-related. Data Source: Florida
Department of Juvenile Justice, Juvenile Justice Information System (JJIS).
FISCAL YEAR – the state of Florida fiscal year runs from July 1 through June 30.
IN-SCHOOL SUSPENSION – refers to youth who received one or more in-school suspension within two years of being referred to the Department of Juvenile Justice for school-related delinquency. After or during school detention is an example of an in-school suspension. Data Source: Florida Department of Education (DOE). OUT-OF-SCHOOL SUSPENSION – refers to a youth who received at least one out-of-school suspension within two years of being referred to the Department of Juvenile Justice for school-related delinquency. Data Source: Florida Department of Education (DOE).

DELINQUENCY IN FLORIDA’S SCHOOLS: EIGHT YEARS OF IMPROVEMENT
Page 16
RATE (SCHOOL RERERRAL) – refers to the number of school-related delinquency arrests for every 1,000
students in public school grades 6-12.
RESIDENTIAL COMMITMENT – refers to cases that were disposed to a Department of Juvenile Justice
residential commitment placement. Data Source: Florida Department of Juvenile Justice (DJJ), Juvenile
Justice Information System (JJIS).
SCHOOL-RELATED ARRESTS RECEIVED – refers to a “case” involving a youth that has been received by
the Florida Department of Juvenile Justice for an offense occurring on school grounds, a school bus, an
official school bus stop, or a school event. Local, state and federal law enforcement arrest and refer
youth to the Department. Data Source: Florida Department of Juvenile Justice (DJJ), Juvenile Justice
Information System (JJIS).
SCHOOL-RELATED YOUTH RECEIVED – refers to the unduplicated number of youth received by the
Department of Juvenile Justice during the fiscal year for an offense occurring on school grounds, a
school bus, an official school bus stop, or a school event. Some youth may be arrested and referred to
the Department multiple times over the course of a single year. A youth with multiple delinquency
arrests is only counted once in this category. Data Source: Florida Department of Juvenile Justice (DJJ),
Juvenile Justice Information System (JJIS).
STUDENT POPULATION – refers to the number of public school students in grades 6-12 during the 2008-
09 school year. Student population figures do not include students participating in “virtual” schools or in
some specialized schools, (i.e. FSU LAB, FAMU LAB, FAU LAB, UF LAB, Dozier, DEAF/BLIND or FLVA).
Data Source: Florida Department of Education (DOE), Survey 2 Data.
PREVIOUS EXPULSION – refers to a youth who was expelled from a public school within two years of being referred to the Department of Juvenile Justice for school-related delinquency. Data Source: Florida Department of Education (DOE).
PROBATION SERVICES – refers to cases that were disposed to general juvenile probation. Data Source:
Florida Department of Juvenile Justice (DJJ), Juvenile Justice Information System (JJIS).
OTHER OUTCOME – refers to cases that were not disposed at the time of this report or received some
other outcome such as court fines or a judicial warning. Data Source: Florida Department of Juvenile
Justice (DJJ), Juvenile Justice Information System (JJIS).
TRANSFER TO ADULT COURT – refers to cases that were transferred to adult court. The majority of
transfers to adult court cases were direct-filed by local state attorneys. Data Source: Florida Department
of Juvenile Justice (DJJ), Juvenile Justice Information System (JJIS).