deliver trusted data and empower users to govern data with sap
TRANSCRIPT

TEST CASE DOCUMENTATION
AND TESTING RESULTS
TEST CASE ID EM-VAL-5.1
TEAM Workshop Problem 7
Tested with LS-DYNA R© v980 Revision Beta
Friday 1st June, 2012

Document Information
Confidentiality external use
Document Identifier LSTC-QA-LS-DYNA-EM-VAL-5.1-1
Author(s) Inaki Caldichoury, Pierre L’ Eplattenier
Number of pages 9
Date created Friday 1st June, 2012
Distribution External
Disclaimer:
The test case(s) described herein are for illustrative purposes only. LSTCdoes not warrant that a user of these or other LS-DYNA features will expe-rience the same or similar results or that a feature will meet the user’s par-ticular requirements or operate error free. FURTHERMORE, THERE ARENO WARRANTIES, EITHER EXPRESS OR IMPLIED, ORAL OR WRIT-TEN, WITH RESPECT TO THE DOCUMENTATION AND SOFTWAREDESCRIBED HEREIN INCLUDING, BUT NOT LIMITED TO ANY IM-PLIED WARRANTIES (i) OF MERCHANTABILITY, OR (ii) FITNESSFOR A PARTICULAR PURPOSES, OR (iii) ARISING FROM COURSEOF PERFORMANCE OR DEALING, OR FROM USAGE OF TRADE OR.THE REMEDIES SET FORTH HEREIN ARE EXCLUSIVE AND IN LIEUOF ALL OTHER REMEDIES FOR BREACH OF WARRANTY.
LSTC-QA-LS-DYNA-EM-VAL-5.1-1 i

Contents
1 Introduction 11.1 Purpose of this Document . . . . . . . . . . . . . . . . . . . . . . . . . . . . 1
2 Test Case Information 2
3 Test Case Specification 33.1 Test Case Purpose . . . . . . . . . . . . . . . . . . . . . . . . . . . . . . . . 33.2 Test Case Description . . . . . . . . . . . . . . . . . . . . . . . . . . . . . . . 33.3 Model Description . . . . . . . . . . . . . . . . . . . . . . . . . . . . . . . . 5
4 Test Case Results 64.1 Test Case observations . . . . . . . . . . . . . . . . . . . . . . . . . . . . . . 6
ii LSTC-QA-LS-DYNA-EM-VAL-5.1-1
1 Introduction
1.1 Purpose of this Document
This document specifies the test case EM-VAL-5.1. It provides general test case informationlike name and ID as well as information to the confidentiality, status, and classification ofthe test case.
A detailed description of the test case is given, the purpose of the test case is defined, and thetested features are named. Results and observations are stated and discussed. Testing resultsare provided in section 4.1 for the therein mentioned LS-DYNA R© version and platforms.
LSTC-QA-LS-DYNA-EM-VAL-5.1-1 1
2 Test Case Information
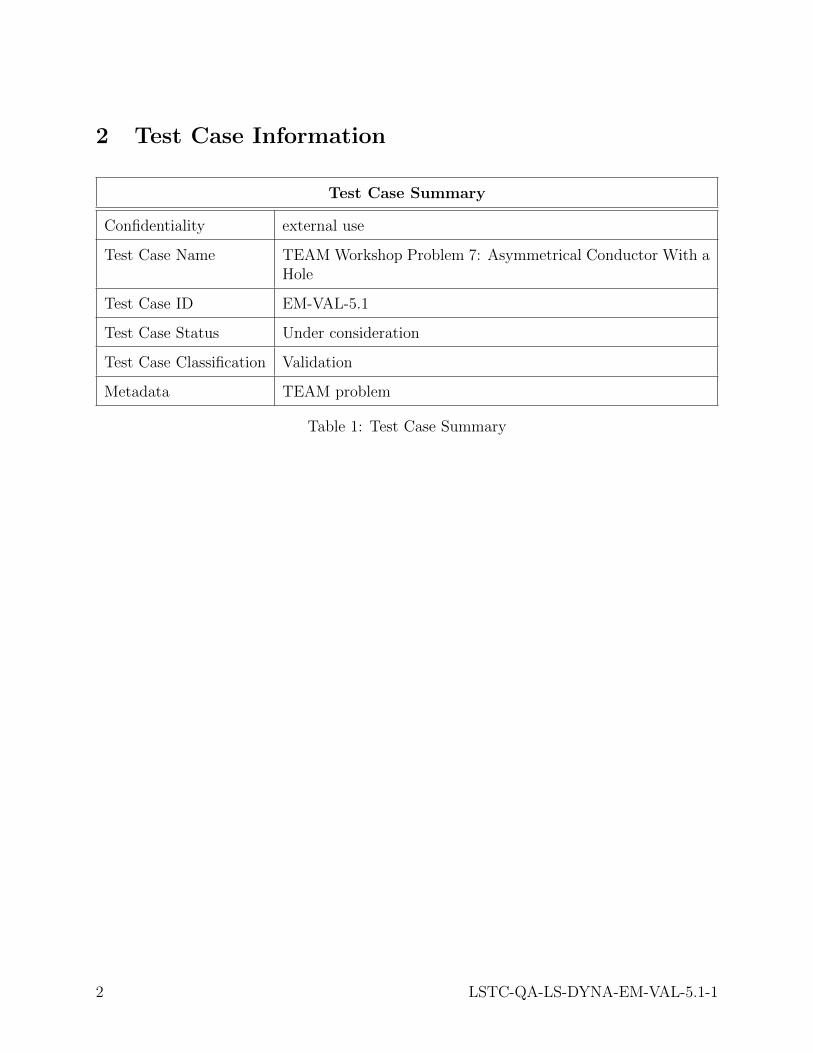
Test Case Summary
Confidentiality external use
Test Case Name TEAM Workshop Problem 7: Asymmetrical Conductor With aHole
Test Case ID EM-VAL-5.1
Test Case Status Under consideration
Test Case Classification Validation
Metadata TEAM problem
Table 1: Test Case Summary
2 LSTC-QA-LS-DYNA-EM-VAL-5.1-1

3 Test Case Specification
3.1 Test Case Purpose
The purpose of this test case is to analyse the EM solver’s capabilities at simulating a uniformcurrent (no eddy currents) circulating in a coil interacting with a conductor plate where thefull Eddy Current problem is solved.
3.2 Test Case Description
TEAM (Testing Electromagnetic Analysis Methods) represents an open international work-ing group aiming to compare electromagnetic analysis computer codes. TEAM Workshopsare meetings of this group. A series of TEAM Workshops was started in 1986 and has beenorganized in two-year rounds, each comprising a series of ”Regional” workshops and a ”Fi-nal” Workshop, as a satellite event of the COMPUMAG Conference. The TEAM problemsconsist in a list of test-problems, with precisely defined dimensions, constitutive laws of ma-terials, excitations, etc., and each backed by a real laboratory device, on which measurementscan be made.
The TEAM 7 problem is very similar to the TEAM 3 problem but offers a little more chal-lenge since the geometry is asymmetric(See Figure (1)). A thick aluminum plate with a hole,which is placed eccentrically, is set unsymmetrically in a non-uniform magnetic field. Thefield is produced by the exciting current which varies sinusoidally with time.
To examine the accuracy of the results, the z-components Bz of the flux densities along theline A1-B1 (y=72 mm, z=34 mm) and A2-B2 (y=144 mm, z=34 mm) are studied at wt = 0(i.e when the coil’s current value reaches its peak) and wt = 90 (i.e when the coil’s currentvalue is 0). The results will compared to the reference experimental results by [1].
LSTC-QA-LS-DYNA-EM-VAL-5.1-1 3

Figure 1: Test case sketch and dimensions
4 LSTC-QA-LS-DYNA-EM-VAL-5.1-1

3.3 Model Description
The conductivity of the plate is 35.26e6S.m−1. Two different frequencies in the coil willbe studied namely 50Hz and 200Hz respectively. The ampere turn of the coil is 2742AT .Figure (2) and Table (2) give some information on the mesh.
Figure 2: Test case Mesh
Model information
Plate surface element size 9 (mm)
Number of elements in the thickness of theplate
10
Total number of Nodes (Coil and Plate) 14432
Total number of Solid elements (Coil andPlate)
11200
Table 2: Test Case Mesh information
LSTC-QA-LS-DYNA-EM-VAL-5.1-1 5

4 Test Case Results
4.1 Test Case observations
On Figure (3), the current density vectors can be observed. The current can be seen rotatingmainly just underneath the coil’s location with a small portion flowing around the hole. Sincethe current is sinusoidal, the direction of the current flow gets periodically inverted. Figure(4) and Figure (5) show the results for the magnetic field Bz at wt = 0 and wt = 90 alongthe line A1-B1 and A2-B2 and offer a comparison with the measured results. For wt = 0,the results are in good agreement with the experimental results by [1]. For wt = 90, theresults show some discrepancies especially for the 200Hz frequency case. However, theseexperimental results don’t seem to be in accordance with the other curves and show a veryunstable behavior that may be the result of bad measurements.
Figure 3: Test Case Density current vectors
6 LSTC-QA-LS-DYNA-EM-VAL-5.1-1
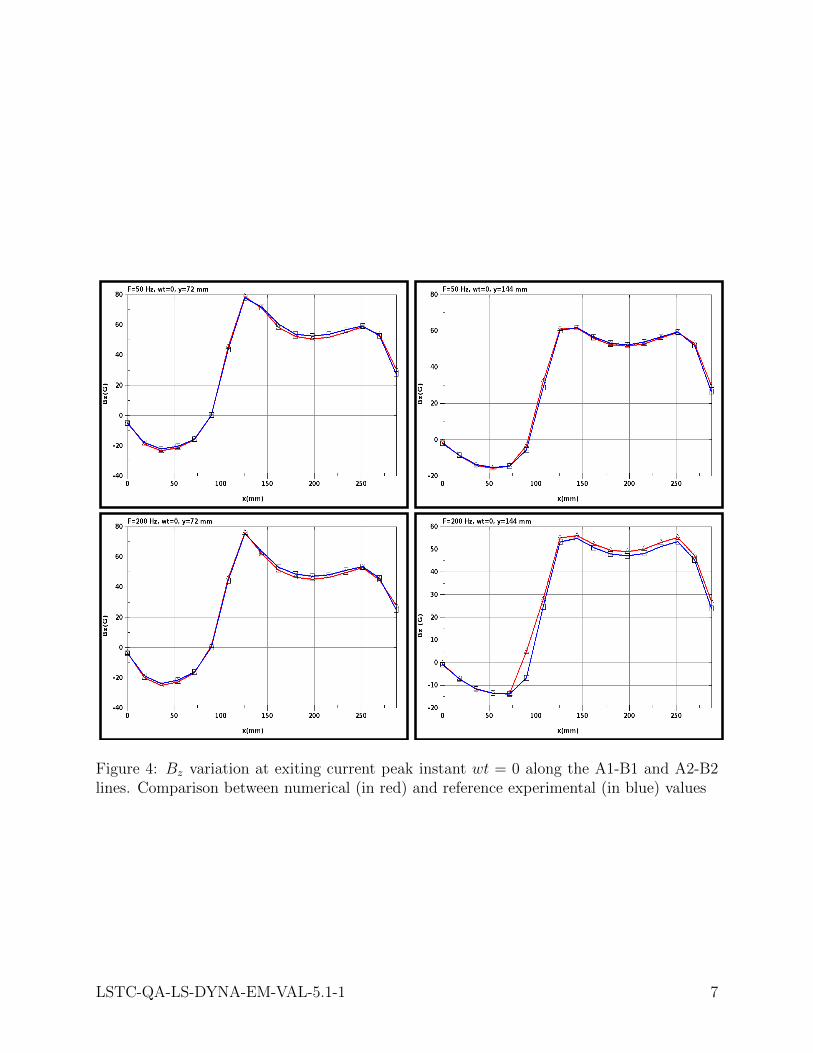
Figure 4: Bz variation at exiting current peak instant wt = 0 along the A1-B1 and A2-B2lines. Comparison between numerical (in red) and reference experimental (in blue) values
LSTC-QA-LS-DYNA-EM-VAL-5.1-1 7

Figure 5: Bz variation at exiting current minimum instant wt = 90 along the A1-B1 andA2-B2 lines. Comparison between numerical (in red) and reference experimental (in blue)values
8 LSTC-QA-LS-DYNA-EM-VAL-5.1-1

References
[1] K. FUJIWARA and T. NAKATA, Results for benchmark problem 7 (asymmetri-cal conductor with a hole), COMPEL-The International Journal for Computation andMathematics in Electrical and Electronic Engineering, 9 (1990), pp. 17–154.
LSTC-QA-LS-DYNA-EM-VAL-5.1-1 9