deliverable 5.11: river vltava modelling, final report
TRANSCRIPT

FRAMEWORK PROGRAMME
THEME 6: Environment (including Climate Change)
Adaptive Strategies to Mitigate the Impacts of Climate Change on European Freshwater Ecosystems
Collaborative Project (large-scale integrating project)
Grant Agreement 244121
Duration: 1 February 2010 – 31 January 2014
Deliverable 5.11: River Vltava modelling, final report
Lead contractor: BCAS
Other contractors involved: -
Due date of deliverable: Month 44 Actual submission date: Month 46
Work package: 5 – Integrated Biophysical Modelling
Contributors: Josef Hejzlar, Jiří Jarošík, Jiří Kopáček
Estimated person months: 10
Project co-funded by the European Commission within the Seventh Framework Programme (2007-2013) Dissemination Level (add X to PU, PP. RE or CO)
PU Public X
PP Restricted to other programme participants (including the Commission Services)
RE Restricted to a group specified by the consortium (including the Commission Services)
CO Confidential, only for members of the consortium (including the Commission Services)

2
TABLE OF CONTENTS
ABSTRACT .................................................................................................................................................... 3
1. INTRODUCTION ....................................................................................................................................... 5 2. STUDY AREA AND DATA ........................................................................................................................ 5
2.1. STUDY AREA ................................................................................................................................................ 5 2.2. EXISTING AND NEW DATA ............................................................................................................................ 6
2.2.1. Existing data ........................................................................................................................................ 6 2.2.2. REFRESH data .................................................................................................................................... 7
3. MODEL SETUP ......................................................................................................................................... 7 3.1. MODEL CALIBRATION AND TESTING ........................................................................................................... 10
3.1.1. Calibration ........................................................................................................................................ 10 3.1.2. Testing ............................................................................................................................................... 11
3.2. SENSITIVITY ANALYSIS ............................................................................................................................... 11 3.3. UNCERTAINTY ANALYSIS ........................................................................................................................... 11 3.4. SCENARIO ANALYSIS .................................................................................................................................. 12
3.4.1. Climate .............................................................................................................................................. 12 3.4.2. Nitrogen deposition ........................................................................................................................... 13 3.4.3. Land use, demography and socio-economic conditions .................................................................... 14 3.4.4. Scenarios with mitigation measures against eutrophication of the Orlík reservoir .......................... 16 3.4.5. Water-use scenarios .......................................................................................................................... 16 3.4.6. Scenario runs ..................................................................................................................................... 16
4. RESULTS .................................................................................................................................................. 17 4.1. MODEL CALIBRATION AND TESTING ........................................................................................................... 18
4.1.1. INCA models ...................................................................................................................................... 18 4.1.2. CE-QUAL-W2 .................................................................................................................................... 20
4.2. SENSITIVITY ANALYSIS ............................................................................................................................... 22 4.3. UNCERTAINTY ANALYSIS ........................................................................................................................... 23 4.4. SCENARIO ANALYSIS .................................................................................................................................. 25
4.4.1. Representativeness of model climate data for running the model system .......................................... 25 4.4.2. Impacts of climate change and catchment land use in the Orlík reservoir ........................................ 26
5. CONCLUSIONS ....................................................................................................................................... 28 6. REFERENCES ......................................................................................................................................... 29 7. ANNEX ..................................................................................................................................................... 32

3
Abstract
The REFRESH project aims to help design adaptation and mitigation strategies for freshwater ecosystems to comply with the Water Framework (WFD) and Habitats Directives (HD). Tasks 5.2 and 5.3 are concerned with developing model systems that can simulate catchment hydrology and water quality together with ecological processes in receiving water bodies. These model systems are used to investigate the likely changes in hydrology and water quality under scenarios of climate and land use change. This report presents the outcomes of Tasks 5.2 and 5.3 for the Czech demonstration site, the upper Vltava catchment in the southern Czech Republic. The specific aims for this catchment were to: (i) predict the effects of changes in climate and land use on water quality and eutrophication in the catchment-lake ecosystem; and (ii) integrate modelling outcomes with cost-effectiveness analysis carried out in work package 6, to determine the most cost effective options for reducing eutrophication, both at current conditions and under future scenarios of environmental change.
The upper Vltava catchment upstream from the dam of Orlík reservoir consists of a heterogeneous landscape with natural forested mountainous parts, agriculturally employed river valleys and upland plains, urban areas, and numerous artificial reservoirs used for fish production and water storage. The Orlík reservoir is the largest reservoir in the Czech Republic and is primarily used for hydropower
but it has also a high potential for recreation use. Eutrophication problems of the Orlík reservoir mostly due to excessive phosphorus loading from municipal wastewater discharges, fishpond
fisheries and agriculture losses have been a major concern since the 1990s when heavy cyanobacteria blooms started to seriously hamper recreation at this large water body and development of the surrounding region.
The model chain system for simulations of climate and land use change effects on hydrology, water quality and reservoir ecology in the Vltava catchment consisted of INCA-N/INCA-P and CE-QUAL-W2 models for simulations of the precipitation-runoff process in the catchment and the reservoir hydrodynamics and water quality, respectively. The models were successfully calibrated and validated in two separate parts of the 1991–2010 period. This period featured large changes of water quality in streams and reservoirs that were initiated by the socio-economic change from a planned to market economy in the Czech Republic in 1990. Then, river flow and nutrient concentrations in the catchment runoff and temperature stratification, water level fluctuation, hypolimnion oxygen deficit, phosphorus and chlorophyll-a concentrations in four major storage reservoirs, i.e. Lipno, Římov,
Hněvkovice, and Orlík, were simulated for the baseline period of 19812010 and for the scenario
period of 20312060, using predictions of three climate models and four different land use and socio-economic development scenarios.
All three future climate change scenarios in the Vltava catchment resulted in only small modifications of simulated mean river flow but in a significant increase in phosphorus (by 7 to 21%) and decrease in nitrate (by 1 to 9%) concentrations. In the Orlík reservoir, the climate change scenarios resulted in an increased water level fluctuation (by 0 to 3.1 m), prolonged anoxic conditions in the hypolimnion and decreased mean phosphorus (by 3 to 9%), and chlorophyll-a (by 3 to 15%) concentrations that apparently resulted from increased phosphorus retention in the reservoir under the conditions of changed seasonal flow pattern. The simulations of future alternatives of socio-economic development according to A1 (World Markets), A2/B2 (National Enterprise / Local Stewardship), and B1 (Global Sustainability) scenarios indicated that impacts of land use change and wastewater management are far more important than the influence of climate change.
Finally, a set of mitigation measures against eutrophication of the Orlík reservoir was selected in collaboration with work package 6 to determine if compliance with the WDF quality standards could

4
be achieved. The mitigation measures included: (i) the 90% efficiency of P removal from all municipal and other wastewater discharges, (ii) fishpond fishery production with zero phosphorus surplus, and (iii) the grassing of steep (>7°) arable land areas and 20-m wide buffer zones along streams. The resulting scenario runs for present and future climate indicated that it might be difficult to decrease the phosphorus concentrations in the runoff from catchment to the required level by this suggested set of mitigation measures. Despite this, the standards for phosphorus and chlorophyll-a concentrations could be met in the Orlík reservoir. Under future climate conditions, the inflow concentrations tended to increase. Anyway, the phosphorus and chlorophyll-a concentrations remained near the required standard level, apparently due to increased phosphorus retention in the reservoir in conditions of prolonged water residence time and higher temperature. The nitrate concentration met the WFD standard in the current state as well as under the future climate conditions.

5
1. Introduction
Eutrophication of surface waters resulting from excessive nutrient loads has been identified as an important problem of water quality and aquatic ecosystem state in the River Vltava catchment since the 1970s (e.g., Straškraba at Straškrabová 1975, Hejzlar et al. 1996, Procházková at al. 1996, Hejzlar et al. 2000). The problem persists and will cause the non-compliance for many water bodies in this catchment (and similarly in the whole Czech Republic) with the requirement of the EU Water Framework Directive for reaching good ecological state in 2015. Problems with high nutrient loads into streams and rivers in the Czech Republic are largely due to insufficient national resources to take remediation measures, especially to build efficient municipal sewerages and wastewater treatment plants, but also due to missing a substantiated, quantitative method for analysis of catchment nutrient sources.
The aim of biophysical modelling at the demonstration catchment of the River Vltava is to highlight methodologies for quantification of catchment nutrient sources, explore historical perspectives on the problem and future projections. The biophysical modelling at the catchment-scale is used to enable a socio-economic analysis (through collaborations with WP6) that can initiate efforts for searching solutions to abate nutrient pollution and improve the ecological state and potential of rivers and reservoirs.
2. Study area and data
2.1. Study area
The study area is the upper River Vltava catchment (12,116 km2, mean altitude of 589 m above sea level (masl)) that stretches from the border mountain range of the Bohemian Forest between the Czech Republic, Austria, and Germany (maximum altitude of 1378 masl) to the Orlík Reservoir (altitude of 354 masl), situated ca 70 km south (and upstream) of Prague.
This landscape is naturally lakeless due to its old geological age (Precambrian) but is characterised by numerous artificial reservoirs. Most standing water areas are shallow and were created in the Middle Ages and early Modern Ages for fish production. Four large and deep hydropower, water supply and flood protection reservoirs were constructed by damming the Vltava River and its tributaries during the second half of the 20th century (i.e., Lipno, Orlík, Římov, and Hněvkovice). The bedrock of the catchment is mostly formed by gneiss, mica-schist, and granite. Soils are dominated by cambisols (67%), stagnosols (13%), and podzols (10%), with the depth usually less than one metre in steep mountain areas, and greater than one metre elsewhere. Main land cover classes include currently (2005-2010) farmland, forests (consisting of more than 80% of Norway spruce plantations), surface waters and urban areas in proportions of 52%, 42%, 3%, and 3% of the catchment area, respectively. Their relative proportions differ with elevation, from a farmland dominance (60%) below an elevation of 600 m to a forest dominance (88%) at elevations greater than 900 m. Between 1959 and 2010 the forest proportion of the total catchment area increased from 38% to 42%, whereas the farmland decreased from 57% to 52%. This change occurred due to natural reforestation of abandoned pastures and meadows. In addition, approximately 330 km2 of arable land was converted to grassland in the 1990s. The area of surface waters increased from 370 to 460 km2 in the study catchment between 1959 and 2010. The volume of surface waters almost tripled from 0.57 to 1.60 km3 in 1959–1963 due to the construction and filling of two deep reservoirs (Lipno, Orlík) and further increased to 1.66 km3 by 1991 due to the construction of two small reservoirs (Římov, Hněvkovice).
6
The catchment includes most of the area of the administrative South Bohemian district (area of 11,347 km2), with available annual statistical data on land use characteristics, agricultural activities (production of major products, livestock numbers, application of synthetic fertilizers, and drainage of farmland), population, and development of sanitary systems (waste water production and treatment). Consequently, data describing fertilization rates and livestock numbers, percent drainage of farmland, contribution of arable land and pastures to the total farmland area, and trends in the development of sanitary systems were available for the study catchment to aid interpretation of the hydrological and water quality data and to implement the catchment-scale biophysical models.
The water quality of the River Vltava has suffered from high P loading from mainly point sources due to discharges from wastewater treatment plants (WWTPs) along the river and its tributaries, and also from diffuse sources from agriculture and fishpond fisheries production. Exceedence of the phosphorus concentration standards is the largest single reason for Czech water bodies not to reach good ecological status as defined in the EU Water Framework Directive (WFD). The WFD as applied to the Vltava catchment is shown in Table 1. For streams and rivers at altitude below 800 m, the total phosphorus (TP) and phosphate (PO4-P) standards for good status are below 0.045–0.05 mg l-1 and 0.035–0004 mg l-1respectively. Current TP in the total inflow into the Orlík reservoir from all its tributaries is of the order of 0.15 mg l-1, i.e., about three times above the required standard.
Table 1. WFD nutrient and eutrophication standards for the Czech Republic rivers and reservoirs (boundary values between high and good (H/G) or good and moderate (G/M) status for streams and rivers or potential for reservoirs)
Water type TP, mg l-1 PO4-P, mg l-1 NO3-N, mg l-1 Chla, µg l-1
H/G G/M H/G G/M H/G G/M G/M
Streams and rivers:*
altitude 200–500 m 0.035 0.05 0.02 0.035 1.7 3.2 –
altitude 500–800 m 0.025 0.045 0.015 0.03 1.2 2.3 –
above 800 m altitude 0.02 0.03 0.01 0.02 0.8 1 –
Reservoirs:†
Lipno – 0.015 – – – 2.3 3
Římov – 0.03 – – – 3.2 10
Hněvkovice – 0.04 – – – 3.2 20
Orlík upper / dam part – 0.04 / 0.03 – – – 3.2 10 *, standards in streams and rivers are median values from annual monitoring;†, standards in reservoirs are mean values from seasonal (April–October) monitoring of surface layer at the reservoir dam
A corresponding difference is between the TP standard in the Orlík reservoir (0.03 mg l-1) and current TP concentrations (ca 0.05 mg l-1). Hence, a great challenge for mitigation options is to get below this standard.
2.2. Existing and new data
2.2.1. Existing data
Daily hydrological data at the Orlík, Lipno, and Římov reservoirs (period 1961-2010) and at approximately 30 additional hydrological stations in the catchment (shorter data sets 10 to 25 years long) are from the databases held by the Czech Hydrometeorological Institute and the Vltava River Basin Authority, state enterprise. Hydrological and operational data for the deep reservoirs (volume of stored water, outflow, depths of discharges and withdrawals, etc.) were obtained from operation evidence at the reservoir dams.
7
Daily climate data include air temperature, humidity, wind speed and direction, cloud cover, precipitation from 1961 to 2010 for 8 stations that cover different regions and elevations of the upper Vltava River catchment. These data were obtained from the Czech Hydrometeorological Institute.
Water quality data on nutrients and the basic chemistry of the surface waters (nitrate, ammonium, total P, soluble reactive P, total P, suspended solids, dissolved and particulate organic carbon or chemical oxygen demand, alkalinity, ionic composition) originate from data sets maintained by the Institute of Hydrobiology BC AV CR (BCAS) and of the Czech Republic (CR) State Surface Water Quality Monitoring System. The BCAS data sets include long-term monitoring data at the Římov (1979-2010) and Lipno (1964-1967, 1993-2010) reservoirs. The data sets from the CR monitoring system include 25 stations distributed across the catchment with monthly sampling for 1975-2010. In addition, data from 194 stations for the latest decade (2000-2009) are available from the databases of the Vltava River Basin Authority, state enterprise. Nutrient exports (N, P, Corg) from small (1-8 km2) catchments with homogeneous land use (3 forested, 2 arable land, 2 grassland) have been measured by BCAS within the catchment of Římov reservoir since 2009.
Bulk deposition of nutrients (N, P), acidifying compounds (sulphate), and major ions were used from BCAS monitoring for two distinct parts of the catchment: (i) the mountainous part (3 stations were operated during 1998-2011 for open area and below-canopy deposition of precipitation chemistry) and (ii) the lower part (Slapy reservoir station since 1980, Římov reservoir station 1980-1993).
The land cover, spatially detailed data were determined from the current land cover database of the Czech Republic (ZABAGED, www.cuzk.cz) and the LANDSAT 7 ETM+ satellite images (on the territory of Austria and Germany) for the recent period (2007-2009). Land use (i.e. fertilization rates, farm animals, crop yields) and demographic data (population, sewerages, waste water discharges) for the period 1950-2010 were obtained from annual administration statistical data, held by the Czech Statistical Office, with averaged values at district level, each of approximately 1,500 km2, which is sufficiently detailed for representation of different parts of the catchment.
2.2.2. REFRESH data
Within the REFRESH project, data on the future climate development and deposition rates were collated in collaboration with WP1. Based on the four storylines of socio-economic trends (global-local, economic-sustainable) elaborated under WP1, local interpretations for the Vltava catchment were formulated with considering the ongoing socio-economic studies of WP6.
Climate scenario data for the territory of the Vltava catchment were obtained in collaboration with WP1 from the database of the ENSEMBLES project for three combined global circulation-regional climate models: ECHAM5-KNMI (average sensitivity), HadRM3-HacCM3Q0 (higher sensitivity), and SMHIRCA-BMC (lower sensitivity). The data sets included gridded data over the upper Vltava catchment for air temperature, precipitation, relative humidity, wind speed, and cloud cover from 1961 to 2060. The data from all models were compared with measured data at corresponding existing climate monitoring stations and corrected using the resampling method of Leander and Buishand (2007) for mean and coefficient of variation.
3. Model setup
The model chain system that has been developed for the description of effects of climate variability on hydrology and water quality in the Vltava River catchment consists of two major model compartments, i.e., INCA-N/INCA-P and CE-QUAL-W2 for simulations of the precipitation–runoff

8
process in the catchment and the reservoir hydrodynamics and water quality, respectively, and several auxiliary submodels that couple these two model together and provide data on inflow water quality (DOM, STEMP) and on reservoir hydrological operation (RESMNG) (Figure 1).
Figure 1. The diagram of the INCA–CE-QUAL-W2 model chain system showing major (full-line rectangles) and auxiliary (dash-line rectangles) model compartments and their input and output
variables. Abbrev.: Ta, air temperature; RH, relative humidity; WS, wind speed; WD, wind direction; PO4-P, orthophosphate phosphorus; DPorg, dissolved organic phosphorus; PP, particulate
phosphorus; Tin, water temperature in reservoir inflow; CL, cloudiness; P, precipitation; Q, flow; Qo, outflow; Qwd, withdrawal; Elev, surface level elevation; T, water temperature; DO, dissolved oxygen; DOM, dissolved organic matter; TP, total phosphorus; Chla, chlorophyll-a; N, nitrate and
ammonia nitrogen; Si, silicon; ISS, inorganic suspended solids
The INCA-N (Whitehead et al., 1998) and INCA-P (Wade et al., 2002) have been used as the core models for simulations of flow and nutrient (N, P) export from the catchment. The outputs provided by the INCA model are fed into the two-dimensional, laterally averaged numerical reservoir model CE-QUAL-W2 (v. 3.7; Cole and Wells, 2011) that simulates water temperature, ice cover thickness, dissolved oxygen, biomass of 3 phytoplankton groups, labile and refractory dissolved and particulate organic matter (LDOM, RDOM, LPOM, RPOM), orthophosphate P (PO4-P), NO3-N, and NH4-N. The auxiliary submodels include: (i) The IHACRES model (Croke et al. 2005); (ii) the DOM (=dissolved organic matter) model is an empirical regression model that was developed using monthly or weekly means of DOC, air temperature, and precipitation in the Římov Res. catchment (Hejzlar et al., 2003). The DOC values are then converted to dissolved organic matter (DOM) for the purpose of the CE-QUAL-W2 input data assuming a 40% carbon content in the aquatic DOM (Thurman, 1985). (iii) The STEMP submodel is used to calculate daily water temperature in streams that enter the reservoirs. It uses a harmonic function to mimic the annual temperature cycle and is calibrated to local conditions with daily data on air temperature (Straškraba and Gnauck, 1985). (iv) The RESMNG is a simple water

9
balance model for simulations of the outflow and withdrawal operation at the reservoir dam according to the given operation manual.
The model chain system in the upper Vltava River catchment is spatially organised into 14 subcatchments that are modelled by the INCA models with 4 major reservoirs (Lipno, Římov, Hněvkovice, Orlík) that are simulated by the CE-QUAL-W2 model (Figure 2, Tables 2 and 3).
Figure 2. The upper Vltava River catchment with subcatchments and reservoirs (Lipno, sub. 2; Římov, sub. 4; Hněvkovice, sub. 6; Orlík, sub. 1) used in the INCA/CE-QUAL-W2 model chain system
Table 2. Areas, major land use categories a population density in the Vltava River subcatchments used for in calibration and testing of INCA-N and -P models (C1 to C7) and in INCA scenario modelling (1 to 14)
No. River/stream – Profile
Closing profile Area, km2 Forest, % Farmland, % Fishponds,
% Population,
inh km-2
Geogr. coordinates Altitude,
masl sub. cum. sub. cum. sub. cum. sub. cum. sub. cum.
C1 Forest stream – Klepná 48.702335N, 14.655166E 725 0.6 0.6 99 99 1 1 0 0 0 0
C2 Forest stream – Pohoří 48.608130N, 14.681054E 890 1.5 1.5 100 100 0 0 0 0 0 0
C3 Grassland stream - Benešov n. Č. 48.730204N, 14.599166E 608 1.5 1.5 5 5 95 95 0 0 0 0
C4 Grassland stream – Malonty 48.684456N, 14.556882E 625 0.6 0.6 1 1 94 94 0 0 0 0

10
No. River/stream – Profile
Closing profile Area, km2 Forest, % Farmland, % Fishponds,
% Population,
inh km-2
Geogr. coordinates Altitude,
masl sub. cum. sub. cum. sub. cum. sub. cum. sub. cum.
C5 Arable land stream – Besednice 48.783218N, 14.538078E 565 1.5 1.5 3 3 95 95 0 0 0 0
C6 Arable land stream – Dobechov 48.718661N, 14.525515E 557 0.5 0.5 0 0 100 100 0 0 0 0
C7 Zvíkovský stream – Dlouhá 48.815474N, 14.475292E 487 6.7 6.7 28 28 35 35 0 0 59 59
1 Vltava – Pěkná 48.852148N, 13.92023E 728 480 480 76 76 23 23 0.0 0.0 16 16
2 Vltava - Lipno reservoir dam 48.632854N, 14.237171E 712 472 951 60 68 29 26 0.0 0.0 12 14
3 Malše – Pořešín 48.785508N, 14.516309E 505 437 437 56 56 42 42 0.1 0.1 34 34
4 Malše - Římov reservoir dam 48.850161N, 14.491014E 428 51 487 35 54 57 44 0.0 0.1 21 33
5 Vltava - Hluboká n/Vlt. 49.054009N, 14.445084E 365 1956 3395 40 50 54 44 1.4 0.8 102 67
6 Vltava - VN Hněvkovice 49.181659N, 14.446045E 356 146 3541 59 50 37 44 0.0 0.8 20 65
7 Lužnice - Veselí n/Luž. 49.189748N, 14.702653E 405 1714 1714 49 49 43 43 3.0 3.0 36 36
8 Lužnice – Klenovice 49.280918N, 14.700317E 396 1002 2716 36 44 58 49 2.2 2.7 57 44
9 Lužnice – Koloděje 49.252397N, 14.419997E 352 1517 4233 30 39 65 54 0.6 1.9 75 55
10 Otava – Katovice 49.270252N, 13.831484E 397 1235 1235 51 51 46 46 0.2 0.2 34 34
11 Otava – Topělec 49.350139N, 14.144738E 352 1715 2950 37 43 59 53 0.8 0.6 76 59
12 Lomnice - Dolní Ostrovec 49.419358N, 14.116752E 375 453 453 34 34 60 60 2.5 2.5 39 39
13 Skalice – Varvažov 49.440258N, 14.127419E 382 375 375 27 27 69 69 0.6 0.6 49 49
14 Vltava - Orlík reservoir dam 49.606330N, 14.181400E 268 565 12117 45 43 48 51 0.3 1.2 36 57
Table 3. Characteristics of major modelled reservoir in the upper Vltava River basin
Sub. No.
Reservoir Catchment area, km
2
Surafce elevation,
masl
Area, km
2
Volume, mil. m
3
Mean / Max. depth, m
Purposes*
2 Lipno 952 726 48.7 310 6.4 / 19 H, A,C, N, R, S, F
4 Římov 488 471 2.1 34 16 / 43 S, A, C, H
6 Hněvkovice 3542 371 2.8 21 7.5 / 18 H, A, N, R, F
14 Orlík 12,116 354 27.3 717 26 / 68 H, A, C, N, R, F
*H, hydropower; A, river flow augmentation; C, flood control; N, navigation; R, recreation; S, water supply; F, recreation and sport fishing
3.1. Model calibration and testing
3.1.1. Calibration
The INCA-N and INCA-P models have been calibrated using a concept of nested subcatchments including small size (0.5–2 km2) catchments with homogeneous land use (2 arable land, 3 forest, 2 grassland, and 2 fishpond), medium size (7–10 km2) catchments with mixed land use (2), and the full size (51–1,956 km2) catchments. The calibration has been done manually while the parameter values for the same land use categories at different levels of catchment size were kept as comparable as possible.
The CE-QUAL-W2 model has been calibrated for each reservoir modelled reservoir manually. The reservoir hydrodynamics was calibrated against vertical profiles of water temperature with 2- to 10-

11
year (according to availability) datasets of summer stratification periods. The dynamics of chemical and biological changes in the reservoir were set for measured concentrations of dissolved oxygen (DO), dissolved reactive phosphorus (PO4-P), total phosphorus (TP), and chlorophyll-a (Chla) in the surface layer (PO4-P, TP, Chla) or in the hypolimnion (DO).
3.1.2. Testing
The calibration has been always accompanied by a validation that was organised with independent sets of data in another time period. For calibration and test runs where there were observations and model predictions, the following model performance criteria were evaluated: bias (B), bias normalised by the standard deviation of the observations (B*), root mean square difference (RMSD’), RMSD’ normalised by dividing by the standard deviation of the observations and with a sign given by multiplying by the sign of the standard deviation difference (Joliff et al., 2008; Los and Blaas, 2010), Nash-Sutcliffe model performance coefficient (Nash and Sutcliffe, 1970) calculated with original (ENS) and logarithmic (log(ENS)) data (Jain and Sudheer, 2008), and coefficient of determination (r2).
3.2. Sensitivity analysis
The global sensitivity analysis for the parameters of the multi-variable models used in simulations of the Vltava catchment was done according to van Griensven et al. (2006) using a sampling strategy that combines the latin-hypercube method and one-factor-at-a-time sampling. First, for each parameter a range of minimum to maximum values was determined based on previous experience and common ranges used in literature. This range was divided into 5 segments and 4 randomly sampled values were selected in each segment. The results of model runs were evaluated by calculation of the partial effect Si for the change i in each parameter e (Eq. 1):
Si =|(Mi - M)/((Mi + M)/2)/((ei – e)/((ei + e)/2)| (Eq. 1)
where Mi is the modelled variable with changed parameter value ei from the calibrated parameter value e and M is the modelled variable with calibrated parameter e. A final effect S was then calculated by averaging these partial effects for all values in 5 segments. The final effects were ranked with the largest effect being given rank 1 and the smallest effect being given a rank equal to the total number of parameters. If a parameter had no effect on the model prediction of a particular variable, then it was given a rank equal to the number of parameters. This global sensitivity analysis was performed on a selected one-year period run of the CE-QUAL-W2 model at one reservoir (Sub. No. 4 Římov reservoir) and for the INCA-N and INCA-P models at one subcatchment (Sub. No. 12 Lomnice).
3.3. Uncertainty analysis
The uncertainty analysis included testing of (i) effect of feasible selections of parameter values, (ii) effect of input data uncertainty on the variability of simulated results, and evaluation of structural uncertainty.
The effect of uncertainty of model parameterisation was evaluated by running the calibrated INCA and CE-QUAL-W2 models with various combinations of parameter values for parameters that showed the highest sensitivities on the modelling results in the previous sensitivity analysis. These parameters included for INCA-P: (i) Equilibrium phosphorus concentration in soil, (ii) Direct runoff residence time, (iii) Soil water residence time, (iv) Ratio of total to available water in soil, (v) Erosion scaling factor a1, (vi) Erosion scaling factor a4, (vii) Erosion nonlinear coefficient a6, and (viii) Flow b coefficient; for INCA-N: (i) Maximum nitrogen uptake, (ii) Mineralisation rate, (iii) Response to a 10 °C

12
soil temperature change for each process, (iv) Flow a coefficient, (v) Denitrification, (vi) Nitrification;
and for CE-QUAL-W2: (i) PO4R (Sediment release rate of phosphorus), (iiiii) ALGP1, ALGP2
(Stoichiometric equivalent between biomass and phosphorus in algae groups 1 and 2), (ivv) AG1, AG2 (Maximum algal growth rate for algae groups 1 and 2). Three values for each of these parameters were selected from the range that occurred in calibrations in all modelled subcatchments or reservoirs in the Vltava catchment, namely the 10th percentile, median, and 90th percentile values. Then, the models were run with all possible combinations of these parameter values, namely 38=6561, 36=729 and 35=243 combinations for INCA-P, INCA-N and CE-QUAL-W2, respectively. The resulting model runs were sorted according to the value of Nash-Sutcliffe model performance coefficient (ENS) and the runs with ENS equal or larger than that obtained in the calibration were considered behavioural with valid combinations of parameter values. The minimum and maximum simulated daily values of all behavioural runs delineated a band of uncertainty due to ambiguity of parameterisation. These tests were done for selected 3-year periods with the INCA models at the Lomnice subcatchment and with the CE-QUAL-W2 model at the Orlík reservoir. The sets of parameters from the behavioural runs were then used to re-run the models for the whole Vltava
catchment during 19812010.
The behavioural runs from the parameter uncertainty testing that had the minimum and/or maximum values of the uncertainty band were selected for the analysis of the effect of input data uncertainty. All these runs were re-run with the most important input variables increased and decreased within their expertly estimated confidence intervals. These input variables included for INCA-P: HER (±10%), inputs of phosphorus by wastewaters (±18%) and fishpond fisheries (±18%); for INCA-N: HER (±10%), inputs of nitrogen to the catchment by NH4
+ and NO3- fertilisers (±15%),
atmospheric deposition (±12%), wastewaters (±18%) and (±18%); and for CE-QUAL-W2: PO4-P, TP, NO3
-, and NH4+ (±respective values that were derived from the resulting INCA input-data uncertainty
analysis runs). The widening of the parameter uncertainty band in these runs was considered to reflect the additional variability due to uncertainty of the input data.
3.4. Scenario analysis
3.4.1. Climate
Forecasts of climate in the Vltava catchment by three regional climate models with different sensitivities to CO2 emissions, i.e. ECHAM5-KNMI (average sensitivity), HadRM3-HacCM3Q0 (higher sensitivity), and SMHIRCA-BMC (lower sensitivity) indicate following changes for the middle of the 21st century (2031–2060) in comparison with the current (1981–2010) conditions: (i) An increase in mean air temperature by 1–2.2 °C will occur in all parts of the catchment (Figure 3a). (ii) The growing season (i.e., period with mean daily temperature above 5 °C) will be prolonged by approximately 2 to 3 weeks. (iii) Only small changes in total annual precipitation amounts are forecasted (Fig. 3b) but summers will be drier and warmer (a decrease in July–August precipitations by approximately 5% and an increase in July-August temperature by approximately 2 °C), whereas springs will have similar temperatures but will be wetter (an increase in April–June precipitation by approximately 5%).
The above-described changes of climate will influence conditions for agriculture and fish farming. Longer growing season and higher temperatures will improve cultivation of more thermophilic crops (e.g., better growth of wheat and maize; possible use of more vegetable types). Potential fishpond production of carp will also increase (by prolongation of periods with water temperature above the limit of fish growth).

13
3.4.2. Nitrogen deposition
Trends in the nitrogen deposition over the Vltava River catchment are shown in Figures 4 and 5. A large peak in nitrogen deposition occurred during the1970s-1990s, while much lower and steady or only slightly increasing deposition is the forecasted 2031-2060 period.
Figure 3. Mean annual temperature (a) and precipitation (b) in the Vltava catchment for the baseline (1981-2010) and scenario (2031-2060) periods for three global-regional climate model
combinations: ECHAM5-KNMI (KNMI), HadRM3P-HadCM3Q0 (HC), and SMHIRCA-BCM (HC).
Figure 4. Comparison of mean total nitrogen deposition in the Orlík catchment of the Vltava basin in the reference (1981-2010) and scenario (2031-2060) periods from the EMEP data
0
2
4
6
8
10
12
KNMI SHMI HC all models
T, °
C
Vltava
1981-2010
2031-2060
(a)
0
100
200
300
400
500
600
700
800
900
KNMI SHMI HC all models
P, m
m/a
1981-2010
2031-2060
(b)

14
Figure 5. Trends in the deposition of ammonium (left) and nitrate (right) nitrogen in the Orlík catchment according to the EMEP model for emission scenarios S1-S3 (data WP1)
3.4.3. Land use, demography and socio-economic conditions
Future development in the area of the Orlík reservoir catchment can follow different directions, accordingly to the trends in the society. The REFRESH project has assumed 4 socio-economic scenarios (Deliverable 1.07): A1 - World Markets (WM): market oriented approach to the provision of goods and services, with increasing globalisation and large corporations; A2 - National Enterprise (NE): market-oriented approach, but with a regional or national focus and great diversity; B1 - Global Sustainability (GS): sustainable approach to the provision of goods and services, with strong global institutions; B2 - Local Services (LS): community-oriented to the provision of goods and services, with no global overview and dominance of local approaches.
These scenarios are expected to be superimposed on the background of long-term socio-economic trends in the structure of landscape and land use. For example, in the Orlík reservoir catchment during the last 50 years the number of inhabitants increased by 7%, forest and urbanised areas increased by 11 and 13%, respectively, at the expense of agricultural area that decreased by 7%. Particular scenarios suppose continuation of these trends (Fig. 6, 7), however, with a rather different intensities and impacts to the environmental, water quality and ecological state of aquatic ecosystems.
A1 scenario (WM): (i) Agricultural land will be used in areas with good soil quality only, but with higher intensities; less productive and uneasily manageable agricultural areas will be abandoned and spontaneously change to forest. Hence, an increase by 10% in forest areas off the agricultural areas is supposed in 2060. (ii) Fertiliser applications will increase from the current approximate applications of 70 and 5 kg/ha of N and P, respectively, to the level of maximum agricultural intensities in the country in the 1980s (i.e., to 100 and 15 kg/ha of N and P, respectively), livestock breeding will increase (from the current value of 0.6 to approximately 1.1 LU per hectare of agricultural land) (LU = livestock unit of 500 kg alive weight, i.e., 1 cattle, 5 pig, 250 hen, 10 sheep). (iii) Mean fish production intensity in fishpond fisheries will increase to approximately 700 kg/ha in comparison with the current 500 kg/ha. (iv) These changes will cause a marked increase in P and N concentrations in the runoff from agricultural areas and fishponds.

15
(v) Municipal sewerage and wastewater treatment will improve and will gradually reach the standard of western European countries; i.e. wastewater treatment plants will be built also at small settlements and nutrient discharges will decrease by approximately 50% compared to the current situation. Hence, the input of P by wastewaters into the river network in the Orlík catchment will decrease in a twenty-year period from the current value of 150 to 75 t/a. (vi) The combination of these trends in diffuse and point sources will mostly compensate, hence leaving water quality and eutrophication of the Orlík reservoir approximately at the contemporary level.
A2 scenario A2 (NE): (i) State interventions and subsidies for agriculture will keep agricultural land resources in a similar state as today; areas of forests and farmland will increase and decrease according to the long-term trend of the last 50 years, i.e. by approximately +3% and -3%, respectively. (ii) The use of fertilisers, fishpond production, wastewaters discharges, and the eutrophication of the Orlík reservoir will be similar as in the previous scenario A1.
B1 scenario (GS): (i) A lower proportion of agricultural areas will be used as tilled fields and the rest will be changed to grassland or meadows; part of less fertile agricultural areas will be used for production of energetic woody species; the forest areas will increase by 3% off the agricultural areas. (ii) The tree structure of forests with the current predominance of Norway spruce and conifers will change and the proportion of deciduous trees will increase from the current 15% to approximately 40% (with consequences for the atmospheric deposition of pollutants into the catchment, which decrease in winter and early spring due to less horizontal precipitations).
Figure 6. Trends in the development of (a) land use, (b) phosphorus export in surface waters from municipal wastewaters, (c) N and P fertiliser application rates and (d) livestock density in the Orlík
catchment supposed in the REFRESH scenarios A1, A2, B1 and B2
(iii) Productive agricultural areas will be used extensively with fertilisation intensities similar to the current level or even lesser; pastures will be used extensively with the current livestock density (i.e.,
0%
10%
20%
30%
40%
50%
60%
1960 1985 2010 2035 2060
Part
of
catc
hm
ent
are
a
(a) A1 A2,B2 B1
Total farmland
Arable land
Grassland
0.0
0.1
0.2
0.3
0.4
0.5
0.6
1960 1985 2010 2035 2060P-e
xpo
rt w
aste
wat
ers
, kg
/c/a
(b) A1 A2,B2 B1
0
20
40
60
80
100
120
1960 1985 2010 2035 2060
Fert
ilise
rs, k
g/h
a
(c) A1 A2,B2 B1
Nitrogen
Phosphorus
0.0
0.2
0.4
0.6
0.8
1.0
1.2
1960 1985 2010 2035 2060
Live
sto
ck, L
U/h
a
(d) A1 A2,B2 B1

16
on average 0.6 LU per hectare of agricultural land). (iv) Fishponds will be used extensively, without fertilisation and fish feeding, i.e. with production based on natural productivity; hence, fishponds will relatively efficiently retain phosphorus. (v) Municipal wastewaters will be treated with respect to maximising phosphorus removal; export of P into streams in the catchment will decrease to approximately 30% of the current state. (vi) Water quality in streams through the whole catchment will markedly improve and the problems with eutrophication of the Orlík reservoir will cease.
B2 scenario (LS): Very similar to the A2 scenario.
3.4.4. Scenarios with mitigation measures against eutrophication of the Orlík reservoir
In the economic analysis done within the REFRESH WP6 tasks, mitigation measures were suggested to decrease phosphorus export from the catchment to the Orlík reservoir with the aim of abating eutrophication of this water body and complying with the EU Water Framework Directive (WFD) targets. These mitigation measures included mainly (i) improved municipal wastewater treatment and increasing the phosphorus removal to 90% efficiency of treatment plants, (ii) changing fishpond fishery practices to achieve zero phosphorus surplus in balance between the inputs by fish fodder and manure and the output in the produced fish, (iii) decrease in phosphorus losses from agriculture by grassing 20-m strips along water courses and lakes and steep slopes (>7°) to prevent erosion phosphorus input.
3.4.5. Water-use scenarios
Water use in the Orlík reservoir catchment includes mainly withdrawals for drinking water production, industry, and power and heat stations. These withdrawals are relatively small and represent less than 3% of the mean total water runoff from the catchment. Most of this withdrawn water is returned back to the river network as wastewaters, except for the evaporative losses of cooling waters used by power and heat stations (less than one third of the withdrawn volume). Any significant demands for irrigation by agriculture occur in this catchment and neither are expected for the future. Hence, no water-use scenarios were designed and simulated.
3.4.6. Scenario runs
The model system of the Orlík reservoir catchment was run for several scenarios to separate the effects of climate change and different land use on catchment hydrology, water quality and ecological conditions. A summary of the scenarios is given in Table 4.
Table 4. Scenario runs for the Vltava catchment
No. Code Period Land use conditions Climate
1 1981-2010 1981-2010 real trend 1981-2010 real 1981-2010
2 0 1981-2010 mean 2006-2010 real 1981-2010
3 00K 1981-2010 mean 2006-2010 KNMI 1981-2010
4 00S 1981-2010 mean 2006-2010 SHMI 1981-2010
5 00H 1981-2010 mean 2006-2010 HC 1981-2010
6 05K 2031-2060 mean 2006-2010 KNMI 2031-2060
7 05S 2031-2060 mean 2006-2010 SHMI 2031-2060
8 05H 2031-2060 mean 2006-2010 HC 2031-2060
9 15K 2031-2060 A1 KNMI 2031-2060
10 25K 2031-2060 A2/B2 KNMI 2031-2060

17
No. Code Period Land use conditions Climate
11 35K 2031-2060 B1 KNMI 2031-2060
12 15H(w) 2031-2060 A1 HC 2031-2060
13 35K(b) 2031-2060 B1 KNMI 2031-2060
14 M0 1981-2010 M real 1981-2010
15 M5H(w) 2031-2060 M HC 2031-2060
16 M5K(b) 2031-2060 M KNMI 2031-2060
4. Results
The progress in the biophysical modelling of the Vltava River demonstration catchment is documented in Table 5.
Table 5. The application of the REFRESH Common Modelling Framework at the Vltava catchment demonstration site
Task Description Date completed
1 Model setup
1.1 Model input data collated June 2012
1.2 Model geometry defined June 2012
1.3 Observations for testing collated July 2012
2 Calibration
2.1 Manual calibration July 2013
2.2 Auto-calibration1 not planned
2.3 Inverse modelling1 not planned
3 Testing
3.1 Split sample test done November 2012
3.2 Calibration and test performance assessed objectively July 2013
4 Sensitivity and robustness testing
4.1 Sensitivity analysis2 October 2013
4.2 Robustness analysis October 2013
5 Uncertainty analysis October 2013
6 Scenario analysis
6.1 ECHAM5-KNMI climate scenario August 2013
6.2 ECHAM5-KNMI climate plus four land cover/N deposition/water use scenarios
August 2013
6.3 HadRM3-HadCM3Q0 climate scenario September 2013
6.4 HadRM3-HadCM3Q0 climate plus four land cover/N deposition/water use scenarios
September 2013
6.5 SMHIRCA-BCM climate scenario September 2013
6.6 SMHIRCA-BCM climate plus four land cover/N deposition/water use scenarios
September 2013
1Manual calibration is the minimum requirement;
2A sensitivity analysis is not required for INCA-N as this has been done
before

18
4.1. Model calibration and testing
4.1.1. INCA models
The INCA-P and INCA-N models were calibrated in the Vltava catchment at first for a series of small (0.5 to 1.5 km2) subcatchments with homogeneous land use (forest, grassland, arable land) and one medium size (6.7 km2) subcatchment with mixed land use and wastewater discharges and then, based on this experience, at each of the relatively large (51 to 1,715 km2) subcatchments of the Orlík catchment. The calibration of the small subcatchments was done with 2- or 3-year periods of available measured data (mostly from 2008 to 2010) while the the Orlík reservoir subcatchment system was calibrated with a 10-year period from 1/1/1991 to 31/12/2000. This period was selected for calibration because large changes occurred in the Czech Republic during this decade, for example in loading of surface waters with wastewaters, fertilisation rates in agriculture, and atmospheric deposition of nitrogen, which was useful for examining the responses of the INCA models to changes in inputs. The next decade (from 1/1/2001 to 31/12/2010) was consequently used for the independent validation of models. The calibration and validation results for all small subcatchments and for selected major subcatchments of the Orlík reservoir catchment are listed in Table 6 and in Annex (pages 1 to 30).
Table 6. The coefficients of determination (r2) between measured and modelled flow, TP, PO4-P, and NO3-N data in calibration (cal.) and validation (val.) data periods for the monitored subcatchments of the Vltava catchment
Subcatchment number
Q TP PO4-P NO3-N
cal. val. cal. val. cal. val. cal. val.
C1 0.50 n.a. 0.02 n.a. 0.17 n.a. 0.34 n.a.
C2 0.59 n.a. 0.44 n.a. 0.13 n.a. 0.11 n.a.
C3 0.53 n.a. 0.05 n.a. 0.33 n.a. 0.01 n.a.
C4 0.58 n.a. 0.15 n.a. 0.33 n.a. 0.15 n.a.
C5 0.57 n.a. 0.38 n.a. 0.43 n.a. 0.26 n.a.
C6 0.56 n.a. 0.12 n.a. 0.12 n.a. 0.26 n.a.
C7 0.56 n.a. 0.12 n.a. 0.12 n.a. 0.26 n.a.
1 0.58 0.55 0.08 0.05 0.02 0 0.07 0.01
3 0.51 0.54 0.14 0.07 0.18 0.2 0.00 0.02
5 0.42 0.55 0.25 0.27 0.36 0.16 0.07 0.19
9 0.61 0.59 0.15 0.12 0.26 0.16 0.37 0.39
11 0.53 0.67 0.28 0.08 0.32 0.34 0.15 0.12
12 0.36 0.38 0.34 0.23 0.28 0.22 0.28 0.17
13 0.27 0.4 0.33 0.17 0.39 0.22 0.15 0.16
14 0.7 0.72 0.29 0.01 0.38 0.17 0.14 0.24
The flow regime of the subcatchments was simulated identically by INCA-N and INCA-P. The comparability between modelled and measured flow data was reasonable with r2 above 0.5 at most subcatchments, independently of their size or elevation. Examples of model fits to measured flow are given for two small and two large subcatchments in Figures 7 and 8, indicating that the flow patterns were simulated well, including the timing and magnitude of the high flow conditions after precipitation events and during snow-melt runoff in early spring.

19
Figure 7. INCA calibration results at small subcatchments with homogeneous land use: measured and simulated stream flow and TP, PO4-P, and NO3-N concentrations at Forest stream Klepná (sub.
C1; left column) and Arable-land stream Besednice (sub. C5; right column) from 2008 to 2010
Figure 8. INCA calibration results at large subcatchments: measured and simulated river flow and TP, PO4-P, and NO3-N concentrations at Vltava Hluboká n/Vlt. (sub. 5; left column) and total
composed inflow in the Orlík reservoir (sub. 14; right column) from 1991 to 2000
0.001
0.010
0.100
1.1.2008 1.1.2009 2.1.2010
Q, m
3/s
measured modelSubcatchment C1: Forest Stream - Klepná
0.00
0.01
0.02
0.03
0.04
1.1.2008 1.1.2009 2.1.2010
TP, m
g/l
measured model
0.00
0.01
0.02
0.03
1.1.2008 1.1.2009 2.1.2010
PO
4-P
, mg
/l
measured model
0
0.2
0.4
0.6
0.8
1
1.1.2008 1.1.2009 2.1.2010
NO
3-N
, mg
/l
measured model
0.000
0.001
0.010
0.100
1.1.2008 1.1.2009 2.1.2010
Q, m
3/s
measured modelSubcatchment C5: Arable Land Stream - Besednice
0.00
0.05
0.10
0.15
1.1.2008 1.1.2009 2.1.2010
TP, m
g/l
measured model
0.00
0.01
0.02
0.03
0.04
1.1.2008 1.1.2009 2.1.2010
PO
4-P
, mg
/l
measured
0
2
4
6
8
10
1.1.2008 1.1.2009 2.1.2010N
O3
-N, m
g/l
measured
10
100
1,000
1991 1992 1993 1994 1995 1996 1997 1998 1999 2000
Q, m
3/s
measured modelSubcatchment 14: total input in Orlík Reservoir
0.0
0.2
0.4
0.6
1991 1992 1993 1994 1995 1996 1997 1998 1999 2000
TP, m
g/l
measured model
0.0
0.1
0.2
0.3
1991 1992 1993 1994 1995 1996 1997 1998 1999 2000
PO
4-P
, mg
/l
measured model
0
2
4
6
1991 1992 1993 1994 1995 1996 1997 1998 1999 2000
NO
3-N
, mg
/l
measured model
5
50
500
1991 1992 1993 1994 1995 1996 1997 1998 1999 2000
Q, m
3/s
observed modelSubcatchment 5: Vltava - Hluboká n/Vlt.
0.0
0.1
0.2
0.3
0.4
1991 1992 1993 1994 1995 1996 1997 1998 1999 2000
TP, m
g/l
observed model
0.0
0.1
0.2
0.3
1991 1992 1993 1994 1995 1996 1997 1998 1999 2000
PO
4-P
, mg
/l
observed model
0
2
4
6
1991 1992 1993 1994 1995 1996 1997 1998 1999 2000
NO
3-N
, mg
/l
observed model

20
The TP, PO4-P, and NO3-N concentrations were simulated less successfully in comparison with the flow and the explained variability did not exceed 50% in any of the calibration runs (r2 < 0.44). An apparent reason was rather imprecise matching of seasonal patterns and short temporal fluctuations by the INCA models. However, the average simulated and measured concentrations were well comparable for the whole range of concentrations in different subcatchments (Figure 9) indicating that processes and responses of the INCA models on inputs were reasonably correct.
The results of validation runs at the subcatchments of the Orlík reservoir catchment in the period from 1/1/2001 to 31/12/2010 showed a comparable agreement of the modelled and measure data as in the calibration (Table 6, Figure 9).
Fig. 9. Relationships between average measured and INCA simulated values of flow, TP, PO4-P and NO3-N at subcatchments used in calibration and validation runs
4.1.2. CE-QUAL-W2
The CE-QUAL-W2 model was calibrated separately for each of the reservoirs modelled. First, the reservoir hydrodynamics were calibrated against vertical profiles of water temperature that were measured in the deepest points of reservoirs near the dam. The simulations of chemical and biological changes in the reservoirs were compared with the measured vertical profiles of DO and
concentrations of TP, PO4-P, and chlorophyll-a (Chla) in the surface (01 m) layer at the dam. The calibration was always done with one part of available data and the other part was left for the independent validation of the calibrated models. The calibration and validation results for all reservoirs are presented in Table 6 and in the Annex (pages 31 to 38).
Seasonal patterns of thermal stratification were reproduced well by the CE-QUAL-W2 for all four reservoirs with typical values of the coefficient of determination (r2) > 0.9 in the surface layer and 0.71–0.92 in the hypolimnion (Table 7, Figure 10).
R² = 0.99 R² = 1.00
0
15
30
45
0 15 30 45
Q m
od
el, m
3/s
Q measured, m3/s
calibrationvalidation
R² = 0.96
R² = 0.98
0
0.1
0.2
0.3
0.0 0.1 0.2 0.3
TP m
od
el, m
g/l
TP measured, mg/l
calibration
validation
R² = 0.96R² = 0.94
0
0.1
0.2
0.0 0.1 0.2
PO
4-P
mo
del
, mg
/l
PO4-P measured, mg/l
calibrationvalidation
R² = 0.85
R² = 0.92
0
2
4
6
0 2 4 6
NO
3-N
mo
del
, mg
/l
NO3-N measured, mg/l
calibrationvalidation

21
Table 7. The coefficients of determination (r2) between measured and modelled surface (Tw-surf) and hypolimnion (Tw-hypo) water temperature, dissolved oxygen concentration in hypolimnion (DOhypo)
and TP, PO4-P, and chlorophyll-a (Chla) concentrations in the surface layer (01 m) at the dam of the modelled reservoirs in the calibration (cal.) and validation (val.) data periods
Reservoir Tw-surf Tw-hypo DOhypo TP PO4-P Chla
cal. val. cal. val. cal. val. cal. val. cal. val. cal. val.
Lipno 0.92 0.92 0.88 0.77 0.72 0.51 0.24 0.02 0.11 0.03 0.19 0.10
Římov 0.98 0.96 0.54 0.44 0.60 0.63 0.32 0.25 0.73 0.57 0.21 0.12
Hněvkovice 0.97 0.88 0.95 0.87 0.78 0.59 0.08 0.07 0.08 0.01 0.09 0.02
Orlík 0.91 0.71 0.95 0.93 0.69 0.60 0.41 0.60 0.52 0.53 0.04 0.29
Figure 10. CE-QUAL-W2 calibration results at selected reservoirs: measured and simulated water surface (Tw-surf) and hypolimnion (Tw-hypo) temperature, dissolved oxygen in the hypolimion (DOhypo) and surface concentrations of TP, PO4-P, and chlorophyll a (Chla) in the Římov reservoir from 1991 to 1995 (sub. 4; left column) and the Orlík reservoir (sub. 14; right column) from 1990 to 1994
Also the simulated concentrations of DO in the hypolimnion fitted reasonably well to the measured data (r2 > 0.6). These results demonstrate that the overall rates of reservoir metabolism consisting of biomass and organic matter production, sedimentation and respiration were captured correctly in all reservoirs.
0
10
20
30
1/1/1991 1/1/1992 1/1/1993 1/1/1994 2/1/1995
T w-s
urf, °
C
measured model
Římov Reservoir
0.00
0.02
0.04
0.06
1/1/1991 1/1/1992 1/1/1993 1/1/1994 2/1/1995
PO
4-P
, mg
/l
measured model
0
25
50
75
1/1/1991 1/1/1992 1/1/1993 1/1/1994 2/1/1995
Ch
la, µ
g/l
measured model
0
5
10
15
1/1/1991 1/1/1992 1/1/1993 1/1/1994 2/1/1995
T w-h
ypo, °
C measured model
0
6
12
18
1/1/1991 1/1/1992 1/1/1993 1/1/1994 2/1/1995
DO
hyp
o, m
g/l measured model
0.00
0.05
0.10
1/1/1991 1/1/1992 1/1/1993 1/1/1994 2/1/1995
TP, m
g/l
measured model
0
10
20
30
1/1/1990 1/1/1991 2/1/1992 1/1/1993 2/1/1994
T w-s
urf, °
C
measured modelOrlík Reservoir
0.00
0.05
0.10
0.15
1/1/1990 1/1/1991 2/1/1992 1/1/1993 2/1/1994
PO
4-P
, mg
/l
measured model
0
35
70
105
1/1/1990 1/1/1991 2/1/1992 1/1/1993 2/1/1994
Ch
la, µ
g/l
measured model
0
8
16
24
1/1/1990 1/1/1991 2/1/1992 1/1/1993 2/1/1994
T w-h
ypo, °
C measured model
0
6
12
18
1/1/1990 1/1/1991 2/1/1992 1/1/1993 2/1/1994
DO
hyp
o, m
g/l measured model
0.00
0.10
0.20
1/1/1990 1/1/1991 2/1/1992 1/1/1993 2/1/1994
TP, m
g/l
measured model

22
The phosphorus concentrations (both TP and PO4-P) were more or less successfully calibrated only in the Římov and Orlík reservoirs, where the seasonal patterns showed marked variability with decreased values during the growing period due to phosphorus uptake by phytoplankton and sedimentation processes. The agreement between the calibrated and measured data was poor (r2 < 0.24) at the Lipno and Hněvkovice reservoirs, apparently due to the small seasonal variability in P concentrations in these reservoirs, which results from their relatively small depths and unstable stratification, in contrast to the deep and seasonally strongly stratified Římov and Orlík reservoirs. The averages of simulated and measured concentrations were comparable for the range of concentrations in different reservoirs (Figure 11) indicating that the response of the CE-QUAL-W2 model on different inputs were correct.
The CE-QUAL-W2 simulated chlorophyll-a concentrations agreed well with the general seasonal patterns of spring and summer-to-autumn maxima and winter minimum in all reservoirs. However, the seasonal oscillations of phytoplankton growth were not well captured in any reservoir and the values of r2 did not exceed 0.2.
The validation runs of the CE-QUAL-W2 reservoirs models showed a similar modelling efficiency as the calibration runs (Table 6, Figure 11), indicating consistency and a relative reliability of the models.
Figure 11. Relationships between average measured and CE-QUAL-W2 simulated values of of
hypolimnion concentration of DO and surface concentrations of TP, PO4-P, and chlorophyll-a in the Lipno, Římov, Hněvkovice, and Orlík reservoirs in the calibration and validation runs
4.2. Sensitivity analysis
The results of global sensitivity analysis of the INCA and CE-QUAL-W2 model parameters are given in Annex, Tables A20 to A23.
The sensitivity analysis of the INCA-N parameters was tested for flow and concentrations of NO3-N and NH4-N (Table A20). The results, related to streamwater NO3-N and NH4-N concentrations, showed a considerable sensitivity to changes in hydrology parameters, such as the ‘a’ parameter which controls the flow velocity in a river reach, and the ‘soil water residence time’. This result confirms those found in other studies (Rankinen et al. 2002, Futter et al. 2009, Jin et al. 2012). It is apparent that hydrology and soil process parameters for nitrogen cycling have to be calibrated together.
R² = 0.88
R² = 0.83
1
4
7
10
1 4 7 10
DO
hyp
om
od
el, m
g/l
DOhypo measured, mg/l
calibrationvalidation
R² = 1.00
R² = 0.94
0.00
0.03
0.06
0.09
0.00 0.03 0.06 0.09
TP m
od
el, m
g/l
TP measured, mg/l
calibration
validation
R² = 0.93
R² = 0.51
0.00
0.02
0.04
0.06
0.00 0.02 0.04 0.06
PO
4-P
mo
del
, mg
/l
PO4-P measured, mg/l
calibrationvalidation
R² = 0.28R² = 0.57
0
10
20
30
40
0 10 20 30 40
Ch
lam
od
el, μ
g/l
Chla measured, μg/l
calibrationvalidation
23
The INCA-P sensitivity analysis (Table A21) showed even higher relative sensitivity effects (S) in PP, TP, and TDP concentrations for parameters related to hydrology (and erosion) than were the sensitivity effects in NO3-N and NH4-N concentrations for hydrology parameters in the case of the INCA-N model. TDP was in addition very sensitive to the parameters of ´Soil P equilibrium concentrations´ and ´Plant P uptake´.
The CE-QUAL-W2 model of the Vltava catchment reservoirs is composed of many interconnected processes covering hydrodynamics, nutrient controlled algae growth temperature, light limitation, biomass sedimentation and decay, biotic adsorption to and release of PO4-P from particles. The results of the global sensitivity test demonstrated that the sensitivity effects were spread among many parameters but with the major importance on those parameters related to algae growth and mortality, nutrient uptake, sedimentation, and the partition coefficient of PO4-P on particles (Tables A22 and A23). The effect of these parameters was manifested in the responses of many simulated variables, including the lake water chlorophyll-a and phosphorus concentrations, dissolved oxygen regime, and temperature stratification.
4.3. Uncertainty analysis
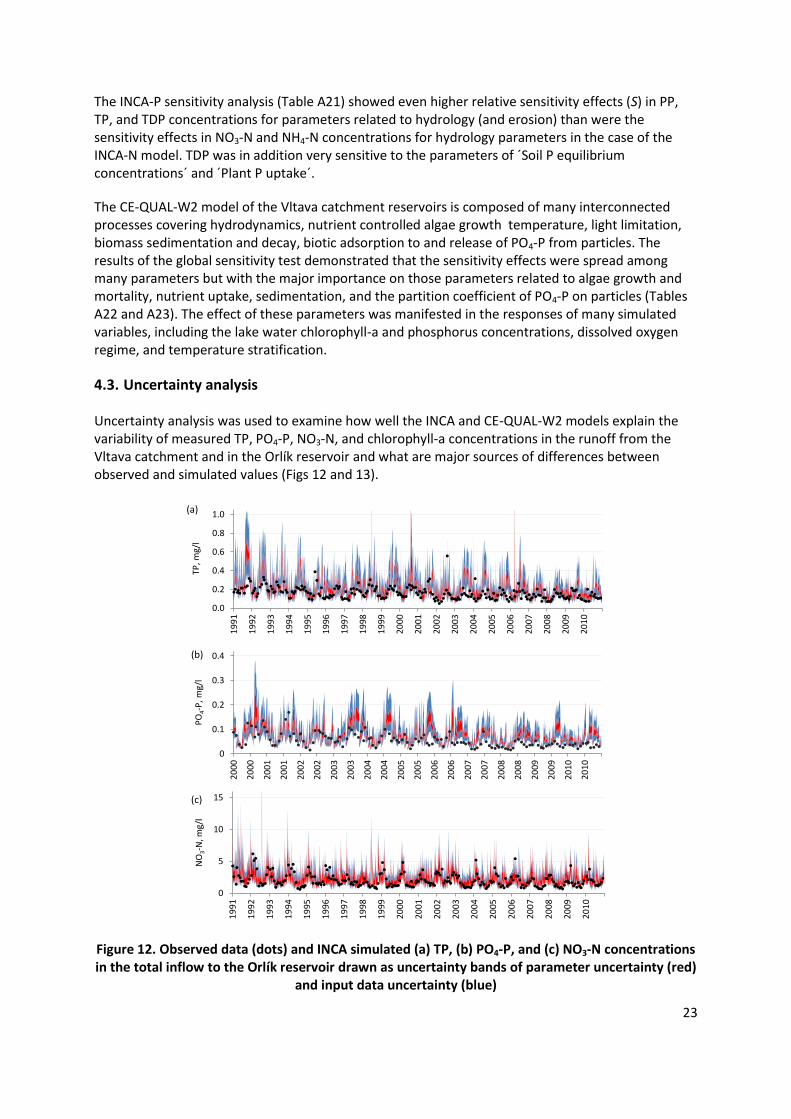
Uncertainty analysis was used to examine how well the INCA and CE-QUAL-W2 models explain the variability of measured TP, PO4-P, NO3-N, and chlorophyll-a concentrations in the runoff from the Vltava catchment and in the Orlík reservoir and what are major sources of differences between observed and simulated values (Figs 12 and 13).
Figure 12. Observed data (dots) and INCA simulated (a) TP, (b) PO4-P, and (c) NO3-N concentrations in the total inflow to the Orlík reservoir drawn as uncertainty bands of parameter uncertainty (red)
and input data uncertainty (blue)
0.0
0.2
0.4
0.6
0.8
1.0
19
91
19
92
19
93
19
94
19
95
19
96
19
97
19
98
19
99
20
00
20
01
20
02
20
03
20
04
20
05
20
06
20
07
20
08
20
09
20
10
TP, m
g/l
(a)
0
0.1
0.2
0.3
0.4
20
00
20
00
20
01
20
01
20
02
20
02
20
03
20
03
20
04
20
04
20
05
20
05
20
06
20
06
20
07
20
07
20
08
20
08
20
09
20
09
20
10
20
10
PO
4-P
, mg/
l
(b)
0
5
10
15
19
91
19
92
19
93
19
94
19
95
19
96
19
97
19
98
19
99
20
00
20
01
20
02
20
03
20
04
20
05
20
06
20
07
20
08
20
09
20
10
NO
3-N
, mg/
l
(c)

24
Figure 13. Observed data (dots) and CE-QUAL-W2 simulated (a) TP, (b) PO4-P, and (c) chlorophyll-a concentrations in the Orlík reservoir drawn as uncertainty bands of parameter uncertainty (red)
and input data uncertainty (blue)
The runoff from this catchment is dominated by a spring snow-melt peak while low-flow periods occur normally in summer and autumn; however, summers are also typical with irregular occurrence of high flow events after storm precipitations. In general, the observed phosphorus concentrations are low during the spring high-flow peak but increase in summer mainly due less dilution of phosphorus discharges from point sources, erosion and surface runoff events caused by storm precipitations, and export of phosphorus from fishpond fisheries. The observed TP concentrations fell reasonably well between the minimum and maximum uncertainty bounds of the INCA-P model (Fig. 12a). The uncertainty band due to parameter uncertainty was, however, insufficient to cover all the observed data, which indicates that imprecisions and uncertainty of the input data are an important source of bias of the model. The observed PO4-P concentrations fell between the minimum and maximum uncertainty bounds until the middle of the 2000s, but after 2005 the modelled PO4-P uncertainty bounds started to be systematically higher than the observed data (Fig. 12b). The reason for this discrepancy is unclear yet, but possible reasons may include too low in-stream transformation rates from PO4-P to particulate phosphorus within the INCA-P model or incorrect input data from point sources; further work is required to improve the models in this aspect. The nitrate concentrations (Fig. 12c) in the runoff from the Vltava catchment typically show maximum values in winter and spring and minimum values in summer and autumn. The observed nitrate data conform to the uncertainty bounds of INCA-N model.
0
0.05
0.1
0.15
0.2
19
91
19
92
19
93
19
94
19
95
19
96
19
97
19
98
19
99
20
00
20
01
20
02
20
03
20
04
20
05
20
06
20
07
20
08
20
09
20
10
PO
4-P
, mg/
l
(b)
0
0.06
0.12
0.18
0.24
19
91
19
92
19
93
19
94
19
95
19
96
19
97
19
98
19
99
20
00
20
01
20
02
20
03
20
04
20
05
20
06
20
07
20
08
20
09
20
10
TP, m
g/l
(a)
0
30
60
90
120
19
91
19
92
19
93
19
94
19
95
19
96
19
97
19
98
19
99
20
00
20
01
20
02
20
03
20
04
20
05
20
06
20
07
20
08
20
09
20
10
Ch
loro
ph
yll-
a, µ
g/l
(c)

25
The uncertainty of simulated TP and PO4-P concentrations in the Orlík reservoir associated with the CE-QUAL-W2 parameterisation was relatively small when it is compared with the input-data uncertainty that was high (Fig. 13ab), apparently due to the use of wide ranges of INCA simulated variables for the inputs in CE-QUAL-W2. The reason for the narrow range of parameter uncertainty bounds in the CE-QUAL-W2 simulations during the non-vegetation period is obvious, as the selection of parameters used in the uncertainty testing included mostly parameters of algal growth that cannot influence nutrient concentrations when conditions for phytoplankton growth are not favourable. During the vegetation period the minimum and maximum concentration bounds of the parameter uncertainty were relatively wider but yet they were not able to accommodate all observed TP and PO4-P concentration values and the expansion of the uncertainty bounds by the input-data uncertainty was necessary. The observed chlorophyll-a concentrations mostly conformed to the joined band of both uncertainty types.
4.4. Scenario analysis
An overview of scenario runs for water quality in the runoff from the Vltava catchment into the Orlík Reservoir (Annex, Figures A20 and A21) indicates that the pressures from the land use and wastewater management in the catchment are the main environmental drivers, while climate change has lesser but still clearly discernible effects.
4.4.1. Representativeness of model climate data for running the model system
The original climate data generated by the ENSEMBLES climate models in the Vltava catchment that were used in this study (i.e., ECHAM5-KNMI (KNMI), HadRM3-HacCM3Q0 (HC), and SMHIRCA-BMC (SHMI)) were biased in comparison with observations. We rectified this bias using the resampling method of Leander and Buishand (2007) for mean and coefficient of variation and the corrected data apparently well agreed in their means and variation with measurements at corresponding local climate monitoring stations. An example is given in Figure A22 (Annex, p. 47) for a station in the vicinity of the Orlík reservoir that indicates a relatively good agreement between the modelled/rectified and the measured data. The annual means of modelled/rectified temperature, dewpoint temperature, precipitation, and wind differed from the measured values by ± 0.4 °C, 0.6 °C, 1%, and 2%, and the seasonal 4-month means for the same variables fluctuated slightly more by ± 0.5 °C, 0.9 °C, 10%, and 7%, respectively.
However, the residual differences between the modelled/rectified and the real climate data introduced a systematic bias into some modelled variables of the INCA/CE-QUAL-W2 catchment modelling system. Among the INCA modelled variables, mainly the flow was increased (see Figure A23), for example the annual means of the total inflow into the Orlík reservoir were increased by 7% (with SHMI data) to 12% (with HC data) and the summer (June to August) means even by 10% (SHMI) to 26% (HC). The other INCA output variables, namely, the streamwater TP, PO4-P, and NO3-N concentrations, were modelled without this systematic bias and the differences between the runs with modelled/rectified and real climate data only fluctuated around zero (Figure A23). From the CE-QUAL-W2 modelled variables at the Orlík reservoir, surface and hypolimnion temperatures and dissolved oxygen concentrations were modelled without any systematic bias, but phosphorus and chlorophyll-a concentrations were increased in comparison with the simulations with the real observed climate and flow data: the annual means of TP, PO4-P, and chlorophyll-a by 21–32%, 32–51%, and 6–18% and the summer (July to August) means of the same variables by 25–36%, 62–101%, and 6–15% (Figure A24). Hence, these results indicated that evaluations of the effects of climate change must be done between comparable scenario runs that do cannot mix the use real and modelled climate data or modelled climate data between particular climate models.

26
4.4.2. Impacts of climate change and catchment land use in the Orlík reservoir
Climate change
The comparison of simulated climate variables in the locality of the Orlík reservoir between the 1981–2010 and 2031–2060 periods (Annex, Figure A24) indicated: - An increase in annual air temperature in all climate models consistently with their climate sensitivities, i.e., by 1, 1.4 and 2.2 °C with the SHMI, KNMI, and HC models, respectively. The highest increase was in winter (December to February), namely by 2, 1.7 and 2.8 °C, while the lowest increase in spring (March to May), namely, by 1.2, 0.6 and 1.7 °C, with the SHMI, KNMI, and HC models, respectively. - An increase in annual precipitation by 5, 9, and 1% with the SHMI, KNMI, and HC models, respectively; with inconsistent changes of seasonal patterns among the climate models. - Insignificant changes of annual wind speed values, but with moderately increased (by 2 to 4%) winter values in all climate models.
The changes in climate variables between the 1981–2010 and 2031–2060 periods resulted in modifications of the INCA simulated water runoff and water quality as follows (Annex, Figures A26 and A27): - The total inflow into the Orlík reservoir changed relatively little, namely on average by 0, 1, and -9% in the scenarios with the SHMI, KNMI, and HC climate data, respectively. However, the seasonal distribution of flow was markedly modified in all scenarios with increased winter values by 13–19%, decreased values in spring and summer by 2–25%, and large, but inconsistent changes among the models in the autumn, that is, by 19, 45, and -29% with the SHMI, KNMI, and HC climate data, respectively. - A moderate increase in the TP concentrations was predicted for all climate models, namely by 7, 11, and 21% with the SHMI, KNMI, and HC data, respectively. The largest increases were in the summer period (by 18 to 35%), while little or no changes occurred in the other seasons. The increased TP concentrations were mainly associated with low flow situations, indicating a major influence of a lesser dilution of wastewater inputs into the river system. The proportion of PO4-P in TP concentrations increased in the summer period of decreased flow, which also confirms that wastewaters might be the major source of pollution. - A small decrease in the average NO3-N concentrations, i.e., by 7, 1, and 9% in the scenarios with the SHMI, KNMI, and HC climate data, respectively. The decrease was largest in the summer period (by 3 to 15%) while no or only small increases occurred in the winter period (by 0 to 3%).
The changes in the CE-QUAL-W2 simulated hydrology and water quality in the Orlík reservoir between the 1981–2010 and 2031–2060 periods (Annex, Figures A28 and A29) included: - A slightly varied mean stored water volume in the reservoir but more important changes in the
water level fluctuation that increased from a 2-m range in the 19812010 period by 0.5, -0.2, and 3.1 m with the SHMI, KNMI, and HC climate data, respectively. - The increased mean water temperatures in the surface layer by 0.3, 0.8, and 1.4 °C and in the hypolimnion (20-m depth) by 0.1, 0.6, and 0.9 °C in the scenarios with the SHMI, KNMI, and HC climate data, respectively. - A slight decrease in the medians of the hypolimnion DO concentration (by 0.1 to 0.4 mg l-1) with all models indicating a prolonged duration of anoxic conditions in the hypolimnion. - Moderately decreased mean TP (by 3 to 6%), PO4-P (by 3 to 9%), and chlorophyll-a (by 3 to 15%) concentrations resulting apparently from the increase of phosphorus retention in the reservoir.
The comparison of the ranks of the impact of climate change predictions by the SHMI, KNMI, and HC
climate models between 19812010 to 20312060 on hydrology and water quality variables

27
simulated by the INCA and CE-QUAL-W2 models revealed that the greatest effects and the worst water quality was in most cases associated with the HC climate data which included the highest temperature increase and precipitation decrease of all three climate models, while the KNMI climate data lead to on average to the least impact. Hence, the KNMI and HC climate scenarios were considered as representatives of future climate situations with the best and the worst impacts, respectively, on hydrology and water quality in the the Orlík catchment.
Future socio-economic development scenarios
The scenarios with the future alternatives of socio-economic development in the Vltava catchment according to A1 (World Markets), A2/B2 (National Enterprise / Local Stewardship), and B1 (Global Sustainability) scenarios are shown in the Annex (Figures A30 to A33). The INCA and CE-QUAL-W2
simulation runs with the current (20062010) and future (20312060) climate and land use predictions were based on the KNMI climate data except for the worst-case scenario where the HC climate data with the largest effects on hydrology and water quality were employed. The results indicated:
- In comparison with the current (20062010) state, the TP concentrations in the inflow into the Orlík reservoir were deteriorated in the A1 scenarios while improved in the other scenarios. The annual TP concentrations changed by +2, -27, -50 and +4% in the A1, A2/B2, B1 (best case), and A1 (worst case)
scenarios, respectively. Largely increased (by 4049%) TP concentrations were modelled in the summer period for the A1 scenarios. The pattern of PO4-P concentrations among the scenarios was similar with TP. - The pattern of scenario results for the NO3-N concentrations in the inflow into the Orlík reservoir differed from the pattern for phosphorus where A1 scenario was the worst. The worst scenario for NO3-N was A2 (National Enterprise), apparently due to its highest proportion of arable land. The
annual NO3-N concentrations were changed from the current (20062010) state by 13, 29, -21, and 1% in the A1, A2/B2, B1 (best case), and A1 (worst case) scenarios, respectively. - In the Orlík reservoir, the phosphorus concentrations were highest in the A1 and A1(worst case)
scenarios exceeding the current (20062010) state by ca 60%, which is more than the corresponding increase in the inflow. On the other hand, the B1 (best case) scenario showed annual TP and PO4-P concentrations lower by 23 and 33%, which was a markedly smaller decrease than that in the TP and PO4-P concentrations in the inflow. This suggests that the P retention in the reservoir is controlled by a non-linear function on P loading that is apparently influenced also by the changes in the seasonal
hydrological pattern and/or climate variables of the predicted 20312060 period.
- The chlorophyll-a concentration in the Orlík reservoir changed from the current (20062010) state by 4, -6, -18, and -14% in the A1, A2/B2, B1 (best case), and A1 (worst case) scenarios, respectively. - The mean hypolimnion DO concentration was changed by -0.1 and +0.2 mg l-1 in the A1 (worst case) and B1 (best case) scenarios, which indicates a weak response of the reservoir ecosystem to the changed nutrient inputs.
Effect of mitigation measures in current and future climate conditions
For the socio-economic analysis of the mitigation measures, determined in WP6, , a set of mitigation measures against eutrophication of the Orlík reservoir was selected to determine if compliance with the WDF quality standards was achieved. The mitigation measures covered the whole Orlík reservoir catchment area and included: (i) the 90% efficiency of P removal from all municipal and other wastewater discharges, (ii) the change in fishpond fishery practices to zero surplus in phosphorus balance, and (iii) the grassing of arable land at steep (>7°) slopes and at 20-m wide buffer zones along streams and other water bodies. Then we run the INCA/CE-QUAL-W2 model system in 4 scenarios, i.e., without and with these mitigation measures under present climate conditions and with the

28
mitigation measures under future (2031–2060) conditions predicted by two climate models differing in their impacts on hydrology and water quality (Table 8 and Annex, Figures A34-A37).
Table 8. Results of scenario runs for assessment of mitigation measures against eutrophication of the Orlík reservoir to reach compliance with EU Water Framework Directive for the standard TP, PO4-P, and NO3-N concentrations in its total inflow and TP and chlorophyll-a concentrations in the dam part of the reservoir (the inflow concentrations are annual averages and the reservoir concentrations are April to October averages)
Scenario
TPin, mg l-1
PO4-Pin, mg l-1
NO3-Nin, mg l-1
TP, mg l-1
Chla, µg l-1
WFD standards 0.050 0.035 3.2 0.030 10
2 00: current state (2006-2010) 0.149 0.070 1.6 0.048 14
14 M0: after mitigation measures 0.064 0.037 1.2 0.030 9
15 M5H(w): in future climate - worst case 0.070 0.038 1.3 0.030 10
16 M5K(b): in future climate - best case 0.065 0.035 1.5 0.029 10
The summary of scenario runs in Table 8 indicates that it might be difficult to decrease the inflow phosphorus concentrations to the required level by this set of mitigation measures. Despite this the standards for phosphorus and chlorophyll-a concentrations can be met in the reservoir. Under the future climate, the inflow concentrations tend to increase, anyway, the phosphorus and chlorophyll-a concentrations remain near the required standard level, apparently due to increased phosphorus retention in the reservoir in conditions of the prolonged water residence time and higher temperature. The nitrate concentration meets the WFD standard in the current state as well as under the future climate conditions. The seasonal data box-plots and frequency distributions of these scenario runs are in Annex, Figures A34-A37.
5. Conclusions
A comprehensive process-based dynamic model system consisting of the catchment models INCA-N and INCA-P linked to the reservoir model, CE-QUAL-W2 was set up to simulate the upper River Vltava catchment. The purpose was to investigate the effects of changes in land use, wastewater management, and climate on flow, water quality, and the ecology of the major streams and reservoirs in the catchment. The methodology used in this study includes complex interactions linking natural processes of the export of nutrients from the catchment, the socio-economic system of land use, water supply, and water management, and the ecological system of the River Vltava with its cascade of reservoirs and addresses also specific issues of the EU WFD. In the centre of interest of our study is the question, what measures have to be used to decrease phosphorus loading to the river network and combat eutrophication of the Orlík reservoir and if these measures will be sufficient also in the future of changed climate.
The application of INCA/CE-QUAL-W2 modelling system to the upper River Vltava catchment to address a range of scenarios was a complicated, but useful, methodology for assessing possible management options. It was shown that the strategy of high efficiency P removal at WWTPs combined with phosphorus-balanced fish production in the fishponds and reduction of P losses from agricultural areas is required to manage P in the River Vltava and achieve compliance with the requirements of the EU WFD. It is likely that this modelling strategy is applicable also to other

29
catchments with single reservoirs or reservoir cascades in the Czech Republic and can be used also in other stated across the EU.
This modelling study has demonstrated that essential impacts on water quality and ecology in the River Vltava catchment and its reservoirs come from the catchment land use and wastewater management while the influence of forecasted climate change is well recognisable but less important and can play even an alleviating role in eutrophication of reservoirs due to changes in hydrology.
6. References
Chung S.W., Oh J.K. 2006. Calibration of CE-QUAL-W2 for a monomictic reservoir in a monsoon climate area. Water Sci. Technol. 54(11-12): 29-37.
Cole T.M., Wells S.A. 2011. CE-QUAL-W2: A two-dimensional, laterally averaged, Hydrodynamic and Water Quality Model, Version 3.7. Department of Civil and Environmental Engineering, Portland State University, Portland, OR.
Croke B.F.W., Andrews F., Spate J., Cuddy S.M. 2005. IHACRES User Guide. Technical Report 2005/19. Second Edition. iCAM, School of Resources, Environment and Society, The Australian National University, Canberra. http://www.toolkit.net.au/ihacres
Futter M.N., Skeffington R.A., Whitehead P.G., Moldan F. 2009. Modelling stream and soil water nitrate dynamics during experimentally increased nitrogen deposition in a coniferous forest catchment at Gardsjon, Sweden. Hydrology Research 40, 187-197.
Hejzlar J., Borovec J., Kopáček J., Turek J., Volková A. 2011. Long-term trends in pollution by nutrients in the catchment of Orlík Reservoir. In: Proc. Conf. Revitalisation of Orlík Reservoir 2011, October 4-5, 2011, Písek, J. Borovec and I. Očásková (Eds), Svazek obcí regionu Písecko and Biologické centrum AV ČR, v.v.i., České Budějovice, pp. 36-42. (In Czech)
Hejzlar J., Dubrovský M., Buchtele J., Růžička M. 2003. The effect of climate change on the concentration of dissolved organic matter in a temperate stream (the Malše River, South Bohemia). Science of Total Environment 310: 143–152.
Hejzlar J., Borovec J., Mošnerová P., Polívka J., Turek J., Volková A., Žaloudík J. 2010a. A mass balance study of nutrient sources in the catchment of Orlík Reservoir: 1. Principles, methods, results. In: Proc. Conf. Revitalisation of Orlík Reservoir 2010, October 12-13, 2010, Písek, J Borovec and I Očásková (Eds), Svazek obcí regionu Písecko and Biologické centrum AV ČR, v.v.i., České Budějovice, pp. 53-66. (In Czech)
Hejzlar J., Borovec J., Mošnerová P., Polívka J., Turek J., Volková A., Žaloudík J. 2010c. The balance of phosphorus and nitrogen sources in the catchment of Orlík Reservoir. Technical report, Biology Centre AS CR, v.v.i., Institute of Hydrobiology, České Budějovice, 30 p. + 289 encl. (In Czech)
Hejzlar J, Vyhnálek V., Kopáček J., Duras J. 1996. Sources and transport of phosphorus in the Vltava River watershed (Czech Republic). Water Science and Technology 33: 137-144.
Hejzlar J., Vyhnálek V., Kopáček J., Procházková L., Komárková J. 2000. Eutrophication trends in the Vltava catchment area, Czech Republic. In: 12th Regional Central European Conference IUAPPA and

30
4th International Conference on Environmental Impact Assessment Prague 2000, Prague, September 11-14, 2000, CA-IUAPPA, Czech Republic, pp. 223-227.
Hejzlar J., Borovec J., Polívka J., Turek J., Volková A. 2010b. A mass balance study of nutrient sources in the catchment of Orlík Reservoir: 2. Scenario analysis for proposal of strategy to decrease phosphorus runoff. In: Proc. Conf. Revitalisation of Orlík Reservoir 2010, October 12-13, 2010, Písek, J Borovec and I Očásková (Eds), Svazek obcí regionu Písecko and Biologické centrum AVČR, v.v.i., České Budějovice, pp. 67-80. (In Czech)
Jain S., Sudheer K. 2008. Fitting of hydrologic models: a close look at the Nash–Sutcliffe Index. J. Hydrol. Eng., 13(10): 981–986.
Jin L. Whitehead P.G., Futter M.N., Lu Z. 2012. Modelling the impacts of climate change on flow and nitrate in the River Thames: assessing potential adaptation strategies. Hydrology Research, 43: 902-916.
Joliff J.K., Kindle J.C., Shulman I., Penta B., Friedrichs M.A.M., Helber R., Arnone R.A. 2009. Summary diagrams for coupled hydrodynamic-ecosystem model skill assessment. J. Marine Systems, 76: 64-82.
Kopáček J., Hejzlar J., Posch M. 2013a. Quantifying nitrogen leaching from diffuse agricultural and forest sources in a large heterogeneous catchment. Biogeochemistry, 115:149-165.
Kopáček J., Hejzlar J., Posch M. 2013b: Factors controlling the export of nitrogen from agricultural land in a large central European catchment during 1900-2010. Environmental Science and Technology 47, 6400-6407.
Kopáček J., Posch M., Hejzlar J., Oulehle F., Volková A. 2012. An elevation-based regional model for interpolating sulphur and nitrogen deposition. Atmospheric Environment, 50: 287–296.
Lapka M., Cudlínová E., Borovec J., Hejzlar J., Políčková B., Švejdarová E. 2011. Socio-economic interests and possibilities to decrease phosphorus loading in the catchment of Orlík Reservoir. In: Proc. Conf. Revitalisation of Orlík Reservoir 2011, October 4-5, 2011, Písek, J Borovec and I Očásková (Eds), Svazek obcí regionu Písecko and Biologické centrum AV ČR, v.v.i., České Budějovice, pp. 95-100. (In Czech)
Leander R., Buishand T.A. 2007. Resampling of regional climate model output for the simulation of extreme river flows. Journal of Hydrology, 332: 487-496.
Los F.J., Blaas M. 2010. Complexity, accuracy and practical applicability of different biogeochemical model versions. J. Marine Systems, 81: 44-74.
Nash J.E., Sutcliffe J.V. 1970. River flow forecasting through conceptual models part I — A discussion of principles, Journal of Hydrology, 10: 282–290.
Procházková L., Blažka P., Kopáček J. 1996. Impact of diffuse pollution on water quality of the Vltava River (Slapy Reservoir, Czech Republic). Water Science and Technology 33: 145-152.
Rankinen K., Lepistö A., Granlund K. 2002. Hydrological application of the INCA model with varying spatial resolution and nitrogen dynamics in a northern river basin. Hydrology and Earth System Sciences 6: 339-350.

31
Straškraba M., Gnauck A.H. 1985. Freshwater Ecosystems: Modelling and Simulation. Elsevier, Amsterdam, the Netherlands.
Straškraba M., Straškrabová V. 1975. Managment problems of Slapy Reservoir, Bohemia, Czechoslovakia. In: Proc. Symp. The Effect of Storage on Water Quality, Reading University, March 1975, organised by the Water Research Centre, Medmenham Laboratory, Bucks SL7 2HD, England, UK, pp. 449-483.
Thurman E.M. 1985. Organic Geochemistry of Natural Waters. Nijhoff Publishers, Dordrecht, the Netherlands.
Wade A.J., Whitehead P.G., Butterfield D. 2002. The Integrated Catchments model of Phosphorus dynamics (INCA-P), a new approach for multiple source assessment in heterogeneous river systems: model structure and equations. Hydrology and Earth System Sciences 6: 583-606.
Whitehead P.G., Wilson E.G., Butterfield D. 1998. A semi-distributed Nitrogen Model for Multiple Source Assessments in Catchments (INCA): Part 1 - Model structure and Process Equations. Sci. Total Environ. 201: 547-558.

32
7. Annex
Deliverable 5.11 Annex is available from the REFRESH Web site at
http://www.refresh.ucl.ac.uk/webfm_send/2386