deliverable 6.1 structural analysis and design of the...
TRANSCRIPT

Structural analysis and design of the masts at
three Pilot/building sites
Deliverable 6.1
Date: December, 2015
“This project has received funding from the European Union’s Seventh Programme for research, technological development
and demonstration under grant agreement No 608554”
Prepared by: Solearth and Solute
www.swipproject.eu
SWIP – New innovative solutions, components and tools for the integration of wind energy in urban and peri-urban areas Grant Agreement: 608554 From October 2013 to June 2017

Document:
Structural analysis and design of the masts at three Pilot/building sites Author:
SOLUTE Version: 6
Reference: D6.1 Date: 15/12/15
Disclaimer of warranties and limitation of liabilities
This document has been prepared by SWIP project partners to document work carried out within the framework of the EC-GA contract no 608554. Neither Project Coordinator, nor any signatory party of SWIP Project Consortium Agreement, nor any person acting on behalf of any of them:
(a) makes any warranty or representation whatsoever, express or implied,
(i). with respect to the use of any information, apparatus, method, process, or similar item disclosed in this document, including merchantability and fitness for a particular purpose, or
(ii). that such use does not infringe on or interfere with privately owned rights, including any party's intellectual property, or
(iii). that this document is suitable to any particular user's circumstance; or
(b) assumes responsibility for any damages or other liability whatsoever (including any consequential damages, even if Project Coordinator or any representative of a signatory party of the SWIP Project Consortium Agreement, has been advised of the possibility of such damages) resulting from your selection or use of this document or any information, apparatus, method, process, or similar item disclosed in this document.
2 Structural analysis and design of the masts at three Pilot/building sites

Document:
Structural analysis and design of the masts at three Pilot/building sites Author:
SOLUTE Version: 6
Reference: D6.1 Date: 15/12/15
Document info sheet Document Name: Structural Analysis and Design of The Masts at 3 Pilot Buildings
Responsible Partner: SOLUTE
WP: 6
Task: 6.3
Deliverable nº: 6.1
Version: 6
Version Date: 15/12/2015
Diffusion list All partners.
Approvals
Company CompanyAuthor/s SAL SOLUTE
Task Leader Solute WP Leader SAL
Documents history Revision Date Main modification Author
1 10/11/2015 First Draft SOLUTE 2 15/11/2015 Re formatting SOLUTE & SAL 3 27/11/2015 Comments TCD
4 01/12/2015 Comments and
Formattings CIRCE
5 09/12/2015 Consolidated version SOLUTE
6 15/12/2015 Final version (Fromatting) CIRCE
3 Structural analysis and design of the masts at three Pilot/building sites

Document:
Structural analysis and design of the masts at three Pilot/building sites Author:
SOLUTE Version: 6
Reference: D6.1 Date: 15/12/15
Executive Summary The present document presents the design and structural validation of the tower structures for each of the three wind turbines.
1. Chochezwo – V2 For the vertical axis wind turbine a frame built with beams has been selected for the design of the tower. The wind turbine is held by two points at both sides, as the turbine is installed in horizontal position.
2. Zaragoza – H4
This structure has been designed to bare a turbine in conditions in which the rooftop of the building can´t bare the loads or the weight of the entire machine. An additional beam structure located below the tower is attached to the building to distribute the loads between both. To prevent frequency damage to the tower structure two thin beams are bolted at each side of the main cylindrical beam and to the basement.
3. Kokozski – H20 For the H20 wind turbine a specific structure has been designed, consisting in two parts: main tower and beam frame. The main tower is made out of two cylindrical tubes of different diameter and welded to a conical connection. The beam frame is attached to the main tower to prevent any damaging vibrations due to the rotation frequencies of the wind turbine. Calculations by FEM and analytical approach for modal and static loading of this structure are presented for each of the tower designs.
4 Structural analysis and design of the masts at three Pilot/building sites

Document:
Structural analysis and design of the masts at three Pilot/building sites Author:
SOLUTE Version: 6
Reference: D6.1 Date: 15/12/15
Table of Contents 1 V2 Tower structural analysis .................................................................................................................. 9
1.1 Introduction ......................................................................................................................................... 9 1.2 Summary of results .............................................................................................................................. 9 1.3 Components description .................................................................................................................... 10
1.3.1 Beam Sections ........................................................................................................................ 11
1.4 Material Properties ............................................................................................................................ 11 1.5 Safety factors. .................................................................................................................................... 12 1.6 Load Cases .......................................................................................................................................... 12 1.7 FEM Model Description ..................................................................................................................... 13
1.7.1 Mesh size and type ................................................................................................................. 13
1.8 Assembly ............................................................................................................................................ 14
1.8.1 Constrains ............................................................................................................................... 14 1.8.2 Boundary conditions ............................................................................................................... 15 1.8.3 Mass element ......................................................................................................................... 15 1.8.4 Joint between parts. ............................................................................................................... 15
1.9 Hypothesis & Calculation Methodology ............................................................................................ 15
1.9.1 General stress calculation ....................................................................................................... 15 1.9.2 Natural frequencies calculation .............................................................................................. 16
2 H4 tower structural analysis ................................................................................................................ 16
2.1 Introduction ....................................................................................................................................... 16 2.2 Summary of results ............................................................................................................................ 17 2.3 Components description. ................................................................................................................... 17 2.4 Material Properties ............................................................................................................................ 19 2.5 Safety factors. .................................................................................................................................... 19 2.6 Load cases .......................................................................................................................................... 19 2.7 FEM model description ...................................................................................................................... 20
2.7.1 Reference coordination systems ............................................................................................ 20 2.7.2 Mesh size and type ................................................................................................................. 21 2.7.3 Assembly ................................................................................................................................. 23
2.8 Hypothesis & Calculation Methodology ............................................................................................ 25
2.8.1 General stress calculation ....................................................................................................... 25 2.8.2 Natural frequencies calculation .............................................................................................. 25 2.8.3 Weld Analysis .......................................................................................................................... 26
2.9 Results ................................................................................................................................................ 30
3 H20 tower structural analysis .............................................................................................................. 31
3.1 Introduction ....................................................................................................................................... 31 3.2 Summary of results ............................................................................................................................ 31 3.3 Components description. ................................................................................................................... 32
5 Structural analysis and design of the masts at three Pilot/building sites
Document:
Structural analysis and design of the masts at three Pilot/building sites Author:
SOLUTE Version: 6
Reference: D6.1 Date: 15/12/15
3.4 Material Properties ............................................................................................................................ 34 3.5 Safety factors. .................................................................................................................................... 34 3.6 Load cases .......................................................................................................................................... 35 3.7 FEM model description ...................................................................................................................... 35
3.7.1 Reference coordination systems ............................................................................................ 36 3.7.2 Mesh size and type ................................................................................................................. 36 3.7.3 Assembly ................................................................................................................................. 38
3.8 Hypothesis & Calculation Methodology ............................................................................................ 40
3.8.1 General stress calculation ....................................................................................................... 40 3.8.2 Natural frequencies calculation .............................................................................................. 40 3.8.3 Weld Analysis .......................................................................................................................... 41
4 Conclusions .......................................................................................................................................... 46
4.1 Results ................................................................................................................................................ 46
4.1.1 Wind turbine V2...................................................................................................................... 46 4.1.2 Wind turbine H4 ..................................................................................................................... 54 4.1.3 Wind turbine H20 ................................................................................................................... 62
5 References ........................................................................................................................................... 70
Index of tablesTable 1: Summary of results for V2 structure. ................................................................................................. 10 Table 2: Components 1 section properties. ..................................................................................................... 11 Table 3: Component 2 and 3. Section properties ............................................................................................ 11 Table 4: S275 JR steel material properties. ...................................................................................................... 12 Table 5: Material safety factors according to IEC61400-2 Wind Turbines Part 2 .......................................... 12 Table 6: Load Cases. ......................................................................................................................................... 12 Table 7: Model elements ................................................................................................................................. 13 Table 8: mass representation ........................................................................................................................... 15 Table 9: Summary of results for H4 structure. ................................................................................................. 17 Table 10: Steel S235JR material Properties...................................................................................................... 19 Table 11: Material safety factors according to IEC61400-2 Wind Turbines Part 2 ........................................ 19 Table 12: Load Cases ........................................................................................................................................ 20 Table 13: Dimensioning Load Cases and respective load magnitudes. ............................................................ 20 Table 14: Model elements ............................................................................................................................... 21 Table 15: Mass magnitude for components considered in the FE model. ....................................................... 25 Table 16: Fatigue joint classification ................................................................................................................ 26 Table 17: Summary of results for H20 structure. ............................................................................................. 31 Table 24: Material Properties .......................................................................................................................... 34 Table 19: Material safety factors according to IEC61400-2 Wind Turbines Part 2 ........................................ 34 Table 26: Load Cases ........................................................................................................................................ 35 Table 21: Dimensioning Load Cases ................................................................................................................. 35 Table 22: Model number of elements ............................................................................................................. 36 Table 23: Fatigue joint classification ................................................................................................................ 41 Table 24: Natural Frequencies of the model .................................................................................................... 52 Table 25: Reaction Force Load Case 1 .............................................................................................................. 53
6 Structural analysis and design of the masts at three Pilot/building sites
Document:
Structural analysis and design of the masts at three Pilot/building sites Author:
SOLUTE Version: 6
Reference: D6.1 Date: 15/12/15
Table 26: Reaction Force Load Case 2 .............................................................................................................. 53 Table 27: Reaction Force Load Case 3 .............................................................................................................. 53 Table 28: Natural Frequencies of the model .................................................................................................... 59 Table 29: Second natural frequency displacement (side view) ....................................................................... 60 Table 30: Reactions at Max My Load Case ....................................................................................................... 61 Table 31: Reactions at Max Mx Load Case ....................................................................................................... 61 Table 32: Reactions at Max Fx Load Case ........................................................................................................ 62 Table 33:Margin of safety Max My case .......................................................................................................... 63 Table 34: Margin of safety Max Mx case ......................................................................................................... 65 Table 35: Margin of safety Max Fx case ........................................................................................................... 67 Table 36: Superior Pipe weld calculation ......................................................................................................... 67 Table 37: Inferior pipe weld calculation ........................................................................................................... 68 Table 38: Natural Frequencies of the model .................................................................................................... 68 Index of figures Figure 1: V2 structure overview and components. .......................................................................................... 10 Figure 2: V2 structure load cases directions. ................................................................................................... 12 Figure 3: Model configuration and mesh ......................................................................................................... 13 Figure 4: Load and mass constrain ................................................................................................................... 14 Figure 5: base constrain ................................................................................................................................... 15 Figure 6: Campbell diagram for turbine design. .............................................................................................. 16 Figure 7: Structure overview ............................................................................................................................ 18 Figure 8: Model parts ....................................................................................................................................... 18 Figure 9: Beams frame Section dimensions ..................................................................................................... 19 Figure 10: coordinate system ........................................................................................................................... 21 Figure 11: Model configuration and mesh (1).................................................................................................. 22 Figure 12: Model configuration and mesh ....................................................................................................... 22 Figure 13: Load and mass constrains ............................................................................................................... 23 Figure 14: base constrain ................................................................................................................................. 24 Figure 15: wall constrain .................................................................................................................................. 24 Figure 16: Campbell diagram for turbine design ............................................................................................. 26 Figure 17: Fillet weld stresses .......................................................................................................................... 27 Figure 18: Weld throat stresses calculation ..................................................................................................... 28 Figure 19: Reference welding points at different types of meshing for HOT SPOT. ........................................ 29 Figure 20: HOT SPOT types .............................................................................................................................. 29 Figure 21: Detail category from EC3-1-9 for nominal stress HOT SPOT method ............................................. 29 Figure 22: Parts of the H20 Tower ................................................................................................................... 33 Figure 23: Beams frame section dimensions ................................................................................................... 34 Figure 24: View of FEM models: Left: frame with beam elements, right: shell elements are used instead. ... 37 Figure 25: Mesh of the FEM Models. Left: frame with beam elements, right: shell elements are used instead. ......................................................................................................................................................................... 37 Figure 26: Load constrain at first bearing interface location ........................................................................... 38 Figure 27: Mass constrain ................................................................................................................................ 39 Figure 28: Boundary constrain ......................................................................................................................... 39 Figure 29: Campbell diagram for turbine design ............................................................................................. 41 Figure 30: Fillet weld stresses .......................................................................................................................... 42 Figure 31: Weld throat stresses calculation ..................................................................................................... 43
7 Structural analysis and design of the masts at three Pilot/building sites
Document:
Structural analysis and design of the masts at three Pilot/building sites Author:
SOLUTE Version: 6
Reference: D6.1 Date: 15/12/15
Figure 32: Reference welding points at different types of meshing for HOT SPOT. ........................................ 44 Figure 33: HOT SPOT types .............................................................................................................................. 44 Figure 34: Detail category from EC3-1-9 for nominal stress HOT SPOT method ............................................. 44 Figure 35: Gravity Load case. Displacements (m). Scale factor: 100. ............................................................... 46 Figure 36: Gravity Load case. Von Mises stress (MPa). .................................................................................... 47 Figure 37: Highest stress node Gravity Load case. Von Mises stress (MPa). ................................................... 47 Figure 38: Front Wind Load Case. Displacements (m). Scale factor: 100......................................................... 48 Figure 39: Front Wind Load Case. Von Mises stress (MPa). ............................................................................. 48 Figure 40: Highest stress node Front Wind Load case. Von Mises stress (MPa). ............................................. 49 Figure 41: Side Wind Load Case. Displacements (m). Scale factor: 100. ......................................................... 49 Figure 42: Side Wind Load Case. Von Mises stress (MPa). ............................................................................... 50 Figure 43: Highest stress node Side wind Load case. Von Mises stress (MPa). ............................................... 50 Figure 44: First Natural Frequency mode shape. ............................................................................................. 51 Figure 45: Max My Loading Case. Dispalcements (m). Scale factor: 800. ........................................................ 54 Figure 46: Max My Loading Case. Von Mises stress (Pa). ................................................................................ 54 Figure 29: Detail Max My case. Von Mises stress (Pa). .................................................................................... 55 Figure 48:Von Misses Max Mx. Displacements (m). Scale factor: 800. ............................................................ 55 Figure 49: Max Mx Loading Case.. Von Mises stress (Pa). ............................................................................... 56 Figure 50: Detail Case Max Mx. Von Mises stress (Pa)..................................................................................... 56 Figure 51:Von Misses Max Fx. Displacements (m). Scale factor: 800. ............................................................. 57 Figure 52: Von Misses Max Fx. Von Mises stress (Pa). ..................................................................................... 57 Figure 53: Detail Max Fx. Von Mises stress (Pa). .............................................................................................. 58 Figure 54: Campbell´s Diagram ........................................................................................................................ 59 Figure 55:First natural frequency displacement (front view) .......................................................................... 60 Figure 56: Max My Loading Case. Displacements (m). Scale factor = 1000 ..................................................... 62 Figure 57: Max My Loading Case. Von Mises stress (Pa). ................................................................................ 63 Figure 58: Detail Max My case. Von Mises stress (Pa). .................................................................................... 63 Figure 59: Max Mx Loading Case. Displacements (m). Scale factor = 1000 ..................................................... 64 Figure 60:Von Misses Max Mx. Von Mises stress (Pa). .................................................................................... 64 Figure 61: Detail Case Max Mx. Von Mises stress (Pa)..................................................................................... 65 Figure 62: Max Fx Loading Case. Displacements (m). Scale factor = 1000 ....................................................... 66 Figure 63: Von Misses Max Fx. Von Mises stress (Pa). ..................................................................................... 66 Figure 64: Detail Max Fx. Von Mises stress (Pa). .............................................................................................. 67 Figure 65: Campbell´s Diagram ........................................................................................................................ 68 Figure 66: First natural frequency displacement 6.244 Hz .............................................................................. 69 Figure 67: Second natural frequency displacement 6.246 Hz .......................................................................... 69
8 Structural analysis and design of the masts at three Pilot/building sites

Document:
Structural analysis and design of the masts at three Pilot/building sites Author:
SOLUTE Version: 6
Reference: D6.1 Date: 15/12/15
1 V2 Tower structural analysis
1.1 Introduction The present document has been developed to validate the design, materials and joints chosen for the SWIP Project on the V2 Structure. This report studies the behavior of the tower under modal test and extreme load tests using the finite element method. For the loads the guideline used was the International Standard [Ref. 1] for small wind turbines. There were several limitations we have to attend to design the wind turbine and, therefore, the anchorages. First of all, we found a height limitation in the pilot chosen. The wind turbine could not go over three meters above the rooftop. Also, following the DOW, the wind turbine to be designed for this pilot had to have a vertical axis. The initial design of the wind turbine had a 4.5 metres blades length. This design meant we could not install the wind turbine in a vertical position due to the height limitation. The solution was to lye down the wind turbine on the rooftop. At this point, a cage with four legs was designed to install the wind turbine. The next limitation was the weight that the rooftop could support. The initial wind turbine was too heavy. The design of the wind turbine was review to try to make it lighter and the structure of the building was carefully studied to find the strongest or reinforced part of the rooftop to install the wind turbine. Other restrictions as the vent pipes, sirens and other additional structures were taking into account when selecting the most optimum part of the rooftop. The last decision was to adapt the wind turbine cutting the size to the half and supporting the structure over the load bearing walls of the building. These walls are part of the main structure of the building and can support more weight than the rest of the structure of the rooftop mainly built of hollow bricks. A polish civil engineer was hired by BAPE in order to perform the calculations needed to know the weight that can be supported by the load bearing walls and also to find a solution to install the wind turbine. The platform below was the solution proposed by the polish civil engineer and the structure and anchorages of the wind turbine were adapted to this platform.
1.2 Summary of results The structure of V2 , bearing loads from turbine and transmitt them to the buiding, is proven to fulfill structural requirements. This means that structural strength is checked against the load cases considered, that are chosen as the most demanding from a structural point of view.
9 Structural analysis and design of the masts at three Pilot/building sites
Document:
Structural analysis and design of the masts at three Pilot/building sites Author:
SOLUTE Version: 6
Reference: D6.1 Date: 15/12/15
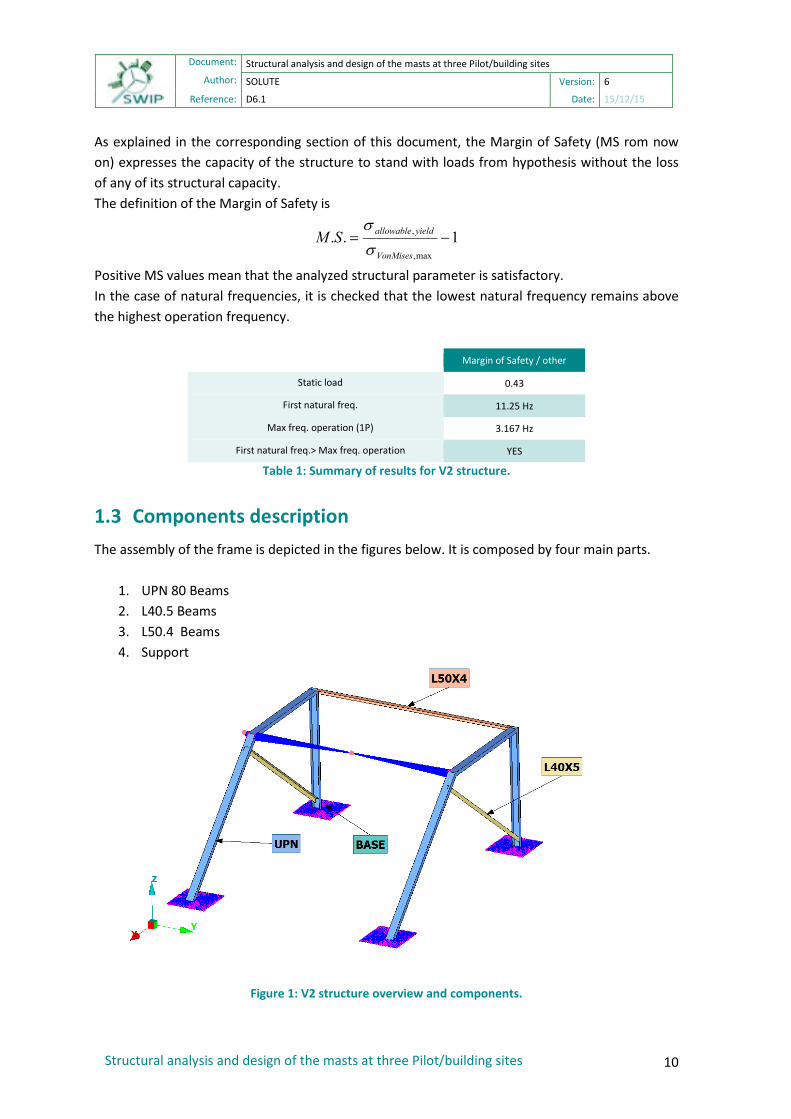
As explained in the corresponding section of this document, the Margin of Safety (MS rom now on) expresses the capacity of the structure to stand with loads from hypothesis without the loss of any of its structural capacity. The definition of the Margin of Safety is
1..max,
, −=VonMises
yieldallowableSMss
Positive MS values mean that the analyzed structural parameter is satisfactory. In the case of natural frequencies, it is checked that the lowest natural frequency remains above the highest operation frequency.
Margin of Safety / other
Static load 0.43
First natural freq. 11.25 Hz
Max freq. operation (1P) 3.167 Hz
First natural freq.> Max freq. operation YES
Table 1: Summary of results for V2 structure.
1.3 Components description The assembly of the frame is depicted in the figures below. It is composed by four main parts.
1. UPN 80 Beams 2. L40.5 Beams 3. L50.4 Beams 4. Support
Figure 1: V2 structure overview and components.
10 Structural analysis and design of the masts at three Pilot/building sites

Document:
Structural analysis and design of the masts at three Pilot/building sites Author:
SOLUTE Version: 6
Reference: D6.1 Date: 15/12/15
1.3.1 Beam Sections
Part Section h(mm) b (mm) Thickness (mm) Length (m) Quantity
1
U 80 45 6 1.2 2
U 80 45 6 1.25 2
U 80 45 6 1.8 2
Table 2: Components 1 section properties.
Part Section h(mm) b (mm) Thickness (mm) Length (m) Quantity
2 L 40 40 5 1.75 2
3 L 50 50 4 2.11 1
Table 3: Component 2 and 3. Section properties
1.4 Material Properties Material considered in analysis is S275 JR steel. Selection is made based on availability and strength required. Properties considered are shown in table 4.
11 Structural analysis and design of the masts at three Pilot/building sites

Document:
Structural analysis and design of the masts at three Pilot/building sites Author:
SOLUTE Version: 6
Reference: D6.1 Date: 15/12/15
Steel S275JR
E (MPa) 21000
fy (MPa) 275
Tensile Stress (MPa) 360
Table 4: S275 JR steel material properties.
1.5 Safety factors. Material properties are affected by the safety factors expressed in the figure below.
Safety factor Steel
Extreme 1.1
Fatigue ( ) 1.265
Table 5: Material safety factors according to IEC61400-2 Wind Turbines Part 2
1.6 Load Cases The load cases defined to verify the structure are the following:
LOAD CASE Description Direction Magnitude
1 Gravity -Z 9.81 m/seg2
2 Side wind -Y 3376.5 N
3 Front wind -X 5024.6 N
Table 6: Load Cases.
Loads directions are shown in the figure 2.
Figure 2: V2 structure load cases directions.
Load Case 2
Load Case 3
12 Structural analysis and design of the masts at three Pilot/building sites

Document:
Structural analysis and design of the masts at three Pilot/building sites Author:
SOLUTE Version: 6
Reference: D6.1 Date: 15/12/15
The magnitude of each load case was calculated as the equivalent force applied by the wind to the structure. As the International Standard demonstrates [Ref.1] we can calculate the equivalent force by the following equation:
F=0.5 x Cf x ρ·x v2 x ·A
Cf: aerodynamic coefficient ρ: wind density v: wind speed A: exposed area of the turbine
1.7 FEM Model Description A global coordinate system is showed in figure 3..
1.7.1 Mesh size and type The mesh length used for this model is between 8-10 mm. The elements used for the definition of the model consist in S4 and S3 shell and B31 beam elements.
Element Type Number of elements
Quads 6450
Trias 14
Table 7: Model elements
Figure 3: Model configuration and mesh
13 Structural analysis and design of the masts at three Pilot/building sites
Document:
Structural analysis and design of the masts at three Pilot/building sites Author:
SOLUTE Version: 6
Reference: D6.1 Date: 15/12/15
1.8 Assembly
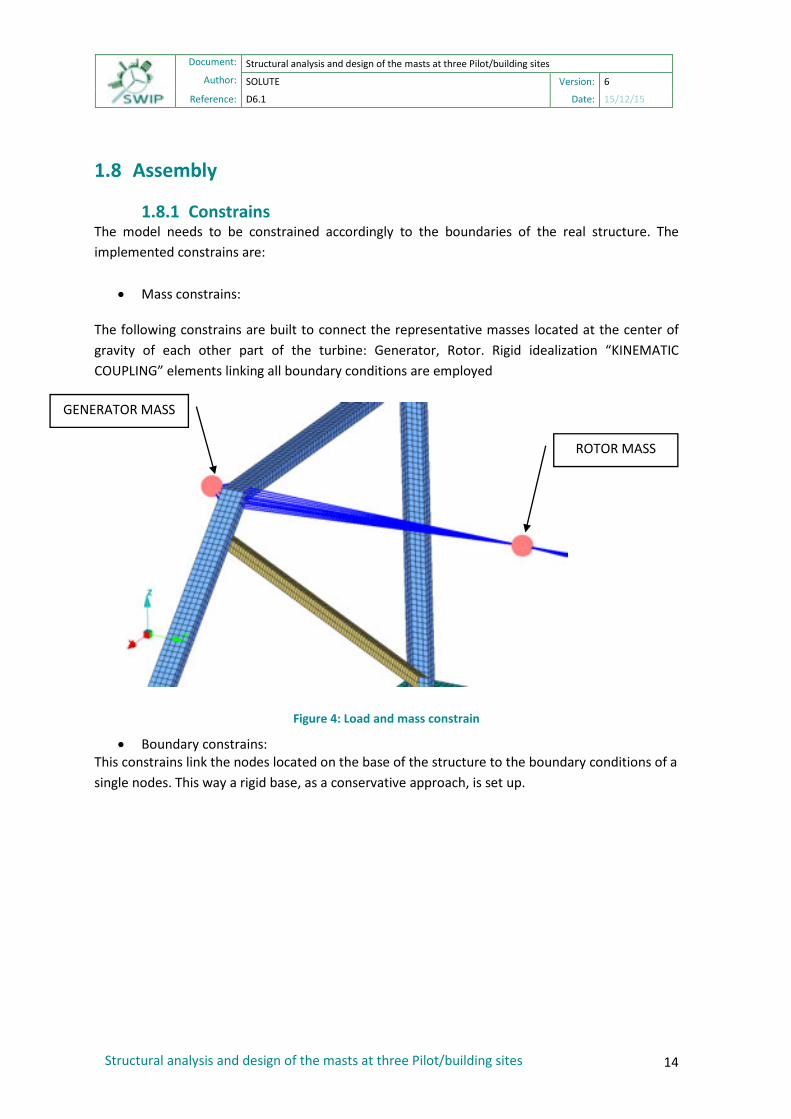
1.8.1 Constrains The model needs to be constrained accordingly to the boundaries of the real structure. The implemented constrains are:
• Mass constrains:
The following constrains are built to connect the representative masses located at the center of gravity of each other part of the turbine: Generator, Rotor. Rigid idealization “KINEMATIC COUPLING” elements linking all boundary conditions are employed
Figure 4: Load and mass constrain
• Boundary constrains: This constrains link the nodes located on the base of the structure to the boundary conditions of a single nodes. This way a rigid base, as a conservative approach, is set up.
ROTOR MASS
GENERATOR MASS
14 Structural analysis and design of the masts at three Pilot/building sites

Document:
Structural analysis and design of the masts at three Pilot/building sites Author:
SOLUTE Version: 6
Reference: D6.1 Date: 15/12/15
Figure 5: base constrain
1.8.2 Boundary conditions The boundary conditions are located in the master node of the constraint in the base of the structure, and represent the joints to the roof of the building. These boundary conditions restrict all degrees of freedom.
1.8.3 Mass element To represent the heavy components that will be placed over the structure an element with a representative mass almost equal to the mass of those components is defined. ABAQUS lets us define a point mass and we´ve estimated a representative mass for each of those components:
Component Mass (kg)
Generator 40
Hub and blades 130
Table 8: mass representation
1.8.4 Joint between parts. Parts are joined between them by sharing common nodes.
1.9 Hypothesis & Calculation Methodology
1.9.1 General stress calculation The margin of safety of all the parts made up of shells elements is calculated with the maximum allowable stress value for each component.
1..max,
, −=VonMises
yieldallowableSMss
Von Mises stress is obtained directly from the output file of the FE model.
15 Structural analysis and design of the masts at three Pilot/building sites

Document:
Structural analysis and design of the masts at three Pilot/building sites Author:
SOLUTE Version: 6
Reference: D6.1 Date: 15/12/15
1.9.2 Natural frequencies calculation In wind turbines it must be verified that the excitation frequencies do not intersect natural frequencies of the components and structures on it. Rotation frequency of the rotor is the main source of frequencies in a wind turbine. As the wind speed rises the rotation speed also increases, thus the frequency increases from none to the extreme wind case. Therefore the design of each component needs to have its natural frequency above the working values of the rotation frequencies. In the case of the V2, as there is a twist along the axis of rotation for the six blades, only the rotation speed of the rotor, i.e. 1P, is considered. In other words, there is no composition of higher frequencies as there is in the horizontal wind turbines, and no 6P (for the six blades) is here considered.
Figure 6: Campbell diagram for turbine design.
2 H4 tower structural analysis
2.1 Introduction The present document describes the structural analysis for the validation of the design, materials and joints defined for the tower of the 4kW Urban Wind Turbine type (from now on H4) developed under the SWIP Project. This report studies the structural behaviour of the tower by means of a finite element method (FEM) model under extreme load cases and modal analysis.
16 Structural analysis and design of the masts at three Pilot/building sites

Document:
Structural analysis and design of the masts at three Pilot/building sites Author:
SOLUTE Version: 6
Reference: D6.1 Date: 15/12/15
The main problem found on this pilot was getting permission to install the wind turbine on one of the rooftops of the University of Zaragoza. Some of the buildings offered have the rooftop with such a high inclination that installation of the wind turbine would have become very expensive because of the attached structured to be designed and the cranes needed to lift the components of the wind turbine. Finally one of the offered buildings had a flat rooftop being optimum to install the wind turbine but the University was installing a telescope and vibrations of the wind turbine could be transmitted through the roof avoiding the right work of the telescope. Finally, CIRCE offered its own building close to the university of Zaragoza but the rooftop was too weak to support the weight of the wind turbine. The solution became to add an external structure attached to the building and install the wind turbine over this structure. ABAQUS is the code used in the definition of the FEM model.
2.2 Summary of results The structure of H4 , bearing loads from turbine and transmitt them to the buiding, is proven to fulfill structural requirements. This means that structural strength is checked against the load cases considered, that are chosen as the most demanding from a structural point of view. As it is collected in table 1, all margin of safety are positive. As explained in the corresponding section of this document, the Margin of Safety (MS rom now on) expresses the capacity of the structure to stand with loads from hypothesis without the loss of any of its structural capacity. The definition of the Margin of Safety is
1..max,
, −=VonMises
yieldallowableSMss
Positive MS values mean that the analyzed structural parameter is satisfactory. In the case of natural frequencies, it is checked that the lowest natural frequency remains above the highest operation frequency.
Margin of Safety / other
Static load 7.32
First natural freq. 6.28 Hz
Max freq. operation 6 Hz
First natural freq.> Max freq. operation YES
Table 9: Summary of results for H4 structure.
2.3 Components description. The assembly of the tower is depicted in the figures below. It is composed by four main parts.
1. Upper Tube
17 Structural analysis and design of the masts at three Pilot/building sites

Document:
Structural analysis and design of the masts at three Pilot/building sites Author:
SOLUTE Version: 6
Reference: D6.1 Date: 15/12/15
2. Beams frame. 3. Lower Tube 4. Cone connector
Figure 7: Structure overview
Figure 8: Model parts
1. Superior Pipe 5 meters long – 25 mm thickness pipe welded at its ends.
2. Beam Frame A structure made out of steel box beams. This structure helps preventing the natural frequencies of the tower reach the rotation frequency of the turbine.
1 3
2 4
18 Structural analysis and design of the masts at three Pilot/building sites

Document:
Structural analysis and design of the masts at three Pilot/building sites Author:
SOLUTE Version: 6
Reference: D6.1 Date: 15/12/15
Figure 9: Beams frame Section dimensions
3. Inferior Pipe 11 meters long - 25mm thickness pipe welded at its ends.
4. Joints These joints are the ones that hold together both the top and inferior structures of the tower. Also the joints are used to connect the tower structure to the building located next to the tower.
2.4 Material Properties Material considered in analysis is S235 JR steel. Properties considered are shown in table below.
Steel S235JR
E (MPa) 21000
fy (MPa) 235
Tensile Stress (Mpa) 360
Table 10: Steel S235JR material Properties.
2.5 Safety factors. Material properties are affected by the safety factors expressed in the figure below.
Safety factor Steel
Extreme 1.1
Fatigue ( ) 1.265
Table 11: Material safety factors according to IEC61400-2 Wind Turbines Part 2
2.6 Load cases Two scenarios are verified:
• Extreme load cases
70mm
70mm
Th= 10mm
19 Structural analysis and design of the masts at three Pilot/building sites

Document:
Structural analysis and design of the masts at three Pilot/building sites Author:
SOLUTE Version: 6
Reference: D6.1 Date: 15/12/15
• Modal analysis
These load cases have been calculated according to International Standard- IEC 61400-2 specific for small wind turbines. Wind turbine extreme loading cases were selected, and are shown in the table 14.
LOAD CASE Description
A Normal operation
B Yawing
C Yaw error
D Maximum thrust
E Maximum rotational speed
F Short at Load Connection
G Shutdown (Braking)
H Extreme Wind Loading
I Parked Wind Loading, Maximum Exposure
Table 12: Load Cases
ENVELOPE Loads (Nm, N)
Load case My Mx Fx
Case A 16552.69
Case G 13636.2
Case D 13998.24
Fatigue 1809.73 564.27 1152.07
Table 13: Dimensioning Load Cases and respective load magnitudes.
2.7 FEM model description
2.7.1 Reference coordination systems For the finite element models, a global coordinate system as shown in Figure 17 has been considered:
20 Structural analysis and design of the masts at three Pilot/building sites

Document:
Structural analysis and design of the masts at three Pilot/building sites Author:
SOLUTE Version: 6
Reference: D6.1 Date: 15/12/15
Figure 10: coordinate system
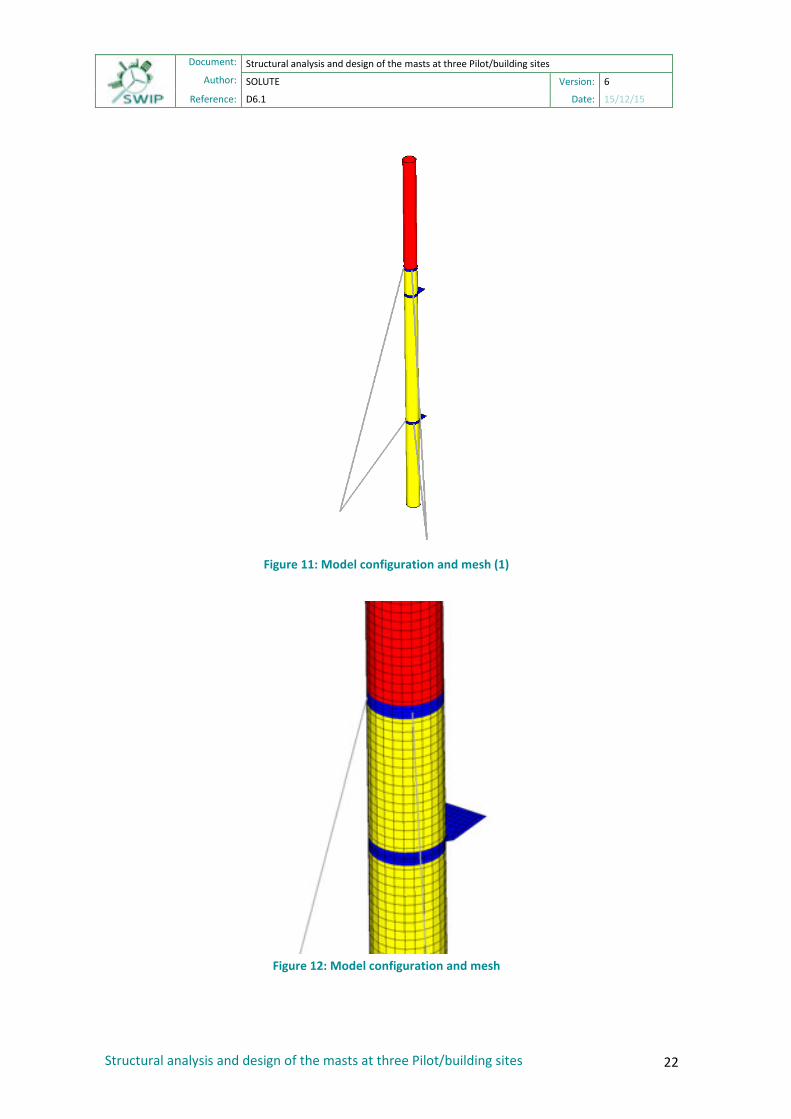
2.7.2 Mesh size and type The mesh size used for this model is between 8-10 mm. The elements used for the definition of the model consist in S4 and S3 shell and B31 beam elements.
Element Type Number of elements
Quads 5854
Trias 10
Beams 4
Table 14: Model elements
21 Structural analysis and design of the masts at three Pilot/building sites
Document:
Structural analysis and design of the masts at three Pilot/building sites Author:
SOLUTE Version: 6
Reference: D6.1 Date: 15/12/15
Figure 11: Model configuration and mesh (1)
Figure 12: Model configuration and mesh
22 Structural analysis and design of the masts at three Pilot/building sites

Document:
Structural analysis and design of the masts at three Pilot/building sites Author:
SOLUTE Version: 6
Reference: D6.1 Date: 15/12/15
2.7.3 Assembly
2.7.3.1Constrains For the definition of the loads and restrictions needed for the FEM analysis a total of seven constrains are implemented in this particular model, divided into two groups:
• Top tower constraints: All of this constrains are located on the top nodes of the superior structure. Three of them connect three corresponding mass elements (representing components of the drive train) to the tower top. An additional coupling constraint at the top of the tower represents the load way through the structure. The reference node is located where the loads are calculated: at the first bearing of the main shaft. The following constrains are connected to the representative masses located at the center of gravity of each part of the turbine (I: yaw system, II: hub, III: nacelle).
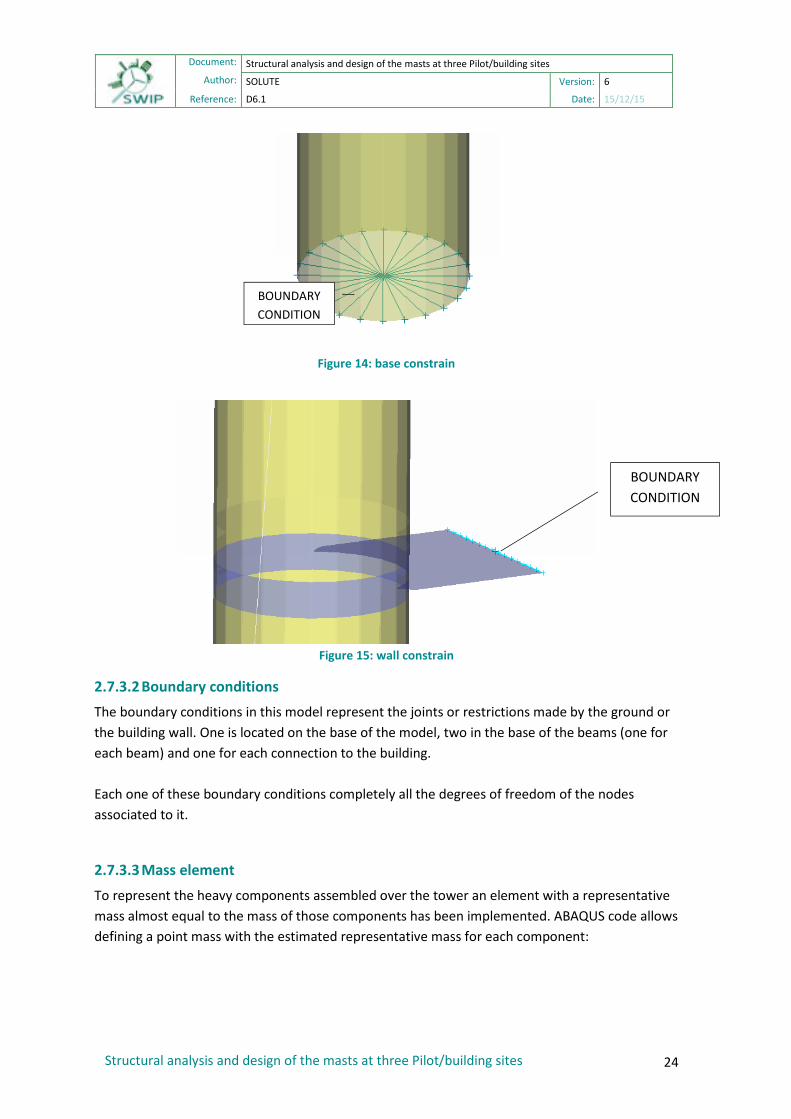
Figure 13: Load and mass constrains
• Boundary constrains: This constrains link the nodes located on the base of the structure and on the wall side of the joints to the boundary conditions. The one in the bottom of the structure represents the link to the ground and the ones in the joints the connection to the wall.
23 Structural analysis and design of the masts at three Pilot/building sites
Document:
Structural analysis and design of the masts at three Pilot/building sites Author:
SOLUTE Version: 6
Reference: D6.1 Date: 15/12/15
Figure 14: base constrain
Figure 15: wall constrain
2.7.3.2Boundary conditions The boundary conditions in this model represent the joints or restrictions made by the ground or the building wall. One is located on the base of the model, two in the base of the beams (one for each beam) and one for each connection to the building. Each one of these boundary conditions completely all the degrees of freedom of the nodes associated to it.
2.7.3.3Mass element To represent the heavy components assembled over the tower an element with a representative mass almost equal to the mass of those components has been implemented. ABAQUS code allows defining a point mass with the estimated representative mass for each component:
BOUNDARY CONDITION
BOUNDARY CONDITION
24 Structural analysis and design of the masts at three Pilot/building sites

Document:
Structural analysis and design of the masts at three Pilot/building sites Author:
SOLUTE Version: 6
Reference: D6.1 Date: 15/12/15
Component Mass (kg)
Yaw system 221
Hub and blades 270
Nacelle 264
Table 15: Mass magnitude for components considered in the FE model.
2.7.3.4Beam element To represent the beams that will be placed in the structure an ABAQUS element that simulates the behavior of a real beam with a pre-defined section has been used.
2.8 Hypothesis & Calculation Methodology
2.8.1 General stress calculation The margin of safety of all the parts made up of shells elements is calculated with the maximum allowable stress value for each component.
1..max,
, −=VonMises
yieldallowableSMss
Von Mises stress is obtained directly from the output file of the FE model.
2.8.2 Natural frequencies calculation In wind turbines it must be verified that the excitation frequencies do not intersect natural frequencies of the components and structures on it. Rotation frequency of the blades is the main source f frequencies in a wind turbine. As the wind speed rises the rotation speed also increases, thus the frequency increases from none to the extreme wind case. Therefore the design of each component needs to have its natural frequency above the working values of the rotation frequencies. The frequency that affect the turbine components are:
1P frequency, contribution of one of the rotation of each blade,
3P, contribution of the sum of the three blades.
As the wind speed rises, the rotation speed also increases, thus the frequency increases from zero to the extreme wind case. Therefore the design of each component needs to have its natural frequency above the working values of the rotation frequencies 1P and 3P. This is represented in a Campbell diagram, as shown below. Results of frequency analysis are evaluated in this diagram.
25 Structural analysis and design of the masts at three Pilot/building sites

Document:
Structural analysis and design of the masts at three Pilot/building sites Author:
SOLUTE Version: 6
Reference: D6.1 Date: 15/12/15
Figure 16: Campbell diagram for turbine design
2.8.3 Weld AnalysisThe method of global analysis is elastic distribution of loads over the welds joining parts. The behavior of the joints is determined in accordance with EC3 section 5 (see Ref. 3). For elastic global analysis, the joints should be classified according to their rotational stiffness. The joints of the hub under study are classified as rigid. With that classification, the type of joint model is continuous (see EC3 table 5.1). This means that joints in the FEM model are not simple (which means not transmission of moments), nor semi-continuous (which would imply that the joint stiffness should be included in the FEM model). The following table summarizes the approach followed:
Static analysis Fatigue Analysis
Full penetration Not Required At TOEs nominal - Detail Category 100
s geometric (HOT-SPOT)
Fillet weld According to Ref 1At TOE s geometric (HOT-SPOT)
At ROOT s nominal - Detail Category 90
Table 16: Fatigue joint classification
2.8.3.1Ultimate strength analysis The static strength of welded joints is analyzed according to Ref. 3
26 Structural analysis and design of the masts at three Pilot/building sites
Document:
Structural analysis and design of the masts at three Pilot/building sites Author:
SOLUTE Version: 6
Reference: D6.1 Date: 15/12/15
The distribution of forces is calculated on the assumption of elastic behavior.theories. Two types of welds are found in the structure:
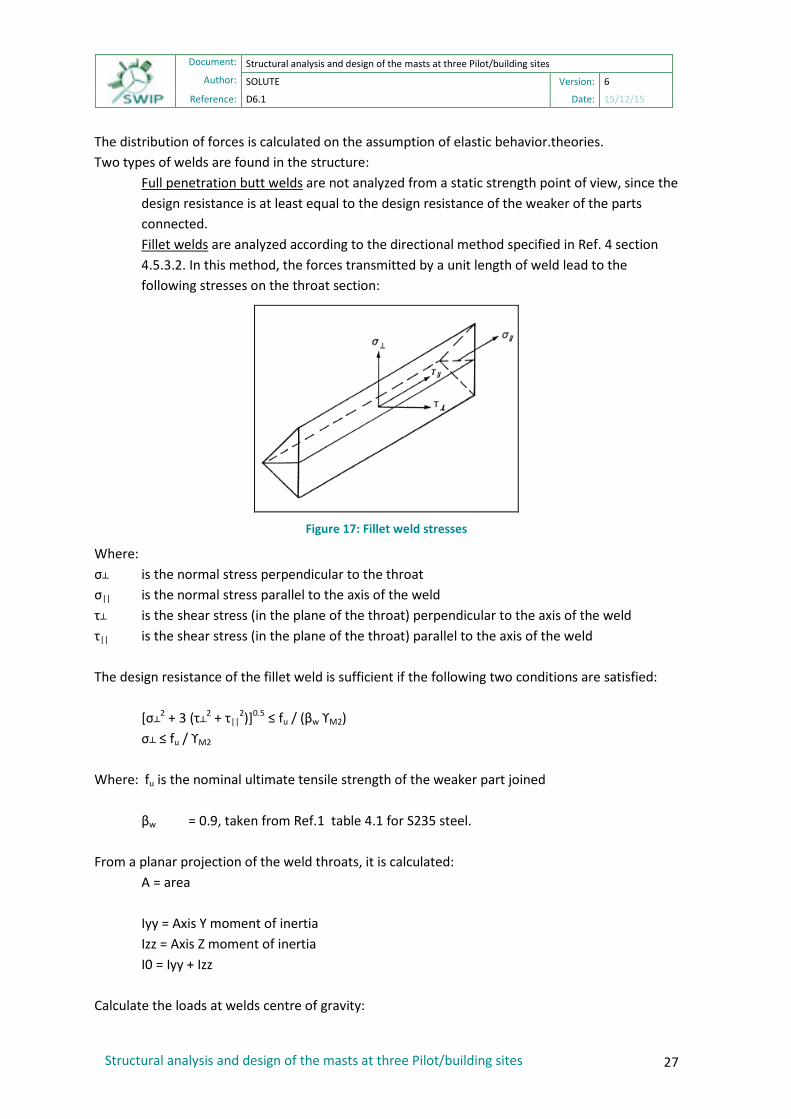
Full penetration butt welds are not analyzed from a static strength point of view, since the design resistance is at least equal to the design resistance of the weaker of the parts connected. Fillet welds are analyzed according to the directional method specified in Ref. 4 section 4.5.3.2. In this method, the forces transmitted by a unit length of weld lead to the following stresses on the throat section:
Figure 17: Fillet weld stresses
Where: σ┴ is the normal stress perpendicular to the throat σ|| is the normal stress parallel to the axis of the weldτ┴ is the shear stress (in the plane of the throat) perpendicular to the axis of the weld τ|| is the shear stress (in the plane of the throat) parallel to the axis of the weld The design resistance of the fillet weld is sufficient if the following two conditions are satisfied: [σ┴
2 + 3 (τ┴2 + τ||
2)]0.5 ≤ fu / (βw ϒM2) σ┴ ≤ fu / ϒM2
Where: fu is the nominal ultimate tensile strength of the weaker part joined βw = 0.9, taken from Ref.1 table 4.1 for S235 steel. From a planar projection of the weld throats, it is calculated: A = area
Iyy = Axis Y moment of inertia Izz = Axis Z moment of inertia I0 = Iyy + Izz Calculate the loads at welds centre of gravity:
27 Structural analysis and design of the masts at three Pilot/building sites

Document:
Structural analysis and design of the masts at three Pilot/building sites Author:
SOLUTE Version: 6
Reference: D6.1 Date: 15/12/15
Fx, Fy, Fz, Mx, My, Mz Calculate stresses in joint coordinate frame according to the following expressions:
Fx -> σx = Fx / A Fy -> σy = Fy / A Fz -> σz = Fz / A Mx -> σy = - Mx / I0 · z σz = Mx / I0 · y My -> σx = My / Iyy · z Mz -> σx = - Mz / Izz · y Finally, weld throat stresses are calculated:
2
1
┴
┴
┴ = (2 – 1) / √2┴ = (2+ 1) / √2|| = 3
Figure 18: Weld throat stresses calculation
2.8.3.2Fatigue strength analysisThe fatigue loads are provided in terms of an equivalent stress range at 1E07 cycles. The distribution of forces is calculated on the assumption of elastic behavior. For this kind of analysis we use the FEM weld toe behavior described in Ref. 2. It presents the following remarkable points:
• FE model must follow modelization guidelines as explained in Ref. [2]. Weld seam not modelled.
• Reference stresses are taken at mid-edge nodes at first and second elements from weld toe, i.e. at 0.4 t and 1.0 t, being t the thickness of the plate, as shown in Figure 25 for type-A weld location. For type-B, nodes are placed as shown in the figure 25.
• Nominal Geometric stress obtained from extrapolation until structural intersection point.
28 Structural analysis and design of the masts at three Pilot/building sites

Document:
Structural analysis and design of the masts at three Pilot/building sites Author:
SOLUTE Version: 6
Reference: D6.1 Date: 15/12/15
Figure 19: Reference welding points at different types of meshing for HOT SPOT.
Type A: for to the plane surface Type B: for the plate edge. In the frames, weld toe locations corresponds to type A.
Figure 20: HOT SPOT types
Following table B.1 from Ref. 1 , detail category 90 is applied:
Figure 21: Detail category from EC3-1-9 for nominal stress HOT SPOT method
It is important to notice that the NOTE 2 in Table B-1 Ref.4 that is referred to in the category 90 says that the propagation of the failure from the root through the weld throat is not covered by the hot spot methodology, that is why a root calculation is also compulsory for the welds analyzed with this HOT SPOT category.
29 Structural analysis and design of the masts at three Pilot/building sites

Document:
Structural analysis and design of the masts at three Pilot/building sites Author:
SOLUTE Version: 6
Reference: D6.1 Date: 15/12/15
The steps followed are: • Stress range is calculated as absolute difference of Major and Minor principal stresses
between the subcases of each fatigue load case. • The plot colored contour allows discriminating visually the worst areas. These are to be
analyzed. This is done for each load case. • At these areas, the directions of the principal stresses are checked, so that they remain
perpendicular to the weld and can therefore be taken into account. Otherwise, they would be obviated from the analysis.
Extrapolation as per Ref 1, leads to the hot spot stress value to be compared to detail category, and determination of Damage.
2.9 Results In this section the results from the structural analysis from the FEM model are shown. Summarizing, the structure proved to bear extreme loads from the considered load cases. No stresses are above the yield limit of the material, meaning that the structure will remain under the elastic zone of the material behavior. Welds are also analyzed here and their definition verified under fatigue loads scenario. Natural frequencies remain above excitation frequencies, meaning that no modal response is possible to happen in the expected operational conditions, and therefore, no dynamic excitation of the stress response of the structure is likely to happen.
30 Structural analysis and design of the masts at three Pilot/building sites

Document:
Structural analysis and design of the masts at three Pilot/building sites Author:
SOLUTE Version: 6
Reference: D6.1 Date: 15/12/15
3 H20 tower structural analysis
3.1 Introduction The present document describes the structural analysis for the validation of the design, materials and joints defined for the tower of the 20MW Urban Wind Turbine type (from now on H20) developed under the SWIP Project. This report studies the structural behaviour of the tower by means of a finite element method (FEM) model under extreme load cases and modal analysis. ABAQUS is the code used in the definition of the FEM model.
3.2 Summary of results The structure of H20 , bearing loads from turbine and transmitt them to the foundation, is proven to fulfill structural requirements. This means that structural strength is checked against the load cases considered, that are chosen as the most demanding from a structural point of view. As it is collected in table 1, all margin of safety are positive. As explained in the corresponding section of this document, the Margin of Safety (MS rom now on) expresses the capacity of the structure to stand with loads from hypothesis without the loss of any of its structural capacity. The definition of the Margin of Safety is
1..max,
, −=VonMises
yieldallowableSMss
Positive MS values mean that the analyzed structural parameter is satisfactory. In the case of natural frequencies, it is checked that the lowest natural frequency remains above the highest operation frequency.
Margin of Safety / other
Static load 3.3
First natural freq. 6.24 Hz
Max freq. operation 6 Hz
First natural freq.> Max freq. operation YES
Table 17: Summary of results for H20 structure.
31 Structural analysis and design of the masts at three Pilot/building sites

Document:
Structural analysis and design of the masts at three Pilot/building sites Author:
SOLUTE Version: 6
Reference: D6.1 Date: 15/12/15
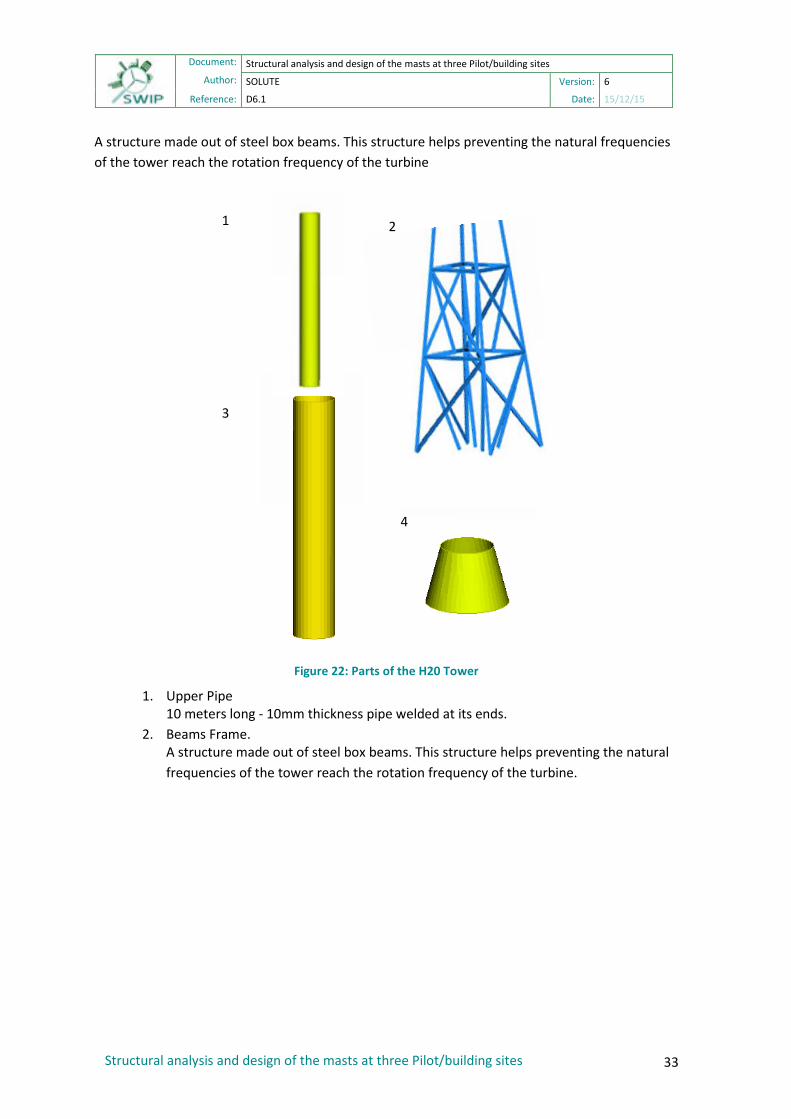
3.3 Components description. The assembly of the tower is depicted in the figures below. It is composed by four main parts.
5. Upper Tube 6. Beams frame. 7. Lower Tube 8. Cone connector
5. Superior Pipe A welded pipe of 10 meters high and 10mm thickness
6. Beam Structure
32 Structural analysis and design of the masts at three Pilot/building sites
Document:
Structural analysis and design of the masts at three Pilot/building sites Author:
SOLUTE Version: 6
Reference: D6.1 Date: 15/12/15
A structure made out of steel box beams. This structure helps preventing the natural frequencies of the tower reach the rotation frequency of the turbine
Figure 22: Parts of the H20 Tower
1. Upper Pipe 10 meters long - 10mm thickness pipe welded at its ends.
2. Beams Frame. A structure made out of steel box beams. This structure helps preventing the natural frequencies of the tower reach the rotation frequency of the turbine.
1
4
2
3
33 Structural analysis and design of the masts at three Pilot/building sites

Document:
Structural analysis and design of the masts at three Pilot/building sites Author:
SOLUTE Version: 6
Reference: D6.1 Date: 15/12/15
Figure 23: Beams frame section dimensions
3. Inferior Pipe 12 meters long - 10mm thickness pipe welded at its ends. 4. Cone connector A steel transition part between both pipes diameters.
3.4 Material PropertiesMaterial considered in analysis is S235 JR steel. Properties considered are shown in table below.
Steel S235JR
E (MPa) 21000
fy (MPa) 235
Tensile Stress (Mpa) 360
Table 18: Material Properties
3.5 Safety factors. Material properties are affected by the safety factors expressed in the figure below.
Safety factor Steel
Extreme 1.1
Fatigue ( ) 1.265
Table 19: Material safety factors according to IEC61400-2 Wind Turbines Part 2
120mm
120mm
th = 12mm
34 Structural analysis and design of the masts at three Pilot/building sites

Document:
Structural analysis and design of the masts at three Pilot/building sites Author:
SOLUTE Version: 6
Reference: D6.1 Date: 15/12/15
3.6 Load cases Two scenarios are verified:
• Extreme load cases
• Modal analysis
These load cases have been calculated according to International Standard- IEC 61400-2 specific for small wind turbines. Wind turbine extreme loading cases were selected, and are shown in the figure below.
LOAD CASE Description
A Normal operation
B Yawing
C Yaw error
D Maximum thrust
E Maximum rotational speed
F Short at Load Connection
G Shutdown (Braking)
H Extreme Wind Loading
I Parked Wind Loading, Maximum Exposure Table 20: Load Cases
ENVELOPE Loads (Nm, N)
Load case My Mx Fx
Case A 56475.78
Case G 119616.12
Case D 10390.82
Fatigue 4535.15 2461.99 5102.04
Table 21: Dimensioning Load Cases
3.7 FEM model description Two FEM model are used, being the difference between them the kind of element employed for the beams frame. The modal analysis is performed including beam type elements for this part. Static analysis uses instead shell type elements allowing a good definition of the geometry of the box section of the frame at its middle surface. This yields a more detailed and accurate view of the stresses over this part.
35 Structural analysis and design of the masts at three Pilot/building sites
Document:
Structural analysis and design of the masts at three Pilot/building sites Author:
SOLUTE Version: 6
Reference: D6.1 Date: 15/12/15
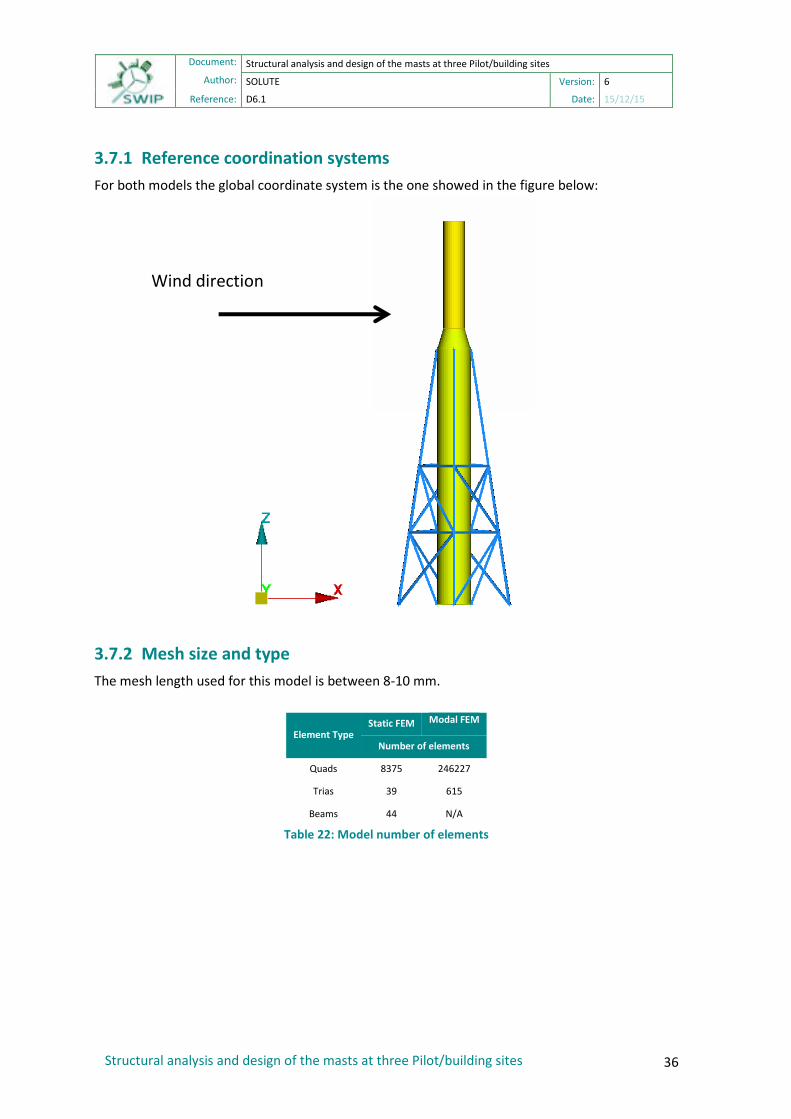
3.7.1 Reference coordination systems For both models the global coordinate system is the one showed in the figure below:
3.7.2 Mesh size and type The mesh length used for this model is between 8-10 mm.
Element Type Static FEM Modal FEM
Number of elements
Quads 8375 246227
Trias 39 615
Beams 44 N/A
Table 22: Model number of elements
Wind direction
36 Structural analysis and design of the masts at three Pilot/building sites

Document:
Structural analysis and design of the masts at three Pilot/building sites Author:
SOLUTE Version: 6
Reference: D6.1 Date: 15/12/15
Figure 24: View of FEM models: Left: frame with beam elements, right: shell elements are used instead.
Figure 25: Mesh of the FEM Models. Left: frame with beam elements, right: shell elements are used
instead.
37 Structural analysis and design of the masts at three Pilot/building sites

Document:
Structural analysis and design of the masts at three Pilot/building sites Author:
SOLUTE Version: 6
Reference: D6.1 Date: 15/12/15
3.7.3 Assembly
3.7.3.1Constrains For the implementation of the loads and restrictions needed for the FEM analysis there are some constraints implemented in the model. A coupling constrain over all the nodes at the top of the tower, represents the load way through the structure. The reference node is located where the loads are calculated: the position of the first bearing of the main shaft.
Figure 26: Load constrain at first bearing interface location
An additional constrain link the mass element to the top of the tower.
FIRST BEARING INTERFACE
38 Structural analysis and design of the masts at three Pilot/building sites

Document:
Structural analysis and design of the masts at three Pilot/building sites Author:
SOLUTE Version: 6
Reference: D6.1 Date: 15/12/15
Figure 27: Mass constrain
A constrain at the bottom of the model links all the nodes at the base of the tower and the beams frame to the boundary restriction of the ground in all degrees of freedom, representing the foundation of the windturbine.
Figure 28: Boundary constrain
MASS ELEMENT
BOUNDARY CONDITION
39 Structural analysis and design of the masts at three Pilot/building sites

Document:
Structural analysis and design of the masts at three Pilot/building sites Author:
SOLUTE Version: 6
Reference: D6.1 Date: 15/12/15
3.7.3.2Boundary conditions The only boundary condition added to this model restricts all degrees of freedom at the nodes that are in contact with the ground.
3.7.3.3Mass element To represent the components that are placed over the tower a mass element is defined with a representative mass at least equal to the mass of those components. ABAQUS allows to define a point mass with an estimated representative mass of 1500kg.
3.8 Hypothesis & Calculation Methodology
3.8.1 General stress calculation The margin of safety of all the parts made up of shells elements is calculated with the maximum allowable stress value for each component.
1..max,
, −=VonMises
yieldallowableSMss
Von Mises stress is obtained directly from the output file of the FE model.
3.8.2 Natural frequencies calculation There is a common problem among wind turbines that affect many of its components, usually the one that determines its apparition is the tower. This problem arises when the natural frequency of tower components matches or passes by the same as the rotation frequency of the blades. That is why this kind of study is very important for this component of the turbine. The frequency that affect the turbine components are:
1P frequency, contribution of one of the rotation of each blade,
3P, contribution of the sum of the three blades.
As the wind speed rises, the rotation speed also increases, thus the frequency increases from zero to the extreme wind case. So the design of each component needs to have its natural frequency above the working values of the rotation frequencies 1P and 3P. This is represented in a Campbell diagram, as shown below. Results of frequency analysis are evaluated in this diagram.
40 Structural analysis and design of the masts at three Pilot/building sites

Document:
Structural analysis and design of the masts at three Pilot/building sites Author:
SOLUTE Version: 6
Reference: D6.1 Date: 15/12/15
Figure 29: Campbell diagram for turbine design
3.8.3 Weld AnalysisThe method of global analysis is elastic distribution of loads over the welds joining parts. The behavior of the joints is determined in accordance with EC3 section 5 (see Ref. 3). For elastic global analysis, the joints should be classified according to their rotational stiffness. The joints of the hub under study are classified as rigid. With that classification, the type of joint model is continuous (see EC3 table 5.1). This means that joints in the FEM model are not simple (which means not transmission of moments), nor semi-continuous (which would imply that the joint stiffness should be included in the FEM model). The following table summarizes the approach followed:
Static analysis Fatigue Analysis
Full penetration Not Required At TOEs nominal - Detail Category 100
s geometric (HOT-SPOT)
Fillet weld According to Ref 1At TOE s geometric (HOT-SPOT)
At ROOT s nominal - Detail Category 90
Table 23: Fatigue joint classification
3.8.3.1Ultimate strength analysis The static strength of welded joints is analyzed according to Ref. 3
41 Structural analysis and design of the masts at three Pilot/building sites

Document:
Structural analysis and design of the masts at three Pilot/building sites Author:
SOLUTE Version: 6
Reference: D6.1 Date: 15/12/15
The distribution of forces is calculated on the assumption of elastic behavior. Two types of welds are found in the structure:
Full penetration butt welds are not analyzed from a static strength point of view, since the design resistance is at least equal to the design resistance of the weaker of the parts connected. Fillet welds are analyzed according to the directional method specified in Ref. 4 section 4.5.3.2. In this method, the forces transmitted by a unit length of weld lead to the following stresses on the throat section:
Figure 30: Fillet weld stresses
Where: σ┴ is the normal stress perpendicular to the throat σ|| is the normal stress parallel to the axis of the weld τ┴ is the shear stress (in the plane of the throat) perpendicular to the axis of the weld τ|| is the shear stress (in the plane of the throat) parallel to the axis of the weld The design resistance of the fillet weld is sufficient if the following two conditions are satisfied: [σ┴
2 + 3 (τ┴2 + τ||
2)]0.5 ≤ fu / (βw ϒM2) σ┴ ≤ fu / ϒM2
Where: fu is the nominal ultimate tensile strength of the weaker part joined βw = 0.9, taken from Ref.1 table 4.1 for S355 steel. From a planar projection of the weld throats, it is calculated: A = area Iyy = Axis Y moment of inertia Izz = Axis Z moment of inertia I0 = Iyy + Izz Calculate the loads at welds centre of gravity: Fx, Fy, Fz, Mx, My, Mz
42 Structural analysis and design of the masts at three Pilot/building sites

Document:
Structural analysis and design of the masts at three Pilot/building sites Author:
SOLUTE Version: 6
Reference: D6.1 Date: 15/12/15
Calculate stresses in joint coordinate frame according to the following expressions: Fx -> σx = Fx / A Fy -> σy = Fy / A Fz -> σz = Fz / A Mx -> σy = - Mx / I0 · z σz = Mx / I0 · y My -> σx = My / Iyy · z Mz -> σx = - Mz / Izz · y Finally, weld throat stresses are calculated:
2
1
┴
┴
┴ = (2 – 1) / √2┴ = (2+ 1) / √2|| = 3
Figure 31: Weld throat stresses calculation
3.8.3.2Fatigue strength analysis The fatigue loads are provided in terms of an equivalent stress range at 1E07 cycles. The distribution of forces is calculated on the assumption of elastic behavior. For this kind of analysis we use the FEM weld toe behavior described in Ref. 2. It presents the following remarkable points:
• FE model must follow modelization guidelines as explained in Ref. [2]. Weld seam not being modelled.
• Reference stresses are taken at mid-edge nodes at first and second elements from weld toe, i.e. at 0.4 t and 1.0 t, being t the thickness of the plate, as shown in Figure below for type-A weld location. When type-B, nodes are placed as shown in the next figure.
• Nominal Geometric stress obtained from extrapolation until structural intersection point.
43 Structural analysis and design of the masts at three Pilot/building sites
Document:
Structural analysis and design of the masts at three Pilot/building sites Author:
SOLUTE Version: 6
Reference: D6.1 Date: 15/12/15
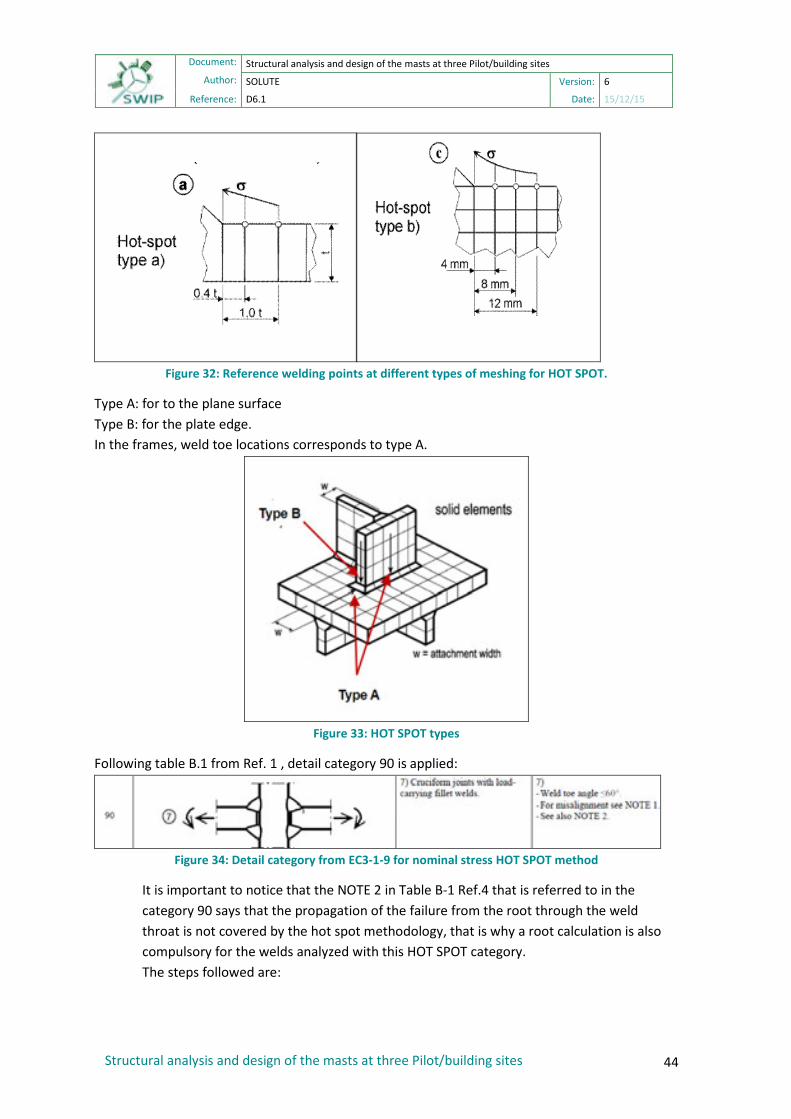
Figure 32: Reference welding points at different types of meshing for HOT SPOT.
Type A: for to the plane surface Type B: for the plate edge. In the frames, weld toe locations corresponds to type A.
Figure 33: HOT SPOT types
Following table B.1 from Ref. 1 , detail category 90 is applied:
Figure 34: Detail category from EC3-1-9 for nominal stress HOT SPOT method
It is important to notice that the NOTE 2 in Table B-1 Ref.4 that is referred to in the category 90 says that the propagation of the failure from the root through the weld throat is not covered by the hot spot methodology, that is why a root calculation is also compulsory for the welds analyzed with this HOT SPOT category. The steps followed are:
44 Structural analysis and design of the masts at three Pilot/building sites

Document:
Structural analysis and design of the masts at three Pilot/building sites Author:
SOLUTE Version: 6
Reference: D6.1 Date: 15/12/15
• Stress range is calculated as absolute difference of Major and Minor principal stresses between the subcases of each fatigue load case.
• The plot colored contour allows discriminating visually the worst areas that are to be analyzed. This is done for each load case.
• At these areas, the directions of the principal stresses are checked, so that they remain perpendicular to the weld and can therefore be taken into account. Otherwise, they would be obviated from the analysis.
• Extrapolation as per Ref 1, leads to the hot spot stress value to be compared to detail category, and determination of Damage.
45 Structural analysis and design of the masts at three Pilot/building sites

Document:
Structural analysis and design of the masts at three Pilot/building sites Author:
SOLUTE Version: 6
Reference: D6.1 Date: 15/12/15
4 Conclusions
4.1 Results In this section the results from the structural analysis from the FEM model are shown. Summarizing, the structure proved to bear extreme loads from the considered load cases. No stresses are above the yield limit of the material, meaning that the structure will remain under the elastic zone of the material behavior. Natural frequencies remain above excitation frequencies, meaning that no modal response is possible to happen in the expected operational conditions, and therefore, no dynamic excitation of the stress response of the structure is likely to happen.
4.1.1 Wind turbine V2
4.1.1.1Static Load Case The von Mises Stress is shown for the loading case.
4.1.1.1.1 Load Case 1 Gravity
Figure 35: Gravity Load case. Displacements (m). Scale factor: 100.
46 Structural analysis and design of the masts at three Pilot/building sites

Document:
Structural analysis and design of the masts at three Pilot/building sites Author:
SOLUTE Version: 6
Reference: D6.1 Date: 15/12/15
Figure 36: Gravity Load case. Von Mises stress (MPa).
Figure 37: Highest stress node Gravity Load case. Von Mises stress (MPa).
Stress Value (MPa)
Admissible 255 Max stress 13
Margin of safety 18
47 Structural analysis and design of the masts at three Pilot/building sites
Document:
Structural analysis and design of the masts at three Pilot/building sites Author:
SOLUTE Version: 6
Reference: D6.1 Date: 15/12/15
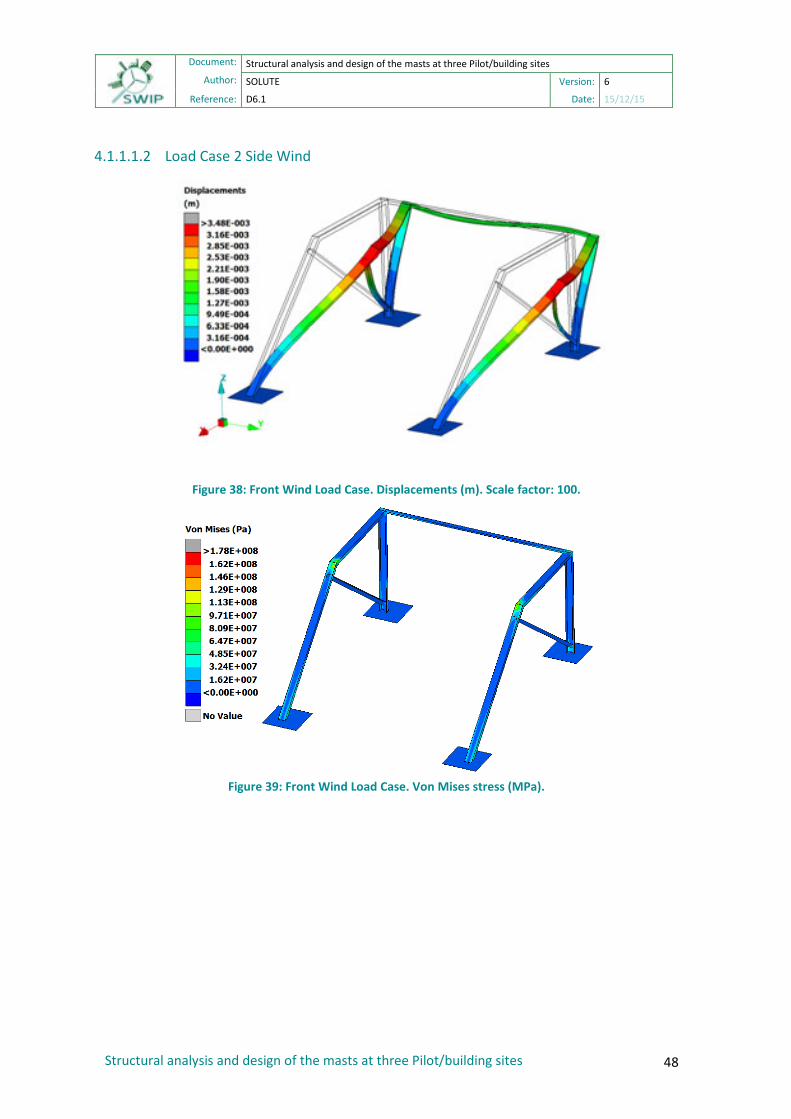
4.1.1.1.2 Load Case 2 Side Wind
Figure 38: Front Wind Load Case. Displacements (m). Scale factor: 100.
Figure 39: Front Wind Load Case. Von Mises stress (MPa).
48 Structural analysis and design of the masts at three Pilot/building sites
Document:
Structural analysis and design of the masts at three Pilot/building sites Author:
SOLUTE Version: 6
Reference: D6.1 Date: 15/12/15
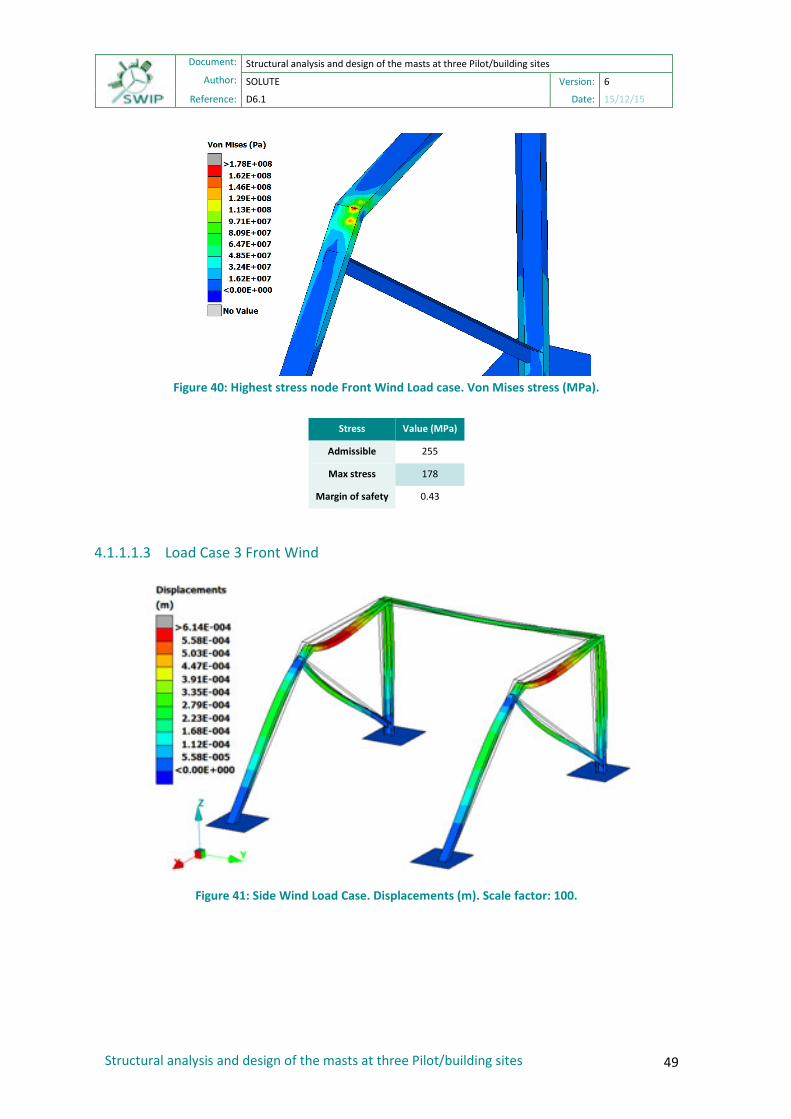
Figure 40: Highest stress node Front Wind Load case. Von Mises stress (MPa).
Stress Value (MPa)
Admissible 255
Max stress 178
Margin of safety 0.43
4.1.1.1.3 Load Case 3 Front Wind
Figure 41: Side Wind Load Case. Displacements (m). Scale factor: 100.
49 Structural analysis and design of the masts at three Pilot/building sites

Document:
Structural analysis and design of the masts at three Pilot/building sites Author:
SOLUTE Version: 6
Reference: D6.1 Date: 15/12/15
Figure 42: Side Wind Load Case. Von Mises stress (MPa).
Figure 43: Highest stress node Side wind Load case. Von Mises stress (MPa).
Stress Value (MPa)
Admissible 255 Max stress 46
Margin of safety 4.5
4.1.1.2 Lowest natural frequency. The lowest frequency eigenvalue is extracted ant its natural frequency and mode is shown in the figures below.
50 Structural analysis and design of the masts at three Pilot/building sites

Document:
Structural analysis and design of the masts at three Pilot/building sites Author:
SOLUTE Version: 6
Reference: D6.1 Date: 15/12/15
Figure 44: First Natural Frequency mode shape.
11.25 Hz
11.25 Hz
51 Structural analysis and design of the masts at three Pilot/building sites

Document:
Structural analysis and design of the masts at three Pilot/building sites Author:
SOLUTE Version: 6
Reference: D6.1 Date: 15/12/15
The values of the natural frequencies are:
Natural Frequency Cycles/time (Hz)
N_FR_1 11.25
Table 24: Natural Frequencies of the model This frequency remains above the highest operation frequency, as it can be appreciated in the Campbell diagram.
4.1.1.3 Reaction forces Reaction forces transmitted to the building are evaluated from the output of the FEM results.
RF 4
RF 3
RF 2
RF 1
52 Structural analysis and design of the masts at three Pilot/building sites
Document:
Structural analysis and design of the masts at three Pilot/building sites Author:
SOLUTE Version: 6
Reference: D6.1 Date: 15/12/15
4.1.1.3.1 Load case 1 Gravity
DOF
Fx Fy Fz Mx My Mz
RF 1 681.8 16.83 953.9 -40.33 53.81 36.35
RF 2 -674.8 0 -854.3 -29.28 -32.07 -29.75
RF 3 -443.3 -5.11 640 17.8 -19.58 16.83
RF 4 436.3 -11.66 753.8 24.52 27.48 -15.34
Table 25: Reaction Force Load Case 1
4.1.1.3.2 Load Case 2 Side Wind
DOF
Fx Fy Fz Mx My Mz
RF 1 369.8 -564.2 573.3 587.1 47.97 -7.6
RF 2 -378.9 -1138 592.9 809.3 -11.37 751.3
RF 3 -731.5 -1128 885.1 849.6 -42.82 792.7
RF 4 740.6 -546.4 1154 590 -4.75 -82.43
Table 26: Reaction Force Load Case 2
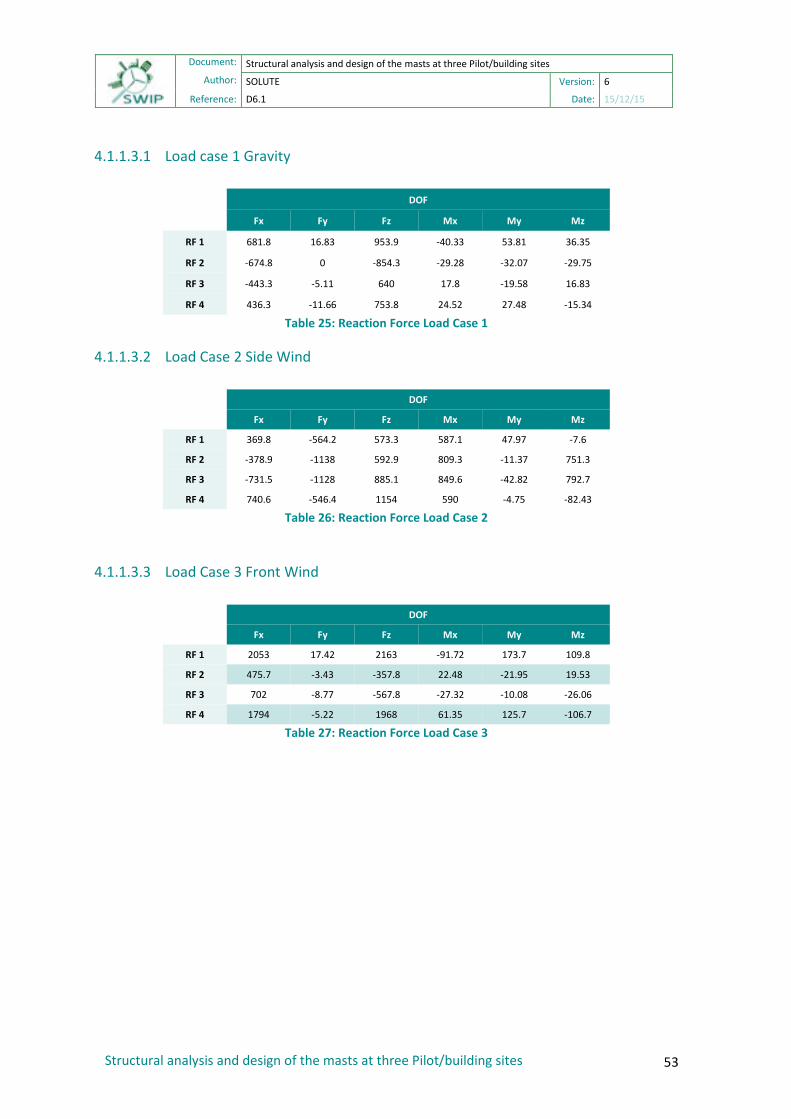
4.1.1.3.3 Load Case 3 Front Wind
DOF
Fx Fy Fz Mx My Mz
RF 1 2053 17.42 2163 -91.72 173.7 109.8
RF 2 475.7 -3.43 -357.8 22.48 -21.95 19.53
RF 3 702 -8.77 -567.8 -27.32 -10.08 -26.06
RF 4 1794 -5.22 1968 61.35 125.7 -106.7
Table 27: Reaction Force Load Case 3
53 Structural analysis and design of the masts at three Pilot/building sites

Document:
Structural analysis and design of the masts at three Pilot/building sites Author:
SOLUTE Version: 6
Reference: D6.1 Date: 15/12/15
4.1.2 Wind turbine H4
4.1.2.1Static load case The von Mises Stress is shown for each loading case.
4.1.2.1.1 Load Case A: Max. My
Figure 45: Max My Loading Case. Dispalcements (m). Scale factor: 800.
Figure 46: Max My Loading Case. Von Mises stress (Pa).
54 Structural analysis and design of the masts at three Pilot/building sites

Document:
Structural analysis and design of the masts at three Pilot/building sites Author:
SOLUTE Version: 6
Reference: D6.1 Date: 15/12/15
Figure 47: Detail Max My case. Von Mises stress (Pa).
Stress Value (MPa)
Admissible 255 Max stress 9.45
Margin of safety 25.98
4.1.2.1.2 Load Case G: Max. Mx
Figure 48:Von Misses Max Mx. Displacements (m). Scale factor: 800.
55 Structural analysis and design of the masts at three Pilot/building sites

Document:
Structural analysis and design of the masts at three Pilot/building sites Author:
SOLUTE Version: 6
Reference: D6.1 Date: 15/12/15
Figure 49: Max Mx Loading Case.. Von Mises stress (Pa).
Figure 50: Detail Case Max Mx. Von Mises stress (Pa).
Stress Value (MPa)Admissible 255 Max stress 5.25
Margin of safety 47.57
56 Structural analysis and design of the masts at three Pilot/building sites
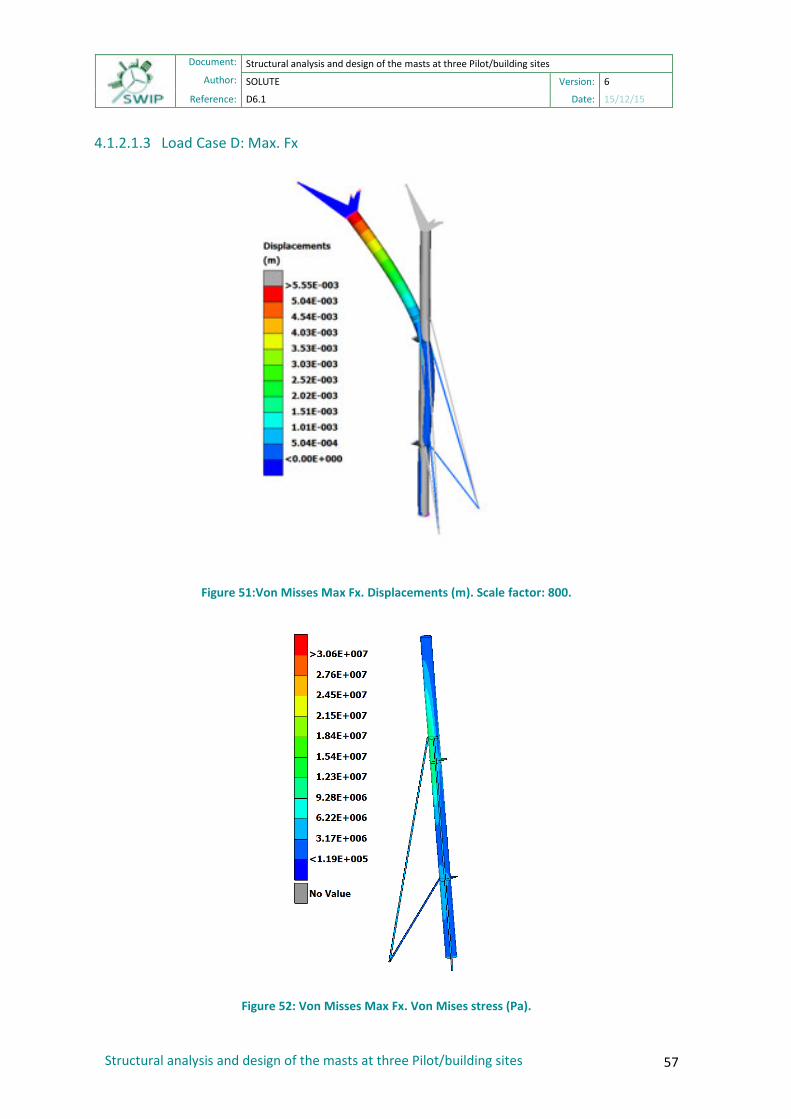
Document:
Structural analysis and design of the masts at three Pilot/building sites Author:
SOLUTE Version: 6
Reference: D6.1 Date: 15/12/15
4.1.2.1.3 Load Case D: Max. Fx
Figure 51:Von Misses Max Fx. Displacements (m). Scale factor: 800.
Figure 52: Von Misses Max Fx. Von Mises stress (Pa).
57 Structural analysis and design of the masts at three Pilot/building sites
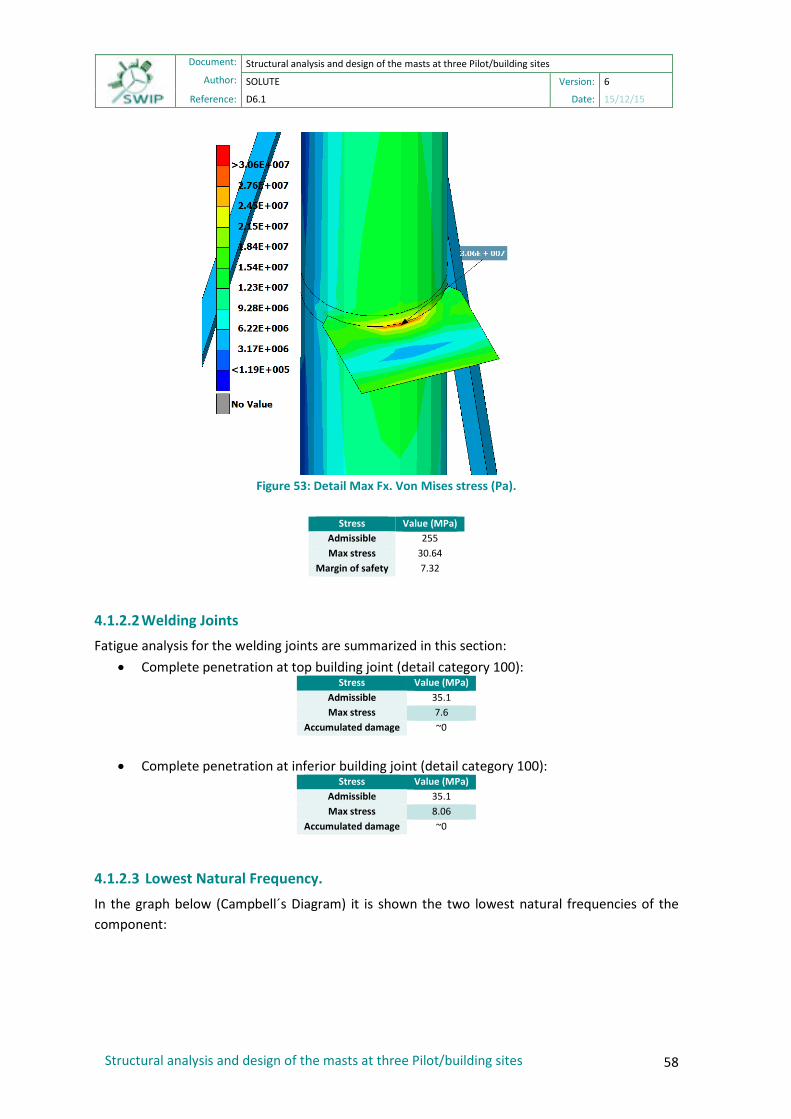
Document:
Structural analysis and design of the masts at three Pilot/building sites Author:
SOLUTE Version: 6
Reference: D6.1 Date: 15/12/15
Figure 53: Detail Max Fx. Von Mises stress (Pa).
Stress Value (MPa)
Admissible 255 Max stress 30.64
Margin of safety 7.32
4.1.2.2Welding Joints Fatigue analysis for the welding joints are summarized in this section:
• Complete penetration at top building joint (detail category 100): Stress Value (MPa)
Admissible 35.1Max stress 7.6
Accumulated damage ~0
• Complete penetration at inferior building joint (detail category 100):
Stress Value (MPa) Admissible 35.1Max stress 8.06
Accumulated damage ~0
4.1.2.3 Lowest Natural Frequency. In the graph below (Campbell´s Diagram) it is shown the two lowest natural frequencies of the component:
58 Structural analysis and design of the masts at three Pilot/building sites

Document:
Structural analysis and design of the masts at three Pilot/building sites Author:
SOLUTE Version: 6
Reference: D6.1 Date: 15/12/15
Figure 54: Campbell´s Diagram
The values of the natural frequencies are:
Natural Frequency Cycles/time (Hz)
N_FR_1 6.28
N_FR_2 6.29
Table 28: Natural Frequencies of the model
59 Structural analysis and design of the masts at three Pilot/building sites

Document:
Structural analysis and design of the masts at three Pilot/building sites Author:
SOLUTE Version: 6
Reference: D6.1 Date: 15/12/15
Figure 55:First natural frequency displacement (front view)
The first natural frequency of the structure produces a displacement in the structure along the plane shown in the figure 22. Beams at both sides of the structure prevent this scenario to take place during the working frequencies of the turbine.
Table 29: Second natural frequency displacement (side view) The second natural frequency produces a displacement at a perpendicular plane to the one of the first natural frequency. The angle of the beams and the connections to the building prevents the
60 Structural analysis and design of the masts at three Pilot/building sites
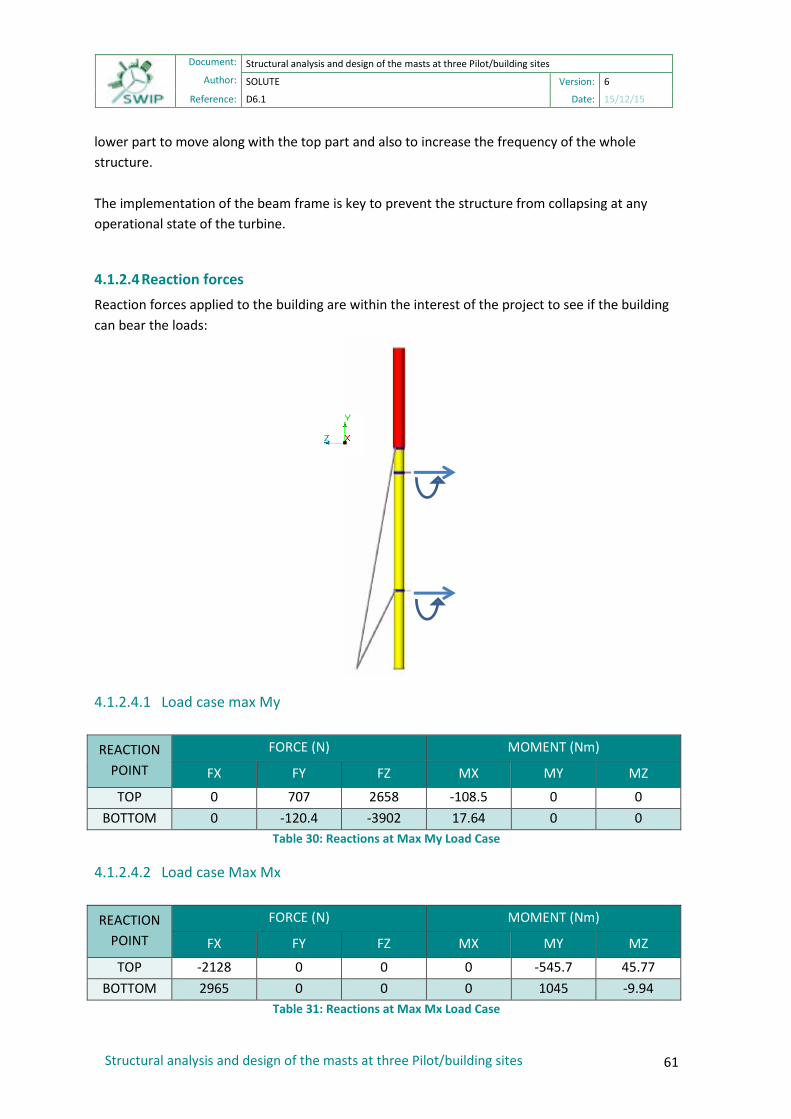
Document:
Structural analysis and design of the masts at three Pilot/building sites Author:
SOLUTE Version: 6
Reference: D6.1 Date: 15/12/15
lower part to move along with the top part and also to increase the frequency of the whole structure. The implementation of the beam frame is key to prevent the structure from collapsing at any operational state of the turbine.
4.1.2.4Reaction forces Reaction forces applied to the building are within the interest of the project to see if the building can bear the loads:
4.1.2.4.1 Load case max My
REACTION POINT
FORCE (N) MOMENT (Nm)
FX FY FZ MX MY MZ
TOP 0 707 2658 -108.5 0 0 BOTTOM 0 -120.4 -3902 17.64 0 0
Table 30: Reactions at Max My Load Case
4.1.2.4.2 Load case Max Mx
REACTION POINT
FORCE (N) MOMENT (Nm)
FX FY FZ MX MY MZ
TOP -2128 0 0 0 -545.7 45.77 BOTTOM 2965 0 0 0 1045 -9.94
Table 31: Reactions at Max Mx Load Case
61 Structural analysis and design of the masts at three Pilot/building sites

Document:
Structural analysis and design of the masts at three Pilot/building sites Author:
SOLUTE Version: 6
Reference: D6.1 Date: 15/12/15
4.1.2.4.3 Load Case Max Fx
REACTION POINT
FORCE (N) MOMENT (Nm)
FX FY FZ MX MY MZ
TOP 0 4041 2.912E+04 -619.4 3.3 0 BOTTOM 0 -681 -2.212E+04 99.8 -3.2 0
Table 32: Reactions at Max Fx Load Case
4.1.3 Wind turbine H20
4.1.3.1Static load case Von Mises Stress is analyzed for each loading case.
4.1.3.1.1 Load Case A: Max. My
Figure 56: Max My Loading Case. Displacements (m). Scale factor = 1000
62 Structural analysis and design of the masts at three Pilot/building sites

Document:
Structural analysis and design of the masts at three Pilot/building sites Author:
SOLUTE Version: 6
Reference: D6.1 Date: 15/12/15
Figure 57: Max My Loading Case. Von Mises stress (Pa).
Figure 58: Detail Max My case. Von Mises stress (Pa).
Stress Value (MPa)
Admissible 255Max stress 25
Margin of safety 9.2
Table 33:Margin of safety Max My case
63 Structural analysis and design of the masts at three Pilot/building sites
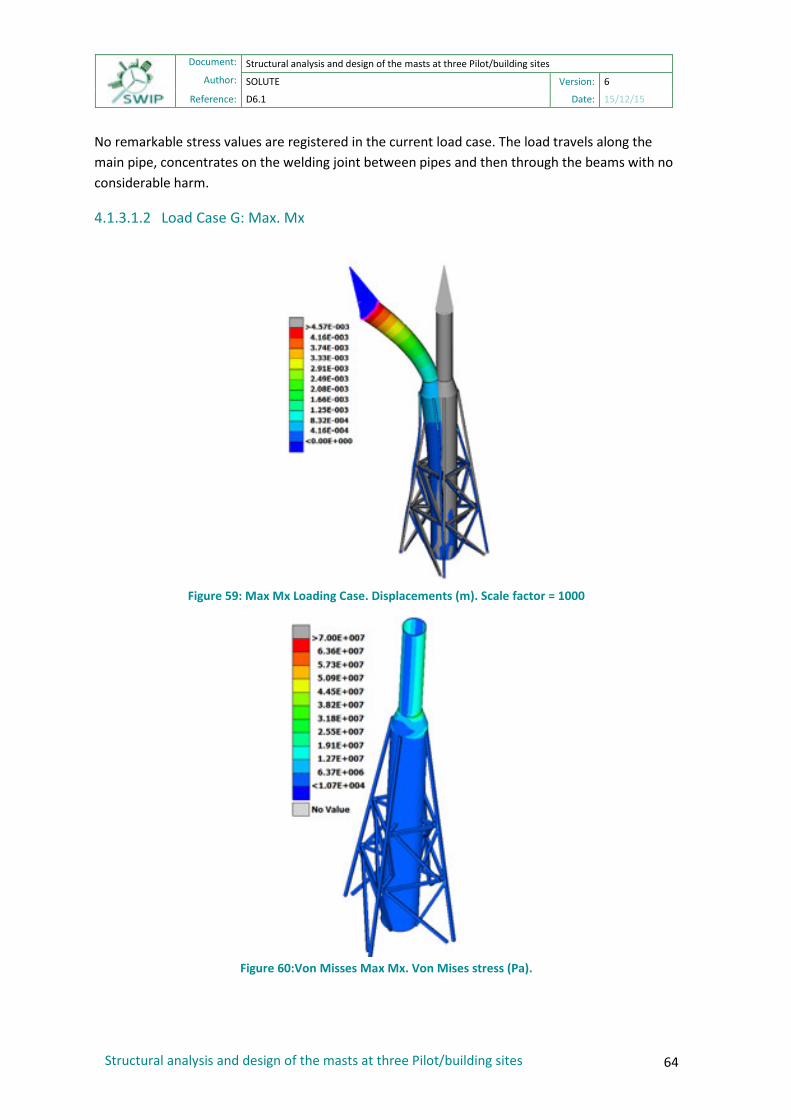
Document:
Structural analysis and design of the masts at three Pilot/building sites Author:
SOLUTE Version: 6
Reference: D6.1 Date: 15/12/15
No remarkable stress values are registered in the current load case. The load travels along the main pipe, concentrates on the welding joint between pipes and then through the beams with no considerable harm.
4.1.3.1.2 Load Case G: Max. Mx
Figure 59: Max Mx Loading Case. Displacements (m). Scale factor = 1000
Figure 60:Von Misses Max Mx. Von Mises stress (Pa).
64 Structural analysis and design of the masts at three Pilot/building sites

Document:
Structural analysis and design of the masts at three Pilot/building sites Author:
SOLUTE Version: 6
Reference: D6.1 Date: 15/12/15
Figure 61: Detail Case Max Mx. Von Mises stress (Pa).
Stress Value (MPa)
Admissible 255 Max stress 59.2
Margin of safety 3.3
Table 34: Margin of safety Max Mx case This is the worst case scenario of the three main loading cases, from the stress point of view. The calculations detect low stress values along the whole structure. The highest stress value is concentrated in the joint between the cone and the superior pipe which in depth analysis is covered in the next paragraph.
65 Structural analysis and design of the masts at three Pilot/building sites
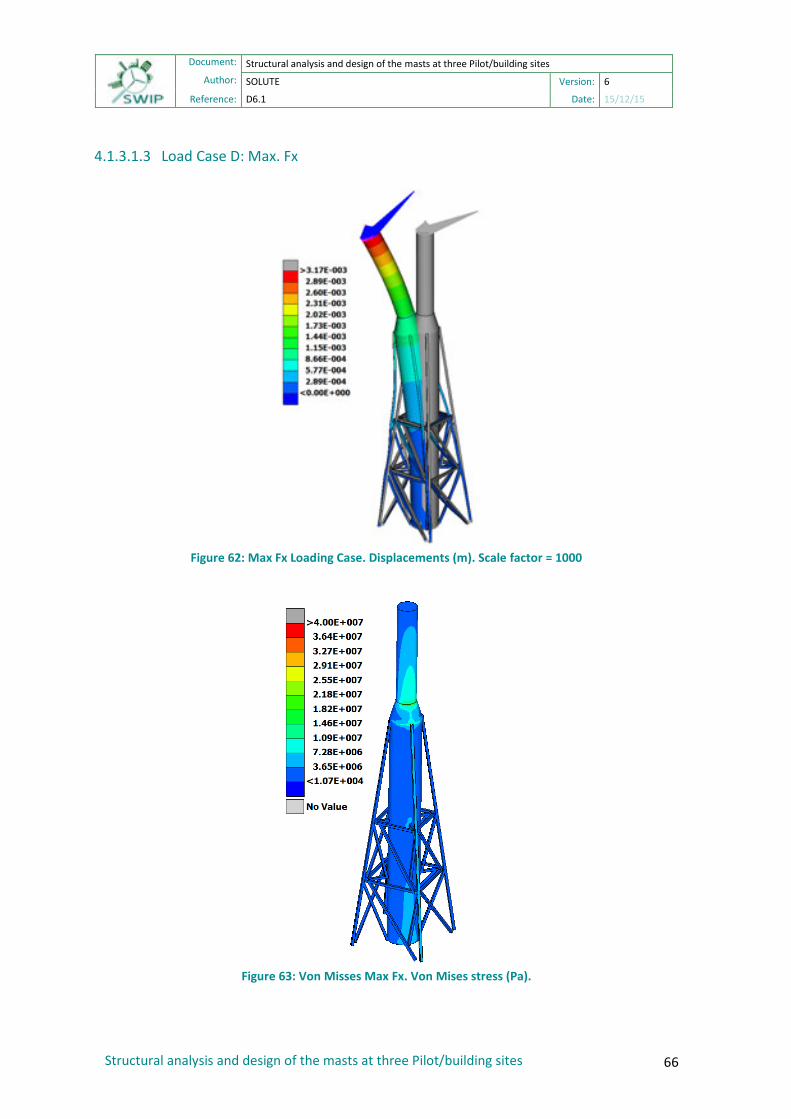
Document:
Structural analysis and design of the masts at three Pilot/building sites Author:
SOLUTE Version: 6
Reference: D6.1 Date: 15/12/15
4.1.3.1.3 Load Case D: Max. Fx
Figure 62: Max Fx Loading Case. Displacements (m). Scale factor = 1000
Figure 63: Von Misses Max Fx. Von Mises stress (Pa).
66 Structural analysis and design of the masts at three Pilot/building sites

Document:
Structural analysis and design of the masts at three Pilot/building sites Author:
SOLUTE Version: 6
Reference: D6.1 Date: 15/12/15
Figure 64: Detail Max Fx. Von Mises stress (Pa).
Stress Value (MPa)
Admissible 255 Max stress 32.2
Margin of safety 6.9
Table 35: Margin of safety Max Fx case This loading case of maximum thrust pusses the structure backwards and lays all the stress again at the joint of the two pipes. No harm in any part of the structure is shown by the calculation, reaching a value of 32.2 Mpa at the highest point.
4.1.3.2 Welding Joints For the welding joints we´ve included the extreme loading test to the fillet welding joints in the static load cases. As they are part of the global model there is no doubt that those parts can bear the loads that reach them, otherwise the Von Misses analysis would have revealed a tension concentration in those parts. So in this section the fatigue test for the welding joints will be presented.
• Complete penetration weld between cone and superior pipe (detail category 100): •
Stress Value (MPa) Admissible 35.1Max stress 16.71
Accumulated damage ~0
Table 36: Superior Pipe weld calculation • Complete penetration weld between cone and inferior pipe (detail category 100):
67 Structural analysis and design of the masts at three Pilot/building sites

Document:
Structural analysis and design of the masts at three Pilot/building sites Author:
SOLUTE Version: 6
Reference: D6.1 Date: 15/12/15
Stress Value (MPa)
Admissible 35.1Max stress 8.06
Accumulated damage ~0
Table 37: Inferior pipe weld calculation
4.1.3.3Lowest Natural Frequency. In the graph below (Campbell´s Diagram) it is shown the two lowest natural frequencies of the component:
Figure 65: Campbell´s Diagram
The values of the natural frequencies are:
Natural Frequency Cycles/time (Hz)
N_FR_1 6.244
N_FR_2 6.246
Table 38: Natural Frequencies of the model The calculation shows that the beams structure is key in the performance of this structure to prevent the structure from collapsing because of the modal excitation.
68 Structural analysis and design of the masts at three Pilot/building sites

Document:
Structural analysis and design of the masts at three Pilot/building sites Author:
SOLUTE Version: 6
Reference: D6.1 Date: 15/12/15
Figure 66: First natural frequency displacement 6.244 Hz
The first natural frequency of the structure pusses the whole model to move from one of the beams to another contained in the same plane. Without the beams this natural frequency deforms the structure in the same way but at a lower frequency, reaching the rotation frequency of the turbine.
Figure 67: Second natural frequency displacement 6.246 Hz
The deformation caused in the structure by the second natural frequency has the same shape as the first one but along a perpendicular plane. The beam structure also helps preventing this deformation at any operational state of the turbine.
69 Structural analysis and design of the masts at three Pilot/building sites

Document:
Structural analysis and design of the masts at three Pilot/building sites Author:
SOLUTE Version: 6
Reference: D6.1 Date: 15/12/15
5 References
1. International Standard- IEC 61400-2 Wind Turbines Part 2: Small wind turbines
70 Structural analysis and design of the masts at three Pilot/building sites