deliverable 6.6.4: simulations of coordinated voltage
TRANSCRIPT

- 1 -
CLEEN OY Eteläranta 10, P.O. BOX 10, FI-00131 HELSINKI, FINLAND www.cleen.fi
Deliverable 6.6.4: Simulations of coordinated voltage control methods for distribution network with several active resources
Anna Kulmala
Tampere University of Technology, Department of Electrical Energy Engineering, Finland
Table of contents
Table of contents ......................................................................................................................................... 1
1 Introduction ......................................................................................................................................... 2
2 The proposed voltage control method ................................................................................................... 2
2.1 The original algorithm .................................................................................................................. 2
2.2 The developed algorithm .............................................................................................................. 3
2.2.1 Defining voltage sensitivities ................................................................................................ 7
3 Simulations .......................................................................................................................................... 9
3.1 The simulation network ................................................................................................................ 9
3.2 Control parameters ......................................................................................................................10
3.3 Simulation sequence ....................................................................................................................11
3.4 Simulations results ......................................................................................................................11
4 Conclusions ........................................................................................................................................15
5 References ..........................................................................................................................................15

- 2 -
CLEEN OY Eteläranta 10, P.O. BOX 10, FI-00131 HELSINKI, FINLAND www.cleen.fi
1 Introduction
The connection of distributed generation (DG) to weak distribution networks is likely to cause voltage rise problems. The voltage rise problems can be mitigated using passive methods such as network reinforcement. This can, however, be quite expensive. Active voltage control can in many cases decrease the connection costs of DG significantly.
Active voltage control has been studied in Tampere University of Technology for several years and this deliverable reports the latest developments of this research. In project Adine (Active distribution network), a coordinated voltage control (CVC) algorithm was developed. This algorithm controls the substation voltage and DG reactive power based on control rules and is suitable especially for networks that contain only one DG unit. In this deliverable, the control algorithm is further developed to operate optimally also when multiple active resources are connected to the network. The deliverable will at first introduce the control algorithm of Adine project. Thereafter, the developments of the algorithm will be presented. Finally, the operation of the developed control algorithm is demonstrated using PSCAD simulations. The algorithm defined in this deliverable is not yet completely ready. The algorithm defined here aims only to keep network voltages between acceptable limits and includes no restoring parts. At a later stage of the SGEM project, also an optimizing part will be added to the algorithm.
2 The proposed voltage control method
The voltage control method has been developed based on the CVC algorithm specified in [1]. In [1] it was assumed that network maximum voltage is always located at the substation or at generator terminals and that there is no need to use DG reactive power to increase network voltage. Moreover, the algorithm in [1] does not operate optimally in situations where multiple DG units are connected to the network. In this deliverable, the algorithm is further developed to remove the above mentioned limitations.
2.1 The original algorithm
The algorithm of [1] is modular and consists of parts that control substation voltage and parts that control DG reactive power. Substation voltage control determines its control actions based on network maximum and minimum voltages. Although it does not take the location of these voltages into account, it is applicable to all kinds of networks regardless of the number or type of DG units because changing the substation voltage influences voltages in the whole distribution network similarly.
DG reactive power control determines its control actions based on generator voltage. The algorithm assumes that network maximum voltage is always located either at the substation or at generator terminals which is usually true. The algorithm uses DG reactive power only to lower network maximum voltage and, therefore, if there is a need to use DG reactive power also for increasing network voltages the algorithm should be extended.

- 3 -
CLEEN OY Eteläranta 10, P.O. BOX 10, FI-00131 HELSINKI, FINLAND www.cleen.fi
The algorithm of [1] has been tested only in networks that contain only one DG unit [1], [2]. In real networks, it is naturally possible that multiple active resources are connected to the same network. Substation voltage control operates correctly regardless of the number of active resources because substation voltage control affects the voltages of the whole distribution network. DG reactive power control affects, on the other hand, only voltages at the DG feeder. The control should, therefore, take also the location of maximum and minimum voltages into account.
In the original CVC algorithm, DG power factor control uses generator voltage as an input when the reactive power set point of the DG unit or units is determined. DG reactive power is used only to lower network maximum voltage and, therefore, network minimum voltage does not affect DG power factor set point. When the generator voltage exceeds the maximum voltage limit set for the generator, DG reactive power consumption is increased by basic power factor control. Hence, all generators whose terminal voltage oversteps the voltage control limit will react. The location of maximum voltage is, therefore, taken into account to some extent.
The control algorithm does not determine which generators would be most effective in the situation but all generators, whose control conditions are fulfilled, react. Hence, the division of reactive power between generators might not be optimal in every case. Reactive power control operates, nevertheless, logically also when multiple DG units are connected to the network and improves the network state. If some generators are preferred for reactive power control, their maximum voltage limit can be set lower than the limit of other generators in which case they will react to the voltage rise earlier.
As stated earlier, DG power factor control assumes that maximum voltage is always located either at the substation or at generator terminals. If the network contains also feeder capacitors, long cables or generators whose reactive power cannot be controlled, this assumption might not be correct. In these cases it is possible that the voltage rises above feeder voltage upper limit at some network node but remains within limits at terminals of the controllable resources. In this case, reactive power capability of the controllable resources is not utilized although it could be used to lower the maximum voltage. Hence, some control range might be left unused but, nevertheless, all algorithm operations are beneficial to the network. Without changes to the algorithm, this problem could be solved using feeder maximum voltage instead of generator voltage as an input to basic power factor control but this would lead to operation where all generators on a feeder react when voltage exceeds feeder voltage upper limit at some point on the feeder. This is not always reasonable. If there is, for instance, one generator almost at the substation and one at the end of the feeder it is not sensible to control both of them if voltage rise is too large at the end of the feeder.
In conclusion, the algorithm as such might not be optimal for use in situations where multiple active resources are connected to one distribution feeder because the reactive power division between the resources might not be optimal and because some control possibilities might be left unused. The algorithm’s effect on network voltages is, however, also with multiple resources undoubtedly positive.
2.2 The developed algorithm
The previous chapter discussed the shortcomings of the CVC algorithm determined in [1]. In this deliverable, the algorithm is further developed to overcome the limitations and to operate optimally also in the presence
- 4 -
CLEEN OY Eteläranta 10, P.O. BOX 10, FI-00131 HELSINKI, FINLAND www.cleen.fi
of multiple DG units or other active resources. Also, a new part that controls real power of active resources is added to the algorithm.
The algorithm in [1] consists of basic and restoring parts. The purpose of basic control is to restore network voltages to an acceptable level when either the network maximum or minimum voltage exceeds the feeder voltage limits. The purpose of restoring control is to restore DG power factor to unity when the network state allows it and to restore network voltages to an acceptable level when the voltages of the whole network have remained in an unusually high or low level after for instance disconnection of a DG unit. In this deliverable the basic parts of control are further developed. The restoring parts are ignored because it is planned to replace the rule based restoring control with an optimization algorithm at a later stage of SGEM project. Hence, this deliverable will cover only the operation of basic control that is the control which is activated when network voltages exceed the feeder voltage limits.
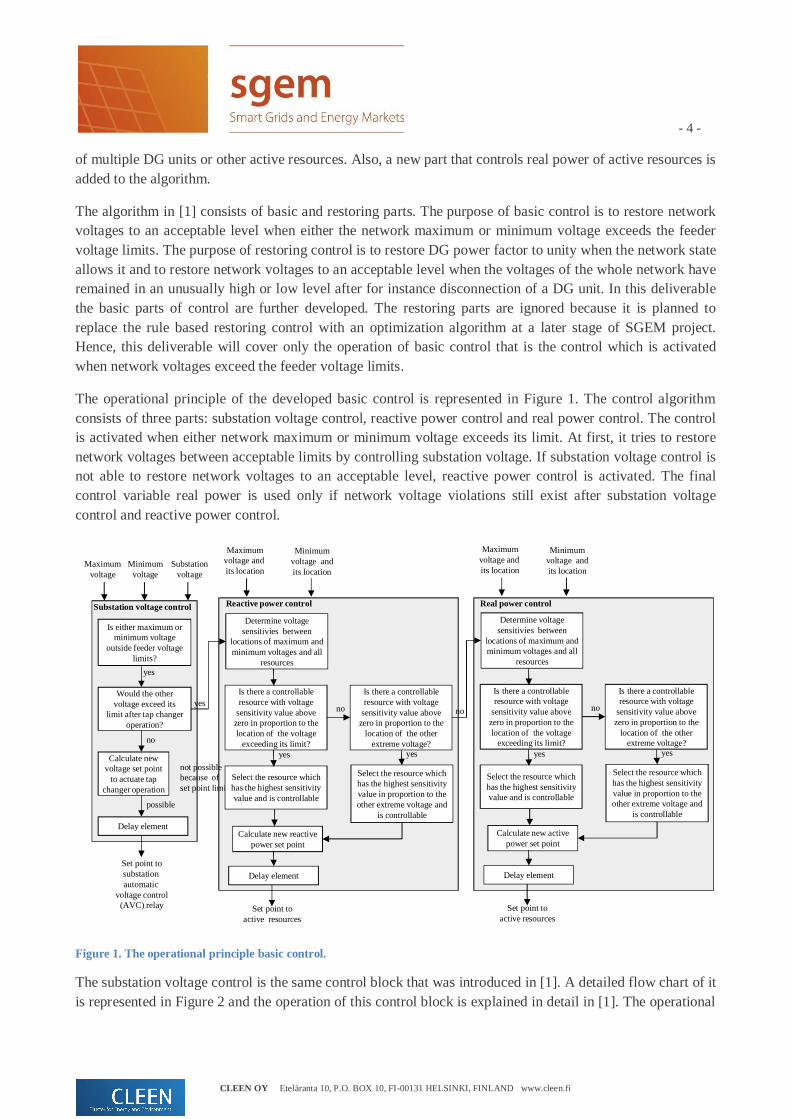
The operational principle of the developed basic control is represented in Figure 1. The control algorithm consists of three parts: substation voltage control, reactive power control and real power control. The control is activated when either network maximum or minimum voltage exceeds its limit. At first, it tries to restore network voltages between acceptable limits by controlling substation voltage. If substation voltage control is not able to restore network voltages to an acceptable level, reactive power control is activated. The final control variable real power is used only if network voltage violations still exist after substation voltage control and reactive power control.
Figure 1. The operational principle basic control.
The substation voltage control is the same control block that was introduced in [1]. A detailed flow chart of it is represented in Figure 2 and the operation of this control block is explained in detail in [1]. The operational
Is either maximum or minimum voltage
outside feeder voltage limits?
Maximumvoltage
Minimumvoltage
Calculate new voltage set point
to actuate tap changer operation
Would the other voltage exceed its
limit after tap changer operation?
no
Set point tosubstationautomatic
voltage control(AVC) relay
yes
yes
Substationvoltage
possible
not possiblebecause of set point limits
Set point toactive resources
Substation voltage controlDetermine voltage
sensitivies between locations of maximum and minimum voltages and all
resources
Select the resource which has the highest sensitivity value and is controllable
Delay element
yes
Delay element
Reactive power control
Maximumvoltage and its location
Minimumvoltage andits location
Is there a controllableresource with voltage
sensitivity value abovezero in proportion to the location of the voltage
exceeding its limit?
Select the resource whichhas the highest sensitivityvalue in proportion to the other extreme voltage and
is controllable
Calculate new reactive power set point
no
Is there a controllableresource with voltage
sensitivity value abovezero in proportion to the
location of the otherextreme voltage?
yes yes
Set point toactive resources
Determine voltage sensitivies between
locations of maximum and minimum voltages and all
resources
Select the resource which has the highest sensitivity value and is controllable
Delay element
Real power control
Maximumvoltage and its location
Minimumvoltage andits location
Is there a controllableresource with voltage
sensitivity value abovezero in proportion to the location of the voltage
exceeding its limit?
Select the resource whichhas the highest sensitivityvalue in proportion to the other extreme voltage and
is controllable
Calculate new activepower set point
no
Is there a controllableresource with voltage
sensitivity value abovezero in proportion to the
location of the otherextreme voltage?
yes
no

- 5 -
CLEEN OY Eteläranta 10, P.O. BOX 10, FI-00131 HELSINKI, FINLAND www.cleen.fi
principle is the following: If network maximum voltage exceeds feeder voltage upper limit and minimum voltage is more than a tap step above its limit, the substation voltage is decreased. Correspondingly, the substation voltage is increased if network minimum voltage is lower than feeder voltage lower limit and maximum voltage is more than a tap step below feeder voltage upper limit. If basic substation voltage control is unable to improve network state (both maximum and minimum voltages exceed or are too close to feeder voltage limits or tap changer operation cannot be initialized because of set point limits), reactive power control is activated.
Figure 2. The flow chart of substation voltage control.
A detailed flow chart of reactive power control is represented in Figure 3. The reactive power control operates only if the substation voltage control has activated it. The algorithm determines which resource to
Vmax>Vupper
Vmin>Vlower+tap
Vmin<Vlower
Vmax<Vupper-tap
yes yes
no
nono
Vrefnew = Vss+tap
The delay has elapsed
New set point Vrefnew to substation AVC relay
Obtain Vmax, Vminand Vss from
measurement or estimator
End
yes yes
|Vrefnew-Vss|>DB
Vrefnew = Vss-tap
Vrefnew Vreflower
Vrefnew = Vreflower
no
no
Delay element
yes
yes
The delay has not elapsed
|Vrefnew-Vss|>DB
Vrefnew Vrefupper
Vrefnew = Vrefupper
no
yes
yes
Activate reactive powercontrol
no no
Q control activated
Vmax>Vupper-tap-hyst
Q controlhysteresis
yes
yes
Part 1
Part 2
Part 3
Q control activated
Vmin<Vupper+tap+hyst
Q controlhysteresis
yes
yes

- 6 -
CLEEN OY Eteläranta 10, P.O. BOX 10, FI-00131 HELSINKI, FINLAND www.cleen.fi
use by using voltage sensitivities. This assures that a minimum amount of reactive power control is used to restore the network voltages between acceptable limits. The determination of voltage sensitivity values is discussed in chapter 2.2.1.
Figure 3. The flow chart of reactive power control.
At first, the reactive power control algorithm selects the active resource whose reactive power is controlled (Part 1 in Figure 3). If network maximum voltage exceeds the feeder voltage upper limit, the algorithm selects the controllable resource that has the highest voltage sensitivity value in proportion to the location of network maximum voltage. If multiple resources have the same sensitivity factor, the resource with the smallest sensitivity in proportion to its own location is selected. In this way, the resource electrically closest to the substation is selected and the distance of reactive power transfer is minimized. If there is no resource that can affect the voltage in the location of maximum voltage (i.e. all sensitivities are zero), the algorithm
Obtain Vmax and Vmin and theirlocations from measurement or
estimator
Vmax>Vupper Vmin<Vlower
yes yes
no no
Go through the sensitivity matrixcolumn that represents the sensitivitiesbetween the maximum voltage point
Vmaxloc and other network nodes
Select the node that has the highestsensitivity and is controllable (includesan active resource that is not already at
its limit)
Go through the sensitivity matrixcolumn that represents the sensitivitiesbetween the minimum voltage point
Vminloc and other network nodes
Select the node that has the highestsensitivity and is controllable (includesan active resource that is not already at
its limit)
Smax > 0
Delay element(if ss control is active willnot change the Q set point)
Qset-step < Qlowerlim
Qsetnew = Qset-step Qsetnew = Qlowerlim
noyes
yes
Vmin<Vlower+tap+hyst
no
End
yes
New set point Qsetnew to the selectedactive resource
Smax > 0
Delay element(if ss control is active willnot change the Q set point)
Qset+step > Qupperlim
Qsetnew = Qset+step Qsetnew = Qupperlim
noyes
yes
Vmax>Vupper-tap-hyst
no
yes
New set point Qsetnew to the selectedactive resource
no no
Part 1
Part 2
Activate real power control
Vmaxloc already checked?Vminloc already checked?
yes
no no
yes

- 7 -
CLEEN OY Eteläranta 10, P.O. BOX 10, FI-00131 HELSINKI, FINLAND www.cleen.fi
checks if increasing the network minimum voltage would be beneficial i.e. enable substation voltage control. If the minimum voltage is smaller that Vlower + tap + hyst, the substation voltage control cannot decrease the substation voltage. By increasing the minimum voltage, operation of substation voltage control can be enabled. The algorithm selects the controllable resource in the same way as before i.e. the resource with the highest voltage sensitivity value in proportion to the location of minimum voltage is selected. If no resource that can affect network minimum voltage is available, the reactive power control is not able to improve the network state and the real power control is activated. If minimum voltage is the one that exceeds its limit, the algorithm operates similarly but naturally selects first the resource that has the highest voltage sensitivity in proportion to the location of minimum voltage.
The second part of the algorithm (Part 2) calculates the new reactive power set point for the selected active resource. The new set point is given to the controlled resource only after a predefined delay. The conditions for set point change have to be fulfilled for the whole delay time and the delay counter is reseted when the control action is taken. If substation voltage control is active (and the reactive power control has been activated by Q control hysteresis) the reactive power set point is not changed because substation voltage control is the primary control variable.
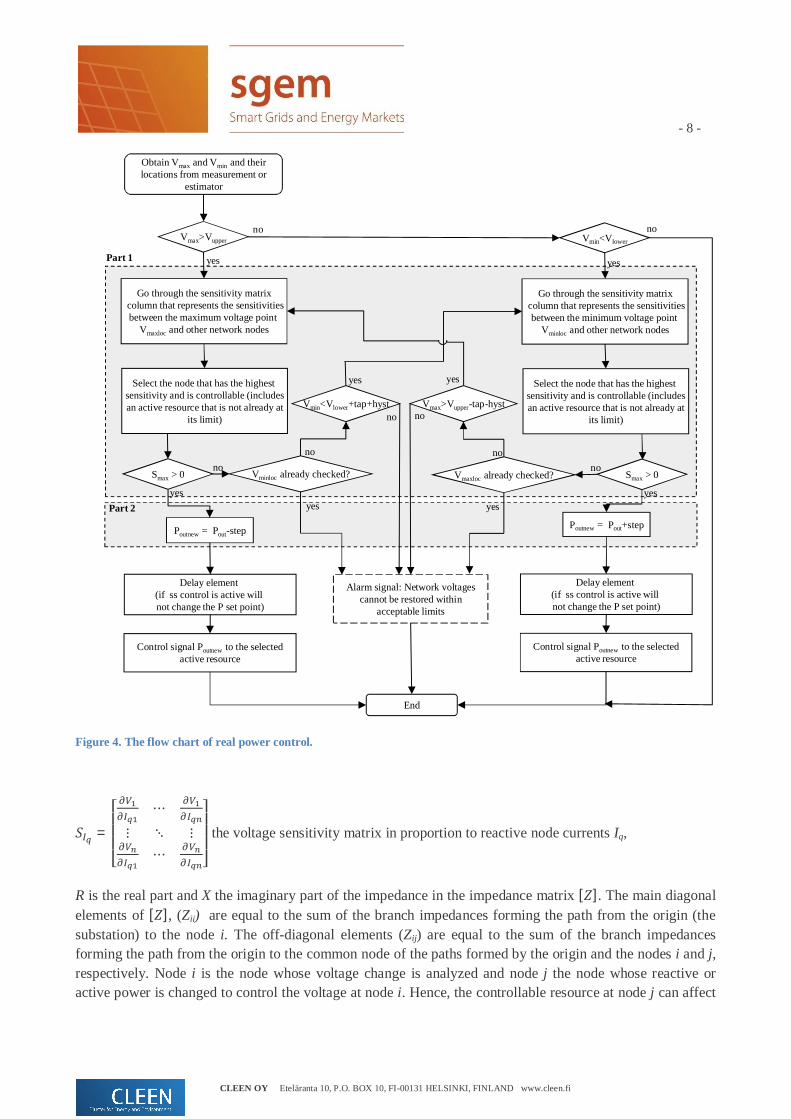
The flow chart of real power control is represented in Figure 4. The real power control is very similar to the reactive power control. The first part of the algorithm selects the controllable resource using voltage sensitivities in the same way as the resource was selected in the reactive power control. The voltage sensitivity values are naturally different for reactive and real powers but the operational principle of the first algorithm part is the same. The second part (Part 2) is a bit different because the CVC algorithm does not control the whole real power set point of the active resources but only gives commands to decrease or increase the power. This is due to the fact that the real power output of active resources (generators or loads) is in normal state determined by factors not related to voltage control (e.g. wind speed). Hence, the CVC algorithm does not control the real powers in the normal state in any way. However, when the network voltages remain outside the acceptable range despite of the substation voltage and reactive power controls, a need to control also the real power exists. The real power control outputs only signals that instruct the resources to decrease or increase their real power output.
2.2.1 Defining voltage sensitivities
The voltage sensitivities are used in the algorithm to determine which resource is used for reactive power and real power control. The sensitivities are determined by an approximate method proposed in [3]. Some simplifying assumptions have been made in the method. Constant current models are used for loads and generators and the phase difference between voltages is assumed to be negligible. As a result of these assumptions, the voltage sensitivities can be represented by the following simple equation:
[ ]
[ ]
where = the voltage sensitivity matrix in proportion to active node currents Ip,
- 8 -
CLEEN OY Eteläranta 10, P.O. BOX 10, FI-00131 HELSINKI, FINLAND www.cleen.fi
Figure 4. The flow chart of real power control.
= the voltage sensitivity matrix in proportion to reactive node currents Iq,
R is the real part and X the imaginary part of the impedance in the impedance matrix [ ]. The main diagonal elements of [ ], (Zii) are equal to the sum of the branch impedances forming the path from the origin (the substation) to the node i. The off-diagonal elements (Zij) are equal to the sum of the branch impedances forming the path from the origin to the common node of the paths formed by the origin and the nodes i and j, respectively. Node i is the node whose voltage change is analyzed and node j the node whose reactive or active power is changed to control the voltage at node i. Hence, the controllable resource at node j can affect
Obtain Vmax and Vmin and theirlocations from measurement or
estimator
Vmax>Vupper Vmin<Vlower
yes yes
no no
Go through the sensitivity matrixcolumn that represents the sensitivitiesbetween the maximum voltage point
Vmaxloc and other network nodes
Select the node that has the highestsensitivity and is controllable (includesan active resource that is not already at
its limit)
Go through the sensitivity matrixcolumn that represents the sensitivitiesbetween the minimum voltage point
Vminloc and other network nodes
Select the node that has the highestsensitivity and is controllable (includesan active resource that is not already at
its limit)
Smax > 0
Delay element(if ss control is active willnot change the P set point)
Poutnew = Pout-step
yes
Vmin<Vlower+tap+hyst
no
End
yes
Control signal Poutnew to the selectedactive resource
Smax > 0
Delay element(if ss control is active willnot change the P set point)
yes
Vmax>Vupper-tap-hyst
no
yes
Control signal Poutnew to the selectedactive resource
no no
Part 1
Part 2
Alarm signal: Network voltagescannot be restored within
acceptable limits
Vmaxloc already checked?Vminloc already checked?
yes
no no
yes
Poutnew = Pout+step
- 9 -
CLEEN OY Eteläranta 10, P.O. BOX 10, FI-00131 HELSINKI, FINLAND www.cleen.fi
the voltage at node i the more the longer (electrically) the common path from the origin to nodes i and j is. This is quite sensible.
In this method the voltage sensitivities are calculated based on only network impedances whereas in reality also other variables such as substation voltage, voltage at the node i and net active and reactive node currents affect the sensitivity value [3]. Hence, the method only gives approximate values of the sensitivities. However, these are adequate for the purpose of selecting the controllable resource. The benefit of the method is its simplicity and the fact that the sensitivity matrix needs to be updated only when the network switching state changes. All data needed for determining the sensitivity values is already available at the distribution management system (DMS).
In this method, it is assumed that reactive and real power control affects voltages only on the feeder they are connected to because the origin is defined to be the substation. This is not, naturally, completely true because there is impedance also in the feeding HV network and the substation transformer. If also these impedances are wanted to be taken into account in the voltage sensitivity calculations, the origin should be defined to be the node representing the ideal voltage source behind the HV network impedance.
There are also more accurate methods to determine the voltage sensitivities [4]-[7].
3 Simulations
The operation of the modified CVC algorithm is tested using PSCAD simulations. The simulations presented here are only preliminary results that will be used in further development of the algorithm. In future, the algorithm will be converted into Matlab code and also the optimizing part will be added. This implementation will be then tested in the Real Time Digital Simulator (RTDS) simulation environment.
3.1 The simulation network
The simulation network is the same medium voltage network that was used in Adine project real network demonstration [8]. The network comprises five medium voltage feeders ranging from one HV/MV substation and contains one relatively large hydro power plant (1600 kVA) on feeder Ritari. The minimum voltage is in the demonstration network always located at feeder Kihniö and, therefore, only these two feeders (Ritari and Kihniö) are modeled in PSCAD. The structure of the PSCAD network model is represented in Figure 5 and its parameters can be found in [8].
Because the CVC algorithm has now been developed to take also multiple active resources into account, two DG units are added to the simulation network at nodes 13_5 and 13_9. The units have similar characteristics as the Soininkoski hydro power plant at node 13_20. In the simulations it is assumed that the reactive and real powers of all DG units are controllable. Simulations are conducted in three loading conditions: maximum (Saturday 6 p.m. in January), minimum (Saturday 4 a.m. in July) and middle (weekday 2 p.m. in November). The loading data can be found in [8] and the loads are modelled as constant power loads.

- 10 -
CLEEN OY Eteläranta 10, P.O. BOX 10, FI-00131 HELSINKI, FINLAND www.cleen.fi
Figure 5. The structure of the network model used in Adine project.
3.2 Control parameters
The substation AVC relay set point is in the beginning of the simulations 1.03 pu, deadband 1.5 % and delay 3 s. Line drop compensation is not used. The main transformer tap step is 1.67 % and its delay is 1 s. The DG
110/20 kV
Feeder Ritari
Coordinated voltage control
AVCrelay
Tap changermechanism
Vref
SubstationHeinäaho
G
Soininkoski hydropower plant, 1600 kVA
AVR
Qref 13_12
13_1413_1513_16
13_17
13_1
13_2
13_3
13_4
13_5
13_7
13_18
13_1913_20
13_10
13_11
13_8
13_9
13_6
13_13
Feeder Kihniö
7_1
7_2
7_3
7_4
7_5 7_6 7_10 7_11
7_7
7_8 7_9
7_12
7_137_147_15
7_16
7_17 7_18 7_19
7_20
7_21
7_22
7_23
7_24 7_25

- 11 -
CLEEN OY Eteläranta 10, P.O. BOX 10, FI-00131 HELSINKI, FINLAND www.cleen.fi
automatic voltage regulators (AVRs) are operating in reactive power control mode and the power factor is set to unity at the beginning of the simulations.
The feeder voltage upper limit is set to 1.05 pu and the feeder voltage lower limit to 0.95 pu. The voltage reference limits of substation voltage control are set equal to the feeder voltage limits. The delay of substation voltage control is 3 s and the Q control hysteresis is 0.005 pu. The reactive power control changes the power factor set point by 0.01 at one step and the minimum power factor of all DG units is set to 0.95. The delay of reactive power control is 1 s. The real power control changes the real power by 0.1 MW at one step and the minimum real power of all DG units is set to 0.0 MW. The delay of real power control is 1 s.
3.3 Simulation sequence
Several simulations were conducted to test the operation of the developed CVC algorithm and results of two example simulations are represented in this deliverable. The simulation sequence is the same in both simulations and only the loading condition is changed. The studied loading conditions are maximum load and minimum load and the used simulation sequence is represented in Table 1. The mechanical input moments of the DG units are changed according to this predefined simulation sequence.
Table 1. The simulation sequence. The value that is changed at the time in question is bolded.
Time Mechanical moment of the DG unit at node 13_5 [pu]
Mechanical moment of the DG unit at node 13_9 [pu]
Mechanical moment of the DG unit at node 13_20 [pu]
0 s 0.1 0.1 0.1
15 s 0.1 0.5 0.1
30 s 0.1 0.5 0.7
60 s 1.0 0.5 0.7
80 s 1.0 1.0 0.7
100 s 1.0 1.0 1.0
130 s 0.1 0.1 0.1
3.4 Simulations results
Simulations results show that the developed CVC algorithm is able to restore the network voltages to an acceptable level in all studied cases. The control algorithm operates in the simulations as expected: It uses substation voltage as the primary control variable and activates reactive power control only if the substation voltage control is not able to restore the voltages to an acceptable level. The reactive power control is able to select the resource with the highest voltage sensitivity value correctly and the real power control is activated only if the reactive power control is not sufficient to restore the network voltages to an acceptable level. The

- 12 -
CLEEN OY Eteläranta 10, P.O. BOX 10, FI-00131 HELSINKI, FINLAND www.cleen.fi
real power control is also able to select the resource with the highest voltage sensitivity value and controls the real power as desired. After the real power control, network voltages are in every case restored between acceptable limits.
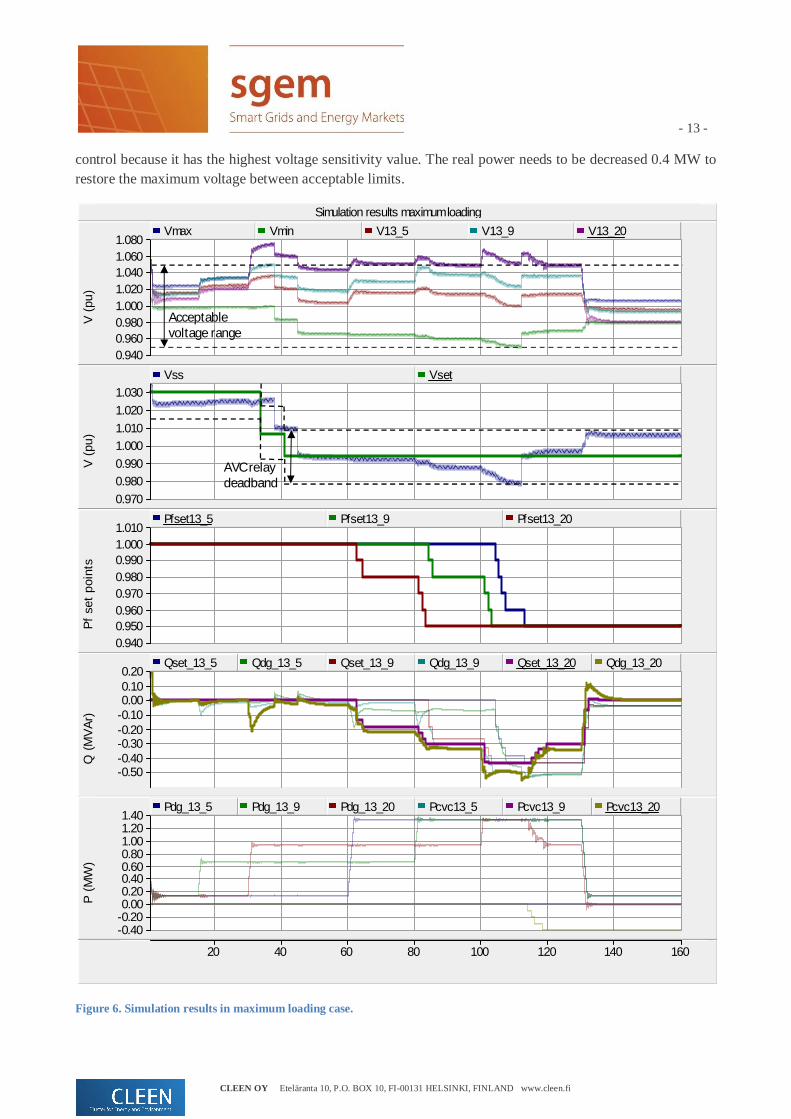
The first example simulation is conducted in the maximum loading condition and the simulations results are represented in Figure 6. In the second example simulation, the load is at its minimum value and the results are represented in Figure 7. In these figures, the uppermost figure represents network maximum and minimum voltages and voltages at DG connection points 13_5, 13_9 and 13_20. Also feeder voltage upper and lower limits are added to the figure. The second figure represents the substation voltage and the AVC relay set point and also the AVC relay deadband is depicted. The third figure represents power factor set points of the DG units and the fourth figure depicts the reactive power set points and measured reactive powers of the DG units. These slightly differ because the reactive power is measured from the medium-voltage side of the generator transformer and, therefore, also the transformers reactive power is present in the measured reactive power. In the fourth figure, the values of DG unit at node 13_20 are bolded to clarify the figure. The lowermost figure represents the measured output powers of the DG units and also the outputs of the real power control of the coordinated voltage control. These outputs are summed to the mechanical input moment of the DG units determined by the simulation sequence determined in Table 1.
In Figure 6, the maximum voltage exceeds its limit for the first time at time 30 s when the output power of DG unit at node 13_20 is raised to 0.7 pu. The substation voltage control operates and the voltages are restored to an acceptable level after two tap changer operations.
When the output power of the DG unit at node 13_5 is raised to 1.0 pu at time 60 s, the maximum voltage exceeds its limit again. The substation voltage control cannot operate because the minimum voltage is less than a tap step away from the feeder voltage lower limit and, therefore, the reactive power control is activated. The maximum voltage is located at node 13_20 and the DG unit with the highest voltage sensitivity in proportion to this node is the DG unit at node 13_20. When the power factor of the DG unit is decreased in two steps to 0.98, all network voltages are restored within the acceptable range.
When the output power of the DG unit at node 13_9 is raised to 1.0 pu at time 80 s, the maximum voltage rises again above its limit. The reactive power control is again activated. At first the power factor of the DG unit at node 13_20 is decreased to its minimum value 0.95. This does not restore the maximum voltage below its limit and, therefore, the DG unit with the second highest voltage sensitivity at node 13_9 is controlled. Its power factor is decreased to 0.98 after which all voltages are again in an acceptable level.
At time 100 s, the output power of the DG unit at node 13_20 is raised to 1.0 pu and, hence, all DG units are operating at their nominal power. The maximum voltage again exceeds its limit and the reactive power control is activated. At first it decreases the power factor of the DG unit at node 13_9 to its minimum value 0.95 and because this is not sufficient, the reactive power of the DG unit at node 13_5 is also controlled. When the power factor is decreased to 0.96, the substation voltage decreases outside the AVC relay deadband and the tap changer operates to increase the substation voltage. Also the maximum voltage naturally increases and the reactive power control is again activated. It decreases the power factor set point of the DG unit at node 13_5 to 0.95 after which all DG units are consuming the maximum allowed amount of reactive power. Since the maximum voltage still remains outside the feeder voltage limits, real power control is activated. The maximum voltage is located at node 13_20 and the DG unit at the same node is selected for
- 13 -
CLEEN OY Eteläranta 10, P.O. BOX 10, FI-00131 HELSINKI, FINLAND www.cleen.fi
control because it has the highest voltage sensitivity value. The real power needs to be decreased 0.4 MW to restore the maximum voltage between acceptable limits.
Figure 6. Simulation results in maximum loading case.
Simulation results maximum loading
20 40 60 80 100 120 140 160 ... ... ...
0.940 0.960 0.980 1.000 1.020 1.040 1.060 1.080
V (p
u)
Vmax Vmin V13_5 V13_9 V13_20
0.970 0.980 0.990 1.000 1.010 1.020 1.030
V (p
u)
Vss Vset
0.940 0.950 0.960 0.970 0.980 0.990 1.000 1.010
Pf s
et p
oint
s
Pfset13_5 Pfset13_9 Pfset13_20
-0.50 -0.40 -0.30 -0.20 -0.10 0.00 0.10 0.20
Q (M
VAr)
Qset_13_5 Qdg_13_5 Qset_13_9 Qdg_13_9 Qset_13_20 Qdg_13_20
-0.40 -0.20 0.00 0.20 0.40 0.60 0.80 1.00 1.20 1.40
P (M
W)
Pdg_13_5 Pdg_13_9 Pdg_13_20 Pcvc13_5 Pcvc13_9 Pcvc13_20
Acceptable voltage range
AVC relaydeadband

- 14 -
CLEEN OY Eteläranta 10, P.O. BOX 10, FI-00131 HELSINKI, FINLAND www.cleen.fi
Figure 7. Simulations results in minimum loading case.
At time 130 s, the output powers of all DG units are decreased to 0.1 pu. After this change, the network voltages remain in a relatively low level, the power factor set points remain at 0.95 and the real power
Simulation results minimum loading
20 40 60 80 100 120 140 160 ... ... ...
0.940 0.960 0.980 1.000 1.020 1.040 1.060 1.080 1.100
V (p
u)
Vmax Vmin V13_9 V13_5 V13_20
0.950 0.960 0.970 0.980 0.990 1.000 1.010 1.020 1.030 1.040
V (p
u)
Vss Vref
0.940 0.950 0.960 0.970 0.980 0.990 1.000 1.010
Pfset13_5
Pf s
et p
oint
s
Pfset13_9 Pfset13_20
-0.50 -0.40 -0.30 -0.20 -0.10 0.00 0.10
Q (M
VAr)
Qset_13_5 Qdg_13_5 Qset_13_9 Qdg_13_9 Qset_13_20 Qdg_13_20
0.00 0.20 0.40 0.60 0.80 1.00 1.20 1.40
P (M
W)
Pdg_13_5 Pdg_13_9 Pdg_13_20 Pcvc13_5 Pcvc13_9 Pcvc13_20
Acceptable voltage range
AVC relaydeadband

- 15 -
CLEEN OY Eteläranta 10, P.O. BOX 10, FI-00131 HELSINKI, FINLAND www.cleen.fi
curtailment of DG unit 13_20 also continues. This operation is due to the fact that no restoring control is at this time modelled. In future, also a restoring part will be added to the control algorithm.
In the minimum loading case (Figure 7), substation voltage control and reactive power control are sufficient to keep the network voltages between acceptable limits and real power control is not needed. This is due to the fact that the voltage drop at feeder Kihniö is in minimum loading case very small and, therefore, the substation voltage control can initiate four tap changer operations whereas in maximum loading case only two tap changer operations could be conducted.
4 Conclusions
In this deliverable, the coordinated voltage control algorithm originally designed in Adine project is further developed to operate optimally also when the network includes multiple active resources. The operation of the developed algorithm is tested using PSCAD simulations. The aim of the developed algorithm is to restore network voltages between acceptable limits when either maximum or minimum voltage exceeds its limit and the simulations show that the algorithm is able to fulfill this objective. In future, the algorithm will be further developed to include also an optimizing part. The final algorithm will be coded into Matlab and its operation will be tested in the RTDS simulation environment at a later stage of the SGEM project.
5 References
[1] A. Kulmala, S. Repo and P. Järventausta, "Increasing penetration of distributed generation in existing distribution networks using coordinated voltage control," Int. Journal of Distributed Energy Resources, vol. 5, pp. 227-255, July 2009.
[2] A. Kulmala, A. Mutanen, A. Koto, S. Repo and P. Järventausta, "RTDS verification of a coordinated voltage control implementation for distribution networks with distributed generation," in Proc. Innovative Smart Grid Technologies Europe, Gothenburg, Sweden, Oct. 2010.
[3] S. Conti, S. Raiti, G. Vaglisiandi, "Voltage sensitivity analysis in radial MV distribution networks using constant current models", in Proc. IEEE Int. Symposium on Industrial Electronics, Bari, Italy, July 2010.
[4] V. Gumar, I. Gupta, H.O. Gupta, C.P. Agarwal, "Voltage and current sensitivities of radial distribution network: a new approach", IEE Gener. Transm. Distrib., vol. 152, pp. 813-818, June 2005.
[5] D.K. Khatod, V. Pant, J. Sharma, "A novel approach for sensitivity calculations in the radial distribution system", IEEE Trans. Power Del., vol. 21, pp. 2048-2057, Oct. 2006.
[6] H.M. Ayres, W. Freitas, M.C. De Almeida, L.C.P. Da Silva, "Method for determining the maximum allowable penetration level of distributed generation without steady-state voltage violations", IET Gener. Transm. Distrib., vol. 4, pp. 495-508, Apr. 2010.
[7] Qiong Zhou, Janusz W. Bialek, "Simplified calculation of voltage and loss sensitivity factors in distribution networks", in Proc. 16th Power Systems Computation Conference, Glasgow, UK, July 14-18.
[8] A. Kulmala, A. Mutanen, A. Koto, "Demonstration report on the use of new coordinated voltage control method", Adine project report D45, Tampere University of Technology, Department of Electrical Energy Engineering, March 2010.