deliverable 7.1 set of kpis for mmff sector
TRANSCRIPT

Acronym: PerformFISH
Title: Integrating Innovative Approaches for Competitive and Sustainable Performance across the Mediterranean Aquaculture Value Chain
Grant Agreement: 727610
Deliverable 7.1 Set of KPIs for MMFF Sector
Lead parties for Deliverable: ISPRA Due date of deliverable: M9 Actual submission date: M18 Dissemination level: PU All rights reserved This document may not be copied, reproduced or modified in whole or in part for any purpose without the written permission from the PerformFISH Consortium. In addition to such written permission to copy, reproduce or modify this document in whole or part, an acknowledgement of the authors of the document and all applicable portions of the copyright must be clearly referenced.
31 Oct 2018

1
INDEX Summary ................................................................................................................................... 3
Introduction ............................................................................................................................... 5
Main barriers to MMFF sector development ....................................................................................... 6
The set of PerformFISH Key Performance Indicators (KPIs) .......................................................... 9
Background ........................................................................................................................................ 9
The choice of KPIs in PerformFISH ..................................................................................................... 10
Methodology ........................................................................................................................... 12
Building of the PerformFISH KPIs ...................................................................................................... 12
The Key Performance Indicators workshop (M.7.1) ................................................................................ 12
i) Identifying relevant KPIs to be measured in PerformFISH ................................................................... 13
ii) Identifying A-Level KPIs ....................................................................................................................... 15
iii) Metrics - parameterization of KPI data recording at LTP facilities ..................................................... 16
iv) Consultation process on KPIs .............................................................................................................. 17
iv) Training ............................................................................................................................................... 18
Source of data .................................................................................................................................. 18
Data recording in industrial facilities ....................................................................................................... 18
KPIs recorded in experiments run in WP2-6............................................................................................ 22
Statistical analisys ............................................................................................................................ 23
Storage of KPI data and access .......................................................................................................... 26
RESULTS ................................................................................................................................... 28
The set of KPIs for MMFF sector ........................................................................................................ 28
Sensitive production data ........................................................................................................................ 29
HATCHERY- List of A- level KPIs ......................................................................................................... 30
Hatchery – Rationale ........................................................................................................................ 30
Hatchery - Parameterization of production cycle and data collection ................................................. 33
Hatchery – KPIs Forms ...................................................................................................................... 35
PRE – GROW - List of A- level KPIs ..................................................................................................... 50
Pre–grow - Rationale ........................................................................................................................ 50
Pre-grow - Parameterization of production cycle and data collection ................................................. 50
Pre-grow – KPIs Forms ...................................................................................................................... 52
GROW OUT- List of A- level KPIs ........................................................................................................ 57
Grow –out – Parameterization of production cycle and data collection .............................................. 58
Identification of geographic areas ........................................................................................................... 59
2
Grow out- Losses – Rationale ............................................................................................................ 63
Grow out- Losses – KPIs Forms .......................................................................................................... 65
Grow out - Dependency on treatments- Rationale ............................................................................. 72
Grow out - Dependency on treatments – KPIs Forms ......................................................................... 74
Grow out –Growth - Rationale .......................................................................................................... 78
Grow out - Growth – KPIs Forms ....................................................................................................... 79
Grow out - Feed Efficiency – Rationale .............................................................................................. 85
Grow out - Feed efficiency – KPIs Forms ............................................................................................ 86
Grow out - Productivity – Rationale .................................................................................................. 90
Grow out - Productivity – KPIs Forms ................................................................................................ 91
Grow out - Welfare - Rationale ......................................................................................................... 93
Grow out- Welfare – KPIs Forms ....................................................................................................... 95
Grow out – Environmental - Rationale ............................................................................................ 101
Grow out - Environment – KPIs Forms ............................................................................................. 106
EXCEL FILES FOR DATA SUBMISSION FOR KPIs :INSTRUCTIONS FOR DATA RECORDING AND SUBMISSION .......................................................................................................................... 119
Introduction ................................................................................................................................... 119
Hatchery – Nursery facilities ........................................................................................................... 120
Structure of excel files ........................................................................................................................... 120
Individual batch data collection ............................................................................................................ 120
Aggregated batches data collection ...................................................................................................... 121
Pre-grow facility ............................................................................................................................. 123
Structure of excel file ............................................................................................................................. 123
Individual batch data collection ............................................................................................................ 123
Grow Out facilities .......................................................................................................................... 124
Structure of excel files ........................................................................................................................... 124
Individual batch data collection ............................................................................................................ 124
Aggregated batches data collection ...................................................................................................... 125
Synthesis of KPIs benchmarking system .................................................................................. 128
References ............................................................................................................................. 136

3
SUMMARY The objective of WP7 is to build a benchmarking tool based on Key Performance Indicators (KPIs), that makes a validated numerical system to be recognised and used by the Mediterranean fish farming industry for its potential to reflect biological capacity, cost-efficiency, welfare-appropriate practices and environmental sustainability (KPIs system). The KPIs system in PerformFISH aims primarily to:
1. benchmark the technical efficiency of aquaculture companies and to identify sources of inefficiencies;
2. benchmark the entire MMFF operations and promote higher efficiencies and increased production with lower environmental impact;
3. assess the impact of PerformFISH results and solutions (feed, vaccines, hatchery and biosecurity protocols) deriving from WP2-WP6 on MMFF operations and KPIs (Task 7.3);
4. facilitate the recognition of criteria, standard and target for improving the performances and environmental sustainability of farming practices of Fish Farming companies as frame for the new Code (Task 7.4);
5. report on how MMFF sector demonstrates stewardship and creates and sustains value, mainly reporting environmental performances through KPIs;
6. implement decision-making throughout the lifetime of the project.
The benchmarking system has been prepared by ISPRA (P20), responsible for Deliverable 7.1. The preparation has been involving Fish Producer Associations (P3,4,5,6,21), their associated Linked Third Parties (LTPs) and several academic partners since the beginning of the project proposal. The consultation was a continuous process within the industry and it was extended for several months (and over the time expected, M9) in order to build a benchmarking system that reflects i) the differences in production systems and technologies used by the industry, ii) the different climate conditions at the different aquaculture sites across the Mediterranean and, more importantly, iii) the different industrial scales of the companies participating in the WP7.
The benchmarking system was designed to be applied to the whole production cycle of MMFF sector (boundaries), with the exclusion of the packaging and processing chain.
The PerformFISH benchmarking system integrates:
- the set of 55 Key Performances Indicators validated as A-level KPIs and ready to be used, approved by the MC and SC and ITEC group of PerformFISH project. Most of KPIs are Technical-KPIs (T-KPI) introduced to estimate the technical efficiency of companies, as far losses and diseases, deformities, feed efficiency, fish growth, use of chemicals. For grow-out production system only, a set of 9 Welfare KPIs (WE-KPI) was conceived for measuring fish welfare during farming in sea net pens and land-based tanks. A set of 14 Environmental KPIs (E-KPIs) was validated for recording numerical values on the impact of farming practices on marine habitat and biodiversity and the use of land, water, energy.
- an harmonised system to collect production data at Hatcheries, Pre-grow and Grow-out industrial installations. The methodology was validated with Partners (3,4,5,6,21) and LTPs

4
for the collection of numerical operational production values and benchmarking at batch, farm, and area level trough the set of KPIs.
- the WP7 - Standard Operating Procedures (SOPs )WP7- Collection of production data at
industrial facilities for Key Performances Indicators, which are published in D4Science web site, in the PerformFISH Gateway, PerformFISH KPI-VREs, along with five ms Excel data submission forms.
- A GIS based platform where ten year time series of Sea Surface Temperatures in °C have
been collected from the Copernicus Marine Environment Monitoring Service (CMEMS) in order to classify the participating facilities into groups homogeneous for their temperature profiles.
The aquaculture industry collaborating in PerformFISH has committed to the principles of transparency, trust and data sharing, which are paramount principles that drive the preparation of PerformFISH and MMFF sectors strategy. The contribution of industrial partners to provide sensitive production data (KPIs G11, G12, G23, G24, G25) reveals their willingness to be open and to collaborate to establish a credible benchmarking system of MMFF sector performances through KPIs. In addition, several aquaculture Companies, not formally involved in PerformFISH, will participate on a voluntarily basis, with the support of national Producer Associations.
In total, 12 hatcheries and 21 pre grow/grow out facilities will be participating to the KPIs benchmarking system.
The KPI system is a core component of PerformFISH and will be used as a reference tool for the decision-making of processes, implementation of activities and impact assessment of the project. The WP7 will dedicate efforts to refine and improve the set of KPIs to reflect new data, improved practices and technologies in order to become a full benchmarking and decision-making tool for PerformFISH and beyond.

5
INTRODUCTION Sea bass and sea bream are the second and the third fish species produced in Europe and represent 27,5% of European aquaculture, for a total volume of 178,300 ton in 2016 (FEAP, 2017). Greece is the main producer (59%) followed by Spain (20,7%), Italy (8%), Croatia (5,3%), Cyprus (3,6) and France (2%). Sea bass/sea bream farming contributes significantly to wealth and job creation in rural and coastal areas in the five EU Mediterranean countries represented in PerformFISH. However, the overall growth of bass/bream sector in the EU has remained stagnant over the last decade, and the industry underwent to cyclic periods of boom and boost, which resulted in declining profitability across the sector and lower production volume than expected.
Figure 1: Sea bass and seabream production over the period 2008-2016 (FEAP 2017)
In 2014, the workshop at Aquaculture Europe concluded that the principal key performance indicators for sea bass/sea bream - growth, mortality and feed efficiency - have not progressed significantly over the last years (EAtiP, 2014) and this issue poses some concern for the sustainable development of the MMFF sector. “More attention needs to be given by both the EU and relevant Member States to the urgent priority of improving technical performance of the Mediterranean fish farming sector, specifically of sea bass and sea bream. The absence of improvement over time is marked. Individual focused projects or a more holistic, integrated programme are required to address this, on both a short and longer term basis......” (FEAP Annual Report 2014). In 2015, the result of the aquaculture industry’s consultation carried out in the ERA-Net COFASP project (Lane et al. 2016), specifically addressing the challenges and needs of salmon and sea bass and sea bream producers, highlighted that new approach models in R&D are needed to fuel improvements in juveniles quality, growth performances, feed ingredients quality and feeding, disease management and welfare and to increase profitability, viability and sustainability of sea bass and sea bream sector

6
(COFASP, 2015). Research and development projects in many areas of sea bass and sea bream aquaculture have been funded in the past years, both at national and international level, but very few have been directed at identifying solutions for industry and led to industrial scale implementation. An innovative bottom-up approach was adopted in PerformFISH to respond to the MMFF needs and generate solutions to consolidate production practices. Starting from the collaboration of the Fish Producers Associations of the 5 countries involved in PerformFISH, R&D partners and with the constitution of the Industry Technical Experts Committee (ITEC) group in representative of the Fish Producers Associations, PerformFISH build a benchmarking system, based on Key Perfomance Indicator (KPI) to perform the numerical assessment of technical performances of MMFF sector. It is the first time that the Fish Producers Associations and industry collaborate to share production data and to use a self-assessment management tool for measuring the technical efficiency and environmental performances of B&B companies within the MMFF sector, and towards other animal food production systems.
Main barriers to MMFF sector development The main barriers and obstacles to consolidate the MMFF sector are recognised in PerformFISH project (Section 2.1.3, TA) as i) the diversity of biological and production systems across the Mediterranean, ii) the different geographical and climate conditions; iii) the lack of common industry standards. The complexity of the production landscape, both in terms of geographical conditions and production systems across the MMFF sector, the variable nature of the inputs, the variation in farm management, and poor data quality available, make measurements of performances of the MMFF sector a tough task.
Expected Impact Barriers/Obstacles Measures to Optimise Impact To consolidate Mediterranean Aquaculture production for Key species towards a commercial scale, through sustainable fish farming and valuable seafood production.
Diversity of biological & production systems;
Geographical conditions;
Lack of common industry standards;
Difficulty and delay in uptake and transfer of knowledge/technology to industrial applications.
Develop standardisation through KPI monitoring system;
Broad Industry Collaboration Generation of management
tools and flexible production solutions;
Focusing on key species; Collaborative Industry and
RD&I experiments will promote knowledge transfer one on-one training;
Tailor-made training
Table 1. Synthesis of impacts and related barriers and measures to optimize impact. The Mediterranean aquaculture fish sector is characterized by a high degree of diversity of biological and productions systems, technologies, geographical conditions and environments. Different stages of maturity characterize aquaculture companies across the Mediterranean basin. There are small and medium enterprises (SMEs) scattered along Mediterranean coasts, typically national oriented, as well as, larger organizations emerged to consolidate business enterprise structure (mainly in Greece), nowadays producing more than 50% of European production of European Mediterranean bass/bream. National industries are operating under different political and environmental frameworks, which have influenced the development of production systems, farming technologies and business strategies. Geomorphological characteristics of the country and the availability of natural water resources also
7
have influenced the choice of production systems and aspects of production cycles. For sea bass and sea bream production, which represent about 98% of the entire MMMFF sector, the following production systems are in use: 1. Marine hatcheries, equipped with recirculation water system and/or open water system producing juveniles with different breeding programmes and in some cases using marker-assisted selection programme; 2. Pre-grow farming systems for juveniles, usually in land based farms using tanks and raceways; 3. Grow out farming systems in sea cages, mainly located in coastal waters, although in very different geographic, climatic and environmental conditions; 4. Grow out farming in land-based tanks or ponds, equipped with open flow water systems, using both marine or geothermal water sources, and partially recirculated water systems in a few cases. Different production protocols and input are used, for example in feeds and feeding protocols, raw materials for self-feed preparation, health management practices and vaccination programme, size of stocking and size of delivered fish on the market. Geographical and climate conditions also differ across Mediterranean area and these influence the regime of water temperature and hydrodynamic conditions in the different aquaculture sites across the Mediterranean. Water temperature plays a key role in biological processes and influences biological performances and ultimately the productivity and efficiency at farm level. A first analysis for sea surface temperature in the Mediterranean region based on Copernicus satellite data was carried out by ISPRA in collaboration with the Mediterranean Centre for Climate Change (CMCC). Time series of mean seasonal sea temperature were recorded in 10 aquaculture farming areas located in Greece, Spain, Italy and Croatia, where aquaculture companies participating as associated Third parties in PerformFISH are based. These time series of 30 years data provide further evidence on the different seasonal water temperature regimes across the Mediterranean sites. Therefore, the analysis of KPIs data recorded at industrial facilities, that are located in different farming sites characterised by different regime temperatures, is elaborated also considering sea water temperature at farm level. The third and important factor impacting on the development of MMFF sector is the availability of sector data and the quality of data for sea bass/sea bream aquaculture in the Mediterranean area, which limits the understanding of biological, technical and economical drivers influencing the sector. The lack of these data has been a serious bottleneck for the construction of a benchmarking tool and to identify targets and industry standards for the sector. Statistical data on European aquaculture production are collected on annual basis at country level (EU data Collection framework; Reg. 762/2009) and also provided by the Federation of Aquaculture Producers (FEAP) and FAO (SIPAM-GFCM). All data are aggregated data sets, thus not suitable to inform decision at farm level. Data on sector performances for bass/bream are not available. In other modern aquaculture industry, such as salmon farming in Norway, where industry production statistics are reported also at country level, information available includes either production data and information on fish inputs, harvests and sales, production losses. Annual company reports are published and available on line and management and technical standards used at company level are available (eg for aspects related to escapee and fish containments, MBA, 2017). The reference model for sea bass and sea bream industry is the salmon aquaculture industry, where collaborative actions across the salmon farming sector and with stakeholders, together with the use of appropriate data recording system and IT tools, allow the monitoring of input and output (e.g. fish meal and fish oil, mortalities, escapes, use of antibiotics). This facilitates the benchmarking of industry performances and the communication of the progress towards responsible aquaculture production practices adopted by salmon industry to market and consumers.

8
The benchmarking system, developed in WP7 and used in PerformFISH is aimed at provide operational values of KPIs that can inform on the biological capacity, technical efficiency and environmental sustainability of MMFF sector (task 7.3) and to identify targets for the company and ultimately common industry standards for MMFF sectors (Task 7.4).
9
THE SET OF PERFORMFISH KEY PERFORMANCE INDICATORS (KPIS)
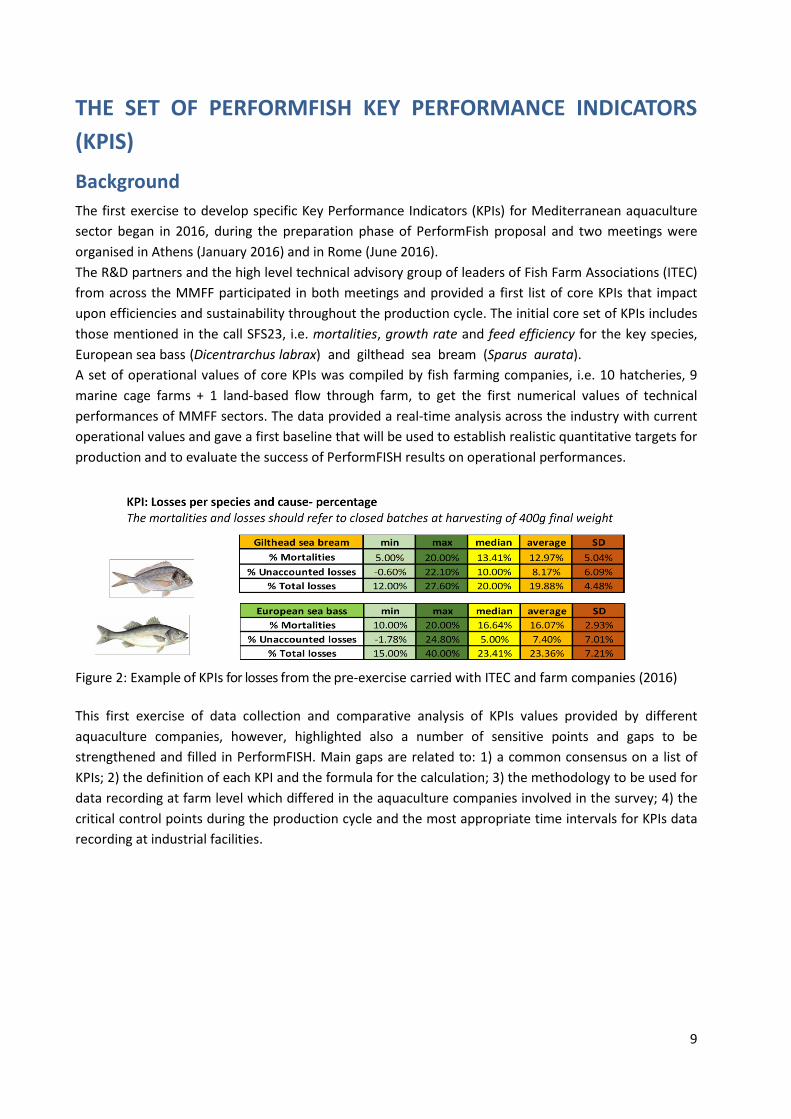
Background The first exercise to develop specific Key Performance Indicators (KPIs) for Mediterranean aquaculture sector began in 2016, during the preparation phase of PerformFish proposal and two meetings were organised in Athens (January 2016) and in Rome (June 2016). The R&D partners and the high level technical advisory group of leaders of Fish Farm Associations (ITEC) from across the MMFF participated in both meetings and provided a first list of core KPIs that impact upon efficiencies and sustainability throughout the production cycle. The initial core set of KPIs includes those mentioned in the call SFS23, i.e. mortalities, growth rate and feed efficiency for the key species, European sea bass (Dicentrarchus labrax) and gilthead sea bream (Sparus aurata). A set of operational values of core KPIs was compiled by fish farming companies, i.e. 10 hatcheries, 9 marine cage farms + 1 land-based flow through farm, to get the first numerical values of technical performances of MMFF sectors. The data provided a real-time analysis across the industry with current operational values and gave a first baseline that will be used to establish realistic quantitative targets for production and to evaluate the success of PerformFISH results on operational performances.
Figure 2: Example of KPIs for losses from the pre-exercise carried with ITEC and farm companies (2016) This first exercise of data collection and comparative analysis of KPIs values provided by different aquaculture companies, however, highlighted also a number of sensitive points and gaps to be strengthened and filled in PerformFISH. Main gaps are related to: 1) a common consensus on a list of KPIs; 2) the definition of each KPI and the formula for the calculation; 3) the methodology to be used for data recording at farm level which differed in the aquaculture companies involved in the survey; 4) the critical control points during the production cycle and the most appropriate time intervals for KPIs data recording at industrial facilities.

10
The choice of KPIs in PerformFISH Key performance indicators (KPIs) are defined as a set of quantifiable measures that a company can use to gauge its performance over time. These metrics are used to determine progress in achieving strategic and operational goals, and to compare performances against other businesses. The work carried in task 7.1 was to set a list of realistic KPIs to cover aspects of health, growth, feed efficiency, fish welfare and environmental sustainability and to standardized a methodology for KPI data recording at aquaculture farms participating as Third Linked Parties (LTP) of the Fish Producers Associations (P3,4,5,6,21) in PerformFISH project. The following four categories of key performance indicators were considered in PerformFISH:
- Key Technical Performance Indicators (T-KPIs) to measure biological performances and technical efficiency;
- Key Economic Performance Indicators (EC-TPIs) to measure productivity and efficiency of aquafarms;
- Key Environmental Performance Indicators (E-KPIs) to measure the impact of fish farming operations on the conservation of biodiversity and habitats, the use of natural resources, water, space and energy use;
- Key Operational Welfare Performance Indicators (WEKPIs) to measure fish welfare of sea bass and sea bream in relation to husbandry practices.
The majority of T-KPIs, Ec-KPIs and WE-KPIs are typically metrics utilised for bass and bream aquaculture sector and are used as Sector metric, while E-KPIs are common measurements across different sectors and used for benchmarking with other food animal production sectors (System metric).
The KPIs measurement in PerformFISH is primarily to: - to benchmark the actual performances and efficiency of B&B companies - to define target, as the level of performances that is needed to reach, according to best
performance and desirable target outcomes - to identify source of inefficiency in production cycles - to analyse how solutions and results (feed, vaccines, hatchery and biosecurity protocols..)
generated in PerformFISH (WP1-6) will improve the performances and contribute to better production efficiencies, profitability and environmental sustainability of the MMFF sector
The set of KPIs will be used to inform decision at different levels
benchmarking performances of farming units at company level (Company KPIs)
benchmarking performances between companies (Sector KPIs)
benchmarking performance vs other food animal production sectors (System KPIs)
for setting industry standard for MMFF sector

11
Figure 3. Methodological approach for construction and use of Key Performance Indicators in PerformFISH Project (modified by Matlock, 2017)

12
METHODOLOGY
Building of the PerformFISH KPIs To select the appropriate set of KPIs, an iterative and participatory process was carried out in close collaboration with the Fish Producers Associations and the ITEC and R&D partners. A preliminary selection of relevant KPIs was presented at the project kick-off meeting (Volos, May 2017) and a dedicated workshop was held in Rome, (November 2017) to identify and validate the set of KPIs to be used in PerformFISH (Milestone 7.1 at M6). The final set of KPIs has been validated by PerformFISH consortium at M12, within the annual project meeting held in Gran Canarie on the 1st June 2018.
The Key Performance Indicators workshop (M.7.1) The Key Performance Indicators workshop was held in Rome at ISPRA headquarter on the 9th of November 2017, with 37 participants from 7 EU countries. The main objective of this meeting was the identification of the set of relevant KPIs to be used in PerformFISH to assess the technical efficiency and the sustainability of the B&B companies, and the definition of a common methodology to collect KPI data on farm, to ensure that different farmers and managers across the Mediterranean will provide accurate and reliable KPI values. Good quality data and appropriate time series were recognized to be essential to benchmark performances through KPIs at a farming unit level, at farm level and between companies. A draft report of DL7.1 was prepared by Giovanna Marino (WP7 leader) and by ISPRA team and delivered to all participants before the meeting to introduce: i) the criteria used for the selection of KPIs; ii) the productions systems and the critical points for each production system to be considered; iii) a tentative list of KPIs selected for each production system; iv) the definition of each KPIs and the formula for the calculation; v) the parameterization for data collection; vi) the source of data.
Figure 4: Scheme of the methodology adopted to define the KPI benchmarking system
Identifying relevant KPIs for MMFF sector
Identifying A-Level KPIs, definition,formula
Parameterization of KPIs data recording at industrial facilities
Data sources: Identifying Companies providing data
Statistics for KPIs benchmarking
13
i) Identifying relevant KPIs to be measured in PerformFISH The spectrum of aquaculture KPIs of potential interest for MMFF sector is very wide. To select the most relevant KPI, the SMART criteria, which letters stand for Specific, Measurable, Attainable, Relevant, Time-bound, were considered. The PerformFISH KPIs have been selected to be:
- Relevant and performance oriented - Easy to understand - Measurable (formula) - Attainable (easy to collect high quality data set) - Achievable in a reasonable time-frame (production cycle/year)
The set of KPIs also responds to the following criteria: - Outcomes Based - Science Driven - Technology Neutral - Transparent
According to these criteria, the process to develop the set of KPIs started from the identification of critical successful factors for the different production systems used in Europe for farming European sea bass and gilthead sea bream. Three production systems were considered:
- Marine hatchery - Pre-grow out system - Grow-out farming system
The critical successful factors (input) and the critical control points for Hatchery, Pre grow and Growth out systems were presented during the WS and analysed as the key area that have to be controlled and measured during production cycle through KPIs (data not reported here). The critical control points were used for the parameterization of data recording for KPIs. The list of KPIs presented by ISPRA at the meeting included 145 indicator metrics (Table2). The list included i) the first list of core KTPIs for hatchery ii) the list of core KTPIs (growth, mortality and feed efficiency) at grow–out stage, already put in place and analysed by ITEC from the beginning of the project; iii) a new set of indicator metrics to complementing the list of core KPIs and intended to measure efficiency, fish welfare and environmental sustainability of farming practices adopted by MMFF sector.

14
Table 2. First list of indicator metrics proposed at Key Performance Indicators workshop (Rome, November 2017)
KPI category Indicator metrics n
Hatchery
Hatchery Total Productivity 10
33
Hatchery production 3 Hatchery deformities 5 Hatchery Growth 4 Hatchery feed Costs 5 Hatchery Health Costs 6
Pre grow
Pre grow total productivity 8
24 Mortalities KPI-Losses per species and cause 3 Growth-KPI 3 Feed efficiency-KPI 2 Health costs-KPI 8
Grow out
Health Feed
Growth
Mortalities KPI-Losses per species and cause 4
22
Dependency on antiparasitic treatments- KPI 3 Dependency on antibiotic treatments- KPI 3 Growth rate KPI 3 Feed efficiency KPI 2 Health costs-KPI 5 Economic KPI 2
Grow out Environmental
Preservation of biodiversity and habitats - KPI 6
27 Responsible Use of Resources -KPI 8 Responsible Use of Chemical and Vet Drugs -KPI 9 Protection of Aquatic Animal Health -KPI 4
Grow out Welfare
Animal based welfare – KPI 20 39 Indirect-welfare indicators 19
145
15
New metrics and indicators were presented and discussed for the first time at WS among ITEC and scientific partners. ISPRA prepared a form for each single indicator metric and requested the participants to provide written comments with regard to the relevance for sea bass and sea bream sector as KPI and its attributes: - relevance - definition - formula for calculation - metrics, as far as data and time series recording at farm/company level - attainability, according to the production strategy of the company participating as Third parties of Fish
Associations.
The workshop participants voluntarily gathered into 4 working groups, mainly according to their expertise. Each working group only dealt with a single category of KPIs:
WG1. Technical KPIs for Hatchery WG2. Technical KPIs for Grow-out - Health, Growth, Feed WG3. Fish welfare KPIs WG4. Environmental KPIs
In each WG and KPI category, the set of KPIs were extensively analyzed and discussed, and notes were reported on each single KPI form, to be handed over to the ISPRA team to be finalized. According to the criteria above reported, the initial set of KPIs (n. 126) belonging to the 4 categories was classified by working group as:
A Level - KPI to be readily adopted by and used in a first phase of the project. B Level - KPI to be revised to be adopted by and used from M24 of the project. KPIs discarded
At the end of the discussion inside the 4 working groups, a reporter from each working group reported in plenary on the main issues emerged from the internal discussion, and a discussion in plenary followed.
ii) Identifying A-Level KPIs On November 30th, a second report was drafted by ISPRA and sent to the WG’s participants. The report analysed all revisions and suggestions elaborated and reported by the 4 WGs for each KPI. The complete list of Technical KPIs (for hatchery system, for pre-grow and for grow-out in cage), Welfare KPI and Environmental KPI were reported and classified as A-level KPI, B- level KPIs and discarded KPIs, as deemed by WGs experts. The participants of each Working Group were asked to check the KPI list and send their feedbacks and comments and to address critical issues identified by ISPRA to find a final consensus on the list of KPI validated at A level, on definitions and formula for calculation by 15th December. Additional comments from ITEC experts and R&D partners who participated to different WGs or were not able to attend the Rome meeting have been also collected by e mail exchange, contacts and skype meetings. The comments received on each KPI, definition and the formula for calculation, were reviewed corrected and completed by ISPRA staff. The file generated was sent again to the Association of Fish Producers and ITEC. The number of KPIs deemed at A-level and B-level are reported in Table 3, however the list of KPIs was still not definitive, and final further refinement was made by Fish Producers Associations and ITEC in the following steps of the process.

16
KPI (n.) A – level B – level Discarded
TE-KPI-Hatchery 20 2 11
TE-KPI-Pre grow 10 2 12
TE-KPI-Grow out 26 3 2
WE-KPI-Welfare 23 7 0
E-KPI-Environment 13 9 5
TOTAL 93 23 28
Table 3. KPI deemed as A- level KPIs, B level KPIs and discarded KPIs after the Rome meeting. The list of A-Level KPIs was revised several times by Fish Producers Associations and ITEC.
iii) Metrics - parameterization of KPI data recording at LTP facilities The objective of this step was to identify a reliable methodology for recording KPI data to be used by all aquaculture companies participating as Third Linked parties of Producers Associations in WP7. It was performed in collaboration with Fish Producers Associations and the ITEC experts coordinating the WGs. The parameterization for recording production data at facilities was designed considering the diversity of biological cycles, production systems and technologies, and more importantly the different industrial scale of the companies participating in the WP7-KPI as third parties of Fish Producers Associations. According to the composition of ITEC, in PerformFISH coexist companies producing 40.000 ton per year and small companies cycle producing <400ton per year. Therefore, the methodology for data recording needs to be flexible and adapted to the different production systems and scale, fixing the KPI and the method for calculation. The parameterization of data recording were not fully defined by the WGs for the different categories of KPIs at Rome meeting. It was recommended to perform data recording considering the period of fish stocking, water temperature and critical control points during the production cycle. For this reason, this step of parameterization of data recording for building the KPI system was quite long and has required many refinements to be consistent with the different requests presented by Producers Associations and LTPs involved in WP7. The recording of KPI data was modelled for the three production systems:
1. Hatchery and Nursery 2. Pre- grow 3. Growth-out in sea net pens and land-based tanks
The parameterization was proposed according to the:
Period of stocking Size of stocking Critical control points: fixed degrees days per hatchery;
fixed fish size (body weight) for grow out Reporting: batch level, farm level and area level

17
iv) Consultation process on KPIs From December 2017 to April 2018, the set of level-A KPIs that will be used in hatchery, pre-grow and grow out systems as well as the methodology for recording numeric values for each KPI at industrial facilities have been reviewed several times by the Producer Associations (P3,4,5,6,21), scientific partners (P2, P12) and Third Linked parties. During this period, ISPRA and the people responsible in charge for the five Producers Associations met regularly via phone and Skype meetings, where various experts and scientific partners of WP2,3 and 4 were consulted in order to refine draft indicators, formula and requirements for data recording at facilities. The consultation was a continuous process within the industry and it was extended for several months in order to build a benchmarking system that reflects the differences in production systems and technologies used by the industry and, more importantly, the different industrial scales of the companies participating in the WP7. The final set of KPIs to be used in the hatchery, pre grow and grow out production systems, the definition of each KPI, the formula for calculation, the way of data recording and the interval of data recording were presented in the first annual project meeting held in Las Palmas, Gran Canarie (30 May- 2 June) and was validated by the MC and SC of PerformFISH.
Figure 5. Step of the process of implementation of deliverable 7.1
•Presentation of KPIs categories and a preliminary list of KPIs for MMFF sector
Kickoff meeting Volos, May 2017
•Identification of the set of relevant KPIs
• Analysis ofmethodology for data collection
KPIs Workshop Rome, Nov 2017
• Choice oflevel- A KPIs
•Level –B KPIs• Deliverable7.1_v0
First report on KPIs (30 Nov
2017)
•Consultation of Producers Associations and Third Linked parties for the revision of KPIs (Level-A) • Parametrization of data recording (inputs-ouputs)
Consultation(Dec. 2017-Apr 2018) Final validation of
• A set of 55 level-AKPIs
•Methodology for KPI data recording at industrial facilities
Final validation ofa set of KPIs
Las Palmas, May 2018
• 5 training workshops on KPIs for farm managers
•Builiding of KPI VREsin PerformFISH Gateway
•Deliverable 7.1 v1
Training on KPIs(Sept-Oct 2018)
Deliverable 7.1 - Set of KPIs for MMFF sector
•Identification of data inputs and intervals
•Calculation ok KPI formula the forms
•Statistical analysis
Elaboration ofsubmission forms
(Jun-Aug 2018)
M18

18
iv) Training Five one-day training workshops on the KPI benchmarking system were organised in collaboration with the Producers associations and Third Linked Parties involved in PerformFISH (Table 4 a,b). The first training was organised by the Croatian Association (P6) in Croatia, Zadar, at Cromaris on 3rd of September and the last was held in Paris on October 11th and organised by the (P21) in Paris. Producers Associations and R&D managers and operators from LTPs that will be directly involved in the recording and submission of data in PerformFISH attended the meeting. In addition, 17 sea bass and sea bream companies, actually not involved as LTP in PerformFISH, also expressed interest to participate in the benchmarking tool and were invited accordingly. The trainings were interactive sessions aimed at reviewing the list of KPIs, the methodology for data recording and the use of the submission forms, as excel datasheets, prepared by ISPRA for the recording and calculation of KPIs values. It was an useful exercise of dialogue with participants and an opportunity to clarify different issues and get their feedback to improve, refine and make more friendly the tool. The requests of farm managers were accepted, whenever possible, and the submission forms were modified accordingly. How to use the D4Science e-Infrastructure and how to register and use KPI-VREs the interface and storage KPIs data (Task. 7.2), was presented remotely by Massimilano Assante from CNR-ISTI (P23), during the meetings held in Athens and Paris. A webinar session on the KPI-VRE has been also organised by ISPRA and ISTI CNR for LTPs managers and Producer Associations from Croatia, Italy and Spain in November 2018, to explain the way of functioning. The special requirements for the anonimization of the KPI data in the VRE and for avoiding the recognition of the farms in the KPI analysis and computation were requested by LTPs. VRE exploitation modalities and Privacy Policy, which are compliant with EU General Data Protection Regulation (GDPR), and PerformFISH ToU Policies were presented and discussed. The timeline for data recording for the 2018-2019 production cycle was planned with LTPs. It was agreed that LTPs will provide production data from closed batches at seasons 2017 and 2018 to analysis background numerical values for KPI at company and farm level.
Source of data Two main sources of data are available in PerformFISH and feed the KPI system: i) data collected at company level in industrial facilities; ii) data collected from experiments run in WP2-6.
Data recording in industrial facilities The aquaculture industry collaborating in PerformFISH has committed to the principles of transparency, trust and data sharing, which are paramount principles that driven the preparation of PerformFISH and MMFF sectors strategy. The process to build the benchmarking tool is a participatory process to be carried out in close collaboration with the Producers Associations, ITEC and Academic partners. The collaboration between R&D and Industry is crucial to choice the appropriate indicator according to criteria, the formula for its calculation, the interval of measurements, and ensure a efficient and not time consuming data collection on farms. Data collection is a responsibility of Producers Associations and associated companies participating in WP7. It’s important that companies and managers involved in KPIs collection identify their needs and the time to allocate to data collection.

19
A questionnaire was delivered to Fish Producers Associations to get a preliminary list of bass/bream companies that will be involved in WP7 and KPIs, including information about the number of farm sites. The list of sea bass and sea bream companies based in Italy, Croatia, Greece and Spain that have expressed interest to participate in task 7.1
Boundaries of the KPI benchmarking system The benchmarking system is designed to be applied to the whole production cycle of MMFF sector with the exclusion of the packaging, processing and marketing chain. The feed production and transport chain has been also not included in the computation and analysis of the KPIs (Boundaries). The Technical, welfare and environmental KPIs will be then applied along the aquaculture production chain, from the fingerling production to the stunning and slaughtering process. This decision was taken considering the project’s focus on production parameters as well as the possible difficulties in the data collection of feed production, transportation to and from the production site, packaging and processing, whenever these processes would be carried out by companies not involved in the benchmarking exercise or even not directly involved in commercial aquaculture production.
Tools for data collection In order to facilitate the recording of uniform numerical values for KPIs and to guarantee the use of identical recording system among the companies, ISPRA developed a set of submission forms, in Ms Excel format, as a tool specifically designed for KPI data recording at Hatchery, Pre grow and Growth out production systems. The tool, which consists of 2 excel spreadsheets for each production system, was presented at the training workshops to make farm managers more confident with the electronic forms prepared and the methodology for data collection, recording and submission. The KPI submission forms and the Standard Operating Procedures (SOPs) for data recording will be made available for download on D4Science web site, in the PerformFISH KPI-VREs.
Closed batches (2017-2018) The PerformFISH Management Committee at the annual meeting (May, 2018), the Producer Associations and the LTPs agreed on the use of historical data (closed batches) to test the data recording system and to build a preliminary dataset of KPI as baseline for the KPI benchmarking system. Each LTP will record production data from closed batches, fill the submission form and upload it in the KPI-VRE. The following data are expected from each LTP involved in WP7:
Hatchery - 5 closed batches, from three hatchery Periods, production cycles closed in 2017 and 2018.
Pre-grow system - 5 closed batches, from three hatchery Periods, from production cycles closed in 2017 and 2018.
Grow out system - 5 closed batches, from four Quarters, from production cycles closed in 2017 and 2018.
The closed batches are an important source of data, providing real numerical values of production for the calculation of KPI, and allow the test for the functioning of the KPI-VRE, the control of submission and calculation forms and finally the validation of the beta test version of the KPI-VRE, in progressing by CNR-ISTI. Closed batches data will be also useful for the first benchmarking with LTPs, at company and farm level.

20
The list of aquaculture companies participating as LTPs of Producers Association and the list of companies participating voluntary in KPI system is reported in Tables 4a,b according to the production system and culture technology (hatchery, pre grow, grow out in net pens, grow out in land based tanks).
HATCHERY (closed and semi-closed systems)
Partner number
Participant Organisation name
Company name
Type of partner
Country Certification scheme (Ref. DL 10.5)
3.1 ALEVINES Y DORADAS SA ADSA LTP Spain GLOBALG.A.P. GGN 4056186237279
3.2 AQUICULTURA ELS ALFACS SL
ALFACS LTP Spain
4.1 Selonda Aquaculture S.A. Selonda LTP Greece GLOBALG.A.P GGN 5206146000002
4.2 NIREUS ICHTHIOKALLIERGEIES ANONYMI ETAIRIA
NIREUS LTP Greece GLOBALG.A.P GGN 5202957000002
4.3 KALLIERGEIES YDROVION ORGANISMON ANONYMOS ETAIREIA
ANDROMEDA LTP Greece GLOBALG.A.P GGN 5200700699992
5.2 Panittica Italia Società Agricola Srl
PISASrl LTP Italy GLOBALG.A.P GGN 4056186236159
5.3 AZIENDA AGRICOLA ITTICA CALDOLI
CALDOLI LTP Italy GLOBALG.A.P GGN 4056186640673
6.1 Cromaris dioničko društvoza marikulturu
CROMARIS LTP Croatia GLOBAL GAP GGN 4056186206817
21.1 FERME MARINE DU DOUHET SAS
FMD LTP France GLOBALG.A.P GGN 4056186237118
21.2 ECLOSERIE MARINE DE GRAVELINES ICHTUS
EMG-Icthus LTP France GLOBALG.A.P GGN 4056186235985
4
Kefalonia Fisheries SA
Others Greece
5
Acqua Azzurra SpA
Others Italy
5
Valle Cà Zuliani srl (RO)
Others Italy
5
Valle Cà Zuliani srl (GO)
Others Italy
21
LPDS - Aqualande
Others France
21
France Turbot Ichtus – Gloria Maris
Others France
21
France Turbot Ichtus - Gloria Maris
Others France
Table 4a. Hatcheries participating voluntary in KPIs system

21
PRE-GROW & GROW-OUT
Partner number
Participant Organisation name
Company name
Type of partner
Country Technology Certification scheme (Ref. DL 10.5)
3.2 AQUICULTURA ELS ALFACS SL
ALFACS LTP Spain Grow-out Sea net pen
3.3 Andromeda Iberica Acuicultura S.L.
AndroIberica LTP Spain Grow-out Sea net pen
GLOBALG.A.P GGN 4052852343060
4.1 Selonda Aquaculture S.A.
Selonda LTP Greece Grow-out Sea net pen
GLOBALG.A.P GGN 5206146000002
4.2 NIREUS ICHTHIOKALLIERGEIES ANONYMI ETAIRIA
NIREUS LTP Greece Grow-out Sea net pen
GLOBALG.A.P GGN 5202957000002
4.3 KALLIERGEIES YDROVION ORGANISMON ANONYMOS ETAIREIA
ANDROMEDA LTP Greece Grow-out Sea net pen
GLOBALG.A.P GGN 5200700699992
5.1 Soc. Agr. Cosa COSA LTP Italy Grow-out Land-based tanks
Occupational Health and Safety Management System Standard OHSAS 18001:2007
5.3 AZIENDA AGRICOLA ITTICA CALDOLI
CALDOLI LTP Italy Grow-out Land-based tanks
GLOBALG.A.P GGN 4056186640673
6.1 Cromaris dioničko društvoza marikulturu
CROMARIS - Kosara
LTP Croatia Grow-out Sea net pen
GLOBAL GAP GGN 4056186206817
6.1 Cromaris dioničko društvoza marikulturu
CROMARIS – Velo Zalo
LTP Croatia Grow-out Sea net pen
GLOBAL GAP GGN 4056186206817
21.1 FERME MARINE DU DOUHET SAS
FMD LTP France Pre-Grow Land-based tanks
GLOBALG.A.P GGN 4056186237118
3 Culmarex Sl Others Spain Grow-out Sea net pen
3 Albaladejo Sl Others Spain Grow-out Sea net pen

22
4 Kefalonia Fisheries SA
Others Greece Grow-out Sea net pen
5 Civita Ittica srl (RM)
Others Italy Grow-out Land-based tanks
5 Civita Ittica srl (LI)
Others Italy Grow-out Sea net pen
5 Maribrin srl Others Italy Pre-Grow Land-based tanks
5 AQUA di Roberto Cò
Others Italy Grow-out Sea net pen
5 Agroittica Toscana (LI)
Others Italy Grow-out Sea net pen
5 Acqua Azzurra SpA
Others Italy Grow-out Sea net pen
5 Valle Cà Zuliani srl
Others Italy Grow-out Sea net pen
5 Rehomare srl Others Italy Grow-out Sea net pen
21 Acquacoltura Palma d’oro -Gloria Maris
Others France Grow-out Sea net pen
Table 4b. Pre grow and Grow out companies participating voluntary in KPIs system
KPIs recorded in experiments run in WP2-6. There are a 2-ways interactions of WP7 with other technical WPs of PerformFISH. From one side, the KPI data collected during routine cycles at hatcheries and grow-out industrial facilities in WP2-WP6 that are relevant for the KPIs used in WP7 will complement the benchmarking system. On the other side, KPI data collected in experimental trials run in WP2-WP6 for testing innovative solutions (e.g. innovative hatchery protocols, feed ingredients and diets, disease managements procedures and medicine and bioactive products) will be tested against the KPI values recorded in WP7 at industrial facilities. This benchmarking analysis will be part of the impact assessment analysis of PerformFISH (task 7.3). WP2 - Juveniles Quality and Growth Potential - An extensive production data collection during the larval rearing period will be carried out at the industrial hatcheries (P3,P4,P5,P21) involved in WP2 (Task 2.2.1, 2.2.2) in 2017-2018. This first exercise in WP2, will be useful to test the feasibility of data recording and sampling and to make more efficient KPI data recording in WP7 for the next hatchery cycles (2018, 2019, 2020). Biological samples collected at batch level and analysed in WP2 for growth, survival, deformities will be used as complement background data for implement KPIs validated for hatchery and for specific KPIs (type of deformities and severity). WP3 – Boosting Fish Health at all Lifecycle Stages - The task 3.1 will record data through a survey on mortalities in routine cycles and on the most relevant pathogens of bass/bream during grow out farming. Information collected will be organised to be used as background data to complement Health-KPIs related to losses (KPI total mortalities, mortalities by specific disease etc) collected at industrial facilities in WP7. As far as welfare KPIs, the task 3.5 will validate some direct animal-based indicators at industrial facilities, in collaboration with companies and ITEC experts that have expressed interest in this

23
task. From M36 the most relevant animal-based welfare KPI validated in task 3.5 and actually deemed as B-Level KPIs will be upgraded in the KPI benchmarking tool of WP7 as A-level KPIs. WP4 – Efficiency Feeds to improve the Current KPIs in production System -Several experiments will run in WP4 for searching alternative sources of feed ingredients and innovative feeding strategies. Some technical KPIs related to fish growth, feed efficiency and welfare will be collected during the experiments; KPIs values from these experiments will be compared with KPI value recorded at batch levels in routine cycle at industrial facilities in WP7. WP6- Testing and validation - Relevant results from experimental trials carried out in WP2-6 will be tested at commercial scale in industrial installations to be validated in real farming environment from M36, in collaboration with Fish Farming companies and Academic partners. KPI values collected in WP7 will be used as benchmarking to evaluate the impact assessment of these new solutions and outcomes tested in WP6. For each KPI, the list of experiments organised in different WP-tasks which may contribute with numerical values to the KPI are detailed in the single KPI form.
Statistical analisys 1. Definition of the minimum sample size
A minimum sample size, at batch level, was defined in order to get reliable data collection. In particular, a minimum number of representative batches in each farm was carried out to obtain statistically significant results (Raheli et al. ,2017). In general, given v companies (v: 1, 2,.....,z) and k j farm (j:1, 2, ....., mr)
Let: • nvj the number of batches to be monitored in the jth farm belongs at vth company
• Nvj the number of total batches belongs at jth farm belongs at vth company
• svj the estimated standard deviation of variable target (e.g. the survival rate %) in the jth farm belongs at vth company
• t the value of t-Student at 95% of the confidence interval
• d the accetable error of the efficient estimate (generally 5%)
It was defined the following minimum sample size
𝑛𝑖𝑣 =𝑁𝑖𝑣 ∗ (𝑠𝑖𝑣 ∗ 𝑡)2
(𝑁𝑖𝑣−1) ∗ 𝑑2 ∗ (𝑠𝑖𝑣 ∗ 𝑡)2
The data collection will be carried out on this minimum number of batches for each farm (j) of the company (v).
2. Analytical KPI formulas
In general, a generic KPI is expressed as ratio between two or more variables observed during the survey. Let Xkj the given variable detected on the kth batch of jth farm Ykj the given variable detected on the kth batch of jth farm

24
The ith KPI can be defined as
𝐾𝑃𝐼𝑖(𝑘𝑗) =𝑋𝑘𝑗𝑌𝑘𝑗
∗ 100
Where i: 1, 2,......,q k: 1, 2,......,hn
j: 1, 2,....., mr
3. Descriptive statistical analysis
The data collected and the KPIs defined in point 2 will be analysed using basic statistical analysis techniques which allowed their graphical and tabular representation. In particular, were calculated position and variability indices both at general level and that at stratified level (e.g by quarter). The position indices considered were: minimum value, first quartile, median, mean, third quartile and maximum value while the variability index involved were the standard deviation, the range and the inter quartile interval . The graphical representation of some or all of those indices was made at the general and/or stratified level (e.g. by quarter) and concerned the choice between different plots such as the scatter plot (using KPI target or KPI dimension), the box plot (using single KPI) and the graphical output of DEA (using KPI target or KPI dimension).
4. Data Envelopment Analysis (DEA)
DEA is a non parametric method based on linear programming model used in economics for the estimation of productive efficiency of decision making units (DMU) (Cook, Tone and Zhu, 2014). DEA is considered as a transformation function (rate) of multiple inputs into multiple outputs and, the resulting ratio can be interpreted as an overall measure of technical efficiency of the unit. This ratio is a number between 0 and 1, where 1 represents full efficiency and values ≤ 1 indicates that inefficiency is present. Unlike from other techniques, DEA permits to measure relative performance of different DMUs, considering multiple inputs and outputs at the same time as follows:
maxWeighted (Input 1 + Input 2 +. . . + Input n)
Weighted (Output 1 + Output 2 +. . . + Output n) [1]
This analysis is applied for measuring the DMU’s efficiency through the modelling of one theorical benchmark unit, which is obtained from [1] by using the DMU observed. The output of DEA provide a chart in which the units are plotted in a plane generates by the input/output ratios; a virtual line (or frontier) in the chart represents the maximum output that can be produced given the inputs [1]. The frontier sets the boundary between the efficiency and inefficiency and, efficient DMUs are plotted along this line while inefficient ones at increasing distance from it. Then efficient or inefficient DMUs can be individuated by deviation from the frontier, which designates the performance of the best DMUs and measures the efficiency of other DMUs as deviations from it (Fig1).

25
For the application in PerformFISH benchmarking system, application of DEA can be performed at batch, farm, company and area level. These levels represents the DMUs. Input and output parameters to be included in the DEA, are defined through the KPIs that determine the efficiency of the batch (if DMU = Batch), of the farm (if DMU = Farm), of the company (if DMU = Company) or of the area (if DMU = area). As reported by Bogetoft and Otto (2011) the classic method of DEA includes six models that can be used to estimate the efficiency, shortly: A) The constant return to scale (CRS) that is applied when an increase (or decrease) of the inputs follows a proportional increase (or decrease) of the outputs. B) The increasing return to scale (IRS) that is applied if an increase (or decrease) of the inputs follows an increase (or decrease) of the outputs more proportional cher (e.g. exponential) C) The decreasing return to scale (DRS) that is applied if an increase (decrease) of the inputs follows an increase (decrease) less than proportional output. D) The Variable returns to scale (VRS) helps to estimate efficiencies whether an increase or decrease in input or outputs does not result in a proportional change in the outputs or inputs respectively. This method includes both increasing and decreasing returns to scale. E) The free disposable hull model (FDH) is based on pairwise comparisons. It uses a pure dominance criterion, but has otherwise no additional flexibility. The FDH model is based on deterministic (or observed activities) and free disposability postulates. It is not a convex model. One appealing characteristic of FDH model due to non convexity nature of FDH efficiency frontier is that, differently from the previous models, in FDH model targets correspond to observed units and not to theoretical unit. F) The free replicability hull models (FRH) keep the entity of the units by only adding integer multiples units. It considers integer combinations of DMUs in order to create a theoretical unit. Once the most appropriate model of the DEA is chosen, on the basis of the assumptions that can be formulated both on the relationship between the input and output KPIs and on the definition of the reference DMU (observed or theoretical), the technical efficiency is calculated in correspondence of each DMUs. This efficiency can be studied, at a second stage of analysis, as a function of some input KPIs and other factors (expressed as dummy variables) by the application of techniques of analysis of ordinary least square regression (OLS) or Tobin regression.

26
Storage of KPI data and access The pre-exercise carried out by bass/bream companies in 2016, highlighted the necessity to develop an IT tool to record, storage and compare the KPI data collected at industrial facilities. The D4Science infrastructure developed at CNR-ISTI in the course of more than 10 years, hosts the PerformFISH Gateway and a dedicated Virtual Research Environment (VRE) named PerformFish-KPIs. This KPI-VRE has been designed by CNR-ISTI (P) and ISPRA to support the uploading, validation and management of usage policies for Farms, Companies, and Associations (Task 7.2). The PerformFish-KPIs VRE has setup as follows
i) a storage system (Workspace) to store user’s data with private-access policy to preserve the privacy of the data system (workspace for each COMPANY)
ii) a web interfaces allow managing and validating user-uploaded submission iii) a computational system to operate the validation of the files iv) a repository for the KPI database v) a computational system to operate the anonymization/publication of files vi) algorithms for comparative and descriptive statistics.
PerformFish-KPIs VRE access is on demand by users registered to the e-Infrastructure. The access and exploitation of the PerformFISH services for Gateway users is regulated by Terms Of Use upon registration; the Gateway Privacy Policy is compliant with EU General Data Protection Regulation (GDPR). VRE for COMPANY: In the PerformFish-KPIs VRE, CNR-ISTI is going to created a workspace for each LTP and aquaculture companies for storage of excel submission forms, for data mining and KPI calculation at company level. VRE for PRODUCERS ASSOCIATIONS: A workspace created exclusively for Producers Associations (P3,4,5,6,21) will storage the KPIs considered by the PerformFISH Consortium at high level of confidentiality. Anonimization, analysis and outputs of these six KPIs will be make available only for Producers Association only. VRE for WORKPACKAGES: In the PerformFish-KPIs VRE, CNR-ISTI will create additional workspaces for storage of data collected in other workpackages of the project, namely WP2,3,4,6, for. Performances of data collected in experimental trials run in WP2-WP6 for testing innovative solutions (e.g. innovative hatchery protocols, feed ingredients and diets, disease managements procedures and medicine and bioactive products) will be tested against the KPI values recorded in WP7 at industrial facilities. This benchmarking analysis will form part of the impact assessment analysis of PerformFISH (task 7.3).

27
28
RESULTS
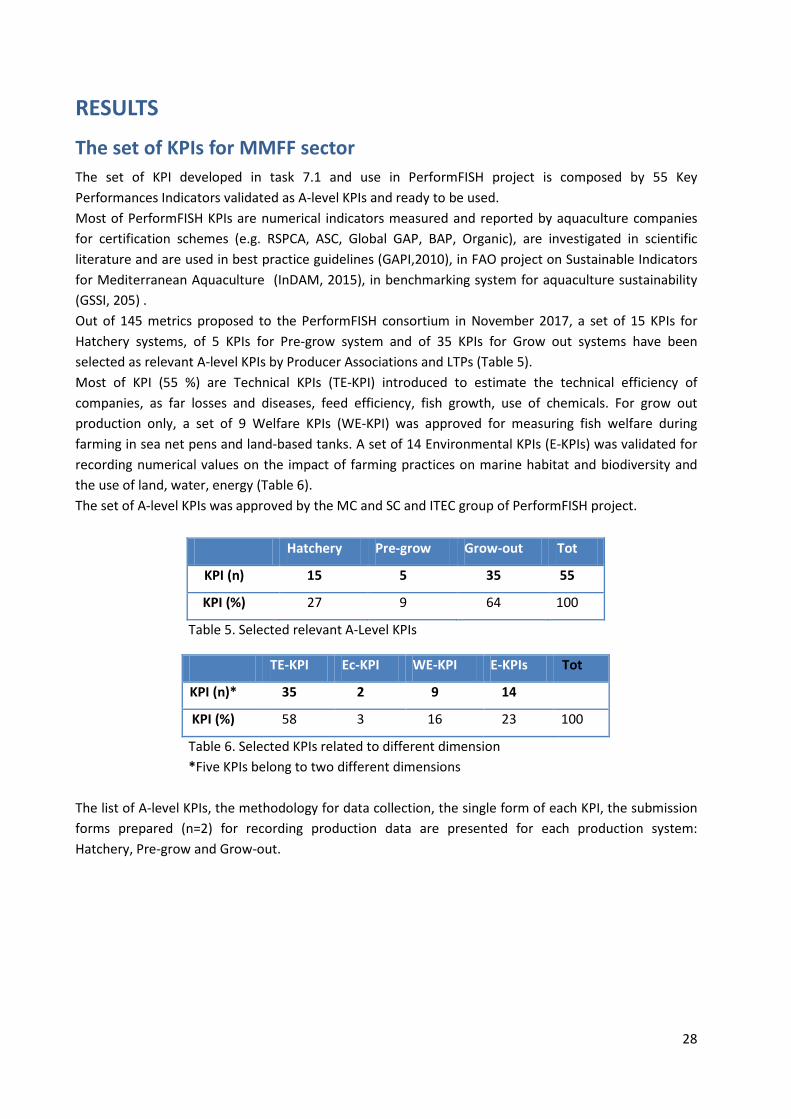
The set of KPIs for MMFF sector The set of KPI developed in task 7.1 and use in PerformFISH project is composed by 55 Key Performances Indicators validated as A-level KPIs and ready to be used. Most of PerformFISH KPIs are numerical indicators measured and reported by aquaculture companies for certification schemes (e.g. RSPCA, ASC, Global GAP, BAP, Organic), are investigated in scientific literature and are used in best practice guidelines (GAPI,2010), in FAO project on Sustainable Indicators for Mediterranean Aquaculture (InDAM, 2015), in benchmarking system for aquaculture sustainability (GSSI, 205) . Out of 145 metrics proposed to the PerformFISH consortium in November 2017, a set of 15 KPIs for Hatchery systems, of 5 KPIs for Pre-grow system and of 35 KPIs for Grow out systems have been selected as relevant A-level KPIs by Producer Associations and LTPs (Table 5). Most of KPI (55 %) are Technical KPIs (TE-KPI) introduced to estimate the technical efficiency of companies, as far losses and diseases, feed efficiency, fish growth, use of chemicals. For grow out production only, a set of 9 Welfare KPIs (WE-KPI) was approved for measuring fish welfare during farming in sea net pens and land-based tanks. A set of 14 Environmental KPIs (E-KPIs) was validated for recording numerical values on the impact of farming practices on marine habitat and biodiversity and the use of land, water, energy (Table 6). The set of A-level KPIs was approved by the MC and SC and ITEC group of PerformFISH project.
Hatchery Pre-grow Grow-out Tot
KPI (n) 15 5 35 55
KPI (%) 27 9 64 100
Table 5. Selected relevant A-Level KPIs
TE-KPI Ec-KPI WE-KPI E-KPIs Tot
KPI (n)* 35 2 9 14
KPI (%) 58 3 16 23 100
Table 6. Selected KPIs related to different dimension *Five KPIs belong to two different dimensions
The list of A-level KPIs, the methodology for data collection, the single form of each KPI, the submission forms prepared (n=2) for recording production data are presented for each production system: Hatchery, Pre-grow and Grow-out.

29
Sensitive production data Producers Associations and aquaculture companies are committed with the principle to avoid the discharge of chemicals toxic for wild life and recognised the importance of effectively control the use and the frequency of chemicals, including the potential risks for aquatic environment (flora and fauna) and to human health for microbial resistance. There is a set of KPIs conceived to analyse for the first time the “Dependency on antibiotic and antiparasistic treatments” of the MMFF sector. It is composed of 4 KPIs, based on the number of antibiotic and antiparasistic treatments per year G9, G10 and the amount of antibiotic and antiparasistic active compounds (G11,G12), normalised by ton of biomass. These latter two have been deemed as high level sensitive KPIs and numerical values provided in the submission forms by LTPs and other companies will be kept confidential to Producers Associations (P3,4,5,6,21). Fish escapees from the industrial facilities is also an issue of great environmental concern for Mediterranean aquaculture, because of potential impact for genetic loss, predation and competition, habitat damage and other impacts on wild life and ecosystems. Knowledge of the extent and causes of escape incidents from sea bass and sea bream net pen facilities is completely lacking (SeaFood Watch, 2014). Producers Associations and aquaculture companies are committed with the principle that farming practices at aquaculture facilities should not pose deleterious effects on wild population and provide data for the estimation of escapee of from sea bass and sea bream batches at industrial facilities. The three E-KPIs measuring, on yearly basis, the number of escapee episodes (G23) and the estimation of the number of escaped (G24) and the impact of farming practices on marine wildlife, as interactions with marine mammals, birds, fish, reptiles (G25) will be also kept confidential to Producers Associations. For these KPIs (Table 7) the numerical values provided in the submission forms by LTPs and other companies, will be stored in a dedicated repository in the KPI-VRE created for Associations. The policies and the term of use of this VRE for Associations will be defined in the Task.7.2. All the data collected on these KPIs were recognized by PerformFISH Consortium as high sensitive information and will be thus stored in a special VRE inside D4Science PerformFISH Gateway and kept strictly confidential for Producer Associations, who will decide in agreement with the PerformFISH consortium how to deliver the processed data.
G11 Amount of active compounds - antiparasitic (total & by disease) G12 Amount of active compounds - antibiotic (total & by disease) G23 Escapes – Number of episodes G24 Escapes – Estimated number of escaped fish G25 Endangered marine mammals, reptiles, fishes and birds lethal incidents
Table 7 List of A-level KPIs manage at Producer Associations level
30
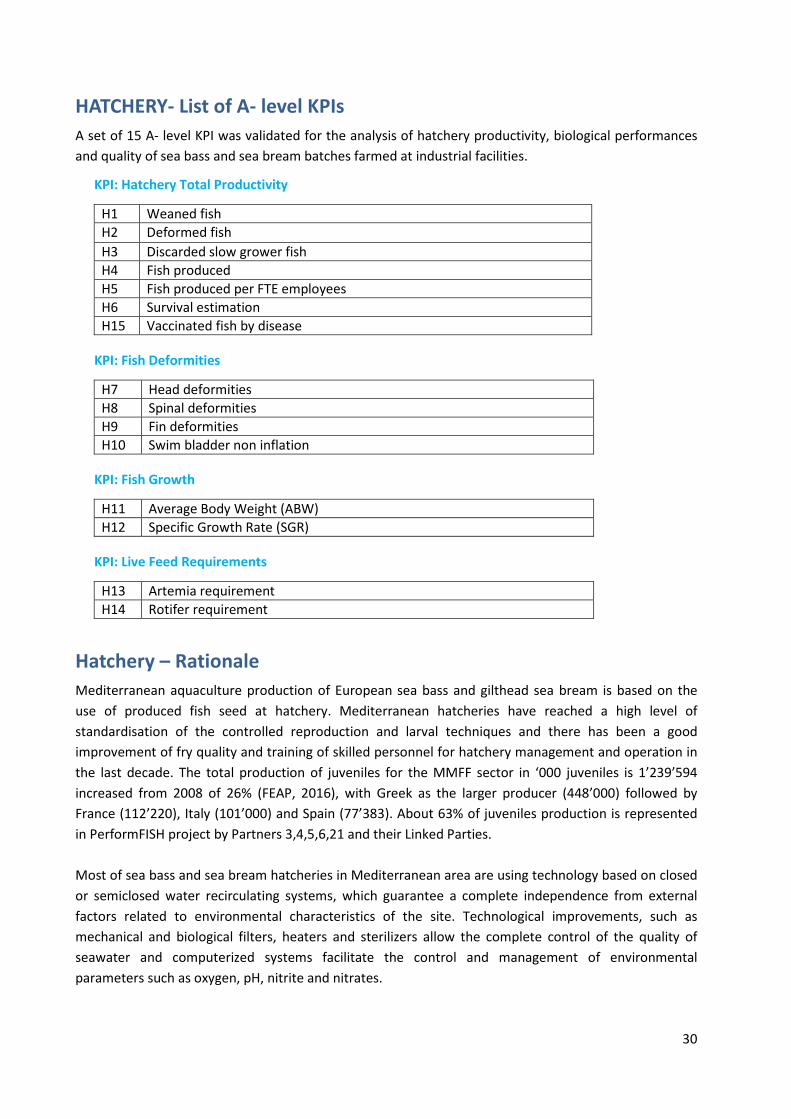
HATCHERY- List of A- level KPIs A set of 15 A- level KPI was validated for the analysis of hatchery productivity, biological performances and quality of sea bass and sea bream batches farmed at industrial facilities.
KPI: Hatchery Total Productivity
H1 Weaned fish H2 Deformed fish H3 Discarded slow grower fish H4 Fish produced H5 Fish produced per FTE employees H6 Survival estimation H15 Vaccinated fish by disease
KPI: Fish Deformities
H7 Head deformities H8 Spinal deformities H9 Fin deformities H10 Swim bladder non inflation
KPI: Fish Growth
H11 Average Body Weight (ABW) H12 Specific Growth Rate (SGR)
KPI: Live Feed Requirements
H13 Artemia requirement H14 Rotifer requirement
Hatchery – Rationale Mediterranean aquaculture production of European sea bass and gilthead sea bream is based on the use of produced fish seed at hatchery. Mediterranean hatcheries have reached a high level of standardisation of the controlled reproduction and larval techniques and there has been a good improvement of fry quality and training of skilled personnel for hatchery management and operation in the last decade. The total production of juveniles for the MMFF sector in ‘000 juveniles is 1’239’594 increased from 2008 of 26% (FEAP, 2016), with Greek as the larger producer (448’000) followed by France (112’220), Italy (101’000) and Spain (77’383). About 63% of juveniles production is represented in PerformFISH project by Partners 3,4,5,6,21 and their Linked Parties. Most of sea bass and sea bream hatcheries in Mediterranean area are using technology based on closed or semiclosed water recirculating systems, which guarantee a complete independence from external factors related to environmental characteristics of the site. Technological improvements, such as mechanical and biological filters, heaters and sterilizers allow the complete control of the quality of seawater and computerized systems facilitate the control and management of environmental parameters such as oxygen, pH, nitrite and nitrates.

31
Sea bass and sea bream are winter spawning species and spawning for sea bream started is in November and sea bass in December and last to March, in combination with gilthead sea bream. The production cycle last about four months, that is the time normally required to produce 2 g fry starting from viable larvae, at a water temperature of 18 to 20°C. At present most hatcheries used to extend the hatchery production period throughout most of the year by mimic different thermo-photoperiod and manipulating the maturation cycles of breeders. This production strategy has the great advantage to guarantee the availability of fry beyond the natural season and is applied by all hatcheries companies involved as LTPs in PerformFISH (Table 4a). The manipulation and conditioning of broodstock and management of larvae out of natural reproductive period require a good knowledge of biology of species and a careful management of breeders and larvae to avoid larval batches of low quality (Carrillo et al., 1989). In PerformFISH benchmarking system the collection of production data at hatchery facilities for KPIs is parameterized on three different reproductive periods (natural period, early period and late period). It allows the analysis of the performances of different batches produced out of natural reproductive period and the analysis of larval batch quality, as occurrence and prevalence of deformed and slow grower fish. Malformations in farmed juveniles are a prime research topic as it has a major impact on fish welfare and on the economical value of the product. Under hatchery conditions, marine fish larvae undergo major functional and morphological changes during the developmental stages and several factors can interfere with ontogenetic development of larvae and affect fry quality. Morphological malformations of the skeleton, such as spinal malformation-scoliosis, lordosis, coiled vertebral column, missing or additional fin rays, bending opercle and jaw malformations, are frequently observed in hatchery-reared larvae of sea bass and sea bream (Boglione et al., 2013). There is a wide spectrum of scientific papers and grey literature investigating the type of morphological abnormalities of sea bass and sea bream early life stages, the possible causes and the way of quantifying severity and the impact on the final product's image, fish shape and fish performances (Conceicao, et al. 2018). The most severe deformities in sea bass and sea bream juveniles affect the spinal column in the form of kyphosis, lordosis or a mix of them. The absence of swimbladder (non inflated) is probably at the origin of lordosis , although this is not, however, the only possible cause. When swimbladder is regularly inflated, the cause of spinal deformity has been found in the high water currents in larval tanks, exceeding 10 cm s-1 during the early weaning phase (Divanach et al., 1997). Several other risk factors, related to elevated temperatures and photoperiod manipulation, environmental conditions and feed composition have been identified in literature, but a clear understanding of the interdependency of genetics, development, rearing environment and feed ingredients is still lacking (Aquaexcel project, D3.2). At present, most of studies on the heritability of malformation traits estimates the sensitivity of fish to the particular hatchery environment as a function of different body weight genotypes (Bardon, 2009; Negrìn-Bàez, 2015; Koumondoros, 2018). Lordosis is one of the most severe deformities developing in reared fish and the evaluation of its effects on fish and economic loss for aquaculture industry has been difficult to establish, since there is no objective way of quantifying its severity and impact. Studies on the effect of lordosis on body shape, analysed by geometric morphometrics, allowed the quantification of lordosis by morphological

32
landmarks and suggested the possible use of body shape as a index for a precise quality assessment of reared sea bass (Sfakianakis et al., 2006). At hatchery level, the monitoring morphological larval quality starts from the beginning of rearing process and is a way to control standard operating procedures and correct accidental methodological deviations and management operations. Searching for deformities is a routine work during production process at hatchery in order to sort out larvae with non inflated swimbladder and deformed fish at nursery stages. Sorting of malformed fish is usually performed at end of weaning period and during grading procedures on the fish collected to assess size. A careful visual examination on tank population is the most common method to detect abnormal fry at grading and to find deformed fish that are discarded during production process. Analysis of larval morphometry and stereoscopic observations are also used by operators, together with observations of swimming behaviour, which may reveal ontogenetic abnormalities. A major drawback for hatchery industrial production is the long ontogenic period in which a deformity can develop (Koumoundouros, 2010) that leads to the possibility that most of skeletal deformities can become fully develop to be visually and thus identifiable only when fish are over 0.5 g in size. Soft X-rays method are usually used on fingerlings being sold, as a proof of their quality. At present there is still no a unique method of classification of morphological abnormalities of different ontogentic stages of sea bass and sea bream and there are not normalised criteria between companies to define whether an individual is deformed or not. There are still large discrepancies in the evaluation of the types of morphological abnormalities, on the prevalence, the estimation of economic losses and for measurement criteria between the companies, and sometime also in the companies themselves (Aquaexcel project, D3.2). The development of a unique monitoring tool for a precise and accurate estimation of larval quality and a scale of quality for the quantification of the effects of deformities on external morphology of fish (Loy et al., 2000; Sfakaniakis et al., 2006) and the correlation of phenotypes of early juveniles and with biological performances of fish at grow out stage are really urgent (Conceicao et al., 2018) (Capitolo 10 Quality descriptors and predictors in farmed marine fish larvae and juveniles and the correlation of morphological quality at different ontogenetic stages at hatchery and the quality of fish is under investigation in the present project (WP2, task 2.2.2, 2.2.) to develop a predictive tool for quality assessment for sea bass and sea bream hatchery juveniles (task 2.2.4). Considering the lack of a common operational tool for quality assessment of hatchery batches, the benchmarking system for batch deformities included four KPIs (H7, H8, H9, H10) based on the scientific literature (Koumoundouros et al. 1997; Boglione et al. 2001; Koumoundouros 2010; Boglione et al., 2013).
H7. fish head deformities (cranial, jaw and the operculum complex deformities) H8.spinal column deformities (lordosis, kyphosis and vertebral fusion) H9. fin deformities H10. non-inflation of swimbladder
The numerical and operational values of deformities will be recorded at batch and farm level and at different ontogenetic stages, expressed in degree days, to support producers in the comparative analyse of the quality of production batches and the pattern of morphological deformities.

33
Hatchery is an expensive component of sea bass and sea bream production and aquaculture companies are interested in improving technical efficiency and productivity to make hatchery more profitable. A set of 7 KPIs has been validated to benchmark the productivity of hatchery companies (H1-H6, H15) along the production cycle through the calculation of index of survival, deformed, and slow grower fish, vaccination, and the number of fish produced for Full Time Employes (FTE). Live feeds is also a key component of hatchery production cycle and represent a expensive part of production costs. The early life stages of sea bass and gilthead sea bream are zooplankton-feeders and their successful rearing depends on an adequate supply of high quality live rotifers (Brachionus plicatilis) fed on unicellular algae and brine shrimp (Artemia spp). The amount of live feed, as rotifer and Artemia required to produce juveniles (H11, H12), are deemed as reliable A-Level KPI to analysis the efficiency of hatchery live feed management, at batch and farm level.
Hatchery - Parameterization of production cycle and data collection Recording uniform KPI is strategic for the correct interpretation of performances among different hatcheries and for benchmarking. Data collection on-farm is an important and unique source of information for comparative analysis and for benchmarking the performances of a given batch at hatchery and between hatcheries. For the purpose of WP7, hatchery production cycle is parameterized as follow:
• Hatchery/nursery period, is the initial part of production process in sea bass and sea bream production. It is implemented in land– based establishments and starts from egg to the end of weaning period (Hatchery period) and from the end of weaning to 2400 degree-days (Nursery period). For the purpose of KPI analysis, hatchery and nursery periods are analysed together and the term here used is shortly reported as “Hatchery”. Hatcheries are usually operated using partially or full water recirculating system (RAS) while full open flow through water systems are rarely adopted.
• Degree days, a degree day is computed as the integral of a function of time that generally varies with temperature. It is the unit of measure chosen to reduce the risk of misinterpretation of results related to biological performances of larvae and juveniles at different temperature regimes.
• Stocking period, is the time when larvae are stocked in hatchery tanks for production cycle. Three different stocking periods are considered to align with routine management procedures used in some hatcheries where the manipulation of thermo and photoperiod is used to extend the reproductive period. Early stocking period is when larvae stocked in hatcheries where obtained from spawning emissions occurring earlier than natural spawning period (July to October); Late stocking period is when egg and larvae stocked in hatcheries where obtained from spawning emissions occurring later than natural spawning period (March to June)
Parameterization for data collection Data recording for KPIs is performed both at production batch level and at farm level:
• BATCH level: data recorded for 1 single production batch, as a group of larvae coming from one or more spawning emissions collected within a 7 days period and managed in one or more hatchery tanks as a single unit until the end of the nursery period

34
• FARM level: data recorded for several production batches coming from multiple spawning emissions in the same stocking period. Data are submitted as aggregated data for the multiple batches in the stocking period.
Collection of production data at hatchery is parameterized according to the three stocking periods in the hatchery:
• EARLY STOCKING period: from July to October • NATURAL STOCKING period: from November to February • LATE STOCKING period: from March to June
Production data will be recorded at standard intervals, which should be consistent among monitored batches.
At BATCH level data collection is parameterized as follow
• Stocking, • at 500 degree days for swim bladder inflation, • at the end of weaning, • at 1200 degree days, • at 1800 degree days • at 2400 degree days, • at the end of cycle.
At FARM level data recording is parameterized:
• at stocking, • at the end of weaning, • and at 2400 degree days
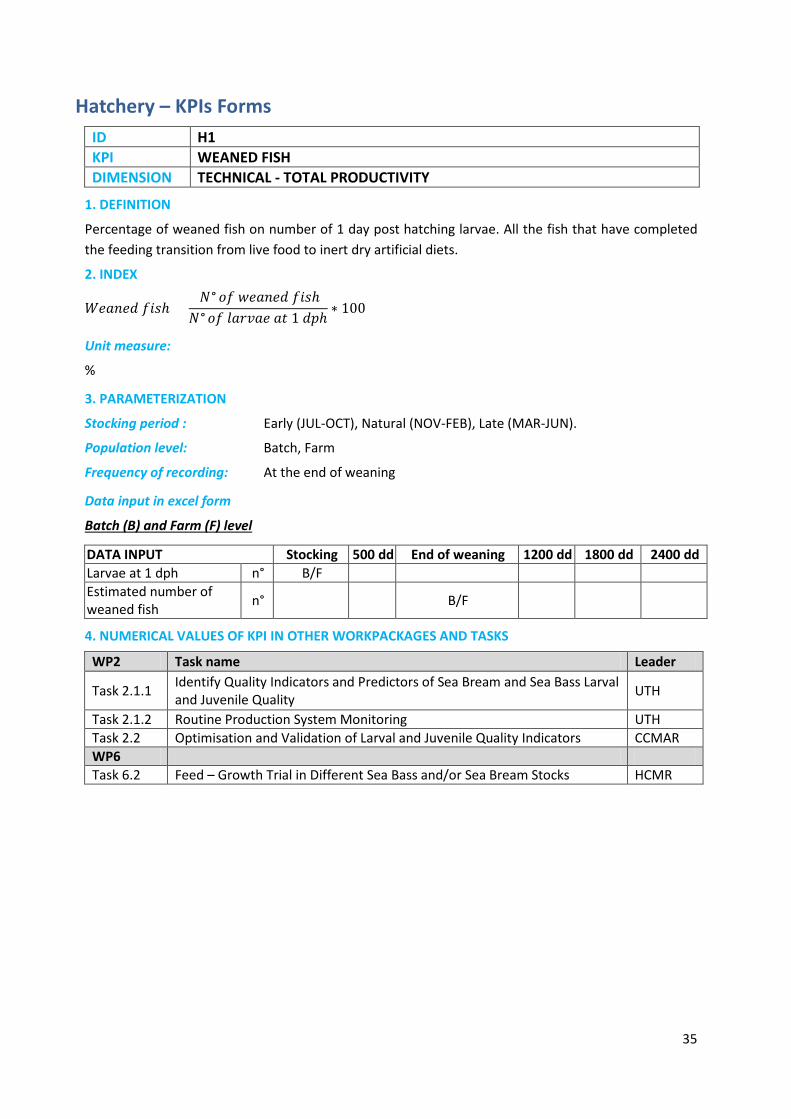
35
Hatchery – KPIs Forms ID H1 KPI WEANED FISH DIMENSION TECHNICAL - TOTAL PRODUCTIVITY
1. DEFINITION
Percentage of weaned fish on number of 1 day post hatching larvae. All the fish that have completed the feeding transition from live food to inert dry artificial diets.
2. INDEX
𝑊𝑒𝑎𝑛𝑒𝑑 𝑓𝑖𝑠ℎ = 𝑁° 𝑜𝑓 𝑤𝑒𝑎𝑛𝑒𝑑 𝑓𝑖𝑠ℎ𝑁° 𝑜𝑓 𝑙𝑎𝑟𝑣𝑎𝑒 𝑎𝑡 1 𝑑𝑝ℎ
∗ 100
Unit measure:
%
3. PARAMETERIZATION
Stocking period : Early (JUL-OCT), Natural (NOV-FEB), Late (MAR-JUN).
Population level: Batch, Farm
Frequency of recording: At the end of weaning
Data input in excel form
Batch (B) and Farm (F) level
DATA INPUT Stocking 500 dd End of weaning 1200 dd 1800 dd 2400 dd Larvae at 1 dph n° B/F Estimated number of weaned fish n° B/F
4. NUMERICAL VALUES OF KPI IN OTHER WORKPACKAGES AND TASKS
WP2 Task name Leader
Task 2.1.1 Identify Quality Indicators and Predictors of Sea Bream and Sea Bass Larval and Juvenile Quality UTH
Task 2.1.2 Routine Production System Monitoring UTH Task 2.2 Optimisation and Validation of Larval and Juvenile Quality Indicators CCMAR WP6 Task 6.2 Feed – Growth Trial in Different Sea Bass and/or Sea Bream Stocks HCMR

36
ID H2 KPI DEFORMED FISH DIMENSION TECHNICAL - TOTAL PRODUCTIVITY
1. DEFINITION
Percentage of discarded deformed fish on number of 1 day post hatching larvae
2. INDEX
𝐷𝑒𝑓𝑜𝑟𝑚𝑒𝑑 𝑓𝑖𝑠ℎ = 𝑁° 𝑜𝑓 𝑑𝑒𝑓𝑜𝑟𝑚𝑒𝑑 𝑓𝑖𝑠ℎ𝑁° 𝑜𝑓 𝑙𝑎𝑟𝑣𝑎𝑒 𝑎𝑡 1 𝑑𝑝ℎ
∗ 100
Unit measure:
%
3. PARAMETERIZATION
Stocking period: Early (JUL-OCT), Natural (NOV-FEB), Late (MAR-JUN).
Population level: Batch, Farm
Frequency of recording: Batch: at 1200, 1800 dd, 2400 dd Farm: at 2400 dd
Data input in excel form
Batch (B) and Farm (F) level
DATA INPUT Stocking 500 dd End of weaning 1200 dd 1800 dd 2400 dd
Larvae at 1 dph n° B/F Number of fish discarded with head deformities n° B1 B1 B1/F2
Number of fish discarded with spinal deformities n° B1 B1 B1/F2
Number of fish discarded with fin deformities n° B1 B1 B1/F2
4. NUMERICAL VALUES OF KPI IN OTHER WORKPACKAGES AND TASKS
WP2 Task name Leader
Task 2.1.1 Identify Quality Indicators and Predictors of Sea Bream and Sea Bass Larval and Juvenile Quality UTH
Task 2.1.2 Routine Production System Monitoring UTH Task 2.2 Optimisation and Validation of Larval and Juvenile Quality Indicators CCMAR WP6 Task 6.2 Feed – Growth Trial in Different Sea Bass and/or Sea Bream Stocks HCMR
Notes: 1 Estimated number of fish with deformities removed from the batch and discarded during the reference period (e.g. the time interval between 1800 dd and 2400 dd) 2 Estimated number of fish with deformities removed from the batches included in the aggregated ID batch and discarded from stocking to 2400 dd

37
ID H3 KPI DISCARDED SLOW GROWER FISH DIMENSION TECHNICAL - TOTAL PRODUCTIVITY
1. DEFINITION Percentage of discarded slow grower fish on number of 1 day post hatching larvae 2. INDEX
𝐷𝑖𝑠𝑐𝑎𝑟𝑑𝑒𝑑 𝑠𝑙𝑜𝑤 𝑔𝑟𝑜𝑤𝑒𝑟 𝑓𝑖𝑠ℎ = 𝑁° 𝑜𝑓 𝑑𝑖𝑠𝑐𝑎𝑟𝑑𝑒𝑑 𝑓𝑖𝑠ℎ𝑁° 𝑜𝑓 𝑙𝑎𝑟𝑣𝑎𝑒 𝑎𝑡 1 𝑑𝑝ℎ
∗ 100
Unit measure
% 3. PARAMETERIZATION
Stocking period: E arly (JUL-OCT), Natural (NOV-FEB), Late (MAR-JUN).
Population level: Batch, Farm
Frequency of recording: Batch: at 1200, 1800 dd, 2400 dd Farm: at 2400 dd
Data input in excel form Batch (B) and Farm (F) level
DATA INPUT Stocking 500 dd End of weaning 1200 dd 1800 dd 2400 dd
Larvae at 1 dph n° B/F Number of discarded slow grower fish n° B1 B1 B1/F2
4. NUMERICAL VALUES OF KPI IN OTHER WORKPACKAGES AND TASKS
WP2 Task name Leader
Task 2.1.1 Identify Quality Indicators and Predictors of Sea Bream and Sea Bass Larval and Juvenile Quality UTH
Task 2.1.2 Routine Production System Monitoring UTH Task 2.2 Optimisation and Validation of Larval and Juvenile Quality Indicators CCMAR WP6 Task 6.2 Feed – Growth Trial in Different Sea Bass and/or Sea Bream Stocks HCMR
Notes: 1 Estimated number of discarded slow grower fish during the reference period (e.g. the time interval between 1800 dd and 2400 dd) 2 Total number of fish discarded for slow growing during the whole rearing period

38
ID H4 KPI FISH PRODUCED DIMENSION TECHNICAL - TOTAL PRODUCTIVITY
1. DEFINITION
Percentage of produced fish, for both internal use or for selling, on number of 1 day post hatching larvae
2. INDEX
𝐹𝑖𝑠ℎ 𝑝𝑟𝑜𝑑𝑢𝑐𝑒𝑑 = 𝑁° 𝑜𝑓 𝑓𝑖𝑠ℎ 𝑝𝑟𝑜𝑑𝑢𝑐𝑒𝑑𝑁° 𝑜𝑓 𝑙𝑎𝑟𝑣𝑎𝑒 𝑎𝑡 1 𝑑𝑝ℎ
∗ 100
Unit measure
%
3. PARAMETERIZATION
Stocking period: Early (JUL-OCT), Natural (NOV-FEB), Late (MAR-JUN).
Population level: Batch, Farm
Frequency of recording : Batch:at 2400 dd, end of cycle Farm: at 2400 dd
Data input in excel form
Batch (B) and Farm (F) level
DATA INPUT Stocking 500 dd End of weaning 1200 dd 1800 dd 2400 dd End of
cycle Larvae at 1 dph n° B/F Estimated number of fish1 n° B1/F B2
4. NUMERICAL VALUES OF KPI IN OTHER WORKPACKAGES AND TASKS
WP2 Task name Leader
Task 2.1.1 Identify Quality Indicators and Predictors of Sea Bream and Sea Bass Larval and Juvenile Quality UTH
Task 2.1.2 Routine Production System Monitoring UTH Task 2.2 Optimisation and Validation of Larval and Juvenile Quality Indicators CCMAR WP6 Task 6.2 Feed – Growth Trial in Different Sea Bass and/or Sea Bream Stocks HCMR
Notes: 1 Total estimated number of fish produced per batches during period. Estimation of fish produced is calculated before fish sorting 2 Total number of fish produced at the end of the production cycle (e.g. when the batch is sold or delivered outside the nursery).

39
ID H5 KPI FISH PRODUCED PER FTE EMPLOYEES DIMENSION ECONOMIC - TOTAL PRODUCTIVITY
1. DEFINITION
Number of millions fish produced at the end of production cycle per number of employees (FTE - Full Time Equivalents) involved in the production cycle.
2. INDEX
𝐹𝑖𝑠ℎ 𝑝𝑟𝑜𝑑𝑢𝑐𝑒𝑑 𝑝𝑒𝑟 𝐹𝑇𝐸 𝑒𝑚𝑝𝑙𝑜𝑦𝑒𝑒𝑠 = 𝑁° 𝑜𝑓 𝑓𝑖𝑠ℎ 𝑝𝑟𝑜𝑑𝑢𝑐𝑒𝑑
𝑁° 𝑜𝑓 𝑒𝑚𝑝𝑙𝑜𝑦𝑒𝑒𝑠 (𝐹𝑇𝐸)
Unit measure
Number fish /FTE employees
3. PARAMETERIZATION
Stocking period: Early (JUL-OCT), Natural (NOV-FEB), Late (MAR-JUN).
Population level: Batch, Farm
Frequency of recording: Batch: 2400 dd Farm: at 2400 dd
Data input in excel form
Batch (B) and Farm (F) level
DATA INPUT Stocking End of weaning 2400 dd
Estimated number of fish n° B/F
Number of FTE employees1 n° Hatchery facility data for B/F
Notes: 1The concept is used to convert the hours worked by several part-time employees into the hours worked by full-time employees. On an annual basis, an FTE is considered to work the total number of hours worked by a full time employee, therefore each part time employee is accounted as FTE with the following calculation: actual number of working hours in one year of the part time employee (included paid leaves)/annual number of working hours of a full time employee (including paid leaves).
Only employees actually working in the production process should be considered (secretaries or marketing employees have not been included not included). If an employee holds different duties, only the hours spent in the production process will be taken into account.

40
ID H6 KPI SURVIVAL ESTIMATION DIMENSION TECHNICAL - TOTAL PRODUCTIVITY
1. DEFINITION
An indicator of the survival at fixed degrees days on number of 1 day post hatching larvae
2. INDEX
𝑆𝑢𝑟𝑣𝑖𝑣𝑎𝑙 𝑒𝑠𝑡𝑖𝑚𝑎𝑡𝑖𝑜𝑛 = 𝑁° 𝑜𝑓 𝑓𝑖𝑠ℎ 𝑎𝑙𝑖𝑣𝑒
𝑁° 𝑜𝑓 𝑙𝑎𝑟𝑣𝑎𝑒 𝑎𝑡 1𝑑𝑝ℎ∗ 100
Unit measure
%
3. PARAMETERIZATION
Stocking period: Early (JUL-OCT), Natural (NOV-FEB), Late (MAR-JUN).
Population level: Batch, Farm
Frequency of recording: Batch: at 1200, 1800 dd, 2400 dd Farm: at 2400 dd
Data input in excel form
Batch (B) and Farm (F) level
DATA INPUT Stocking 500 dd End of weaning 1200 dd 1800 dd 2400 dd
Larvae at 1 dph n° B/F Estimated number of fish1 n° B B B/F
1 Total estimated number of fish produced during the rearing period
4. NUMERICAL VALUES OF KPI IN OTHER WORKPACKAGES AND TASKS
WP2 Task name Leader
Task 2.1.1 Identify Quality Indicators and Predictors of Sea Bream and Sea Bass Larval and Juvenile Quality UTH
Task 2.1.2 Routine Production System Monitoring UTH Task 2.2 Optimisation and Validation of Larval and Juvenile Quality Indicators CCMAR WP3 Task 3.1 Epidemiology and Health Risk Assessment UAB WP6 Task 6.2 Feed – Growth Trial in Different Sea Bass and/or Sea Bream Stocks HCMR

41
ID H7 KPI HEAD DEFORMITIES DIMENSION TECHNICAL - DEFORMITIES
1. DEFINITION
Percentage of fish with head deformities, operculum included, on number of 1 day post hatching larvae.
2. INDEX
𝐻𝑒𝑎𝑑 𝑑𝑒𝑓𝑜𝑟𝑚𝑖𝑡𝑖𝑒𝑠 = 𝑁° 𝑜𝑓 𝑓𝑖𝑠ℎ 𝑤𝑖𝑡ℎ ℎ𝑒𝑎𝑑 𝑑𝑒𝑓𝑜𝑟𝑚𝑖𝑡𝑖𝑒𝑠
𝑁° 𝑜𝑓 𝑙𝑎𝑟𝑣𝑎𝑒 𝑎𝑡 1 𝑑𝑝ℎ∗ 100
Unit measure
%
3. PARAMETERIZATION
Stocking period: Early (JUL-OCT), Natural (NOV-FEB), Late (MAR-JUN).
Population level: Batch, Farm
Frequency of recording: Batch: end of weaning, 2400 dd Farm: end of weaning at 2400 dd
Data input in excel form
Batch (B) and Farm (F) level
DATA INPUT Stocking 500 dd End of weaning 1200 dd 1800 dd 2400 dd
Fish with Head deformities % B/F B/F Estimated number of fish1 n° B/F
1 Total estimated number of fish produced during the rearing period
4. NUMERICAL VALUES OF KPI IN OTHER WORKPACKAGES AND TASKS
WP2 Task name Leader
Task 2.1.1 Identify Quality Indicators and Predictors of Sea Bream and Sea Bass Larval and Juvenile Quality UTH
Task 2.1.2 Routine Production System Monitoring UTH Task 2.2 Optimisation and Validation of Larval and Juvenile Quality Indicators CCMAR WP6 Task 6.2 Feed – Growth Trial in Different Sea Bass and/or Sea Bream Stocks HCMR

42
ID H8 KPI SPINAL DEFORMITIES DIMENSION TECHNICAL - DEFORMITIES
1. DEFINITION
Percentage of fish with spinal deformities on number of 1 day post hatching larvae.
2. INDEX
𝑆𝑝𝑖𝑛𝑎𝑙 𝑑𝑒𝑓𝑜𝑟𝑚𝑖𝑡𝑖𝑒𝑠 = 𝑁° 𝑜𝑓 𝑓𝑖𝑠ℎ 𝑤𝑖𝑡ℎ 𝑠𝑝𝑖𝑛𝑎𝑙 𝑑𝑒𝑓𝑜𝑟𝑚𝑖𝑡𝑖𝑒𝑠
𝑁° 𝑜𝑓 𝑙𝑎𝑟𝑣𝑎𝑒 𝑎𝑡 1𝑑𝑝ℎ∗ 100
Unit measure
%
3. PARAMETERIZATION
Stocking period: Early (JUL-OCT), Natural (NOV-FEB), Late (MAR-JUN).
Population level: Batch, Farm
Frequency of recording: Batch: end of weaning, at 2400 dd Farm: end of weaning at 2400 dd
Data input in excel form
Batch (B) and Farm (F) level
DATA INPUT Stocking 500 dd End of weaning 1200 dd 1800 dd 2400 dd
Fish with Spinal deformities % B/F B/F Estimated number of fish1 n° B/F
1Total estimated number of fish produced during the rearing period
4. NUMERICAL VALUES OF KPI IN OTHER WORKPACKAGES AND TASKS
WP2 Task name Leader
Task 2.1.1 Identify Quality Indicators and Predictors of Sea Bream and Sea Bass Larval and Juvenile Quality UTH
Task 2.1.2 Routine Production System Monitoring UTH Task 2.2 Optimisation and Validation of Larval and Juvenile Quality Indicators CCMAR WP6 Task 6.2 Feed – Growth Trial in Different Sea Bass and/or Sea Bream Stocks HCMR

43
ID H9 KPI FIN DEFORMITIES DIMENSION TECHNICAL - DEFORMITIES
1. DEFINITION
Percentage of fish with fin deformities on number of 1 day post hatching larvae.
2. INDEX
𝐹𝑖𝑛 𝑑𝑒𝑓𝑜𝑟𝑚𝑖𝑡𝑖𝑒𝑠 = 𝑁° 𝑜𝑓 𝑓𝑖𝑠ℎ 𝑤𝑖𝑡ℎ 𝑓𝑖𝑛 𝑑𝑒𝑓𝑜𝑟𝑚𝑖𝑡𝑖𝑒𝑠
𝑁° 𝑜𝑓 𝑙𝑎𝑟𝑣𝑎𝑒 𝑎𝑡 1 𝑑𝑝ℎ∗ 100
Unit measure
%
3. PARAMETERIZATION
Stocking period: Early (JUL-OCT), Natural (NOV-FEB), Late (MAR-JUN).
Population level: Batch, Farm
Frequency of recording: Batch: end of weaning, at 2400 dd Farm: end of weaning at 2400 dd
Data input in excel form
Batch (B) and Farm (F) level
DATA INPUT Stocking 500 dd End of weaning 1200 dd 1800 dd 2400 dd
Fish with Fin deformities % B/F B/F Estimated number of fish1 n° B/F
1Total estimated number of fish produced during the rearing period
4. NUMERICAL VALUES OF KPI IN OTHER WORKPACKAGES AND TASKS
WP2 Task name Leader
Task 2.1.1 Identify Quality Indicators and Predictors of Sea Bream and Sea Bass Larval and Juvenile Quality UTH
Task 2.1.2 Routine Production System Monitoring UTH Task 2.2 Optimisation and Validation of Larval and Juvenile Quality Indicators CCMAR WP6 Task 6.2 Feed – Growth Trial in Different Sea Bass and/or Sea Bream Stocks HCMR
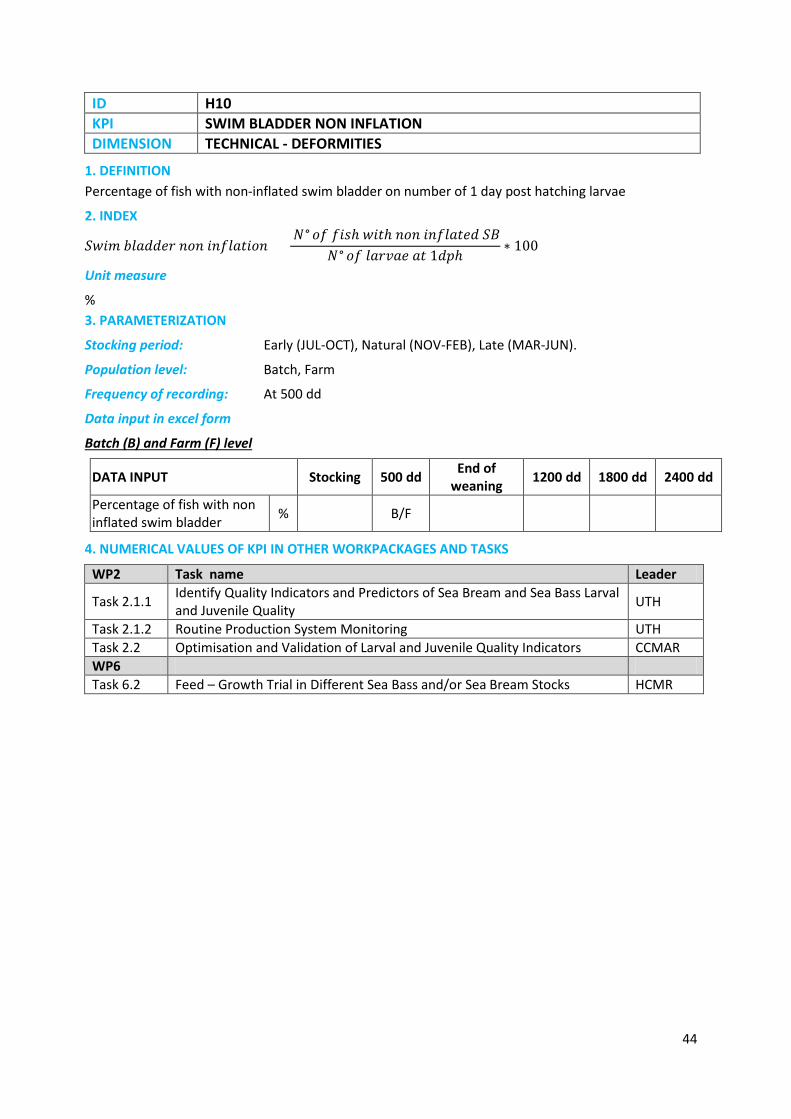
44
ID H10 KPI SWIM BLADDER NON INFLATION DIMENSION TECHNICAL - DEFORMITIES
1. DEFINITION Percentage of fish with non-inflated swim bladder on number of 1 day post hatching larvae
2. INDEX
𝑆𝑤𝑖𝑚 𝑏𝑙𝑎𝑑𝑑𝑒𝑟 𝑛𝑜𝑛 𝑖𝑛𝑓𝑙𝑎𝑡𝑖𝑜𝑛 = 𝑁° 𝑜𝑓 𝑓𝑖𝑠ℎ 𝑤𝑖𝑡ℎ 𝑛𝑜𝑛 𝑖𝑛𝑓𝑙𝑎𝑡𝑒𝑑 𝑆𝐵
𝑁° 𝑜𝑓 𝑙𝑎𝑟𝑣𝑎𝑒 𝑎𝑡 1𝑑𝑝ℎ∗ 100
Unit measure
% 3. PARAMETERIZATION
Stocking period: Early (JUL-OCT), Natural (NOV-FEB), Late (MAR-JUN).
Population level: Batch, Farm
Frequency of recording: At 500 dd
Data input in excel form
Batch (B) and Farm (F) level
DATA INPUT Stocking 500 dd End of weaning 1200 dd 1800 dd 2400 dd
Percentage of fish with non inflated swim bladder % B/F
4. NUMERICAL VALUES OF KPI IN OTHER WORKPACKAGES AND TASKS
WP2 Task name Leader
Task 2.1.1 Identify Quality Indicators and Predictors of Sea Bream and Sea Bass Larval and Juvenile Quality UTH
Task 2.1.2 Routine Production System Monitoring UTH Task 2.2 Optimisation and Validation of Larval and Juvenile Quality Indicators CCMAR WP6 Task 6.2 Feed – Growth Trial in Different Sea Bass and/or Sea Bream Stocks HCMR

45
ID H11 KPI AVERAGE BODY WEIGHT DIMENSION TECHNICAL - GROWTH
1. DEFINITION
The wet weight of fish measured as the average body weight at fixed time intervals (given the average density and temperature).
2. INDEX
𝐴𝑣𝑒𝑟𝑎𝑔𝑒 𝑏𝑜𝑑𝑦 𝑤𝑒𝑖𝑔ℎ𝑡 = 𝑇𝑜𝑡𝑎𝑙 𝑤𝑒𝑖𝑔ℎ𝑡𝑁° 𝑜𝑓 𝑓𝑖𝑠ℎ
Unit measure
g
3. PARAMETERIZATION
Stocking period: Early (JUL-OCT), Natural (NOV-FEB), Late (MAR-JUN).
Population level: Batch
Frequency of recording: Batch: end of weaning, 1200 dd, 1800 dd, 2400 dd
Data input in excel form
Only at Batch level
DATA INPUT Stocking 500 dd End of weaning 1200 dd 1800 dd 2400 dd
Average wet weight of fish mg B B B B Estimated number of fish n° B B B
4. NUMERICAL VALUES OF KPI IN OTHER WORKPACKAGES AND TASKS
WP2 Task name Leader Task 2.1.2 Routine Production System Monitoring UTH
Task 2.3 Larval and Juvenile Quality Indicators - Optimising Production Traits by Modifying Hatchery Conditions UoC
Task 2.3.1 Quality Manipulators - Temperature Treatments UoC
Task 2.3.2 To Estimate the Correlation of Fish Quality Between Different Ontogenetic Stages Maintained Under Different Temperature Regimes UoC
WP6 Task 6.2 Feed – Growth Trial in Different Sea Bass and/or Sea Bream Stocks HCMR
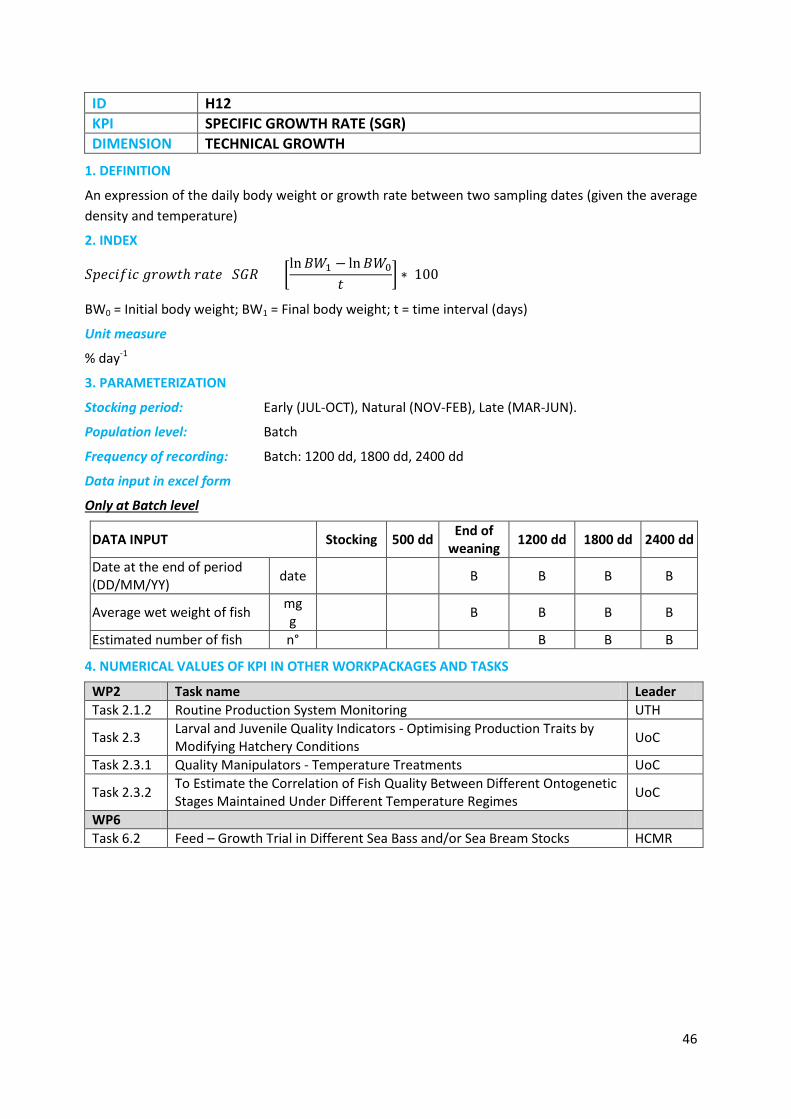
46
ID H12 KPI SPECIFIC GROWTH RATE (SGR) DIMENSION TECHNICAL GROWTH
1. DEFINITION
An expression of the daily body weight or growth rate between two sampling dates (given the average density and temperature)
2. INDEX
𝑆𝑝𝑒𝑐𝑖𝑓𝑖𝑐 𝑔𝑟𝑜𝑤𝑡ℎ 𝑟𝑎𝑡𝑒 (𝑆𝐺𝑅) = �ln𝐵𝑊1 − ln𝐵𝑊0
𝑡 � ∗ 100
BW0 = Initial body weight; BW1 = Final body weight; t = time interval (days)
Unit measure
% day-1
3. PARAMETERIZATION
Stocking period: Early (JUL-OCT), Natural (NOV-FEB), Late (MAR-JUN).
Population level: Batch
Frequency of recording: Batch: 1200 dd, 1800 dd, 2400 dd
Data input in excel form
Only at Batch level
DATA INPUT Stocking 500 dd End of weaning 1200 dd 1800 dd 2400 dd
Date at the end of period (DD/MM/YY) date B B B B
Average wet weight of fish mg g B B B B
Estimated number of fish n° B B B
4. NUMERICAL VALUES OF KPI IN OTHER WORKPACKAGES AND TASKS
WP2 Task name Leader Task 2.1.2 Routine Production System Monitoring UTH
Task 2.3 Larval and Juvenile Quality Indicators - Optimising Production Traits by Modifying Hatchery Conditions UoC
Task 2.3.1 Quality Manipulators - Temperature Treatments UoC
Task 2.3.2 To Estimate the Correlation of Fish Quality Between Different Ontogenetic Stages Maintained Under Different Temperature Regimes UoC
WP6 Task 6.2 Feed – Growth Trial in Different Sea Bass and/or Sea Bream Stocks HCMR

47
ID H13 KPI ARTEMIA REQUIREMENT DIMENSION TECHNICAL - LIVE FEED REQUIREMENTS
1. DEFINITION
Quantity of Artemia administered during the hatchery phase per million fish produced
2. INDEX
𝐴𝑟𝑡𝑒𝑚𝑖𝑎 𝑟𝑒𝑞𝑢𝑖𝑟𝑒𝑚𝑒𝑛𝑡 = 𝐴𝑚𝑜𝑢𝑛𝑡 𝑜𝑓 𝐴𝑟𝑡𝑒𝑚𝑖𝑎 𝑢𝑠𝑒𝑑 (𝑘𝑔)𝑀𝑖𝑙𝑙𝑖𝑜𝑛𝑠 𝑜𝑓 𝑓𝑖𝑠ℎ 𝑝𝑟𝑜𝑑𝑢𝑐𝑒𝑑
Unit measure
Kg of Artemia/million fish
3. PARAMETERIZATION
Stocking period: Early (JUL-OCT), Natural (NOV-FEB), Late (MAR-JUN).
Population level: Batch, Farm
Frequency of recording: Batch: end of weaning
Farm: end of weaning
Data input in excel form
Batch (B) and Farm (F) level
DATA INPUT Stocking 500 dd End of weaning 1200 dd 1800 dd 2400 dd
Artemia distribution1 kg B/F Estimated number of fish2 n° B/F
Notes 1The amount of Artemia is calculated as the total amount of Artemia cysts (expressed in Kg) used for larval weaning until the end of the weaning period 2 Total estimated number of fish produced during the rearing period
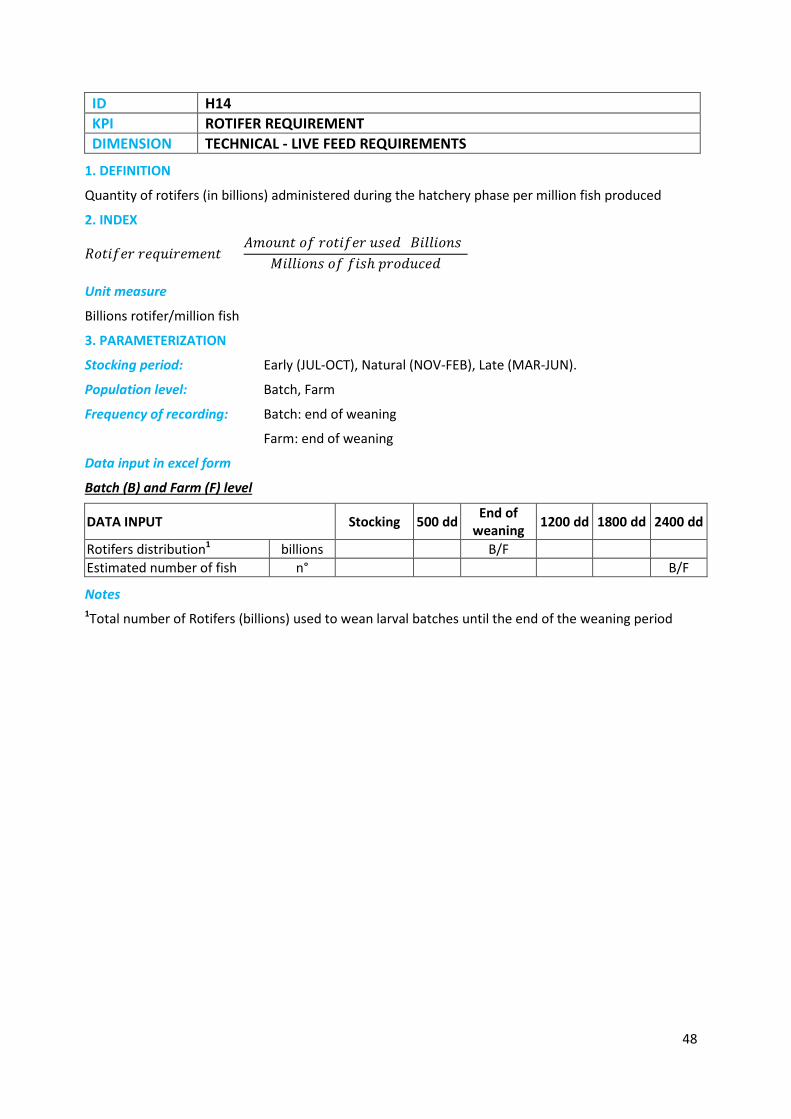
48
ID H14 KPI ROTIFER REQUIREMENT DIMENSION TECHNICAL - LIVE FEED REQUIREMENTS
1. DEFINITION
Quantity of rotifers (in billions) administered during the hatchery phase per million fish produced
2. INDEX
𝑅𝑜𝑡𝑖𝑓𝑒𝑟 𝑟𝑒𝑞𝑢𝑖𝑟𝑒𝑚𝑒𝑛𝑡 = 𝐴𝑚𝑜𝑢𝑛𝑡 𝑜𝑓 𝑟𝑜𝑡𝑖𝑓𝑒𝑟 𝑢𝑠𝑒𝑑 (𝐵𝑖𝑙𝑙𝑖𝑜𝑛𝑠)
𝑀𝑖𝑙𝑙𝑖𝑜𝑛𝑠 𝑜𝑓 𝑓𝑖𝑠ℎ 𝑝𝑟𝑜𝑑𝑢𝑐𝑒𝑑
Unit measure
Billions rotifer/million fish
3. PARAMETERIZATION
Stocking period: Early (JUL-OCT), Natural (NOV-FEB), Late (MAR-JUN).
Population level: Batch, Farm
Frequency of recording: Batch: end of weaning
Farm: end of weaning
Data input in excel form
Batch (B) and Farm (F) level
DATA INPUT Stocking 500 dd End of weaning 1200 dd 1800 dd 2400 dd
Rotifers distribution1 billions B/F Estimated number of fish n° B/F
Notes 1Total number of Rotifers (billions) used to wean larval batches until the end of the weaning period

49
ID H15 KPI VACCINATED FISH BY DISEASE DIMENSION TECHNICAL - TOTAL PRODUCTIVITY
1. DEFINITION
Percentage of vaccinated fish by disease on total number of produced fish.
2. INDEX
𝑉𝑎𝑐𝑐𝑖𝑛𝑎𝑡𝑒𝑑 𝑓𝑖𝑠ℎ 𝑏𝑦 𝑑𝑖𝑠𝑒𝑎𝑠𝑒 = 𝑁° 𝑜𝑓 𝑣𝑎𝑐𝑐𝑖𝑛𝑎𝑡𝑒𝑑 𝑓𝑖𝑠ℎ (𝑒.𝑔.𝑃. 𝑑𝑎𝑚𝑠𝑒𝑙𝑎𝑒)
𝑁° 𝑜𝑓 𝑝𝑟𝑜𝑑𝑢𝑐𝑒𝑑 𝑓𝑖𝑠ℎ𝑥100
Unit measure
%
3. PARAMETERIZATION
Stocking period: Early (JUL-OCT), Natural (NOV-FEB), Late (MAR-JUN).
Population level: Batch, Farm
Frequency of recording: Batch: 2400 dd
Farm: 2400 dd
Data input in excel form
Batch (B) and Farm (F) level
DATA INPUT Stocking 500 dd End of weaning 1200 dd 1800 dd 2400 dd
Number of fish vaccinated against P. damselae n° B/F
Number of fish vaccinated against V. anguillarum n° B/F
Number of fish vaccinated against Betanodavirus n° B/F
Estimated number of fish n° B/F
4. NUMERICAL VALUES OF KPI IN OTHER WORKPACKAGES AND TASKS
WP3 Task name Leader Task 3.1 Epidemiology and Health Risk Assessment. UAB WP6
Task 6.1 Integrated Health Management AQUARK CETGA
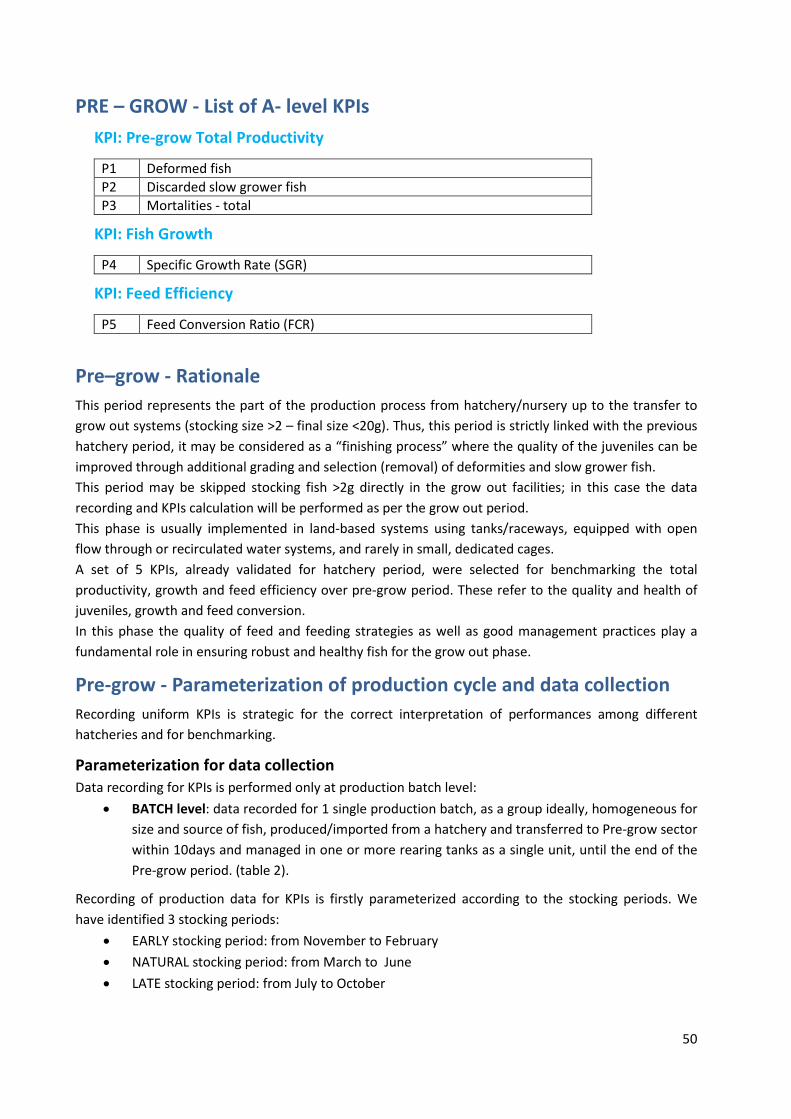
50
PRE – GROW - List of A- level KPIs KPI: Pre-grow Total Productivity
P1 Deformed fish P2 Discarded slow grower fish P3 Mortalities - total
KPI: Fish Growth
P4 Specific Growth Rate (SGR)
KPI: Feed Efficiency
P5 Feed Conversion Ratio (FCR)
Pre–grow - Rationale This period represents the part of the production process from hatchery/nursery up to the transfer to grow out systems (stocking size >2 – final size <20g). Thus, this period is strictly linked with the previous hatchery period, it may be considered as a “finishing process” where the quality of the juveniles can be improved through additional grading and selection (removal) of deformities and slow grower fish. This period may be skipped stocking fish >2g directly in the grow out facilities; in this case the data recording and KPIs calculation will be performed as per the grow out period. This phase is usually implemented in land-based systems using tanks/raceways, equipped with open flow through or recirculated water systems, and rarely in small, dedicated cages. A set of 5 KPIs, already validated for hatchery period, were selected for benchmarking the total productivity, growth and feed efficiency over pre-grow period. These refer to the quality and health of juveniles, growth and feed conversion. In this phase the quality of feed and feeding strategies as well as good management practices play a fundamental role in ensuring robust and healthy fish for the grow out phase.
Pre-grow - Parameterization of production cycle and data collection Recording uniform KPIs is strategic for the correct interpretation of performances among different hatcheries and for benchmarking.
Parameterization for data collection Data recording for KPIs is performed only at production batch level:
• BATCH level: data recorded for 1 single production batch, as a group ideally, homogeneous for size and source of fish, produced/imported from a hatchery and transferred to Pre-grow sector within 10days and managed in one or more rearing tanks as a single unit, until the end of the Pre-grow period. (table 2).
Recording of production data for KPIs is firstly parameterized according to the stocking periods. We have identified 3 stocking periods:
• EARLY stocking period: from November to February • NATURAL stocking period: from March to June • LATE stocking period: from July to October

51
Production data recorded at standard intervals, which should be consistent among monitored batches Data collection is parameterized as follow:
• Stocking • End of pre-grow cycle
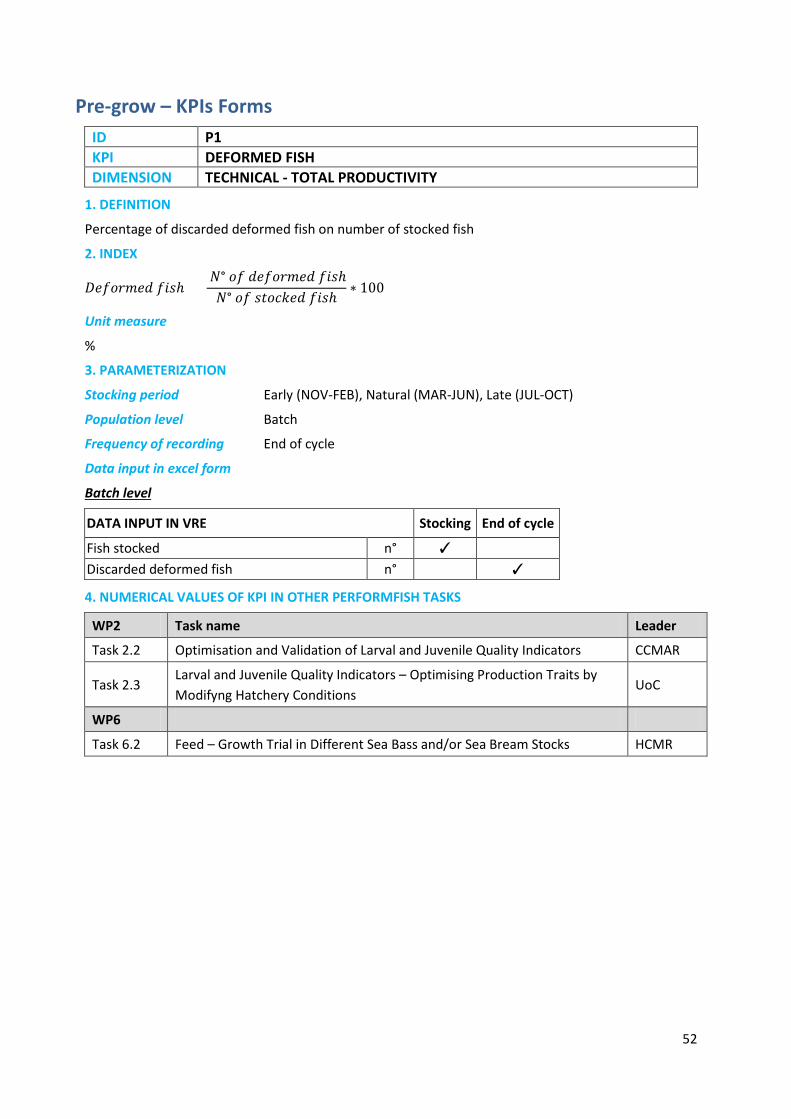
52
Pre-grow – KPIs Forms ID P1 KPI DEFORMED FISH DIMENSION TECHNICAL - TOTAL PRODUCTIVITY
1. DEFINITION
Percentage of discarded deformed fish on number of stocked fish
2. INDEX
𝐷𝑒𝑓𝑜𝑟𝑚𝑒𝑑 𝑓𝑖𝑠ℎ = 𝑁° 𝑜𝑓 𝑑𝑒𝑓𝑜𝑟𝑚𝑒𝑑 𝑓𝑖𝑠ℎ𝑁° 𝑜𝑓 𝑠𝑡𝑜𝑐𝑘𝑒𝑑 𝑓𝑖𝑠ℎ
∗ 100
Unit measure
%
3. PARAMETERIZATION
Stocking period Early (NOV-FEB), Natural (MAR-JUN), Late (JUL-OCT)
Population level Batch
Frequency of recording End of cycle
Data input in excel form
Batch level
DATA INPUT IN VRE Stocking End of cycle
Fish stocked n° ✓ Discarded deformed fish n° ✓
4. NUMERICAL VALUES OF KPI IN OTHER PERFORMFISH TASKS
WP2 Task name Leader
Task 2.2 Optimisation and Validation of Larval and Juvenile Quality Indicators CCMAR
Task 2.3 Larval and Juvenile Quality Indicators – Optimising Production Traits by Modifyng Hatchery Conditions
UoC
WP6
Task 6.2 Feed – Growth Trial in Different Sea Bass and/or Sea Bream Stocks HCMR
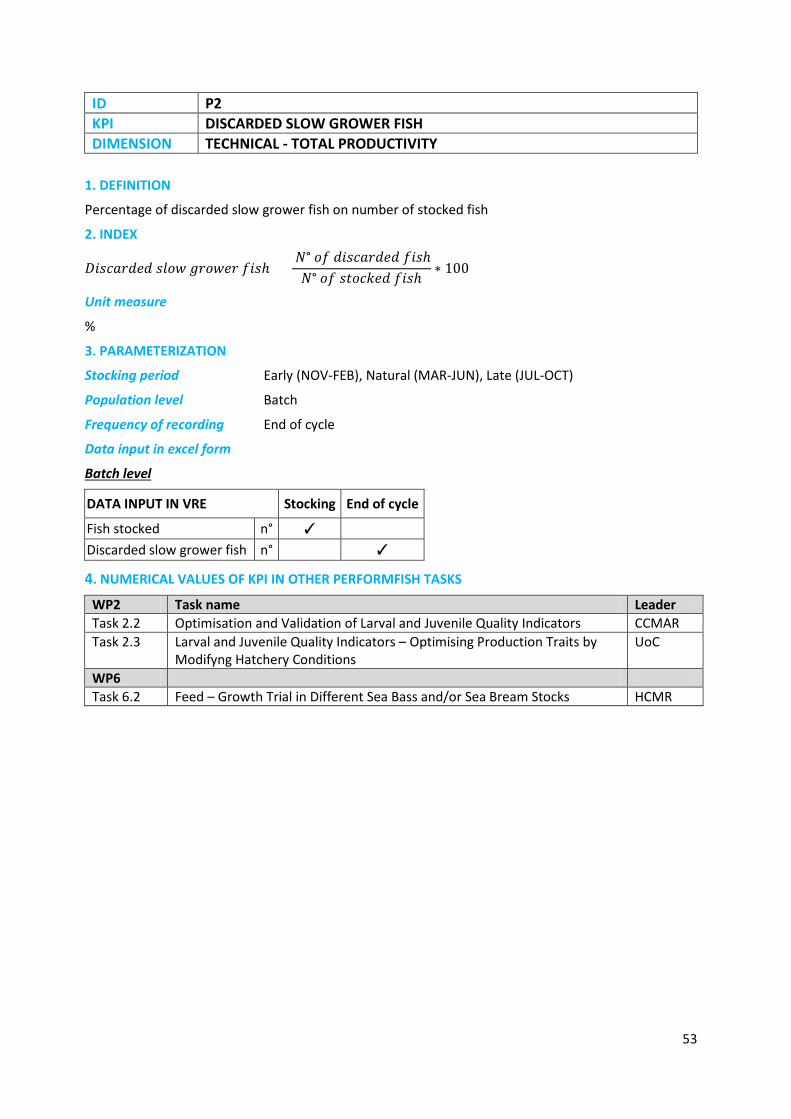
53
ID P2 KPI DISCARDED SLOW GROWER FISH DIMENSION TECHNICAL - TOTAL PRODUCTIVITY
1. DEFINITION
Percentage of discarded slow grower fish on number of stocked fish
2. INDEX
𝐷𝑖𝑠𝑐𝑎𝑟𝑑𝑒𝑑 𝑠𝑙𝑜𝑤 𝑔𝑟𝑜𝑤𝑒𝑟 𝑓𝑖𝑠ℎ = 𝑁° 𝑜𝑓 𝑑𝑖𝑠𝑐𝑎𝑟𝑑𝑒𝑑 𝑓𝑖𝑠ℎ𝑁° 𝑜𝑓 𝑠𝑡𝑜𝑐𝑘𝑒𝑑 𝑓𝑖𝑠ℎ
∗ 100
Unit measure
%
3. PARAMETERIZATION
Stocking period Early (NOV-FEB), Natural (MAR-JUN), Late (JUL-OCT)
Population level Batch
Frequency of recording End of cycle
Data input in excel form
Batch level
DATA INPUT IN VRE Stocking End of cycle
Fish stocked n° ✓ Discarded slow grower fish n° ✓
4. NUMERICAL VALUES OF KPI IN OTHER PERFORMFISH TASKS
WP2 Task name Leader Task 2.2 Optimisation and Validation of Larval and Juvenile Quality Indicators CCMAR Task 2.3 Larval and Juvenile Quality Indicators – Optimising Production Traits by
Modifyng Hatchery Conditions UoC
WP6 Task 6.2 Feed – Growth Trial in Different Sea Bass and/or Sea Bream Stocks HCMR
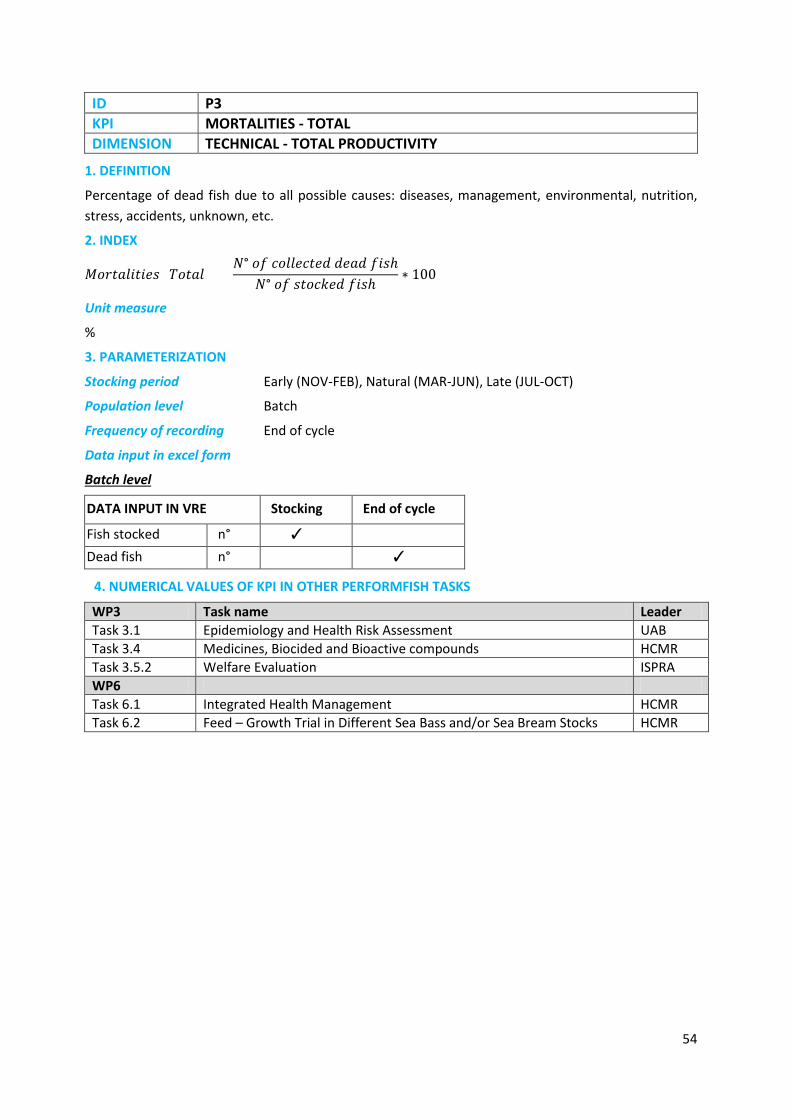
54
ID P3 KPI MORTALITIES - TOTAL DIMENSION TECHNICAL - TOTAL PRODUCTIVITY
1. DEFINITION
Percentage of dead fish due to all possible causes: diseases, management, environmental, nutrition, stress, accidents, unknown, etc.
2. INDEX
𝑀𝑜𝑟𝑡𝑎𝑙𝑖𝑡𝑖𝑒𝑠 (𝑇𝑜𝑡𝑎𝑙) = 𝑁° 𝑜𝑓 𝑐𝑜𝑙𝑙𝑒𝑐𝑡𝑒𝑑 𝑑𝑒𝑎𝑑 𝑓𝑖𝑠ℎ
𝑁° 𝑜𝑓 𝑠𝑡𝑜𝑐𝑘𝑒𝑑 𝑓𝑖𝑠ℎ∗ 100
Unit measure
%
3. PARAMETERIZATION
Stocking period Early (NOV-FEB), Natural (MAR-JUN), Late (JUL-OCT)
Population level Batch
Frequency of recording End of cycle
Data input in excel form
Batch level
DATA INPUT IN VRE Stocking End of cycle
Fish stocked n° ✓ Dead fish n° ✓
4. NUMERICAL VALUES OF KPI IN OTHER PERFORMFISH TASKS
WP3 Task name Leader Task 3.1 Epidemiology and Health Risk Assessment UAB Task 3.4 Medicines, Biocided and Bioactive compounds HCMR Task 3.5.2 Welfare Evaluation ISPRA WP6 Task 6.1 Integrated Health Management HCMR Task 6.2 Feed – Growth Trial in Different Sea Bass and/or Sea Bream Stocks HCMR
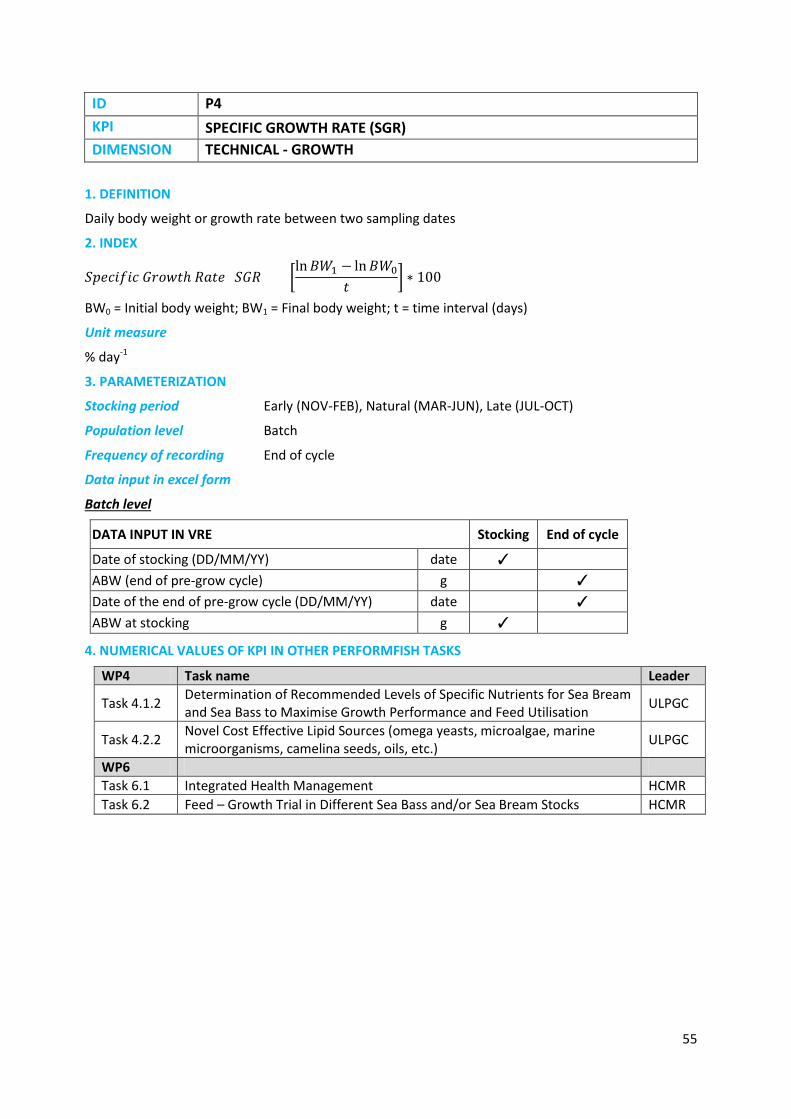
55
ID P4 KPI SPECIFIC GROWTH RATE (SGR) DIMENSION TECHNICAL - GROWTH
1. DEFINITION
Daily body weight or growth rate between two sampling dates
2. INDEX
𝑆𝑝𝑒𝑐𝑖𝑓𝑖𝑐 𝐺𝑟𝑜𝑤𝑡ℎ 𝑅𝑎𝑡𝑒 (𝑆𝐺𝑅) = �ln𝐵𝑊1 − ln𝐵𝑊0
𝑡 � ∗ 100
BW0 = Initial body weight; BW1 = Final body weight; t = time interval (days)
Unit measure
% day-1
3. PARAMETERIZATION
Stocking period Early (NOV-FEB), Natural (MAR-JUN), Late (JUL-OCT)
Population level Batch
Frequency of recording End of cycle
Data input in excel form
Batch level
DATA INPUT IN VRE Stocking End of cycle
Date of stocking (DD/MM/YY) date ✓ ABW (end of pre-grow cycle) g ✓ Date of the end of pre-grow cycle (DD/MM/YY) date ✓ ABW at stocking g ✓
4. NUMERICAL VALUES OF KPI IN OTHER PERFORMFISH TASKS
WP4 Task name Leader
Task 4.1.2 Determination of Recommended Levels of Specific Nutrients for Sea Bream and Sea Bass to Maximise Growth Performance and Feed Utilisation ULPGC
Task 4.2.2 Novel Cost Effective Lipid Sources (omega yeasts, microalgae, marine microorganisms, camelina seeds, oils, etc.) ULPGC
WP6 Task 6.1 Integrated Health Management HCMR Task 6.2 Feed – Growth Trial in Different Sea Bass and/or Sea Bream Stocks HCMR

56
ID P5 KPI FEED CONVERSION RATIO (FCR) DIMENSION TECHNICAL - FEED EFFICIENCY
1. DEFINITION
The ratio between the dry weight of feed and the weight of yield gain. The amount of feed used by lost animals (dead and escaped) is counted in the equation
2. INDEX
𝐹𝑒𝑒𝑑 𝐶𝑜𝑛𝑣𝑒𝑟𝑠𝑖𝑜𝑛 𝑅𝑎𝑡𝑖𝑜 (𝐹𝐶𝑅) = 𝐹𝑒𝑒𝑑 𝑑𝑒𝑙𝑖𝑣𝑒𝑟𝑒𝑑 (𝑡1 − 𝑡0)(𝐵𝑖𝑜𝑚𝑎𝑠𝑠1 − 𝐵𝑖𝑜𝑚𝑎𝑠𝑠0)
Feed delivered(t1-t0)= Feed delivered during time interval
Biomass0=Initial biomass; Biomass1=Final biomass
Unit measure
Numerical index without unit
3. PARAMETERIZATION
Stocking period Early (NOV-FEB), Natural (MAR-JUN), Late (JUL-OCT)
Population level Batch
Frequency of recording End of cycle
Data input in excel form
Batch level
DATA INPUT IN VRE Stocking End of cycle
Fish stocked n° ✓ ABW at stocking g ✓ Dry feed amount kg ✓ Number of harvested fish n° ✓ ABW (end of pre-grow cycle) g ✓
4. NUMERICAL VALUES OF KPI IN OTHER PERFORMFISH TASKS
WP4 Task name Leader
Task 4.1.2 Determination of Recommended Levels of Specific Nutrients for Sea Bream and Sea Bass to Maximise Growth Performance and Feed Utilisation ULPGC
Task 4.2.2 Novel Cost Effective Lipid Sources (omega yeasts, microalgae, marine microorganisms, camelina seeds, oils, etc.) ULPGC
WP6 Task 6.1 Integrated Health Management HCMR Task 6.2 Feed – Growth Trial in Different Sea Bass and/or Sea Bream Stocks HCMR

57
GROW OUT- List of A- level KPIs A set of 35 KPI has been validated by PerformFISH consortium for the analysis and for or benchmarking of grow out systems. The set of KPIs include 15 TE-KPIs, 2 Ec-KPIs, 9 WE-KPIs and 14 E-KPIs and is build to benchmarking: Fish Losses, Dependency on Treatment; Fish Growth, Feed Efficiency, Productivity, Fish Welfare and Environmental performances.
KPI: Fish Losses
G1 Mortalities - total G2 Mortalities – by disease G4 Mortalities first 10 days after transport and stocking G5 Unaccounted losses G6 Total losses G7 Discarded fish at slaughter
KPI: Dependency on treatments
G9 Number of antiparasitic treatments (total & by disease) G10 Number of antibiotic treatments (total & by disease) G11 Amount of active compounds - antiparasitic (total & by disease) G12 Amount of active compounds - antibiotic (total & by disease)
KPI: Fish Growth
G13 Specific Growth Rate (SGR) G14 Grams per day (GPD) G15 Thermal Growth Coefficient (TGC)
KPI: Feed Efficiency
G16 Feed Conversion Ratio (FCR) G17 Biological Feed Conversion Ratio (FCRBIO)
KPI: Productivity
G20 Biomass produced per number of FTE employees G21 Biomass produced per volumes of sea water used
KPI: Fish Welfare
G1 Mortalities - total G3 Mortalities first 3 days after transport and stocking G4 Mortalities first 10 days after transport and stocking G8 Vaccinated fish – by disease G9 Number of antiparasitic treatments (total & by disease) G10 Number of antibiotic treatments (total & by disease) G18 Feed Intake (FI) G19 Stocking density G22 Oxygen depletion persistence days

58
KPI: Environmental Preservation of biodiversity and habitats KPIs
G22 Oxygen depletion persistence days G23 Escapes – Number of episodes G24 Escapes – Estimated number of escaped fish (confidential ISAB) G25 Endangered marine mammals, reptiles, fishes and birds lethal incidents
(confidential ISAB) G26 Phosphorous accumulated in sediment G27 Nitrogen accumulated in sediment
KPI: Environmental performances Use of resources
G28 Marine space use for farming G29 Land use G30 Freshwater use G31 Energy used G32 Fuel (Diesel) used for transport G33 Fuel (Diesel) used for other uses G34 Total emission of CO2 G35 Use of renewable energy
Grow –out – Parameterization of production cycle and data collection For grow-out systems, which differ in technologies and are located in marine sites and on land, the collection of uniform KPI is strategic for the correct interpretation of data set and for the development of a valid benchmarking tool. For the purpose of WP7, grow-out is parameterized as follow: Grow-out is defined as the part of the production process from juveniles (>2g) up to the harvest. It is implemented either in the sea with the use of nets and floating devices forming floating cages (net pen facilities) or in land-based tanks (land-tanks) equipped with flow through water systems or partially/totally recirculated water system. Farming area is a marine area where two or more aquaculture grow out farms are located and managed with the same aquaculture practices (by the same company or by different companies) Farm is an grow-out aquaculture site inside the farming area, characterised by similar environmental conditions (e.g. temperature, currents, etc...), where group(s) of rearing units are located and managed by the same company Rearing unit is a single structure holding the fish (e.g. a net pen, a tank or a pond). Stocking period is the quarter of the year when a batch is stocked: 1st Quarter = Jan – Mar; 2nd Quarter = Apr – Jun; 3rd Quarter = Jul – Sep; 4th Quarter = Oct – Dec Geographic areas are defined as marine areas across the Mediterranean sea where aquaculture facilities are located and characterized by different seawater temperature profiles. Data are derived from Copernicus time series data of seawater temperature in Mediterranean area and are used to identified different T-areas and allocate aquaculture farm.

59
Identification of geographic areas Aquaculture performances of open aquaculture systems (e.g. net pen farms) are expected to have a significant variations depending on the geographic location of the facilities and, therefore, on the actual temperature profile of water in the site. In order to have a proper application of the benchmarking system, where technical efficiency is compared among farms through the calculation of specific KPIs, data on Sea Surface Temperature (SST) have been collected and analysed to allocate each farm participating to the KPI exercise to different zones which are homogenous for their temperature profiles. Time series of Sea Surface Temperatures in °C, collected from the Sentinel satellite network on a period of ten years (2006-2015) have been collected from the Copernicus Marine Environment Monitoring Service (CMEMS). Resolution of the satellite dataset is 0.0625 degrees (around 6.5 Km on the earth surface), which is enough considering that values of SST can be considered homogeneous at this resolution scale.. The average seasonal SST and the average yearly SST have been calculated from the time series dataset of the SST recorded over the period 2006-2015, obtaining a georeferred Mediterranean SST maps that will be used in a Geographic Information System (GIS) environment to identify different areas according to temperature and to allocate each aquaculture farm to one of this area. Therefore, production data provided by companies for the calculation of each KPIs will be analysed and compared by geographic area, facilitating the development of a benchmarking system per area and ensuring that the differences in performance due to different water temperatures will be minimized. At the date of this report, information on the exact location of the farms participating to the KPI exercise is still due by the producer associations of France and Spain. Once the exact locations of farms (Latitude and longitude) will be provided, farm locations will be added to the GIS database and the definition of the three zones homogeneous for temperature and, possibly, number of farms will be finalized. In Figure 6 Mediterranean map showing the average yearly temperature over the ten year period: each colour represents 1°C SST interval. In Figure 7 Mediterranean maps showing the average seasonal temperature over the ten year period: each colour represents 1°C SST interval.

60
Figure 6. Yearly SST means over the period 2006-2015, 1°C intervals
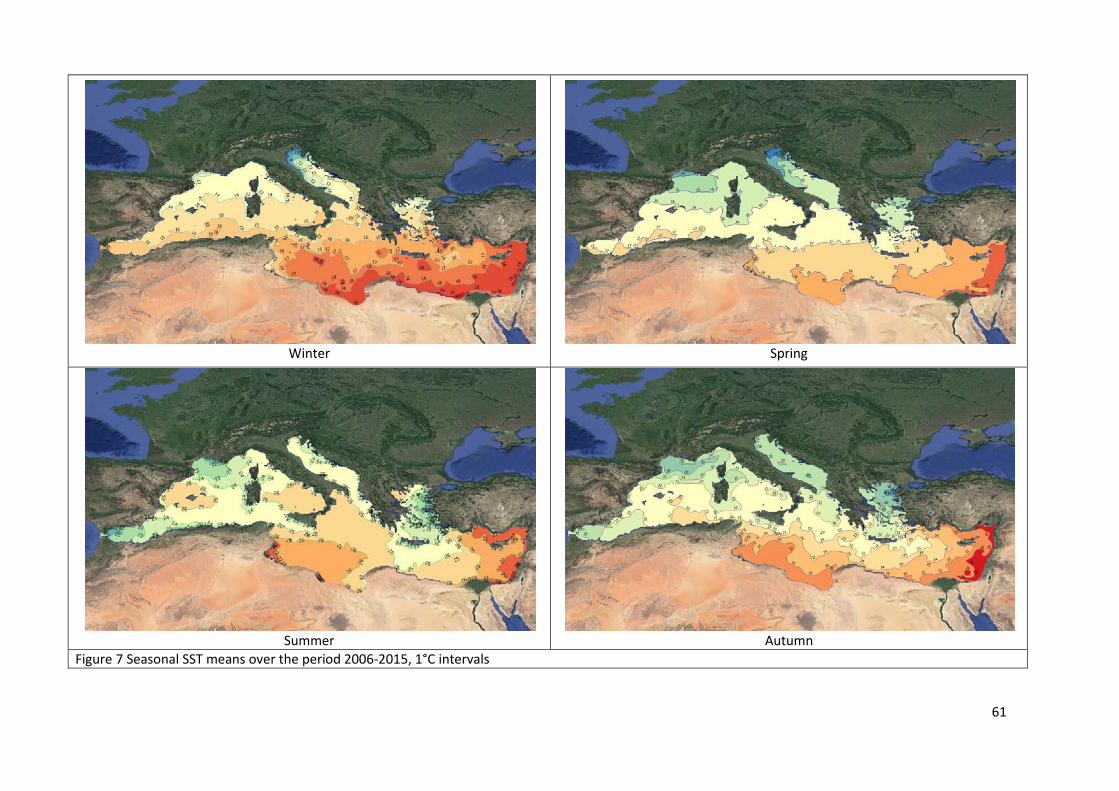
61
Winter
Spring
Summer
Autumn
Figure 7 Seasonal SST means over the period 2006-2015, 1°C intervals

62
Parameterization of data collection at grow-out facilities Data recording for KPIs is performed both at production batch level and at farm level:
• BATCH level: data recorded for 1 single production batch is a group of fish, ideally homogeneous for size and source, stocked in grow out within 2 weeks and managed in one or more rearing units until the end of the grow out cycle and harvest. The number of batches to monitor for KPIs should be representative of the farm production.
• FARM level: data recorded for several production batches (aggregated batches) as groups of individual batch reared in multiple rearing units which data are submitted aggregated, according to the stocking period (1st - 4th Quarter).
The collection of production data at grow-out system is for set numerical operational values for the analysis and calculation of Technical KPIs belonging to the following categories: Fish Losses, Fish Growth, Feed Efficiency and Welfare KPIs. The collection of production data is parameterized according to the date of fish stocking (Quarters) and the size of fish (average body weigth).
• 1st Quarter = Jan – Mar; • 2nd Quarter = Apr – Jun; • 3rd Quarter = Jul – Sep; • 4th Quarter = Oct – Dec
Reference period is a time period in the quarter between two established targets (in this case conventional sizes of fish), e.g. the time interval during which the batch has grown from 50 grams to 150 grams average body weight (AVB)BW.
At BATCH level, production data collection is parameterized at standard intervals, which should be consistent among monitored batches, and defined on the basis of the average body size of fish.
• At stocking • From stocking to the date when fish reach 50g average body weight (+ 5%) • From 51 to 150g (+ 5%) • From 151 to 250g (+ 5%) • From 401 to 800g (for farms that sell large portion fish) • At harvested batches (whenever harvest is performed)
At FARM level production data collection is parameterized at the following interval:
At stocking From stocking to the date when fish reach 150g average body weight (+ 5%) From 151 to 400g (+ 5%) From 401 to 800 (+ 5%) (for farms that sell large portion fish) At harvested batches (whenever harvest is performed
Data collection for Environmental KPIs (G22-G35) is organised on yearly basis

63
Data collection for the “Dependency of treatments” KPIs is organised on yearly basis Standard Operating Procedures for data collection at growth out system are synthesised in section XX of the DL 7.1 and the list of data input is reported in the Annex 2. The Manual for Standard Operating Procedures – Collection of production data at industrial facilities for Key Performances Indicators – available at the PerformFISH Gateway, has been prepared to facilitate farmers and managers to record uniform KPIs, providing information on how perform data collection and how to provide production data at the appropriate standard intervals using the Submission Form.
Grow out- Losses – Rationale #ID Losses KPIs – A Level G1 Mortalities – total G2 Mortalities - by disease G4 Mortalities first 10 days after transport and stocking G5 Unaccounted losses G6 Total losses G7 Discharged fish at slaughter
Losses represent an important component of production costs for MMFF sector. Presently the majority of sea bass and sea bream managers use sophisticated IT software, as a tool for production control and for monitoring health data, fish losses, specific mortality and fish movements. These data stored in on-farm database are available for investigating the pattern of losses across the production cycle and the factors that contribute to the variation in losses. The record of mortalities is indeed essential for the identification of factors that contribute to the variations in mortality rate and for benchmarking the expected mortality across time (Soares et al., 2013). Mortality records held in farm databases are, however, never used for comparing and benchmarking losses among different aquaculture companies. This set of six T- Health KPIs was constructed for benchmarking losses in sea bass and sea bream batches reared in grow out production systems, in net pen and land based tanks. The T- Health KPIs measured the total mortality, as the counted losses due to all possible causes, the mortality by specific disease (virus, parasite, bacteria) and the unaccounted losses, as fish not found and not counted due to cannibalism, predators, escapes, or other reasons. From the point of view of the productivity, also the discharged fish at slaughter (e.g. damaged, deformed, emaciated, etc.) are considered in the count of losses. All above losses contribute to the KPI for total losses. Losses caused by various diseases represent a substantial proportion of economic loss in sea bass and sea bream industry and also represent a key constraints to Mediterranean aquaculture development (FAO, 2007; FAO, Strategy 2018). Diseases also reduce fish welfare, impair growth, increase food conversion rate and increase production costs due to prevention (e.g. vaccination, biosecurity measures) and treatments. Data on diseases affecting farmed sea bass and sea bream are mainly available on scientific and grey literature and observations/communications of experts. There are not extensive official reports available on the occurrence of diseases for MMFF sector, neither at country level or at sector level as in case of salmon industry (e.g. Norway, USA). This is basically because none of the diseases affecting sea bass and sea bream are included in the listed diseases of Directive 2006/88/EC (Annex IV) and only a little information is available from national surveillance programmes. In 2016 and 2017, fish health

64
problems have been reported to be primarily related to VNN/VER, Tenacibaculosis, Vibrio harveyi, Lernathropus kroyeri, Microcotylosis, Sparicotyle sp. and Rash syndrome (EURL Report, 2016; 2017). The occurrence of diseases in farmed sea bass and sea bream changes among EU Member States, with the exception of VNN which causes serious economic impact due to mortality and growth reduction in almost all aquaculture companies in Mediterranean basin. Looking at bacterial disease, Vibriosis still play an important role in sea bass, with Vibrio harvey recognized as an emerging issue. Photobacteriosis represents still a major problem in both species, due to the short protection of vaccination and efficacy of antibiotic treatments in symptomatic/anorexic fish. Regarding parasites, gill flukes (e.g. Sparicotyle chrysophrii) emerge as an important health problem in sea bream due to difficulties in antiparasitic treatments as well as crustaceans infestations (e.g. Isopoda) in sea bass. Skin diseases as petechial rash/red spot disease represents an emerging issue, especially in sea bream (Vendramin et al., 2016; Schmidt et al., 2018). The “List of Concern” of disease agents considered in PerformFISH has been defined by scientific partners (P12, P25), with the support of ITEC and according to information provided by LTPs during meeting and training workshop (Table 8). Benchmarking losses and mortalities using KPIs will provide a different insight on the impact of diseases, allowing companies to better address health and management issues. Results will further contribute to harmonize disease control and prevention strategies in MMFF sector and will improve the knowledge for epidemiological studies and risk analysis, consistently with the new animal health Regulation 2016/429/EU.
List of major disease agents selected in PerformFISH Viruses Sea bream Sea bass Betanodavirus (VNN) ✓ Bacteria Photobacterium damselae piscicida ✓ ✓ Tenacibaculum maritimum ✓ ✓ Vibrio anguillarum ✓ Other Vibrionaceae (e.g. Vibrio harveyi) ✓ Parasites Monogenea (Sparicotyle chrysophrii) ✓ Myxozoa (Enteromyxum leei) ✓ Microsporidia ✓ Isopod crustaceans (Ceratothoa oestroides) ✓ Copepod crustaceans (Lernanthropus kroyeri) ✓ Other Petechial rush disease/red spot syndrome ✓
Table 8. List of major disease agents selected in PerformFISH
Other diseases of interest: Sea bream: Lymphocystis, Epitheliocystis, Enteritis, Winter syndrome. Sea bass: Aeromonas infections, Streptococcosis, Rickettsiosis, Red spot syndrome, Infestation by other copepod crustaceans (Caligus) and Myxosporidia.

65
Grow out- Losses – KPIs Forms ID G1 KPI MORTALITIES - TOTAL DIMENSION TECHNICAL & WELFARE - LOSSES
1. DEFINITION
Percentage of dead fish due to all possible causes: diseases, management, environmental, nutrition, stress, accidents, unknown, etc.
2. INDEX
𝑀𝑜𝑟𝑡𝑎𝑙𝑖𝑡𝑖𝑒𝑠 (𝑇𝑜𝑡𝑎𝑙) = 𝑁° 𝑜𝑓 𝑐𝑜𝑙𝑙𝑒𝑐𝑡𝑒𝑑 𝑑𝑒𝑎𝑑 𝑓𝑖𝑠ℎ
𝑁° 𝑜𝑓 𝑠𝑡𝑜𝑐𝑘𝑒𝑑 𝑓𝑖𝑠ℎ∗ 100
Unit measure
%
3. PARAMETERIZATION
Stocking period : 1st Quarter (JAN – MAR), 2nd Quarter(APR – JUN), 3rd Quarter (JUL – SEP), 4th Quarter (OCT- DEC)
Population level: Batch, Farm, Area
Frequency of recording: Batch: 50g, 150g, 250gr, 400g, 800/harvested batches Farm and Area: 150g, 250gr, 400g, 800/harvested batches
Data input in excel form
Batch (B) and Farm (F) level
DATA INPUT Stocking 50g 150g 250g 400g 800g Harvesta Total mortality (n of dead fish) n° B/F B/F B/F B/F B/F B/F B/F Number of stocked fish n° B/F a whenever harvest is performed
4. NUMERICAL VALUES OF KPI IN OTHER WORKPACKAGES AND TASKS
WP3 Task name Leader Task 3.1 Epidemiology and Health Risk Assessment UAB Task 3.4 Medicines, Biocided and Bioactive compounds HCMR Task 3.5.2 Welfare Evaluation ISPRA WP4
Task 4.2 Development of Sustainable and Cost-Effective Feeds ULPGC; HCMR
Task 4.3 Conditioning of Farmed Species to Novel Feeds to Improve Feed Utilisation, Growth and Fish Health ULPGC
WP6 Task 6.1 Integrated Health Management HCMR Task 6.2 Feed – Growth Trial in Different Sea Bass and/or Sea Bream Stocks HCMR
Notes Quantification of mortality can be done either counting or assessing the number of dead fish. The
quantity of mortality used in the KPI calculation shall be consistent with the quantification of the batch(s) mortality as reported in the farm register.

66
Reference to: - Certification Schemes: RSPCA; ASC; Global G.A.P.; Organic - Welfare Index models: SWIM (Atlantic salmon); - Best practices and Guidelines: FISHWELL HANDBOOK (Atlantic salmon).
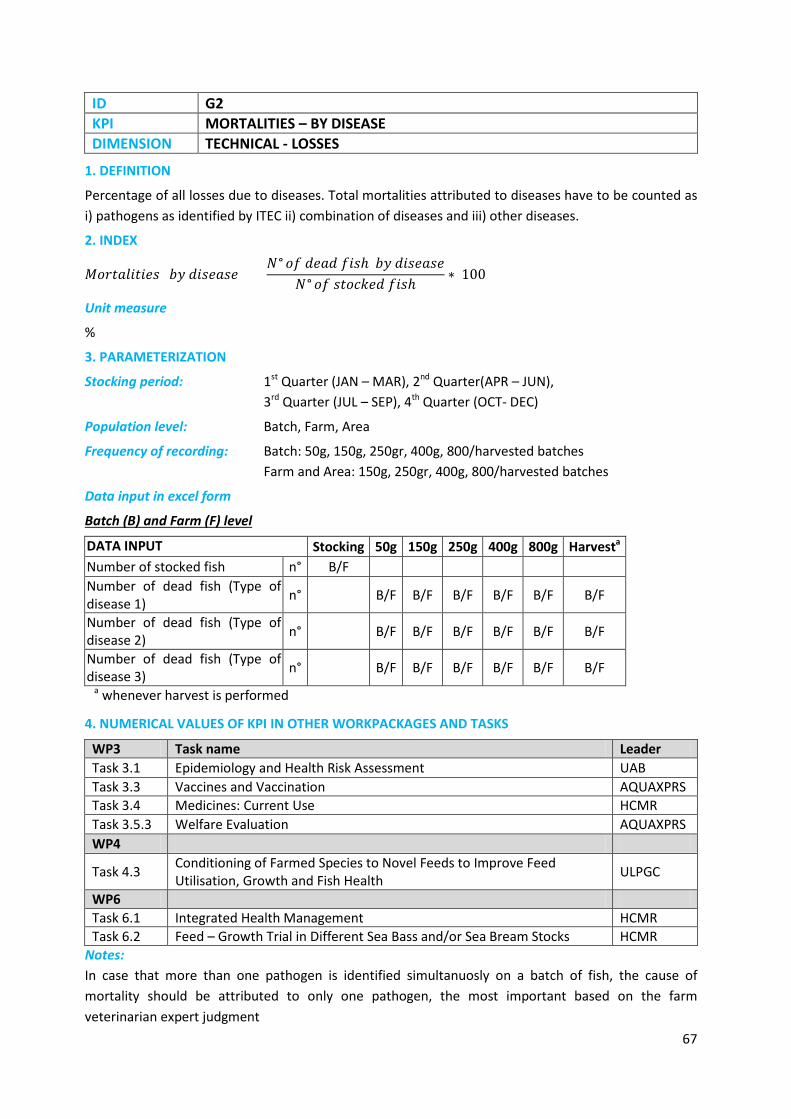
67
ID G2 KPI MORTALITIES – BY DISEASE DIMENSION TECHNICAL - LOSSES
1. DEFINITION
Percentage of all losses due to diseases. Total mortalities attributed to diseases have to be counted as i) pathogens as identified by ITEC ii) combination of diseases and iii) other diseases.
2. INDEX
𝑀𝑜𝑟𝑡𝑎𝑙𝑖𝑡𝑖𝑒𝑠 (𝑏𝑦 𝑑𝑖𝑠𝑒𝑎𝑠𝑒) = 𝑁° 𝑜𝑓 𝑑𝑒𝑎𝑑 𝑓𝑖𝑠ℎ 𝑏𝑦 𝑑𝑖𝑠𝑒𝑎𝑠𝑒
𝑁° 𝑜𝑓 𝑠𝑡𝑜𝑐𝑘𝑒𝑑 𝑓𝑖𝑠ℎ∗ 100
Unit measure
%
3. PARAMETERIZATION
Stocking period: 1st Quarter (JAN – MAR), 2nd Quarter(APR – JUN), 3rd Quarter (JUL – SEP), 4th Quarter (OCT- DEC)
Population level: Batch, Farm, Area
Frequency of recording: Batch: 50g, 150g, 250gr, 400g, 800/harvested batches Farm and Area: 150g, 250gr, 400g, 800/harvested batches
Data input in excel form
Batch (B) and Farm (F) level
DATA INPUT Stocking 50g 150g 250g 400g 800g Harvesta Number of stocked fish n° B/F Number of dead fish (Type of disease 1) n° B/F B/F B/F B/F B/F B/F
Number of dead fish (Type of disease 2) n° B/F B/F B/F B/F B/F B/F
Number of dead fish (Type of disease 3) n° B/F B/F B/F B/F B/F B/F
a whenever harvest is performed
4. NUMERICAL VALUES OF KPI IN OTHER WORKPACKAGES AND TASKS
WP3 Task name Leader Task 3.1 Epidemiology and Health Risk Assessment UAB Task 3.3 Vaccines and Vaccination AQUAXPRS Task 3.4 Medicines: Current Use HCMR Task 3.5.3 Welfare Evaluation AQUAXPRS WP4
Task 4.3 Conditioning of Farmed Species to Novel Feeds to Improve Feed Utilisation, Growth and Fish Health ULPGC
WP6 Task 6.1 Integrated Health Management HCMR Task 6.2 Feed – Growth Trial in Different Sea Bass and/or Sea Bream Stocks HCMR
Notes: In case that more than one pathogen is identified simultanuosly on a batch of fish, the cause of mortality should be attributed to only one pathogen, the most important based on the farm veterinarian expert judgment

68
ID G4 KPI MORTALITIES FIRST 10 DAYS AFTER TRANSPORT AND STOCKING DIMENSION TECHNICAL & WELFARE - LOSSES
1. DEFINITION
It refers to mortalities after transport from nursery to farm due to handling stress and stocking occurring within the first 10 days
2. INDEX
𝑀𝑜𝑟𝑡𝑎𝑙𝑖𝑡𝑖𝑒𝑠 𝑓𝑖𝑟𝑠𝑡 10 𝑑𝑎𝑦𝑠 𝑎𝑓𝑡𝑒𝑟 𝑡𝑟𝑎𝑛𝑠𝑝𝑜𝑟𝑡 𝑎𝑛𝑑 𝑠𝑡𝑜𝑐𝑘𝑖𝑛𝑔 =𝑁° 𝑜𝑓 𝑐𝑜𝑙𝑙𝑒𝑐𝑡𝑒𝑑 𝑑𝑒𝑎𝑑 𝑓𝑖𝑠ℎ 𝑎𝑡 𝑑𝑎𝑦 10
𝑁° 𝑜𝑓 𝑠𝑡𝑜𝑐𝑘𝑒𝑑 𝑓𝑖𝑠ℎ∗ 100
Unit measure
%
3. PARAMETERIZATION
Stocking period: 1st Quarter (JAN – MAR), 2nd Quarter(APR – JUN), 3rd Quarter (JUL – SEP), 4th Quarter (OCT- DEC)
Population level: Batch, Farm, Area
Frequency of recording: Batch: at day 10 Farm and Area: at day 10
Data input in excel form
Batch (B) and Farm (F) level
DATA INPUT Stocking 50g 150g 250g 400g 800g Harvest Number of stocked fish n° B/F Number of dead fish at day 10 from stocking n° B/F
4. NUMERICAL VALUES OF KPI IN OTHER WORKPACKAGES AND TASKS
WP 3 Task name Leader Task 3.5.3 Welfare evaluation ISPRA
Notes
Reference to:
- Certification Schemes: RSPCA; - Best practices and Guidelines: FISHWELL HANDBOOK (Atlantic salmon)

69
ID G5 KPI UNACCOUNTED LOSSES DIMENSION TECHNICAL - LOSSES
1. DEFINITION
The percentage of fish not found and not counted as known mortality. Unaccounted losses may be due to loss for cannibalism, unaccounted escapees, predator (birds, fishes, reptiles or mammals) other causes.
2. INDEX
𝑈𝑛𝑎𝑐𝑐𝑜𝑢𝑛𝑡𝑒𝑑 𝑙𝑜𝑠𝑠𝑒𝑠 = 𝑁° 𝑜𝑓 𝑠𝑡𝑜𝑐𝑘𝑒𝑑 𝑓𝑖𝑠ℎ −𝑁° 𝑜𝑓 𝑑𝑒𝑎𝑑 𝑓𝑖𝑠ℎ − 𝑁° 𝑜𝑓 ℎ𝑎𝑟𝑣𝑒𝑠𝑡𝑒𝑑 𝑓𝑖𝑠ℎ
𝑁° 𝑜𝑓 𝑠𝑡𝑜𝑐𝑘𝑒𝑑 𝑓𝑖𝑠ℎ∗ 100
Unit measure
%
3. PARAMETERIZATION
Stocking period: 1st Quarter (JAN – MAR), 2nd Quarter(APR – JUN), 3rd Quarter (JUL – SEP), 4th Quarter (OCT- DEC)
Population level: Batch, Farm, Area
Frequency of recording: Batch: at harvest Farm and Area: at harvest
Data input in excel form
Batch (B) and Farm (F) level
DATA INPUT Stocking 50g 150g 250g 400g 800g Harvesta Number of stocked fish n° B/F Total mortality (n of dead fish) n° B/F B/F B/F B/F B/F B/F Estimated escapees n° B B/F B B/F B/F B/F Controlled output (sampling, movement, etc.) n° B B/F B B/F B/F B/F
Number of discarded fish n° B B/F B B/F B/F Number of harvested fish n° B/F
a whenever harvest is performed
4. NUMERICAL VALUES OF KPI IN OTHER WORKPACKAGES AND TASKS
WP3 Task name Leader Task 3.5 Welfare Evaluation ISPRA WP6 Task 6.1 Integrated Health Management HCMR Task 6.2 Feed – Growth Trial in Different Sea Bass and/or Sea Bream Stocks HCMR
Notes
For the computation of this KPI all the registered movements during cycle of fish will be taken into account; this will include: estimated escapees, samplings, movements, discarded fish. Calculation of KPI will be done only when the batch will be completely harvested.
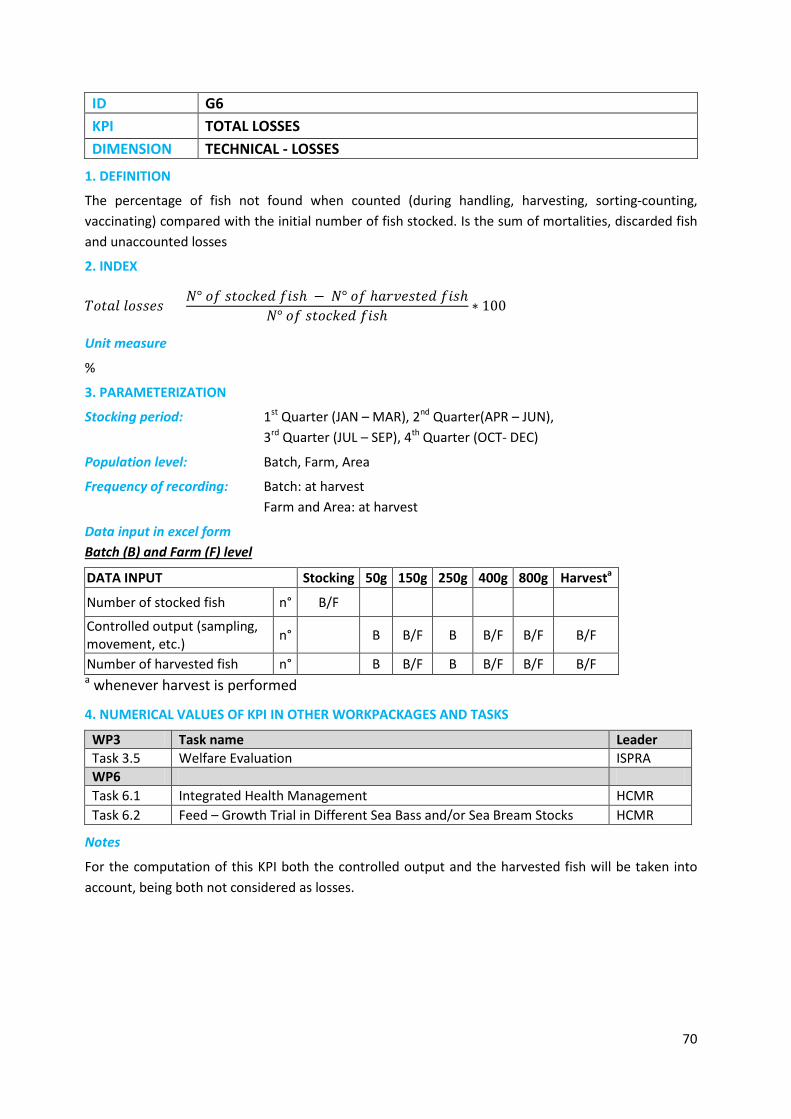
70
ID G6 KPI TOTAL LOSSES DIMENSION TECHNICAL - LOSSES
1. DEFINITION
The percentage of fish not found when counted (during handling, harvesting, sorting-counting, vaccinating) compared with the initial number of fish stocked. Is the sum of mortalities, discarded fish and unaccounted losses
2. INDEX
𝑇𝑜𝑡𝑎𝑙 𝑙𝑜𝑠𝑠𝑒𝑠 =
𝑁° 𝑜𝑓 𝑠𝑡𝑜𝑐𝑘𝑒𝑑 𝑓𝑖𝑠ℎ − 𝑁° 𝑜𝑓 ℎ𝑎𝑟𝑣𝑒𝑠𝑡𝑒𝑑 𝑓𝑖𝑠ℎ
𝑁° 𝑜𝑓 𝑠𝑡𝑜𝑐𝑘𝑒𝑑 𝑓𝑖𝑠ℎ∗ 100
Unit measure
%
3. PARAMETERIZATION
Stocking period: 1st Quarter (JAN – MAR), 2nd Quarter(APR – JUN), 3rd Quarter (JUL – SEP), 4th Quarter (OCT- DEC)
Population level: Batch, Farm, Area
Frequency of recording: Batch: at harvest Farm and Area: at harvest
Data input in excel form Batch (B) and Farm (F) level
DATA INPUT Stocking 50g 150g 250g 400g 800g Harvesta
Number of stocked fish n° B/F
Controlled output (sampling, movement, etc.) n° B B/F B B/F B/F B/F
Number of harvested fish n° B B/F B B/F B/F B/F a whenever harvest is performed
4. NUMERICAL VALUES OF KPI IN OTHER WORKPACKAGES AND TASKS
WP3 Task name Leader Task 3.5 Welfare Evaluation ISPRA WP6 Task 6.1 Integrated Health Management HCMR Task 6.2 Feed – Growth Trial in Different Sea Bass and/or Sea Bream Stocks HCMR
Notes
For the computation of this KPI both the controlled output and the harvested fish will be taken into account, being both not considered as losses.
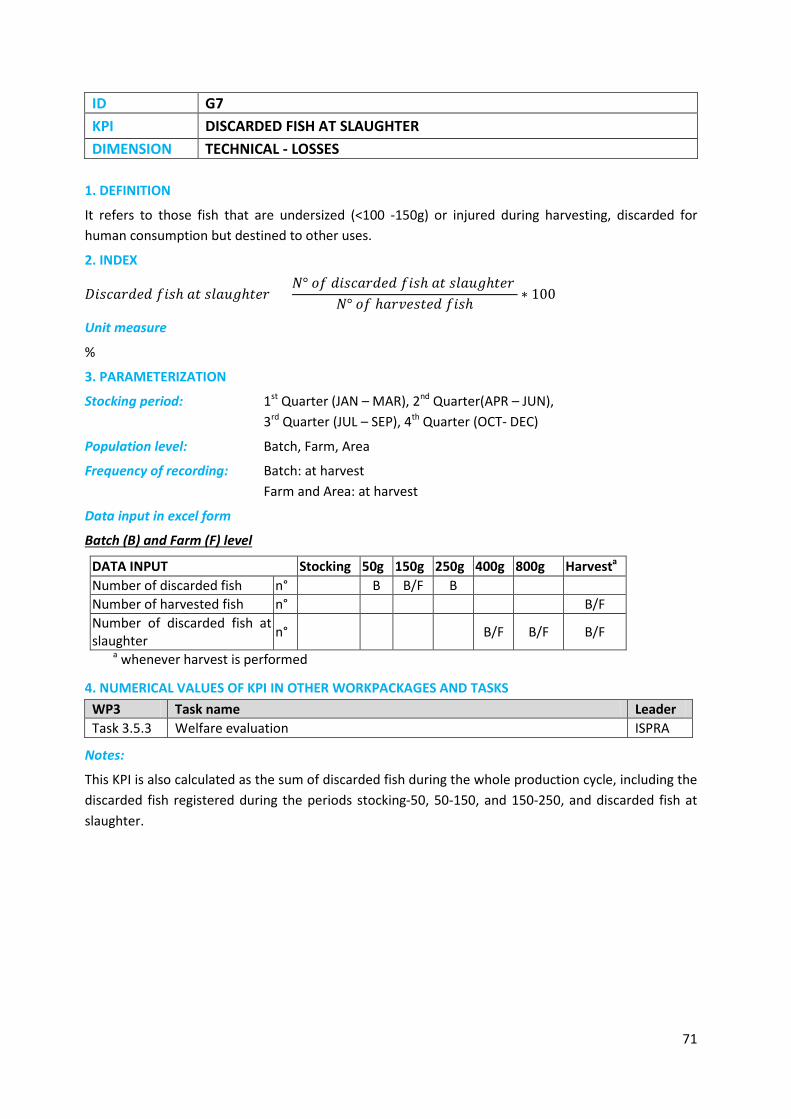
71
ID G7 KPI DISCARDED FISH AT SLAUGHTER DIMENSION TECHNICAL - LOSSES
1. DEFINITION
It refers to those fish that are undersized (<100 -150g) or injured during harvesting, discarded for human consumption but destined to other uses.
2. INDEX
𝐷𝑖𝑠𝑐𝑎𝑟𝑑𝑒𝑑 𝑓𝑖𝑠ℎ 𝑎𝑡 𝑠𝑙𝑎𝑢𝑔ℎ𝑡𝑒𝑟 = 𝑁° 𝑜𝑓 𝑑𝑖𝑠𝑐𝑎𝑟𝑑𝑒𝑑 𝑓𝑖𝑠ℎ 𝑎𝑡 𝑠𝑙𝑎𝑢𝑔ℎ𝑡𝑒𝑟
𝑁° 𝑜𝑓 ℎ𝑎𝑟𝑣𝑒𝑠𝑡𝑒𝑑 𝑓𝑖𝑠ℎ∗ 100
Unit measure
%
3. PARAMETERIZATION
Stocking period: 1st Quarter (JAN – MAR), 2nd Quarter(APR – JUN), 3rd Quarter (JUL – SEP), 4th Quarter (OCT- DEC)
Population level: Batch, Farm, Area
Frequency of recording: Batch: at harvest Farm and Area: at harvest
Data input in excel form
Batch (B) and Farm (F) level
DATA INPUT Stocking 50g 150g 250g 400g 800g Harvesta Number of discarded fish n° B B/F B Number of harvested fish n° B/F Number of discarded fish at slaughter n° B/F B/F B/F
a whenever harvest is performed
4. NUMERICAL VALUES OF KPI IN OTHER WORKPACKAGES AND TASKS WP3 Task name Leader Task 3.5.3 Welfare evaluation ISPRA
Notes:
This KPI is also calculated as the sum of discarded fish during the whole production cycle, including the discarded fish registered during the periods stocking-50, 50-150, and 150-250, and discarded fish at slaughter.

72
Grow out - Dependency on treatments- Rationale #ID Dependency on treatments KPIs – A Level G9 Number of antiparasitic treatments (total & by disease) G10 Number of antibiotic treatments (total & by disease) G11 Amount of active compounds - antiparasitic (total & by disease) G12 Amount of active compounds - antibiotic (total & by disease)
The use of medicated treatments represents a critical issue in all livestock productions, including aquaculture, with implications for animal health and welfare, food safety and human health and environmental sustainability. Several scientific opinions have been produced over last years, highlighting the importance of monitoring the antimicrobial use (AMU), the evaluation of risks related to antimicrobial resistance (AMR) and the need of more transparency and cooperation among different stakeholders (FAO, 2016; EMA-EFSA 2017; OIE, 2017; WHO, 2015, 2017). The OIE aquatic animal health code and the WHO Guidelines recommend the collection of objective and quantitative information to evaluate usage patterns by antimicrobial class, route of administration and aquatic animal species in order to evaluate exposure of microorganisms to antimicrobial agents. “The findings of surveillance and monitoring programmes should be shared at the regional and international level to maximise understanding of the global risks to aquatic animal health and human health. The publication of these data and their interpretation is important to ensure transparency (OIE)”. The EMA and EFSA opinion (2017), which has the primary objective to reduce the AMU in the livestock industry and improve monitoring and surveillance of AMU and AMR across food-production systems, affirmed that “databases are a vital tool that underpins the benchmarking of antimicrobial use (EMA/EFSA, 2017). Biosecurity, good practices and other measures to support prudent use of antimicrobials throughout the food chain is also a major aim of the FAO Action Plan (2016) which further supports the WHO-led Global Action Plan on Antimicrobial Resistance (2015) and highlights the necessity of adopting a “One Health” approach, with the involvement of stakeholders, including public health and veterinary authorities, food and agriculture sectors, environmental specialists and consumers. Looking at the global aquaculture sector, there is substantially a large data gap on AMU, as regard the use in farmed fish and in the different production systems and impact on the social-ecological systems in which aquaculture takes places (Henriksson et al., 2017). The control of major diseases in sea bass and sea bream aquaculture still depends from the use of medicated treatments, due to the absence of vaccines and/or low long-term efficacy for those available, but not data are available on the AMU and AMR for MMFF sector. Specific criteria and index have been developed (GAPI) for comparative evaluation of aquaculture systems as well as in several aquaculture certification schemes (e.g. ASC; Global G.A.P., Organic), increasing the awareness on the AMU in fish production and the public and ecosystem health risks associated with AMR.
PerformFISH will allow an important step forward and will record numerical values for estimating the dependency of treatments for sea bream and sea bass aquaculture sector. This will represent a first and unique exercise which involves major sea bream and sea bass aquaculture companies and producer Associations across EU, providing the sector with the opportunity to evaluate their performance and potential impact in relation to diseases control and being more transparent on AMU as it already happens in Norwegian salmon industry

73
The importance to acquire and update data on AMU was recognizing by PerformFISH consortium since the beginning. The set of KPIs measuring the “Dependency on antibiotic and antiparasitic treatments” was validated in the Rome meeting on November 2017 and the KPIs: number of antibiotic and antiparasistic treatments (G9, G10); amount of antibiotic and antiparasistic active compounds (G11 G12) were deemed as A-level KPIs. The number of medicated treatments, recorded as total number and by specific disease, contributes to acquire knowledge on farm health management and biosecurity and occurrence of diseases treatments over the production cycle; the overall amount of active compounds administered is also an indicator of the potential ecological impact at local and area level. This aspect is particularly relevant also in relation to the low number of drugs registered for use in aquaculture which contributes to potential phenomena of AMR due to the prolonged use of the same molecules. In order to calculate the KPIs, companies will collect data in grow out production facilities on the basis of the listed available therapeutants (antibiotics and antiparasitics). The list was developed by ISPRA and revised by Producers Association of each country and LTPs in order to include the most important therapeutics used in sea bass and sea bream aquaculture at Mediterranean level. Results from the benchmarking of dependency of medicated treatments will contribute in improvement the AMU for disease control and to evaluate the potential effect of sea bream and sea bass aquaculture in increasing risks for the environment and human health. The selected KPIs will further allows the benchmarking with other animal food sectors, with potential benefits on consumers perception for aquaculture products.
Table 9. List of active compounds used in B&B aquaculture * authorized only in Greece and Spain
List of active compounds used in B&B aquaculture Antibiotics Antiparasitics
β-lactam Benzimidazolic compounds Amoxicillin trihydrate Fenbendazole
Ampicilin Mebendazole
Aminoglycosides Imidazothiazoles compounds
Apramycin Levamisol
Apramycin sulphate Avermectins
Tetracyclines Ivermectine
Chlortetracycline Aqueous solution of 37% formaldehyde*
Oxytetracycline Quinolones Enrofloxacin Oxolinic acid Sarafloxacin Fluoroquinolones Florfenicol Flumequin Macrolides Erythromycin Tilosina Sulphonamides Sulphonamides potentiated with Trimethoprin

74
Grow out - Dependency on treatments – KPIs Forms ID G9 KPI NUMBER OF ANTIPARASITIC TREATMENTS (TOTAL & BY DISEASE) DIMENSION TECHNICAL & WELFARE - DEPENDENCY ON TREATMENTS
1. DEFINITION
Total number of antiparasitic treatments (medicated feed or baths) administered per production cycle.
2. INDEX
𝑁𝑢𝑚𝑏𝑒𝑟 𝑜𝑓 𝑎𝑛𝑡𝑖𝑝𝑎𝑟𝑎𝑠𝑖𝑡𝑖𝑐 𝑡𝑟𝑒𝑎𝑡𝑚𝑒𝑛𝑡𝑠 𝑝𝑒𝑟 𝑦𝑒𝑎𝑟 Unit measure
n
3. PARAMETERIZATION
Stocking period 1st Quarter (JAN – MAR), 2nd Quarter(APR – JUN), 3rd Quarter (JUL – SEP), 4th Quarter (OCT- DEC)
Population level Batch, Farm, Area
Frequency of recording Batch: at harvest Farm, Area: Annual reporting
Data input in excel form
Batch
DATA INPUT Stocking 50g 150g 250g 400g 800g Harvesta Number of antiparasitic treatments n° ✓ ✓ ✓ ✓ ✓ ✓
Farm and Area level
DATA INPUT
Number of antiparasitic treatments (total & by disease) n° Annual reporting
a whenever harvest is performed
4. NUMERICAL VALUES OF KPI IN OTHER WORKPACKAGES AND TASKS
WP3 Task name Leader Task 3.1 Epidemiology and Health Risk Assessment UAB Task 3.4. Medicines: Current Use HCMR Task 3.5 Welfare Evaluation ISPRA WP6 Task 6.1 Integrated Health Management HCMR
Notes:
Name of active compound used is also requested in the form for data collection on annual basis.
Reference to:
- Certification Schemes: ASC; BAP; Organic

75
ID G10 KPI NUMBER OF ANTIBIOTIC TREATMENTS (TOTAL & BY DISEASE) DIMENSION TECHNICAL & WELFARE - DEPENDENCY ON TREATMENTS
1. DEFINITION
Total number of antibiotic treatments (medicated feed or baths) administered per production cycle. 2. INDEX
𝑁𝑢𝑚𝑏𝑒𝑟 𝑜𝑓 𝑎𝑛𝑡𝑖𝑏𝑖𝑜𝑡𝑖𝑐 𝑡𝑟𝑒𝑎𝑡𝑚𝑒𝑛𝑡 𝑝𝑒𝑟 𝑦𝑒𝑎𝑟 𝑎𝑡 𝑓𝑎𝑟𝑚 𝑙𝑒𝑣𝑒𝑙 Unit measure
n
3. PARAMETERIZATION
Stocking period 1st Quarter (JAN – MAR), 2nd Quarter(APR – JUN), 3rd Quarter (JUL – SEP), 4th Quarter (OCT- DEC)
Population level Batch, Farm, Area
Frequency of recording Batch: at harvest Farm, Area: Annual reporting
Data input in excel form
Batch level
DATA INPUT Stocking 50g 150g 250g 400g 800g Harvesta
Number of antibiotic treatments n° ✓ ✓ ✓ ✓ ✓ ✓ a whenever harvest is performed
Farm and Area level
DATA INPUT
Number of antibiotic treatments (total & by disease) n° Annual reporting
4. NUMERICAL VALUES OF KPI IN OTHER WORKPACKAGES AND TASKS
WP3 Task name Leader Task 3.1 Epidemiology and Health Risk Assessment UAB Task 3.4. Medicines: Current Use HCMR
Task 3.5 Welfare Evaluation ISPRA WP6 Task 6.1 Integrated Health Management HCMR
Notes:
Name of active compound used is also requested in the annual data collection
Reference to:
- Certification Schemes: ASC; BAP; Organic

76
ID G11
KPI AMOUNT OF ACTIVE COMPOUNDS - ANTIPARASITIC (TOTAL & BY DISEASE)- CONFIDENTIAL TO ASSOCIATION/ISAB
DIMENSION TECHNICAL - DEPENDENCY ON TREATMENTS
1. DEFINITION
Total amount of antiparasitic active compound per ton of fish produced The KPI is confidential to ISAB
2. INDEX
𝐴𝑚𝑜𝑢𝑛𝑡 𝑜𝑓 𝑎𝑐𝑡𝑖𝑣𝑒 𝑐𝑜𝑚𝑝𝑜𝑢𝑛𝑑𝑠 (𝑎𝑛𝑡𝑖𝑝𝑎𝑟𝑎𝑠𝑖𝑡𝑖𝑐) = 𝐴𝑚𝑜𝑢𝑛𝑡 𝑜𝑓 𝑎𝑛𝑡𝑖𝑝𝑎𝑟𝑎𝑠𝑖𝑡𝑖𝑐 (𝑔)
𝑡𝑜𝑛 𝑜𝑓 𝑓𝑖𝑠ℎ
Unit measure
g/ton of fish
3. PARAMETERIZATION
Population level Farm, Area
Frequency of recording Farm and Area: Annual reporting
Data input in excel form
Farm level and Area level
DATA INPUT
Amount of active compounds – antiparasitic (total & by disease) g Annual
reporting
Biomass of harvested fish Kg Annual reporting
Biomass in stock at the end of the year Kg Annual reporting
Biomass in stock at the beginning of the year Kg Annual reporting
awhenever harvest is performed
4. NUMERICAL VALUES OF KPI IN OTHER WORKPACKAGES AND TASKS
WP3 Task name Leader Task 3.1 Epidemiology and Health Risk Assessment UAB Task 3.4. Medicines: Current Use HCMR Task 3.5 Welfare Evaluation ISPRA WP6 Task 6.1 Integrated Health Management HCMR
Notes:
The amount of fish produced in one year is calculated considering the variation of biomass in stock at the end and beginning of the year plus the harvested biomass in the year.
Name of active compound used is also requested in the annual data collection. Information for the calculation of this KPI will include date of treatment, treated species, name of disease, name and quantity of antiparasitic active compound.
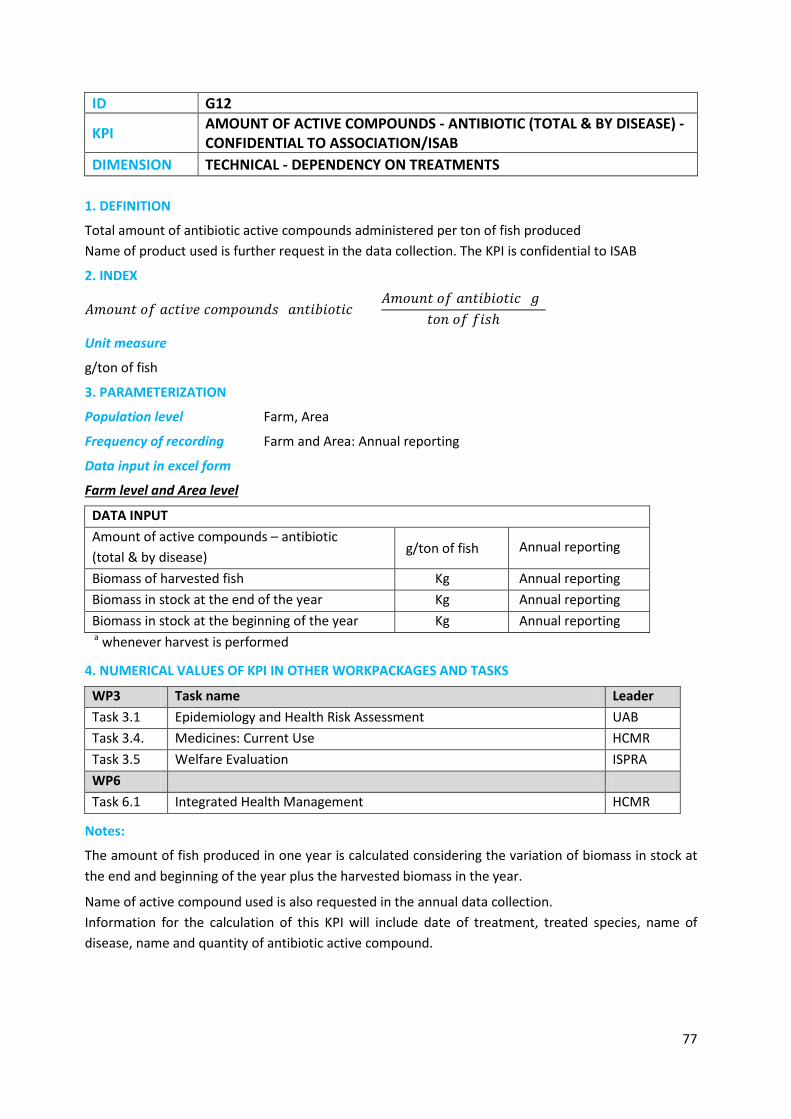
77
ID G12
KPI AMOUNT OF ACTIVE COMPOUNDS - ANTIBIOTIC (TOTAL & BY DISEASE) - CONFIDENTIAL TO ASSOCIATION/ISAB
DIMENSION TECHNICAL - DEPENDENCY ON TREATMENTS
1. DEFINITION
Total amount of antibiotic active compounds administered per ton of fish produced Name of product used is further request in the data collection. The KPI is confidential to ISAB
2. INDEX
𝐴𝑚𝑜𝑢𝑛𝑡 𝑜𝑓 𝑎𝑐𝑡𝑖𝑣𝑒 𝑐𝑜𝑚𝑝𝑜𝑢𝑛𝑑𝑠 (𝑎𝑛𝑡𝑖𝑏𝑖𝑜𝑡𝑖𝑐) = 𝐴𝑚𝑜𝑢𝑛𝑡 𝑜𝑓 𝑎𝑛𝑡𝑖𝑏𝑖𝑜𝑡𝑖𝑐 (𝑔)
𝑡𝑜𝑛 𝑜𝑓 𝑓𝑖𝑠ℎ
Unit measure
g/ton of fish
3. PARAMETERIZATION
Population level Farm, Area
Frequency of recording Farm and Area: Annual reporting
Data input in excel form
Farm level and Area level
DATA INPUT Amount of active compounds – antibiotic (total & by disease) g/ton of fish Annual reporting
Biomass of harvested fish Kg Annual reporting Biomass in stock at the end of the year Kg Annual reporting Biomass in stock at the beginning of the year Kg Annual reporting a whenever harvest is performed
4. NUMERICAL VALUES OF KPI IN OTHER WORKPACKAGES AND TASKS
WP3 Task name Leader Task 3.1 Epidemiology and Health Risk Assessment UAB Task 3.4. Medicines: Current Use HCMR Task 3.5 Welfare Evaluation ISPRA WP6 Task 6.1 Integrated Health Management HCMR
Notes:
The amount of fish produced in one year is calculated considering the variation of biomass in stock at the end and beginning of the year plus the harvested biomass in the year.
Name of active compound used is also requested in the annual data collection. Information for the calculation of this KPI will include date of treatment, treated species, name of disease, name and quantity of antibiotic active compound.

78
Grow out –Growth - Rationale # ID Growth KPIs - A-level G13 Specific Growth Rate (SGR) G14 Grams per day (GPD) G15 Thermal Growth Coefficient (TGC)
Growth rate represents a key parameter in aquaculture, as it is directly linked to production costs: the faster the fish will grow during the rearing period, the shorter will last the cycles, resulting in a reduction of labor required to complete the production, a reduction of indirect costs accountable to each cycle (e.g. depreciation of equipment used for the cycle) and, on the long run and given the same number of rearing units, an increased production capacity of the farm that can increase the overall number of cycles. Three T-KPIs have been selected for benchmarking the growth performance ì of farmed sea bass and sea bream, the SGR, the GPD and the TGC; these are critical management tools in fish grow-out production, because they return an immediate information about the growth performance of cultured fish, Their constant monitoring allows farm managers to take appropriate management measures in case indicators will provide evidence for growth performance below standards or expected targets (Cardia & Lovatelli, 2015) Growth performances are directly linked to different factors, among others: quality of fingerlings (genetic), nutritional properties of feed, stocking density, feeding practices, incidence of pathologies, and environmental characteristics of the site, such as salinity and temperature profile of the water. The latter, which is independent from management decisions, moreover affects the oxygen concentration in the water (Besson et al, 2016). It is indeed a very relevant factor, intrinsic to the farm characteristics (inland farms) or location (cage farms) and the difference in water temperature between areas in the Mediterranean Sea is considered to be a major source of competitive advantages for fish farmers (Llorente and Luna, 2013). The Thermal Growth Coefficient is a growth performance indicator that is calculated taking into account the degree days of the period between two sampling points, it is more directly influenced by the overall farm practices and management decisions and, on a lesser extent, influenced by the water temperature registered in the site, and it is used for the development of predictive growth models (Juralde et al, 2011). Therefore, a classification of pen net farms based on their water temperature profiles will be required for a correct comparison and benchmarking, being not significant the application these growth KPIs to farms having different water temperature profiles; this issue is described in the previous chapter “Identification of geographic areas” Being the growth KPIs also directly related to fish body weights, as the grow rates of small fish are higher than those registered on larger fish, the comparison and benchmarking of these performance KPIs will be also done between fish of the same size. The comparison of growth performances within different companies and different areas in the Mediterranean basin will provide information on a parameter that has been not analyzed at a such large scale for bass and bream so far. It will also provide a reliable benchmarking of these production parameters for MMFF sector.

79
Grow out - Growth – KPIs Forms ID G13 KPI SPECIFIC GROWTH RATE (SGR) DIMENSION TECHNICAL - GROWTH
1. DEFINITION
An expression of the daily growth rate (%) of body weight between two sampling dates
2. INDEX
𝑆𝑝𝑒𝑐𝑖𝑓𝑖𝑐 𝐺𝑟𝑜𝑤𝑡ℎ 𝑅𝑎𝑡𝑒 (𝑆𝐺𝑅) = �ln𝐵𝑊1 − ln𝐵𝑊0
𝑡0−1� ∗ 100
BW0 = Initial body weight; BW1 = Final body weight; t0-1 = time interval (days) Unit measure % day-1 3. PARAMETERIZATION
Stocking period 1st Quarter (JAN – MAR), 2nd Quarter(APR – JUN), 3rd Quarter (JUL – SEP), 4th Quarter (OCT- DEC)
Population level Batch, Farm, Area
Frequency of recording Batch: 50g, 150g, 250gr, 400g, 800/harvested batches Farm and Area: 150g, 250gr, 400g, 800/harvested batches
Data input in excel form
Batch (B) and Farm (F) level
DATA INPUT Stocking 50g 150g 250g 400g 800g Harvesta Date of stocking (dd/mm/yy) date B ABW at stocking g B/F ABW (at the end of period) g F F F F Exact ABW (at the end of period) g B B B B B B Date end of period (DD/MM/YY) date B B B B B B Average number of days of culture to reach 150g n° F
Average number of days of culture to reach 400g n° F
Average number of days of culture to reach 800g or total harvest n° F F a whenever harvest is performed;
4. NUMERICAL VALUES OF KPI IN OTHER WORKPACKAGES AND TASKS
WP3 Task name Leader 3.5 Welfare Evaluation ISPRA WP4
Task 4.1.2 Determination of Recommended Levels of Specific Nutrients for Sea Bream and Sea Bass to Maximise Growth Performance and Feed Utilisation
ULPGC
Task 4.2.1 Evaluation of the Nutritional Value and Sustainability of Novel Cost Effective Alternatives to Fishmeal HCMR
Task 4.2.2 Novel Cost Effective Lipid Sources (omega yeasts, microalgae, marine ULPGC

80
microorganisms, camelina seeds, oils, etc.)
Task 4.2.3 Understanding and Minimizing Negative Effects of Alternative Diets on Fish Health and Welfare Anti-Nutritional Factors HCMR
Task 4.3 Conditioning of Farmed Species to Novel Feeds to Improve Feed Utilisation, Growth and Fish Health ULPGC
WP6 Task 6.1 Integrated Health Management HCMR Task 6.2 Feed – Growth Trial in Different Sea Bass and/or Sea Bream Stocks HCMR
Notes:
Reference to:
- Best practices and Guidelines: FISHWELL HANDBOOK (Atlantic salmon)

81
ID G14 KPI GRAMS PER DAY (GPD) DIMENSION TECHNICAL - GROWTH
1. DEFINITION
An expression of the fish growth expressed in grams per day between two sampling dates
2. INDEX
𝐺𝑟𝑎𝑚𝑠 𝑝𝑒𝑟 𝑑𝑎𝑦 (𝐺𝑃𝐷) = (𝐵𝑊1 − 𝐵𝑊0)
𝑡0−1
BW0 = Initial body weight; BW1 = Final body weight; t0-1 = time interval (days) Unit measure
% day-1
3. PARAMETERIZATION
Stocking period 1st Quarter (JAN – MAR), 2nd Quarter(APR – JUN), 3rd Quarter (JUL – SEP), 4th Quarter (OCT- DEC)
Population level Batch, Farm, Area
Frequency of recording Batch: 50g, 150g, 250gr, 400g, 800/harvested batches Farm and Area: 150g, 250gr, 400g, 800/harvested batches
Data input in excel form
Batch(B) and Farm (F) level
DATA INPUT Stocking 50g 150g 250g 400g 800g Harvesta ABW at stocking g B/F Date of stocking (dd/mm/yy) date B ABW (at the end of period) g F F F F Exact ABW (at the end of period) g B B B B B B Date end of period (DD/MM/YY) date B B B B B B Average number of days of culture to reach 150g n° F
Average number of days of culture to reach 400g n° F
Average number of days of culture to reach 800g or total harvest n° F F a whenever harvest is performed
4. NUMERICAL VALUES OF KPI IN OTHER WORKPACKAGES AND TASKS
WP4 Task name Leader
Task 4.1.2 Determination of Recommended Levels of Specific Nutrients for Sea Bream and Sea Bass to Maximise Growth Performance and Feed Utilisation
ULPGC
Task 4.2.1 Evaluation of the Nutritional Value and Sustainability of Novel Cost Effective Alternatives to Fishmeal HCMR
Task 4.2.2 Novel Cost Effective Lipid Sources (omega yeasts, microalgae, marine microorganisms, camelina seeds, oils, etc.) ULPGC
Task 4.2.3 Understanding and Minimizing Negative Effects of Alternative Diets on HCMR

82
Fish Health and Welfare Anti-Nutritional Factors
Task 4.3 Conditioning of Farmed Species to Novel Feeds to Improve Feed Utilisation, Growth and Fish Health ULPGC
WP6 Task 6.1 Integrated Health Management HCMR Task 6.2 Feed – Growth Trial in Different Sea Bass and/or Sea Bream Stocks HCMR

83
ID G15 KPI THERMAL GROWTH COEFFICIENT (TGC) DIMENSION TECHNICAL - GROWTH
1. DEFINITION
Measure of fish weight increase based on water temperature and time requested to reach target weight
2. INDEX
𝑇ℎ𝑒𝑟𝑚𝑎𝑙 𝐺𝑟𝑜𝑤𝑡ℎ 𝐶𝑜𝑒𝑓𝑓𝑖𝑐𝑖𝑒𝑛𝑡 (𝑇𝐺𝐶) = ��𝐵𝑊13 − �𝐵𝑊0
3
𝑇 ∗ 𝑡0−1� ∗ 1000
BW0 = Initial body weight; BW1 = Final body weight; t0-1 = time interval (days); T = average temperature in the period t0-1
Unit measure
g/degree days
3. PARAMETERIZATION
Stocking period 1st Quarter (JAN – MAR), 2nd Quarter(APR – JUN), 3rd Quarter (JUL – SEP), 4th Quarter (OCT- DEC)
Population level Batch, Farm, Area
Frequency of recording Batch: 50g, 150g, 250gr, 400g, 800/harvested batches Farm and Area: 150g, 250gr, 400g, 800/harvested batches
Data input in excel form
Batch(B) and Farm (F) level
DATA INPUT Stocking 50g 150g 250g 400g 800g Harvesta Degree days °C B/F B B/F B B/F B/F B/F Date of stocking (dd/mm/yy) date B ABW at stocking g B/F ABW (at the end of period) g B B/F B B/F B/F B/F Date end of period (DD/MM/YY) date B B/F B B/F B/F B/F Average number of days of culture to reach 150g n° F
Average number of days of culture to reach 400g n° F
Average number of days of culture to reach 800g or total harvest n° F F
a whenever harvest is performed;
4. NUMERICAL VALUES OF KPI IN OTHER WORKPACKAGES AND TASKS
WP4 Task name Leader
Task 4.1.2 Determination of Recommended Levels of Specific Nutrients for Sea Bream and Sea Bass to Maximise Growth Performance and Feed Utilization
ULPGC
Task 4.2.1 Evaluation of the Nutritional Value and Sustainability of Novel Cost HCMR
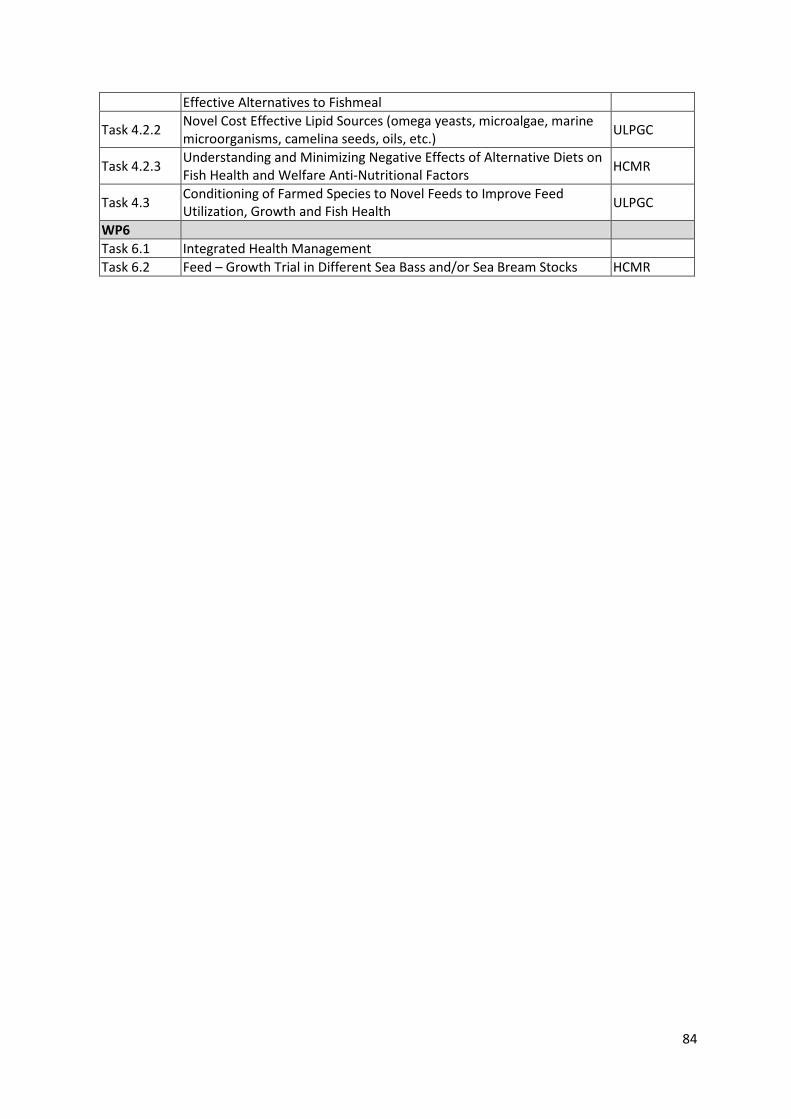
84
Effective Alternatives to Fishmeal
Task 4.2.2 Novel Cost Effective Lipid Sources (omega yeasts, microalgae, marine microorganisms, camelina seeds, oils, etc.) ULPGC
Task 4.2.3 Understanding and Minimizing Negative Effects of Alternative Diets on Fish Health and Welfare Anti-Nutritional Factors HCMR
Task 4.3 Conditioning of Farmed Species to Novel Feeds to Improve Feed Utilization, Growth and Fish Health ULPGC
WP6 Task 6.1 Integrated Health Management Task 6.2 Feed – Growth Trial in Different Sea Bass and/or Sea Bream Stocks HCMR

85
Grow out - Feed Efficiency – Rationale Fish feed is a major factor of aquaculture sustainability, as it affects the quality and costs of production, environmental impact and use of natural renewable resources. The progressive limitation in the availability of fish meal and fish oil worldwide, from capture based fishery and the request for more sustainable feeds, resulted in the use of alternative protein and lipid sources. The new feed formulations do not always answer to species specific needs, with negative effects on feed efficiency, growth performance, health and the environment. The level of fish meal and fish oil included in fish feed further decreased over the past years with significant implications for the nutritional quality of farmed fish (Tacon and Metian, 2015; FEAP, 2014; Sprague et al., 2016; Matos et al., 2017). Statistical data on feed consumption in sea bream and sea bass aquaculture are not available at regional, national and sectoral levels in Europe. Calculation can be done only on the basis of estimated Feed Conversion Rate (FCR) available in literature (Tacon and Metian, 2008) and volume of production provided by FEAP. The approach used to develop the list of KPIs considered the general principles of the FAO Code of Conduct of Responsible Fisheries (CCRF) and principles criteria included in other reference system for sustainability (e.g. GAPI, 2010; FAO, 2013; MBA Seafood Watch, 2014; GSSI, 2015). Two TE-KPIs were selected for benchmarking the feed efficiency of farmed sea bass and sea bream. These include the economic feed conversion ratio (FCR), calculated as the ratio of feed intake to weight gain (G16) and the biological feed conversion ratio (FCRbio) which also includes the biomass of lost fish (G17). The FCR is a widely used index to assess the animal production efficiency reflecting fish feed consumption, quality of feed ingredients and the capacity of transferring the feed resources into flesh. It further gives information on the general feeding management practices and fish health. Farmed fish display a better FCR compared to terrestrial animals (Brummet, 2013), however FCR does not account for differences in feed ingredients, edible portion and nutritional quality of final product. Study on the measurement of “nutrient retention” as index of protein and calories in feed (inputs) and edible portions (outputs) in different farmed animals (Fry et al., 2018), showed that farmed Atlantic salmon, rainbow trout, have little or no efficiency benefits compared to other farmed livestock (e.g pig, cattle). Multiple measures should be computed to benchmarking the efficiency of animal productions system. For instance, based on protein inputs and outputs, a 67.2% net loss of protein is experienced during sea bass and sea bream production (MBA, 2014). The sustainability of feed has been further considered as a criterion within the KPIs selection process. The use of fishmeal and fish oil for fish feed and the impacts on forage fish resources and marine food webs are a primary metric for assessing the use of renewable natural resources by aquaculture. FCR, together with the use of the Forage Fish Dependency Ratio (FFDR) have been proposed within environmental KPIs to assess the environmental performance and sustainability of aquaculture productions (FAO, 2013; Volpe et al., 2013). Following the Rome meeting on KPIs and subsequent refinements, the above KPIs have been selected at level-B by aquaculture companies, to be implemented and validated in a second step. At present, the information on the origin and characteristics of marine ingredients used for sea bass and sea bream feed are often not available for aquaculture companies participating in PerformFISH benchmarking system. The TLPs will check the availability of these feed data, which should be provided by feed suppliers.

86
Grow out - Feed efficiency – KPIs Forms ID G16 KPI FEED CONVERSION RATIO (FCR) DIMENSION TECHNICAL - FEED EFFICIENCY
1. DEFINITION
The ratio between the dry weight of feed fed and the weight of yield gain (FA0, 2008). In this case, fish biomass of lost animals (dead and escaped) is not included in the computation.
2. INDEX
𝐹𝑒𝑒𝑑 𝐶𝑜𝑛𝑣𝑒𝑟𝑠𝑖𝑜𝑛 𝑅𝑎𝑡𝑖𝑜 (𝐹𝐶𝑅) = 𝐹𝑒𝑒𝑑 𝑑𝑒𝑙𝑖𝑣𝑒𝑟𝑒𝑑 (𝑡1 − 𝑡0)
(𝐵𝑖𝑜𝑚𝑎𝑠𝑠𝑡1 − 𝐵𝑖𝑜𝑚𝑎𝑠𝑠𝑡0 + 𝐵𝑖𝑜𝑚𝑎𝑠𝑠ℎ)
Feed delivered (t1-t0) = Feed delivered during the time interval Biomasst1 = Final biomass; Biomasst0 = Initial biomass; Biomassh = harvested biomass
Unit measure
Numerical index without unit
3. PARAMETERIZATION
Stocking period 1st Quarter (JAN – MAR), 2nd Quarter(APR – JUN), 3rd Quarter (JUL – SEP), 4th Quarter (OCT- DEC)
Population level Batch, Farm, Area
Frequency of recording Batch: 50g, 150g, 250gr, 400g, 800/harvested batches Farm and Area: 150g, 250gr, 400g, 800/harvested batches
Data input in excel form
Batch(B) and Farm (F) level
DATA INPUT Stocking 50g 150g 250g 400g 800g Harvesta Number of stocked fish n° B/F ABW at stocking g B/F ABW (at the end of period) g F F F F Exact ABW (at the end of period) g B B B B B B Feed delivered kg B B/F B B/F B/F B/F Total mortality (n of dead fish) n° B/F B/F B/F B/F B/F B/F Estimated escapees n° B B/F B B/F B/F B/F Controlled output (sampling, movement, etc.)
n° B B/F B B/F B/F B/F
Controlled biomass output (sampling, movement, etc.)
kg B B/F B B/F B/F B/F
Number of discarded fish n° B/F B B Number of harvested fish n° B/F B/F B/F Biomass of harvested fish kg B/F B/F B/F Biomass of discarded fish at slaugthering kg B/F B/F B/F
a whenever harvest is performed

87
4. NUMERICAL VALUES OF KPI IN OTHER WORKPACKAGES AND TASKS
WP3 Task name Leader
3.5 Welfare Evaluation ISPRA WP4
Task 4.1.2 Determination of Recommended Levels of Specific Nutrients for Sea Bream and Sea Bass to Maximise Growth Performance and Feed Utilisation ULPGC
Task 4.2.1 Evaluation of the Nutritional Value and Sustainability of Novel Cost Effective Alternatives to Fishmeal HCMR
Task 4.2.2 Novel Cost Effective Lipid Sources (omega yeasts, microalgae, marine microorganisms, camelina seeds, oils, etc.) ULPGC
Task 4.2.3 Understanding and Minimizing Negative Effects of Alternative Diets on Fish Health and Welfare Anti-Nutritional Factors HCMR
Task 4.3 Conditioning of Farmed Species to Novel Feeds to Improve Feed Utilisation, Growth and Fish Health ULPGC
WP6 Task 6.1 Integrated Health Management HCMR Task 6.2 Feed – Growth Trial in Different Sea Bass and/or Sea Bream Stocks HCMR
Notes:
The calculation of biomass variation in the period, will include the harvested biomass and any other biomass moved and not lost (e.g. Controlled output)
Reference to:
- Benchmarking system: GSSI, FAO Guide – indicators to monitor sustainable development of aquaculture
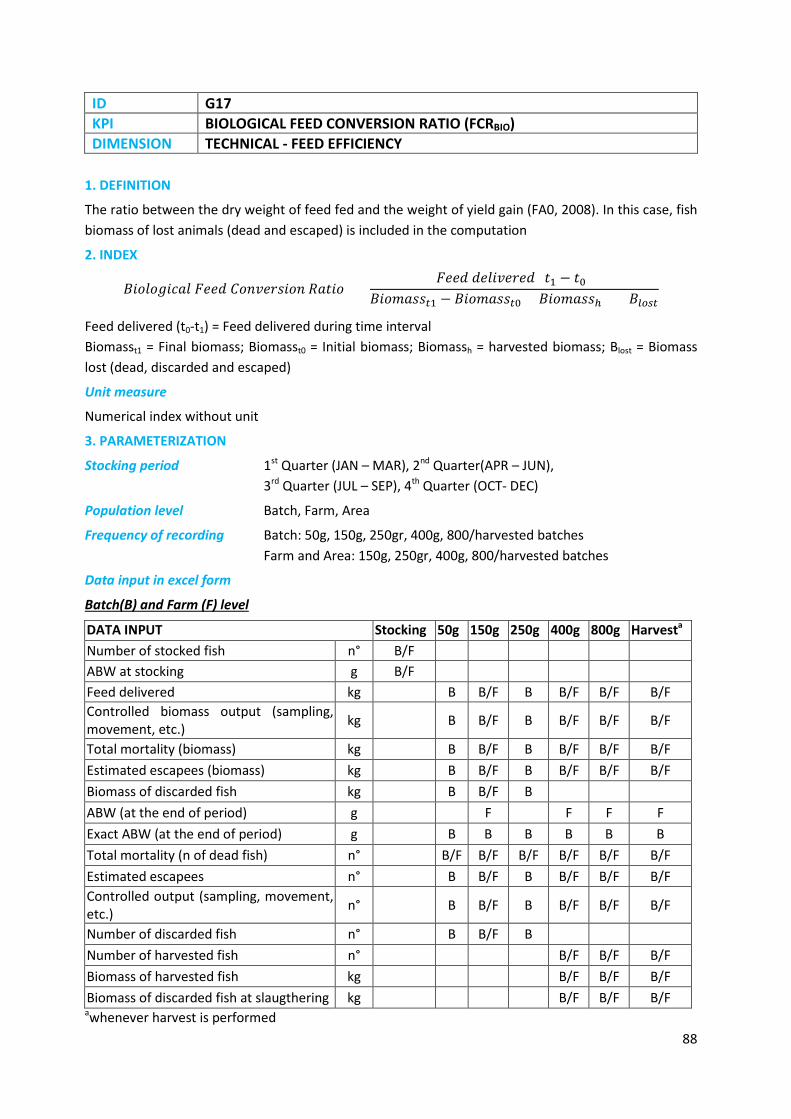
88
ID G17 KPI BIOLOGICAL FEED CONVERSION RATIO (FCRBIO) DIMENSION TECHNICAL - FEED EFFICIENCY
1. DEFINITION
The ratio between the dry weight of feed fed and the weight of yield gain (FA0, 2008). In this case, fish biomass of lost animals (dead and escaped) is included in the computation
2. INDEX
𝐵𝑖𝑜𝑙𝑜𝑔𝑖𝑐𝑎𝑙 𝐹𝑒𝑒𝑑 𝐶𝑜𝑛𝑣𝑒𝑟𝑠𝑖𝑜𝑛 𝑅𝑎𝑡𝑖𝑜 = 𝐹𝑒𝑒𝑑 𝑑𝑒𝑙𝑖𝑣𝑒𝑟𝑒𝑑 (𝑡1 − 𝑡0)
𝐵𝑖𝑜𝑚𝑎𝑠𝑠𝑡1 − 𝐵𝑖𝑜𝑚𝑎𝑠𝑠𝑡0 + 𝐵𝑖𝑜𝑚𝑎𝑠𝑠ℎ + 𝐵𝑙𝑜𝑠𝑡
Feed delivered (t0-t1) = Feed delivered during time interval Biomasst1 = Final biomass; Biomasst0 = Initial biomass; Biomassh = harvested biomass; Blost = Biomass lost (dead, discarded and escaped)
Unit measure
Numerical index without unit
3. PARAMETERIZATION
Stocking period 1st Quarter (JAN – MAR), 2nd Quarter(APR – JUN), 3rd Quarter (JUL – SEP), 4th Quarter (OCT- DEC)
Population level Batch, Farm, Area
Frequency of recording Batch: 50g, 150g, 250gr, 400g, 800/harvested batches Farm and Area: 150g, 250gr, 400g, 800/harvested batches
Data input in excel form
Batch(B) and Farm (F) level
DATA INPUT Stocking 50g 150g 250g 400g 800g Harvesta Number of stocked fish n° B/F ABW at stocking g B/F Feed delivered kg B B/F B B/F B/F B/F Controlled biomass output (sampling, movement, etc.) kg B B/F B B/F B/F B/F
Total mortality (biomass) kg B B/F B B/F B/F B/F Estimated escapees (biomass) kg B B/F B B/F B/F B/F Biomass of discarded fish kg B B/F B ABW (at the end of period) g F F F F Exact ABW (at the end of period) g B B B B B B Total mortality (n of dead fish) n° B/F B/F B/F B/F B/F B/F Estimated escapees n° B B/F B B/F B/F B/F Controlled output (sampling, movement, etc.) n° B B/F B B/F B/F B/F
Number of discarded fish n° B B/F B Number of harvested fish n° B/F B/F B/F Biomass of harvested fish kg B/F B/F B/F Biomass of discarded fish at slaugthering kg B/F B/F B/F awhenever harvest is performed

89
4. NUMERICAL VALUES OF KPI IN OTHER WORKPACKAGES AND TASKS
WP4 Task name Leader
Task 4.1.2 Determination of Recommended Levels of Specific Nutrients for Sea Bream and Sea Bass to Maximise Growth Performance and Feed Utilisation ULPGC
Task 4.2.1 Evaluation of the Nutritional Value and Sustainability of Novel Cost Effective Alternatives to Fishmeal HCMR
Task 4.2.2 Novel Cost Effective Lipid Sources (omega yeasts, microalgae, marine microorganisms, camelina seeds, oils, etc.) ULPGC
Task 4.2.3 Understanding and Minimizing Negative Effects of Alternative Diets on Fish Health and Welfare Anti-Nutritional Factors HCMR
Task 4.3 Conditioning of Farmed Species to Novel Feeds to Improve Feed Utilisation, Growth and Fish Health ULPGC
WP6 Task 6.1 Integrated Health Management HCMR Task 6.2 Feed – Growth Trial in Different Sea Bass and/or Sea Bream Stocks HCMR
Notes:
The calculation of biomass variation in the period, will include the harvested biomass and any other biomass moved and not lost (e.g. Controlled output), while BLost will include any biomass that has been lost during the time interval (e.g. mortality, estimated escapees, discharged fish)
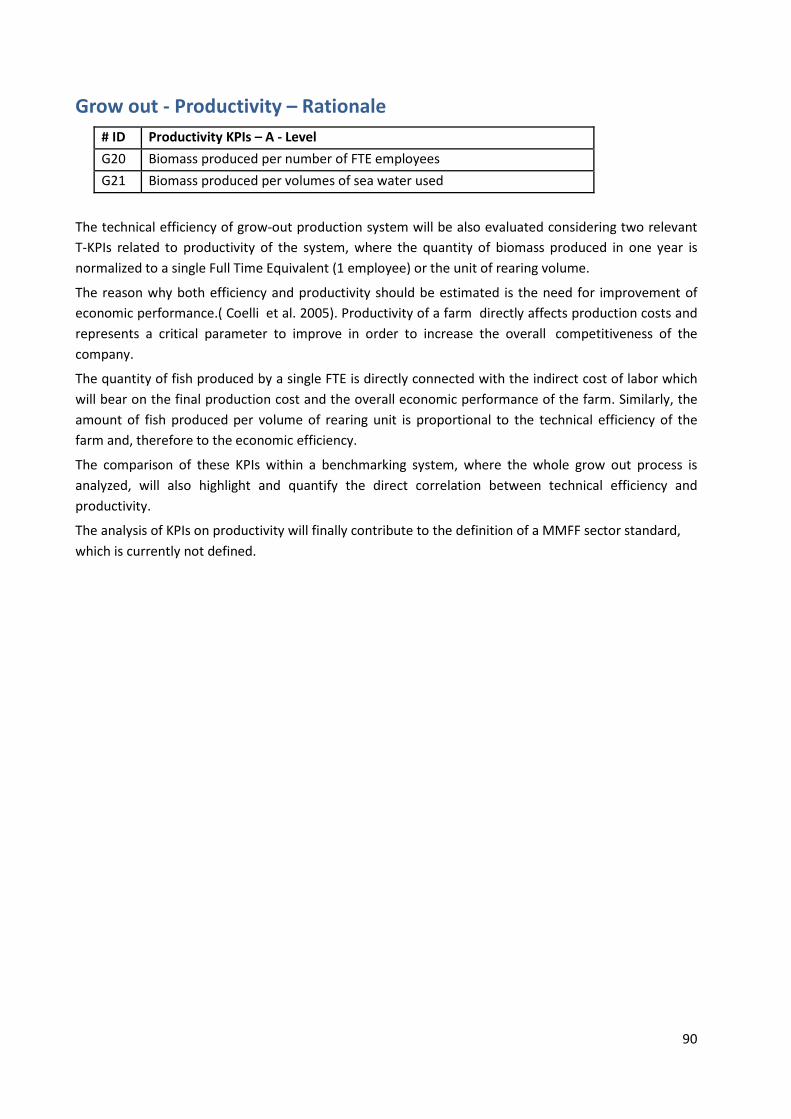
90
Grow out - Productivity – Rationale # ID Productivity KPIs – A - Level G20 Biomass produced per number of FTE employees G21 Biomass produced per volumes of sea water used
The technical efficiency of grow-out production system will be also evaluated considering two relevant T-KPIs related to productivity of the system, where the quantity of biomass produced in one year is normalized to a single Full Time Equivalent (1 employee) or the unit of rearing volume.
The reason why both efficiency and productivity should be estimated is the need for improvement of economic performance.( Coelli et al. 2005). Productivity of a farm directly affects production costs and represents a critical parameter to improve in order to increase the overall competitiveness of the company.
The quantity of fish produced by a single FTE is directly connected with the indirect cost of labor which will bear on the final production cost and the overall economic performance of the farm. Similarly, the amount of fish produced per volume of rearing unit is proportional to the technical efficiency of the farm and, therefore to the economic efficiency.
The comparison of these KPIs within a benchmarking system, where the whole grow out process is analyzed, will also highlight and quantify the direct correlation between technical efficiency and productivity.
The analysis of KPIs on productivity will finally contribute to the definition of a MMFF sector standard, which is currently not defined.

91
Grow out - Productivity – KPIs Forms ID G20 KPI BIOMASS PRODUCED PER NUMBER OF FTE EMPLOYEES DIMENSION ECONOMIC - PRODUCTIVITY
1. DEFINITION
Is the ratio of growth divided by the number of employees (Full Time Equivalents – FTE)
2. INDEX
𝐵𝑖𝑜𝑚𝑎𝑠𝑠 𝑝𝑟𝑜𝑑𝑢𝑐𝑒𝑑 𝑝𝑒𝑟 𝑛° 𝑜𝑓 𝐹𝑇𝐸 𝑒𝑚𝑝𝑙𝑜𝑦𝑒𝑒𝑠 =𝑡𝑜𝑛 𝑜𝑓 𝑓𝑖𝑠ℎ
𝑁° 𝑜𝑓 𝑒𝑚𝑝𝑙𝑜𝑦𝑒𝑒𝑠 (𝐹𝑇𝐸)
Unit measure
Ton fish/FTE employee
3. PARAMETERIZATION
Population level Farm, Area
Frequency of recording Farm and Area: Annual reporting
Data input in excel form: AGGREGATED
Farm and Area level
DATA INPUT Biomass of harvested fish Kg Annual reporting Biomass in stock at the end of the year Kg Annual reporting Biomass in stock at the beginning of the year Kg Annual reporting Number of "Full Time Equivalent"1 employees n Annual reporting
Notes:
The amount of fish produced in one year is calculated considering the variation of biomass in stock at the end and beginning of the year plus the harvested biomass in the year. 1 An FTE of 1.0 is equivalent to a full-time employee.
The concept is used to convert the hours worked by several part-time employees into the hours worked by full-time employees. On an annual basis, an FTE is considered to work the total number of hours worked by a full time employee, therefore each part time employee is accounted as FTE with the following calculation:
actual number of working hours in one year of the part time employee (included paid leaves)/annual number of working hours of a full time employee (including paid leaves).
Example: Working hours in one year for one employee of the company: 2100 Number of full time employees in the year: 5 Number of hours worked by all the part time employees during the year: 8000 Number of FTE employees= 5 + (8000/2100)= 5+3,81 = 8,81 FTE
Only employees actually working in the production process should be considered (e.g. secretaries or marketing employees have not to be included). If an employee holds different duties, only the hours spent in the production process will be taken into account.

92
ID G21 KPI BIOMASS PRODUCED PER VOLUMES OF SEA WATER USED DIMENSION ECONOMIC - PRODUCTIVITY
1. DEFINITION
Is the ratio between production and the volume of sea water used for growing fish
2. INDEX
𝐵𝑖𝑜𝑚𝑎𝑠𝑠 𝑝𝑟𝑜𝑑𝑢𝑐𝑒𝑑 𝑝𝑒𝑟 𝑣𝑜𝑙𝑢𝑚𝑒 𝑜𝑓 𝑠𝑒𝑎 𝑤𝑎𝑡𝑒𝑟 𝑢𝑠𝑒𝑑 =𝑡𝑜𝑛 𝑜𝑓 𝑓𝑖𝑠ℎ
𝑆𝑒𝑎 𝑤𝑎𝑡𝑒𝑟 𝑣𝑜𝑙𝑢𝑚𝑒 (𝑚3)
Unit measure
Ton fish/m3
3. PARAMETERIZATION
Population level Farm, Area
Frequency of recording Farm and Area: Annual reporting
Data input in excel form: AGGREGATED
Farm and Area level
DATA INPUT Volume of sea water used for growing fish for year m3 Annual reporting Biomass of harvested fish Kg Annual reporting Biomass in stock at the end of the year Kg Annual reporting Biomass in stock at the beginning of the year Kg Annual reporting
Notes:
The amount of fish produced in one year is calculated considering the variation of biomass in stock at the end and beginning of the year plus the harvested biomass in the year.

93
Grow out - Welfare - Rationale # ID WE-KPIs - A-level G1 Mortalities – total G3 Mortalities first 3 days after transport and stocking G4 Mortalities first 10 days after transport and stocking G8 Vaccinated fish– by disease G9 Number of antiparasitic treatments (total & by disease) G10 Number of antibiotic treatments (total & by disease) G18 Feed intake (FI) G19 Stocking density G22 Oxygen depletion persistence days
Improve the welfare of farmed animals responds to the ethical demand of consumers and contributes to the framework of sustainability of animal food production systems, including aquaculture (COM(2012) 6 final/2 - Strategy for the Protection and Welfare of Animals 2012-2015; CWGSAP, 2015; EFSA strategy 2020 - Trusted science for safe food; EC Food 2030). Fish welfare is indeed a strategic issue for the competitiveness and sustainability of European aquaculture (CFP Reg. EU 1380/2013; EMFF Reg. EU 508/2014) and represents a main area of the Work Programme approved by the Aquaculture Advisory Council (AAC) (FEAP Annual Report, 2017) to address welfare issues claimed by NGOs and consumer associations, which are questioning on the ethical acceptability of intensive aquaculture and claiming for the application of fish welfare indicators to document the use of animal welfare-friendly farming practices during farming, transport and at slaughter. Documenting welfare is thus an important issue for MMFF sector to provide information on the welfare of farmed sea bass and sea bream at industrial facilities and to support industry in the use of welfare indicators in their benchmarking system. The set of WE-KPIs selected in PerformFISH covers the major areas of fish welfare (health, feeding, housing, transport,) according to the scientific literature, the principles and provisions of EU legislative framework (Dir. EC 1998/58; Dir. EC 2006/88; Dir. EU 2010/63; Reg. EC 178/2002; Reg. EC 882/2004; Reg. EC 1/2005;; Reg. EC 710/2009; Reg. EU 2016/429; the OIE standards, the EFSA Opinions and the available Code of Conducts and Best Practices). Results from EU research projects focusing on operational welfare indicators (OWIs) (e.g. WEALTH, WELLFISH, BENEFISH, COPEWELL, AQUAEXCELL) and OWIs used to assess fish welfare in other farmed species, mainly salmonids (Atlantic Salmon Welfare Handbook, NOFIMA, 2017), were investigated. The use of WE-KPIs and standards in certification schemes (e.g. ASC, Global G.A.P., BAP, RSPCA, Organic) were also considered. Methodologies for measuring welfare using index and score, developed for other animal food systems (e.g. Welfare Quality®, AWIN, for beef, dairy cattle, pigs, turkeys) and for Atlantic salmon (Welfare Index Model SWIM, Stien et al., 2013; Folkedal et al., 2016) were considered. The first set of welfare indicators approved in the Rome meeting consisted of 28 WE-KPIs, 75% of were animal-based WE-KPIs and 25% are WE-KPIs indirect indicators. Most of selected WE-KPIs are already in use in one or more aquaculture certification schemes. Out of 28 KPIs, a total of 9 WE-KPIs were selected at “A-level” as ready to use, taking into account their robustness, repeatability, cost-effectiveness and feasibility. 19 WE-KPIs were selected at “B-level”, as relevant KPIs to be implemented during the project. This is the case of WE-KPIs related to the severity

94
injuries, the degree of parasite infestation, abnormal behavior which are within the scope of WP3 - task 3.5 Welfare evaluation for the validation of a Methodology to assess welfare in MMFF (Deliverable 3.6, M36). The set of WE-KPIs does not include indicators to measure welfare at slaughter, issue actually under debate at EU level (AAC, 2018; EU DG Health and Food Safety, report on “Welfare of farmed fish: Common practices during transport and at slaughter”, SANTE/2016/G2/009, 2017; FEAP Resolution (2011) on the welfare aspect of stunning and killing of Mediterranean farmed fish for human consumption, to respond to the pressure from NGOs which asking for higher fish welfare standard at slaughter. PerformFISH will contribute in this context through the identification and evaluation of potential application of direct and indirect OWIs related to stunning/slaughtering in the WP3 - task 3.5.
Number of selected Animal-based and indirect WE-KPIs WE-KPIs level Animal-based indicators Indirect indicators Total
A 4 5 9 B 17 2 19
Total 21 7 28 Table 10. Selected Animal-based and indirect WE-KPIs
Number of WE-KPIs related to welfare areas WE-KPIs
level Health Feeding Housing Transport Slaugther Total
A 4 1 2 2 9 B 13 5 1 19
Total 17 6 3 2 28 Table 11. WE-KPIs related to welfare areas

95
Grow out- Welfare – KPIs Forms
ID G3 KPI MORTALITIES FIRST 3 DAYS AFTER TRANSPORT AND STOCKING DIMENSION WELFARE
1. DEFINITION
It refers to mortalities related to transport from nursery to farm and handling stress within the first 3 days
2. INDEX
𝑀𝑜𝑟𝑡𝑎𝑙𝑖𝑡𝑖𝑒𝑠 𝑓𝑖𝑟𝑠𝑡 3 𝑑𝑎𝑦𝑠 𝑎𝑓𝑡𝑒𝑟 𝑡𝑟𝑎𝑛𝑠𝑝𝑜𝑟𝑡 𝑎𝑛𝑑 𝑠𝑡𝑜𝑐𝑘𝑖𝑛𝑔 = 𝑁° 𝑜𝑓 𝑐𝑜𝑙𝑙𝑒𝑐𝑡𝑒𝑑 𝑑𝑒𝑎𝑑 𝑓𝑖𝑠ℎ 𝑎𝑡 𝑑𝑎𝑦 3
𝑁° 𝑜𝑓 𝑠𝑡𝑜𝑐𝑘𝑒𝑑 𝑓𝑖𝑠ℎ∗ 100
Unit measure
%
3. PARAMETERIZATION
Stocking period: 1st Quarter (JAN – MAR), 2nd Quarter(APR – JUN), 3rd Quarter (JUL – SEP), 4th Quarter (OCT- DEC)
Population level: Batch, Farm, Area
Frequency of recording: Batch: at day 3 Farm and Area: at day 3
Data input in excel form
Batch (B) and Farm (F) level
DATA INPUT Stocking 50g 150g 250g 400g 800g Harvesta Number of stocked fish n° B/F Estimated number of dead fish at day 3 from stocking n° B/F a whenever harvest is performed
4. NUMERICAL VALUES OF KPI IN OTHER WORKPACKAGES AND TASKS
WP 3 Task name Leader Task 3.5.3 Welfare evaluation ISPRA WP6 Task 6.2 Feed – Growth Trial in Different Sea Bass and/or Sea Bream Stocks HCMR
Notes
Reference to:
- Certification Schemes: RSPCA; - Best practices and Guidelines: FISHWELL HANDBOOK (Atlantic salmon),

96
ID G8 KPI VACCINATED FISH - BY DISEASES DIMENSION TECHNICAL & WELFARE - WELFARE
1. DEFINITION
Percentage of vaccinated fish on total fish (by diseases)
2. INDEX
𝑉𝑎𝑐𝑐𝑖𝑛𝑎𝑡𝑒𝑑 𝑓𝑖𝑠ℎ (𝑏𝑦 𝑑𝑖𝑠𝑒𝑎𝑠𝑒) = 𝑁° 𝑜𝑓 𝑣𝑎𝑐𝑐𝑖𝑛𝑎𝑡𝑒𝑑 𝑓𝑖𝑠ℎ 𝑏𝑦 𝑑𝑖𝑠𝑒𝑎𝑠𝑒
𝑁° 𝑜𝑓 𝑠𝑡𝑜𝑐𝑘𝑒𝑑 𝑓𝑖𝑠ℎ∗ 100
Unit measure
%
3. PARAMETERIZATION
Stocking period: 1st Quarter (JAN – MAR), 2nd Quarter(APR – JUN), 3rd Quarter (JUL – SEP), 4th Quarter (OCT- DEC)
Population level: Batch, Farm, Area
Frequency of recording: Batch: at stocking Farm and Area: at stocking
Data input in excel form
Batch (B) and Farm (F) level
DATA INPUT Stocking 50g 150g 250g 400g 800g Harvesta Number of stocked fish n° B/F Number of fish vaccinated against V. anguillarum n° B/F
Number of fish vaccinated against P. damselae n° B/F
Number of fish vaccinated against Betanodavirus n° B/F awhenever harvest is performed
4. NUMERICAL VALUES OF KPI IN OTHER WORKPACKAGES AND TASKS
WP3 Task name Leader Task 3.1 Epidemiology and Health Risk Assessment UAB Task 3.3 Vaccines and Vaccination AQUAXPRS Task 3.5 Welfare Evaluation ISPRA WP6 Task 6.1 Integrated Health Management HCMR
Notes:
Reference to:
- Certification Schemes: RSPCA; Global G.A.P.
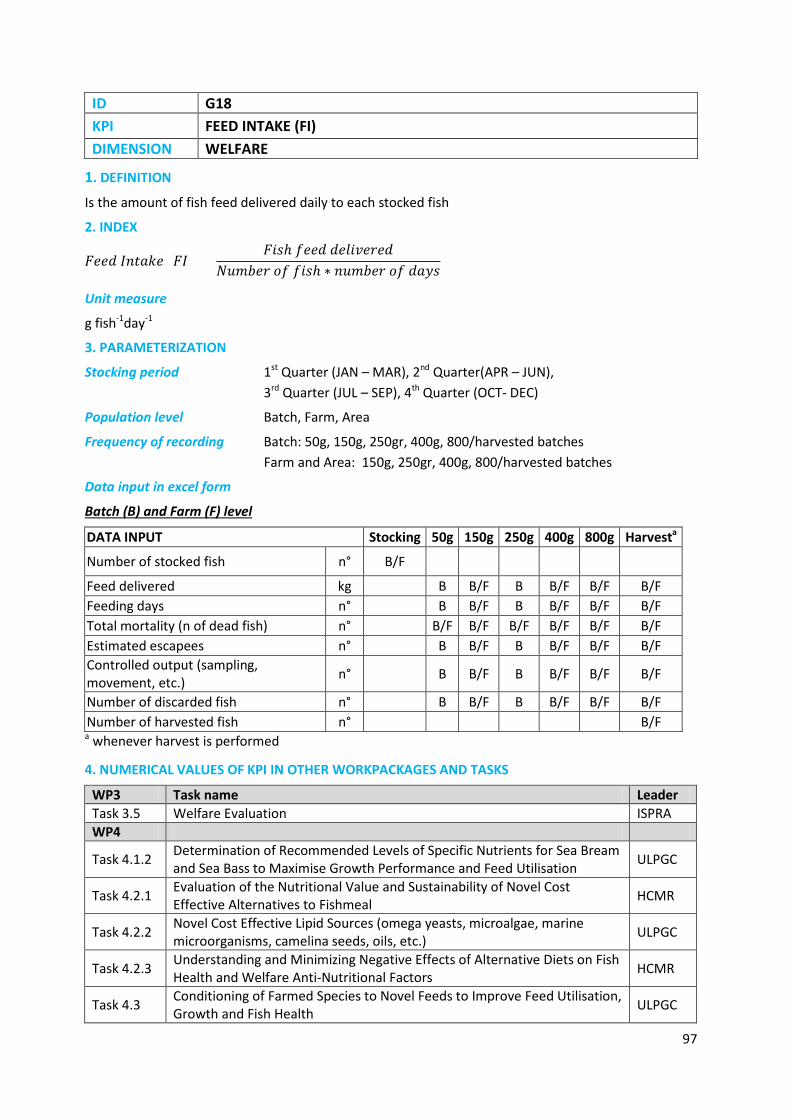
97
ID G18 KPI FEED INTAKE (FI) DIMENSION WELFARE
1. DEFINITION
Is the amount of fish feed delivered daily to each stocked fish
2. INDEX
𝐹𝑒𝑒𝑑 𝐼𝑛𝑡𝑎𝑘𝑒 (𝐹𝐼) = 𝐹𝑖𝑠ℎ 𝑓𝑒𝑒𝑑 𝑑𝑒𝑙𝑖𝑣𝑒𝑟𝑒𝑑
𝑁𝑢𝑚𝑏𝑒𝑟 𝑜𝑓 𝑓𝑖𝑠ℎ ∗ 𝑛𝑢𝑚𝑏𝑒𝑟 𝑜𝑓 𝑑𝑎𝑦𝑠
Unit measure
g fish-1day-1
3. PARAMETERIZATION
Stocking period 1st Quarter (JAN – MAR), 2nd Quarter(APR – JUN), 3rd Quarter (JUL – SEP), 4th Quarter (OCT- DEC)
Population level Batch, Farm, Area
Frequency of recording Batch: 50g, 150g, 250gr, 400g, 800/harvested batches Farm and Area: 150g, 250gr, 400g, 800/harvested batches
Data input in excel form
Batch (B) and Farm (F) level
DATA INPUT Stocking 50g 150g 250g 400g 800g Harvesta
Number of stocked fish n° B/F
Feed delivered kg B B/F B B/F B/F B/F Feeding days n° B B/F B B/F B/F B/F Total mortality (n of dead fish) n° B/F B/F B/F B/F B/F B/F Estimated escapees n° B B/F B B/F B/F B/F Controlled output (sampling, movement, etc.) n° B B/F B B/F B/F B/F
Number of discarded fish n° B B/F B B/F B/F B/F Number of harvested fish n° B/F a whenever harvest is performed
4. NUMERICAL VALUES OF KPI IN OTHER WORKPACKAGES AND TASKS
WP3 Task name Leader Task 3.5 Welfare Evaluation ISPRA WP4
Task 4.1.2 Determination of Recommended Levels of Specific Nutrients for Sea Bream and Sea Bass to Maximise Growth Performance and Feed Utilisation ULPGC
Task 4.2.1 Evaluation of the Nutritional Value and Sustainability of Novel Cost Effective Alternatives to Fishmeal HCMR
Task 4.2.2 Novel Cost Effective Lipid Sources (omega yeasts, microalgae, marine microorganisms, camelina seeds, oils, etc.) ULPGC
Task 4.2.3 Understanding and Minimizing Negative Effects of Alternative Diets on Fish Health and Welfare Anti-Nutritional Factors HCMR
Task 4.3 Conditioning of Farmed Species to Novel Feeds to Improve Feed Utilisation, Growth and Fish Health ULPGC
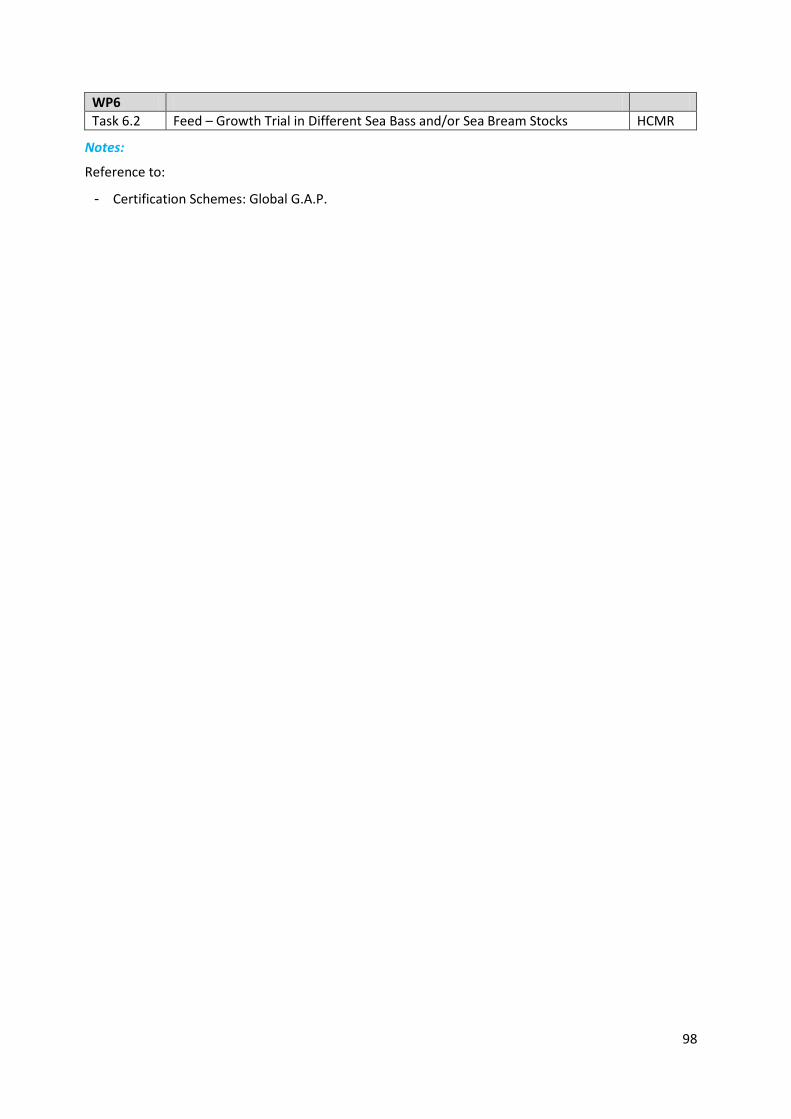
98
WP6 Task 6.2 Feed – Growth Trial in Different Sea Bass and/or Sea Bream Stocks HCMR
Notes:
Reference to:
- Certification Schemes: Global G.A.P.

99
ID G19 KPI STOCKING DENSITY DIMENSION WELFARE
1. DEFINITION
It refers to the maximum stocking density (kg/m3) routinely achieved at harvest at farm level
2. INDEX
𝑆𝑡𝑜𝑐𝑘𝑖𝑛𝑔 𝑑𝑒𝑛𝑠𝑖𝑡𝑦 = 𝑀𝑎𝑥𝑖𝑚𝑢𝑚 𝑠𝑡𝑜𝑐𝑘𝑒𝑑 𝑏𝑖𝑜𝑚𝑎𝑠𝑠 (𝑘𝑔)
𝐶𝑎𝑔𝑒 𝑣𝑜𝑙𝑢𝑚𝑒 (𝑚3)
Unit measure
Kg/m3
3. PARAMETERIZATION
Stocking period 1st Quarter (JAN – MAR), 2nd Quarter(APR – JUN), 3rd Quarter (JUL – SEP), 4th Quarter (OCT- DEC)
Population level Batch, Farm
Frequency of recording Batch: at harvest Farm: at harvest
Data input in excel form
Batch (B) and Farm (F) levell
DATA INPUT Stocking 50g 150g 250g 400g 800g Harvesta
Maximum stocking density kg/m3 B B B
Average maximum stocking density at farm level kg/m3 F F F a whenever harvest is performed
4. NUMERICAL VALUES OF KPI IN OTHER WORKPACKAGES AND TASKS
WP Task name Leader Task 3.5.3 Welfare evaluation ISPRA
Notes:
Reference to:
- Certification Schemes: BAP; Organic; RSPCA - Welfare Index models: SWIM (Atlantic salmon) - Best practices and Guidelines: FISHWELL HANDBOOK (Atlantic salmon)
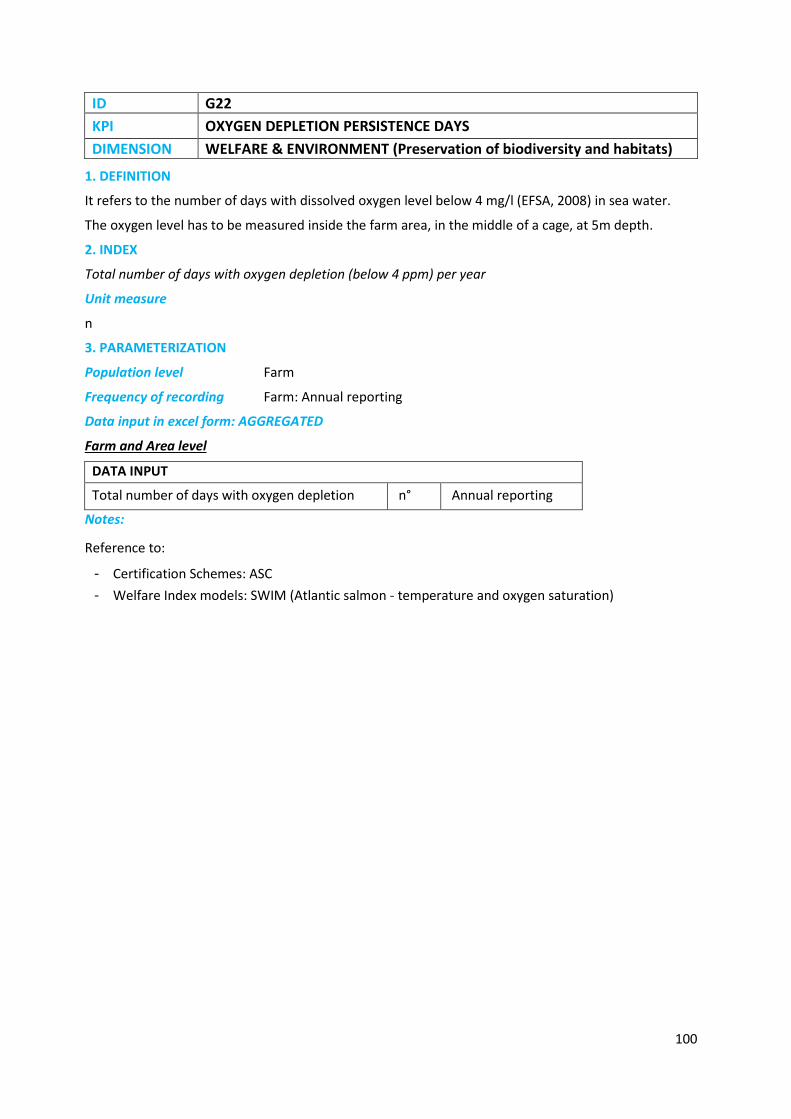
100
ID G22 KPI OXYGEN DEPLETION PERSISTENCE DAYS DIMENSION WELFARE & ENVIRONMENT (Preservation of biodiversity and habitats)
1. DEFINITION
It refers to the number of days with dissolved oxygen level below 4 mg/l (EFSA, 2008) in sea water.
The oxygen level has to be measured inside the farm area, in the middle of a cage, at 5m depth.
2. INDEX
Total number of days with oxygen depletion (below 4 ppm) per year
Unit measure
n
3. PARAMETERIZATION
Population level Farm
Frequency of recording Farm: Annual reporting
Data input in excel form: AGGREGATED
Farm and Area level
DATA INPUT
Total number of days with oxygen depletion n° Annual reporting
Notes:
Reference to:
- Certification Schemes: ASC - Welfare Index models: SWIM (Atlantic salmon - temperature and oxygen saturation)
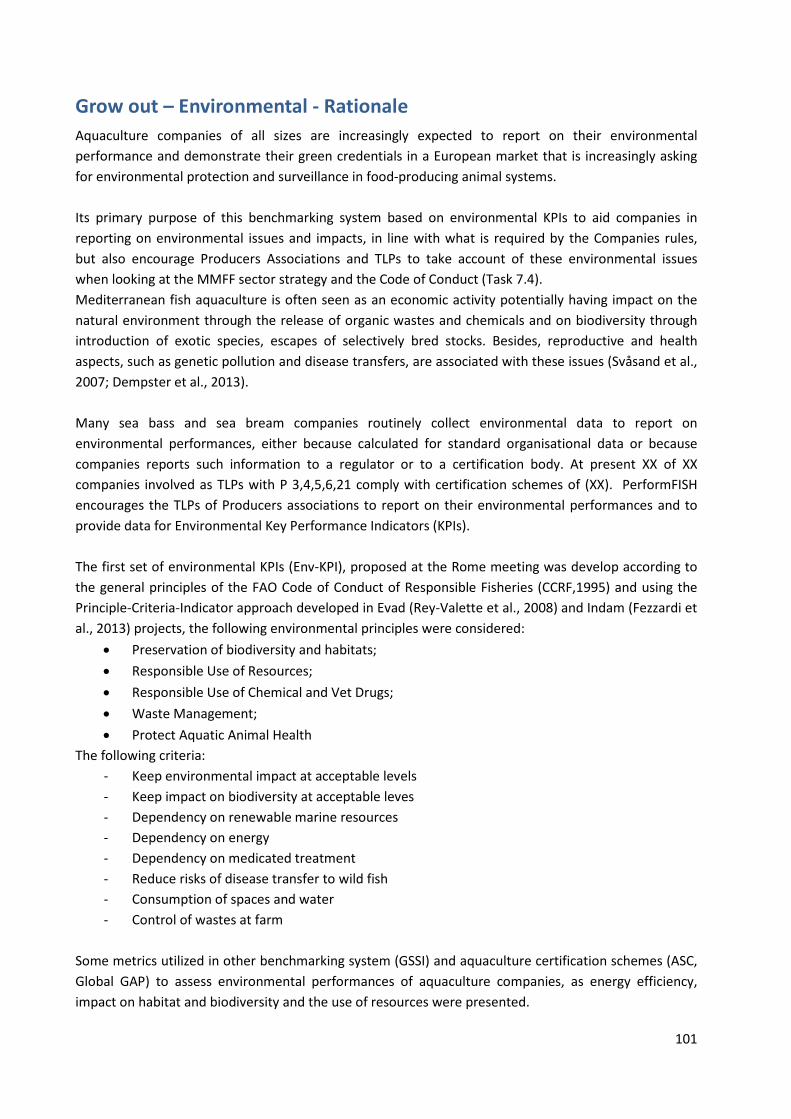
101
Grow out – Environmental - Rationale Aquaculture companies of all sizes are increasingly expected to report on their environmental performance and demonstrate their green credentials in a European market that is increasingly asking for environmental protection and surveillance in food-producing animal systems. Its primary purpose of this benchmarking system based on environmental KPIs to aid companies in reporting on environmental issues and impacts, in line with what is required by the Companies rules, but also encourage Producers Associations and TLPs to take account of these environmental issues when looking at the MMFF sector strategy and the Code of Conduct (Task 7.4). Mediterranean fish aquaculture is often seen as an economic activity potentially having impact on the natural environment through the release of organic wastes and chemicals and on biodiversity through introduction of exotic species, escapes of selectively bred stocks. Besides, reproductive and health aspects, such as genetic pollution and disease transfers, are associated with these issues (Svåsand et al., 2007; Dempster et al., 2013). Many sea bass and sea bream companies routinely collect environmental data to report on environmental performances, either because calculated for standard organisational data or because companies reports such information to a regulator or to a certification body. At present XX of XX companies involved as TLPs with P 3,4,5,6,21 comply with certification schemes of (XX). PerformFISH encourages the TLPs of Producers associations to report on their environmental performances and to provide data for Environmental Key Performance Indicators (KPIs). The first set of environmental KPIs (Env-KPI), proposed at the Rome meeting was develop according to the general principles of the FAO Code of Conduct of Responsible Fisheries (CCRF,1995) and using the Principle-Criteria-Indicator approach developed in Evad (Rey-Valette et al., 2008) and Indam (Fezzardi et al., 2013) projects, the following environmental principles were considered:
• Preservation of biodiversity and habitats; • Responsible Use of Resources; • Responsible Use of Chemical and Vet Drugs; • Waste Management; • Protect Aquatic Animal Health
The following criteria: - Keep environmental impact at acceptable levels - Keep impact on biodiversity at acceptable leves - Dependency on renewable marine resources - Dependency on energy - Dependency on medicated treatment - Reduce risks of disease transfer to wild fish - Consumption of spaces and water - Control of wastes at farm
Some metrics utilized in other benchmarking system (GSSI) and aquaculture certification schemes (ASC, Global GAP) to assess environmental performances of aquaculture companies, as energy efficiency, impact on habitat and biodiversity and the use of resources were presented.
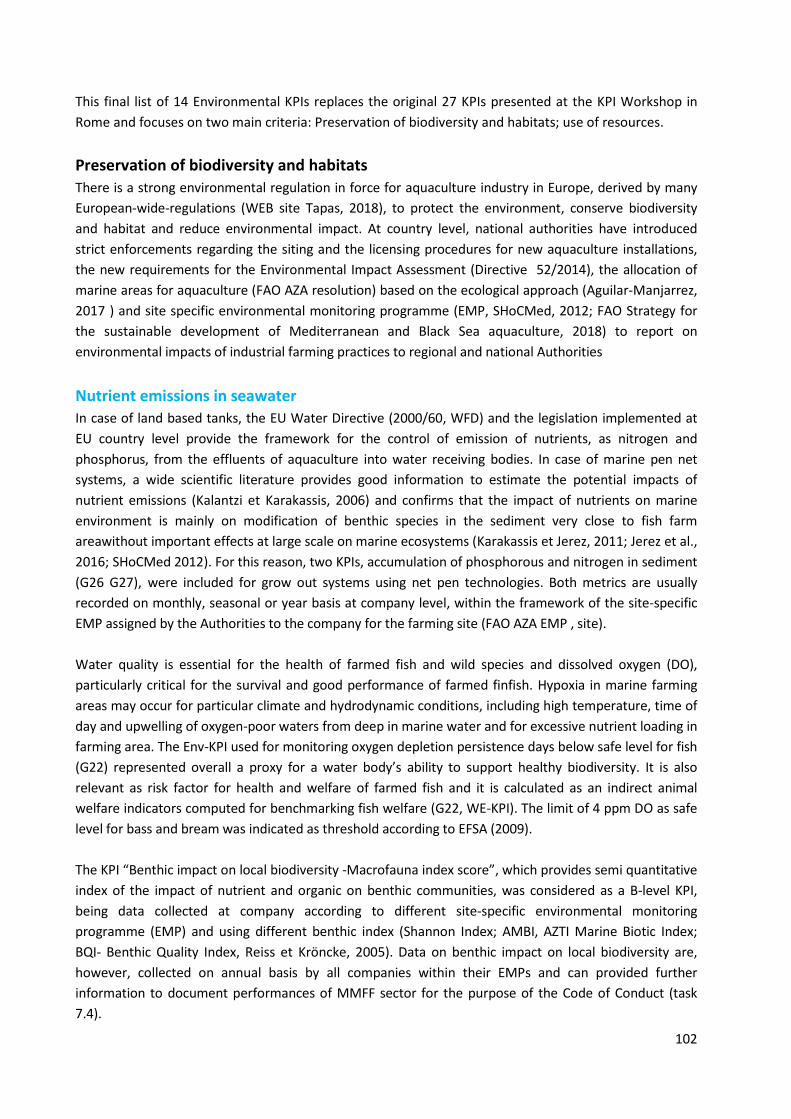
102
This final list of 14 Environmental KPIs replaces the original 27 KPIs presented at the KPI Workshop in Rome and focuses on two main criteria: Preservation of biodiversity and habitats; use of resources. Preservation of biodiversity and habitats There is a strong environmental regulation in force for aquaculture industry in Europe, derived by many European-wide-regulations (WEB site Tapas, 2018), to protect the environment, conserve biodiversity and habitat and reduce environmental impact. At country level, national authorities have introduced strict enforcements regarding the siting and the licensing procedures for new aquaculture installations, the new requirements for the Environmental Impact Assessment (Directive 52/2014), the allocation of marine areas for aquaculture (FAO AZA resolution) based on the ecological approach (Aguilar-Manjarrez, 2017 ) and site specific environmental monitoring programme (EMP, SHoCMed, 2012; FAO Strategy for the sustainable development of Mediterranean and Black Sea aquaculture, 2018) to report on environmental impacts of industrial farming practices to regional and national Authorities Nutrient emissions in seawater In case of land based tanks, the EU Water Directive (2000/60, WFD) and the legislation implemented at EU country level provide the framework for the control of emission of nutrients, as nitrogen and phosphorus, from the effluents of aquaculture into water receiving bodies. In case of marine pen net systems, a wide scientific literature provides good information to estimate the potential impacts of nutrient emissions (Kalantzi et Karakassis, 2006) and confirms that the impact of nutrients on marine environment is mainly on modification of benthic species in the sediment very close to fish farm areawithout important effects at large scale on marine ecosystems (Karakassis et Jerez, 2011; Jerez et al., 2016; SHoCMed 2012). For this reason, two KPIs, accumulation of phosphorous and nitrogen in sediment (G26 G27), were included for grow out systems using net pen technologies. Both metrics are usually recorded on monthly, seasonal or year basis at company level, within the framework of the site-specific EMP assigned by the Authorities to the company for the farming site (FAO AZA EMP , site). Water quality is essential for the health of farmed fish and wild species and dissolved oxygen (DO), particularly critical for the survival and good performance of farmed finfish. Hypoxia in marine farming areas may occur for particular climate and hydrodynamic conditions, including high temperature, time of day and upwelling of oxygen-poor waters from deep in marine water and for excessive nutrient loading in farming area. The Env-KPI used for monitoring oxygen depletion persistence days below safe level for fish (G22) represented overall a proxy for a water body’s ability to support healthy biodiversity. It is also relevant as risk factor for health and welfare of farmed fish and it is calculated as an indirect animal welfare indicators computed for benchmarking fish welfare (G22, WE-KPI). The limit of 4 ppm DO as safe level for bass and bream was indicated as threshold according to EFSA (2009). The KPI “Benthic impact on local biodiversity -Macrofauna index score”, which provides semi quantitative index of the impact of nutrient and organic on benthic communities, was considered as a B-level KPI, being data collected at company according to different site-specific environmental monitoring programme (EMP) and using different benthic index (Shannon Index; AMBI, AZTI Marine Biotic Index; BQI- Benthic Quality Index, Reiss et Kröncke, 2005). Data on benthic impact on local biodiversity are, however, collected on annual basis by all companies within their EMPs and can provided further information to document performances of MMFF sector for the purpose of the Code of Conduct (task 7.4).

103
Marine Life The set of En-KPIs identified as A-level for “Preservation of biodiversity and habitats” are 6 indicators of which 3 KPIs provide numerical values of the impacts of farming practices on marine wildlife, as interactions with marine mammals, birds, fish, reptiles, and escapees of farmed fish. Aquaculture attracts a variety of predators and wildlife and accidental and deliberate mortalities may occur for specie of conservation interest. The list of endangered species of interest in PerformFISH considered the European legislative framework: the species listed in the in Annex II and Annex IV of the Habitat Directive (92/43/EEC), in the Annex I of the Birds Directive (2009/147/EC) and The Protocol concerning Specially Protected Areas and Biological Diversity in the Mediterranean (SPA/BD) of the Barcelona Convention (1976), which also included threatened or endangered marine birds and six species of turtles and some species of fish and cetaceans. The “List of Concern” of protected species includes five species of seals and turtles, all species of cetaceans, some marine fish and marine birds. ISPRA will provide to the companies a simplified list of protected species to facilitate the identification of species of interests for MMFF sector.
Escapee The growth of the MMFF industry increases the potential number of farmed fish in the wild and, consequently, the escape-related issues. Knowledge of the extent and causes of escape incidents from net pen facilities varies greatly from country to country across Europe. Several countries, such as Norway, Scotland and Ireland, have legislated reporting requirements whereby farmers are obligated to report escape incidents, their size and cause and when they occur. In contrast, Mediterranean countries have no such requirements; thus no statistics are available on the number of escapes or the underlying causes of escapes (Seafood Watch, 2014). According to data collected within the “Prevent Impact” EU program, the main causes of escape incidents for sea bream and sea bass in the Mediterranean Sea are either biological (51.5%; e.g. net biting, predator attack) or structural failures (39.4%; e.g. cage break, mooring failure, mechanical net damage), as opposed to operational failures (6%; e.g. harvesting, grading, transport), with more incidents involving sea bream than sea bass (Jackson et al., 2015). In financial terms, Jackson et al. (2015) claimed fish escapes as a major handicap for Mediterranean fish farmers, causing annual losses of €42.8 million in small- and large-scale events (>7 million fish in 67 incidents over a 3-year study period). Knowledge of the specific effects of escaped fish on the ecosystem is limited to Atlantic salmon (Salmo salar) and, to a lesser extent, Atlantic cod (Gadus morhua), highlighting detrimental effects on wild conspecifics and native populations (Naylor et al., 2005; Moe et al., 2007; Jensen et al., 2010). The first negative environmental impacts of escapees arise from more direct biotic interactions, which might result in serious alterations to native ecosystems. Escaped sea bream showed high adaptability to new environments. One study found that they were recaptured in natural habitats, feeding on their most common natural prey just after 1 week in the wild (Arechavala-Lopez et al., 2012). Escaped sea bream and sea bass may become the most abundant predator in shallow coastal waters within tens of kilometers from fish farms, preying on different trophic guilds such as wild fish, crustaceans and cephalopods, which are typically consumed by the autochthonous predators (Gonzalez-Lorenzo et al., 2005; Toledo-Guedes et al., 2009, 2014). Nevertheless, the potential impact of competition could be higher if escape incidents occur in areas where fish assemblages are already subjected to anthropic stressors such as overfishing, pollution or habitat degradation (Giakoumi et al., 2015), and the final

104
effect of the escape would be affected by the carrying capacity of the habitat regarding trophic resources and habitat complexity (Coll et al., 2013). The potential risk of pathogen transmission via escapees in fish farming areas has been scarcely documented. The large number of pathogens affecting both cultured sea bream and sea bass, the species-specificity of certain pathogens (Raynard et al., 2007), and the fact that escaped sea bream and sea bass visit nearby farms (Arechavala-Lopez et al., 2011, 2012), increase the potential risk of disease transmission among farmed stocks (Arechavala-Lopez et al., 2013). This aspect should be very relevant if fish farms coexist in a certain area (i.e. aquaculture polygons) as a result of spatial planning decision-makers. The possible genetic effects of escaped fish on their wild counterparts within the ecosystem has raised lot of concern. The magnitude of impact depends on several important factors, such as the wild population genetic structure and phenotypic variability (Fraser et al., 2010), the size of the local or affected population in relation to the spillover frequency (Rhymer and Simberloff, 1996), the applied breeding programme (number of selected traits and generations under selection) and broodstock origin (non-local vs. local) (Baskett et al., 2013). In the Mediterranean, sea bream and sea bass breeding programmes were initiated in the early 2000s, and at present, the majority of production relies on fingerlings sourced from hatchery-reared-domesticated broodstock. Some programmes are based on structured selective breeding with strains of eight generations under selection (Janssen et al., 2017). Genetic studies on wild sea bream populations have demonstrated contradictory results, indicating either a weak genetic structure in the Atlantic and Mediterranean Seas (Alarcon et al., 2004; De Innocentiis et al., 2004; Franchini et al., 2012) or strong genetic subdivision at short distances throughout the Mediterranean Basin (Ben-Slimen et al., 2004). On the other hand, farmed fish generally form genetically distinct groups compared to wild populations (Karaiskou et al., 2009; Loukovitis et al., 2012). In the case of European sea bass, wild population genetic differentiation has been well studied, showing evidence that some wild Mediterranean stocks may have already been affected by escapees (Bahri-Sfar et al., 2005). According to Taranger et al., (2015), the risk of introgression can be considered moderate, at least for the eastern Adriatic Sea, i.e. risk is considered high with a frequency of escapees above 10% and low below 4%. In PerformFISH benchmarking system, fish escapes represent a component of production batches performances (Uncounted losses, G5). Estimate of small and large escape events at growth out facilities is required to get a cumulative number of escape fish along the production cycle. Escapees are calculated as number of escape episodes occurring at farm level on yearly basis, normalized by the surface area of the farm (G23) and as the estimated number of escaped fish, normalized by biomass produced in tonnes (G24). The Env-KPI G24, together with Env-KPI G24 is among those KPIs considered to address high sensitive data for MMFF sector and will firstly managed and keep confidential to Producer Associations. Numerical data for the calculation of these KPIs provided by means of the submission form will be storage in the workspace created for this scope in the PerformFISH KPI VRE.

105
Use of resources At the present stage the inclusion of energy indicators and resource use indicators into the system of environmental assessments is a common trend to sustainable “green” growth. The benchmarking KPIs system included six En-KPIs to get numerical values of the use of natural resources (marine space, land and freshwater) and the use of energy and calculate The En-KPI G28-G35 are closely related to the issues of resource deficiency, which is the biggest environmental challenge combined with climate changes facing current and future generations. The selected key environmental performances indicators are among the essential parameters used in life cycle inventory use input and outputs and relevant for environmental impact assessment in animal food production systems (Aubin et al. 2009; Ramos, 2016; Aubin et al. 2009). Energy consumption used in food production has become a source of major public concern because of the potential impact of gaseous emissions on heat-radiation absorption in atmosphere and climate change. Despite the importance of an efficient and sustainable energy use for fish production, there are very few data available on energy consumption in aquaculture. This issue is quite new for Mediiterranean companies and the data collected in this process, will allow producers to make a first comparative energy assessments during the phase of grow–out process in cages and land based facilities. Indicators for energy consumption and specific requirements to the maximum energy of GHG emissions allowed at farm level are under analysis also in certification schemes ( e.g. ASC, 2017), to raise awareness of aquaculture producers to the importance of GHG emissions. The data inputs for the calculation of KPIs are related to 1 year period and the reference unit is the farm at gate. The system of KPIs will be used to document the resources consumed and the emissions to the environment, without any computation for the transformation of the inventory data recorded using KPIs (resources an emissions) in impact categories for environmental impact estimation. All eEn-KPIs are normalised by functional unit (ton produced) to facilitate comparison across different organisation sectors and products. The calculation of G31-35 KPIs, only takes into account emissions coming directly from a source that is controlled by the farm/facility (eg. Fuel for boat) and emissions resulting from the generation of purchased electricity, heating, or cooling. Quantification of emissions is calculated by multiplying activity data (e.g., quantity of fuel or kwh consumed) by an emission factor (e.g., CO2/kwh). The calculation of GHG emissions (G35) will be computed automatically in the database using as input the data recorded for KPI 31-33.

106
Grow out - Environment – KPIs Forms
ID G23 KPI ESCAPES - NUMBER OF EPISODES DIMENSION ENVIRONMENT - Preservation of biodiversity and habitats
1. DEFINITION
Number of episodes of escapes, considering both small and large scale escape events of fish.
2. INDEX
𝐸𝑠𝑐𝑎𝑝𝑒𝑠(𝑁𝑢𝑚𝑏𝑒𝑟 𝑜𝑓 𝑒𝑝𝑖𝑠𝑜𝑑𝑒𝑠) = 𝑁𝑢𝑚𝑏𝑒𝑟 𝑜𝑓 𝑒𝑠𝑐𝑎𝑝𝑒𝑠 𝑒𝑝𝑖𝑠𝑜𝑑𝑒𝑠
𝑡𝑜𝑛 𝑜𝑓 𝑓𝑖𝑠ℎ
Unit measure
n. of episodes of escape/ ton fish
3. PARAMETERIZATION
Population level Farm, Area
Frequency of recording Farm, Area: Annual reporting
Data input in excel form: AGGREGATED
Farm and Area level
DATA INPUT Number of episodes of escape n Annual reporting Biomass of harvested fish Kg Annual reporting Biomass in stock at the end of the year Kg Annual reporting Biomass in stock at the beginning of the year Kg Annual reporting
Notes:
The amount of fish produced in one year is calculated considering the variation of biomass in stock at the end and beginning of the year plus the harvested biomass in the year.
Reference to
- Certification Schemes: Global G.A.P.; RSPCA; ASC B&B; - Benchmarking system: GSSI

107
ID G24 KPI ESCAPES - ESTIMATED NUMBER OF ESCAPED FISH DIMENSION ENVIRONMENT - Preservation of biodiversity and habitats
1. DEFINITION
It refers to the estimated number of escaped fish.
2. INDEX
𝐸𝑠𝑐𝑎𝑝𝑒𝑠(𝐸𝑠𝑡𝑖𝑚𝑎𝑡𝑒𝑑 𝑛𝑢𝑚𝑏𝑒𝑟 𝑜𝑓 𝑒𝑠𝑐𝑎𝑝𝑒𝑑 𝑓𝑖𝑠ℎ) = 𝐸𝑠𝑡𝑖𝑚𝑎𝑡𝑒𝑑 𝑛𝑢𝑚𝑏𝑒𝑟 𝑜𝑓 𝑒𝑠𝑐𝑎𝑝𝑒𝑑 𝑓𝑖𝑠ℎ𝑡𝑜𝑛 𝑜𝑓 𝑓𝑖𝑠ℎ
Unit measure
n. of fish / ton fish
3. PARAMETERIZATION
Population level Farm, Area
Frequency of recording Farm, Area: Annual reporting
Data input in excel form: AGGREGATED
Farm and Area level
DATA INPUT Estimated number of escaped fish n Annual reporting Biomass of harvested fish Kg Annual reporting Biomass in stock at the end of the year Kg Annual reporting Biomass in stock at the beginning of the year Kg Annual reporting
Notes:
The amount of fish produced in one year is calculated considering the variation of biomass in stock at the end and beginning of the year plus the harvested biomass in the year.
Reference to: - Certification Schemes: ASC - Benchmarking system: GAPI

108
ID G25
KPI ENDANGERED MARINE MAMMALS, REPTILES, FISHES AND BIRDS LETHAL INCIDENTS
DIMENSION ENVIRONMENT - Preservation of biodiversity and habitats 1. DEFINITION
It refers to number of the lethal incidents of endangered species (marine mammals, birds, fish and turtles).
2. INDEX
𝐸𝑛𝑑𝑎𝑛𝑔𝑒𝑟𝑒𝑑 𝑚𝑎𝑟𝑖𝑛𝑒 𝑚𝑎𝑚𝑚𝑎𝑙𝑠, 𝑟𝑒𝑝𝑡𝑖𝑙𝑒𝑠,𝑓𝑖𝑠ℎ𝑒𝑠 𝑎𝑛𝑑 𝑏𝑖𝑟𝑑𝑠 𝑙𝑒𝑡ℎ𝑎𝑙 𝑖𝑛𝑐𝑖𝑑𝑒𝑛𝑡𝑠
=𝑁𝑢𝑚𝑏𝑒𝑟 𝑜𝑓 𝑙𝑒𝑡ℎ𝑎𝑙 𝑖𝑛𝑐𝑖𝑑𝑒𝑛𝑡𝑠
ℎ𝑎
Unit measure
n. of lethal incident/ha/year
3. PARAMETERIZATION
Population level Farm, Area,
Frequency of recording Farm, Area: Annual reporting
Data input in excel form: AGGREGATED
Farm and Area level
DATA INPUT Number of lethal incidents (Marine endangered species)
n. Annual reporting
Total marine space use for farming ha Annual reporting
Notes
The list of endangered species is according to Protocol concerning specially protected areas and biological diversity in the Mediterranean (Annex 2 and Annex 3), to the Habitat Directive (Annex II and IV) and the Birds Directive (Annex I ).
Reference to:
- Certification Schemes: ASC; RSPCA; - Benchmarking system: GSSI

109
ID G26 KPI PHOSPHOROUS ACCUMULATED IN SEDIMENT DIMENSION ENVIRONMENT - Preservation of biodiversity and habitats 1. DEFINITION
Amount of Phosphorus accumulated in seabed sediment, in the Allowable Zone of Effect (AZE), according to the data provided in the Environmental Monitoring Report by the Company level for national regulations or certification scheme adopted. This KPI will be implemented by Month 24.
2. INDEX
𝑃ℎ𝑜𝑠𝑝𝑜𝑟𝑜𝑢𝑠 𝑎𝑐𝑐𝑢𝑚𝑎𝑙𝑎𝑡𝑒𝑑 𝑖𝑛 𝑠𝑒𝑑𝑖𝑚𝑒𝑛𝑡 = 𝑃 𝑎𝑐𝑐𝑢𝑚𝑢𝑙𝑎𝑡𝑒𝑑 𝑖𝑛 𝑠𝑒𝑑𝑖𝑚𝑒𝑛𝑡 (𝑔)
𝑠𝑒𝑑𝑖𝑚𝑒𝑛𝑡 (𝑘𝑔)
Unit measure
g/kg of sediment
3. PARAMETERIZATION
Population level Farm
Frequency of recording Farm: EMP/Annual reporting
Data input in excel form: NONE
Notes Reference to:
- Certification Schemes: Global G.A.P.; Organic; ASC

110
ID G27 KPI NITROGEN ACCUMULATED IN SEDIMENT DIMENSION ENVIRONMENT - Preservation of biodiversity and habitats
1. DEFINITION
Amount of Nitrogen accumulated in seabed sediment, in the Allowable Zone of Effect (AZE), according to the data provided in the Environmental Monitoring Report by the Company level for national regulations or certification scheme adopted. This KPI will be implemented by Month 24.
2. INDEX
𝑁 𝑎𝑐𝑐𝑢𝑚𝑢𝑙𝑎𝑡𝑒𝑑 𝑖𝑛 𝑠𝑒𝑑𝑖𝑚𝑒𝑛𝑡 = 𝑁 𝑎𝑐𝑐𝑢𝑚𝑢𝑙𝑎𝑡𝑒𝑑 𝑖𝑛 𝑠𝑒𝑑𝑖𝑚𝑒𝑛𝑡 (𝑔)
𝑠𝑒𝑑𝑖𝑚𝑒𝑛𝑡 (𝑘𝑔)
Unit measure
g/kg of sediment
3. PARAMETERIZATION
Population level Farm
Frequency of recording Farm: EMP/Annual reporting
Data input in excel form: NONE
Notes
Reference to:
- Certification Schemes: Organic; ASC
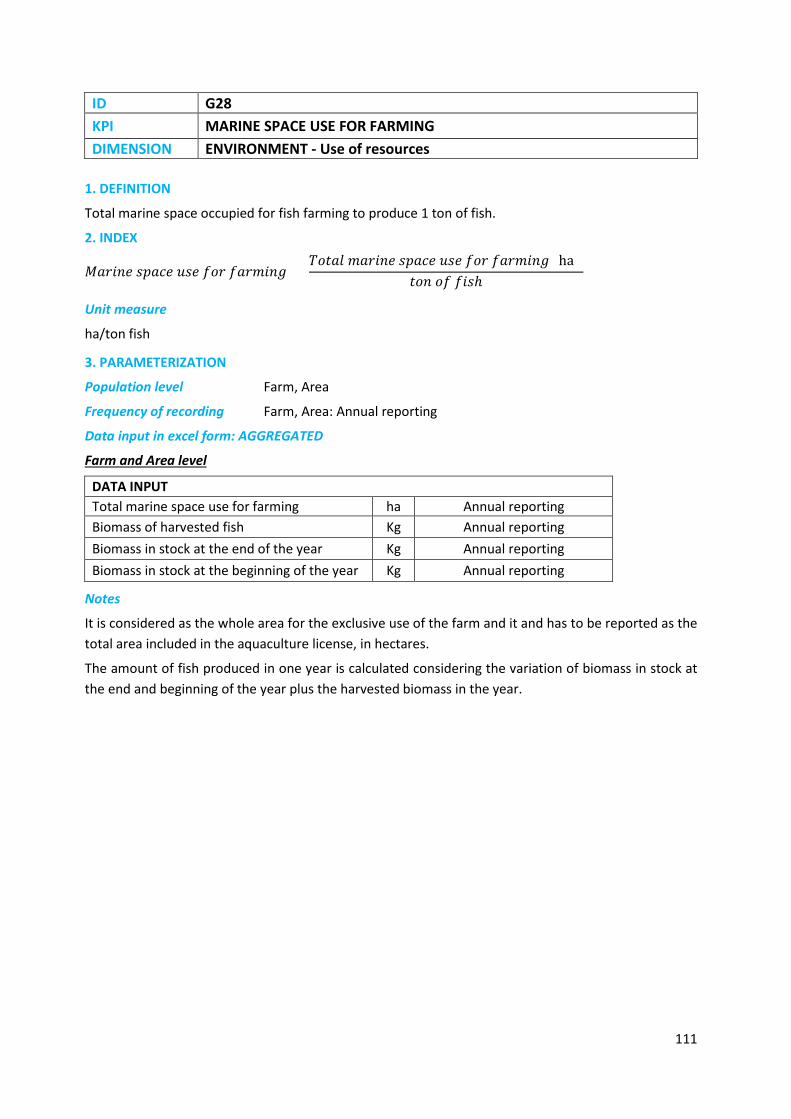
111
ID G28 KPI MARINE SPACE USE FOR FARMING DIMENSION ENVIRONMENT - Use of resources
1. DEFINITION
Total marine space occupied for fish farming to produce 1 ton of fish.
2. INDEX
𝑀𝑎𝑟𝑖𝑛𝑒 𝑠𝑝𝑎𝑐𝑒 𝑢𝑠𝑒 𝑓𝑜𝑟 𝑓𝑎𝑟𝑚𝑖𝑛𝑔 = 𝑇𝑜𝑡𝑎𝑙 𝑚𝑎𝑟𝑖𝑛𝑒 𝑠𝑝𝑎𝑐𝑒 𝑢𝑠𝑒 𝑓𝑜𝑟 𝑓𝑎𝑟𝑚𝑖𝑛𝑔 (ha)
𝑡𝑜𝑛 𝑜𝑓 𝑓𝑖𝑠ℎ
Unit measure
ha/ton fish
3. PARAMETERIZATION
Population level Farm, Area
Frequency of recording Farm, Area: Annual reporting
Data input in excel form: AGGREGATED
Farm and Area level
DATA INPUT Total marine space use for farming ha Annual reporting Biomass of harvested fish Kg Annual reporting Biomass in stock at the end of the year Kg Annual reporting Biomass in stock at the beginning of the year Kg Annual reporting
Notes
It is considered as the whole area for the exclusive use of the farm and it and has to be reported as the total area included in the aquaculture license, in hectares.
The amount of fish produced in one year is calculated considering the variation of biomass in stock at the end and beginning of the year plus the harvested biomass in the year.

112
ID G29 KPI LAND USE DIMENSION ENVIRONMENT - Use of resources
1. DEFINITION
Total land use for farming in ha to produce 1 ton of fish.
2. INDEX
𝐿𝑎𝑛𝑑 𝑢𝑠𝑒 = 𝑇𝑜𝑡𝑎𝑙 𝑎𝑟𝑎𝑏𝑙𝑒 𝑙𝑎𝑛𝑑 𝑢𝑠𝑒 𝑓𝑜𝑟 𝑓𝑎𝑟𝑚𝑖𝑛𝑔 (ℎ𝑎)
𝑡𝑜𝑛 𝑜𝑓 𝑓𝑖𝑠ℎ
Unit measure
ha/ton fish
3. PARAMETERIZATION
Population level Farm, Area
Frequency of recording Farm, Area: Annual reporting
Data input in excel form: AGGREGATED
Farm and Area level
DATA INPUT Total arable land used for farming ha Annual reporting Biomass of harvested fish Kg Annual reporting Biomass in stock at the end of the year Kg Annual reporting Biomass in stock at the beginning of the year Kg Annual reporting
Notes:
It is considered as the whole area for the exclusive use of the farm and it has to be reported as the total area included in the aquaculture license, in hectares.
The amount of fish produced in one year is calculated considering the variation of biomass in stock at the end and beginning of the year plus the harvested biomass in the year.

113
ID G30 KPI FRESHWATER USE DIMENSION ENVIRONMENT - Use of resources
1. DEFINITION
Total freshwater used for fish farming to produce 1 ton of fish.
2. INDEX
𝐹𝑟𝑒𝑠ℎ𝑤𝑎𝑡𝑒𝑟 𝑢𝑠𝑒 = 𝑇𝑜𝑡𝑎𝑙 𝑓𝑟𝑒𝑠ℎ𝑤𝑎𝑡𝑒𝑟 𝑢𝑠𝑒 𝑓𝑜𝑟 𝑓𝑎𝑟𝑚𝑖𝑛𝑔 (𝑚3)
𝑡𝑜𝑛 𝑜𝑓 𝑓𝑖𝑠ℎ
Unit measure
m3/ ton fish
3. PARAMETERIZATION
Population level Farm, Area
Frequency of recording Farm, Area: Annual reporting
Data input in excel form: AGGREGATED
Farm and Area level
DATA INPUT Total volume of freshwater use for farming m3 Annual reporting Biomass of harvested fish Kg Annual reporting Biomass in stock at the end of the year Kg Annual reporting Biomass in stock at the beginning of the year Kg Annual reporting
Notes:
The term "fresh water" refers to water with zero salinity. It is considered as the amount of freshwater used for production phase and at slaughter, (e.g.
for producing ice slurry used in stunning methods, cleaning nets and diving equipments, showers etc.)
The amount of fish produced in one year is calculated considering the variation of biomass in stock at the end and beginning of the year plus the harvested biomass in the year.
Reference to: - Benchmarking system: GSSI

114
ID G31 KPI ENERGY USED DIMENSION ENVIRONMENT - Use of resources
1. DEFINITION
Total Electricity used for farming in Kilojoule to produce 1 ton of fish
2. INDEX
𝐸𝑛𝑒𝑟𝑔𝑦 𝑢𝑠𝑒𝑑 = 𝑇𝑜𝑡𝑎𝑙 𝑒𝑙𝑒𝑐𝑡𝑟𝑖𝑐𝑖𝑡𝑦 𝑢𝑠𝑒𝑑 𝑓𝑜𝑟 𝑓𝑎𝑟𝑚𝑖𝑛𝑔 (𝑘𝑊ℎ)
𝑡𝑜𝑛 𝑜𝑓 𝑓𝑖𝑠ℎ
Unit measure
kW h/ton fish
3. PARAMETERIZATION
Population level Farm, Area
Frequency of recording Farm, Area: Annual reporting
Data input in excel form: AGGREGATED
Farm and Area level
DATA INPUT Total electricity used for farming kW h Annual reporting
Biomass of harvested fish Kg Annual reporting
Biomass in stock at the end of the year Kg Annual reporting
Biomass in stock at the beginning of the year Kg Annual reporting Notes:
The amount of fish produced in one year is calculated considering the variation of biomass in stock at the end and beginning of the year plus the harvested biomass in the year.
The quantity of energy used in the year of reference for production Reference to:
- Certification Schemes: Global G.A.P.; ASC; EMAS (Reg.1221/2009, Annex IV)

115
ID G32 KPI FUEL (DIESEL AND PETROL) USED FOR TRANSPORT DIMENSION ENVIRONMENT - Use of resources
1. DEFINITION
Total Fuel (Diesel or Petrol) used for transport (eg. boat) to produce 1 ton of fish
2. INDEX
𝐹𝑢𝑒𝑙 (𝑑𝑖𝑒𝑠𝑒𝑙 𝑜𝑟 𝑝𝑒𝑡𝑟𝑜𝑙)𝑢𝑠𝑒𝑑 𝑓𝑜𝑟 𝑡𝑟𝑎𝑛𝑠𝑝𝑜𝑟𝑡 = 𝑇𝑜𝑡𝑎𝑙 𝑓𝑢𝑒𝑙 𝑢𝑠𝑒𝑑 𝑓𝑜𝑟 𝑡𝑟𝑎𝑛𝑠𝑝𝑜𝑟𝑡 (𝑙)
𝑡𝑜𝑛 𝑜𝑓 𝑓𝑖𝑠ℎ
Unit measure
L/ton fish
3. PARAMETERIZATION
Population level Farm, Area
Frequency of recording Farm, Area: Annual reporting
Data input in excel form: AGGREGATED
Farm and Area level
DATA INPUT
Total Fuel (Diesel oil) used for transport (e.g. boats) L Annual reporting
Total Fuel (Petrol) used for transport (e.g. boats) L Annual reporting
Biomass of harvested fish Kg Annual reporting
Biomass in stock at the end of the year Kg Annual reporting
Biomass in stock at the beginning of the year Kg Annual reporting
Notes:
The amount of fish produced in one year is calculated considering the variation of biomass in stock at the end and beginning of the year plus the harvested biomass in the year.
Volume of petrol or diesel used in the year of reference for transportation (boat, truck, forklift, etc.). Only those transports related to the production process (eg. feed distribution at sea) are considered.
Reference to: - Certification Schemes: ASC, EMAS (Reg.1221/2009, Annex IV)

116
ID G33 KPI FUEL (DIESEL AND PETROL) USED FOR OTHERS USES DIMENSION ENVIRONMENT - Use of resources
1. DEFINITION
Total fuel (Diesel) used for other uses (e.g. cooling, heating) to produce 1 ton of fish
2. INDEX
𝐹𝑢𝑒𝑙 (𝑑𝑖𝑒𝑠𝑒𝑙 𝑜𝑟 𝑝𝑒𝑡𝑟𝑜𝑙)𝑢𝑠𝑒𝑑 𝑓𝑜𝑟 𝑜𝑡ℎ𝑒𝑟 𝑢𝑠𝑒𝑠 = 𝑇𝑜𝑡𝑎𝑙 𝑓𝑢𝑒𝑙 𝑓𝑜𝑟 𝑜𝑡ℎ𝑒𝑟 𝑢𝑠𝑒𝑠 (𝑙)
𝑡𝑜𝑛 𝑜𝑓 𝑓𝑖𝑠ℎ
Unit measure
L/ton fish
3. PARAMETERIZATION
Population level Farm, Area
Frequency of recording Farm, Area: Annual reporting
Data input in excel form: AGGREGATED
Farm and Area level
DATA INPUT Total fuel (Diesel or Petrol) used for others uses (e.g. cooling, heating) L
Annual reporting
Biomass of harvested fish Kg Annual
reporting
Biomass in stock at the end of the year Kg Annual
reporting
Biomass in stock at the beginning of the year Kg Annual
reporting Notes:
The amount of fish produced in one year is calculated considering the variation of biomass in stock at the end and beginning of the year plus the harvested biomass in the year.
Volume of petrol or diesel used in the year of reference for all uses except transport (cooling, heating, power supply, etc.)
Reference to: - Certification Schemes: ASC, EMAS (Reg.1221/2009, Annex IV)

117
ID G34 KPI TOTAL EMISSION OF CO2 DIMENSION ENVIRONMENT - Use of resources
1. DEFINITION
Total emission of CO2 to produce 1 ton of fish. Feed production not included
2. INDEX
𝑇𝑜𝑡𝑎𝑙 𝑒𝑚𝑖𝑠𝑠𝑖𝑜𝑛 𝑜𝑓 𝐶𝑂2 = 𝑇𝑜𝑡𝑎𝑙 𝑒𝑚𝑖𝑠𝑠𝑖𝑜𝑛 𝑜𝑓 𝐶𝑂2 (𝐶𝑂2 𝑡𝑜𝑛)
𝑡𝑜𝑛 𝑜𝑓 𝑓𝑖𝑠ℎ
Unit measure
t CO2/ ton fish
3. PARAMETERIZATION
Population level Farm, Area
Frequency of recording Farm, Area: Annual reporting
Data input in excel form
Farm and Area level
DATA INPUT
Total electricity used for farming kW h Annual reporting
Total Fuel (DIESEL OIL) used for transport (eg. boats)
l Annual reporting
Total Fuel (DIESEL OIL) used for other uses (eg. cooling, heating)
l Annual reporting
Total Fuel (PETROL) used for transport (eg. boats)
l Annual reporting
Total Fuel (PETROL) used for other uses (eg. cooling, heating)
l Annual reporting
Biomass of harvested fish Kg Annual reporting
Biomass in stock at the end of the year Kg Annual reporting
Biomass in stock at the beginning of the year Kg Annual reporting
Notes:
The amount of fish produced in one year is calculated considering the variation of biomass in stock at the end and beginning of the year plus the harvested biomass in the year.
Reference to:
- Certification Schem: ASC
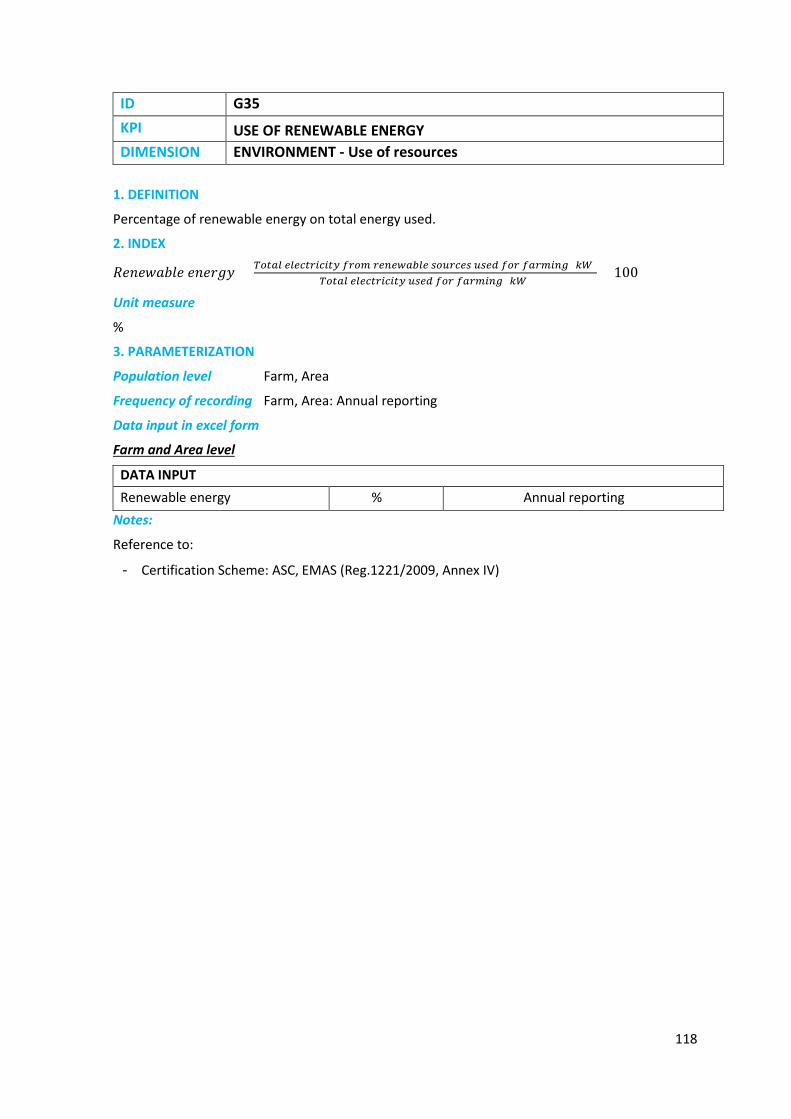
118
ID G35 KPI USE OF RENEWABLE ENERGY DIMENSION ENVIRONMENT - Use of resources
1. DEFINITION
Percentage of renewable energy on total energy used.
2. INDEX
𝑅𝑒𝑛𝑒𝑤𝑎𝑏𝑙𝑒 𝑒𝑛𝑒𝑟𝑔𝑦 = 𝑇𝑜𝑡𝑎𝑙 𝑒𝑙𝑒𝑐𝑡𝑟𝑖𝑐𝑖𝑡𝑦 𝑓𝑟𝑜𝑚 𝑟𝑒𝑛𝑒𝑤𝑎𝑏𝑙𝑒 𝑠𝑜𝑢𝑟𝑐𝑒𝑠 𝑢𝑠𝑒𝑑 𝑓𝑜𝑟 𝑓𝑎𝑟𝑚𝑖𝑛𝑔 (𝑘𝑊)𝑇𝑜𝑡𝑎𝑙 𝑒𝑙𝑒𝑐𝑡𝑟𝑖𝑐𝑖𝑡𝑦 𝑢𝑠𝑒𝑑 𝑓𝑜𝑟 𝑓𝑎𝑟𝑚𝑖𝑛𝑔 (𝑘𝑊)
× 100
Unit measure
%
3. PARAMETERIZATION
Population level Farm, Area
Frequency of recording Farm, Area: Annual reporting
Data input in excel form
Farm and Area level
DATA INPUT Renewable energy % Annual reporting
Notes:
Reference to:
- Certification Scheme: ASC, EMAS (Reg.1221/2009, Annex IV)

119
EXCEL FILES FOR DATA SUBMISSION FOR KPIS :INSTRUCTIONS FOR DATA RECORDING AND SUBMISSION
Introduction Five dedicated data collection forms have been developed in MsExcel format, in order to facilitate the recording and submission of data useful for KPI calculation at different production facilities: Hatchery – Nursery facilities
• Hatchery individual batch data collection form • Hatchery aggregated batch data collection form
Pre-grow facility
• Pre grow data collection form Grow Out facilities
• Grow out individual batch data collection form • Grow out aggregated batch data collection form
Data collection is an important and unique source of information for comparative analysis and for benchmarking the performances of a given batch in the facility and between different facilities. Data will be recorded with the collaborative support of the companies (SMEs), along farming cycles and will be provided using the appropriate excel submission forms. The following chapters provide a synthesis of the SOPs manual where instructions for users are available on how data collection and recording should be performed. The use of the dedicated excel spreadsheets will allow a reliable and comparable values for the calculation of the set of Key Performance Indicators (KPIs) validated for hatchery, pre grow and grow out systems in PerformFISH (Task 7.1). These forms should be considered as a parallel farm register which has been specifically designed for PerformFISH data collection, thus to be updated regularly. The success of KPI data recording will mainly depend on the traceability of batches recorded (by ID) in the excel forms and the respect of the times of batch controls scheduled during the production cycles. The same methodology for collection and submission of data is used for the two target species of PerformFISH, European sea bass (Dicentrarchus labrax) and Gilthead sea bream (Sparus aurata). The excel files filled with recorded data will be regularly uploaded in the personal Virtual Research Environment (VRE), hosted in the PerformFISH portal at CNR. All data will be totally confidential and analysed in anonymous way. Data submission The farm (or company) management has the responsibility of regularly update the excel forms, which will be uploaded periodically (or on request) in the personal VRE, were will be treated as strictly confidential and anonymized. The file format of the excel files must be .XLSX before uploading it in the personal VRE Please note: excel files have protected cells where users are not supposed to modify the content. Whenever needed, spreadsheets can be unlocked going to the menu tab “review”> “unprotect spreadsheet”
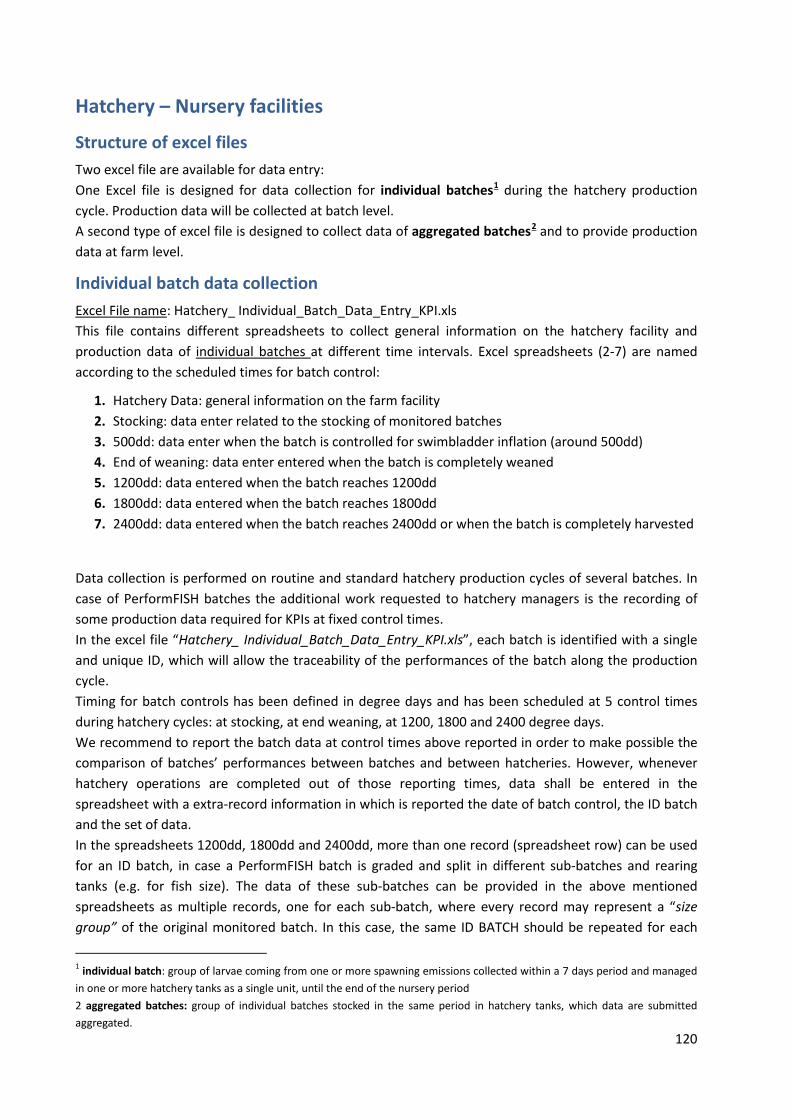
120
Hatchery – Nursery facilities
Structure of excel files Two excel file are available for data entry: One Excel file is designed for data collection for individual batches1 during the hatchery production cycle. Production data will be collected at batch level. A second type of excel file is designed to collect data of aggregated batches2 and to provide production data at farm level.
Individual batch data collection Excel File name: Hatchery_ Individual_Batch_Data_Entry_KPI.xls This file contains different spreadsheets to collect general information on the hatchery facility and production data of individual batches at different time intervals. Excel spreadsheets (2-7) are named according to the scheduled times for batch control:
1. Hatchery Data: general information on the farm facility 2. Stocking: data enter related to the stocking of monitored batches 3. 500dd: data enter when the batch is controlled for swimbladder inflation (around 500dd) 4. End of weaning: data enter entered when the batch is completely weaned 5. 1200dd: data entered when the batch reaches 1200dd 6. 1800dd: data entered when the batch reaches 1800dd 7. 2400dd: data entered when the batch reaches 2400dd or when the batch is completely harvested
Data collection is performed on routine and standard hatchery production cycles of several batches. In case of PerformFISH batches the additional work requested to hatchery managers is the recording of some production data required for KPIs at fixed control times. In the excel file “Hatchery_ Individual_Batch_Data_Entry_KPI.xls”, each batch is identified with a single and unique ID, which will allow the traceability of the performances of the batch along the production cycle. Timing for batch controls has been defined in degree days and has been scheduled at 5 control times during hatchery cycles: at stocking, at end weaning, at 1200, 1800 and 2400 degree days. We recommend to report the batch data at control times above reported in order to make possible the comparison of batches’ performances between batches and between hatcheries. However, whenever hatchery operations are completed out of those reporting times, data shall be entered in the spreadsheet with a extra-record information in which is reported the date of batch control, the ID batch and the set of data. In the spreadsheets 1200dd, 1800dd and 2400dd, more than one record (spreadsheet row) can be used for an ID batch, in case a PerformFISH batch is graded and split in different sub-batches and rearing tanks (e.g. for fish size). The data of these sub-batches can be provided in the above mentioned spreadsheets as multiple records, one for each sub-batch, where every record may represent a “size group” of the original monitored batch. In this case, the same ID BATCH should be repeated for each
1 individual batch: group of larvae coming from one or more spawning emissions collected within a 7 days period and managed in one or more hatchery tanks as a single unit, until the end of the nursery period 2 aggregated batches: group of individual batches stocked in the same period in hatchery tanks, which data are submitted aggregated.

121
record as many size classes you got after grading/splitting, in order to match the multiple records with the unique BATCH ID assigned to the starting batch of fish in the “stocking” spreadsheet. NOTE: only one record per batch shall be used in the spreadsheets Stocking, 500dd and end of weaning.
Aggregated batches data collection Excel File name: Hatchery_Aggregated_Batch_Data_Entry_KPI This file contains different spreadsheets to collect production data of aggregated batches farmed in hatchery rearing units. Hatchery Data: general information on the hatchery facility Aggregated Data by period production data of aggregated batches recorded period wise Aggregated batches data collection Production data can be provided in a simple way by aggregating information of the batches stocked during the same period (Early period, Natural period or Late period). Thus, larval batches stocked in the same period (eg. Early), can be provided both as a single record (sum of all batches) or as multiple records for the same period. Level of aggregation of data is upon a decision of hatchery managers, according to the production protocols used at hatchery.
Figure 8 BATCH LEVEL - Schematic representation of a single batch cycle and data collection recorded at fixed interval

122
Fig. 9 BATCH LEVEL - Schematic representation of a single batch cycle and data collection recorded on an event based periods (at grading)
Figure 10 FARM LEVEL- Schematic representation of aggregated batches data collection
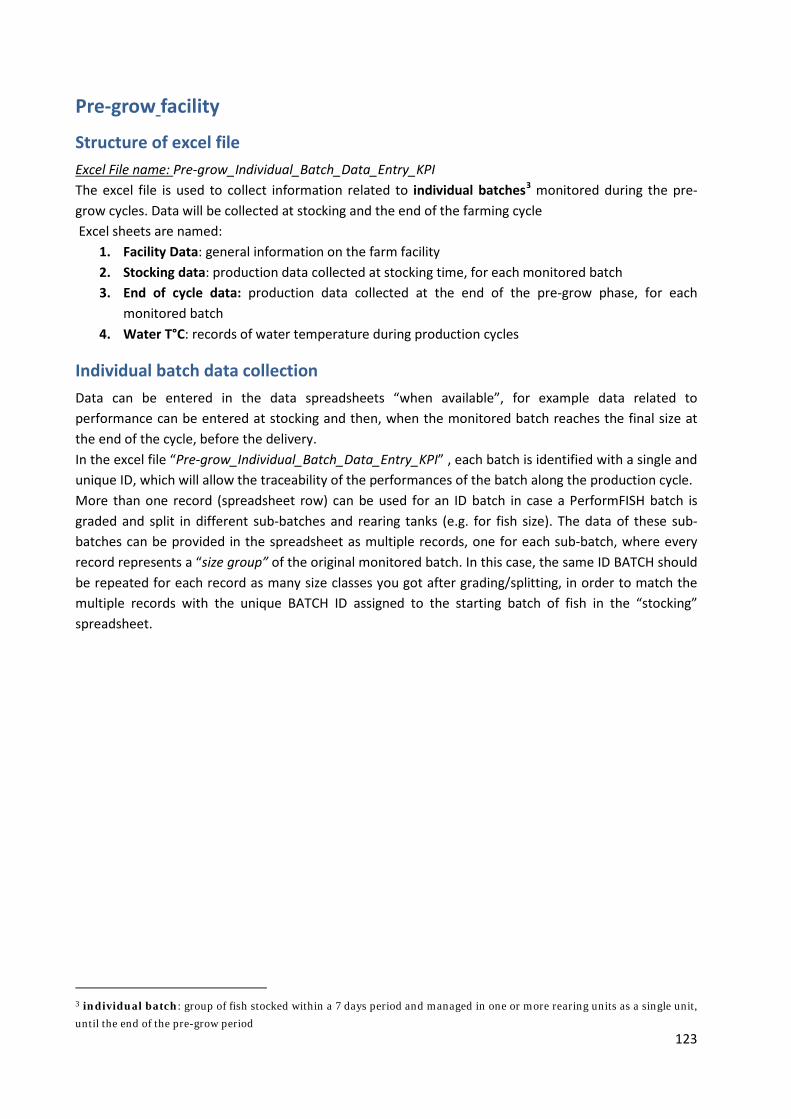
123
Pre-grow facility
Structure of excel file Excel File name: Pre-grow_Individual_Batch_Data_Entry_KPI The excel file is used to collect information related to individual batches3 monitored during the pre-grow cycles. Data will be collected at stocking and the end of the farming cycle Excel sheets are named:
1. Facility Data: general information on the farm facility 2. Stocking data: production data collected at stocking time, for each monitored batch 3. End of cycle data: production data collected at the end of the pre-grow phase, for each
monitored batch 4. Water T°C: records of water temperature during production cycles
Individual batch data collection Data can be entered in the data spreadsheets “when available”, for example data related to performance can be entered at stocking and then, when the monitored batch reaches the final size at the end of the cycle, before the delivery. In the excel file “Pre-grow_Individual_Batch_Data_Entry_KPI” , each batch is identified with a single and unique ID, which will allow the traceability of the performances of the batch along the production cycle. More than one record (spreadsheet row) can be used for an ID batch in case a PerformFISH batch is graded and split in different sub-batches and rearing tanks (e.g. for fish size). The data of these sub-batches can be provided in the spreadsheet as multiple records, one for each sub-batch, where every record represents a “size group” of the original monitored batch. In this case, the same ID BATCH should be repeated for each record as many size classes you got after grading/splitting, in order to match the multiple records with the unique BATCH ID assigned to the starting batch of fish in the “stocking” spreadsheet.
3 individual batch: group of fish stocked within a 7 days period and managed in one or more rearing units as a single unit, until the end of the pre-grow period

124
Grow Out facilities
Structure of excel files One Excel file is for data collection for individual batches4 during the grow out production cycle. Production data will be collected at batch level: A second type of excel file is used to collect data of aggregated batches5 and to provide production data at farm level.
Individual batch data collection Excel File name: Grow_out_Individual_Batch_Data_Entry_KPI.xlsx The excel file contains different spreadsheets where data on individual batches, farmed in one or more rearing units, can be entered at different time intervals. Excel sheets are named according to the scheduled time for batch control:
1. Grow out Data: general information on the farm facility 2. Stocking data: production data related to the stocking of monitored batches 3. Stocking- 50g: production data collected from stocking to 50grams; data entered when the batch
reaches 50 grams 4. 50g – 150g: production data collected from 50 grams to 150 grams, data entered when a batch
reaches 150 grams 5. 150g – 250g: production data collected from 150 grams to 250 grams, data entered when a batch
reaches 250 grams 6. 250g – 400g: production data collected from 250 grams to 400 grams, data entered when a batch
reaches 400 grams 7. 400g -800g-final harvest: production data collected from 400 grams to 800 grams or final
harvesting, data entered when a batch reaches 800 grams or when the batch is completely harvested.
8. Water T°C : Information on daily temperature measured in the farm
Data collection is normally performed during production cycles of all the batches in grow out. In case of PerformFISH batches, the additional work requested to farm managers is the recording of some production data required for KPIs at fixed control times. Control times are set at defined fish sizes (stocking, 50g, 150g, 250g, 400g and 800g/harvest) and farm management should arrange data collection of each batch as much close as possible these sizes, with a tolerance of ±5%. In the excel file “Grow_out_Individual_Batch_Data_Entry_KPI.xlsx” , each batch is identified with a single and unique ID, which will allow the traceability of the performances of the batch along the production cycle. Information on individual batches can be entered in each record of the excel file and data can be entered “when available”; for example data related to single batch performance can be entered periodically, when each monitored batch reaches the fish size at the end of each period.
4 individual batch: group of fish ( fingerlings), coming from the same source, stocked in grow out within a 7 days period and managed in one or more rearing unit, until the end of the grow out cycle. 5 aggregated batches: group of individual batches reared in multiple rearing units which data are submitted aggregated according to the stocking period (1ST- 4th Quarter)

125
Aggregated batches data collection Excel File name: Grow_out_Aggregated_Batch_Data_Entry_KPI.xlsx This file contains different spreadsheets to collect production data of aggregated batches farmed in multiple rearing units.
1. Grow out Data: general information on the farm facility 2. Stocking data: information related to the stocking of monitored batches 3. Stocking-150g : Information on specific reference period, data entered when all the batches
aggregated in the record reach 150 grams 4. 150g-400g : Information on specific reference period, data entered when all the batches
aggregated in the record reach 400 grams 5. 400g-800g-, harvest: Information on specific reference period, data entered when all the
batches aggregated in the record reach 800 grams or when are completely harvested. 6. Water T°C: records of water temperature during production cycles 7. Annual Data: data recorded for different environmental and management parameters on
annual basis 8. Sensitive data: data recorded for the use of chemicals and for interactions of farming activities
with endangered marine species.
Aggregated batches data collection Production data can be provided in a simple way by aggregating information from multiple batches of bass or bream into single records. Aggregated batches have to be stocked during the same quarter (1ST Quarter = Jan – Mar, 2nd Quarter = Apr – Jun, 3rd Quarter = Jul – Sep, 4th Quarter = Oct - Dec) Data are collected individually for each batch and then submitted aggregated by the farm management. Information on aggregated batches is submitted at the end of each reference period considering the slowest growing batch included in the aggregated one. Annual data Two spreadsheets (Annual data and Sensitive data) are designed to provide data at farm level on annual basis. These set of information is for the calculation of basic environmental and economic performances indicators. A second “ confidential” spreadsheet collected information on the use of chemicals (antibiotic and antiparasistic treatments) and the effects on biodiversity ( lethal incidents to endangered species). These set of data should be provided at the beginning of each following year for the production cycles of 2018,2019,2020. These two spreadsheets have to be filled even if the farm management will provide production data using only the Individual Batch data submission form.

126
Fig. 11 BATCH LEVEL - Data collection method for different batches in relation to the quarters (sea cage/land tank) and fish fixed body weight Data collection method: FARM scale
Data will be collected and submitted aggregated, grouping all the batches stocked in Q1, Q2, Q3 and Q4. Data will be recorded for each group of batches when the slowest-growing batch of the group will reach the target average body weight: 150g, 400g, 800g and at harvested batches and provided aggregated
Fig. 12 FARM LEVEL - Data collection method for aggregated batches on the period from stocking to 150g over the all quarters
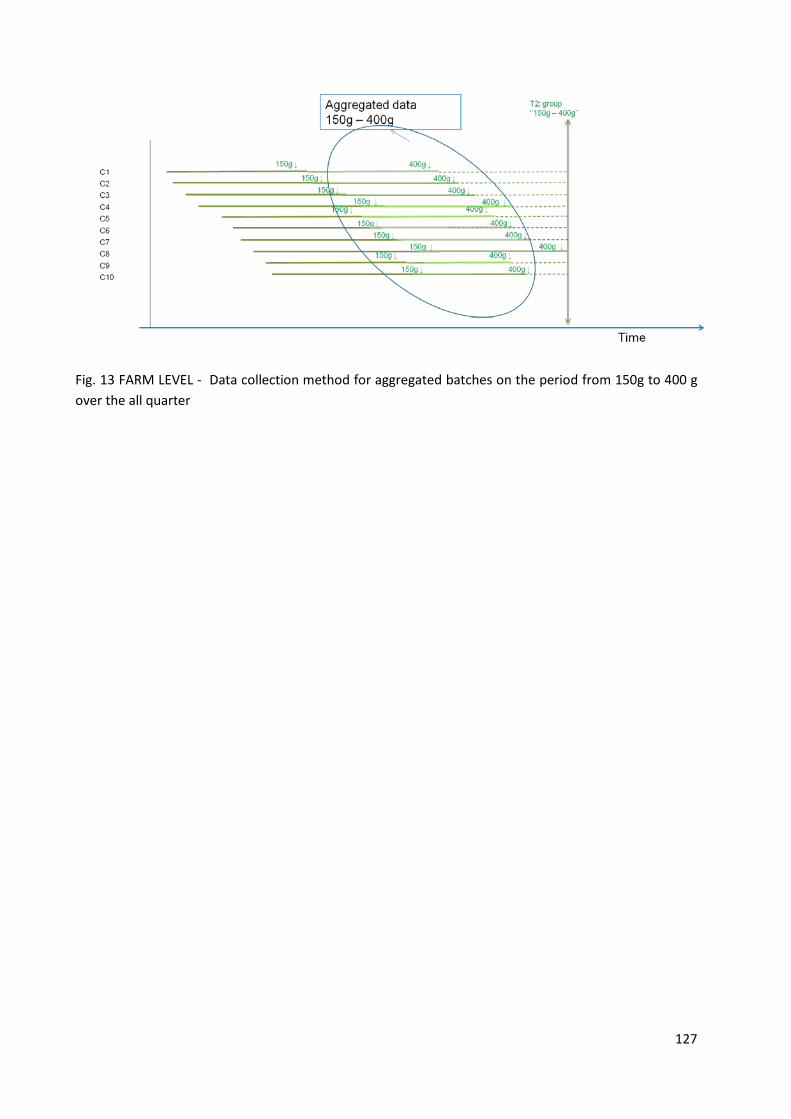
127
Fig. 13 FARM LEVEL - Data collection method for aggregated batches on the period from 150g to 400 g over the all quarter
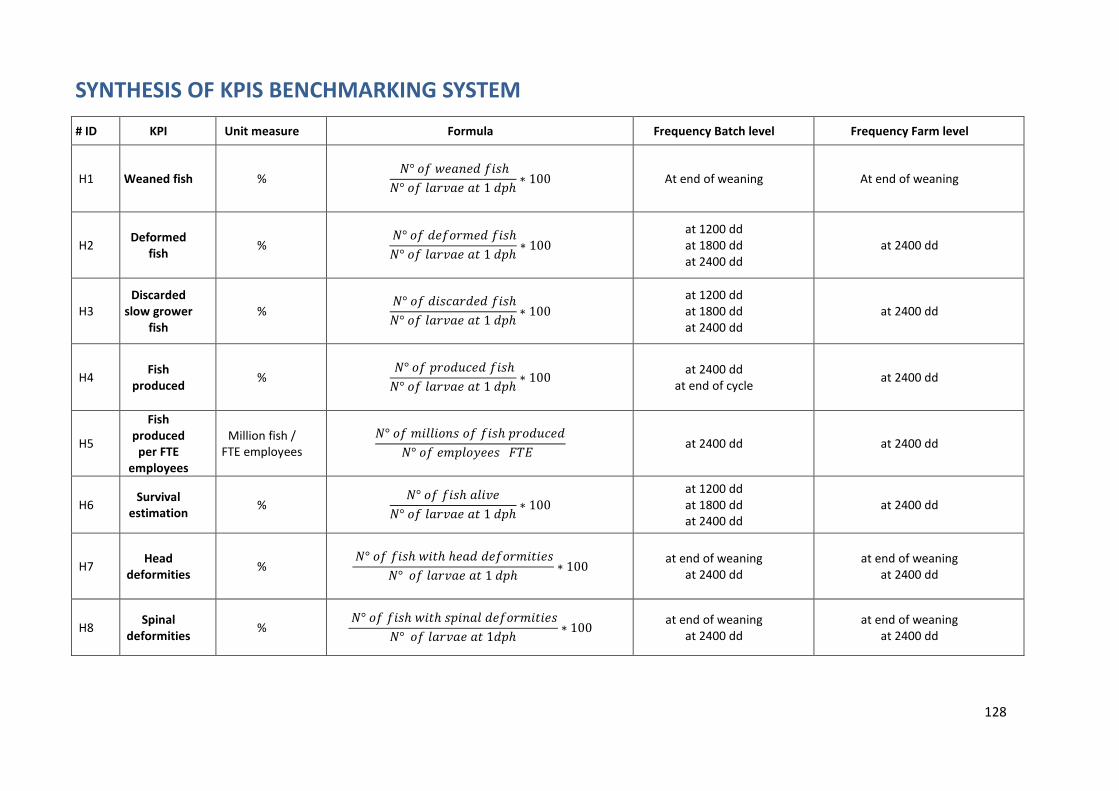
128
SYNTHESIS OF KPIS BENCHMARKING SYSTEM
# ID KPI Unit measure Formula Frequency Batch level Frequency Farm level
H1 Weaned fish % 𝑁° 𝑜𝑓 𝑤𝑒𝑎𝑛𝑒𝑑 𝑓𝑖𝑠ℎ𝑁° 𝑜𝑓 𝑙𝑎𝑟𝑣𝑎𝑒 𝑎𝑡 1 𝑑𝑝ℎ
∗ 100 At end of weaning At end of weaning
H2 Deformed fish %
𝑁° 𝑜𝑓 𝑑𝑒𝑓𝑜𝑟𝑚𝑒𝑑 𝑓𝑖𝑠ℎ𝑁° 𝑜𝑓 𝑙𝑎𝑟𝑣𝑎𝑒 𝑎𝑡 1 𝑑𝑝ℎ
∗ 100 at 1200 dd at 1800 dd at 2400 dd
at 2400 dd
H3 Discarded
slow grower fish
% 𝑁° 𝑜𝑓 𝑑𝑖𝑠𝑐𝑎𝑟𝑑𝑒𝑑 𝑓𝑖𝑠ℎ𝑁° 𝑜𝑓 𝑙𝑎𝑟𝑣𝑎𝑒 𝑎𝑡 1 𝑑𝑝ℎ
∗ 100 at 1200 dd at 1800 dd at 2400 dd
at 2400 dd
H4 Fish produced %
𝑁° 𝑜𝑓 𝑝𝑟𝑜𝑑𝑢𝑐𝑒𝑑 𝑓𝑖𝑠ℎ𝑁° 𝑜𝑓 𝑙𝑎𝑟𝑣𝑎𝑒 𝑎𝑡 1 𝑑𝑝ℎ
∗ 100 at 2400 dd at end of cycle at 2400 dd
H5
Fish produced
per FTE employees
Million fish / FTE employees
𝑁° 𝑜𝑓 𝑚𝑖𝑙𝑙𝑖𝑜𝑛𝑠 𝑜𝑓 𝑓𝑖𝑠ℎ 𝑝𝑟𝑜𝑑𝑢𝑐𝑒𝑑𝑁° 𝑜𝑓 𝑒𝑚𝑝𝑙𝑜𝑦𝑒𝑒𝑠 (𝐹𝑇𝐸)
at 2400 dd at 2400 dd
H6 Survival estimation %
𝑁° 𝑜𝑓 𝑓𝑖𝑠ℎ 𝑎𝑙𝑖𝑣𝑒𝑁° 𝑜𝑓 𝑙𝑎𝑟𝑣𝑎𝑒 𝑎𝑡 1 𝑑𝑝ℎ
∗ 100 at 1200 dd at 1800 dd at 2400 dd
at 2400 dd
H7 Head deformities %
𝑁° 𝑜𝑓 𝑓𝑖𝑠ℎ 𝑤𝑖𝑡ℎ ℎ𝑒𝑎𝑑 𝑑𝑒𝑓𝑜𝑟𝑚𝑖𝑡𝑖𝑒𝑠𝑁° 𝑜𝑓 𝑙𝑎𝑟𝑣𝑎𝑒 𝑎𝑡 1 𝑑𝑝ℎ
∗ 100 at end of weaning at 2400 dd
at end of weaning at 2400 dd
H8 Spinal deformities %
𝑁° 𝑜𝑓 𝑓𝑖𝑠ℎ 𝑤𝑖𝑡ℎ 𝑠𝑝𝑖𝑛𝑎𝑙 𝑑𝑒𝑓𝑜𝑟𝑚𝑖𝑡𝑖𝑒𝑠𝑁° 𝑜𝑓 𝑙𝑎𝑟𝑣𝑎𝑒 𝑎𝑡 1𝑑𝑝ℎ
∗ 100 at end of weaning at 2400 dd
at end of weaning at 2400 dd

129
H9 Fin deformities %
𝑁° 𝑜𝑓 𝑓𝑖𝑠ℎ 𝑤𝑖𝑡ℎ 𝑓𝑖𝑛 𝑑𝑒𝑓𝑜𝑟𝑚𝑖𝑡𝑖𝑒𝑠𝑁° 𝑜𝑓 𝑙𝑎𝑟𝑣𝑎𝑒 𝑎𝑡 1 𝑑𝑝ℎ
∗ 100 at end of weaning at 2400 dd
at end of weaning at 2400 dd
H10 Swim
bladder non inflation
% 𝑁° 𝑜𝑓 𝑓𝑖𝑠ℎ 𝑤𝑖𝑡ℎ 𝑛𝑜𝑛 𝑖𝑛𝑓𝑙𝑎𝑡𝑒𝑑 𝑆𝐵
𝑁° 𝑜𝑓 𝑙𝑎𝑟𝑣𝑎𝑒 𝑎𝑡 1𝑑𝑝ℎ∗ 100 at 500 dd at 500 dd
H11 Average
body weight (BW)
g 𝑇𝑜𝑡𝑎𝑙 𝑤𝑒𝑖𝑔ℎ𝑡𝑁° 𝑜𝑓 𝑓𝑖𝑠ℎ
At end of weaning at 1200 dd at 1800 dd at 2400 dd
H12 Specific Growth
Rate (SGR)
% day -1
�ln𝐵𝑊1 − ln𝐵𝑊0
𝑡� ∗ 100
BW0 = Initial body weight; BW1 = Final body weight
t = time interval (days)
at 1200dd at 1800dd at 2400dd
H13 Artemia requirement
Kg of artemia/million
fish
𝐴𝑚𝑜𝑢𝑛𝑡 𝑜𝑓 𝐴𝑟𝑡𝑒𝑚𝑖𝑎 𝑢𝑠𝑒𝑑 (𝑘𝑔)𝑀𝑖𝑙𝑙𝑖𝑜𝑛𝑠 𝑜𝑓 𝑓𝑖𝑠ℎ 𝑝𝑟𝑜𝑑𝑢𝑐𝑒𝑑
At end of weaning At end of weaning
H14 Rotifers requirement
Billions/million fish
𝐴𝑚𝑜𝑢𝑛𝑡 𝑜𝑓 𝑅𝑜𝑡𝑖𝑓𝑒𝑟 𝑢𝑠𝑒𝑑 (𝐵𝑖𝑙𝑙𝑖𝑜𝑛𝑠)𝑀𝑖𝑙𝑙𝑖𝑜𝑛𝑠 𝑜𝑓 𝑓𝑖𝑠ℎ 𝑝𝑟𝑜𝑑𝑢𝑐𝑒𝑑
At end of weaning At end of weaning
H15 Vaccinated
fish by disease
% 𝑁° 𝑜𝑓 𝑣𝑎𝑐𝑐𝑖𝑛𝑎𝑡𝑒𝑑 𝑓𝑖𝑠ℎ ( 𝑒.𝑔.𝑃.𝑑𝑎𝑚𝑠𝑒𝑙𝑎𝑒)
𝑁° 𝑜𝑓 𝑝𝑟𝑜𝑑𝑢𝑐𝑒𝑑 𝑓𝑖𝑠ℎ𝑥100 at 2400 dd at 2400 dd
Table 12. Synthesis of KPIs benchmarking system for Hatchery

130
# ID KPI Unit measure Formula Frequency Batch level
P1 Deformed fish % 𝑁° 𝑜𝑓 𝑑𝑒𝑓𝑜𝑟𝑚𝑒𝑑 𝑓𝑖𝑠ℎ𝑁° 𝑜𝑓 𝑠𝑡𝑜𝑐𝑘𝑒𝑑 𝑓𝑖𝑠ℎ
∗ 100 End of cycle
P2 Discarded slow grower fish %
𝑁° 𝑜𝑓 𝑑𝑖𝑠𝑐𝑎𝑟𝑑𝑒𝑑 𝑓𝑖𝑠ℎ𝑁° 𝑜𝑓 𝑠𝑡𝑜𝑐𝑘𝑒𝑑 𝑓𝑖𝑠ℎ
∗ 100 End of cycle
P3 Mortalities - total % 𝑁° 𝑜𝑓 𝑐𝑜𝑙𝑙𝑒𝑐𝑡𝑒𝑑 𝑑𝑒𝑎𝑑 𝑓𝑖𝑠ℎ
𝑁° 𝑜𝑓 𝑠𝑡𝑜𝑐𝑘𝑒𝑑 𝑓𝑖𝑠ℎ∗ 100 End of cycle
P4 Specific Growth Rate (SGR)
% day-1
�ln𝐵𝑊1 − ln𝐵𝑊0
𝑡� ∗ 100
BW0 = Initial body weight; BW1 = Final body weight; t = time interval (days)
End of cycle
P5 Feed Conversion Ratio (FCR)
Numerical index without unit
𝐹𝑒𝑒𝑑 𝑑𝑒𝑙𝑖𝑣𝑒𝑟𝑒𝑑 (𝑡1 − 𝑡0)(𝐵𝑖𝑜𝑚𝑎𝑠𝑠1 − 𝐵𝑖𝑜𝑚𝑎𝑠𝑠0)
Feed delivered(t1-t0)= Feed delivered during time
interval Biomass0=Initial biomass; Biomass1=Final biomass
End of cycle
Table 13. Synthesis of KPIs benchmarking system for Pre grow

131
# ID KPI Unit Index Frequency* Population Period
G1 Mortalities - total % 𝑁° 𝑜𝑓 𝑐𝑜𝑙𝑙𝑒𝑐𝑡𝑒𝑑 𝑑𝑒𝑎𝑑 𝑓𝑖𝑠ℎ
𝑁° 𝑜𝑓 𝑠𝑡𝑜𝑐𝑘𝑒𝑑 𝑓𝑖𝑠ℎ∗ 100 At fixed body
weight Batch/Farm/Area Quarters
G2 Mortalities - by disease % 𝑁° 𝑜𝑓 𝑑𝑒𝑎𝑑 𝑓𝑖𝑠ℎ 𝑏𝑦 𝑑𝑖𝑠𝑒𝑎𝑠𝑒
𝑁° 𝑜𝑓 𝑠𝑡𝑜𝑐𝑘𝑒𝑑 𝑓𝑖𝑠ℎ∗ 100 At fixed body
weight Batch/Farm/Area Quarters
G3 Mortalities first 3 days after transport and stocking %
𝑁° 𝑜𝑓 𝑐𝑜𝑙𝑙𝑒𝑐𝑡𝑒𝑑 𝑑𝑒𝑎𝑑 𝑓𝑖𝑠ℎ 𝑎𝑡 𝑑𝑎𝑦 3𝑁° 𝑜𝑓 𝑠𝑡𝑜𝑐𝑘𝑒𝑑 𝑓𝑖𝑠ℎ
∗ 100 At day 3 after transport and
stocking Batch/Farm/Area Quarters
G4 Mortalities first 10 days after transport and stocking %
𝑁° 𝑜𝑓 𝑐𝑜𝑙𝑙𝑒𝑐𝑡𝑒𝑑 𝑑𝑒𝑎𝑑 𝑓𝑖𝑠ℎ 𝑎𝑡 𝑑𝑎𝑦 10𝑁° 𝑜𝑓 𝑠𝑡𝑜𝑐𝑘𝑒𝑑 𝑓𝑖𝑠ℎ
∗ 100 At day 10 after transport and
stocking Batch/Farm/Area Quarters
G5 Unaccounted losses % 𝑁° 𝑜𝑓 𝑠𝑡𝑜𝑐𝑘𝑒𝑑 𝑓𝑖𝑠ℎ − 𝑁° 𝑜𝑓 𝑑𝑒𝑎𝑑 𝑓𝑖𝑠ℎ
−𝑁° 𝑜𝑓 ℎ𝑎𝑟𝑣𝑒𝑠𝑡𝑒𝑑 𝑓𝑖𝑠ℎ𝑁° 𝑜𝑓 𝑠𝑡𝑜𝑐𝑘𝑒𝑑 𝑓𝑖𝑠ℎ
∗ 100 At harvest Batch/Farm/Area Quarters
G6 Total losses % 𝑁° 𝑜𝑓 𝑠𝑡𝑜𝑐𝑘𝑒𝑑 𝑓𝑖𝑠ℎ − 𝑁° 𝑜𝑓 ℎ𝑎𝑟𝑣𝑒𝑠𝑡𝑒𝑑 𝑓𝑖𝑠ℎ𝑁° 𝑜𝑓 𝑠𝑡𝑜𝑐𝑘𝑒𝑑 𝑓𝑖𝑠ℎ
∗ 100 At harvest Batch/Farm/Area Quarters
G7 Discarded fish at slaughter % 𝑁° 𝑜𝑓 𝑑𝑖𝑠𝑐𝑎𝑟𝑑𝑒𝑑 𝑓𝑖𝑠ℎ 𝑎𝑡 𝑠𝑙𝑎𝑢𝑔ℎ𝑡𝑒𝑟
𝑁° 𝑜𝑓 ℎ𝑎𝑟𝑣𝑒𝑠𝑡𝑒𝑑 𝑓𝑖𝑠ℎ∗ 100 At harvest Batch/Farm/Area Quarters
G8 Vaccinated fish - by diseases % 𝑁° 𝑜𝑓 𝑣𝑎𝑐𝑐𝑖𝑛𝑎𝑡𝑒𝑑 𝑓𝑖𝑠ℎ 𝑏𝑦 𝑑𝑖𝑠𝑒𝑎𝑠𝑒
𝑁° 𝑜𝑓 𝑠𝑡𝑜𝑐𝑘𝑒𝑑 𝑓𝑖𝑠ℎ∗ 100 At stocking Batch/Farm/Area Quarters
G9 Number of antiparasitic treatments (total & by disease) n Number of antiparasitic treatments per batch or per year at
farm level At harvest1
Annual reporting2 Batch1/Farm2/Area2 Quarters1
Year2
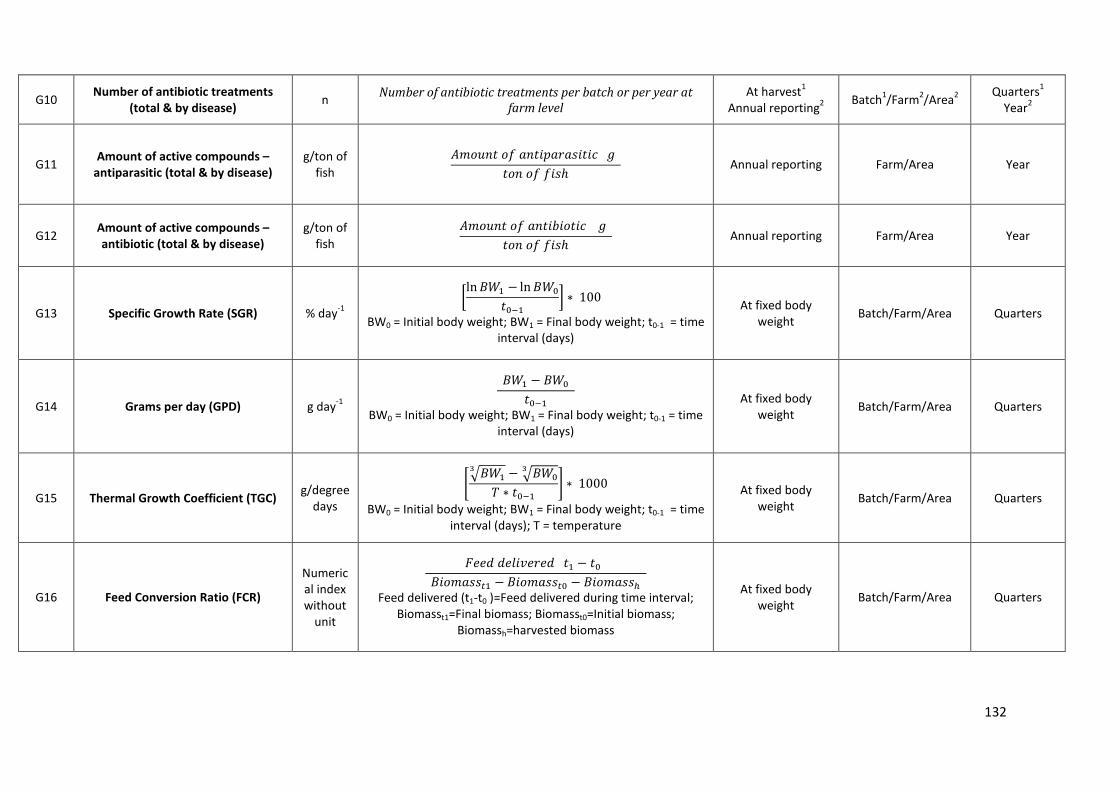
132
G10 Number of antibiotic treatments (total & by disease) n Number of antibiotic treatments per batch or per year at
farm level At harvest1
Annual reporting2 Batch1/Farm2/Area2 Quarters1
Year2
G11 Amount of active compounds – antiparasitic (total & by disease)
g/ton of fish
𝐴𝑚𝑜𝑢𝑛𝑡 𝑜𝑓 𝑎𝑛𝑡𝑖𝑝𝑎𝑟𝑎𝑠𝑖𝑡𝑖𝑐 (𝑔)𝑡𝑜𝑛 𝑜𝑓 𝑓𝑖𝑠ℎ
Annual reporting Farm/Area Year
G12 Amount of active compounds – antibiotic (total & by disease)
g/ton of fish
𝐴𝑚𝑜𝑢𝑛𝑡 𝑜𝑓 𝑎𝑛𝑡𝑖𝑏𝑖𝑜𝑡𝑖𝑐 (𝑔)𝑡𝑜𝑛 𝑜𝑓 𝑓𝑖𝑠ℎ
Annual reporting Farm/Area Year
G13 Specific Growth Rate (SGR) % day-1 �ln𝐵𝑊1 − ln𝐵𝑊0
𝑡0−1� ∗ 100
BW0 = Initial body weight; BW1 = Final body weight; t0-1 = time interval (days)
At fixed body weight Batch/Farm/Area Quarters
G14 Grams per day (GPD) g day-1
(𝐵𝑊1 − 𝐵𝑊0)𝑡0−1
BW0 = Initial body weight; BW1 = Final body weight; t0-1 = time interval (days)
At fixed body weight Batch/Farm/Area Quarters
G15 Thermal Growth Coefficient (TGC) g/degree days
��𝐵𝑊13 − �𝐵𝑊0
3
𝑇 ∗ 𝑡0−1� ∗ 1000
BW0 = Initial body weight; BW1 = Final body weight; t0-1 = time interval (days); T = temperature
At fixed body weight Batch/Farm/Area Quarters
G16 Feed Conversion Ratio (FCR)
Numerical index without
unit
𝐹𝑒𝑒𝑑 𝑑𝑒𝑙𝑖𝑣𝑒𝑟𝑒𝑑 (𝑡1 − 𝑡0)(𝐵𝑖𝑜𝑚𝑎𝑠𝑠𝑡1 − 𝐵𝑖𝑜𝑚𝑎𝑠𝑠𝑡0 − 𝐵𝑖𝑜𝑚𝑎𝑠𝑠ℎ)
Feed delivered (t1-t0 )=Feed delivered during time interval; Biomasst1=Final biomass; Biomasst0=Initial biomass;
Biomassh=harvested biomass
At fixed body weight Batch/Farm/Area Quarters

133
G17 Biological Feed Conversion Ratio (FCRBIO)
Numerical index
𝐹𝑒𝑒𝑑 𝑑𝑒𝑙𝑖𝑣𝑒𝑟𝑒𝑑 (𝑡1 − 𝑡0)(𝐵𝑖𝑜𝑚𝑎𝑠𝑠𝑡1 − 𝐵𝑖𝑜𝑚𝑎𝑠𝑠𝑡0) + 𝐵ℎ + 𝐵𝑙𝑜𝑠𝑡
Feed delivered (t1-t0 )=Feed delivered during time interval; Biomasst1=Final biomass; Biomasst0=Initial biomass;
Bh=harvested biomass; Blost=biomass lost
At fixed body weight Batch/Farm/Area Quarters
G18 Feed Intake (FI) g fish-
1day-1 𝐹𝑖𝑠ℎ 𝑓𝑒𝑒𝑑 𝑑𝑒𝑙𝑖𝑣𝑒𝑟𝑒𝑑
𝑁𝑢𝑚𝑏𝑒𝑟 𝑜𝑓 𝑓𝑖𝑠ℎ ∗ 𝑛𝑢𝑚𝑏𝑒𝑟 𝑜𝑓 𝑑𝑎𝑦𝑠 At fixed body
weight Batch/Farm/Area Quarters
G19 Stocking density Kg/m3 𝑀𝑎𝑥𝑖𝑚𝑢𝑚 𝑠𝑡𝑜𝑐𝑘𝑒𝑑 𝑏𝑖𝑜𝑚𝑎𝑠𝑠 (𝑘𝑔)
𝐶𝑎𝑔𝑒 𝑣𝑜𝑙𝑢𝑚𝑒 (𝑚3) At harvest Batch/Farm Quarters
G20 Biomass produced per number of FTE employees
ton/FTE employe
e
𝑡𝑜𝑛 𝑜𝑓 𝑓𝑖𝑠ℎ𝑁° 𝑜𝑓 𝑒𝑚𝑝𝑙𝑜𝑦𝑒𝑒𝑠 (𝐹𝑇𝐸)
Annual reporting Farm/Area Year
G21 Biomass produced per volumes of sea water used ton/m3
𝑡𝑜𝑛 𝑜𝑓 𝑓𝑖𝑠ℎ𝑆𝑒𝑎 𝑤𝑎𝑡𝑒𝑟 𝑣𝑜𝑙𝑢𝑚𝑒 (𝑚3)
Annual reporting Farm/Area Year
G22 Oxygen depletion persistence days n Total number of days with oxygen depletion(below 4 ppm) Annual reporting Farm Year

134
G23 Escapes - Number of episodes
n. of episodes
of escapes / ton fish
𝑁𝑢𝑚𝑏𝑒𝑟 𝑜𝑓 𝑒𝑠𝑐𝑎𝑝𝑒 𝑒𝑝𝑖𝑠𝑜𝑑𝑒𝑠 𝑡𝑜𝑛 𝑜𝑓 𝑓𝑖𝑠ℎ
Annual reporting Farm/Area Year
G24 Escapes - estimated number of escaped fish
n. of fish / ton fish
𝐸𝑠𝑡𝑖𝑚𝑎𝑡𝑒𝑑 𝑛𝑢𝑚𝑏𝑒𝑟 𝑜𝑓 𝑒𝑠𝑐𝑎𝑝𝑒𝑑 𝑓𝑖𝑠ℎ𝑡𝑜𝑛 𝑜𝑓 𝑓𝑖𝑠ℎ
Annual reporting Farm/Area Year
G25
Endangered marine mammals, reptiles, fishes and birds lethal
incidents (
n. of lethal
incident/ha
𝑁𝑢𝑚𝑏𝑒𝑟 𝑜𝑓 𝑙𝑒𝑡ℎ𝑎𝑙 𝑖𝑛𝑐𝑖𝑑𝑒𝑛𝑡𝑠ℎ𝑎
Annual reporting Farm/Area Year
G26 Phosphorous accumulated in sediment
g/kg of sediment
𝑃 𝑎𝑐𝑐𝑢𝑚𝑢𝑙𝑎𝑡𝑒𝑑 𝑖𝑛 𝑠𝑒𝑑𝑖𝑚𝑒𝑛𝑡 (𝑔)𝑠𝑒𝑑𝑖𝑚𝑒𝑛𝑡 (𝑘𝑔)
Annual reporting or EMP Farm Year or EMP
G27 Nitrogen accumulated in sediment g/kg of sediment
𝑁 𝑎𝑐𝑐𝑢𝑚𝑢𝑙𝑎𝑡𝑒𝑑 𝑖𝑛 𝑠𝑒𝑑𝑖𝑚𝑒𝑛𝑡 (𝑔)𝑠𝑒𝑑𝑖𝑚𝑒𝑛𝑡 (𝑘𝑔)
Annual reporting or EMP Farm Year or EMP
G28 Marine space use for farming ha/ton fish
𝑇𝑜𝑡𝑎𝑙 𝑚𝑎𝑟𝑖𝑛𝑒 𝑠𝑝𝑎𝑐𝑒 𝑢𝑠𝑒 𝑓𝑜𝑟 𝑓𝑎𝑟𝑚𝑖𝑛𝑔 (ha) 𝑡𝑜𝑛 𝑜𝑓 𝑓𝑖𝑠ℎ
Annual reporting Farm/Area Year
G29 Land use ha/ton fish
𝑇𝑜𝑡𝑎𝑙 𝑎𝑟𝑎𝑏𝑙𝑒 𝑙𝑎𝑛𝑑 𝑢𝑠𝑒 𝑓𝑜𝑟 𝑓𝑎𝑟𝑚𝑖𝑛𝑔 (ℎ𝑎) 𝑡𝑜𝑛 𝑜𝑓 𝑓𝑖𝑠ℎ
Annual reporting Farm/Area Year

135
G30 Freshwater use m3/ ton fish
𝑇𝑜𝑡𝑎𝑙 𝑓𝑟𝑒𝑠ℎ𝑤𝑎𝑡𝑒𝑟 𝑢𝑠𝑒 𝑓𝑜𝑟 𝑓𝑎𝑟𝑚𝑖𝑛𝑔 (𝑚3) 𝑡𝑜𝑛 𝑜𝑓 𝑓𝑖𝑠ℎ
Annual reporting Farm/Area Year
G31 Energy used
Kilojoule/ton fish
𝑇𝑜𝑡𝑎𝑙 𝑒𝑙𝑒𝑐𝑡𝑟𝑖𝑐𝑖𝑡𝑦 𝑢𝑠𝑒𝑑 𝑓𝑜𝑟 𝑓𝑎𝑟𝑚𝑖𝑛𝑔 (𝑘𝐽)𝑡𝑜𝑛 𝑜𝑓 𝑓𝑖𝑠ℎ
Annual reporting Farm/Area Year
G32 Fuel (Diesel or petrol) used for transport L/ton fish
𝑇𝑜𝑡𝑎𝑙 𝑓𝑢𝑒𝑙 𝑢𝑠𝑒𝑑 𝑓𝑜𝑟 𝑡𝑟𝑎𝑛𝑠𝑝𝑜𝑟𝑡 (𝑙) 𝑡𝑜𝑛 𝑜𝑓 𝑓𝑖𝑠ℎ
Annual reporting Farm/Area Year
G33 Fuel (Diesel or petrol) used for others uses L/ton fish
𝑇𝑜𝑡𝑎𝑙 𝑓𝑢𝑒𝑙 𝑓𝑜𝑟 𝑜𝑡ℎ𝑒𝑟 𝑢𝑠𝑒𝑠 (𝑙) 𝑡𝑜𝑛 𝑜𝑓 𝑓𝑖𝑠ℎ
Annual reporting Farm/Area Year
G34 Total emission of CO2 t CO2/ ton fish
𝑇𝑜𝑡𝑎𝑙 𝑒𝑚𝑖𝑠𝑠𝑖𝑜𝑛 𝑜𝑓 𝐶𝑂2 (𝐶𝑂2 𝑡𝑜𝑛) 𝑡𝑜𝑛 𝑜𝑓 𝑓𝑖𝑠ℎ
Annual reporting Farm/Area Year
G35 Use of renewable energy %
𝑅𝑒𝑛. 𝑒𝑛𝑒𝑟𝑔𝑦
=𝑇𝑜𝑡𝑎𝑙 𝑒𝑙𝑒𝑐𝑡𝑟𝑖𝑐𝑖𝑡𝑦 𝑓𝑟𝑜𝑚 𝑟𝑒𝑛. 𝑠𝑜𝑢𝑟𝑐𝑒𝑠 𝑢𝑠𝑒𝑑 𝑓𝑜𝑟 𝑓𝑎𝑟𝑚𝑖𝑛𝑔 (𝑘
𝑇𝑜𝑡𝑎𝑙 𝑒𝑙𝑒𝑐𝑡𝑟𝑖𝑐𝑖𝑡𝑦 𝑢𝑠𝑒𝑑 𝑓𝑜𝑟 𝑓𝑎𝑟𝑚𝑖𝑛𝑔 (𝑘𝑊)× 100
Annual reporting Farm/Area Year
Table 14. Synthesis of KPIs benchmarking system for Grow out
*Fixed body weight: BATCH level - Body weight classes : 5-50g, 51-150g, 151-250gr, 251-400g, 401-800/harvested batches FARM/AREA level - Body weight classes: 150g, 250gr, 400g, 800/harvested batches
136
REFERENCES • Aguilar-Manjarrez, J., Soto, D. & Brummett, R. (2017). Aquaculture zoning, site selection and area
management under the ecosystem approach to aquaculture. A handbook. Report ACS18071. Rome, FAO, and World Bank Group, Washington, DC. 62 pp. Includes a USB card containing the full document (395 pp.)
• AO/Network of Aquaculture Centres in Central-Eastern Europe (NACEE). Report of the Third Meeting of Directors of the Network of Aquaculture Centres in Central-Eastern Europe (NACEE). Dubrovnik, Croatia, 28–30 September 2006. FAO Fisheries Report. No. 841. Rome, FAO. 2007. 275p
• Arechavala-Lopez, P., D. Fernandez-Jover, K. D. Black, E. Ladoukakis, J. T. Bayle-Sempere, P. Sanchez-Jerez, and T. Dempster. (2013b). Differentiating the wild or farmed origin of Mediterranean fish: a review of tools for sea bream and sea bass. Rev. Aquacult., 5(3): 137–157.
• Arechavala-Lopez, P., I. Uglem, D. Fernandez-Jover, J. T. Bayle-Sempere, and P. Sanchez-Jerez. (2011). Immediate postescape behaviour of farmed seabass (Dicentrarchus labrax L.) in the Mediterranean Sea. J. Appl. Ichthyol., 27(6): 1375–1378
• Arechavala-Lopez, P., I. Uglem, D. Fernandez-Jover, J. T. Bayle-Sempere, and P. Sanchez-Jerez. (2012a) Post-escape dispersion of farmed seabream (Sparus aurata L.) and recaptures by local fisheries in the Western Mediterranean Sea. Fish. Res., 121: 126–135
• Arechavala-Lopez, P., P. Sanchez-Jerez, J. T. Bayle-Sempere, D.G. Sfakianakis, and S. Somarakis (2012b). Discriminating farmed gilthead sea bream Sparus aurata and European sea bass Dicentrarchus labrax from wild stocks through scales and otoliths. J. Fish Biol., 80(6): 2159–2175.
• Arechavala-Lopez, P., P. Sanchez-Jerez, J. T. Bayle-Sempere, I. Uglem, and I. Mladineo. (2013a). Reared fish, farmed escapees and wild fish stocks—a triangle of pathogen transmission of concern to Mediterranean aquaculture management. Aquacult. Environ. Interact., 3: 153–161
• ASC Sea Bass, Sea Bream, and Meagre Standard – version 1.0 January 2107 • Bardon, A., Vandeputte, M., Dupont-Nivet, M., Chavanne, H., Haffray, P., Vergnet, A., & Chatain, B.
(2009). What is the heritable component of spinal deformities in the European sea bass (Dicentrarchus labrax)? Aquaculture, 294(3-4), 194–201. doi:10.1016/j.aquaculture.2009.06.018
• Baskett, M. L., S. C. Burgess, and R. S. Waples. (2013). Assessing strategies to minimize unintended fitness consequences of aquaculture on wild populations. Evol. Appl., 6(7): 1090–1108
• Besson, M., Vandeputte, M., van Arendonk, J. A. M., Aubin, J., de Boer, I. J. M., Quillet, E., & Komen, H. (2016). Influence of water temperature on the economic value of growth rate in fish farming: The case of sea bass (Dicentrarchus labrax) cage farming in the Mediterranean. Aquaculture, 462, 47–55
• Boglione, C., Gagliardi, F., Scardi, M., & Cataudella, S. (2001). Skeletal descriptors and quality assessment in larvae and post-larvae of wild-caught and hatchery-reared gilthead sea bream (Sparus aurata L. 1758). Aquaculture, 192(1), 1–22. doi:10.1016/s0044-8486(00)00446-4
• Boglione, C., Gavaia, P., Koumoundouros, G., Gisbert, E., Moren, M., Fontagné, S., & Witten, P. E. (2013). Skeletal anomalies in reared European fish larvae and juveniles. Part 1: normal and anomalous skeletogenic processes. Reviews in Aquaculture, 5, S99–S120. doi:10.1111/raq.12015
• Bostock J., Lane A., Hough C., Yamamoto K. (2016). An assessment of the economic contribution of EU aquaculture production and the influence of policies for its sustainable development. Aquacult Int (2016) 24:699–733
• Brummett, R. 2013. Growing aquaculture in sustainable ecosystems. Agriculture and environmental services. Notes, no. 5) Washington DC; World Bank http://www-wds.worldbank.org/
• Cardia, F. & Lovatelli, A. (2015). Aquaculture operations in floating HDPE cages: a field handbook. FAO Fisheries and Aquaculture Technical Paper No. 593. Rome, FAO. 152 pp
• Carrillo, M., Bromage, N., Zanuy, S., Serrano, R., & Prat, F. (1989). The effect of modifications in photoperiod on spawning time, ovarian development and egg quality in the sea bass (Dicentrarchus labrax L.). Aquaculture, 81(3-4), 351–365. doi:10.1016/0044-8486(89)90159-2

137
• Coll, J., A. Garcia-Rubies, G. Morey, O. Re~nones, D. Alvarez-Berastegui, O. Navarro, and A. M. Grau. (2013). Using no-take marine reserves as a tool for evaluating rocky-reef fish resources in the western Mediterranean. ICES J. Mar. Sci., 70: 578–590
• Conceicao L., Amos Tandler. (2018). Book: Success Factors for Fish Larval Production. John Wiley & Sons, 9 Jan 2018 - 512 pag. 111907214X, 9781119072140
• Convention for the Protection of the Marine Environment and the Coastal Region of the Mediterranean (1995). Original February 16, 1976, Amendments July 9, 2004. United Nations Environment Programme (UNEP). https://eur-lex.europa.eu/legal-content/EN/TXT/?uri=LEGISSUM:l28084
• Cook W.D., Tone K., and Zhu J., (2014). Data envelopment analysis: Prior to choosing a model, OMEGA, 2014, Vol. 44, 1-4.
• COUNCIL DIRECTIVE 2006/88/EC of 24 October 2006 on animal health requirements for aquaculture animals and products thereof, and on the prevention and control of certain diseases in aquatic animals. Official Journal of the European Union
• COUNCIL DIRECTIVE 92/43/EEC of 21 May 1992 on the conservation of natural habitats and of wild fauna and flora. Official Journal L 206 , 22/07/1992 P. 0007 – 0050. https://eur-lex.europa.eu/eli/dir/1992/43/oj
• De Innocentiis, S., A. Lesti, S. Livi, A. R. Rossi, D. Crosetti, and L. Sola. (2004). Microsatellite markers reveal population structure in gilthead sea bream Sparus aurata from the Atlantic Ocean and Mediterranean Sea. Fish. Sci., 70: 852–859
• Dempster T, Jackson D, Noble C, Sanchez-Jerez P, Somarakis S, Jensen O. (2013). Assessing the causes and developing measures to prevent the escape of fish from sea-cage aquaculture (Prevent Escape) – Executive Summary. In: PREVENT ESCAPE Project Compendium. Commission of the European Communities, 7th Research Framework Program. www.preventescape.eu
• DIRECTIVE 2000/60/EC OF THE EUROPEAN PARLIAMENT AND OF THE COUNCIL of 23 October 2000 establishing a framework for Community action in the field of water policy. 22.12.2000. L 327/1. Official Journal of the European Communities https://eur-lex.europa.eu/resource.html?uri=cellar:5c835afb-2ec6-4577-bdf8-756d3d694eeb.0004.02/DOC_1&format=PDF
• DIRECTIVE 2009/147/EC OF THE EUROPEAN PARLIAMENT AND OF THE COUNCIL of 30 November 2009 on the conservation of wild birds. Official Journal of the European Union L 20/7 https://eur-lex.europa.eu/eli/dir/2009/147/oj
• DIRECTIVE 2014/52/EU OF THE EUROPEAN PARLIAMENT AND OF THE COUNCIL of 16 April 2014 amending Directive 2011/92/EU on the assessment of the effects of certain public and private projects on the environment. L 124/1. Official Journal of the European Union
• Divanach, P., Papandroulakis, N., Anastasiadis, P., Koumoundouros, G., & Kentouri, M. (1997). Effect of water currents on the development of skeletal deformities in sea bass (Dicentrarchus labrax L.) with functional swimbladder during postlarval and nursery phase. Aquaculture, 156(1-2), 145–155. doi:10.1016/s0044-8486(97)00072-0
• FAO, 1995. Code of Conduct for Responsible Fisheries Rome, FAO. 1995. 41p. ISBN 92-5-103834-5 http://www.fao.org/3/a-v9878e.pdf
• FAO, 2009. Environmental impact assessment and monitoring in aquaculture (2009). FAO Fisheries and Aquaculture Technical Paper. No. 527. Rome, FAO. 2009. 57p http://www.fao.org/docrep/012/i0970e/i0970e.pdf
• FAO, 2016. Action Plan. The FAO Action Plan on Antimicrobial Resistance. FOOD AND AGRICULTURE ORGANIZATION OF THE UNITED NATIONS, Rome, 2016. http://www.fao.org/3/a-i5996e.pdf
• FAO, 2016. Fisheries and aquaculture software. FishStatJ – software for fishery statistical time series. In: FAO Fisheries and Aquaculture Department [online]. Rome. Updated 21 July (2016)
138
• FAO, 2018. Food and Agriculture Organization of the United Nations (2018). Strategy for the sustainable development of Mediterranean and Black Sea aquaculture. http://www.fao.org/3/I9766EN/i9766en.pdf
• Fezzardi D., Massa F., Àvila-Zaragoza P., Rad F., Yücel-Gier G., Deniz H., Hadj Ali Salem M., Hamza H.A., Ben Salem S. (2013) Indicators for sustainable aquaculture in Mediterranean and Black Sea countries. Guide for the use of indicators to monitor sustainable development of aquaculture. Studies and Reviews. General Fisheries Commission for the Mediterranean. No 93. Rome, FAO. 2013. 60 pp. (InDAM project)
• Fragkoulis, S., Batargias, C., Kolios, P., & Koumoundouros, G. (2018). Genetic parameters of the upper-jaw abnormalities in Gilthead seabream Sparus aurata. Aquaculture, 497, 226–233. doi:10.1016/j.aquaculture.2018.07.071
• Franchini, P., L. Sola, D. Crosetti, V. Milana, and A. R. Rossi. (2012). Low levels of population genetic structure in the gilthead sea bream, Sparus aurata, along the coast of Italy. ICES J. Mar. Sci., 69(1): 41–50
• Fraser, D. J., A. L. S. Houde, P. V. Debes, P. O’Reilly, J. D. Eddington, and J. A. Hutchings.(2010). Consequences of farmed– wild hybridization across divergent wild populations and multiple traits in salmon. Ecol. Appl., 20(4): 935–953
• Fry J.P., N.A. Mailloux, D.Clove, M.C. Milli, L. Cao (2018). Feed conversion efficiency in aquaculture: do we measure it correctly? Environmental Research Letters, volume 13,number 2, pag 024017, http://stacks.iop.org/1748-9326/13/i=2/a=024017
• GAPI, 2010. Global Aquaculture Performance Index. http://web.uvic.ca/~gapi/data/reports/GlobalAquaculturePerformaceIndex.pdf
• GLOBAL G.A.P General Regulations v5.1. Jul, 2017 • GSSI. Global Sustainable Seafood Initiative GLOBAL BENCHMARK TOOL. Version I, October 2015 • Halwart, M.; Soto, D.; Arthur, J.R. (eds.) Cage aquaculture – Regional reviews and global overview.
FAO Fisheries Technical Paper. No. 498. Rome, FAO. 2007. 241 pp • Henriksson, P. J. G., Rico, A., Troell, M., Klinger, D. H., Buschmann, A. H., Saksida, S., … Zhang, W.
(2017). Unpacking factors influencing antimicrobial use in global aquaculture and their implication for management: a review from a systems perspective. Sustainability Science, 13(4), 1105–1120. doi:10.1007/s11625-017-0511-8
• Jackson, D., A. Drumm, S. McEvoy, Ø. Jensen, D. Mendiola, G. Gabina, J. Borg, N. Papageorgiou, Y. Karakassis, and K. D. Black. (2015). A pan-European valuation of the extent, causes and cost of escape events from sea cage fish farming. Aquacult, 436: 21–26
• Janssen, K., H. Chavanne, P. Berentsen, and H. Komen. (2017). Impact of selective breeding on European aquaculture. Aquacult, 472: 8–16
• Jauralde, I., Martínez-Llorens, S., Tomás, A., Ballestrazzi, R., & Jover, M. (2011). A proposal for modelling the thermal-unit growth coefficient and feed conversion ratio as functions of feeding rate for gilthead sea bream (Sparus aurata L.) in summer conditions. Aquaculture Research, 44(2)
• Jensen, Ø., T. Dempster, E. B. Thorstad, I. Uglem, and A. Fredheim. (2010). Escapes of fishes from Norwegian sea-cage aquaculture: causes, consequences and prevention. Aquacult. Environ. Interac., 1: 71–83
• Jerez SP, Karakassis I, Massa F, Fezzardi D and others (2016). Aquaculture’s struggle for space: the need for coastal spatial planning and the potential benefits of Allocated Zones for Aquaculture (AZAs) to avoid conflict and promote sustainability. Aquacult Environ Interact 8:41-54. https://doi.org/10.3354/aei00161
• Jørstad, K. E., T. van der Meeren, O. I. Paulsen, T. Thomsen, A. Thorsen, and T. Svasand. (2008). ‘Escapes’ of eggs from farmed cod spawning in net pens: recruitment to wild stocks. Rev. Fish. Sci., 16: 285–295
• Kalantzi, I., & Karakassis, I. (2006). Benthic impacts of fish farming: Meta-analysis of community and geochemical data. Marine Pollution Bulletin, 52(5), 484–493. doi:10.1016/j.marpolbul.2005.09.034

139
• Kalantzi, I., Shimmield, T. M., Pergantis, S. A., Papageorgiou, N., Black, K. D., & Karakassis, I. (2013). Heavy metals, trace elements and sediment geochemistry at four Mediterranean fish farms. Science of The Total Environment, 444, 128–137. doi:10.1016/j.scitotenv.2012.11.082
• Karaiskou, N., A. Triantafyllidis, V. Katsares, T. J. Abatzopoulos, and C. Triantaphyllidis. (2009). Microsatellite variability of wild and farmed populations of Sparus aurata. J. Fish Biol., 74: 1816–1825
• Karakassis I., PS Jerez (2011) Environmental Quality Standards for Mediterranean Marine finfish farming based on the response of experts to a Delphi questionnaire. - GFCM report. 29p
• Koumoundouros, G. (2010). Morpho-anatomical abnormalities in Mediterranean marine aquaculture. Recent Advances in Aquaculture Research: 125-148. ISBN: 978-81-7895-483-7
• Koumoundouros, G., Gagliardi, F., Divanach, P., Boglione, C., Cataudella, S., & Kentouri, M. (1997a). Normal and abnormal osteological development of caudal fin in Sparus aurata L. fry. Aquaculture, 149(3-4), 215–226. doi:10.1016/s0044-8486(96)01443-3
• Koumoundouros, G., Oran, G., Divanach, P., Stefanakis, S., & Kentouri, M. (1997b). The opercular complex deformity in intensive gilthead sea bream (Sparus aurata L.) larviculture. Moment of apparition and description. Aquaculture, 156(1-2), 165–177. doi:10.1016/s0044-8486(97)89294-0
• Llorente, I., & Luna, L. (2013). The Competitive Advantages Arising from Different Environmental Conditions in Seabream, Sparus aurata, Production in the Mediterranean Sea. Journal of the World Aquaculture Society, 44(5)
• Loukovitis, D., E. Sarropoulou, E. Vogiatzi, C. S. Tsigenopoulos, G. Kotoulas, A. Magoulas, and D. Chatziplis. (2012). Genetic variation in farmed populations of the gilthead sea bream population structure in gilthead sea bream Sparus aurata in Greece using microsatellite DNA markers. Aquacult. Res., 43: 239–246
• Loy, A., Boglione, C., Gagliardi, F., Ferrucci, L., & Cataudella, S. (2000). Geometric morphometrics and internal anatomy in sea bass shape analysis (Dicentrarchus labrax L., Moronidae). Aquaculture, 186(1-2), 33–44. doi:10.1016/s0044-8486(99)00366-x
• Matlock M (2017) Aligning Aquaculture KPI Metrics with other livestock sectors to accelerate industry growth. Columbus, OH, April 4.
• Matos, E., Dias, J., Dinis, M.T., Silva, T.S., (2017). Sustainability vs. Quality in gilthead seabream (Sparus aurata L.) farming: are trade-offs inevitable? Rev. Aquac. http:// dx.doi.org/10.1111/raq.12144
• Moe, H., T. Dempster, L. M. Sunde, U. Winther, and A. Fredheim. (2007). Technological solutions and operational measures to prevent escapes of Atlantic cod (Gadus morhua) from sea cages. Aquacult. Res., 38(1): 91–99
• Murphy D, Antonia Ricci, Zanda Auce, J. Gabriel Beechinor, Hanne Bergendahl, … (2017), EMA and EFSA Joint Scientific Opinion on measures to reduce the need to use antimicrobial agents in animal husbandry in the European Union, and the resulting impacts on food safety (RONAFA), Section 6, European Commission, EMA-EFSA opinion OIE aquatic animal health code, EFSA-Q-2015-00216 doi: 10.2903/j.efsa.2017.4666
• Naylor, R., K. Hindar, I. A. Fleming, R. Goldburg, S. Williams, J. Volpe, F. Whoriskey, J. Eagle, D. Kelso, and M. Mangel. (2005). Fugitive salmon: assessing the risks of escaped fish from net-pen aquaculture. BioScience, 55: 427–437
• Negrín-Báez, D., Navarro, A., Lee-Montero, I., Soula, M., Afonso, J. M., & Zamorano, M. J. (2015). Inheritance of skeletal deformities in gilthead seabream (Sparus aurata) – lack of operculum, lordosis, vertebral fusion and LSK complex1. Journal of Animal Science, 93(1), 53–61. doi:10.2527/jas.2014-7968
• Raynard, R., T. Wahli, I. Vatsos, and S. Mortensen. (2007). Review of disease interactions and pathogen exchange between farmed and wild finfish and shellfish in Europe. In: DIPNET, p. 459. Aberdeen. http://www.dipnet.info/docs/doc.asp?idD48

140
• Reiss, H., & Kröncke, I. (2005). Seasonal variability of benthic indices: An approach to test the applicability of different indices for ecosystem quality assessment. Marine Pollution Bulletin, 50(12), 1490–1499. doi:10.1016/j.marpolbul.2005.06.017
• Resolution GFCM/36/2012/1 on guidelines on allocated zones for aquaculture (AZA) • Rey-Valette, H., Clément, O., Aubin, J., Mathé, S., Chia, E., Legendre, M., Caruso, D., Mikolasek, O.,
Blancheton, J.P., Slembrouck, J., Baruthio, A., René, F., Levang, P., Morrissens, P. & Lazard,J. (2008). Guide to the co-construction of sustainable development indicators in aquaculture. Montpellier, Cirad, Ifremer, INRA, IRD, Université Montpellier 1. 144 pp. EVAD project
• Rhymer, J. M., and D. Simberloff. (1996). Extinction by hybridization and introgression. Ann. Rev. Ecol. Syst., 27(1): 83–109
• ROO, J.; HERNÁNDEZ-CRUZ, C.M; SOCORRO, J.;FERNANDEZ-PALACIOS, H. AND IZQUIERDO, M.S. (2005a) Poster: Development of skeletal deformities in gilthead sea bream (Sparus aurata) reared under different larval culture and dietary conditions
• ROO, J.; HERNÁNDEZ-CRUZ, C.M; SOCORRO, J.;FERNANDEZ-PALACIOS, H. AND IZQUIERDO, M.S. (2005b) Poster: Effect of rearing techniques over, survival growth and skeletal abnormalities development in red porgy (Pagrus pagrus) larvae
• Santos, L., & Ramos, F. (2018). Antimicrobial resistance in aquaculture: Current knowledge and alternatives to tackle the problem. International Journal of Antimicrobial Agents, 52(2), 135–143. doi:10.1016/j.ijantimicag.2018.03.010
• Schmidt J.G., K. D. Thompson and F. Padrós, (2018). Emerging skin diseases in aquaculture. 122, Bull. Eur. Ass. Fish Pathol., 38(3)
• Seafood Watch Atlantic Salmon, Scotland Marine Net Pens. September 18, 2017 Seafood Watch Consulting Researcher. Monterey Bay Aquarium. https://www.seafoodwatch.org/-/m/sfw/pdf/reports/s/mba_seafoodwatch_farmedscotlandsalmon_report.pdf
• Seafood Watch European Sea Bass, Gilthead Seabream (Dicentrarchus labrax, Sparus aurata) (2014). Mediterranean Sea Marine Net Pens. December 5, 2014. Brian Albaum – Seafood Watch Science Analyst (Aquaculture). Monterey Bay Aquarium. http://seafood.ocean.org/wp-content/uploads/2016/10/European-Seabass-Gilthead-Seabream-Open-Net-Pen-Mediterranean.pdf
• Sfakianakis, D. G., Georgakopoulou, E., Kentouri, M., & Koumoundouros, G. (2006). Geometric quantification of lordosis effects on body shape in European sea bass, Dicentrarchus labrax (Linnaeus, 1758). Aquaculture, 256(1-4), 27–33. doi:10.1016/j.aquaculture.2006.01.037
• SHoCMed: Project in support to the GFCM CAQ Working Group on Site Selection and Carrying Capacity (WGSC). Jan 2012 http://www.fao.org/gfcm/activities/aquaculture/en/?pag=content/_ShowPortal&Portal=SHOCMED
• Sprague, M., Dick, J.R., Tocher, D.R., (2016). Impact of sustainable feeds on omega-3 longchain fatty acid levels in farmed Atlantic salmon, 2006–2015. Sci. Rep. 6 Article number: 21892. 10.1038/srep21892
• Strategy for the sustainable development of Mediterranean and Black Sea aquaculture. (2018) FOOD AND AGRICULTURE ORGANIZATION OF THE UNITED NATIONS Rome. http://www.fao.org/3/I9766EN/i9766en.pdf
• Svåsand T., Crosetti D., García-Vázquez E., Verspoor E. (eds). (2007). Genetic impact of aquaculture activities on native populations. Genimpact final scientifi c report (EU contract n. RICA-CT-2005-022802). 176 p. http://genimpact.imr.no/
• Tacon, A. G. J., & Metian, M. (2008). Global overview on the use of fish meal and fish oil in industrially compounded aquafeeds: Trends and future prospects. Aquaculture, 285(1-4), 146–158. doi:10.1016/j.aquaculture.2008.08.015
• Tacon, A.G.J., Metian, M., (2015). Feed matters: satisfying the feed demand of aquaculture. Rev. Fish. Sci. Aquacult. 23, 1–10
• TAPAS H2020, No 678396 http://tapas-h2020.eu/the-project/

141
• Taranger G.L., Ø. Karlsen, R. J. Bannister, K. A. Glover, V. Husa, E. Karlsbakk, … S. A. Madhun. (2015). Risk assessment of the environmental impact of Norwegian Atlantic salmon farming. ICES J. Mar. Sci., 72(3): 997–1021
• Vendramin N, S. Zrncic, F Padrós, D Oraic, A Le Breton, C Zarza and N. J. Olesen, (2016). Fish health in Mediterranean Aquaculture, past mistakes and future challenges. 38, Bull. Eur. Ass. Fish Pathol., 36(1)
• Volpe J, Gee J, Ethier V, Beck M, Wilson A & Stoner J. (2013). Global Aquaculture Performance Index (GAPI): The First Global Environmental Assessment of Marine Fish Farming. Sustainability, 5(9), 3976–3991. doi:10.3390/su5093976
• WHO Global Action Plan on Antimicrobial Resistance (2015). World Health Organization, 20 Avenue Appia, 1211 Geneva 27, Switzerland. http://www.wpro.who.int/entity/drug_resistance/resources/global_action_plan_eng.pdf
• WHO guidelines on use of medically important antimicrobials in food-producing animals (2017). Geneva: World Health Organization; 2017. Licence: CC BY-NC-SA 3.0 IGO. http://apps.who.int/iris/bitstream/handle/10665/258970/9789241550130-eng.pdf;jsessionid=99C145FD891960DDCCE2CF3934812D49?sequence=1
• Zuang et al., EURL ECVAM Status Report on the Development, Validation and Regulatory Acceptance of Alternative Methods and Approaches (2017), EUR 28823, Publications Office of the European Union, Luxembourg, 2017, Available at http://publications.jrc.ec.europa.eu/repository/handle/JRC108831
• Zuang et al., EURL ECVAM Status Report on the Development, Validation and Regulatory Acceptance of Alternative Methods and Approaches (2016), EUR 28156, Publications Office of the European Union, Luxembourg, 2016, Available at http://publications.jrc.ec.europa.eu/repository/bitstream/JRC103522/eurl%20ecvam%20status%20report%20oct%202016%20online.pdf