deliverable d1.1 partial disinfection technolo- gies for...
TRANSCRIPT
The project “Innovation Demonstration for a Competitive and Innovative European Water Reuse Sector” (DEMOWARE) has received funding from the European Union’s 7th Framework Programme for research, technological development and demonstration, theme ENV.2013.WATER INNO&DEMO-1 (Water innova-tion demonstration projects) under grant agreement no 619040
Deliverable D1.1
Partial disinfection technolo-
gies for water reuse: case stud-
ies and design guidelines


i
Deliverable Title D1.1 Partial disinfection technologies for water reuse: case studies and
design guidelines
Related Work Package: WP1: Demonstrating innovative treatment processes and reuse scheme
operation
Deliverable lead: Ulf Miehe / KWB
Author(s): Johan Stüber, Ulf Miehe KWB
Contact for queries KWB:
Ulf Miehe
Kompetenzzentrum Wasser Berlin gGmbH
Cicerostr. 24
D-10709 Berlin
T +49 30 53653 822
Dissemination level: Public
Due submission date: 30/06/2015 (M18)
Actual submission: 14/01/2016
Grant Agreement Number: 619040
Instrument: FP7-ENV-2013-WATER-INNO-DEMO
Start date of the project: 01.01.2014
Duration of the project: 36 months
Website: www.demoware.eu
Abstract Partial disinfection can be a cost effective and sustainable application
when the chosen reuse application does not increase the risk of water-
borne diseases. This report summarizes the experiences of a pilot scale
investigation at WWTP Brunswick and full scale operation at WWTP El
Port de la Selva for disinfection steps, performed for water reuse. Addi-
tionally results of pilot scale ozonation are presented. An economic eval-
uation with the defined doses is carried out and it is presented for
WWTP Brunswick.
Versioning and Contribution History
Version Date Modified by Modification reason
v.01 29/05/2015 Xavier Martinez Adopted template provided to Lead Beneficiary
v.02 27/07/2015 Johan Stüber Initial draft
v.03 03/09/2015 Raquel Iglesias Review
v.04 15/01/2016 Johan Stüber Revision as suggested by reviewer

ii
Table of contents
Versioning and Contribution History .............................................................................................................. i
List of figures ................................................................................................................................................ iii
List of tables .................................................................................................................................................. iv
Glossary ........................................................................................................................................................ vi
Executive Summary ....................................................................................................................................... 8
1 Introduction ........................................................................................................................................... 9
2 Selection of Reuse application – Regulatory requirements ................................................................. 11
3 Feed water characteristics ................................................................................................................... 13
3.1 WWTP data evaluation ................................................................................................................ 14
3.1.1 WWTP Brunswick – Demoware pilot trials 14
3.1.2 WWTP El Port de la Selva 20
3.1.3 Summary water parameters 25
3.2 Monitoring campaign secondary effluent .................................................................................... 25
4 Upstream process evaluation / optimization ....................................................................................... 26
5 Selection of disinfection technology .................................................................................................... 28
5.1 Chemical disinfection technologies ............................................................................................. 28
5.1.1 Chlorination and disinfection with chlorine dioxide 29
5.1.2 Performic acid (PFA) 30
5.1.3 Ozone 31
5.1.4 Summary Ct values for chemical disinfection technologies 32
5.2 Physical disinfection technologies ............................................................................................... 34
5.2.1 Membrane filtration 34
5.2.2 UV radiation disinfection 34
6 Evaluation of disinfection performance of selected technologies ....................................................... 36
6.1 Piloting example Brunswick ......................................................................................................... 36
6.1.1 Pilot plant set up 36
6.1.2 Results pilot scale investigations 38
6.1.3 Retention time PFA reactor 43
6.1.4 Sludge run off incident 44
6.1.5 Summary Pilot trials WWTP Brunswick 46
6.2 El Port de la Selva ......................................................................................................................... 47
6.2.1 Set up tertiary treatment system 47
6.2.2 Disinfection results 47
6.3 Ozonation pilot trials ................................................................................................................... 49
6.3.1 Set up pilot plants 49
6.3.2 Results 50
7 Design guidelines partial disinfection .................................................................................................. 52
7.1 Chlorination and disinfection with chlorine dioxide .................................................................... 53
7.1.1 Reactor design 53
7.1.2 Control strategy 54
iii
7.2 Performic acid .............................................................................................................................. 54
7.3 Ozone ........................................................................................................................................... 54
7.3.1 Reactor design 54
7.3.2 Control strategy 55
7.4 UV Disinfection ............................................................................................................................ 56
7.4.1 Reactor design 56
7.4.2 Control strategy 58
7.5 Outlook control strategies ........................................................................................................... 58
8 Cost estimation .................................................................................................................................... 59
8.1 WWTP Brunswick ......................................................................................................................... 59
8.1.1 Disinfection based on crop demand 63
8.2 Ozonation .................................................................................................................................... 64
9 Conclusion ........................................................................................................................................... 65
10 Bibliography ......................................................................................................................................... 67
11 Appendix .............................................................................................................................................. 69
List of figures
Figure 1 Decision tree and work flow .................................................................................................... 10
Figure 2 Example of box plot ................................................................................................................. 14
Figure 3 Temperature evolution secondary effluent WWTP Brunswick ............................................... 16
Figure 4 Suspended solids & turbidity – Secondary effluent WWTP Brunswick (without sludge run-off)16
Figure 5 DOC - Conductivity - pH - Secondary effluent WWTP Brunswick ............................................ 17
Figure 6 Transmittance - Secondary effluent WWTP Brunswick ........................................................... 17
Figure 7 Indicators present in secondary effluent WWTP Brunswick – Samples taken during pilot testing Sept. – Oct. 2014 ............................................................................................................................. 19
Figure 8 Suspended solids and turbidity during sludge run-off at WWTP Brunswick on October 9th ... 20
Figure 9 Suspended solids of secondary effluent WWTP El Port de la Selva - 2011 to March 2015 ..... 21
Figure 10 Turbidity secondary effluent WWTP El Port de la Selva - 2011 to March 2015 ...................... 22
Figure 11 Transmittance tertiary effluent – 2011 to March 2015........................................................... 23
Figure 12 Conductivity tertiary effluent at WWTP El Port de la Selva - 2011 to March 2015 ................. 23
Figure 13 Pathogens present in secondary effluent WWTP El Port de la Selva – Samples taken 01/2011 to 12/2015 24
Figure 14 Basic flow sheet UV disinfection ............................................................................................. 37
Figure 15 Basic flow sheet PFA pilot plant WWTP Brunswick ................................................................. 37
Figure 16 Disinfection results - E. coli - UV radiation .............................................................................. 38
Figure 17 Disinfection results - E. coli – Performic acid (PFA) ................................................................. 39
Figure 18 Disinfection results - E.Cocci - UV radiation ............................................................................ 40
Figure 19 Disinfection results - E.Cocci – Performic acid (PFA) ............................................................... 40
Figure 20 Disinfection results - Clostridium Perfringens - UV radiation .................................................. 41
iv
Figure 21 Disinfection results - Clostridium Perfringens - Performic acid (PFA)...................................... 41
Figure 22 Disinfection results - Somatic Coliphages - UV radiation ......................................................... 42
Figure 23 Disinfection results - Somatic Coliphages - Performic acid (PFA) ............................................ 43
Figure 24 Comparison results for 2 g/m3 PFA - with and without quenching ......................................... 44
Figure 25 Indicator organisms and suspended solids during sludge run-off - secondary effluent - PFA 2 g/m3, UV 32 Wh/m3 (600 J/m2) ................................................................................................................. 45
Figure 26 Suspended solids and LUR for PFA and UV during sludge run-off ........................................... 46
Figure 27 Tertiary treatment including disinfection by UV and Sodium-hypochlorite at WWTP El Port de la Selva 47
Figure 28 E. coli - secondary effluent - UV effluent – after NaOCl - WWTP El Port de la Selva ............... 48
Figure 29 Somatic coliphages - secondary effluent - UV effluent – after NaOCl - WWTP El Port de la Selva 48
Figure 30 Sulphite-reducing clostridia - secondary effluent - UV effluent – after NaOCl - WWTP El Port de la Selva 49
Figure 32 Ozone contactors - A) Bubble column as used in ASKURIS - B) By-pass system with venturi cone as used in IST4R................................................................................................................................... 50
Figure 33 Log reduction of E. coli due to ozonation of a secondary effluent at pilot scale versus DOC specific ozone dose with (grey points) and without (black cross) consideration of the additional ozone consumption by nitrite. Adapted from (Jekel et al. 2015a), mean DOC concentration was 12.9 mg/L. ...... 51
Figure 34 Reduction of E. coli (left) and E. cocci (right) due to ozonation of a secondary effluent of a municipal wastewater treatment plant. ...................................................................................................... 51
Figure 35 Process flow sheet - chlorination ............................................................................................ 53
Figure 36 Examples for chlorine contacts basins: left serpentine plug-flow basin, right with rounded corners; adapted from Asano et al. (2007) – Design can be adapted for PFA contact basins ..................... 53
Figure 37 Left: Scheme of a four compartment ozone contactor (adapted from Asano et al. (2007)); right: Ozone contactor designed for up to 10 m3/h (Stüber & Godehardt 2013) ........................................ 55
Figure 38 Scheme of ozonation contactor .............................................................................................. 56
Figure 39 Examples for open channel reactors adapted from Asano et al. (2007) ................................. 57
Figure 40 Examples for closed in-line UV reactors adapted from Asano et al. (2007) ............................ 58
Figure 41 Net present value for different disinfection technologies at WWTP Steinhof – 11 mio. m3/a 61
Figure 42 Specific capital and operational costs – Over 30 years treating 11 mio. m3 per year ............. 62
Figure 43 Net present value of different disinfection technologies at WWTP Steinhof - 3.6 mio. m3/a . 63
Figure 44 Specific costs according to utilisation of disinfection step ...................................................... 64
List of tables
Table 1 Required water class for irrigation, according to DIN19650 and EPA Victoria 2003) .............. 12
Table 2 Effect of feed water characteristic on disinfection technology, considering an increase of the parameter 13
Table 3 Summary of physico-chemical parameters of WWTP Brunswick ............................................ 18
Table 4 Water parameters WWTP Brunswick and WWTP El Port de la Selva – Secondary effluent .... 25
Table 5 Expected water quality according to the prior treatment adapted from Asano et al. (2007) . 27

v
Table 6 Impact of wastewater constituent on the use of chlorine for wastewater disinfection, adapted from (Asano et al. 2007) (without ClO2) ........................................................................................ 30
Table 7 Impact of wastewater constituent on the use of PFA for wastewater disinfection ................ 31
Table 8 Impact of wastewater constituent on the use of ozone for wastewater disinfection, adapted from (Asano et al. 2007) .............................................................................................................................. 32
Table 9 Ct values for chemical disinfection technologies for secondary effluent in mg * min * L-1 (adapted from (Tchobanoglous et al. 2014)) ............................................................................................... 32
Table 10 Examples of Ct values for 99 % (2-log) inactivation of various microorganisms by disinfectants1,2,3 ........................................................................................................................................... 33
Table 11 Nominal pore size membrane filtration .................................................................................. 34
Table 12 Characteristics of UV lamps - adapted from Tchobanoglous et al. (2014) .............................. 34
Table 13 Impact of wastewater constituent on the use of UV for wastewater disinfection, adapted from Asano et al. (2007) .............................................................................................................................. 35
Table 14 Target LUR of indicator organisms assumed to be equivalent to 1.5 LUR of viruses .............. 36
Table 15 Flow and correspondent specific energy consumption and fluence ....................................... 37
Table 16 Comparison of median LURs with and without quenching ..................................................... 44
Table 17 Comparison disinfection results Brunswick – Mean LURs ....................................................... 46
Table 18 Comparison of technologies suitable for partial disinfection, adapted in part from Asano et al. (2007), Tchobanoglous et al. (2014), and Crittenden et al. (2012) ......................................................... 52
Table 19 Net present values over 30 years - sensitivity to dosage and energy costs ............................ 63
Table 20 Specific costs for ozonation according to the used dose ........................................................ 65
Table 21: Dosages and specific costs of case studies – 2 LUR for E. coli ...................................................... 66
Table 22 Microorganisms present in treated wastewaters and diseases caused (adapted from Alcade-Sanz & Gawlik (2014), Adams et al. (1999), (Hochstrat & Wintgens 2015) and Tchobanoglous et al. (2014))69
Table 23 Standards on water reuse – Europe and Worldwide; adopted from Alcade-Sanz & Gawlik (2014) and own review ................................................................................................................................ 69
Table 24 Water for irrigation purposes - DIN 19650 .............................................................................. 72
Table 25 Classes of reclaimed water and corresponding standards for biological treatment and pathogen reduction - (EPA Victoria 2003) ................................................................................................... 73
vi
Glossary
a Year (annum)
AC Annual costs
BOD Biological oxygen demand
CFU Colony-forming units
COD Chemical oxygen demand
DALY Disability-adjusted life years
DBP Disinfection by-products
DEF Depreciation factor
DF Discount factor
DOC Dissolved organic carbon
DPR Direct potable reuse
E Specific ozone dose (mgO3/mgDOC)
e.g. Latin: exempli gratia
Etc. Latin: etcetera
HAAs Haloacetic acids
i Rate of interest
IPR Indirect potable reuse
IR Industrial reuse
LUR Log unit reduction
MIC Microbial Inactivation Credit = log-credits
mio Million (106)
MBR Membrane bioreactor
MF Microfiltration
MPN Most probable number
n Number of years (e.g. economic lifetime)
na not available
NDMA N-nitrosodimethylamine
NF Nanofiltration
NOM Natural organic matter
NTU Nephelometric Turbidity Unit
Opex operational costs
org Organisms
PAA Peracetic acid
PFU Plaque forming units
p.e. Population equivalent
PFA Performic acid
RI Restricted irrigation
vii
RO Reverse Osmosis
SE Secondary effluent
SIB Saltwater intrusion barrier
SRC Sulphite-reducing clostridia
SVI Sludge volume index
TE Tertiary effluent
TDS Total dissolved salts
THMs Trihalomethanes
TOC Total organic carbon
TSS Total suspended solids
UF Ultrafiltration
UI Unrestricted irrigation
UR Urban reuse
UV Ultraviolet radiation
WHO World Health Organization
�̇� Flow (Volume per time)
WWTP Wastewater treatment plant
8
DEMOWARE GA No. 619040
Executive Summary
Water reuse is required to face the water stress situation throughout the world. Considering a sustaina-
ble approach the energy and chemical demand should be as low as possible. Therefore, partial disinfec-
tion with a lower demand for energy and chemicals is favourable wherever the reuse application allows
lower water quality to be used, e.g. 100 – 2,000 CFU/100mL total coliforms, depending on the reuse ap-
plication. This report shows exemplary the approach to a disinfection task at two wastewater treatment
plants (WWTP), WWTP Brunswick and WWTP El Port de la Selva. Additionally, the results from pilot scale
ozonation at WWTPs in Berlin are given.
At WWTP Brunswick pilot scale trials were conducted running a performic acid (PFA) and an ultraviolet
radiation unit in parallel for three months. In order to achieve a water class suitable for irrigation,
2.0 g/m3 of PFA and 35 Wh/m3 (650 J/m2) were defined assuring a sufficient disinfection.
Cost estimation for WWTP Brunswick is included in chapter 8. Evaluation of the specific costs for UV, PFA
and chlorine-dioxide (ClO2) showed the high dependency on the capacity utilisation, which is described by
the actual utilisation divided by the maximum design capacity. Considering an utilisation of 0.53, specific
costs of 2.2 cent/m3 for ClO2, 2.4 cent/m3 for UV and 2.6 cent/m3 for PFA are calculated.
At WWTP El Port de la Selva the existing tertiary treatment step including dual media filter, UV disinfec-
tion and chlorination with sodium-hypochlorite is presented.
The effects of ozonation on pathogens, E. coli and E. cocci, were measured within the research projects
ASKURIS and IST4R. The findings showed that a log unit removal (LUR) of 2 can be achieved by applying an
ozone dosage of 0.6 mgO3/mgDOC. Nonetheless, the high capital and operation costs lead to specific
costs of approximately 5.8 cent/m3 (using 0.7 mgO3/mgDOC).
9
Deliverable D1.1
1 Introduction
Considering the increasing water scarcity in Europe and worldwide, treated wastewater represents a val-
uable but not fully exploited water source. The risk of infection through water carried pathogens is the
major concern with regard to the public recognition of wastewater reuse applications. On the other hand,
demanding full disinfection for every reuse application will lead to high amounts of chemicals or/and
energy. Evaluating disinfection technologies designed for full disinfection in a holistic way reveals an often
unnecessary burden to the environment. Through quantitative microbiological risk assessment (QMRA),
required disinfection levels for different applications can be defined (WHO 2006). This evaluation ap-
proach can be used to define disinfection goals balancing the effort, e.g. energy and chemicals, and the
risk to public health. Waterborne diseases and their origin are summarized in Table 22 in chapter 11.
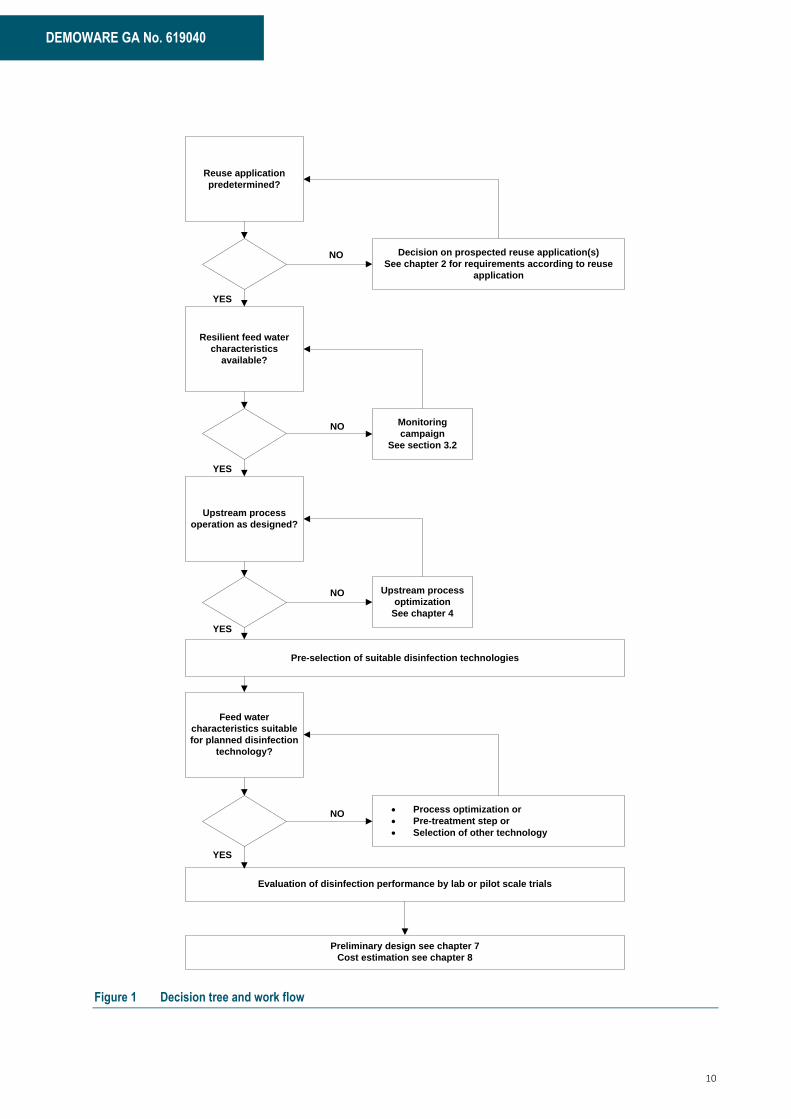
Approaching a water reuse task, disinfection is often a crucial process step, which needs to be designed in
order to achieve a safe and cost effective solution. This report is based on the assumption that an existing
WWTP shall be upgraded with a disinfection step. The questions at the beginning of this design process
and the corresponding tasks are summarized in Figure 1 and shall serve as a guidance approaching a wa-
ter reuse application. The tasks refer to chapters and sections in this report. Where possible, piloting and
full scale results are given and the approach can help to get started. This decision tree helps to define a
workflow targeting a technical and economical outline proposal.
In chapter 2, different applications for water reuse and the corresponding regulations are summarized.
These regulations are application oriented and help to operate disinfection installation in an energy and
resource efficient way. Feed water characteristics and the effect on disinfection technologies are dis-
cussed in chapter 3 (and chapter 5). Data exploitation is exemplary presented using data assessed during
pilot and full scale investigations within Demoware.
A guideline to review the upstream sanitation process and potential savings for the disinfection by pro-
cess optimization is summarized in chapter 4.
In chapter 5, different disinfection technologies are presented and guidelines which technology might be
appropriate for the current task are given.
Evaluation of selected disinfection technologies with respect to the applied doses is presented with the
data collected during pilot and full scale trials in chapter 6.
Design considerations and recommendations for process control strategies are given in chapter 7.
Using the net present value as explained in chapter 8, helps to compare different technologies and to
identify the cost nature. Due to the different requirements of each technology, the net present value with
respect to the actual and proposed costs for the considered site can define a break-even point between
different technologies.
The disinfection technologies discussed in detail in this report were chosen due to the possibility to oper-
ate these processes with the goal of partial disinfection.
10
DEMOWARE GA No. 619040
Reuse application
predetermined?
Resilient feed water
characteristics
available?
Monitoring
campaign
See section 3.2
Decision on prospected reuse application(s)
See chapter 2 for requirements according to reuse
application
Upstream process
operation as designed?
Upstream process
optimization
See chapter 4
Feed water
characteristics suitable
for planned disinfection
technology?
· Process optimization or
· Pre-treatment step or
· Selection of other technology
YES
NO
YES
YES
NO
NO
NO
Pre-selection of suitable disinfection technologies
Evaluation of disinfection performance by lab or pilot scale trials
Preliminary design see chapter 7
Cost estimation see chapter 8
YES
Figure 1 Decision tree and work flow

11
Deliverable D1.1
2 Selection of Reuse application – Regulatory requirements
Alcade-Sanz & Gawlik (2014) described in their report „Water Reuse in Europe“ the status quo of water
reuse practice and the need for further innovations in this field. There are plenty of advantages connect-
ed to increased water reuse and the authors predict “significant economic, social and environmental
benefits”. One major drawback identified in a report published by the Water sanitation and supply Tech-
nical Platform (WssTP 2013) is the lack of suitable regulations, which are accepted internationally. Due to
the sensitive nature of the topic of water reuse, this lack of a widely accepted regulation represents a
barrier to market introduction. The potential health risk for the population is a concern that needs to be
addressed through active information on the safety, reliability and benefits of water reuse techniques,
with remark to existing and powerful guidelines.
On the other hand, successful water reuse application can be found worldwide, among others, in Singa-
pore (NEWater, Indirect potable reuse and industrial reuse, (PUB 2015)), Australia (e.g. agricultural),
South Africa (e.g. City of Cape Town, industrial reuse (Ncube 2015)) and Israel (50% for irrigation is pro-
vided by wastewater reuse (WaterWorld 2012)). The broad range of water reuse application of these
projects shows the need for adequate regulations according to the type of the reuse application.
European regulations and guidelines addressing the water reuse issue are summarized in Table 23. Exem-
plary definitions of water classes can be found in Table 24 and Table 25 in the Appendix.
Local, national and international regulations govern the disinfection requirements for these purposes.
The World Health Organization (WHO) provides a step-by-step approach to define a health-based target
of pathogens reduction (WHO 2006). This guideline is based on the precondition that the additional dis-
ease burden of water reuse should not exceed the burden defined for drinking-water: “WHO (2004) has
adopted, in the third edition of the Guidelines for drinking-water quality, a tolerable burden of water-
borne disease from consuming drinking-water of < 10-6 DALY per person per year.”
Even though Australia has a very long history in water reuse and each state set up guidelines and regula-
tions in order to manage risks to the population as well as to the environment, a national standardization
process was established (NRMMC-EPHC-AHMC 2006; NRMMC-EPHC-AHMC 2008). This process was initi-
ated to establish a guideline with an equivalent approach as defined prior for drinking water (NHMRC &
NRMMC 2015).
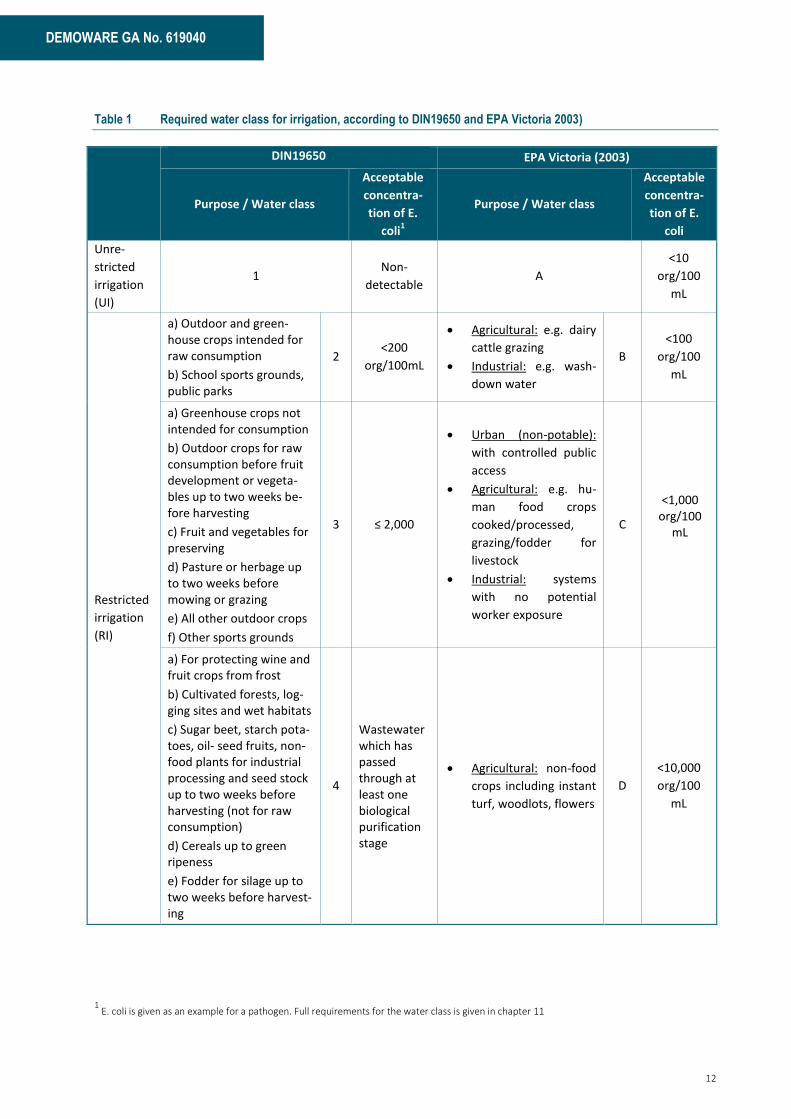
Irrigation water requires different disinfection levels according to the application and two classifications
are summarized in Table 1. Partial disinfection schemes are limited to applications, where a log unit re-
moval (LUR) ≤ 3 is acceptable. Some regulations demand a specified maximal tolerable concentration of
indicator organisms in the reuse water (e.g. DIN 19650 and EPA Victoria (2003)), whereas other regula-
tion demand treatment trains with a specified LUR accredited (California Department of Public Health
2014). Other reuse applications are saltwater intrusion barrier (SIB), urban reuse (UR) and industrial reuse
(IR), where different regulations apply.
12
DEMOWARE GA No. 619040
Table 1 Required water class for irrigation, according to DIN19650 and EPA Victoria 2003)
DIN19650 EPA Victoria (2003)
Purpose / Water class
Acceptable
concentra-
tion of E.
coli1
Purpose / Water class
Acceptable
concentra-
tion of E.
coli
Unre-
stricted
irrigation
(UI)
1 Non-
detectable A
<10
org/100
mL
Restricted
irrigation
(RI)
a) Outdoor and green-house crops intended for raw consumption
b) School sports grounds, public parks
2 <200
org/100mL
· Agricultural: e.g. dairy
cattle grazing
· Industrial: e.g. wash-
down water
B
<100
org/100
mL
a) Greenhouse crops not intended for consumption
b) Outdoor crops for raw consumption before fruit development or vegeta-bles up to two weeks be-fore harvesting
c) Fruit and vegetables for preserving
d) Pasture or herbage up to two weeks before mowing or grazing
e) All other outdoor crops
f) Other sports grounds
3 ≤ 2,000
· Urban (non-potable):
with controlled public
access
· Agricultural: e.g. hu-
man food crops
cooked/processed,
grazing/fodder for
livestock
· Industrial: systems
with no potential
worker exposure
C
<1,000 org/100
mL
a) For protecting wine and fruit crops from frost
b) Cultivated forests, log-ging sites and wet habitats
c) Sugar beet, starch pota-toes, oil- seed fruits, non-food plants for industrial processing and seed stock up to two weeks before harvesting (not for raw consumption)
d) Cereals up to green ripeness
e) Fodder for silage up to two weeks before harvest-ing
4
Wastewater which has passed through at least one biological purification stage
· Agricultural: non-food
crops including instant
turf, woodlots, flowers
D
<10,000
org/100
mL
1 E. coli is given as an example for a pathogen. Full requirements for the water class is given in chapter 11
13
Deliverable D1.1
3 Feed water characteristics
Partial disinfection is recommended for the purpose of irrigation and uses where the WHO health target
of 10-6 Disability adjusted life years (DALY) per person per year can be met (WHO 2004)), considering all
implemented risk reduction measures. In order to design an efficient system, considering the ecological
as well as economic aspects, the feed water characteristics have to be evaluated properly. Among others,
the physical and chemical characteristics influence the decision on which technology is the most appro-
priate for the given task. The presented technologies were chosen due to the fact that partial disinfection
can be done in a cost and energy efficient way and without the burden of formation of disinfection by-
products (DBPs) in high quantities.
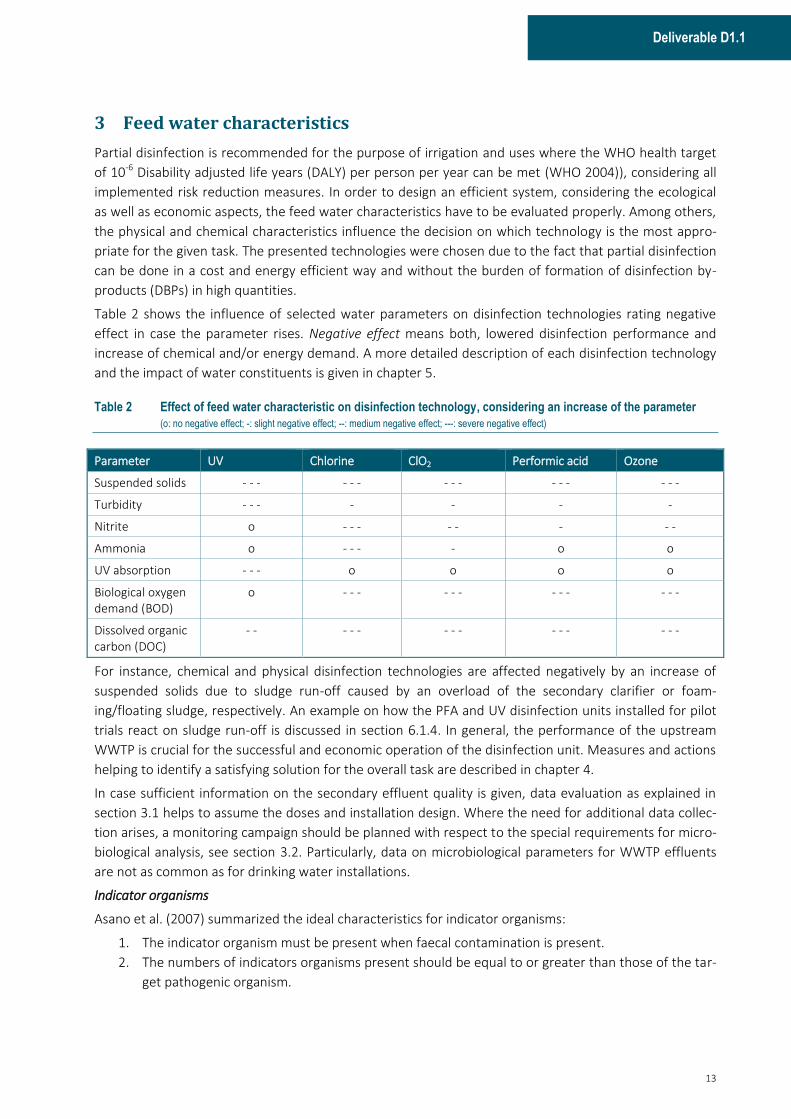
Table 2 shows the influence of selected water parameters on disinfection technologies rating negative
effect in case the parameter rises. Negative effect means both, lowered disinfection performance and
increase of chemical and/or energy demand. A more detailed description of each disinfection technology
and the impact of water constituents is given in chapter 5.
Table 2 Effect of feed water characteristic on disinfection technology, considering an increase of the parameter
(o: no negative effect; -: slight negative effect; --: medium negative effect; ---: severe negative effect)
Parameter UV Chlorine ClO2 Performic acid Ozone
Suspended solids - - - - - - - - - - - - - - -
Turbidity - - - - - - -
Nitrite o - - - - - - - -
Ammonia o - - - - o o
UV absorption - - - o o o o
Biological oxygen demand (BOD)
o - - - - - - - - - - - -
Dissolved organic carbon (DOC)
- - - - - - - - - - - - - -
For instance, chemical and physical disinfection technologies are affected negatively by an increase of
suspended solids due to sludge run-off caused by an overload of the secondary clarifier or foam-
ing/floating sludge, respectively. An example on how the PFA and UV disinfection units installed for pilot
trials react on sludge run-off is discussed in section 6.1.4. In general, the performance of the upstream
WWTP is crucial for the successful and economic operation of the disinfection unit. Measures and actions
helping to identify a satisfying solution for the overall task are described in chapter 4.
In case sufficient information on the secondary effluent quality is given, data evaluation as explained in
section 3.1 helps to assume the doses and installation design. Where the need for additional data collec-
tion arises, a monitoring campaign should be planned with respect to the special requirements for micro-
biological analysis, see section 3.2. Particularly, data on microbiological parameters for WWTP effluents
are not as common as for drinking water installations.
Indicator organisms
Asano et al. (2007) summarized the ideal characteristics for indicator organisms:
1. The indicator organism must be present when faecal contamination is present.
2. The numbers of indicators organisms present should be equal to or greater than those of the tar-
get pathogenic organism.

14
DEMOWARE GA No. 619040
3. The indicator organism must exhibit the same or greater survival characteristics in treatment
processes and the environment as the target pathogen organism for which it is a surrogate.
4. The indicator organism must not reproduce outside of the host organism (i.e. the culturing pro-
cedure itself should not produce a serious health threat to laboratory workers).
5. The isolation and quantification of the indicator organism must be faster than that of the target
pathogen (i.e., the procedure must be less expensive and it must be easier to cultivate the indica-
tor organisms than the target pathogen).
6. The organism should be a member of the intestinal microflora of warm-blooded animals.
Most of the regulations for water reuse in practice worldwide define the indicator organisms to be meas-
ured for permission, see Table 24 and Table 25.
3.1 WWTP data evaluation
Most WWTPs carry out a continuous monitoring of chemical and physical water characteristics for the
feed and the effluent, due to legal obligations and as an internal control for the plant operation. When
available, these measurements should be used. Data covering one or more years help to identify seasonal
variations and shall be evaluated accordingly. For instance, suspended solids as well as transmission can
be affected in a negative way during transition times in spring and fall, due to temperature change and
consequently changes in the microbiological community. Additionally, the operation regime is adapted to
the season and might lead to adverse effluent quality. Therefore, it is necessary to design the disinfection
step with sufficient performance back-up for periods with altered water quality.
The water parameters are shown in graphs displaying a box-plot. Where possible, a timeline is also given,
in order to identify seasonal variations. Figure 2 shows an exemplary box-plot indicating the meaning of
the graphical elements. The box-plot displays the minimum and maximum (lower and upper end of
whisker), 25 / 50 (median) / 75 percentile (box) and the mean value (square).
25%
75%
50%
Max
Min
Sample
0
20
40
60
80
100
120
Sam
ple
val
ue
Mean
Figure 2 Example of box plot
3.1.1 WWTP Brunswick – Demoware pilot trials
The WWTP Brunswick is designed for 200,000 p.e. and equipped with biological phosphorus removal and
pre-denitrification. Four secondary clarifiers are operated and primary and excess sludge are digested

15
Deliverable D1.1
separately. The secondary effluent is used for irrigation either at the nearby meander for polishing or at
local farms enhancing yields due to water and nutrient supply.
Physical and chemical parameters
During the pilot trials in autumn 2014, an intensive monitoring campaign was carried out and the results
on physical and chemical measurements of the secondary effluent can be used for designing the disinfec-
tion step. Most of these parameters are monitored due to regulatory demands and can be used to as-
sume the effect on different disinfection technologies. Other parameters were added, e.g. ultraviolet
absorption (UV) and transmittance in order to gain all parameters affecting disinfection technologies.
Following methods were used:
· pH-value DIN EN 38404 C5
· Temperature DIN 38404-C04
· conductivity DIN EN 27888 C8
· COD, filtered DIN ISO 15705 H45
· COD homogenized DIN ISO 15705 H45
· DOC DIN EN 1484 H3
· Suspended solids DIN EN 872 H33
· AOX DIN EN 1485 H14
· Turbidity Online turbidity probe
· Ultraviolet Absorption (UVA) DIN 38404-C03
· Transmittance DIN 38404-C03
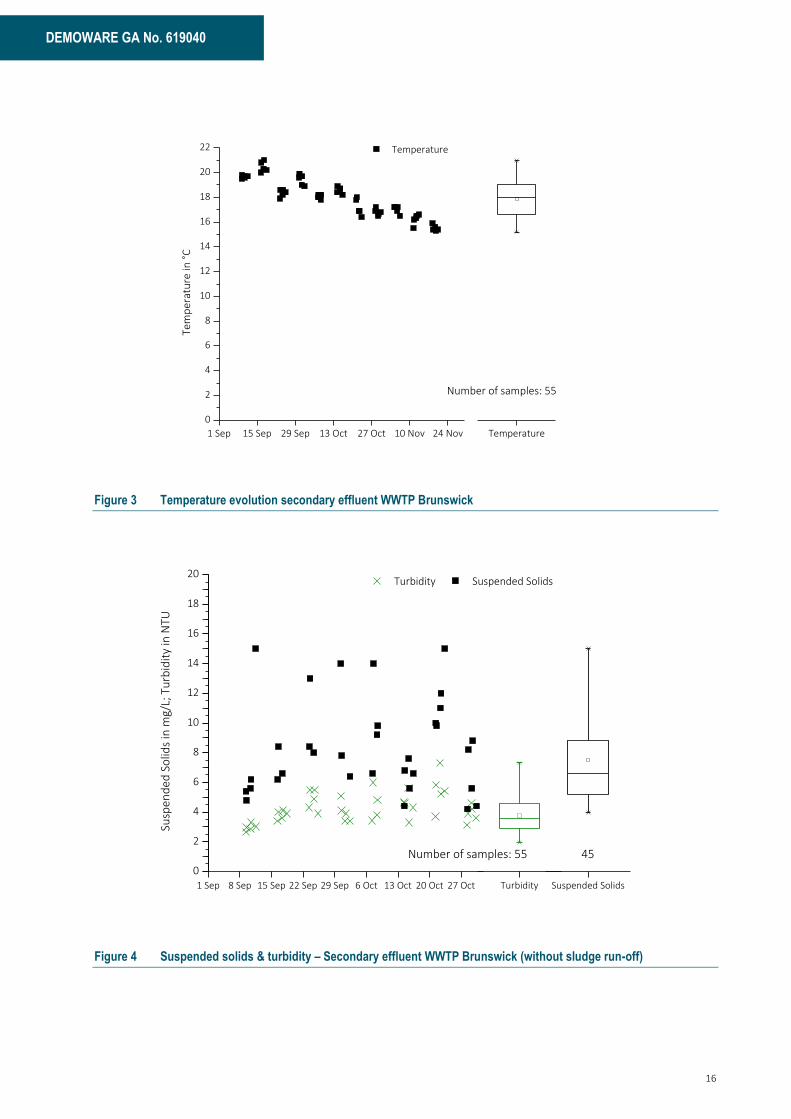
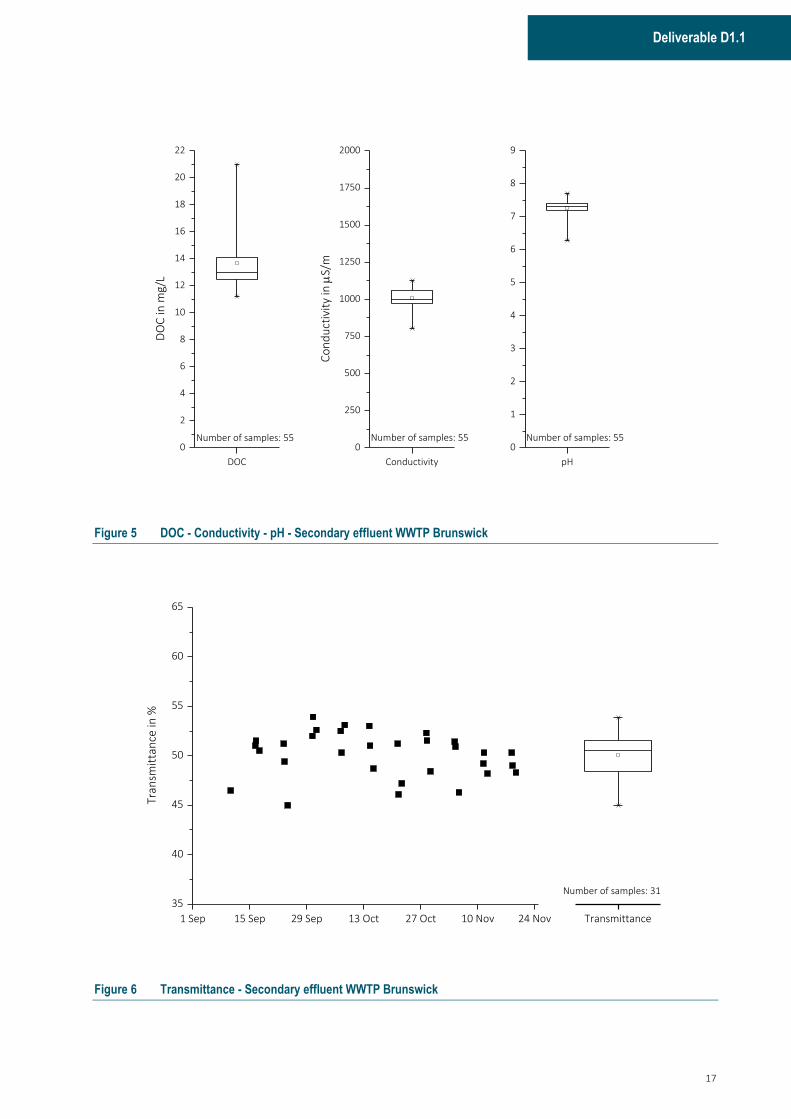
In Figure 3 to Figure 6 the physical and chemical water parameters are presented for undisturbed opera-
tion. The incident of sludge run-off is discussed separately, see section 6.1.4.
The temperature fell from 21 °C to approx. 16 °C as expected towards winter season. Suspended solids
covered a range of 4 – 15 mg/L with a median of 6.6 mg/L and turbidity lied between 1.9 and 7.3 NTU,
with a median of 3.6. These values are in the expected range for secondary effluent and indicate that the
upstream WWTP works within its designated ranges. It can also be concluded that this secondary effluent
is generally suitable for the common disinfection technologies. The impact of wastewater constituents on
the disinfection technologies suitable for partial disinfection is listed for each technology in chapter 5.
When considering a disinfection step using chlorine (Cl2), ammonia concentrations have to be considered,
because depending on the chlorine agent to be used, present ammonia can lead to nitrosamines, which
are suspected to be carcinogenic and which will increase the chlorine demand. During the pilot trials, the
median concentration of ammonia-nitrogen (NH4-N) was 4.4 mgN/L. Since ClO2 does not react with Am-
monia this chlorination agent was chosen for the economic evaluation presented in chapter 8.
16
DEMOWARE GA No. 619040
1 Sep 15 Sep 29 Sep 13 Oct 27 Oct 10 Nov 24 Nov
0
2
4
6
8
10
12
14
16
18
20
22
Temperature
Temperature
Tem
per
atu
re in
°C
Number of samples: 55
Figure 3 Temperature evolution secondary effluent WWTP Brunswick
1 Sep 8 Sep 15 Sep 22 Sep 29 Sep 6 Oct 13 Oct 20 Oct 27 Oct
0
2
4
6
8
10
12
14
16
18
20 Turbidity
Susp
end
ed S
olid
s in
mg/
L; T
urb
idit
y in
NTU
Turbidity Suspended Solids
Suspended Solids
Number of samples: 55 45
Figure 4 Suspended solids & turbidity – Secondary effluent WWTP Brunswick (without sludge run-off)
17
Deliverable D1.1
Conductivity
0
250
500
750
1000
1250
1500
1750
2000
Co
nd
uct
ivit
y in
S/
m
DOC
0
2
4
6
8
10
12
14
16
18
20
22
Number of samples: 55Number of samples: 55
DO
C in
mg/
L
Number of samples: 55
pH
0
1
2
3
4
5
6
7
8
9
Figure 5 DOC - Conductivity - pH - Secondary effluent WWTP Brunswick
1 Sep 15 Sep 29 Sep 13 Oct 27 Oct 10 Nov 24 Nov
35
40
45
50
55
60
65
Transmittance
Tran
smit
tan
ce in
%
Number of samples: 31
Figure 6 Transmittance - Secondary effluent WWTP Brunswick
18
DEMOWARE GA No. 619040
Table 3 Summary of physico-chemical parameters of WWTP Brunswick
Parameter Unit Min Max Median N2
Temperature °C 15.2 21.0 18.1 58
pH - 6.3 7.7 7.3 58
Conductivity µS/cm 796 1,130 1,002 58
Turbidity NTU 1.9 537 3.6 58
Suspended Solids
mg/L 4.0 770.0 6.6 58
Ultraviolet Absorption
(UVA)
1/m 25.4 31.5 27.4 34
Specific UVA (SUVA)
L/mgm 1.2 2.5 2.1 34
Transmittance % 45.0 53.9 50.5 31
COD mg/L 21 840 35 58
COD fil mg/L 15.0 38.0 29.5 57
DOC mg/L 10.0 21.0 13.0 58
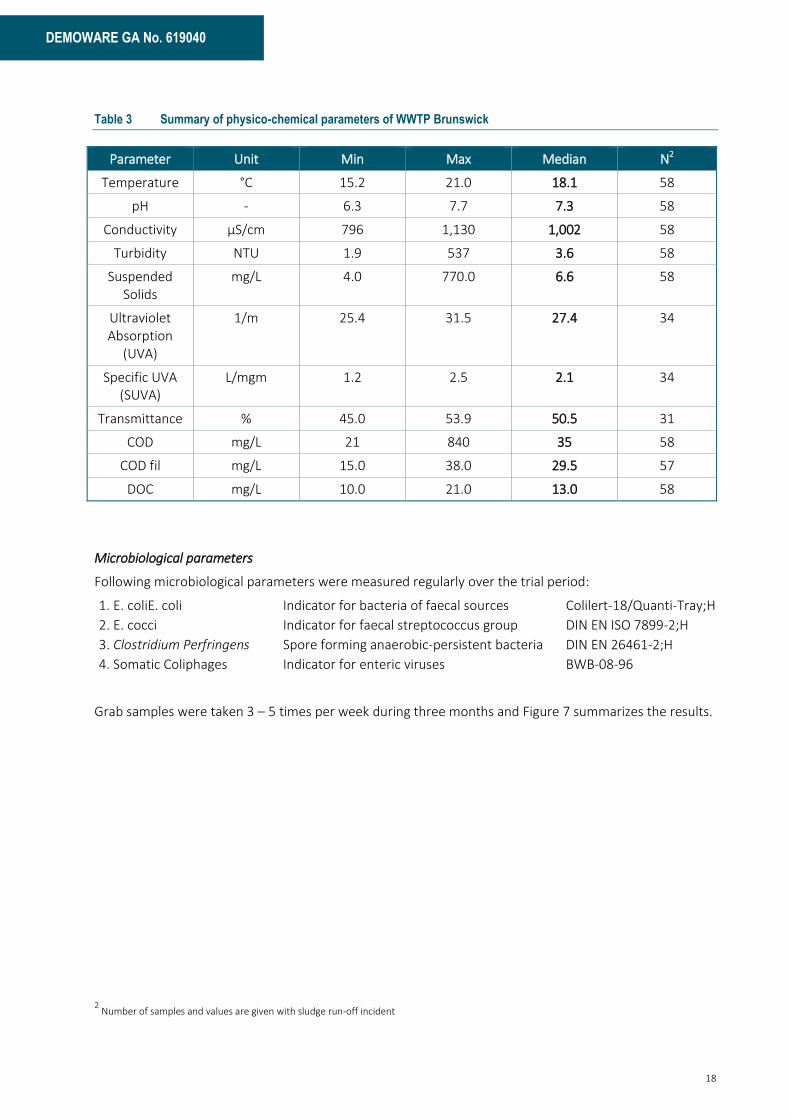
Microbiological parameters
Following microbiological parameters were measured regularly over the trial period:
1. E. coliE. coli Indicator for bacteria of faecal sources Colilert-18/Quanti-Tray;H
2. E. cocci Indicator for faecal streptococcus group DIN EN ISO 7899-2;H
3. Clostridium Perfringens Spore forming anaerobic-persistent bacteria DIN EN 26461-2;H
4. Somatic Coliphages Indicator for enteric viruses BWB-08-96
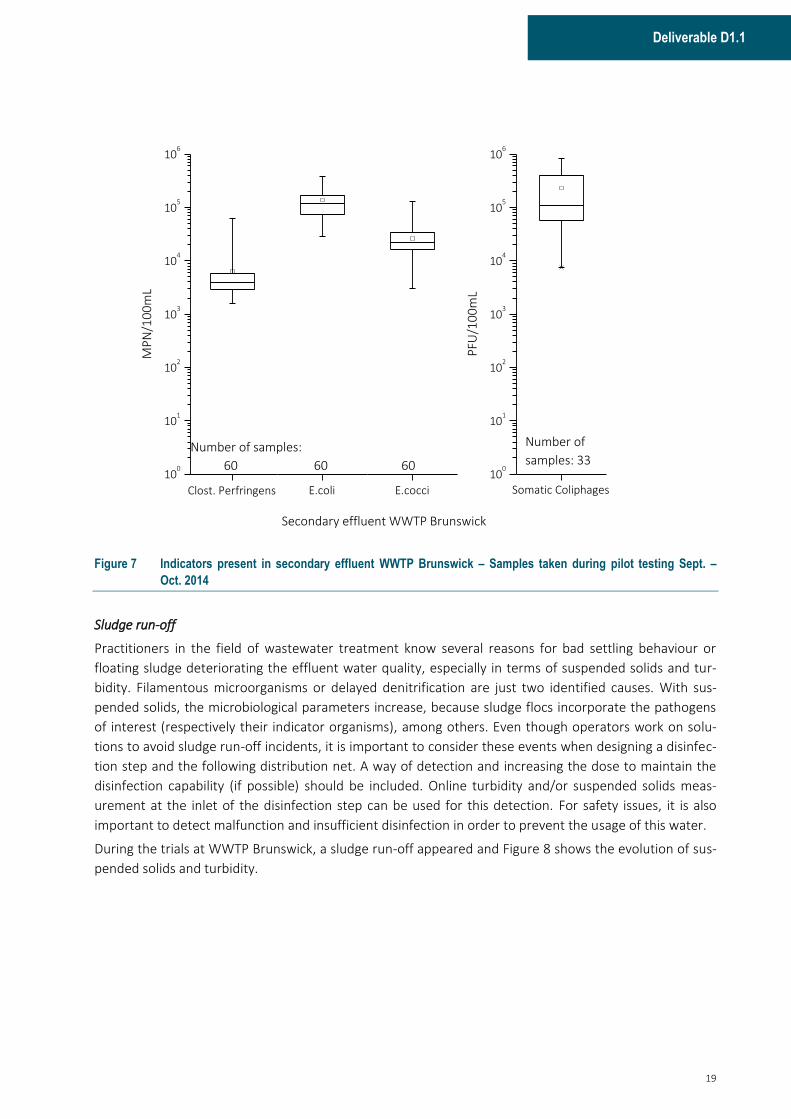
Grab samples were taken 3 – 5 times per week during three months and Figure 7 summarizes the results.
2 Number of samples and values are given with sludge run-off incident
19
Deliverable D1.1
100
101
102
103
104
105
106
Number of samples:
60 60 60
MP
N/1
00
mL
Number of
samples: 33
Somatic ColiphagesE.coli E.cocci
Secondary effluent WWTP Brunswick
Clost. Perfringens
100
101
102
103
104
105
106
PFU
/10
0m
L
Figure 7 Indicators present in secondary effluent WWTP Brunswick – Samples taken during pilot testing Sept. –
Oct. 2014
Sludge run-off
Practitioners in the field of wastewater treatment know several reasons for bad settling behaviour or
floating sludge deteriorating the effluent water quality, especially in terms of suspended solids and tur-
bidity. Filamentous microorganisms or delayed denitrification are just two identified causes. With sus-
pended solids, the microbiological parameters increase, because sludge flocs incorporate the pathogens
of interest (respectively their indicator organisms), among others. Even though operators work on solu-
tions to avoid sludge run-off incidents, it is important to consider these events when designing a disinfec-
tion step and the following distribution net. A way of detection and increasing the dose to maintain the
disinfection capability (if possible) should be included. Online turbidity and/or suspended solids meas-
urement at the inlet of the disinfection step can be used for this detection. For safety issues, it is also
important to detect malfunction and insufficient disinfection in order to prevent the usage of this water.
During the trials at WWTP Brunswick, a sludge run-off appeared and Figure 8 shows the evolution of sus-
pended solids and turbidity.
20
DEMOWARE GA No. 619040
08:00 16:00 00:00 08:00 16:00
0
100
200
300
400
500
600
700
800
08:00 16:00 00:00 08:00 16:00
0
100
200
300
400
500
600
700
800Su
spen
ded
so
lids
in m
g/L
TurbiditySuspended solids
Turb
idit
y in
NTU
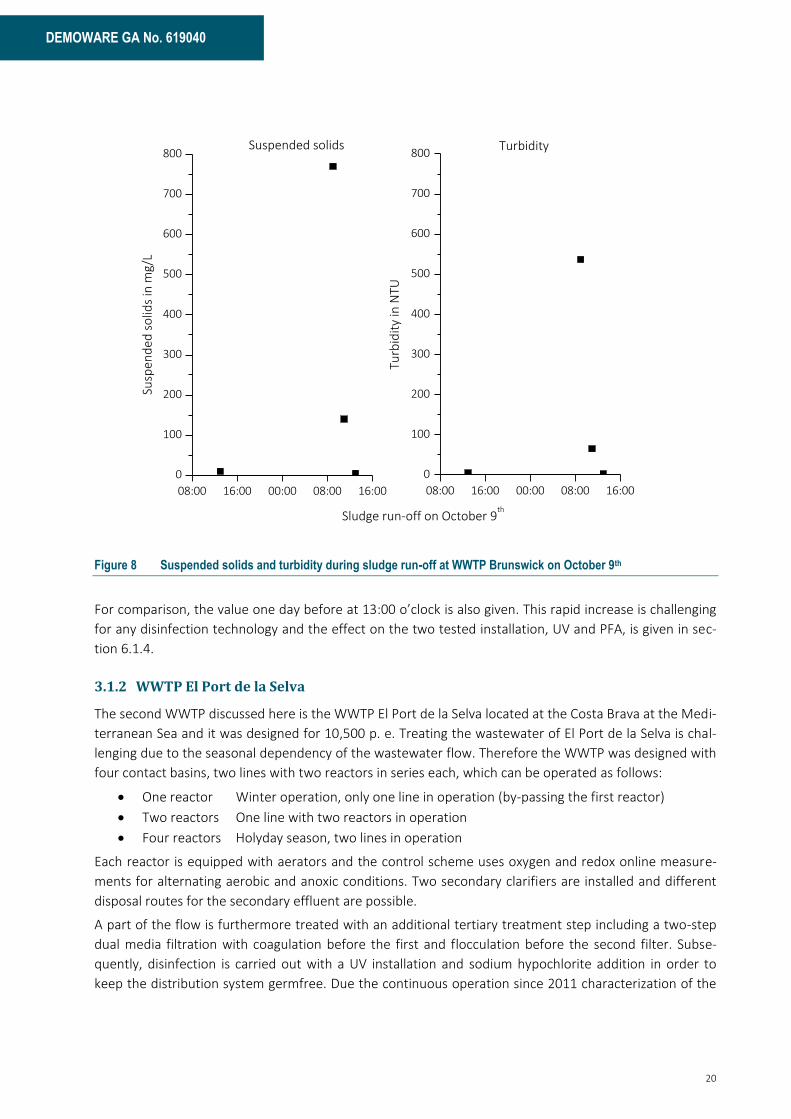
Sludge run-off on October 9th
Figure 8 Suspended solids and turbidity during sludge run-off at WWTP Brunswick on October 9th
For comparison, the value one day before at 13:00 o’clock is also given. This rapid increase is challenging
for any disinfection technology and the effect on the two tested installation, UV and PFA, is given in sec-
tion 6.1.4.
3.1.2 WWTP El Port de la Selva
The second WWTP discussed here is the WWTP El Port de la Selva located at the Costa Brava at the Medi-
terranean Sea and it was designed for 10,500 p. e. Treating the wastewater of El Port de la Selva is chal-
lenging due to the seasonal dependency of the wastewater flow. Therefore the WWTP was designed with
four contact basins, two lines with two reactors in series each, which can be operated as follows:
· One reactor Winter operation, only one line in operation (by-passing the first reactor)
· Two reactors One line with two reactors in operation
· Four reactors Holyday season, two lines in operation
Each reactor is equipped with aerators and the control scheme uses oxygen and redox online measure-
ments for alternating aerobic and anoxic conditions. Two secondary clarifiers are installed and different
disposal routes for the secondary effluent are possible.
A part of the flow is furthermore treated with an additional tertiary treatment step including a two-step
dual media filtration with coagulation before the first and flocculation before the second filter. Subse-
quently, disinfection is carried out with a UV installation and sodium hypochlorite addition in order to
keep the distribution system germfree. Due the continuous operation since 2011 characterization of the
21
Deliverable D1.1
secondary effluent based on regular measurements is possible. The samples were taken as grab samples
once or twice a week.
In contrast to the pilot scale investigation at WWTP Brunswick, the motivation at WWTP El Port de la Sel-
va was to optimize an existing tertiary treatment step and downstream UV disinfection. The current wa-
ter reuse application includes the usage of the treated water for street cleaning and non-agricultural irri-
gation. In order to reduce water scarcity and to recharge ground water sources, indirect potable reuse is
planned. An infiltration pond is being constructed and the tertiary effluent needs to meet more stringent
requirements given by RD-1620 (2007):
· < 2 NTU (required for private irrigation)
· < 35 mg/L suspended solids (required for aquifer recharge)
· < 10 mg/L Nitrogen-N for 90 % of time – No samples above 15 mg/L Nitrogen-N
· < 1,000 E. coli/100mL
These goals have to be achieved by upstream process adaptation, e.g. nitrogen removal, as well as opti-
mization of the tertiary treatment step, e.g. turbidity.
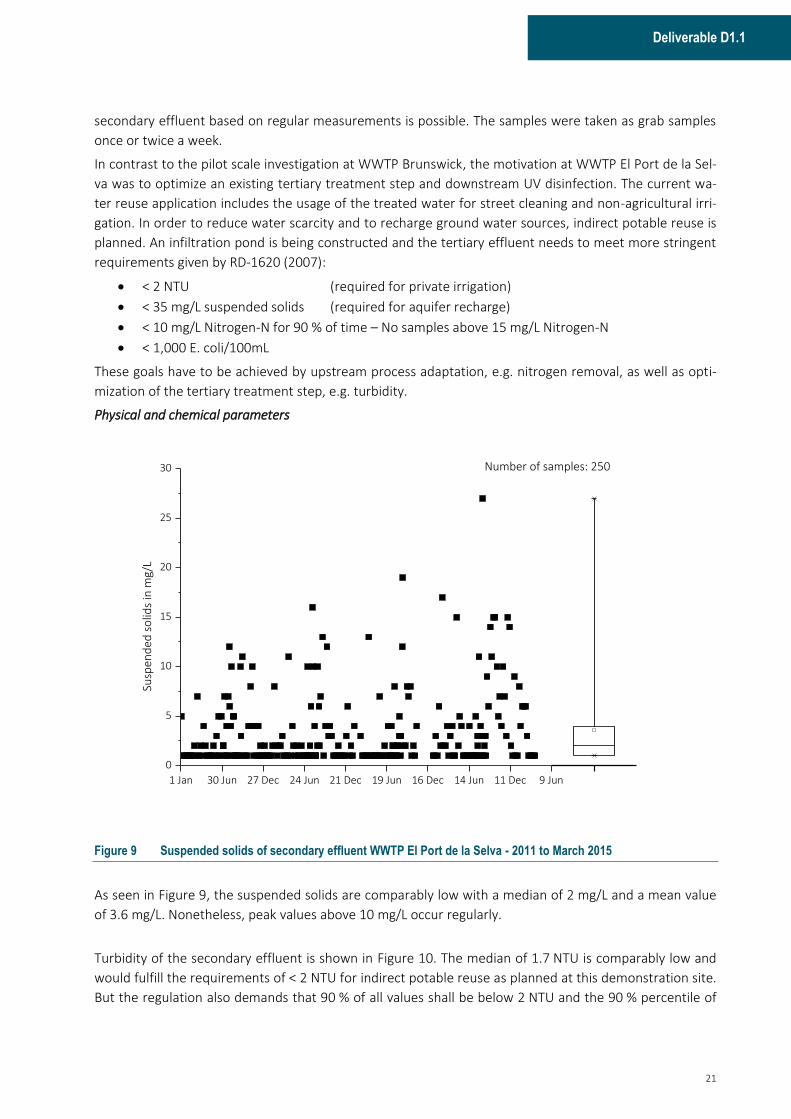
Physical and chemical parameters
1 Jan 30 Jun 27 Dec 24 Jun 21 Dec 19 Jun 16 Dec 14 Jun 11 Dec 9 Jun
0
5
10
15
20
25
30
Susp
end
ed s
olid
s in
mg/
L
Number of samples: 250
Figure 9 Suspended solids of secondary effluent WWTP El Port de la Selva - 2011 to March 2015
As seen in Figure 9, the suspended solids are comparably low with a median of 2 mg/L and a mean value
of 3.6 mg/L. Nonetheless, peak values above 10 mg/L occur regularly.
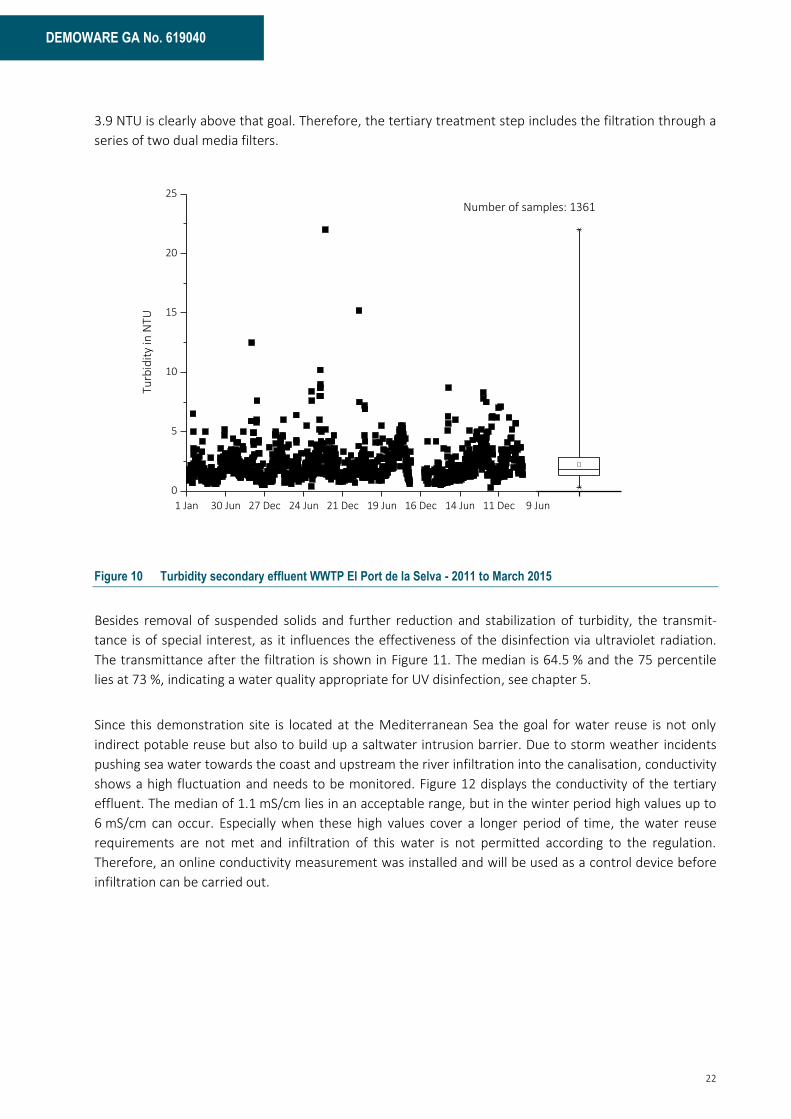
Turbidity of the secondary effluent is shown in Figure 10. The median of 1.7 NTU is comparably low and
would fulfill the requirements of < 2 NTU for indirect potable reuse as planned at this demonstration site.
But the regulation also demands that 90 % of all values shall be below 2 NTU and the 90 % percentile of
22
DEMOWARE GA No. 619040
3.9 NTU is clearly above that goal. Therefore, the tertiary treatment step includes the filtration through a
series of two dual media filters.
1 Jan 30 Jun 27 Dec 24 Jun 21 Dec 19 Jun 16 Dec 14 Jun 11 Dec 9 Jun
0
5
10
15
20
25
Turb
idit
y in
NTU
Number of samples: 1361
Figure 10 Turbidity secondary effluent WWTP El Port de la Selva - 2011 to March 2015
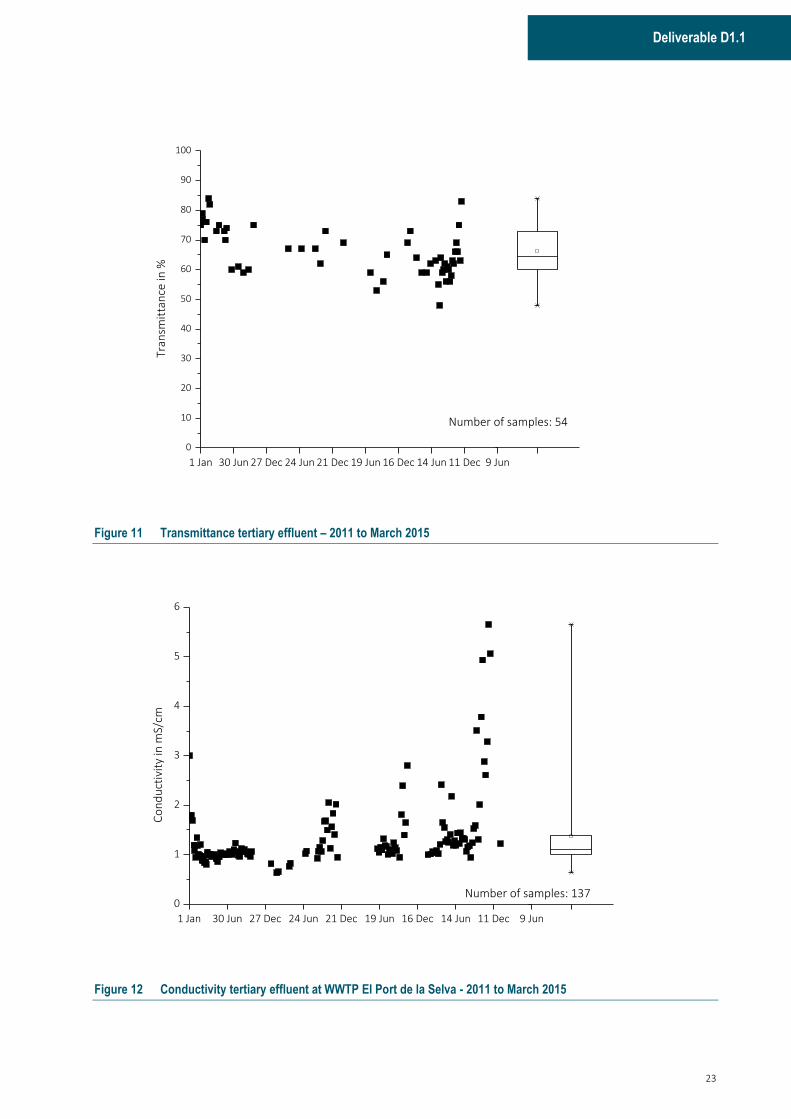
Besides removal of suspended solids and further reduction and stabilization of turbidity, the transmit-
tance is of special interest, as it influences the effectiveness of the disinfection via ultraviolet radiation.
The transmittance after the filtration is shown in Figure 11. The median is 64.5 % and the 75 percentile
lies at 73 %, indicating a water quality appropriate for UV disinfection, see chapter 5.
Since this demonstration site is located at the Mediterranean Sea the goal for water reuse is not only
indirect potable reuse but also to build up a saltwater intrusion barrier. Due to storm weather incidents
pushing sea water towards the coast and upstream the river infiltration into the canalisation, conductivity
shows a high fluctuation and needs to be monitored. Figure 12 displays the conductivity of the tertiary
effluent. The median of 1.1 mS/cm lies in an acceptable range, but in the winter period high values up to
6 mS/cm can occur. Especially when these high values cover a longer period of time, the water reuse
requirements are not met and infiltration of this water is not permitted according to the regulation.
Therefore, an online conductivity measurement was installed and will be used as a control device before
infiltration can be carried out.
23
Deliverable D1.1
1 Jan 30 Jun 27 Dec 24 Jun 21 Dec 19 Jun 16 Dec 14 Jun 11 Dec 9 Jun
0
10
20
30
40
50
60
70
80
90
100Tr
ansm
itta
nce
in %
Number of samples: 54
Figure 11 Transmittance tertiary effluent – 2011 to March 2015
1 Jan 30 Jun 27 Dec 24 Jun 21 Dec 19 Jun 16 Dec 14 Jun 11 Dec 9 Jun
0
1
2
3
4
5
6
Co
nd
uct
ivit
y in
mS/
cm
Number of samples: 137
Figure 12 Conductivity tertiary effluent at WWTP El Port de la Selva - 2011 to March 2015

24
DEMOWARE GA No. 619040
Microbiological parameters
At WWTP El Port de la Selva, four microbiological indicator organisms are measured on a regular basis:
· E. coli
· Sulphite-reducing clostridia (SRC)
· Aerobic bacteria
· Somatic coliphages
In Figure 13 the box-plots for these indicators are given and the obtained values can be compared to the
secondary effluent of WWTP Brunswick, see section 3.1.3.
E.coli SRC Aerobic bacteria Somatic coliphages10
0
101
102
103
104
105
106
107
CFU
/10
0m
L
Number of samples:
118 56 52 42
Figure 13 Pathogens present in secondary effluent WWTP El Port de la Selva – Samples taken 01/2011 to 12/2015
25
Deliverable D1.1
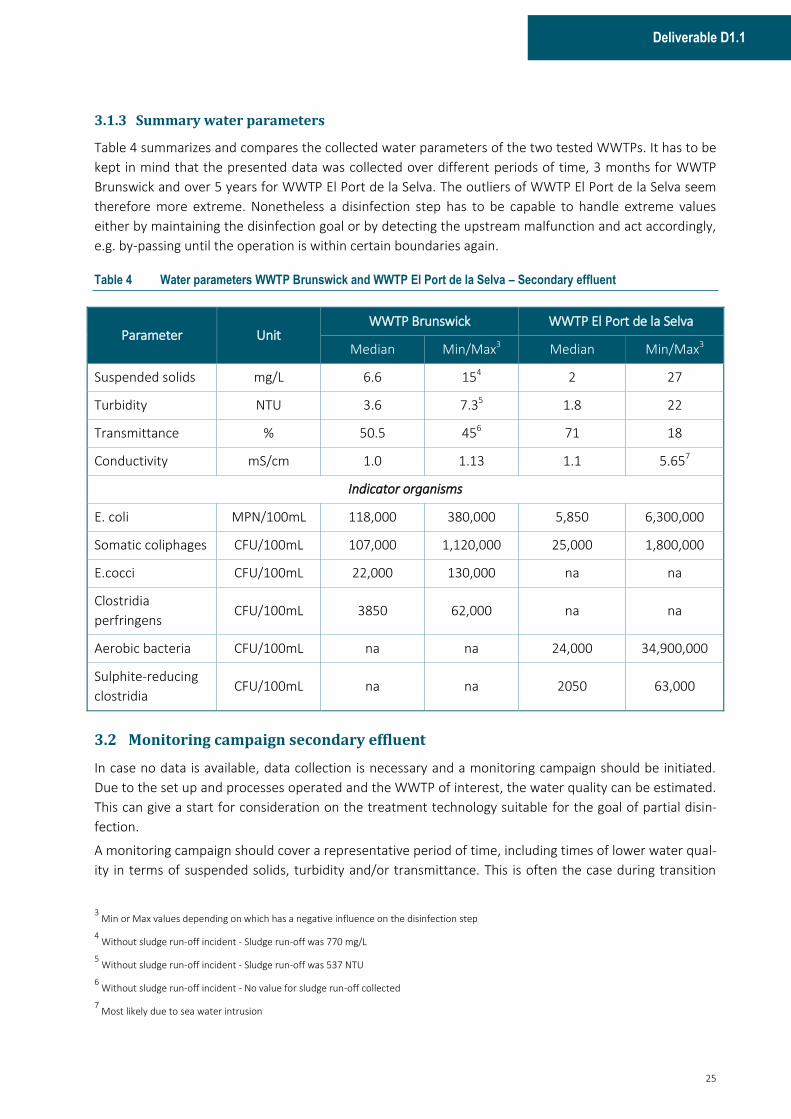
3.1.3 Summary water parameters
Table 4 summarizes and compares the collected water parameters of the two tested WWTPs. It has to be
kept in mind that the presented data was collected over different periods of time, 3 months for WWTP
Brunswick and over 5 years for WWTP El Port de la Selva. The outliers of WWTP El Port de la Selva seem
therefore more extreme. Nonetheless a disinfection step has to be capable to handle extreme values
either by maintaining the disinfection goal or by detecting the upstream malfunction and act accordingly,
e.g. by-passing until the operation is within certain boundaries again.
Table 4 Water parameters WWTP Brunswick and WWTP El Port de la Selva – Secondary effluent
Parameter Unit WWTP Brunswick WWTP El Port de la Selva
Median Min/Max3 Median Min/Max3
Suspended solids mg/L 6.6 154 2 27
Turbidity NTU 3.6 7.35 1.8 22
Transmittance % 50.5 456 71 18
Conductivity mS/cm 1.0 1.13 1.1 5.657
Indicator organisms
E. coli MPN/100mL 118,000 380,000 5,850 6,300,000
Somatic coliphages CFU/100mL 107,000 1,120,000 25,000 1,800,000
E.cocci CFU/100mL 22,000 130,000 na na
Clostridia
perfringens CFU/100mL 3850 62,000 na na
Aerobic bacteria CFU/100mL na na 24,000 34,900,000
Sulphite-reducing
clostridia CFU/100mL na na 2050 63,000
3.2 Monitoring campaign secondary effluent
In case no data is available, data collection is necessary and a monitoring campaign should be initiated.
Due to the set up and processes operated and the WWTP of interest, the water quality can be estimated.
This can give a start for consideration on the treatment technology suitable for the goal of partial disin-
fection.
A monitoring campaign should cover a representative period of time, including times of lower water qual-
ity in terms of suspended solids, turbidity and/or transmittance. This is often the case during transition
3 Min or Max values depending on which has a negative influence on the disinfection step
4 Without sludge run-off incident - Sludge run-off was 770 mg/L
5 Without sludge run-off incident - Sludge run-off was 537 NTU
6 Without sludge run-off incident - No value for sludge run-off collected
7 Most likely due to sea water intrusion

26
DEMOWARE GA No. 619040
times in spring or autumn, when changing temperatures and adaptation of the biological operation, e.g.
change of sludge age, takes place.
Besides the physical and chemical water parameters, the indicator organisms are of special interest.
Therefore, the planned reuse application and the corresponding local regulations have to be considered
when planning the sampling and analysis campaign. Sampling can be done either with grab-, time-
proportional or volume-proportional samples. Since the handling of microbiological samples is more de-
manding in terms of storage temperature and time, grab samples often give more precise and sufficient
results. In cases where a load has to be calculated volume-proportional sampling is mandatory. The fol-
lowing aspects need to be considered before the sampling campaign is planned:
· Sampling points
Is the sampling point representative? Is complete mixing given? In case several treatment trains are
operated, is it useful to measure each treatment train? Is it possible to withdraw samples without
contaminating the sample? Is it helpful to measure the disinfection efficiency of the upstream treat-
ment process?
· Sample volume
Sample volume should be sufficient for the tests planned, but easy to handle. Usually sterilized bot-
tles of 250 mL can be used.
· Sample temperature
Cooling to 4°C should be done directly after sampling; at this temperature, biological activity is hal-
tered to a minimum and with respect to concentrations of indicator organisms neither growth nor
decay falsifies the analysis. On the other hand freezing the samples is only permitted when no effect
on the measurement method or the indicator organism is expected.
· Transport/storage time
In order to minimize effects of growth and decay the samples shall not be stored and transported for
more than 24h. Additionally exposure to light should be minimized.
· Water quality parameters
What should be measured additionally to the pathogens? As discussed before, suspended solids, tur-
bidity, transmittance or ammonia can affect a disinfection step adversely. Scaling propensities should
be monitored, because this can severely impact the operation of UV disinfection installations.
· Indicator organisms
Which indicator organisms should be measured? Local regulations and guidelines have to be consid-
ered here. Analysis of microbiological parameters should be done in a certified laboratory and the
measurement method should be evaluated and discussed prior.
4 Upstream process evaluation / optimization
As discussed before, the water quality influences the disinfection step to a great extent and can cause
additional costs due to higher chemical doses and energy costs see tables in chapter 5. Therefore it is
necessary to evaluate the performance of the upstream processes. A review can help to decide whether
upstream optimization or adaptation of the disinfection technology is more efficient. Expectable water
qualities according to the prior treatment are summarized in Table 5.

27
Deliverable D1.1
Table 5 Expected water quality according to the prior treatment adapted from Asano et al. (2007)
Process Total Suspended solids Turbidity Ammonia-N
mg/L NTU mgN/L
Primary effluent 131 88 21
Secondary effluent 9.8 14 5 - 10
Tertiary effluent 1.3 0.5 5 - 10
Reddy & Pagilla (2009) summarized in detail the review process in order to identify and optimize existing
wastewater treatment plants. Data evaluation and monitoring of the peak flows and loads respectively
are of special interest and a desktop study reviewing the design assumptions is recommended as a first
step. Afterwards, the current treatment facility should be evaluated identifying different parameters for
each treatment step e.g. Total Suspended Solids (TSS), Total Kjeldahl Nitrogen (TKN), Biological Oxygen
Demand (BOD). In order to minimize efforts in terms of chemicals and/or energy, partial disinfection is
mostly located at the end of the treatment train and therefore sludge parameters are of special interest.
Bad settling behaviour or a hydraulic overload of the secondary clarifier results in high amounts of sus-
pended solids and correspond water qualities and will affect the disinfection in a negative way.
This chapter is a brief summary what should be looked at when upgrading an existing WWTP with a disin-
fection step in order to decide for a cost effective system. It can be more reasonable to optimize the
WWTP operation and install a smaller disinfection step than sizing the disinfection step according to low-
er water quality.
The following key factors should be considered when troubleshooting an existing plant:
· Denitrification
Incomplete denitrification leads to build up of small gas bubbles in the secondary settling tank and
consequently to flotation.
· High Sludge blankets
A high sludge blanket may lead to high suspended solids concentrations in the secondary effluent.
The sludge blanket is determined by the settling behaviour of mixed liquor, influent flow rate and re-
turn activated sludge flow rate. When measuring the flows it should be noted that each settling tank
has to be evaluated separately.
· Ratio of dissolved suspended solids (DSS) and flocculated suspended solids (FSS)
Poor flocculation can cause high concentrations of suspended solids in the effluent and one measure
to identify the cause is the relationship between DSS and FSS. Reddy & Pagilla (2009) name following
reasons: Bioflocculation problem, excessive turbulence or not enough flocculation time, hydraulic
problems and high sludge blanket and the combination of bioflocculation and hydraulic problems.
· Phosphorus release
In nutrient removal activated sludge systems, a phosphorus release within the secondary settling tank
can lead to poor effluent qualities and therefore the phosphorus dynamic should be measured. Here,
an adaptation of the control regime, optimizing retention times and sludge blanket level can lead to
the desired effluent quality.
The sludge volume index (SVI) is a key characteristic for evaluating the overall process. This parameter
should therefore be measured in standard as well as in peak load conditions. Seasonal variations can be
28
DEMOWARE GA No. 619040
expected and adaptation of sludge age and solid retention times, respectively, will alter this value. There-
fore, the measurement should be carried out consistently throughout the whole year.
5 Selection of disinfection technology
Disinfection technologies can be classified according their mechanism: Chemical or physical. In the follow-
ing sections three chemical and two physical disinfection technologies are briefly discussed. Performic
acid (PFA) is presented, because this chemical disinfection agent does not form by-products in considera-
ble amounts. Chlorination is the most widely implemented disinfection technology, even though disinfec-
tion by-products (DBPs) are of increasing concern. Disinfection with chlorine-dioxide (ClO2) does not show
this drawback. Additionally, processes for on-site production of PFA and ClO2 improved recently, consid-
ering safety and economic aspects. Ozone is discussed, as water treatment with ozone can achieve two
major goals in wastewater treatment: disinfection and trace organic removal. Membrane filtration devel-
oped over the last decades and is worldwide installed for various purposes, e.g. membrane bioreactors
(MBRs) or pretreatment for desalination. No formation of DBPs besides the high effluent quality in terms
of suspended solids and turbidity are further reasons which make this technology attractive. Ultraviolet
(UV) radiation is described, due to the increasing number of installations as recent developments in pro-
duction and energy requirements lead to economical competitive installations.
More detailed descriptions on these technologies can be found in (Asano et al. 2007; Tchobanoglous et
al. 2014).
Disinfection in water and wastewater treatment processes can be attributed to one of the following
mechanisms (Asano et al. 2007):
· Damage to cell wall
· Alternation of cell permeability
· Alteration of the colloidal nature of the protoplasm
· Alteration of the organism DNA or RNA
· Inhibition of enzyme activity
5.1 Chemical disinfection technologies
All chemical disinfection technologies can be assessed through the Ct approach. Chick (1908) published
the relationship between the dose and the contact time referring to the lethality rate of the measured
micro-organisms. Watson (1908) used the data gathered by Chick and others to formulate the mathemat-
ical description of dose-contact time relationship, which is now known as the Chick-Watson law:
ln (𝑁
𝑁0) = ∆𝐶𝑊 𝐶𝑛 𝑡
‐ 𝑙𝑛 (𝑁
𝑁0) is the survival ratio for the microorganisms being killed
‐ ∆CW is the Chick-Watson coefficient of specific lethality
‐ C is the concentration of the disinfection
‐ t is the contact time
The Ct concept describes the relative effectiveness of a specific aqueous disinfectant against different
microorganisms under specific conditions. Using the Ct-approach disinfection technologies can be com-
pared and evaluated against each other.

29
Deliverable D1.1
Evaluation of the Ct values for one organism can be used to calculate the corresponding Ct values for
other organisms when a sufficient data base is given, assuming that the correlation of the LURs at a given
Ct between two organisms is the same. This can be necessary in cases where measurement of the organ-
isms of interest is impossible or very cost intensive. For the case study of Brunswick, this approach helped
to identify the necessary dose for the desired LUR of Rota- and Noroviruses without measuring these
organisms each time. This concept is further explained in section 6.1.
5.1.1 Chlorination and disinfection with chlorine dioxide
Chlorination is the most widespread disinfection technology and has been further developed for various
applications over the last decades. Following chlorine agents are used in wastewater disinfection:
· Free chlorine gas
· Sodium chloride
· Combined chloride
· Chlorine dioxide
Due to a long evolution of disinfection by chlorine, it is a-well established process and especially where
reliable and quick-in-action technologies are required, chlorine is often installed. Among others the pos-
sibility to provide residuals for a network-disinfection is often emphasized when discussing the possible
process steps. The main disadvantages of chlorine are, beside the laborious handling due to safety rea-
sons, the possible formation of by-products, e.g. trihalomethanes (THMs), N-nitrosodimethylamine
(NDMA), and haloacetic acids (HAAs). When chlorine dioxide is used, the formation of chlorite and chlo-
rate has to be kept in mind and a maximum concentration of chlorine needs to be respected (Asano et al.
2007; Crittenden et al. 2012). Where residual chlorine is unwanted, dechlorination has to be designed
and operated.
In order to form residual free chlorine breakpoint chlorination is necessary. The required chlorine dosage
depends on the water quality, because formation of chloro-organic and chloramine compounds takes
place. High concentrations of ammonia lead to higher formation of chloramines and consequently to a
higher chlorine demand.
Chlorine-dioxide (ClO2) has the advantage that no reaction with ammonia occurs and therefore is ade-
quate for secondary effluents with higher ammonia concentrations. It was also reported that no halogen-
ated organic compounds are formed in concerning concentrations, which is another advantage over oth-
er chlorine agents (Asano et al. 2007; DVGW 2008). On the other hand, due to the way of production by
reaction of chlorine-chlorite, chlorite-hydrochloric acid, or chlorite-peroxodisulfate reaction trace
amounts of chlorite and chlorate are present in the dosing solution and are further formed during reac-
tion in the water (DVGW 2008; Höll 2002). The formation of these DBPs can be limited by an effective
management of the production process. This includes severe monitoring of the precursors and the prod-
uct concentration. Due to these considerations ClO2, was chosen for the economic evaluation for the
disinfection step at WWTP Brunswick.
It has to be noted, that the disinfection mechanism imposed by ClO2 is due to oxidation and thus differs
from other chlorine agents.
Table 6 gives the impact of water constituents on the use of chlorine for disinfection.

30
DEMOWARE GA No. 619040
Table 6 Impact of wastewater constituent on the use of chlorine for wastewater disinfection, adapted from (Asano
et al. 2007) (without ClO2)
Water constituent Effect
BOD, COD, and TOC Organic compounds comprised within BOD and COD can increase the
chlorine demand. The degree of interferences depends on their func-
tional groups and their chemical structure
Natural organic matter (NOM) Reduces effectiveness of chlorine by forming chlorinated organic com-
pounds that are measured as chlorine residual, but are not effective
for disinfection
Oil and grease Can exert the chlorine demand
Total suspended solids (TSS) Shield embedded bacteria
Alkalinity No or minor effect
Hardness No or minor effect
Ammonia Combines with chlorine to form chloramines / Not for ClO2
Nitrite Oxidized by chlorine, formation of N-nitrosodimethylamine (NDMA)
Nitrate Chlorine dose is reduced because chloramines are not formed. Com-
plete nitrification may lead to the formation of NDMA due to the pres-
ence of free chlorine. Partial nitrification may lead to difficulties in
establishing the proper chlorine dose
Iron Oxidized by chlorine
Manganese Oxidized by chlorine
pH Affects distribution between hypochlorous acid and hypochlorite ion
Industrial discharges Depending on the constituents, may lead to a diurnal and seasonal
variations in the chlorine demand
5.1.2 Performic acid (PFA)
In contrast to chlorination, performic acid for disinfection is not widely established yet. The precursor of
this agent (peracetic-acid (PAA)) formed adsorbable organic halogens (AOX) in wastewater applications.
By switching to performic–acid, this disadvantage was no longer detected. In comparison to chlorination
and ozone, PFA leads to less harmful products. Formic acid, O2, CH4, CO2, and H2O are formed during the
reaction of performic acid with wastewater constituents, which are considered not toxic in the concentra-
tions typically encountered (Tchobanoglous et al. 2014).
Due to its instable nature, PFA has to be produced on-site by the reaction of formic acid and hydrogen-
peroxide. The company Kemira provides a reaction unit where performic acid is produced with a concen-
tration of approx. 13.5 % in the dosing solution. Due to the relatively low investment costs for the reactor
and the comparably easy implementation in existing wastewater treatment plants this process is more
and more considered as an alternative to ultraviolet radiation and chlorination. This process was tested
for different applications including advanced primary effluent, storm water treatment, and secondary

31
Deliverable D1.1
effluent (Falsanisi et al. 2008; Gehr et al. 2009; Karpova et al. 2013). A full scale installation is operated at
WWTP Ruhleben by Berliner Wasserbetriebe and the results are summarized by Gnirrs et al. (2015).
The pilot scale investigations at WWTP Brunswick therefore included performic acid, and the economic
comparison shown in section 8 highlights the key circumstances when this novel process is favourable.
Table 7 gives the impact of some water constituents present in wastewater to be disinfected on the use
of PFA. Because this novel process is not widely implemented yet, data on the impact of physical and
chemical water constituents is limited in comparison to the other disinfection technology.
Table 7 Impact of wastewater constituent on the use of PFA for wastewater disinfection
Water constituent Effect
BOD, COD, and TOC Organic compounds comprised within BOD and COD can increase the PFA
demand.
NOM Affects the rate of PFA decomposition and the demand
Oil and grease Can exert the PFA demand
TSS Shield embedded bacteria
5.1.3 Ozone
Ozone is widely used for disinfection in drinking water applications and becomes more and more an al-
ternative process in wastewater treatment. Among others the advantage of ozone is a high efficiency in
inactivating viruses, spores, cysts, and oocysts in comparison to chlorine (Asano et al. 2007). With lower
contact times required another practical advantage are the smaller reaction tanks. Since ozone is dis-
cussed for trace organic removal in water and wastewater treatment, a synergic effect can be deployed.
Drawbacks are the higher measurement and control efforts as well as the safety issues, e.g. handling, off-
gas treatment, ambient control probes. Due to its instability, ozone cannot be stored and transported and
the on-site production is energy consuming. In addition, ozone requires comparably high maintenance
and operation efforts which increase the operation costs.
For secondary effluent, the required doses given by Asano et al. (2007) are as follows:
· 3 - 5 mg/L → coliform count < 1,000 MPN/100mL
· 5 - 7 mg/L → coliform count < 200 MPN/100mL
· 12 – 16 mg/L → coliform count < 23 MPN/100mL
· 20 – 30 mg/L → coliform count < 2.2 MPN/100mL
These values shall serve as a rough estimation and further tests on site are required in order to precisely
estimate the required dosage for a specific application. The given dosages in mg/L do not account for the
high reactivity of ozone with organic compounds and can therefore be misleading. In order to be able to
evaluate ozonation processes at different locations, the DOC concentration shall be used for calculation
of the specific ozone dose. This calculation is further explained in chapter 6.3 where the disinfection re-
sults for the ozonation pilot trials are presented.
Table 8 gives the impact of wastewater constituents on the use of ozone for disinfection.
32
DEMOWARE GA No. 619040
Table 8 Impact of wastewater constituent on the use of ozone for wastewater disinfection, adapted from (Asano et
al. 2007)
Water constituent Effect
BOD, COD, and TOC Organic compounds comprised within the BOD and COD can increase the ozone
demand. The degree of interferences depends on their functional groups and
their chemical structure
NOM Affects the rate of ozone decomposition and the ozone demand
Oil and grease Can exert an ozone decomposition and increase the ozone demand
TSS Increase ozone demand and shielding of embedded bacteria
Alkalinity No or minor effect
Hardness No or minor effect
Ammonia No or minor effect, can react at high pH
Nitrite Oxidized by ozone
Nitrate Can reduce effectiveness of ozone
Iron Oxidized by ozone
Manganese Oxidized by ozone
pH Effects the rate of ozone decomposition
Industrial discharge Depending on the constituents, may lead to a diurnal and seasonal variations in
the ozone demand
Temperature Effects the rate of ozone decomposition
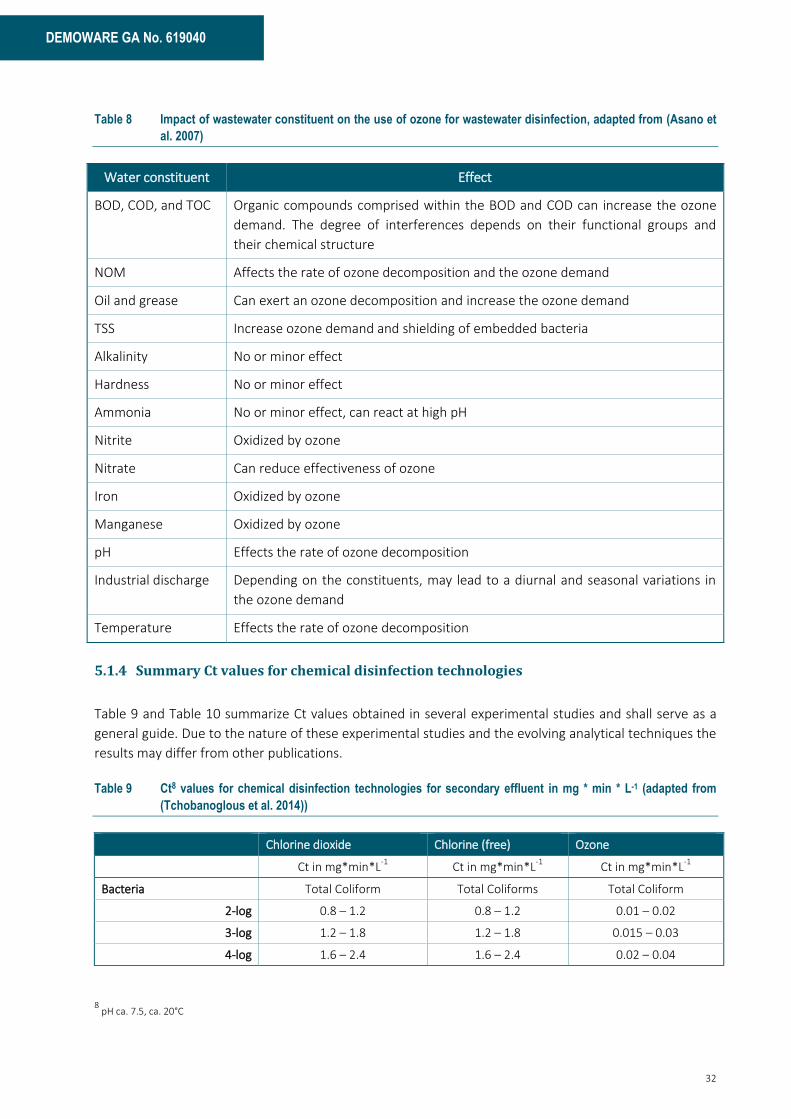
5.1.4 Summary Ct values for chemical disinfection technologies
Table 9 and Table 10 summarize Ct values obtained in several experimental studies and shall serve as a
general guide. Due to the nature of these experimental studies and the evolving analytical techniques the
results may differ from other publications.
Table 9 Ct8 values for chemical disinfection technologies for secondary effluent in mg * min * L-1 (adapted from
(Tchobanoglous et al. 2014))
Chlorine dioxide Chlorine (free) Ozone
Ct in mg*min*L-1
Ct in mg*min*L-1
Ct in mg*min*L-1
Bacteria Total Coliform Total Coliforms Total Coliform
2-log 0.8 – 1.2 0.8 – 1.2 0.01 – 0.02
3-log 1.2 – 1.8 1.2 – 1.8 0.015 – 0.03
4-log 1.6 – 2.4 1.6 – 2.4 0.02 – 0.04
8 pH ca. 7.5, ca. 20°C

33
Deliverable D1.1
Virus
2-log 5 – 5.5 1.5 – 1.8 0.25 – 0.3
3-log 9 – 10 2.2 – 2.6 0.35 – 0.45
4-log 12.5 – 13.5 3 – 3.5 0.5 – 0.6
Protozoan Cysts
2-log 235 – 260 45 – 55 8 – 8.5
3-log 700 – 100 70 – 80 1.43
Table 10 Examples of Ct values for 99 % (2-log) inactivation of various microorganisms by disinfectants1,2,3
Ct Values (mg * min * L-1
)
Microorganism Free
Chlorine Preformed Chloramine
Chlorine
Dioxide Ozone
Escherichia coli <1
(10-15oC)
95-180 0.4-0.75 0.02
Enteric viruses 5.4
(15oC)
428
(15oC)
(for viruses in general)
5.6 0.6
Giardia 60
(15oC)
1,000 (15oC) 17 0.5-0.6
Cryptosporidium4
7,200
(25oC)
7,200
(25oC) (4)
357
(15oC)
32
Notes: (1) Temperature is 5oC unless stated.
(2) pH is within range of 6-9 unless stated.
(3) See individual information sheets for references for quoted values
(4) The Ct value for Cryptosporidium is for a 1 log reduction
34
DEMOWARE GA No. 619040
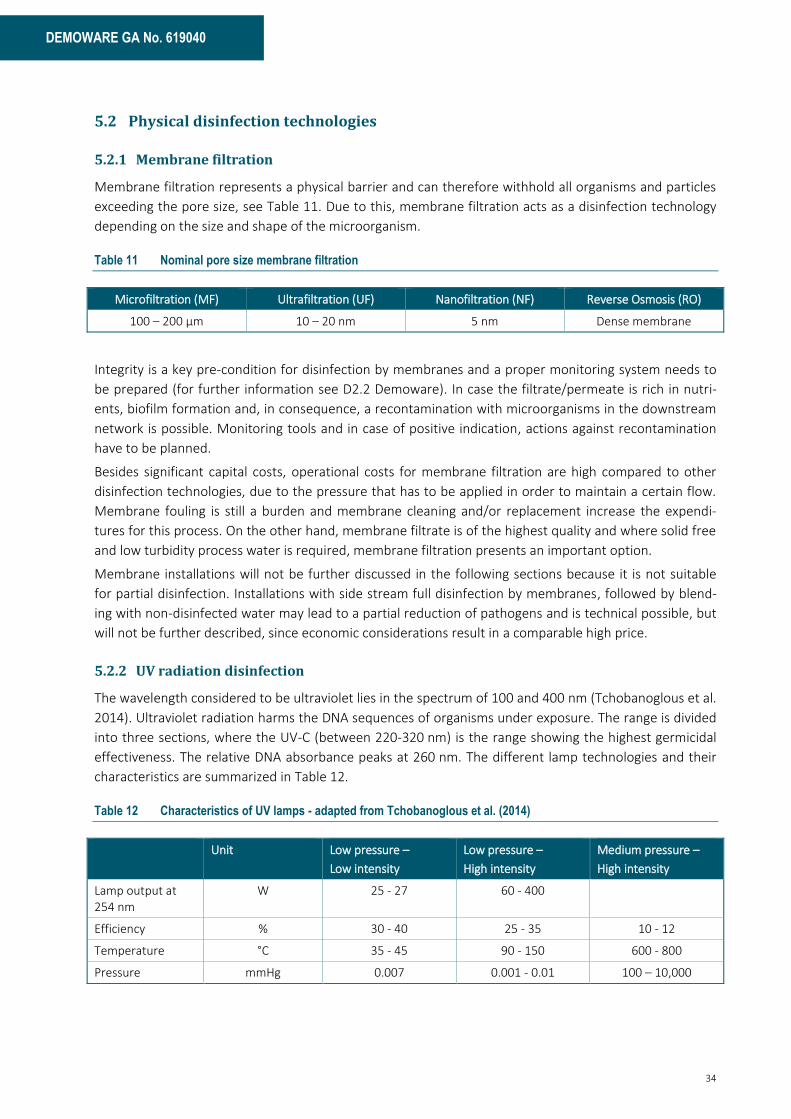
5.2 Physical disinfection technologies
5.2.1 Membrane filtration
Membrane filtration represents a physical barrier and can therefore withhold all organisms and particles
exceeding the pore size, see Table 11. Due to this, membrane filtration acts as a disinfection technology
depending on the size and shape of the microorganism.
Table 11 Nominal pore size membrane filtration
Microfiltration (MF) Ultrafiltration (UF) Nanofiltration (NF) Reverse Osmosis (RO)
100 – 200 µm 10 – 20 nm 5 nm Dense membrane
Integrity is a key pre-condition for disinfection by membranes and a proper monitoring system needs to
be prepared (for further information see D2.2 Demoware). In case the filtrate/permeate is rich in nutri-
ents, biofilm formation and, in consequence, a recontamination with microorganisms in the downstream
network is possible. Monitoring tools and in case of positive indication, actions against recontamination
have to be planned.
Besides significant capital costs, operational costs for membrane filtration are high compared to other
disinfection technologies, due to the pressure that has to be applied in order to maintain a certain flow.
Membrane fouling is still a burden and membrane cleaning and/or replacement increase the expendi-
tures for this process. On the other hand, membrane filtrate is of the highest quality and where solid free
and low turbidity process water is required, membrane filtration presents an important option.
Membrane installations will not be further discussed in the following sections because it is not suitable
for partial disinfection. Installations with side stream full disinfection by membranes, followed by blend-
ing with non-disinfected water may lead to a partial reduction of pathogens and is technical possible, but
will not be further described, since economic considerations result in a comparable high price.
5.2.2 UV radiation disinfection
The wavelength considered to be ultraviolet lies in the spectrum of 100 and 400 nm (Tchobanoglous et al.
2014). Ultraviolet radiation harms the DNA sequences of organisms under exposure. The range is divided
into three sections, where the UV-C (between 220-320 nm) is the range showing the highest germicidal
effectiveness. The relative DNA absorbance peaks at 260 nm. The different lamp technologies and their
characteristics are summarized in Table 12.
Table 12 Characteristics of UV lamps - adapted from Tchobanoglous et al. (2014)
Unit Low pressure –
Low intensity
Low pressure –
High intensity
Medium pressure –
High intensity
Lamp output at 254 nm
W 25 - 27 60 - 400
Efficiency % 30 - 40 25 - 35 10 - 12
Temperature °C 35 - 45 90 - 150 600 - 800
Pressure mmHg 0.007 0.001 - 0.01 100 – 10,000
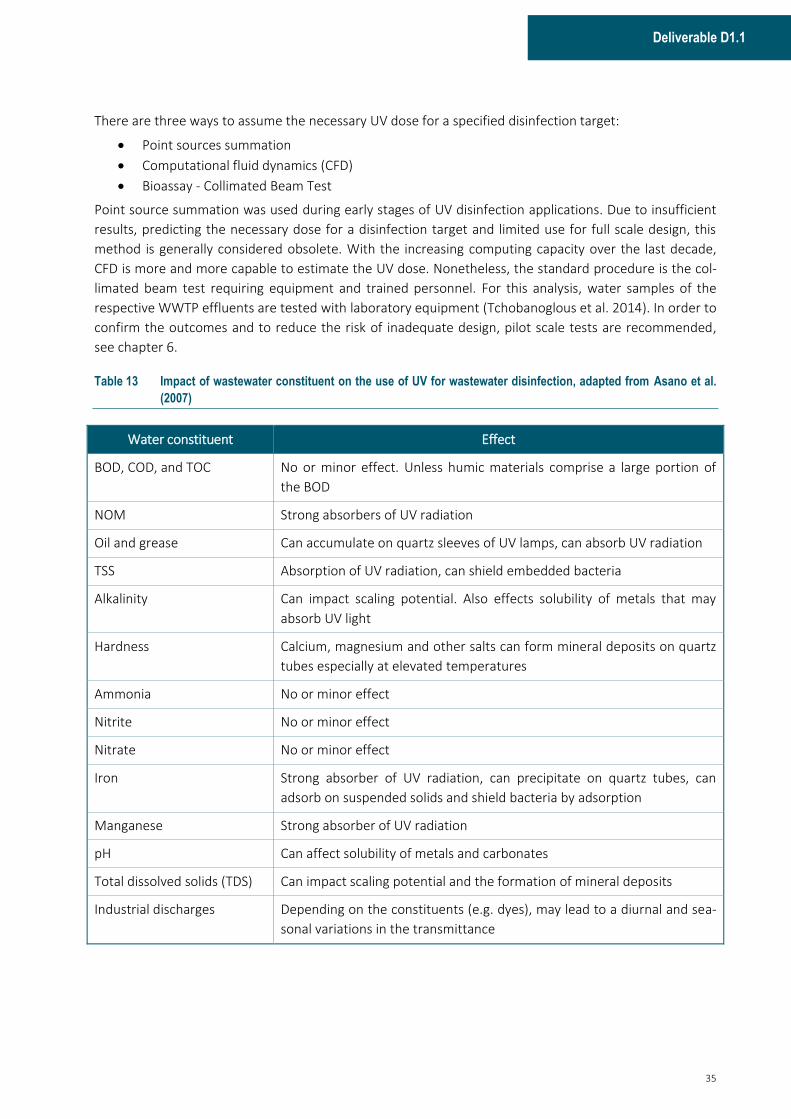
35
Deliverable D1.1
There are three ways to assume the necessary UV dose for a specified disinfection target:
· Point sources summation
· Computational fluid dynamics (CFD)
· Bioassay - Collimated Beam Test
Point source summation was used during early stages of UV disinfection applications. Due to insufficient
results, predicting the necessary dose for a disinfection target and limited use for full scale design, this
method is generally considered obsolete. With the increasing computing capacity over the last decade,
CFD is more and more capable to estimate the UV dose. Nonetheless, the standard procedure is the col-
limated beam test requiring equipment and trained personnel. For this analysis, water samples of the
respective WWTP effluents are tested with laboratory equipment (Tchobanoglous et al. 2014). In order to
confirm the outcomes and to reduce the risk of inadequate design, pilot scale tests are recommended,
see chapter 6.
Table 13 Impact of wastewater constituent on the use of UV for wastewater disinfection, adapted from Asano et al.
(2007)
Water constituent Effect
BOD, COD, and TOC No or minor effect. Unless humic materials comprise a large portion of
the BOD
NOM Strong absorbers of UV radiation
Oil and grease Can accumulate on quartz sleeves of UV lamps, can absorb UV radiation
TSS Absorption of UV radiation, can shield embedded bacteria
Alkalinity Can impact scaling potential. Also effects solubility of metals that may
absorb UV light
Hardness Calcium, magnesium and other salts can form mineral deposits on quartz
tubes especially at elevated temperatures
Ammonia No or minor effect
Nitrite No or minor effect
Nitrate No or minor effect
Iron Strong absorber of UV radiation, can precipitate on quartz tubes, can
adsorb on suspended solids and shield bacteria by adsorption
Manganese Strong absorber of UV radiation
pH Can affect solubility of metals and carbonates
Total dissolved solids (TDS) Can impact scaling potential and the formation of mineral deposits
Industrial discharges Depending on the constituents (e.g. dyes), may lead to a diurnal and sea-
sonal variations in the transmittance
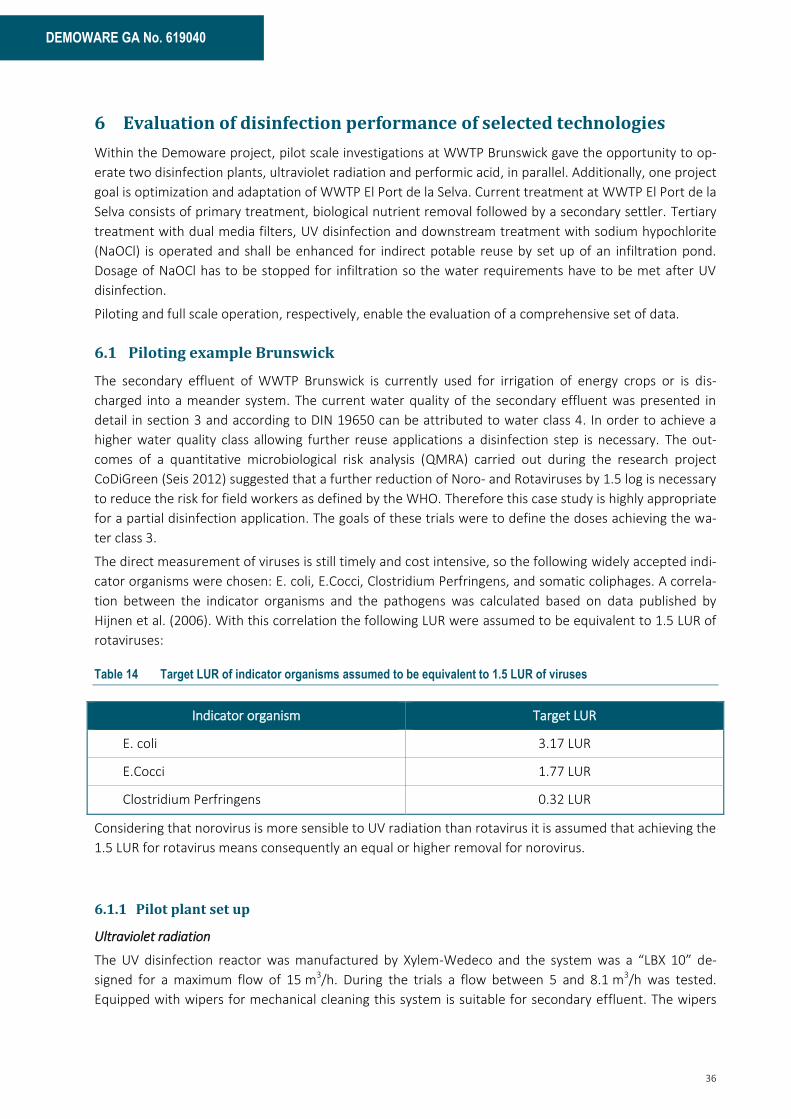
36
DEMOWARE GA No. 619040
6 Evaluation of disinfection performance of selected technologies
Within the Demoware project, pilot scale investigations at WWTP Brunswick gave the opportunity to op-
erate two disinfection plants, ultraviolet radiation and performic acid, in parallel. Additionally, one project
goal is optimization and adaptation of WWTP El Port de la Selva. Current treatment at WWTP El Port de la
Selva consists of primary treatment, biological nutrient removal followed by a secondary settler. Tertiary
treatment with dual media filters, UV disinfection and downstream treatment with sodium hypochlorite
(NaOCl) is operated and shall be enhanced for indirect potable reuse by set up of an infiltration pond.
Dosage of NaOCl has to be stopped for infiltration so the water requirements have to be met after UV
disinfection.
Piloting and full scale operation, respectively, enable the evaluation of a comprehensive set of data.
6.1 Piloting example Brunswick
The secondary effluent of WWTP Brunswick is currently used for irrigation of energy crops or is dis-
charged into a meander system. The current water quality of the secondary effluent was presented in
detail in section 3 and according to DIN 19650 can be attributed to water class 4. In order to achieve a
higher water quality class allowing further reuse applications a disinfection step is necessary. The out-
comes of a quantitative microbiological risk analysis (QMRA) carried out during the research project
CoDiGreen (Seis 2012) suggested that a further reduction of Noro- and Rotaviruses by 1.5 log is necessary
to reduce the risk for field workers as defined by the WHO. Therefore this case study is highly appropriate
for a partial disinfection application. The goals of these trials were to define the doses achieving the wa-
ter class 3.
The direct measurement of viruses is still timely and cost intensive, so the following widely accepted indi-
cator organisms were chosen: E. coli, E.Cocci, Clostridium Perfringens, and somatic coliphages. A correla-
tion between the indicator organisms and the pathogens was calculated based on data published by
Hijnen et al. (2006). With this correlation the following LUR were assumed to be equivalent to 1.5 LUR of
rotaviruses:
Table 14 Target LUR of indicator organisms assumed to be equivalent to 1.5 LUR of viruses
Indicator organism Target LUR
E. coli 3.17 LUR
E.Cocci 1.77 LUR
Clostridium Perfringens 0.32 LUR
Considering that norovirus is more sensible to UV radiation than rotavirus it is assumed that achieving the
1.5 LUR for rotavirus means consequently an equal or higher removal for norovirus.
6.1.1 Pilot plant set up
Ultraviolet radiation
The UV disinfection reactor was manufactured by Xylem-Wedeco and the system was a “LBX 10” de-
signed for a maximum flow of 15 m3/h. During the trials a flow between 5 and 8.1 m3/h was tested.
Equipped with wipers for mechanical cleaning this system is suitable for secondary effluent. The wipers
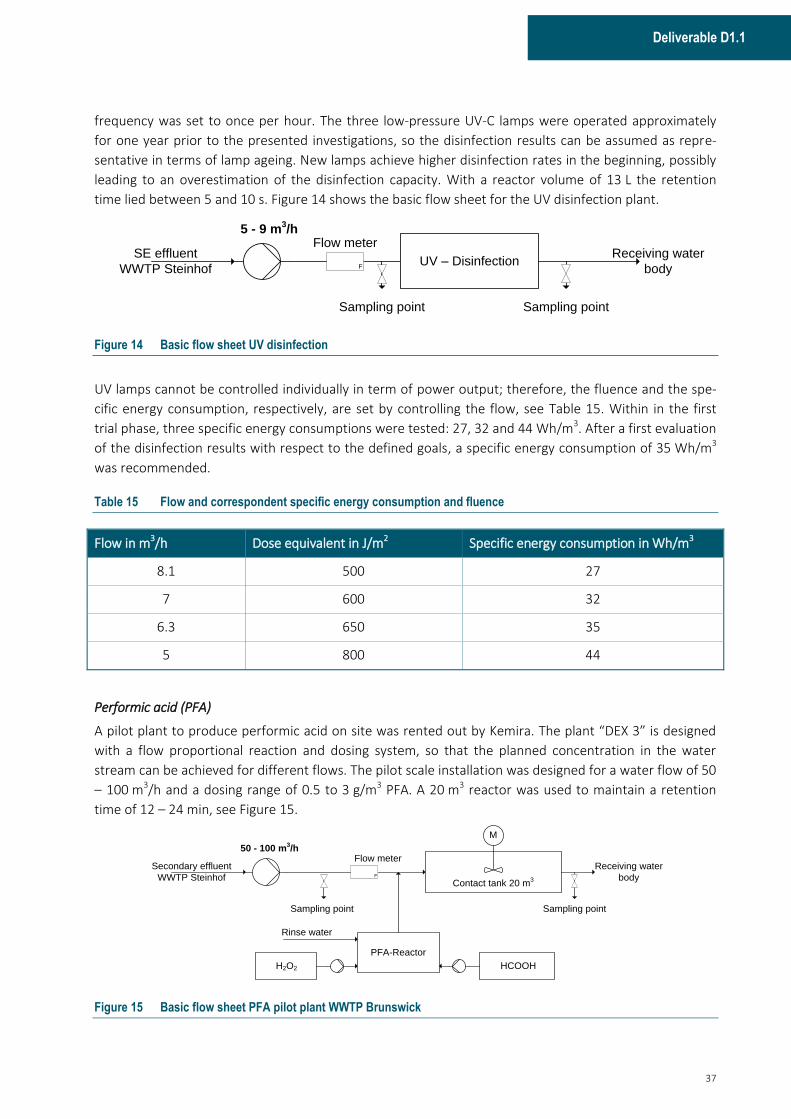
37
Deliverable D1.1
frequency was set to once per hour. The three low-pressure UV-C lamps were operated approximately
for one year prior to the presented investigations, so the disinfection results can be assumed as repre-
sentative in terms of lamp ageing. New lamps achieve higher disinfection rates in the beginning, possibly
leading to an overestimation of the disinfection capacity. With a reactor volume of 13 L the retention
time lied between 5 and 10 s. Figure 14 shows the basic flow sheet for the UV disinfection plant.
SE effluent
WWTP Steinhof
Sampling point
UV – DisinfectionReceiving water
body
Sampling point
5 - 9 m3/h
F
Flow meter
Figure 14 Basic flow sheet UV disinfection
UV lamps cannot be controlled individually in term of power output; therefore, the fluence and the spe-
cific energy consumption, respectively, are set by controlling the flow, see Table 15. Within in the first
trial phase, three specific energy consumptions were tested: 27, 32 and 44 Wh/m3. After a first evaluation
of the disinfection results with respect to the defined goals, a specific energy consumption of 35 Wh/m3
was recommended.
Table 15 Flow and correspondent specific energy consumption and fluence
Flow in m3/h Dose equivalent in J/m2 Specific energy consumption in Wh/m3
8.1 500 27
7 600 32
6.3 650 35
5 800 44
Performic acid (PFA)
A pilot plant to produce performic acid on site was rented out by Kemira. The plant “DEX 3” is designed
with a flow proportional reaction and dosing system, so that the planned concentration in the water
stream can be achieved for different flows. The pilot scale installation was designed for a water flow of 50
– 100 m3/h and a dosing range of 0.5 to 3 g/m3 PFA. A 20 m3 reactor was used to maintain a retention
time of 12 – 24 min, see Figure 15.
Sampling point
H2O2 HCOOH
PFA-Reactor
50 - 100 m3/h
Contact tank 20 m3
Sampling point
Secondary effluent
WWTP Steinhof
Flow meterReceiving water
body
Rinse water
M
F
Figure 15 Basic flow sheet PFA pilot plant WWTP Brunswick

38
DEMOWARE GA No. 619040
During the trial period in 2014 the flow was kept constant at 50 m3/h whereas three concentrations of
PFA were tested: 1.4, 2.0 and 2.7 g/m3. The outcomes of the first trial phase were used to conclude the
following statements:
· UV and PFA show similar effectiveness on indicator organisms
Target LUR of 1.77 for E. cocci is also valid for PFA
Therefore a PFA dose of 2 g/m3 is recommended for the goal of 1.5 LUR of rotavirus and 3.17 LUR for
E. coli.
6.1.2 Results pilot scale investigations
In order to allow a complete data evaluation the data is presented in total, including the first trial phase
and the results obtained with the recommended doses.
Figure 16 and Figure 17 show the disinfection capacity on E. coli for both pilot plants. The different specif-
ic energy demand and PFA dose, respectively, are indicated and the mean LURs are given. The mean LURs
are calculated using the LUR of each data pair. E. coli is known to be sensitive to UV radiation what is
clearly shown in Figure 16.
SE UV effluent10
0
101
102
103
104
105
106
MP
N/1
00
mL
27 Wh/m3
32 Wh/m3 35 Wh/m
3 44 Wh/m
3
500 J/m2
600 J/m2
650 J/m2
800 J/m2
Mean LUR 2.7 Mean LUR 2.9 Mean LUR 3.2 Mean LUR 3.7
Number of samples
10 9 26 10
SE UV effluent SE UV effluent SE UV effluent
E. coli
Figure 16 Disinfection results - E. coli - UV radiation
The LUR rises from 2.7 to 3.7 by increasing the specific energy consumption from 27 (~500 J/m2) to
44 Wh/m3 (~800 J/m2). With respect to the targeted LUR of 3.17 for E. coli the recommendation is a spe-
cific energy consumption of 35 Wh/m3 (~650 J/m2).
For the PFA, a similar result was obtained, a clear sensibility of E. coli to the disinfection agent, see Figure
17. The higher the dose is, the higher the LUR. But the goal of 3.17 LUR was not achieved, in contrast to
the assumption that a similar sensitivity correlation between E. coli and viruses for UV and PFA exists.
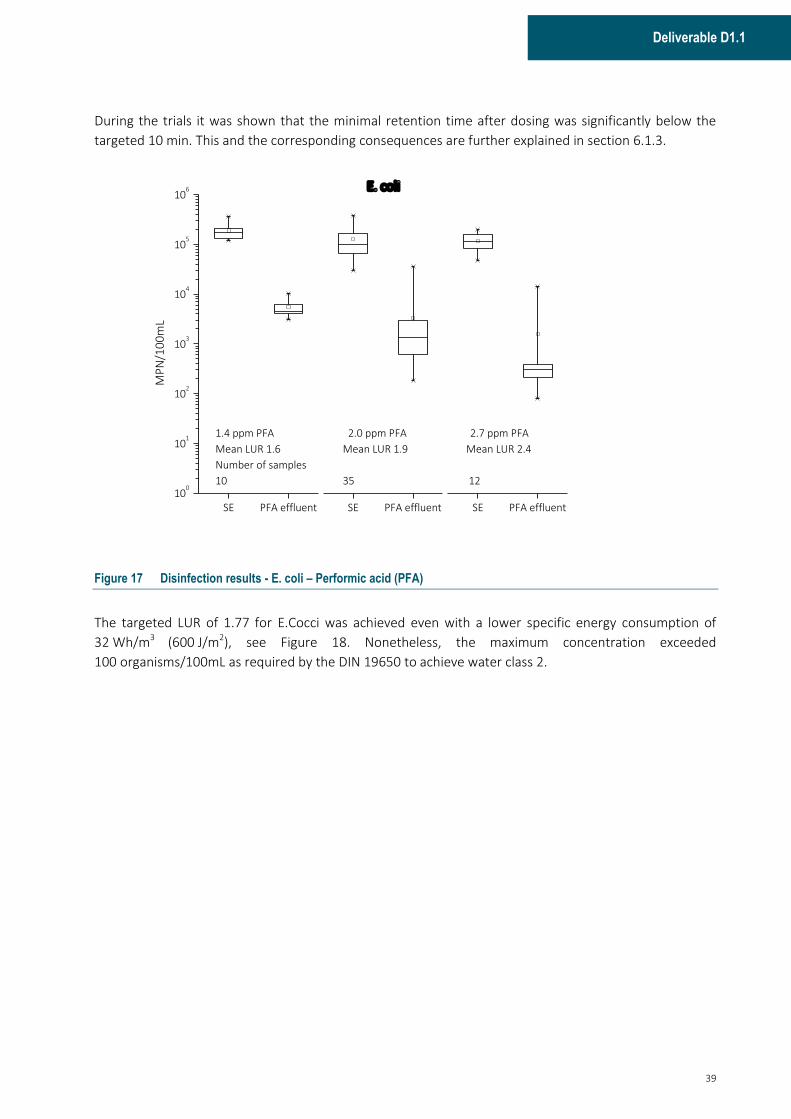
39
Deliverable D1.1
During the trials it was shown that the minimal retention time after dosing was significantly below the
targeted 10 min. This and the corresponding consequences are further explained in section 6.1.3.
SE PFA effluentSE PFA effluent
1.4 ppm PFA 2.0 ppm PFA 2.7 ppm PFA
Mean LUR 1.6 Mean LUR 1.9 Mean LUR 2.4
Number of samples
10 35 12
SE PFA effluent10
0
101
102
103
104
105
106 E. coli
MP
N/1
00
mL
Figure 17 Disinfection results - E. coli – Performic acid (PFA)
The targeted LUR of 1.77 for E.Cocci was achieved even with a lower specific energy consumption of
32 Wh/m3 (600 J/m2), see Figure 18. Nonetheless, the maximum concentration exceeded
100 organisms/100mL as required by the DIN 19650 to achieve water class 2.
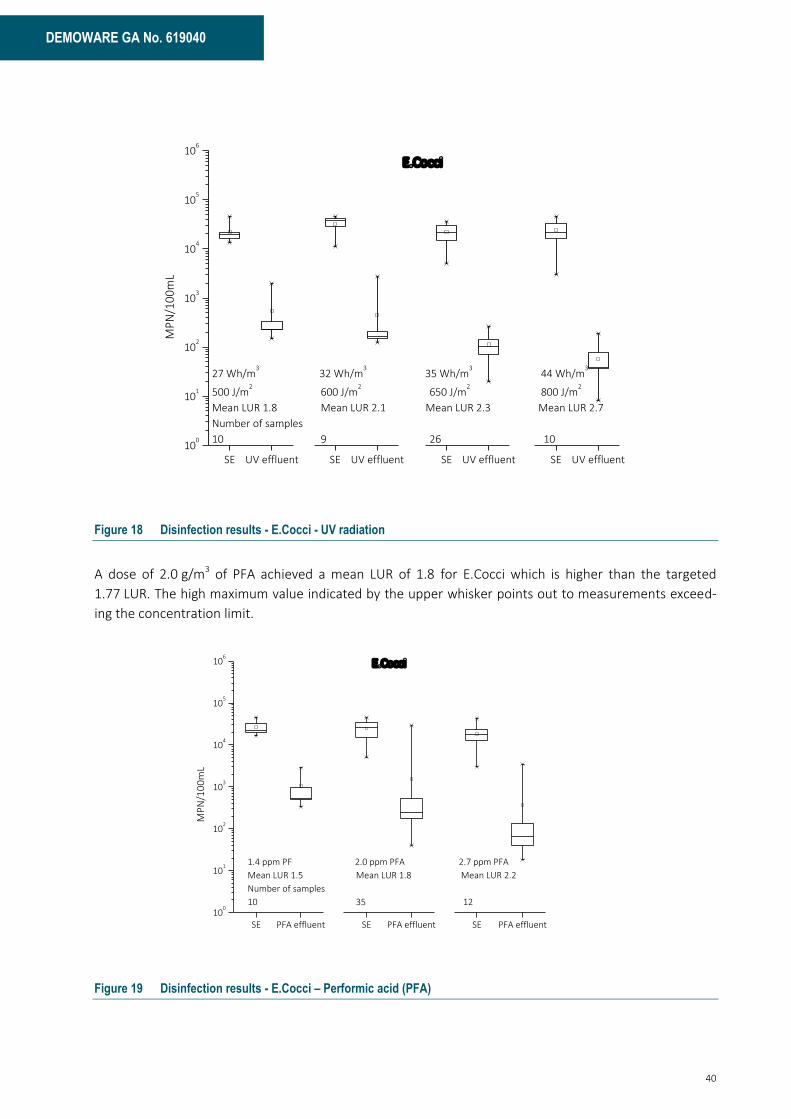
40
DEMOWARE GA No. 619040
SE UV effluent10
0
101
102
103
104
105
106
27 Wh/m3
32 Wh/m3 35 Wh/m
3 44 Wh/m
3
500 J/m2
600 J/m2
650 J/m2
800 J/m2
Mean LUR 1.8 Mean LUR 2.1 Mean LUR 2.3 Mean LUR 2.7
Number of samples
10 9 26 10
MP
N/1
00
mL
SE UV effluent SE UV effluent SE UV effluent
E.Cocci
Figure 18 Disinfection results - E.Cocci - UV radiation
A dose of 2.0 g/m3 of PFA achieved a mean LUR of 1.8 for E.Cocci which is higher than the targeted
1.77 LUR. The high maximum value indicated by the upper whisker points out to measurements exceed-
ing the concentration limit.
SE PFA effluent10
0
101
102
103
104
105
106
MP
N/1
00
mL
SE PFA effluent SE PFA effluent
1.4 ppm PF 2.0 ppm PFA 2.7 ppm PFA
Mean LUR 1.5 Mean LUR 1.8 Mean LUR 2.2
Number of samples
10 35 12
E.Cocci
Figure 19 Disinfection results - E.Cocci – Performic acid (PFA)

41
Deliverable D1.1
Figure 20 and Figure 21 show the results for Clostridium Perfringens. The low LURs for both treatment
technologies and all doses showed an overall high resilience of the indicator organism.
SE UV effluent10
0
101
102
103
104
105
106
27 Wh/m3
32 Wh/m3 35 Wh/m
3 44 Wh/m
3
500 J/m2
600 J/m2
650 J/m2
800 J/m2
Mean LUR 0.4 Mean LUR 0.5 Mean LUR 0.4 Mean LUR 0.4
Number of samples
10 9 26 10
MP
N/1
00
mL
SE UV effluent SE UV effluent
Clostridium Perfringens
SE UV effluent
Figure 20 Disinfection results - Clostridium Perfringens - UV radiation
SE PFA effluent10
0
101
102
103
104
105
106
MP
N/1
00
mL
SE PFA effluent
1.4 ppm PFA 2.0 ppm PFA 2.7 ppm PFA
Mean LUR 0.1 Mean LUR 0.2 Mean LUR 0.3
Number of samples
10 35 12
Clostridium Perfringens
SE PFA effluent
Figure 21 Disinfection results - Clostridium Perfringens - Performic acid (PFA)

42
DEMOWARE GA No. 619040
Somatic Coliphages show a high sensitivity to UV radiation and the LUR applying 27 Wh/m3 (500 J/m2)
was > 3. Increasing the specific energy consumption further led to LURs above 4.0. Only the LUR for the
highest specific energy consumption decreased in comparison, which can be explained by the already
high LURs. In this case the mean value is biased by the maximum value.
SE UV effluent10
-1
100
101
102
103
104
105
106
107
PFU
/10
0m
L
SE UV effluent SE UV effluent SE UV effluent
27 Wh/m3
32 Wh/m3 35 Wh/m
3 44 Wh/m
3
500 J/m2
600 J/m2
650 J/m2
800 J/m2
Mean LUR 3.2 Mean LUR 4.0 Mean LUR 4.2 Mean LUR 3.6
Somatic Coliphages
Number of samples
6 6 15 6
Figure 22 Disinfection results - Somatic Coliphages - UV radiation
As shown in Figure 23 PFA is effective against somatic coliphages. But increasing the dose from 1.4 to
2.7 g/m3 does not increase the LUR to the same extent. In this case the indicator organism somatic
coliphages does not show similar sensitivities for UV and PFA. Nonetheless, a LUR > 2.0 can be satisfying
for water reuse applications where partial disinfection is sufficient.

43
Deliverable D1.1
SE PFA effluent10
-1
100
101
102
103
104
105
106
107
PFU
/10
0m
L
SE PFA effluent SE PFA effluent
Somatic Coliphages
1.4 ppm PFA 2.0 ppm PFA 2.7 ppm PFA
Mean LUR 2.3 Mean LUR 2.4 Mean LUR 2.5
Number of samples
6 21 6
Figure 23 Disinfection results - Somatic Coliphages - Performic acid (PFA)
6.1.3 Retention time PFA reactor
A minimum retention time of 10 min is recommended for the PFA reaction by the manufacturer. There-
fore a contact tank with 20 m3 was installed for piloting. A plug flow contact basin is the ideal reactor for
chemical disinfection technologies, neglecting the possibility of short cuts leading to poor disinfection
results. Since for piloting the construction of such a contact basin was too cost intensive and due to limit-
ing space, a lying tank was set up. The design with a length to height ratio of 2.5 was considered to result
in mostly plug flow-like conditions. As this tank was manufactured for different purposes, the inlet as well
as the outlet were on the bottom. Even though the piping was designed in order to maintain and control
the water level in the tank, thus the theoretical reaction volume, the position of the connections would
have led to a constant short circuit. Therefore a mixer was installed in the middle of the tank, aiming at
increasing the mean retention time. The mixer was more effective than expected and tracer tests were
performed implying a minimum retention of 3.4 min and long tail indicating higher retention times.
In order to evaluate the impact of the comparatively short reaction time, sampling was performed with-
out quenching reactant (Sodiumthiosulfate STS) in the sampling bottles. Considering the time for storage
and transportation to the laboratory (3-7 h), a complete reaction can be assumed representing an ideal
designed reaction basin. Additionally samples with the quenching reactant were taken in parallel enabling
a direct comparison. Figure 24 shows the mean removal results for E. coli, E.Cocci and Clostridium
Perfringens with and without quenching. The results prove that the previously presented results underes-
timate the disinfection performance for the PFA. Table 16 compares the median LURs with and without
quenching.

44
DEMOWARE GA No. 619040
Bearing this in mind, the recommendation dose of 2.0 g/m3 for WWTP Brunswick can be considered suffi-
cient. The impact of the dose on the economic evaluation will be discussed in Section 8 where different
dosage and energy costs are evaluated.
Feed Quenched Not quenched
10-1
100
101
102
103
104
105
106
MP
N/1
00
mL
Number of samples
15 15 15
Feed Quenched Not quenched Feed QuenchedNot quenched
E.cocci E.coli Clostridium perfringens
Figure 24 Comparison results for 2 g/m3 PFA - with and without quenching
Due to the maximum value obtained during this measurement campaign, the mean values for all three
indicator organisms lie in the same range. Nonetheless, the median is clearly lower for samples not
quenched for E. coli and E.Cocci. This backs the assumptions that the reaction was not completely ended.
The maximum values show outliers for the PFA, which could not be explained during evaluation of the
trials.
Table 16 Comparison of median LURs with and without quenching
E. coli E.Cocci Clostridium Perfringens
With quenching 1.95 2.02 0.08
Without quenching 3.06 2.62 0.46
6.1.4 Sludge run off incident
Malfunctions in the upstream operation may lead to a significant impact of the water quality for short
periods of time and the capability of the disinfections step to handle this can help in the decision which
technology should be installed. During the pilot scale trials at WWTP Brunswick, an incident of sludge run-
off took place, see section 3.1.1. The impact on the microbiological indicators is shown in Figure 25.

45
Deliverable D1.1
07.10.2014 08:00 07.10.2014 20:00 08.10.2014 08:00 08.10.2014 20:00 09.10.2014 08:0010
0
101
102
103
104
105
106
Susp
end
ed s
olid
s in
mg/
L &
Ind
icat
ors
in M
PN
/10
0m
L
Suspended solids
E.cocci
E.coli
Clostridium perfringens
Figure 25 Indicator organisms and suspended solids during sludge run-off - secondary effluent - PFA 2 g/m3,
UV 32 Wh/m3 (600 J/m2)
While E. coli concentration can be correlated with suspended solids, the impact on E.Cocci and Clostridi-
um Perfringens is not obvious. Correlating the log unit removal of both disinfection technologies it is
shown that the removals of E. coli and E.Cocci are highly dependent on the concentration of suspended
solids, whereas the removal of Clostridium Perfringens shows no direct correlation. Due to the fact that
the LUR for both technologies are not remarkably high even with low suspended solids concentration, an
impact cannot be observed with three sample values.
The rising LUR for both technologies with the suspended solids decrease, shows the capability of both
systems to recover automatically. The systems react almost with the same speed to the alteration of this
water quality parameter.

46
DEMOWARE GA No. 619040
08.10.2014 08:00 08.10.2014 20:00 09.10.2014 08:00
0
100
200
300
400
500
600
700
800
900
1000
Suspended solids
LUR PFA E.cocci
LUR UV E.cocci
LUR PFA E.coli
LUR UV E.coli
LUR PFA Clostridium perfringens
LUR UV Clostridium perfringens
Susp
end
ed s
olid
s in
mg/
L
-1.0
-0.5
0.0
0.5
1.0
1.5
2.0
2.5
3.0
3.5
4.0
Lo
g u
nit
rem
ova
l
Figure 26 Suspended solids and LUR for PFA and UV during sludge run-off
6.1.5 Summary Pilot trials WWTP Brunswick
After piloting for three months testing four different microbiologic parameters with 3 – 4, doses the disin-
fection performance for UV radiation and performic acid can be compared for WWTP Brunswick. Consid-
ering the impact of the retention time for the reaction with performic acid, 2 g/m3 PFA and 35 Wh/m3 is
the recommendation in order to increase the water class from 3 to 2, according to DIN 19650. The corre-
spondent LURs are given in Table 17. These dosages proved to be sufficient as mean/median values, but
run-away values, caused by sludge run-off, lead to high values and based on the grab sample value the
disinfection result is not appropriate. Therefore it has to be kept in mind, that different the regulations
might require different sampling procedures and different quantification of limit values. E.g. either medi-
an values or 90 % of all measured values.
Table 17 Comparison disinfection results Brunswick – Mean LURs
Parameter
UV
27 Wh/m3
500 J/m2
UV
32 Wh/m3
600 J/m2
UV
35 Wh/m3
650 J/m2
UV
44 Wh/m3
800 J/m2
PFA
1.4 g/m3
PFA
2.0 g/m3
PFA 2.0 g/m
3
Without quenching
(median)
PFA
2.7 g/m3
E coli 2.7 2.9 3.2 3.7 1.6 1.9 3.1 2.4
E. cocci 1.8 2.1 2.3 2.7 1.5 1.8 2.6 2.2
Clostridium Perfringens
0.4 0.5 0.4 0.4 0.1 0.2 0.5
0.3
Somatic coliphages
3.2 4.0 4.2 3.6 2.3 2.4
2.5
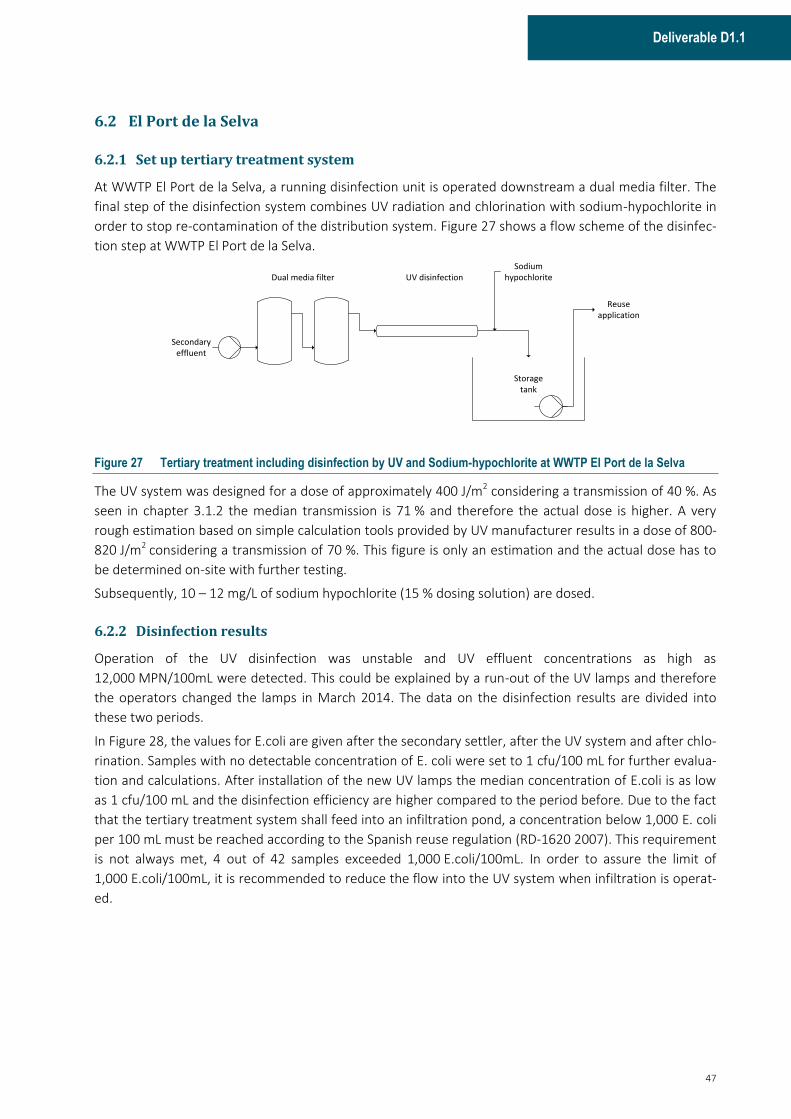
47
Deliverable D1.1
6.2 El Port de la Selva
6.2.1 Set up tertiary treatment system
At WWTP El Port de la Selva, a running disinfection unit is operated downstream a dual media filter. The
final step of the disinfection system combines UV radiation and chlorination with sodium-hypochlorite in
order to stop re-contamination of the distribution system. Figure 27 shows a flow scheme of the disinfec-
tion step at WWTP El Port de la Selva.
Sodium hypochloriteUV disinfectionDual media filter
Secondary effluent
Reuse application
Storage tank
Figure 27 Tertiary treatment including disinfection by UV and Sodium-hypochlorite at WWTP El Port de la Selva
The UV system was designed for a dose of approximately 400 J/m2 considering a transmission of 40 %. As
seen in chapter 3.1.2 the median transmission is 71 % and therefore the actual dose is higher. A very
rough estimation based on simple calculation tools provided by UV manufacturer results in a dose of 800-
820 J/m2 considering a transmission of 70 %. This figure is only an estimation and the actual dose has to
be determined on-site with further testing.
Subsequently, 10 – 12 mg/L of sodium hypochlorite (15 % dosing solution) are dosed.
6.2.2 Disinfection results
Operation of the UV disinfection was unstable and UV effluent concentrations as high as
12,000 MPN/100mL were detected. This could be explained by a run-out of the UV lamps and therefore
the operators changed the lamps in March 2014. The data on the disinfection results are divided into
these two periods.
In Figure 28, the values for E.coli are given after the secondary settler, after the UV system and after chlo-
rination. Samples with no detectable concentration of E. coli were set to 1 cfu/100 mL for further evalua-
tion and calculations. After installation of the new UV lamps the median concentration of E.coli is as low
as 1 cfu/100 mL and the disinfection efficiency are higher compared to the period before. Due to the fact
that the tertiary treatment system shall feed into an infiltration pond, a concentration below 1,000 E. coli
per 100 mL must be reached according to the Spanish reuse regulation (RD-1620 2007). This requirement
is not always met, 4 out of 42 samples exceeded 1,000 E.coli/100mL. In order to assure the limit of
1,000 E.coli/100mL, it is recommended to reduce the flow into the UV system when infiltration is operat-
ed.
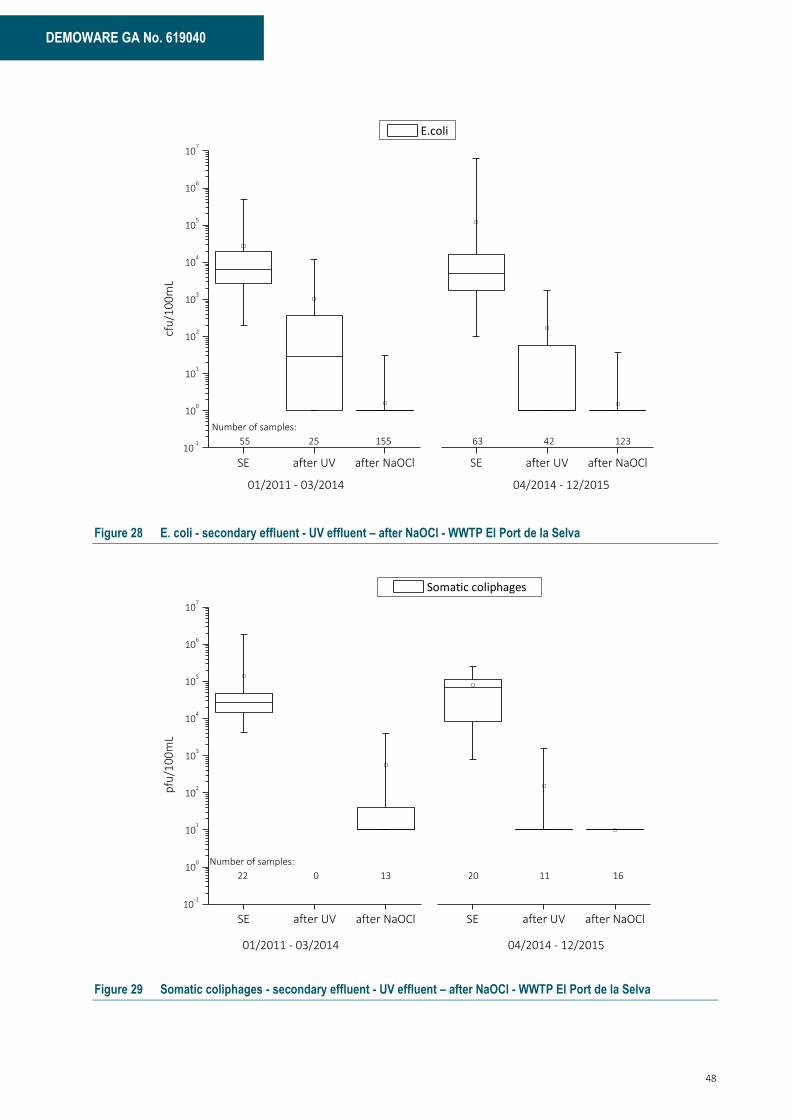
48
DEMOWARE GA No. 619040
SE after UV after NaOCl10
-1
100
101
102
103
104
105
106
107
cfu
/10
0m
L
E.coli
SE after UV after NaOCl
Number of samples:
55 25 155 63 42 123
01/2011 - 03/2014 04/2014 - 12/2015
Figure 28 E. coli - secondary effluent - UV effluent – after NaOCl - WWTP El Port de la Selva
SE after UV after NaOCl10
-1
100
101
102
103
104
105
106
107
pfu
/10
0m
L
Somatic coliphages
SE after UV after NaOCl
01/2011 - 03/2014 04/2014 - 12/2015
Number of samples:
22 0 13 20 11 16
Figure 29 Somatic coliphages - secondary effluent - UV effluent – after NaOCl - WWTP El Port de la Selva
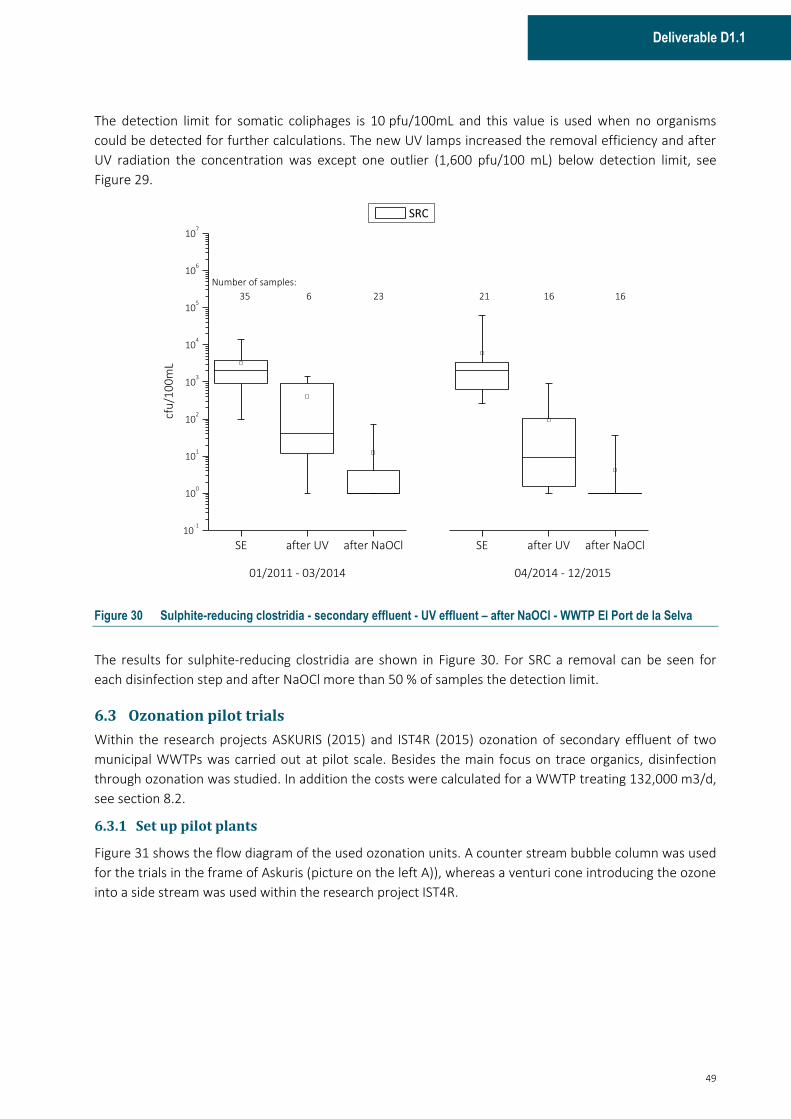
49
Deliverable D1.1
The detection limit for somatic coliphages is 10 pfu/100mL and this value is used when no organisms
could be detected for further calculations. The new UV lamps increased the removal efficiency and after
UV radiation the concentration was except one outlier (1,600 pfu/100 mL) below detection limit, see
Figure 29.
SE after UV after NaOCl10
-1
100
101
102
103
104
105
106
107
cfu
/10
0m
L
SRC
SE after UV after NaOCl
01/2011 - 03/2014 04/2014 - 12/2015
Number of samples:
35 6 23 21 16 16
Figure 30 Sulphite-reducing clostridia - secondary effluent - UV effluent – after NaOCl - WWTP El Port de la Selva
The results for sulphite-reducing clostridia are shown in Figure 30. For SRC a removal can be seen for
each disinfection step and after NaOCl more than 50 % of samples the detection limit.
6.3 Ozonation pilot trials
Within the research projects ASKURIS (2015) and IST4R (2015) ozonation of secondary effluent of two
municipal WWTPs was carried out at pilot scale. Besides the main focus on trace organics, disinfection
through ozonation was studied. In addition the costs were calculated for a WWTP treating 132,000 m3/d,
see section 8.2.
6.3.1 Set up pilot plants
Figure 31 shows the flow diagram of the used ozonation units. A counter stream bubble column was used
for the trials in the frame of Askuris (picture on the left A)), whereas a venturi cone introducing the ozone
into a side stream was used within the research project IST4R.

50
DEMOWARE GA No. 619040
Secondary effluent
Ozone generator
Oxygen supply
Off gas collection
Degassing tank
Ozone destruction
Bu
bb
le c
olu
mn Secondary
effluent
Degassing tank
Treated effluent
Ozone generator
Oxygen supply
Treated effluent
Off gas collection Ozone destruction
Ve
ntu
ri
con
e
By-pass pump
B)A)
Figure 31 Ozone contactors - A) Bubble column as used in ASKURIS - B) By-pass system with venturi cone as used
in IST4R
The DOC specific ozone dosage E is used for evaluation and this value allows a comparison between dif-
ferent installations treating waters with varying water qualities. To be able to calculate the transferred
amount of ozone precisely, an off gas measurement is necessary. The following equation applies here:
𝑑 = (𝑐𝑂3, 𝑖𝑛 − 𝑐𝑂3, 𝑜𝑢𝑡) ∗ �̇�𝐺𝑎𝑠
�̇�𝐻2𝑂
Division of d by the the DOC concentration in the water gives the specific dose EDOC. When nitrite is pre-
sent the dose can be corrected with regards to the ozone consumed by nitrite, see section 6.3.2. This
value is given as EDOC, corr.
6.3.2 Results
As mentioned in section 5.1.3, nitrite has to be taken into account, because the additional ozone con-
sumption by nitrite (3.43 mg O3/mg N) reduces the amount of ozone which is available for disinfection.
Jekel et al. (2015a) showed that the disinfection efficiency decreases, if nitrite is spiked into the influent
of the ozonation to simulate concentrations of up to 1 mg N/L. Without consideration of nitrite, a range
of about 2 log in E. coli reduction can be seen at an applied ozone dose of 0.6 mg O3/mg DOC. If the ap-
plied ozone dose is corrected for the ozone consumption of nitrite, a correlation of the E. coli reduction
with an increasing applied ozone dose appears (Figure 32). In order to achieve a more stable disinfection,
the applied ozone dose has to be adapted to the varying water quality at the secondary effluent. A possi-
ble process control for the operation of the ozonation can be an open-loop process control based on the
online measurement of DOC and nitrite at the influent of the ozonation. Another option could be a
closed-loop process control based on the reduction of the UV absorbance at 254 nm due to the ozona-
tion, which was primarily used at an ozonation stage to eliminate trace organic contaminants (Stapf &
Miehe 2015). An advantage of such a closed-loop process control is the indirect consideration of ozone
consuming substances like nitrite.

51
Deliverable D1.1
Figure 32 Log reduction of E. coli due to ozonation of a secondary effluent at pilot scale versus DOC specific ozone
dose with (grey points) and without (black cross) consideration of the additional ozone consumption by ni-
trite. Adapted from (Jekel et al. 2015a), mean DOC concentration was 12.9 mg/L.
Achieved reductions of E. coli and E. cocci due to ozonation by pilot plants at two different municipal
wastewater treatment plants in Berlin (Germany) are shown in Figure 33 (Jekel et al. 2015a; Jekel et al.
2015b). At a median of E. coli at the secondary effluent of 3*104 MPN/100 ml and 5*103 MPN/100 ml for
E. cocci, respectively, reductions of 2 to 3 log could be achieved for both parameters with applied ozone
doses >0.6 mg O3/mg DOC. A further reduction of up to 1-log can be achieved with a post filtration like
coagulation and dual media filtration which is used for phosphorous removal (Jekel et al. 2015a).
Figure 33 Reduction of E. coli (left) and E. cocci (right) due to ozonation of a secondary effluent of a municipal
wastewater treatment plant. Black points indicate that E. cocci concentrations at the ozonation effluent were below the LOQ of 15 or 38 MPN/100 ml.
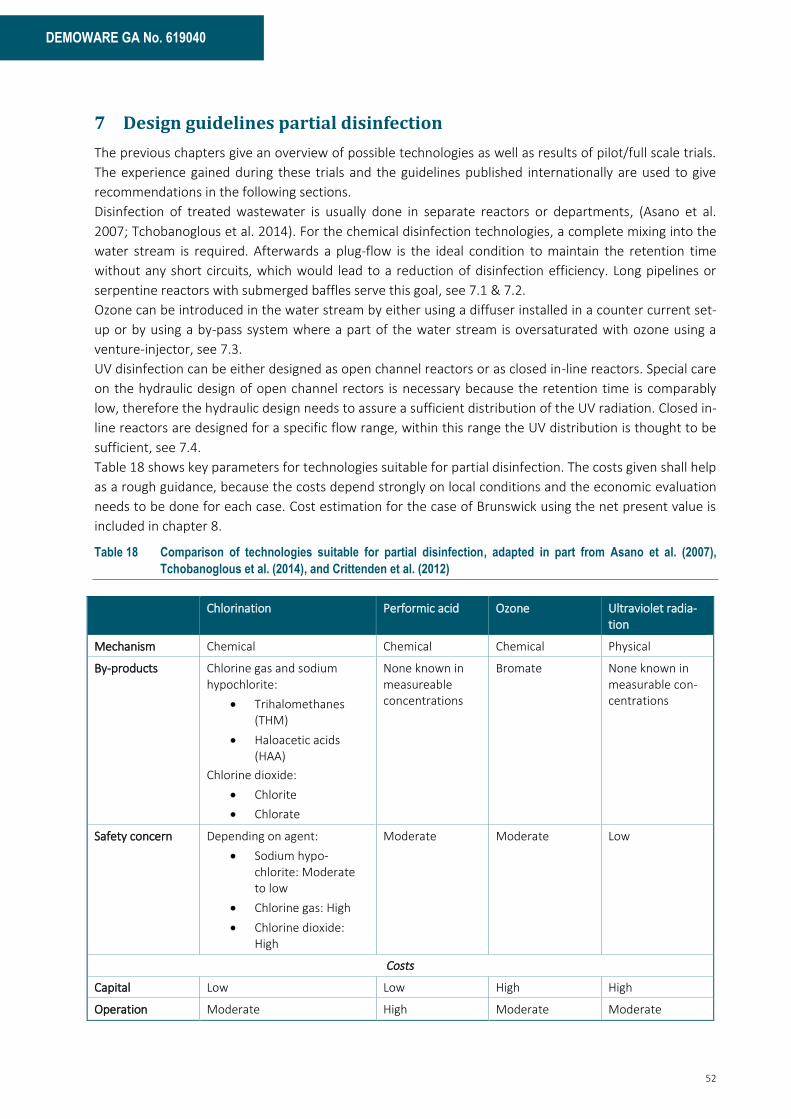
52
DEMOWARE GA No. 619040
7 Design guidelines partial disinfection
The previous chapters give an overview of possible technologies as well as results of pilot/full scale trials.
The experience gained during these trials and the guidelines published internationally are used to give
recommendations in the following sections.
Disinfection of treated wastewater is usually done in separate reactors or departments, (Asano et al.
2007; Tchobanoglous et al. 2014). For the chemical disinfection technologies, a complete mixing into the
water stream is required. Afterwards a plug-flow is the ideal condition to maintain the retention time
without any short circuits, which would lead to a reduction of disinfection efficiency. Long pipelines or
serpentine reactors with submerged baffles serve this goal, see 7.1 & 7.2.
Ozone can be introduced in the water stream by either using a diffuser installed in a counter current set-
up or by using a by-pass system where a part of the water stream is oversaturated with ozone using a
venture-injector, see 7.3.
UV disinfection can be either designed as open channel reactors or as closed in-line reactors. Special care
on the hydraulic design of open channel rectors is necessary because the retention time is comparably
low, therefore the hydraulic design needs to assure a sufficient distribution of the UV radiation. Closed in-
line reactors are designed for a specific flow range, within this range the UV distribution is thought to be
sufficient, see 7.4.
Table 18 shows key parameters for technologies suitable for partial disinfection. The costs given shall help
as a rough guidance, because the costs depend strongly on local conditions and the economic evaluation
needs to be done for each case. Cost estimation for the case of Brunswick using the net present value is
included in chapter 8.
Table 18 Comparison of technologies suitable for partial disinfection, adapted in part from Asano et al. (2007),
Tchobanoglous et al. (2014), and Crittenden et al. (2012)
Chlorination Performic acid Ozone Ultraviolet radia-tion
Mechanism Chemical Chemical Chemical Physical
By-products Chlorine gas and sodium hypochlorite:
· Trihalomethanes (THM)
· Haloacetic acids (HAA)
Chlorine dioxide:
· Chlorite
· Chlorate
None known in measureable concentrations
Bromate None known in measurable con-centrations
Safety concern Depending on agent:
· Sodium hypo-chlorite: Moderate to low
· Chlorine gas: High
· Chlorine dioxide: High
Moderate Moderate Low
Costs
Capital Low Low High High
Operation Moderate High Moderate Moderate
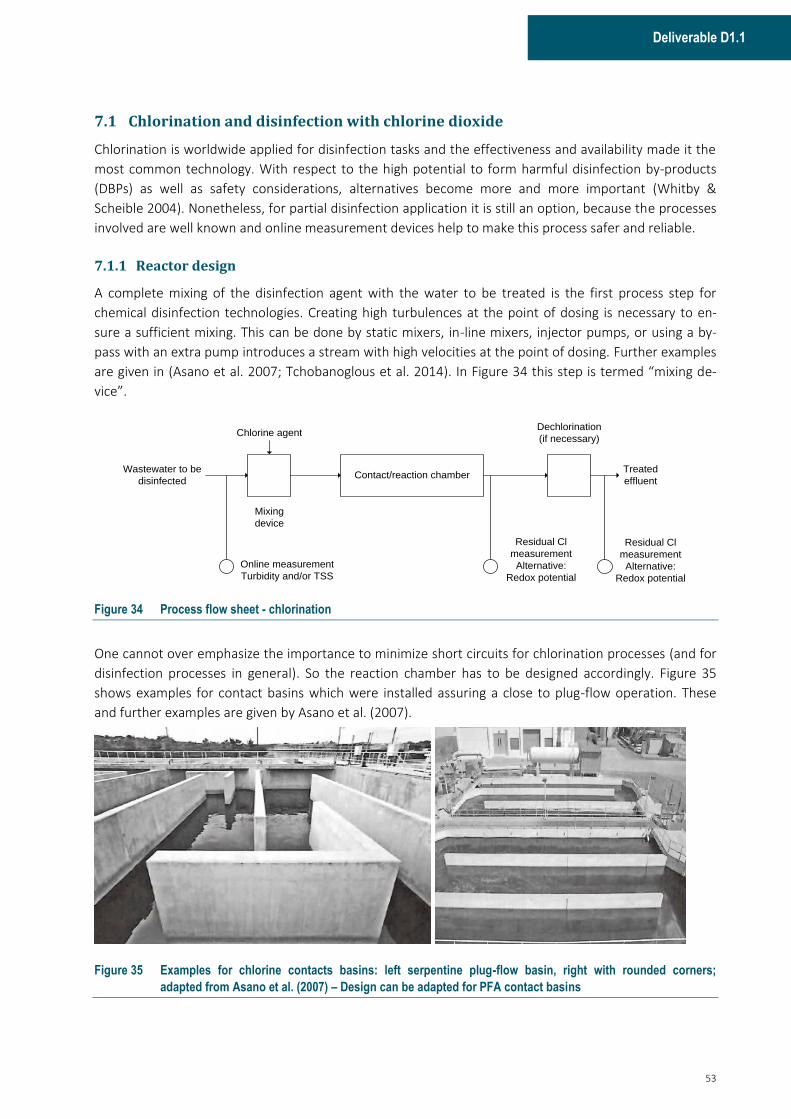
53
Deliverable D1.1
7.1 Chlorination and disinfection with chlorine dioxide
Chlorination is worldwide applied for disinfection tasks and the effectiveness and availability made it the
most common technology. With respect to the high potential to form harmful disinfection by-products
(DBPs) as well as safety considerations, alternatives become more and more important (Whitby &
Scheible 2004). Nonetheless, for partial disinfection application it is still an option, because the processes
involved are well known and online measurement devices help to make this process safer and reliable.
7.1.1 Reactor design
A complete mixing of the disinfection agent with the water to be treated is the first process step for
chemical disinfection technologies. Creating high turbulences at the point of dosing is necessary to en-
sure a sufficient mixing. This can be done by static mixers, in-line mixers, injector pumps, or using a by-
pass with an extra pump introduces a stream with high velocities at the point of dosing. Further examples
are given in (Asano et al. 2007; Tchobanoglous et al. 2014). In Figure 34 this step is termed “mixing de-
vice”.
Wastewater to be
disinfected
Chlorine agent
Mixing
device
Contact/reaction chamber
Dechlorination
(if necessary)
Treated
effluent
Online measurement
Turbidity and/or TSS
Residual Cl
measurement
Alternative:
Redox potential
Residual Cl
measurement
Alternative:
Redox potential
Figure 34 Process flow sheet - chlorination
One cannot over emphasize the importance to minimize short circuits for chlorination processes (and for
disinfection processes in general). So the reaction chamber has to be designed accordingly. Figure 35
shows examples for contact basins which were installed assuring a close to plug-flow operation. These
and further examples are given by Asano et al. (2007).
Figure 35 Examples for chlorine contacts basins: left serpentine plug-flow basin, right with rounded corners;
adapted from Asano et al. (2007) – Design can be adapted for PFA contact basins

54
DEMOWARE GA No. 619040
Where necessary a dechlorination step is included to avoid discharge of toxic substances and odour is-
sues. Dechlorination agents serve as reducing compounds and sulfur-dioxide (SO2) is most commonly
used. Other agents are sodium bisulfite (NaHSO3), sodium sulphite (Na2SO3), sodium metasulfite
(Na2S2O2), and sodium thiosulfate (Na2S2O3). An alternative to these agents is the adsorption to activated
carbon and subsequent reaction to harmless compounds.
7.1.2 Control strategy
With reliable online-measurement techniques, chlorination for water reuse can be designed with a per-
manent detection of malfunctions and correspondent actions can be implemented in the control system.
The previously presented sludge run-off incident (see section 6.1.4) can be detected by a TSS or turbidity
measurement in the inlet of the system. Together with the back-loop control cycle using the residual Cl
concentration, a control scheme can be designed minimizing the chance for undetected failure and usage
of insufficiently disinfected water.
For chlorination processes residual Cl measurement is implemented in order to control the free and com-
bined residual chlorine. Depending on the circumstances, a certain concentration is targeted in order to
protect the distribution network from regrowth and contamination.
Figure 34 shows a basic process flow sheet for a chlorination process and where it is recommended to
install online measurement techniques.
7.2 Performic acid
As discussed before, PFA processes were developed recently and only few full scale installations are run-
ning. Due to the similar constraints for mixing and reactor design as chlorine, the experiences gained over
the last decades operating and optimizing chlorine installations can be used for PFA reactors, see Figure
35.
TSS and turbidity online measurement techniques should be used in the inlet of the PFA disinfection step
to enhance process reliability. These measurements are often already implemented at WWTPs effluents
or can be easily installed, and can therefore be used to determine whether the water can be disinfected
with PFA or not.
Implementation of a reliable online detection of micro-organisms will help to optimize the PFA dosage,
and thus will significantly reduce the operating costs. Direct measurement of PFA in the effluent would be
another way to minimize operating costs, but up to now this kind of online analysis is not available.
7.3 Ozone
7.3.1 Reactor design
Ozone is introduced either by by-pass systems or by counter current bubble columns. Figure 36 shows
the scheme of a four compartment contact chamber (Asano et al. 2007). On the right, hand side an ozone
contactor for the treatment of up to 10 m3/h is shown (Stüber & Godehardt 2013). The first column is the
bubble column, where ozone rich gas is introduced at the bottom with a plate diffuser, followed by con-
tact chambers for reaction.
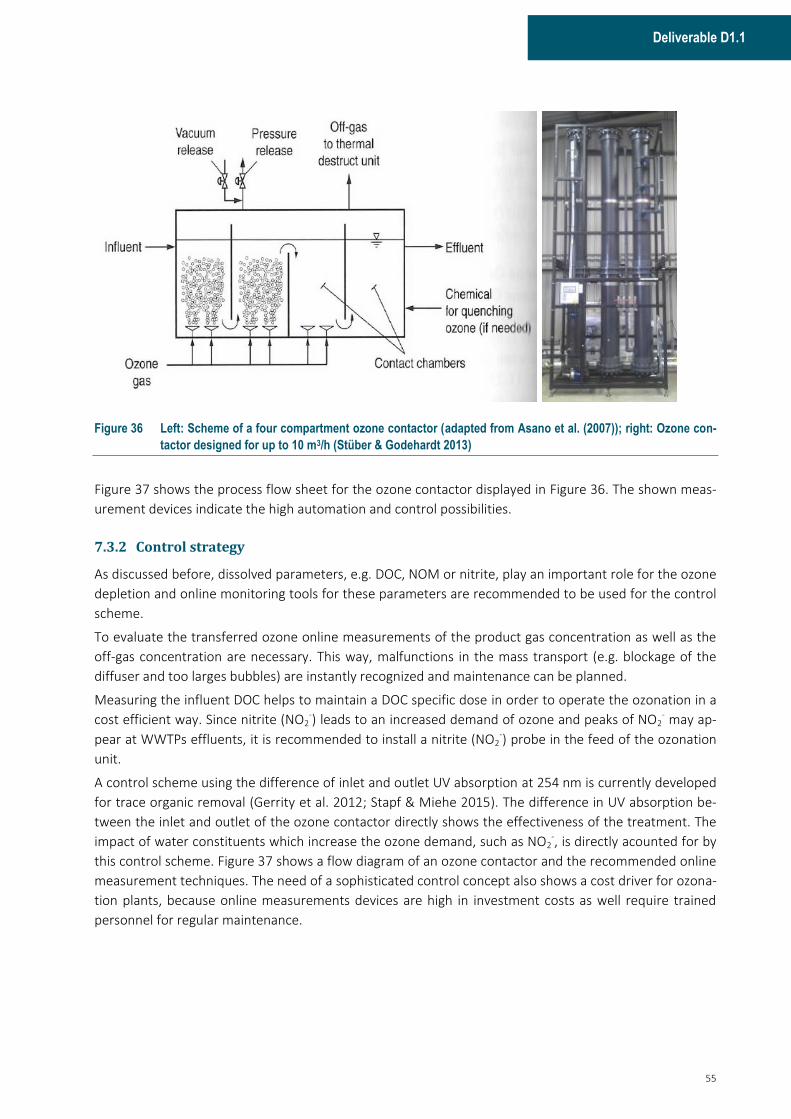
55
Deliverable D1.1
Figure 36 Left: Scheme of a four compartment ozone contactor (adapted from Asano et al. (2007)); right: Ozone con-
tactor designed for up to 10 m3/h (Stüber & Godehardt 2013)
Figure 37 shows the process flow sheet for the ozone contactor displayed in Figure 36. The shown meas-
urement devices indicate the high automation and control possibilities.
7.3.2 Control strategy
As discussed before, dissolved parameters, e.g. DOC, NOM or nitrite, play an important role for the ozone
depletion and online monitoring tools for these parameters are recommended to be used for the control
scheme.
To evaluate the transferred ozone online measurements of the product gas concentration as well as the
off-gas concentration are necessary. This way, malfunctions in the mass transport (e.g. blockage of the
diffuser and too larges bubbles) are instantly recognized and maintenance can be planned.
Measuring the influent DOC helps to maintain a DOC specific dose in order to operate the ozonation in a
cost efficient way. Since nitrite (NO2-) leads to an increased demand of ozone and peaks of NO2
- may ap-
pear at WWTPs effluents, it is recommended to install a nitrite (NO2-) probe in the feed of the ozonation
unit.
A control scheme using the difference of inlet and outlet UV absorption at 254 nm is currently developed
for trace organic removal (Gerrity et al. 2012; Stapf & Miehe 2015). The difference in UV absorption be-
tween the inlet and outlet of the ozone contactor directly shows the effectiveness of the treatment. The
impact of water constituents which increase the ozone demand, such as NO2-, is directly acounted for by
this control scheme. Figure 37 shows a flow diagram of an ozone contactor and the recommended online
measurement techniques. The need of a sophisticated control concept also shows a cost driver for ozona-
tion plants, because online measurements devices are high in investment costs as well require trained
personnel for regular maintenance.
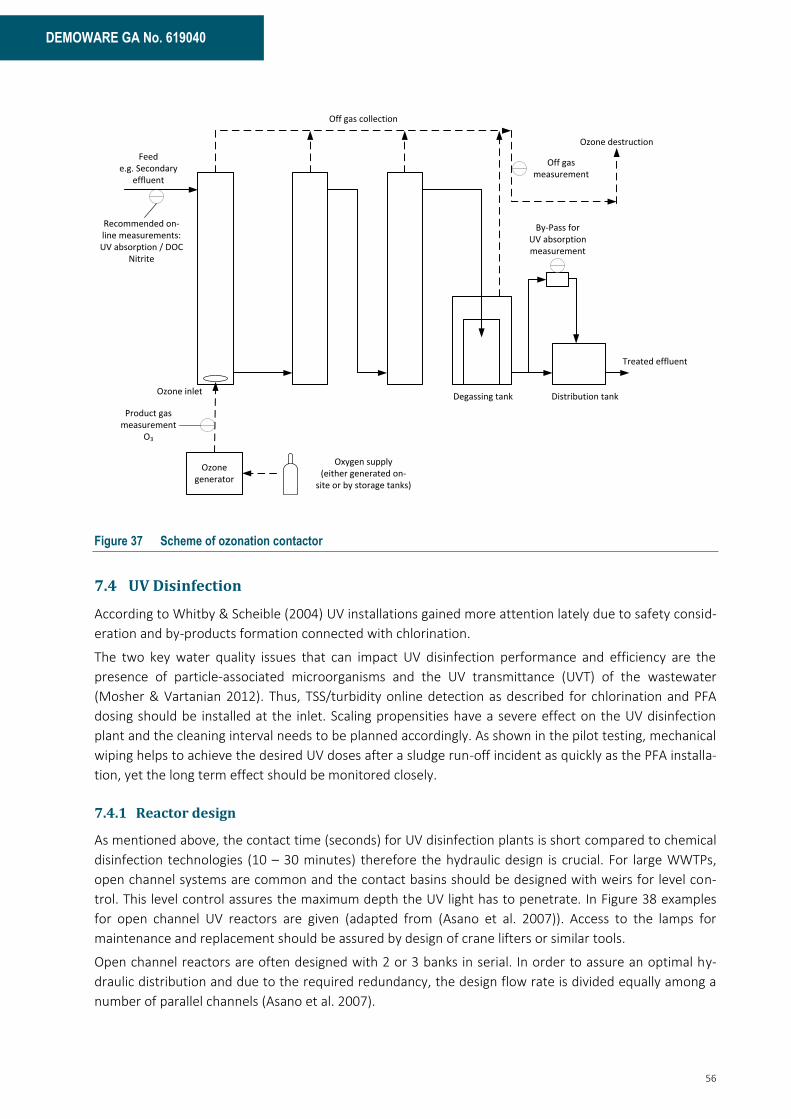
56
DEMOWARE GA No. 619040
Off gas collection
Off gas measurement
Ozone destruction
Ozone inlet
Feede.g. Secondary
effluent
Degassing tank Distribution tank
By-Pass forUV absorption measurement
Product gas measurement
O3
Treated effluent
Recommended on-line measurements:UV absorption / DOC
Nitrite
Ozone generator
Oxygen supply(either generated on-
site or by storage tanks)
Figure 37 Scheme of ozonation contactor
7.4 UV Disinfection
According to Whitby & Scheible (2004) UV installations gained more attention lately due to safety consid-
eration and by-products formation connected with chlorination.
The two key water quality issues that can impact UV disinfection performance and efficiency are the
presence of particle-associated microorganisms and the UV transmittance (UVT) of the wastewater
(Mosher & Vartanian 2012). Thus, TSS/turbidity online detection as described for chlorination and PFA
dosing should be installed at the inlet. Scaling propensities have a severe effect on the UV disinfection
plant and the cleaning interval needs to be planned accordingly. As shown in the pilot testing, mechanical
wiping helps to achieve the desired UV doses after a sludge run-off incident as quickly as the PFA installa-
tion, yet the long term effect should be monitored closely.
7.4.1 Reactor design
As mentioned above, the contact time (seconds) for UV disinfection plants is short compared to chemical
disinfection technologies (10 – 30 minutes) therefore the hydraulic design is crucial. For large WWTPs,
open channel systems are common and the contact basins should be designed with weirs for level con-
trol. This level control assures the maximum depth the UV light has to penetrate. In Figure 38 examples
for open channel UV reactors are given (adapted from (Asano et al. 2007)). Access to the lamps for
maintenance and replacement should be assured by design of crane lifters or similar tools.
Open channel reactors are often designed with 2 or 3 banks in serial. In order to assure an optimal hy-
draulic distribution and due to the required redundancy, the design flow rate is divided equally among a
number of parallel channels (Asano et al. 2007).
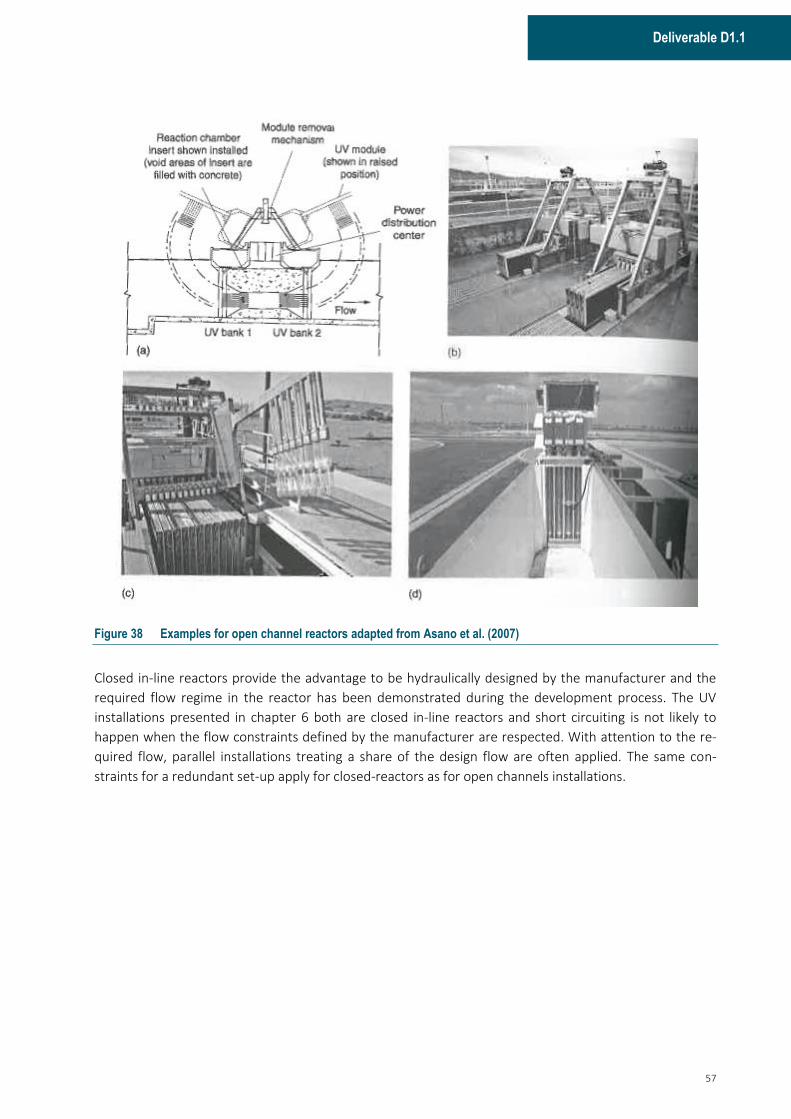
57
Deliverable D1.1
Figure 38 Examples for open channel reactors adapted from Asano et al. (2007)
Closed in-line reactors provide the advantage to be hydraulically designed by the manufacturer and the
required flow regime in the reactor has been demonstrated during the development process. The UV
installations presented in chapter 6 both are closed in-line reactors and short circuiting is not likely to
happen when the flow constraints defined by the manufacturer are respected. With attention to the re-
quired flow, parallel installations treating a share of the design flow are often applied. The same con-
straints for a redundant set-up apply for closed-reactors as for open channels installations.

58
DEMOWARE GA No. 619040
Figure 39 Examples for closed in-line UV reactors adapted from Asano et al. (2007) a) schematic of close reactor with flow perpendicular to UV lamps b) schematic of close reactor with flow parallel to UV lamps
c) view through in-line UV reactor (Trojan Technologies) d) view of installed UV system
7.4.2 Control strategy
Closed UV reactors usually have a UV probe installed at the wall of the reactor and this value is used to
maintain a minimum UV dose. This measurement serves as an alarm mechanism in order to detect lamp
ageing or deposition on the glass sleeves. The effectiveness of the UV system can be significantly dimin-
ished by increased values of TSS and/or NTU, see section 6.1.4. Therefore TSS/NTU measurements are
recommended in the inlet of the UV reactor. Measuring UV absorption at 254 nm at the inlet is another
possibility to increase the reliability, when the flow can be adapted accordingly. Increasing absorption
should be used to decrease the flow, which leads to a longer retention time inside the reactor. This
should lead to a stable disinfection performance.
When treating wastewater with a high scaling propensity special care is required and the cleaning interval
needs to be adapted. When regular chemical cleanings are required, an automated chemical cleaning
system in addition to the wiping system reduces the personnel efforts. The used chemicals need to be
handled according to their safety regulation.
7.5 Outlook control strategies
The development of on-line measurements detecting microbiological organisms (e.g. E. coli) or corre-
spondent enzymatic activity showed major progress recently and cost efficient solutions are thought to

59
Deliverable D1.1
be introduced in the coming years (Appels 2015; Ryzinska-Paier et al. 2014; Storey et al. 2011). When the
robustness of these systems is proven and the costs can be reduced to an acceptable amount, these sys-
tems can help to gain higher reliability levels by minimizing the risk of using water exceeding the concen-
tration limits. Maintenance intervals and precision of on-line analyses have to be tested on the specific
site in order to estimate these expenditures precisely.
The implementation of these tools can be done for all disinfection technologies and a direct measure-
ment of the indicator organisms on-line would significantly help to make the processes more reliable and
reduce the costs.
8 Cost estimation
8.1 WWTP Brunswick
Within Demoware pilot scale investigations comparing one chemical and one physical disinfection tech-
nology were carried out for WWTP Brunswick. An economic evaluation with regards to the disinfection
level and necessary reduction of indicator organisms is presented in the coming sections.
The net present value helps to compare different options considering investment, re-investment and
operational costs over the expected lifetime and cost evolution. Since ClO2 does not react with Ammonia
this disinfection agent was chosen for this economic evaluation.
It has to be noted that chlorination is not discussed for wastewater disinfection in Germany due to the
risk of AOX formation, so chlorination was not tested during the pilot scale trials.
Six set-ups are compared with changing assumptions for water flow, energy costs and chemical doses:
1. Ultraviolet radiation as a single line UV
2. Ultraviolet radiation in a redundant set-up UV (n+1)
3. Performic acid as a single line PFA
4. Performic acid in a redundant set-up PFA (n+1)
5. Ultraviolet radiation and performic acid as a back-up UV + PFA
6. Disinfection with ClO2 in a redundant set-up ClO2 (n+1)
The redundant set-up increases the safety and availability of the disinfection treatment, because all criti-
cal parts are installed twice. This means for the UV disinfection plant a second UV reactor is installed and
ready to use. A second reactor for PFA production and a second reactor for ClO2 production, respectively,
are installed and integrated in the control system for the latter set-ups. This increases the investment
costs to a great extent, but the operational cost only in minor parts, as only maintenance is affected by
the second installation. Depending on the reuse application and the local regulations, a redundant set-up
might be required to increase reliability requirements.
In order to reduce the increased investment costs for a UV system in a redundant set-up, a hybrid system
with one UV reactor and one PFA reactor (UV + PFA) was included in the cost estimation. The major part
(95 %) of the annual water treatment is done by the UV disinfection and only in cases of maintenance and
uncontrolled stops of the UV system, the PFA system is activated (5 %). This way, a redundant disinfection
treatment scheme can be installed with comparably low investment costs. Considering the operational
constraints of such a system, e.g. training of personnel for both systems, the decision for such a hybrid
system needs to be done carefully.
60
DEMOWARE GA No. 619040
The following assumptions were chosen to start with the cost estimation and kept constant, whereas
other factors are varied in order to show the sensibility of the disinfection step:
· Rate of interest (i): 3 %
· Planning costs 18 %
· Life time of construction: 30 years
· Lifetime of machinery: 12years
· Lifetime of electric equipment: 10 years
· Lifetime of UV lamps: 3 years
· Peak flow: 0.65 m3/s
· Evaluation over 30 years (n)
Costs for UV radiation can be assumed to be strongly dependent on investment costs, whereas PFA and
ClO2 are affected by operational costs. These different dependencies can be best compared by calculating
the net present value (NPV). The NPV gives the costs for an installation/process over the planned lifetime
in relation to the year when the investment is done. It is a financial tool to compare different investment
options. The NPV is calculated according to LAWA (2005) as follows:
The annual costs are the sum of operational costs and capital costs:
𝐴𝑛𝑛𝑢𝑎𝑙 𝑐𝑜𝑠𝑡𝑠 (𝐴𝐶) = 𝑜𝑝𝑒𝑟𝑎𝑡𝑖𝑜𝑛𝑎𝑙 𝑐𝑜𝑠𝑡𝑠 [𝐸𝑢𝑟𝑜
𝑎] + 𝑐𝑎𝑝𝑖𝑡𝑎𝑙 𝑐𝑜𝑠𝑡𝑠 [
𝐸𝑢𝑟𝑜
𝑎]
The operational costs are the yearly costs for energy, chemicals, labour, maintenance and spare
parts, e.g. UV lamps. The capital costs are calculated using the depreciation factor (DEF) based on
the interest rate and the economic lifetime:
𝐶𝑎𝑝𝑖𝑡𝑎𝑙 𝑐𝑜𝑠𝑡𝑠 = ∑ 𝑖𝑛𝑣𝑒𝑠𝑡𝑚𝑒𝑛𝑡 𝑐𝑜𝑠𝑡𝑠 [𝐸𝑢𝑟𝑜] ∗ 𝐷𝐸𝐹𝑖[1
𝑎]
𝑖
𝐷𝐸𝐹(𝑖, 𝑛) =(1 + 𝑖)𝑛 − 1
𝑖 ∗ (1 + 𝑖)𝑛
The NPV is now identified by the sum of the investment costs and the annual costs multiplied with the
discount factor (DF).
𝑁𝑃𝑉 = 𝐼𝑛𝑣𝑒𝑠𝑡𝑚𝑒𝑛𝑡 𝑐𝑜𝑠𝑡𝑠 + 𝑎𝑛𝑛𝑢𝑎𝑙 𝑐𝑜𝑠𝑡𝑠 ∗ 𝐷𝐹(𝑖, 𝑛)
Figure 40 shows the results for a total of 11 mio m3 of water being disinfected per year. The recommend-
ed doses of 2 g/m3 PFA, 35 Wh/m3 UV and 2.0 g/m3 ClO2 were used for design and operational cost con-
straints. An energy price of 0.12 €/kWh has been given by WWTP Brunswick as the current energy price.
WWTP Brunswick has a high production of biogas due to the co-fermentation of energy plants. Efficient
heat-and-power stations help to reduce the energy costs.
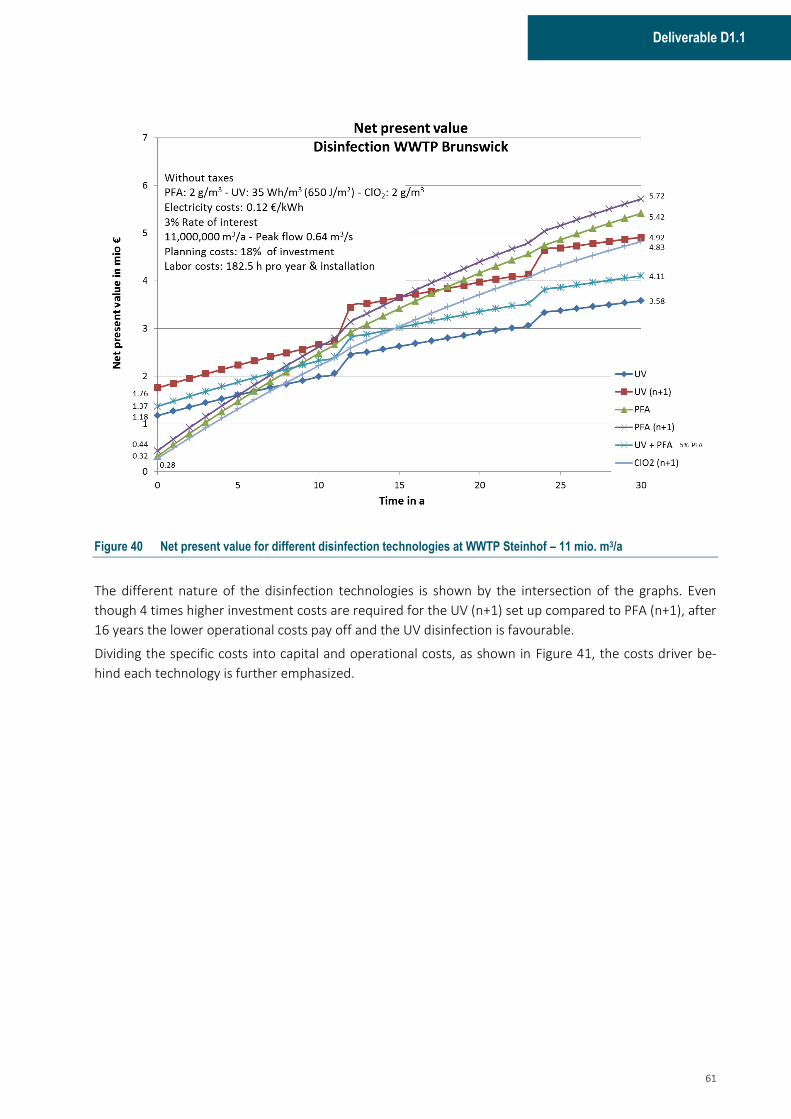
61
Deliverable D1.1
Figure 40 Net present value for different disinfection technologies at WWTP Steinhof – 11 mio. m3/a
The different nature of the disinfection technologies is shown by the intersection of the graphs. Even
though 4 times higher investment costs are required for the UV (n+1) set up compared to PFA (n+1), after
16 years the lower operational costs pay off and the UV disinfection is favourable.
Dividing the specific costs into capital and operational costs, as shown in Figure 41, the costs driver be-
hind each technology is further emphasized.
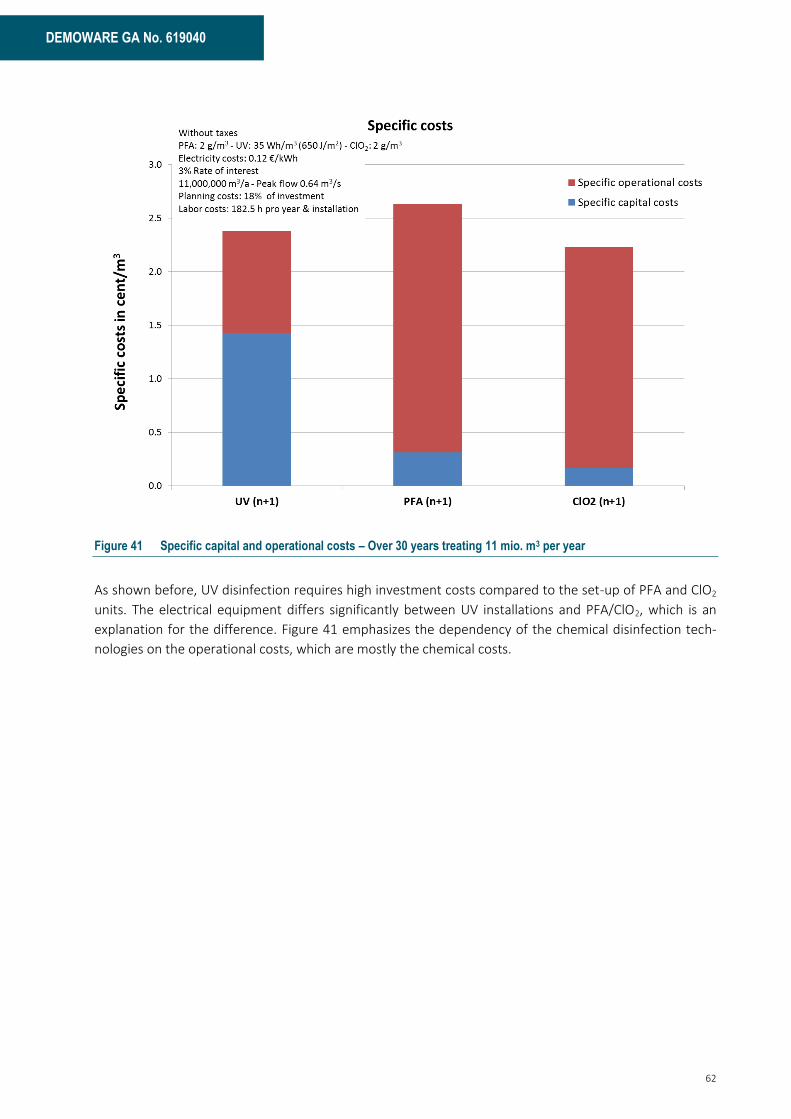
62
DEMOWARE GA No. 619040
Figure 41 Specific capital and operational costs – Over 30 years treating 11 mio. m3 per year
As shown before, UV disinfection requires high investment costs compared to the set-up of PFA and ClO2
units. The electrical equipment differs significantly between UV installations and PFA/ClO2, which is an
explanation for the difference. Figure 41 emphasizes the dependency of the chemical disinfection tech-
nologies on the operational costs, which are mostly the chemical costs.
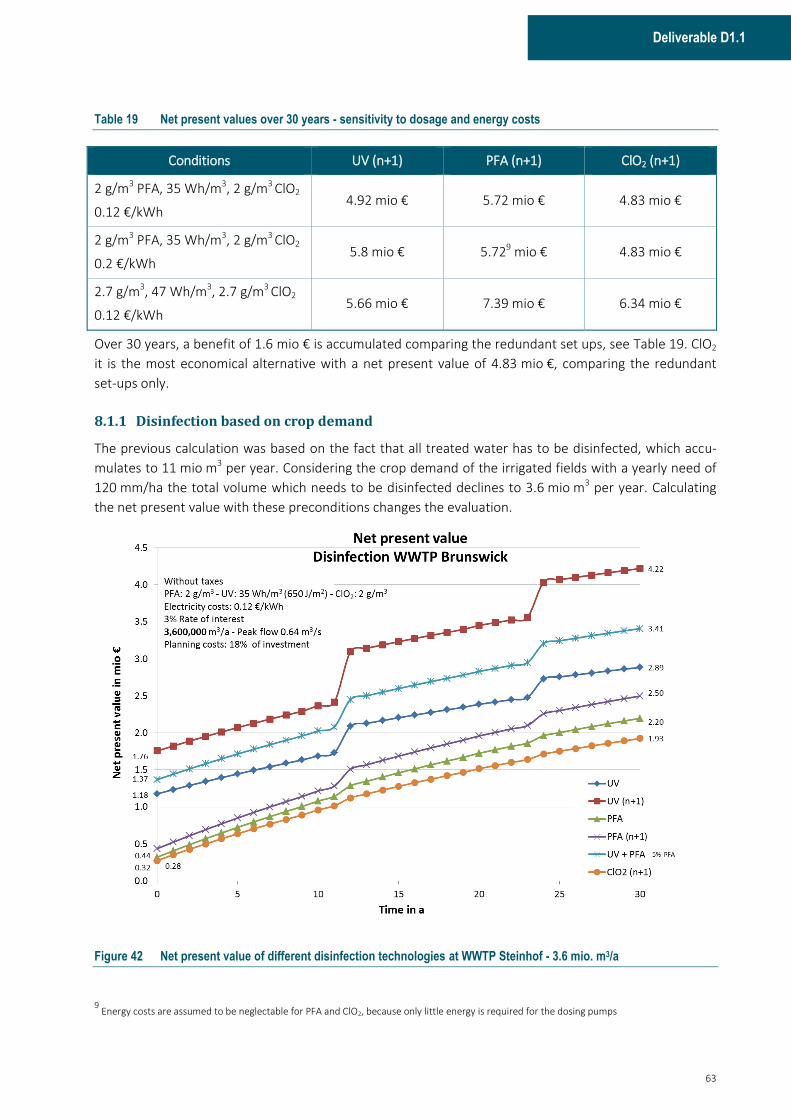
63
Deliverable D1.1
Table 19 Net present values over 30 years - sensitivity to dosage and energy costs
Conditions UV (n+1) PFA (n+1) ClO2 (n+1)
2 g/m3 PFA, 35 Wh/m3, 2 g/m3 ClO2
0.12 €/kWh 4.92 mio € 5.72 mio € 4.83 mio €
2 g/m3 PFA, 35 Wh/m3, 2 g/m3 ClO2
0.2 €/kWh 5.8 mio € 5.729 mio € 4.83 mio €
2.7 g/m3, 47 Wh/m3, 2.7 g/m3 ClO2
0.12 €/kWh 5.66 mio € 7.39 mio € 6.34 mio €
Over 30 years, a benefit of 1.6 mio € is accumulated comparing the redundant set ups, see Table 19. ClO2
it is the most economical alternative with a net present value of 4.83 mio €, comparing the redundant
set-ups only.
8.1.1 Disinfection based on crop demand
The previous calculation was based on the fact that all treated water has to be disinfected, which accu-
mulates to 11 mio m3 per year. Considering the crop demand of the irrigated fields with a yearly need of
120 mm/ha the total volume which needs to be disinfected declines to 3.6 mio m3 per year. Calculating
the net present value with these preconditions changes the evaluation.
Figure 42 Net present value of different disinfection technologies at WWTP Steinhof - 3.6 mio. m3/a
9 Energy costs are assumed to be neglectable for PFA and ClO2, because only little energy is required for the dosing pumps
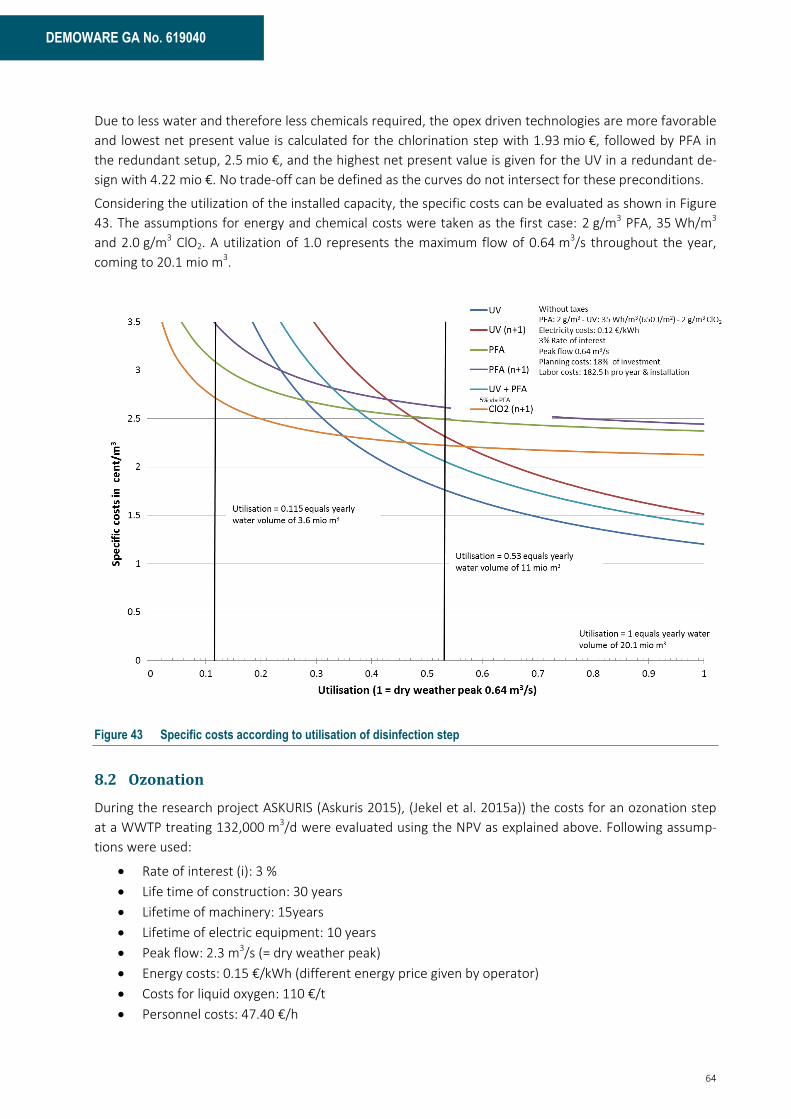
64
DEMOWARE GA No. 619040
Due to less water and therefore less chemicals required, the opex driven technologies are more favorable
and lowest net present value is calculated for the chlorination step with 1.93 mio €, followed by PFA in
the redundant setup, 2.5 mio €, and the highest net present value is given for the UV in a redundant de-
sign with 4.22 mio €. No trade-off can be defined as the curves do not intersect for these preconditions.
Considering the utilization of the installed capacity, the specific costs can be evaluated as shown in Figure
43. The assumptions for energy and chemical costs were taken as the first case: 2 g/m3 PFA, 35 Wh/m3
and 2.0 g/m3 ClO2. A utilization of 1.0 represents the maximum flow of 0.64 m3/s throughout the year,
coming to 20.1 mio m3.
Figure 43 Specific costs according to utilisation of disinfection step
8.2 Ozonation
During the research project ASKURIS (Askuris 2015), (Jekel et al. 2015a)) the costs for an ozonation step
at a WWTP treating 132,000 m3/d were evaluated using the NPV as explained above. Following assump-
tions were used:
· Rate of interest (i): 3 %
· Life time of construction: 30 years
· Lifetime of machinery: 15years
· Lifetime of electric equipment: 10 years
· Peak flow: 2.3 m3/s (= dry weather peak)
· Energy costs: 0.15 €/kWh (different energy price given by operator)
· Costs for liquid oxygen: 110 €/t
· Personnel costs: 47.40 €/h
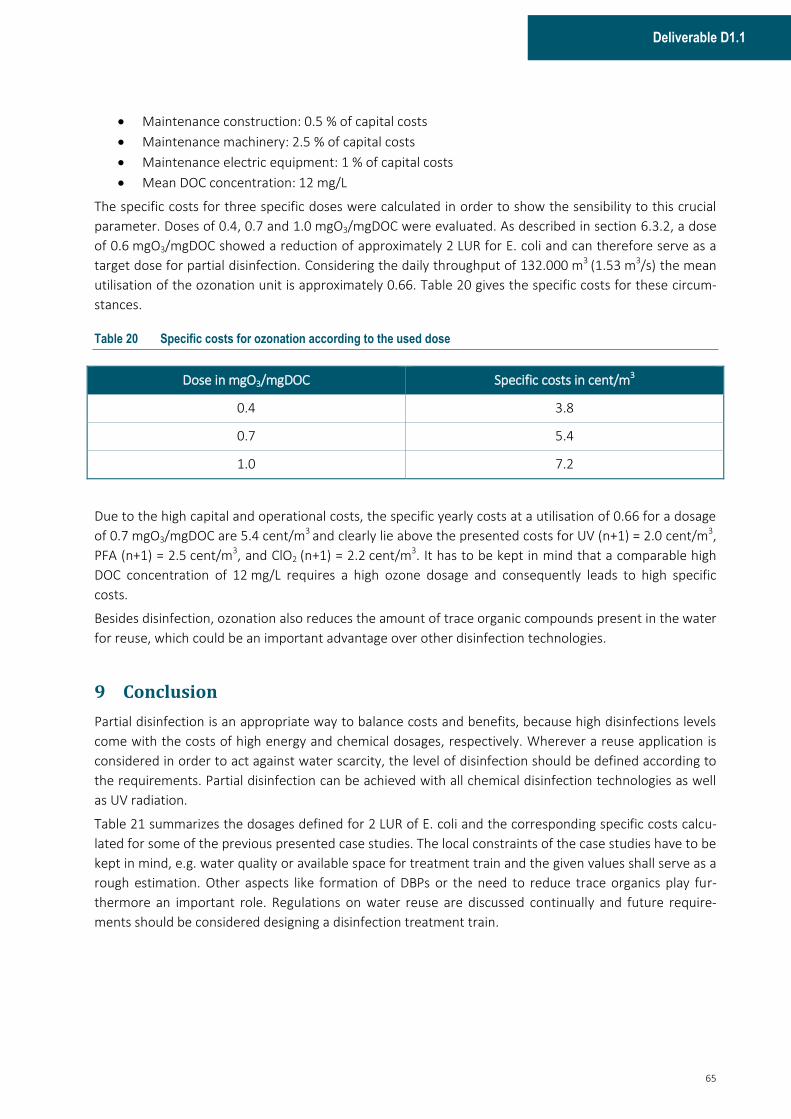
65
Deliverable D1.1
· Maintenance construction: 0.5 % of capital costs
· Maintenance machinery: 2.5 % of capital costs
· Maintenance electric equipment: 1 % of capital costs
· Mean DOC concentration: 12 mg/L
The specific costs for three specific doses were calculated in order to show the sensibility to this crucial
parameter. Doses of 0.4, 0.7 and 1.0 mgO3/mgDOC were evaluated. As described in section 6.3.2, a dose
of 0.6 mgO3/mgDOC showed a reduction of approximately 2 LUR for E. coli and can therefore serve as a
target dose for partial disinfection. Considering the daily throughput of 132.000 m3 (1.53 m3/s) the mean
utilisation of the ozonation unit is approximately 0.66. Table 20 gives the specific costs for these circum-
stances.
Table 20 Specific costs for ozonation according to the used dose
Dose in mgO3/mgDOC Specific costs in cent/m3
0.4 3.8
0.7 5.4
1.0 7.2
Due to the high capital and operational costs, the specific yearly costs at a utilisation of 0.66 for a dosage
of 0.7 mgO3/mgDOC are 5.4 cent/m3 and clearly lie above the presented costs for UV (n+1) = 2.0 cent/m3,
PFA (n+1) = 2.5 cent/m3, and ClO2 (n+1) = 2.2 cent/m3. It has to be kept in mind that a comparable high
DOC concentration of 12 mg/L requires a high ozone dosage and consequently leads to high specific
costs.
Besides disinfection, ozonation also reduces the amount of trace organic compounds present in the water
for reuse, which could be an important advantage over other disinfection technologies.
9 Conclusion
Partial disinfection is an appropriate way to balance costs and benefits, because high disinfections levels
come with the costs of high energy and chemical dosages, respectively. Wherever a reuse application is
considered in order to act against water scarcity, the level of disinfection should be defined according to
the requirements. Partial disinfection can be achieved with all chemical disinfection technologies as well
as UV radiation.
Table 21 summarizes the dosages defined for 2 LUR of E. coli and the corresponding specific costs calcu-
lated for some of the previous presented case studies. The local constraints of the case studies have to be
kept in mind, e.g. water quality or available space for treatment train and the given values shall serve as a
rough estimation. Other aspects like formation of DBPs or the need to reduce trace organics play fur-
thermore an important role. Regulations on water reuse are discussed continually and future require-
ments should be considered designing a disinfection treatment train.

66
DEMOWARE GA No. 619040
Table 21: Dosages and specific costs of case studies – 2 LUR for E. coli
PFA10 UV10 Ozone11 ClO212
Dosages for 2 LUR
for E.coli 2 g/m3 35 Wh/m3 – 650 J/m2 0.7 mgO3/mgDOC 2 g/m3
Specific costs
cent/m3 2.6 2.4 5.4 2.2
The ongoing development of online analysis, e.g. microbiological analysis, increases the precision and
availability and reduces the maintenance effort at the same time. The implementation of these analytical
tools helps to obtain the goal of partial disinfection and will increase the robustness of the system. Con-
trol schemes using these online tools apply only the necessary dosage for a given application and opera-
tion is more economic and sustainable through savings of energy and chemicals, respectively.
10 Results of pilot trials at WWTP Brunswick, with a utilization of 0.53
11 Results of R&D project Askuris, Jekel et al., M. (2015a) ASKURIS - Anthropogene Spurenstoffe und Krankheitserreger im urbanen
Wasserkreislauf: Bewertung, Barrieren und Risikokommunikation (Abschlussbericht) - (available online 03/2016 - http://www.askuris.tu-
berlin.de/).
12 Theoretical evaluation based on experience – precise figures require pilot scale testing

67
Deliverable D1.1
10 Bibliography
Wastwater Technology Fact Sheet - Chlorine Disinfection. (1999)
Alcade-Sanz, L. & Gawlik, B. M. (2014) Water Reuse in Europe - Relevant guidelines, needs for and barriers to innovation. European Commission doi:10.2788/29234
Appels, J. (2015) Automated online microbiological water quality monitoring is possible now, In Water Reuse in Texas - Extending Our Water Frontier. Lubbock
Asano, T., Burton, F. L., Leverenz, H., Tsuchihashi, R. & Tchobanoglous, G. (2007) Water reuse: issues, technologies, and applications. New York: McGraw-Hill
Askuris (2015). http://www.askuris.tu-berlin.de/ (Accessed 06.01.2016)
California Department of Public Health (2014) Regulations Related to Recycled Water.
Chick, H. (1908) An Investigation of the Laws of Disinfection. Epidemiology & Infection 8 (01): 92-158
Crittenden, J. C., Trussel, R. R., Hand, D. W., Howe, K. J. & Tchobanoglous, G. (2012) water treatment: principles and design. Canada: MWH
Deutsches Institut für Normung: DIN 19650:1999, Bewässerung - Hygienische Belange von Bewässerungswasser.
Arbeitsblatt W 224 - Verfahren zur Desinfektion von Trinkwasser mit Chlordioxid. (2008)
EPA Victoria (2003) Guidelines for Environmental Management - Use of reclaimed water. p. 101.
Falsanisi, D., Gehr, R., Lorenzo, L. & Notarnicola, M. (2008) Effect of Suspended Particles on Disinfection of a Physicochemical Municipal Wastewater with Peracetic Acid. Water Quality Research Journal Canada 43 (1): 7
Gehr, R., Chen, D. & Moreau, M. (2009) Performic acid (PFA): Tests on an advanced primary effluent show promising disinfection performance. Water Science and Technology 59 (1): 89-96
Gerrity, D., Gamage, S., Jones, D., Korshin, G. V., Lee, Y., Pisarenko, A., Trenholm, R. A., Von Gunten, U., Wert, E. C. & Snyder, S. A. (2012) Development of surrogate correlation models to predict trace organic contaminant oxidation and microbial inactivation during ozonation. Water research 46 (19): 6257-6272
Gnirrs, R., Lüdicke, C., Beraktschjan, M., Renner, P., Feuerpfeil, I., Dizer, H., Szewzyk, R. & Selinka, H.-C. (2015) Abwasserdesinfektion - Verfahrensvergleich in Bezug auf Indikatororganismen. Korrespondent Abwasser - Abfall 62 (3)
Hijnen, W. A. M., Beerendonk, E. F. & Medema, G. J. (2006) Inactivation credit of UV radiation for viruses, bacteria and protozoan (oo)cysts in water: A review. Water Research 40 (1): 3-22
Hochstrat, R. & Wintgens, T. (2015) Qualitative und hygienische Aspekte bei der Nutzung von aufbereitetem Abwasser zur landwirtschaftlichen Bewässerung, In Abwassernutzung in der Landwirtschaft. Berlin
Höll, K. (2002) Wasser - Nutzung im Kreislauf; Hygiene, Analyse und Bewertung. Berlin: de Gruyter
IST4R (2015). http://www.wrh.tu-berlin.de/menue/forschung/projekte/ist4r/ (Accessed 06.01.2016)
Jekel et al., M. (2015a) ASKURIS - Anthropogene Spurenstoffe und Krankheitserreger im urbanen Wasserkreislauf: Bewertung, Barrieren und Risikokommunikation (Abschlussbericht) - (available online 03/2016 - http://www.askuris.tu-berlin.de/).
Jekel, M., Altmann, J., Ruhl, A., Sperlich, A., Schaller, J., Gnirß, R., Miehe, U., Stapf, M., Remy, C. & Mutz, D. (2015b) Vergleich verschiedener Verfahrensvarianten der weitergehenden Abwasserreinigung zur Entlastung der Berliner Gewässer – Integration der Spurenstoffentfernung in Technologieansätze der 4. Reinigungsstufe bei Klärwerken.

68
DEMOWARE GA No. 619040
Karpova, T., Pekonen, P., Gramstad, R., Öjstedt, U., Laborda, S., Heinonen-Tanski, H., Chávez, A. & Jiménez, B. (2013) Performic acid for advanced wastewater disinfection. Water Science and Technology 68 (9): 2090-2096
LAWA (2005) Leitlinien zur Durchführung dynamischer Kostenvergleichsrechnungen (KVR-Leitlinien) (Guidelines for dynamic calculation of cost comparison). Länderarbeitsgemeinschaft Wasser
Mosher, J. J. & Vartanian, G. M. (2012) Ultraviolet Disinfection - Guideline for Drinking Water and Water Reuse. National Water Research Institute in collaboration with Water Research Foundation
Ncube, E. J. (2015) Water Scarcity, a driver for water reclamation, reuse and collaboration. http://www.unisa.ac.za/default.html
NHMRC, NRMMC: Australian Drinking Water Guidelines Paper 6 National Water Quality Management Strategy. (2015)
National Guidelines for Water Recycling: Managing Health and Environmental Risks - Phase 1. (2006)
National Guidelines for Water Recycling: Managing Health and Environmental Risks - Phase 2. (2008)
PUB (2015). http://www.pub.gov.sg/general/Pages/NotificationCertification.aspx (Accessed 10.06.2015)
Spain, Ministerio de la Presidencia (Ministry of Environment): Royal decree 1620/2007 Water reuse regulation. (2007)
Reddy, M. & Pagilla, K. (2009) Integrated Methods for Wastewater Treatment Plant Upgrading and Optimization. Water Environment Research Foundation WERF
Ryzinska-Paier, G., Lendenfeld, T., Correa, K., Stadler, P., Blaschke, A. P., Mach, R. L., Stadler, H., Kirschner, A. K. T. & Farnleiter, A. H. (2014) A sensitive and robust method for automated on-line monitoring of enzymatic activities in water and water resources. Water Science and Technology 69 (6)
Seis, W. (2012) Risk assessment of Braunschweig wastewater reuse scheme. TU Berlin
Stapf, M. & Miehe, U. (2015) Application of ultraviolet absorption measurement for closed-loop control of tertiary ozonation, In IOA, 22nd World Congress & Exhibition. Barcelona
Storey, M. V., van der Gaag, B. & Burns, B. P. (2011) Advances in on-line drinking water quality monitoring and early warning systems. Water Research 45 (2): 741-747
Stüber, J. & Godehardt, M. (2013) Tertiary treatment combining ozonation and membrane filtration – Pilot scale investigations - Final report OXERAM. Kompetenzzentrum Wasser Berlin gGmbH www.kompetenz-wasser.de
Tchobanoglous, G., Stensel, D. H., Tsuchihashi, R. & Burton, F. L. (2014) Wastewater Engineering - Treatment and Resource Recovery. New York: McGraw-Hill
WaterWorld (2012) Wastewater reuse relieves agricultural irrigation drought in Israel. http://www.waterworld.com/articles/2012/01/wastewater-reuse-relieves-agricultural-irrigation-drought-in-israel.html (Accessed 10.06.2015)
Watson, H. E. (1908) A Note on the Variation of the Rate of Disinfection with Change in the Concentration of the Disinfectant. Epidemiology & Infection 8 (04): 536-542
Whitby, G. E. & Scheible, O. K. (2004) The History of UV and Wastewater. IUVA NEWS 6 (3): 12
Guidlines for Drinking-water Quality. (2004)
WHO (2006) Guidelines for the safe Use of Wastewater, Excreta and Greywater. p. 222. Wastewater use in agriculture.
WssTP (2013) Water Reuse: Research and Technology Development Needs.

69
Deliverable D1.1
11 Appendix
Table 22 Microorganisms present in treated wastewaters and diseases caused (adapted from Alcade-Sanz & Gawlik
(2014), Adams et al. (1999), (Hochstrat & Wintgens 2015) and Tchobanoglous et al. (2014))
Organism Disease caused
Escheria coli Gastroenteritis
Leptospira (spp.) Leptospirosis
Salmonella typhi Typhoid fever
Salmonella (=2100 serotypes) Salmonellosis
Shigella (4 spp.) Shigellosis (bacillary dysentery)
Vibrio cholerae Cholera
Campilobacter jejuni Gastroenteritis
EHEC Hemolytic urmic syndrom (HUS)
Leptospira spp. Leptospirose
Shigella Shigellose (dysentery)
Vibrio cholera Cholera
Yersinia enterocolitica Yersinose, Gastroenteritis
Legionella Pneumonia
Balantidium coli Balantidiasis
Cryptosporidium parvum Cryptosporidiosis, diarrhea, Fever
Entamoeba histolytica Amebiasis (amoebic dysentery)
Giardia lamblia Gardia
Helminths
Ascaris lumbricoides Ascariasis
T. Solium Taeniasis
Trichuris trichiura Trichuriasis
Enteroviruses (72 types, e.g. polio echo, and coxsackie viruses)
Gastroenteritis, heart anomalies, meningitis
Hepatitis A virus Hepatitis
Norwalk agent Gastroenteritis
Rotavirus Gastroenteritis
Norovirus Gastroenteritis
Adenovirus Conjunctivitis
Gastroenteritis
Table 23 Standards on water reuse – Europe and Worldwide; adopted from Alcade-Sanz & Gawlik (2014) and own
review
Country Standard / Guideline Issuing organization
Cyprus Law 106 (l) 2002 Water and Soil pollution control and associated regulations KDP 772/2003, KDP
Ministry of Agriculture, Natural re-sources and Environment Water development Department
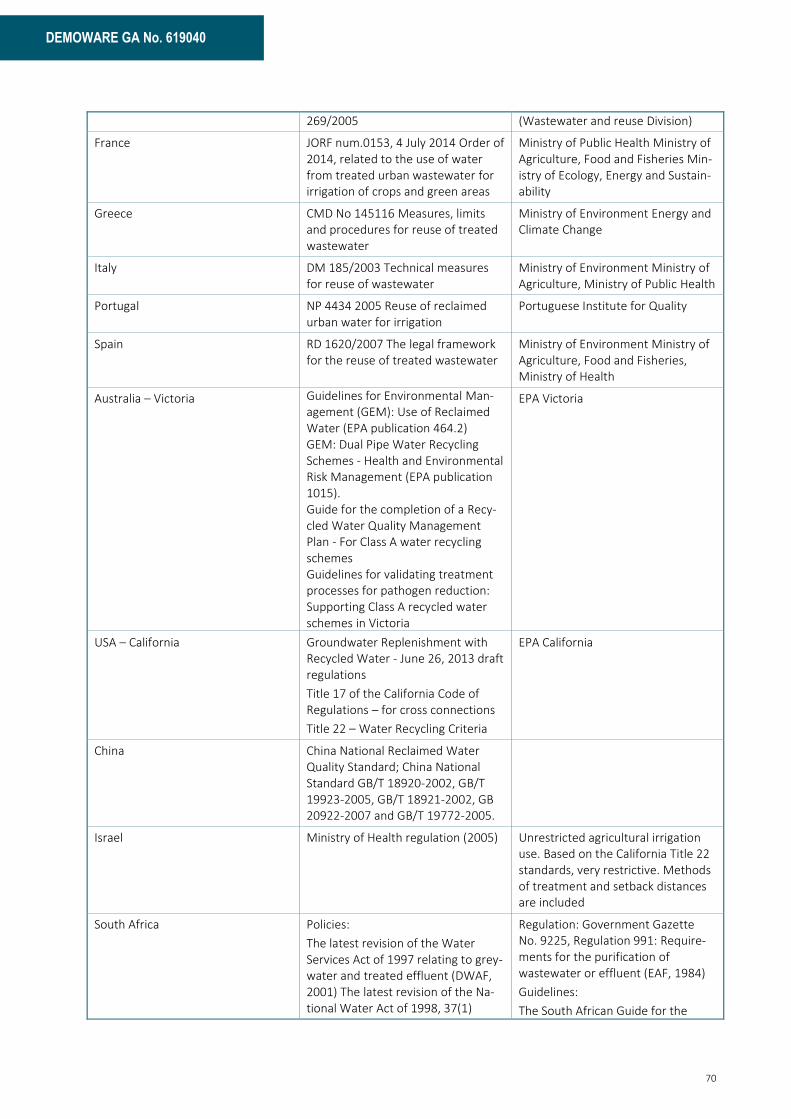
70
DEMOWARE GA No. 619040
269/2005 (Wastewater and reuse Division)
France JORF num.0153, 4 July 2014 Order of 2014, related to the use of water from treated urban wastewater for irrigation of crops and green areas
Ministry of Public Health Ministry of Agriculture, Food and Fisheries Min-istry of Ecology, Energy and Sustain-ability
Greece CMD No 145116 Measures, limits and procedures for reuse of treated wastewater
Ministry of Environment Energy and Climate Change
Italy DM 185/2003 Technical measures for reuse of wastewater
Ministry of Environment Ministry of Agriculture, Ministry of Public Health
Portugal NP 4434 2005 Reuse of reclaimed urban water for irrigation
Portuguese Institute for Quality
Spain RD 1620/2007 The legal framework for the reuse of treated wastewater
Ministry of Environment Ministry of Agriculture, Food and Fisheries, Ministry of Health
Australia – Victoria Guidelines for Environmental Man-agement (GEM): Use of Reclaimed Water (EPA publication 464.2) GEM: Dual Pipe Water Recycling Schemes - Health and Environmental Risk Management (EPA publication 1015). Guide for the completion of a Recy-cled Water Quality Management Plan - For Class A water recycling schemes Guidelines for validating treatment processes for pathogen reduction: Supporting Class A recycled water schemes in Victoria
EPA Victoria
USA – California Groundwater Replenishment with Recycled Water - June 26, 2013 draft regulations
Title 17 of the California Code of Regulations – for cross connections
Title 22 – Water Recycling Criteria
EPA California
China China National Reclaimed Water Quality Standard; China National Standard GB/T 18920-2002, GB/T 19923-2005, GB/T 18921-2002, GB 20922-2007 and GB/T 19772-2005.
Israel Ministry of Health regulation (2005) Unrestricted agricultural irrigation use. Based on the California Title 22 standards, very restrictive. Methods of treatment and setback distances are included
South Africa Policies:
The latest revision of the Water Services Act of 1997 relating to grey-water and treated effluent (DWAF, 2001) The latest revision of the Na-tional Water Act of 1998, 37(1)
Regulation: Government Gazette No. 9225, Regulation 991: Require-ments for the purification of wastewater or effluent (EAF, 1984)
Guidelines:
The South African Guide for the

71
Deliverable D1.1
(DWAF, 2004a) relating to irrigation of any land with waste or water containing waste generated through any industrial activity or by a water works
Permissible Utilization and Disposal of Treated Effluent (DNHPD, 1978) The South African Water Quality Guidelines (DWAF, 1996)

72
DEMOWARE GA No. 619040
Table 24 Water for irrigation purposes - DIN 19650
Quality category Use
Faecal-
streptococci
colony count per 100 ml
E. Coli
Colony count per 100 ml
Salmonellae
per 1,000 ml
Potenially infectious stages of human and
domestic animal para-sites
Per 1,000 ml
1 (drinking water) No restriction Non-detectable Non-detectable Non-detectable Non-detectable
2 a) Outdoor and greenhouse crops intended for raw consump-tion
b) School sports grounds, public parks
≤ 100 ≤ 200 Non-detectable Non-detectable
3 a) Greenhouse crops not intended for consumption
b) Outdoor crops for raw consumption before fruit develop-ment or vegetables up to two weeks before harvesting
c) Fruit and vegetables for preserving
d) Pasture or herbage up to two weeks before mowing or graz-ing
e) All other outdoor crops
f) Other sports grounds
≤ 400 ≤ 2,000 Non-detectable Non-detectable
4 a) For protecting wine and fruit crops from frost
b) Cultivated forests, logging sites and wet habitats
c) Sugar beet, starch potatoes, oil- seed fruits, nonfood plants for industrial processing and seed stock up to two weeks before harvesting (not for raw consumption)
d) Cereals up to green ripeness
e) Fodder for silage up to two weeks before harvesting
Wastewater which has passed through at least one bio-logical purification stage
a) No standard recommendation possible for intes-tinal nematodes
b) Taenia stages not detectable

73
Deliverable D1.1
Table 25 Classes of reclaimed water and corresponding standards for biological treatment and pathogen reduction -
(EPA Victoria 2003)
Class Water quality objectives -
medians unless specified
Treatment processes Range of uses– uses in-clude all lower class uses
A Indicative objectives
· < 10 E. coli org/100 mL
· Turbidity < 2 NTU
· < 10 / 5 mg/L BOD / SS
· pH 6 – 9
· 1 mg/L Cl2 residual (or equivalent disinfection)
Tertiary and pathogen
reduction with sufficient log
reductions to achieve:
<10 E. coli per 100 mL;
<1 helminth per litre;
< 1 protozoa per 50 litres; &
< 1 virus per 50 litres.
Urban (non-potable): with uncontrolled public access Agricultural: e.g. human food crops consumed raw Industrial: open systems with worker exposure potential
B · <100 E. coli org/100 mL
· pH 6 – 9
· < 20 / 30 mg/L BOD / SS
Secondary and pathogen (including helminth reduction for cattle graz-ing) reduction
Agricultural: e.g. dairy cattle grazing Industrial: e.g. washdown water
C · <1,000 E. coli org/100 mL
· pH 6 – 9
· < 20 / 30 mg/L BOD / SS
Secondary and pathogen reduction (including helminth reduction for cattle grazing use schemes)
Urban (non-potable): with controlled public access Agricultural: e.g. human food crops cooked/processed, graz-ing/fodder for livestock Industrial: systems with no potential worker exposure
D · <10,000 E. coli org/100 mL
· pH 6 – 9
· < 20 / 30 mg/L BOD / SS
Secondary Agricultural: non-food crops including instant turf, woodlots, flowers