delivering · 04 eurochem annual report and accounts 2018 ensuring long-term supply across all...
TRANSCRIPT

2018 Annual Report and Accounts
Delivering world-class nutrients
Delivering world-class nutrients
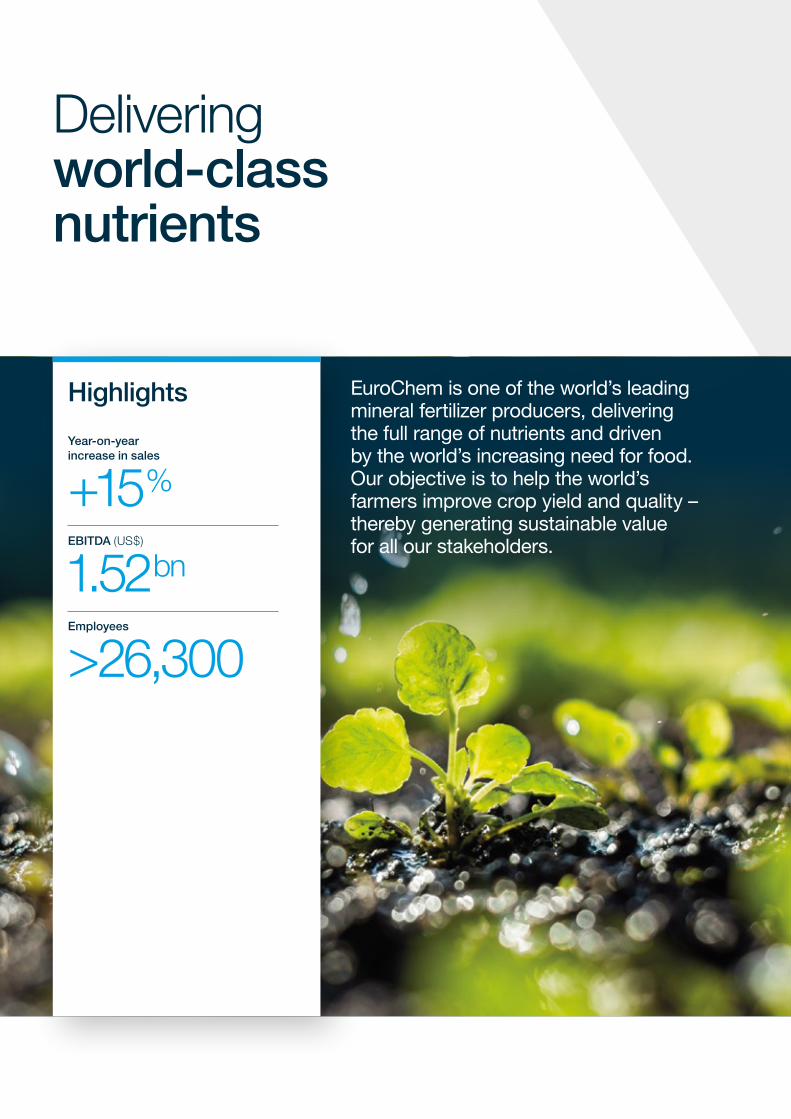
EuroChem is one of the world’s leading mineral fertilizer producers, delivering the full range of nutrients and driven by the world’s increasing need for food. Our objective is to help the world’s farmers improve crop yield and quality – thereby generating sustainable value for all our stakeholders.
Highlights
Year-on-year increase in sales
+15%
EBITDA (US$)
1.52bn
Employees
>26,300

EuroChem Annual Report and Accounts 2018 01
Strategic Report Corporate Governance Financial Statements
Strategic Report
02 Delivering world-class nutrients
14 Geographic footprint
16 Product portfolio
18 Chairman’s statement
20 Market overview
24 Business model
26 Stakeholder engagement
28 Our strategy
30 Performance review
44 Sustainability review
62 Risks and uncertainties
Governance
66 Board of Directors
68 Corporate Governance report
74 Audit Committee
76 Strategy Committee
78 Nomination and Remuneration Committee
Financial Statements
81 Independent Auditors’ Report
86 Consolidated Statement of Financial Position
88 Consolidated Statement of Profit or Loss
89 Consolidated Statement of Comprehensive Income
90 Consolidated Statement of Cash Flows
92 Consolidated Statement of Changes in Equity
93 Notes to the Consolidated Financial Statements
155 Contact information
156 EuroChem reporting awards
Potash on streamWith potash mining underway, EuroChem is one of just three global fertilizer companies with capacity in all three primary nutrients: nitrogen, phosphates and potash.
See page 02
Operating on the global stageWe have an established presence around the world with production facilities in Europe, Asia, and the CIS – supported by comprehensive distribution capabilities.
See page 06
Focused on our customers’ needsWith access to vast high-quality natural resources and an extensive portfolio of both standard and premium products, we aim to meet all farmers’ plant nutrition requirements.
See page 10

02 EuroChem Annual Report and Accounts 2018
Delivering world-class nutrients
Potash on stream, completing the full range of mineral fertilizers
EuroChem is now one of only three companies in the world with production capacity in all three primary nutrient groups. We are able to make a full range of nitrogen, phosphate and potash fertilizers to help farmers meet the world’s food production challenge.
From discovery...
Read more about our strategic priorities on page 28

EuroChem Annual Report and Accounts 2018 03
Delivering sustainable competitive advantageOur strategy is to add value through low-cost vertical integration. Access to world-class resources, cost-efficient, flexible production capacity and our own logistics and global distribution network gives us significant competitive advantages. Our presence in key markets enables us to serve an extensive customer base around the world.
Strategic Report Corporate Governance Financial Statements
Increase in fertilizer sales (by volume)
+2%
Fertilizer sales volumes
14.1MMT
Number of customers worldwide
>10,000
>10BMTof potash reserves and resources in Russia
...to distribution

04 EuroChem Annual Report and Accounts 2018
Ensuring long-term supply across all nutrient categories
Delivering world-class nutrients
A landmark moment for EuroChemIn 2018 we began production of potassium chloride at our Usolskiy plant in the Perm region. The commissioning process saw 15 mining machines in operation by the year end. Construction and installation at train 2 was completed, with both trains 1 and 2 working at projected capacity. The total length of headings at the end of the year amounted to 73 kilometres.
Usolskiy mined 1.38 million metric tonnes (MMT) of potash ore in 2018. Once fully operational, Phase 1 will have a total annual production capacity of 2.3 MMT of muriate of potash, or MOP, the most commonly used potash fertilizer in agriculture.
Work advanced at our VolgaKaliy project in the Gremyachinskoe potash deposit, Volgograd region. Below ground, the two skip shafts were successfully connected and implementation of the cage shaft programme continued. The total hoisting capacity of the two skip shafts is 10 MMT of ore per annum.
Investment in potash projects to date1 (US$)
4.58bn
Muriate of potash produced at Usolskiy in 2018
250KMT
Average KCl content at Usolskiy
30.8%
Mine workings at VolgaKaliy
1. Historical currency rates were used for the calculation of the investment.

Strategic Report Corporate Governance Financial Statements
EuroChem Annual Report and Accounts 2018 05
How our stakeholders benefit
Over the past seven years we have made considerable investments in the development of our greenfield potash projects in the Perm and Volgograd regions. This continued commitment underpins the sustainable growth of our business – and contributes significantly to the local economies where we operate.
CommunitiesAs a major employer in Kotelnikovo and Berezniki, EuroChem’s presence has a considerable influence on the local economy. Hence our investment in community infrastructure contributes to the success of our major potash projects at VolgaKaliy and Usolskiy. Our ongoing support continues to improve the urban fabric in these communities.
EmployeesWe offer a safe and progressive working environment for our employees. More than 1,800 people work at Usolskiy and a further 1,300 are employed at VolgaKaliy. Attractive leisure and recreational facilities help us secure and retain the services of talented and motivated staff, which is fundamental to our long-term growth strategy.
Partners and suppliersAs a major business investing billions of dollars in our potash operations, engagement with local and regional contractors and suppliers creates jobs and drives economic growth. The resulting improvements create a virtuous circle by attracting other business investors.
CustomersOur highly cost-competitive potash production will benefit our customers globally, through improved access to affordable, high-quality complex fertilizers. These are essential in enabling growers to make the right decisions about plant nutrition, improve their crop yields and meet growing world demand for food.
“ For me, EuroChem is a space where ambitions materialise. In my five years here, I’ve experienced both professional and personal growth. I set out my plans, and the Company gives me the opportunities to realise them. Two years ago I obtained a management training qualification thanks to our staff development programme. I’m a technical specialist; I’m really interested in this field and loved my training sessions. Having a real chance to grow within a robust and stable company is why I like working at EuroChem.”
Ivan ManakaSenior Specialist, Engineering and Process Team, EuroChem-VolgaKaliy
Voice from the workplace

06 EuroChem Annual Report and Accounts 2018
Delivering world-class nutrients
Operating on the global stage
Extending our distribution reach has enabled us to consistently grow the amount of product we bring to market. This has brought us closer to our customers, while channelling valuable market intelligence and strategic opportunities back to us, allowing us to further refine our offering and approach.
From local...
Read more about our increasing market share on pages 20-21

EuroChem Annual Report and Accounts 2018 07
Delivering an optimised supply of nutrients globallyIn 2018 we continued to expand our logistics activities and worldwide sales presence, giving us additional depth in key global markets. This has enabled us to build enduring partnerships with our customers and deliver the required volumes of products, on time, throughout the year.
Geography of sales (%)
■ 1 Europe 29
■ 2 Latin America 21
■ 3 Russia 19
■ 4 North America 15
■ 5 Asia Pacific 9
■ 6 CIS1 5
■ 7 Africa 2
1. Including associate states, excluding Russia.
>100countries where we have long-established customer relationships
...to global
Strategic Report Corporate Governance Financial Statements
1
23
4
56 7

08 EuroChem Annual Report and Accounts 2018
Growing a robust network of international relationships
Delivering world-class nutrients
Committed to the world’s biggest fertilizer marketEuroChem signed a Memorandum of Understanding with Heilongjiang Beidahuang Farms, part of Beidahuang Group, China’s largest agricultural company, to supply potash and other NPK fertilizers. The Memorandum – which was signed at our Usolskiy potash mine in July – highlights our determination to become a key supplier to the world’s most important agricultural market.
First potash agreement in AfricaIn June, we signed a take-or-pay agreement for the purchase of up to 100% of the expected future sulphate of potash (SOP) output from the Colluli Potash Project in Eritrea, East Africa. SOP is a premium fertilizer product suited to crops such as fruit, vegetables and coffee,
and represents EuroChem’s increased focus on premium products. The contract, for a 10-year term, with an option to extend for a further three years, is the first such agreement by EuroChem in Africa. It gives us access to an economically attractive SOP greenfield project that is well placed to supply the world’s fastest-growing markets. Annual output of around 472,000 tonnes is envisaged.
Delivering an optimised supply of nutrients globallyEuroChem’s logistics infrastructure supports our vertically integrated business model. Our global distribution network ensures the efficient supply of a complete range of fertilizers – from our standard offering to premium grade products – to customers around the world.
We continue to expand our global footprint. We have broadened our distribution capabilities to widen the availability of our products to more farmers around the world. We are forging and maintaining strong relationships with partners and suppliers to help us meet our customers’ specific needs.
Fertilizer sales volumes
14.1MMT
Increase in total US$ sales
+15%
EBITDA (US$)
1.52bn
EuroChem and Heilongjiang Beidahuang Farms representatives sign the MOU at our Usolskiy mine
Strategic Report Corporate Governance Financial Statements
EuroChem Annual Report and Accounts 2018 09
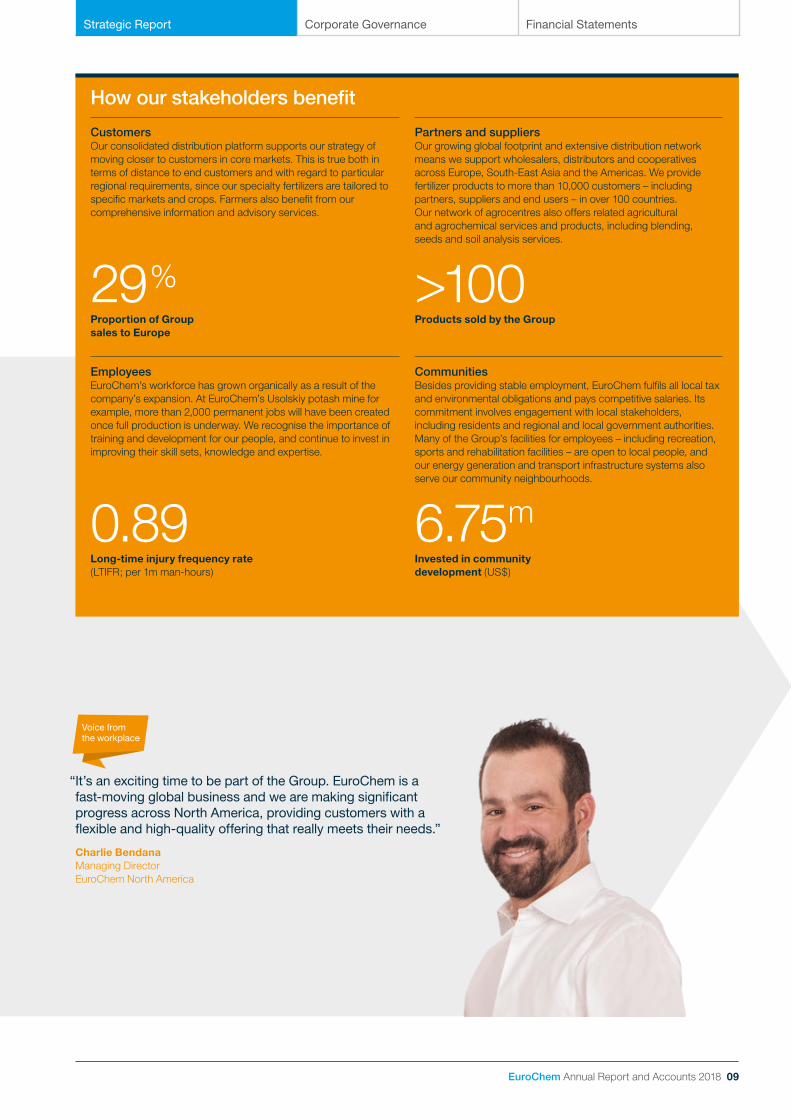
How our stakeholders benefit
CustomersOur consolidated distribution platform supports our strategy of moving closer to customers in core markets. This is true both in terms of distance to end customers and with regard to particular regional requirements, since our specialty fertilizers are tailored to specific markets and crops. Farmers also benefit from our comprehensive information and advisory services.
29% Proportion of Group sales to Europe
Partners and suppliersOur growing global footprint and extensive distribution network means we support wholesalers, distributors and cooperatives across Europe, South-East Asia and the Americas. We provide fertilizer products to more than 10,000 customers – including partners, suppliers and end users – in over 100 countries. Our network of agrocentres also offers related agricultural and agrochemical services and products, including blending, seeds and soil analysis services.
>100Products sold by the Group
EmployeesEuroChem’s workforce has grown organically as a result of the company’s expansion. At EuroChem’s Usolskiy potash mine for example, more than 2,000 permanent jobs will have been created once full production is underway. We recognise the importance of training and development for our people, and continue to invest in improving their skill sets, knowledge and expertise.
0.89Long-time injury frequency rate (LTIFR; per 1m man-hours)
CommunitiesBesides providing stable employment, EuroChem fulfils all local tax and environmental obligations and pays competitive salaries. Its commitment involves engagement with local stakeholders, including residents and regional and local government authorities. Many of the Group’s facilities for employees – including recreation, sports and rehabilitation facilities – are open to local people, and our energy generation and transport infrastructure systems also serve our community neighbourhoods.
6.75mInvested in community development (US$)
“ It’s an exciting time to be part of the Group. EuroChem is a fast-moving global business and we are making significant progress across North America, providing customers with a flexible and high-quality offering that really meets their needs.”
Charlie BendanaManaging Director EuroChem North America
Voice from the workplace

10 EuroChem Annual Report and Accounts 2018
Rising demand for food – coupled with shrinking arable land per capita – challenges farmers to increase yields. Increasing environmental concerns arising from past indiscriminate use of fertilizers are compelling manufacturers to create high-efficiency, gradual release products that reduce possible nutrient loss. That’s why we are dedicated to investing in next-generation technologies to make our products even more effective for our customers.
From concept...
Read more about our approach to innovation on page 12
Delivering world-class nutrients
Focused on our customers’ needs

EuroChem Annual Report and Accounts 2018 11
Delivering innovative productsOur premium fertilizers deliver increasingly resource-efficient solutions, adapted for the specific needs of farms, soils and crops. This is cost effective for customers – and encourages sustainable practices by providing optimal nutrition with minimal application. We plan to expand our range with innovative specialty products including different NPK formulas, products with micronutrients, urease inhibitors and nitrification inhibitors.
Our R&D team in Mannheim, Germany, is focused on optimising the specific characteristics of these products, developing innovative solutions that are equal to the challenges of modern sustainable agriculture.
EuroChem premium products help farmers
■ Improve yields
■ Limit adverse environmental impact
■ Increase crop values
■ Reduce costs through lower fertilizer application requirements
+9%increase in sales of complex and blended fertilizers
...to customer
Strategic Report Corporate Governance Financial Statements

12 EuroChem Annual Report and Accounts 2018
Investing in next-generation fertilizers
Delivering world-class nutrients
Developing inhibitor technologiesEuroChem is developing a new generation of fertilizers. Enhanced-efficiency fertilizers (EEFs) are specially formulated to provide nutrients more slowly, which enables crops to take them up more efficiently.
Our ENTEC® products work by stabilising the applied fertilizer in the ammonium form for a prolonged period. This arrests denitrification, while still providing a source of nitrogen to the crop. Independent scientific studies show that EEFs such as ENTEC® provide more nitrogen directly to crops.
Depending on environmental conditions, stabilised mineral products such as ENTEC® and UTEC® can decrease ammonia and greenhouse gas emissions by up to 100%, reduce nitrate leaching and increase yields.
We are currently working with 18 research partners and 12 universities – and conducting more than 250 field trials in 25 countries – to develop formulations that will deliver optimal results in specific soils, whatever the crop, location or climate.
Average yield increase using nitrification inhibitor1
+5%
Increase in nitrogen use efficiency through use of nitrification inhibitor1
+12%
Average reduction in N20 emissions through use of ENTEC® 262
-72%
1. Source: Abalos et al., Polytechnica Madrid, 2014 Agriculture, Ecosystems and Environment.
2. Source: Programm zur Reduktion von Lachgas-Emissionen in der Schweizer Landschaft – Ammonium-stabilisierter Mineraldünger ENTEC®26, Ernst Basler + Partner (EBP), 8702 Zollikon.
More than 250 field trials are helping us create the next generation of fertilizers

Strategic Report Corporate Governance Financial Statements
EuroChem Annual Report and Accounts 2018 13
How our stakeholders benefit
Our next-generation fertilizers offer multiple benefits. They require fewer applications to be effective, help improve crop yields, result in less nutrient loss and offer sellers higher margins.
CustomersFarmers can increase yields through the use of enhanced-efficiency fertilizers. Trial results show that although products such as ENTEC® cost more to develop than standard fertilizers, the benefits outweigh the additional cost over a standard product, with fewer applications needed and improved yields achieved.
+6%Average yield increase using UTEC®46 with urease inhibitor1
Partners and suppliersFarmers increasingly seek information and advice on the best application of fertilizer to achieve optimum crop yields. Enhanced-efficiency fertilizers and other premium products offer suppliers the potential to achieve higher-margin sales and provide add-on services.
18Number of research partners
EmployeesThe development of next-generation fertilizer products requires highly skilled workers with science and agronomy backgrounds. EuroChem’s talent strategy and career development opportunities are designed to attract and retain the expertise we need to meet our business goals.
>26,300Employees globally
CommunitiesNext-generation fertilizers that enable significant reductions in leaching and greenhouse gas emissions are better for the environment – and therefore good for society as a whole. Trials show evidence of significant reductions in emissions, thus highlighting the opportunities that exist for agriculture to reduce its environmental footprint.
250Field trials underway around the world
“ I’m a plant nutritionist – and 20 years ago, when I did my PhD, we thought we knew everything about plant nutrition. Now I’m leading a department that is right at the cutting edge of research. Our work is not exclusively about developing new products; it spans a whole range of ways to improve plant nitrification and encompasses all types of thinking. That’s what makes it so exciting!”
Thomas Mannheim Head of Global Agronomy Advisory and R&D
1. Source: Abalos, iBid.
Voice from the workplace

14 EuroChem Annual Report and Accounts 2018
17
21
19
18
20
A global operationGeographic footprint
New urea ammonium sulphate productionIn December we began producing UAS at a new US$84 million facility constructed at our Novomoskovskiy Azot plant, 200km south of Moscow. The unit, Russia’s first UAS facility, is projected to reach a final production capacity of 600 tonnes per day. The new fertilizer, which complements our current portfolio of sulphur-enriched fertilizers such as ammonium sulphate (AS) and ammonium sulphate-nitrate (ASN), will meet the growing needs of farmers.
2018 highlights
Expansion in LithuaniaA new US$16 million facility for the production of highly efficient, water-soluble fertilizers opened at Lifosa in October. The new unit has a projected production of 25,000 metric tonnes of crystalline urea phosphate a year, adding to the range of high-quality fertilizers currently manufactured at Lifosa. These include diammonium phosphate (DAP), a nitrogen-phosphorus fertilizer, and water-soluble crystal monoammonium phosphate (MAP).
In 2018 we continued to develop our global distribution capabilities in line with the expansion of our production capacity, bringing us closer to promising new markets and deepening our presence in existing territories. This geographic extension ensures we can supply our customers – wherever they are located – with our high-quality fertilizers.
0508

Strategic Report Corporate Governance Financial Statements
EuroChem Annual Report and Accounts 2018 15
Our assets
Mining
01 Kovdorskiy GOK02 EuroChem-VolgaKaliy03 EuroChem Usolskiy04 EuroChem Fertilizers
Read more on page 36
Fertilizers
05 Novomoskovskiy Azot06 Nevinnomysskiy Azot07 EuroChem Antwerpen08 Lifosa09 Phosphorit10 EuroChem Northwest11 EuroChem-BMU12 EuroChem Migao
Read more on page 38
Logistics
13 Tuapse14 Murmansk15 Sillamäe16 EuroChem Antwerpen jetty
Read more on page 40
Sales
17 Mexico18 US (Tulsa)19 US (Tampa)20 Brazil21 Argentina22 Spain23 France24 Germany25 Switzerland (Global HQ)26 Italy27 Greece28 Serbia29 Hungary30 Turkey31 Belarus32 Bulgaria33 Moldova34 Russia35 China36 Singapore
Read more on page 42
30
29
27
23
22
28
14
15
16
33
34
35
3936
08
0711
05
12
01
02
03
042513 06
26
24
32
Blending plants open in BrazilEuroChem opened two new blending plants at Fertilizantes Tocantins, the Brazilian company in which the Group acquired a controlling interest in 2016. The first was a 20,000 square metre plant at Sinop in the commercially important northern region of Mato Grosso. The second, at Catalão in Goias State, has a static storage capacity of 80,000 tonnes, and a production capability of 60,000 tonnes of fertilizer per month.
31
20
09 10

16 EuroChem Annual Report and Accounts 2018
Product portfolio
From basic fertilizers to value-added solutions
Premium plant nutritionEuroChem essential plant nutrition
AN
AS coarse
AS fine
ASN
CAN
DAP
MAP
MOP granular
MOP standard
NP
NPK
UAN
UAS
Urea granular
Urea prilled
suNKissNitratop
EuroMag
stimulUS
Flexammon
Basammon
Globally recognised SOP- and MOP-based NPKs: all nutrients in one granule
Enhanced nitrification inhibited product: stable N supply in any weather
Nitrophos Stabilised urea: high concentration and stabilised losses of N
Water-soluble fertilizers: effective fertigation and foliar feeding
We manufacture high-quality nitrogen, phosphate, potash, and complex fertilizers. Our premium products are engineered to keep their nutrient properties longer, guaranteeing an optimal supply of nutrients to plants throughout all growth phases.
Left to right: ENTEC®, SOP-based NITROPHOSKA®, ASN, MOP-based NITROPHOSKA®, CAN.

Strategic Report Corporate Governance Financial Statements
EuroChem Annual Report and Accounts 2018 17
Feed phosphates
MiningIndustrial products
Acetic acid
Vinyl acetate
Butyl acetate
Methyl acetate
Acetaldehyde
Butanol
Nitric acid
Melamine
Methanol
Urea grade A
UAN
Caustic soda
Calcium chloride
Hydrochloric acid
Sodium hypochlorite
Ammonia water
AdBlue®
Monocalcium phosphate (MCP)
Defluorinated feed phosphate (DFP)
Argon
Carbon dioxide
Liquid nitrogen
Liquid oxygen
High-density ammonium nitrate
Low-density ammonium nitrate
Iron ore
Apatite
Baddeleyite
Base organic chemistry
ExplosivesHSE industrial products
Wood processing
Industrial gases
Our vertically integrated business model yields more than just fertilizersThe ability to make industrial products adds depth and value to our wide-ranging portfolio.
Sales volumes by product (KMT)
Nitrogen products
-3%
+7%
+39%
+1%
+9%
7,8138,073
Phosphate and complex products
5,6855,319
Potash fertilizers632454
Mining products
5,9775,912
Industrial products and other
1,8711,716
FY 2018 Change Y-o-Y %FY 2017

18 EuroChem Annual Report and Accounts 2018
“ 2018 was a year of considerable progress for EuroChem. We continued to deliver on our strategy and drive the transformation of the business.”
Several notable milestones were passed during the year. With test production of potash underway at our Usolskiy mine in the Perm region, I am delighted to be able to say that we now have capacity across all three primary nutrient categories. We also began test production of potash at our VolgaKaliy site in the Volgograd region. Another highlight was the start of production from Russia’s only urea ammonium sulphate facility at our Novomoskovskiy Azot plant.
During the year we extended our geographic presence still further, bringing us even closer to promising new markets. The expansion of our Brazilian operations continued, with the opening of two fertilizer blending plants at Sinop and Catalão, strategically important locations in the North and Midwest regions, respectively.
As the world’s farmers demand increasingly efficient, sophisticated, and targeted products, EuroChem’s clear research objective is to create new fertilizers with these attributes. These next-generation products will enhance and expand our portfolio, delivering the specific performance our customers require.
Amid the excitement and challenges that come with growth and change, we must remember that nothing is more important than the safety and wellbeing of our people. This is the case whatever their role and wherever they work within EuroChem. I remain profoundly committed to continuing to improve our safety
performance. We must all take personal responsibility for our behaviour at work
and consider how our own habits or working practices potentially affect our safety – and that of others.
EuroChem continuously strives to be a good corporate citizen, whether as an employer, neighbour, customer or supplier. Given the nature of our business, we are also acutely aware of our obligations towards the natural environment. I’m particularly pleased, therefore, that we made good progress this year on key aspects of minimising our environmental impact, especially in the critical areas of effluent discharges, and energy consumption, which continued the downward trend of recent years.
With so much transformation and expansion underway across the Company, it’s an exciting and rewarding time to work at EuroChem. Hiring – and retaining – the best people is therefore a priority for us, so we endeavour to offer fulfilling career paths that enable colleagues to reach their full potential. In 2018, we welcomed nearly 800 new colleagues across our Usolskiy, VolgaKaliy, and Kingisepp projects.
During the year we launched several important initiatives focused on staff development. These included our ‘HiPo’ (High Potential) programme, which identifies exceptional individuals who are at an early stage of their careers but who exhibit strong leadership potential. The programme provides the necessary training and support so they can be fast-tracked into management positions. There is strong interest in the programme, and more than 1,900 staff from nine countries were accepted into it.
Accelerating growthChairman’s statement

EuroChem Annual Report and Accounts 2018 19
Our boardroom also welcomed some new faces in 2018, reflecting the changing nature of our business – as well as its future needs. Geoffery Merszei, Clark Bailey and Samir Brikho have brought valuable fresh perspectives to our deliberations as we steer EuroChem through its next phase of development and growth. During the year we bade farewell to Manfred Wennemer and Garth Moore; EuroChem has benefited considerably from their extensive knowledge, experience and wise counsel. I thank them both for their contributions and service.
Having secured the services of Dmitry Strashnov in 2017, we were naturally very sorry that he left the business for personal reasons after so short a time. Kuzma Marchuk stepped into the role of Acting CEO while we searched for Dmitry’s successor. In February 2019 we announced the appointment of Petter Ostbo as our new CEO with effect from June 1. Petter is highly regarded across the industry and brings a wealth of experience to the position. I am delighted he is joining our team – and am particularly grateful to Kuzma for his continuing service until Petter assumes the role in the summer.
Whenever – and wherever – I meet our employees, I am always struck by their professionalism, dedication and pride in our company. The successes of the last year were only possible thanks to the talents and commitment of EuroChem’s people – and I extend my thanks to each of them.
Alexander LandiaChairman of the Board
Strategic Report Corporate Governance Financial Statements
Board HSE priorities
In 2018, the roll-out continued of Vision Zero, a programme targeting the prevention of injuries, accidents and occupational illnesses, a reduction of environmental impacts, and the rational use of natural resources.
Maintain a safe workplaceThe Group is implementing programmes and projects aimed at preventing workplace injuries, accidents and occupational illnesses.
Near-miss investigationsAll incidents and near misses are to be reported so that a comprehensive investigation can identify root causes and any patterns to prevent repeat occurrences.
Emissions reductionsWe will continue to work to limit emissions, effluent discharges and solid waste along with achieving reductions in the consumption of water, heat and energy.
Effective cooperationThe Group will maintain dialogue with employees, contractors, suppliers, government authorities, trade unions, non-governmental organisations (NGOs), and other stakeholders on health, safety and environmental matters.

20 EuroChem Annual Report and Accounts 2018
Growing our market shareMarket overview
Nutrient
Nitrogen Improves growth and yield
Absorbed from the soil in the form of nitrates or ammonium, nitrogen is the key component of plant growth. The essential constituent of proteins, it features in all key stages of plant development, protein and yield formation. It is also a component of chlorophyll, essential for photosynthesis and yield formation.
N
Phosphorous Accelerates maturity and improves quality
Phosphates are essential for root development and cell division and are involved in membrane function and integrity; they also accelerate maturity. They play a key role in energy storage and transfer and are essential for photosynthesis. Many natural and agricultural soils are deficient in phosphorous. When there are problems with phosphorous fixation in the soil, this also limits its availability to plants.
Potassium Increases resistance to disease and drought
Potassium activates more than 60 enzymes (substances that play a key role in carbohydrate and protein synthesis). It improves a plant’s water regime regulation and increases tolerance to disease, drought and frost. It also strengthens stems and roots whilst adding flavour, texture and colour to food crops.
P
K
EuroChem Annual Report and Accounts 2018 21
Strategic Report Corporate Governance Financial Statements
Demand Supply Market developments
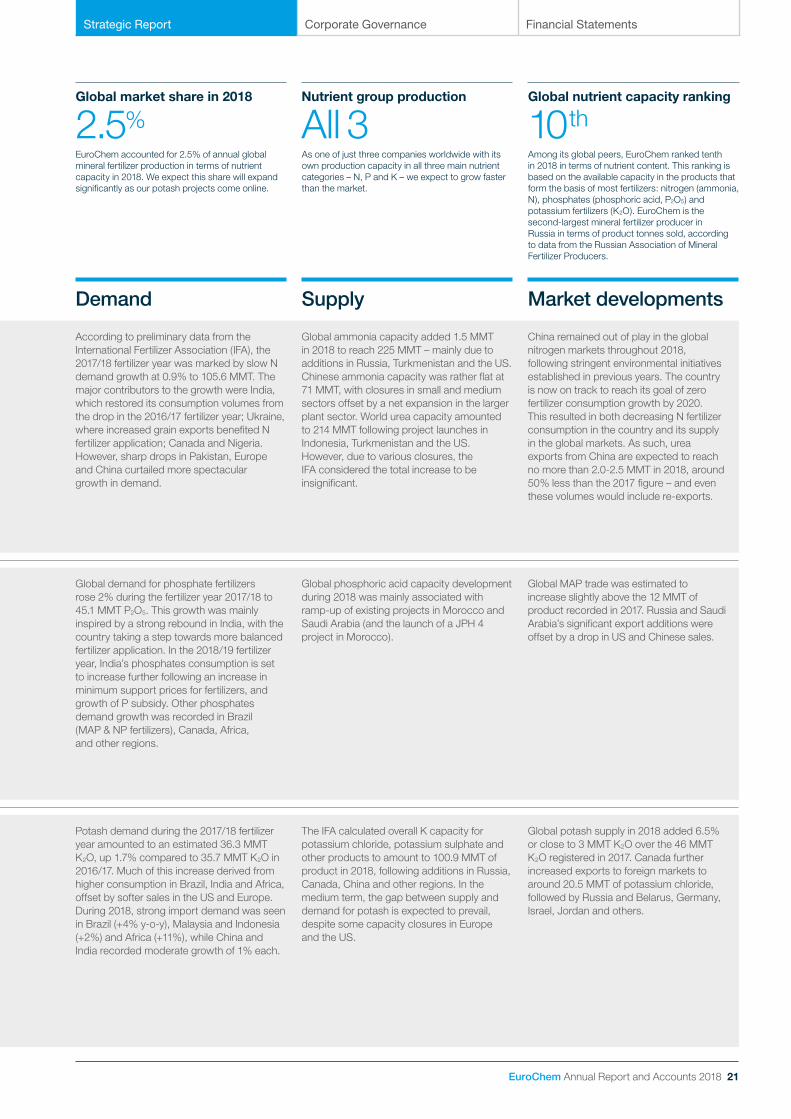
EuroChem accounted for 2.5% of annual global mineral fertilizer production in terms of nutrient capacity in 2018. We expect this share will expand significantly as our potash projects come online.
As one of just three companies worldwide with its own production capacity in all three main nutrient categories – N, P and K – we expect to grow faster than the market.
Among its global peers, EuroChem ranked tenth in 2018 in terms of nutrient content. This ranking is based on the available capacity in the products that form the basis of most fertilizers: nitrogen (ammonia, N), phosphates (phosphoric acid, P2O5) and potassium fertilizers (K2O). EuroChem is the second-largest mineral fertilizer producer in Russia in terms of product tonnes sold, according to data from the Russian Association of Mineral Fertilizer Producers.
Global market share in 2018
2.5%Nutrient group production
All 3Global nutrient capacity ranking
10th
According to preliminary data from the International Fertilizer Association (IFA), the 2017/18 fertilizer year was marked by slow N demand growth at 0.9% to 105.6 MMT. The major contributors to the growth were India, which restored its consumption volumes from the drop in the 2016/17 fertilizer year; Ukraine, where increased grain exports benefited N fertilizer application; Canada and Nigeria. However, sharp drops in Pakistan, Europe and China curtailed more spectacular growth in demand.
Global ammonia capacity added 1.5 MMT in 2018 to reach 225 MMT – mainly due to additions in Russia, Turkmenistan and the US. Chinese ammonia capacity was rather flat at 71 MMT, with closures in small and medium sectors offset by a net expansion in the larger plant sector. World urea capacity amounted to 214 MMT following project launches in Indonesia, Turkmenistan and the US. However, due to various closures, the IFA considered the total increase to be insignificant.
China remained out of play in the global nitrogen markets throughout 2018, following stringent environmental initiatives established in previous years. The country is now on track to reach its goal of zero fertilizer consumption growth by 2020. This resulted in both decreasing N fertilizer consumption in the country and its supply in the global markets. As such, urea exports from China are expected to reach no more than 2.0-2.5 MMT in 2018, around 50% less than the 2017 figure – and even these volumes would include re-exports.
Global demand for phosphate fertilizers rose 2% during the fertilizer year 2017/18 to 45.1 MMT P2O5. This growth was mainly inspired by a strong rebound in India, with the country taking a step towards more balanced fertilizer application. In the 2018/19 fertilizer year, India’s phosphates consumption is set to increase further following an increase in minimum support prices for fertilizers, and growth of P subsidy. Other phosphates demand growth was recorded in Brazil (MAP & NP fertilizers), Canada, Africa, and other regions.
Global phosphoric acid capacity development during 2018 was mainly associated with ramp-up of existing projects in Morocco and Saudi Arabia (and the launch of a JPH 4 project in Morocco).
Global MAP trade was estimated to increase slightly above the 12 MMT of product recorded in 2017. Russia and Saudi Arabia’s significant export additions were offset by a drop in US and Chinese sales.
Potash demand during the 2017/18 fertilizer year amounted to an estimated 36.3 MMT K2O, up 1.7% compared to 35.7 MMT K2O in 2016/17. Much of this increase derived from higher consumption in Brazil, India and Africa, offset by softer sales in the US and Europe. During 2018, strong import demand was seen in Brazil (+4% y-o-y), Malaysia and Indonesia (+2%) and Africa (+11%), while China and India recorded moderate growth of 1% each.
The IFA calculated overall K capacity for potassium chloride, potassium sulphate and other products to amount to 100.9 MMT of product in 2018, following additions in Russia, Canada, China and other regions. In the medium term, the gap between supply and demand for potash is expected to prevail, despite some capacity closures in Europe and the US.
Global potash supply in 2018 added 6.5% or close to 3 MMT K2O over the 46 MMT K2O registered in 2017. Canada further increased exports to foreign markets to around 20.5 MMT of potassium chloride, followed by Russia and Belarus, Germany, Israel, Jordan and others.

22 EuroChem Annual Report and Accounts 2018
Growing our market share continued
Market overview
FY2017
FY2018
Changey-o-y, % High Low
Ammonia (FOB Yuzhny) 265 286 8 346 217
Prilled urea (FOB Yuzhny) 220 251 14 303 216
AN (FOB Black Sea) 191 186 -2 215 152
MAP (FOB Baltic) 348 413 19 434 378
MOP (FOB Baltic, spot) 228 256 12 278 238
Iron ore (63.5% Fe, CFR China) 73 71 -3 81 64
Average market prices (US$/tonne)
World fertilizer consumption in 2000-2023 (KMT nutrients)
2000 2001 2002 2003 2004 2005 2006 2007 2008 2009 2010 2011 2012 2013 2014 2015 2016 2017 2018 E2019 E2020 E2021 E2022 E2023
Nitrogen (N) Phosphate (P2O5) Potash K2O
0
50,000
100,000
150,000
200,000
250,000

Strategic Report Corporate Governance Financial Statements
EuroChem Annual Report and Accounts 2018 23
2013 2018 2023 10-year CAGR
N 2.7 3.0 3.8 3.5%
P2O5 1.0 1.3 1.3 2.7%
K2O 0.2 0.4 3.5 33.1%
Total EuroChem1 4.0 4.7 8.6 8.0%
N 109.1 105.7 111.7 0.2%
P2O5 40.9 45.3 47.9 1.6%
K2O 28.6 36.9 40.5 3.5%
Total World2 178.6 187.9 200.1 1.1%
EuroChem Market Share 2.2% 2.5% 4.3%
1. Without products for industrial use (urea, ammonium nitrate, LDAN), feed phosphates, carnallite.
2. Production of fertilizers consumed in agriculture.
Source: Company estimates, CRU, Fertecon, IFA.
Production in nutrient content (MMTpa)
Selected ranking by nutrient capacity (MMT nutrients)
Ammonia (N) Phosphoric Acid (P2O5) K2O, MOP, SOP, other
1. Once Baltic ammonia and both potash projects are fully operational. Sources: Company data, CRU, Fertecon, IFA.
Nutrien
Mosaic
EUROCHEM1
CF Industries
Uralkali
Belaruskali
Yara
OCP
ICL
K+S
EUROCHEM
PhosAgro
OCI
Sabic/Safco
IFFCO
Ma’aden
UralChem
TogliattiAzot
QAFCO
Acron
20.98
16.32
9.86
8.10
7.98
7.87
7.76
7.10
4.81
4.70
4.14
3.97
3.74
3.52
3.22
3.03
2.68
2.46
2.34
2.21
24 EuroChem Annual Report and Accounts 2018
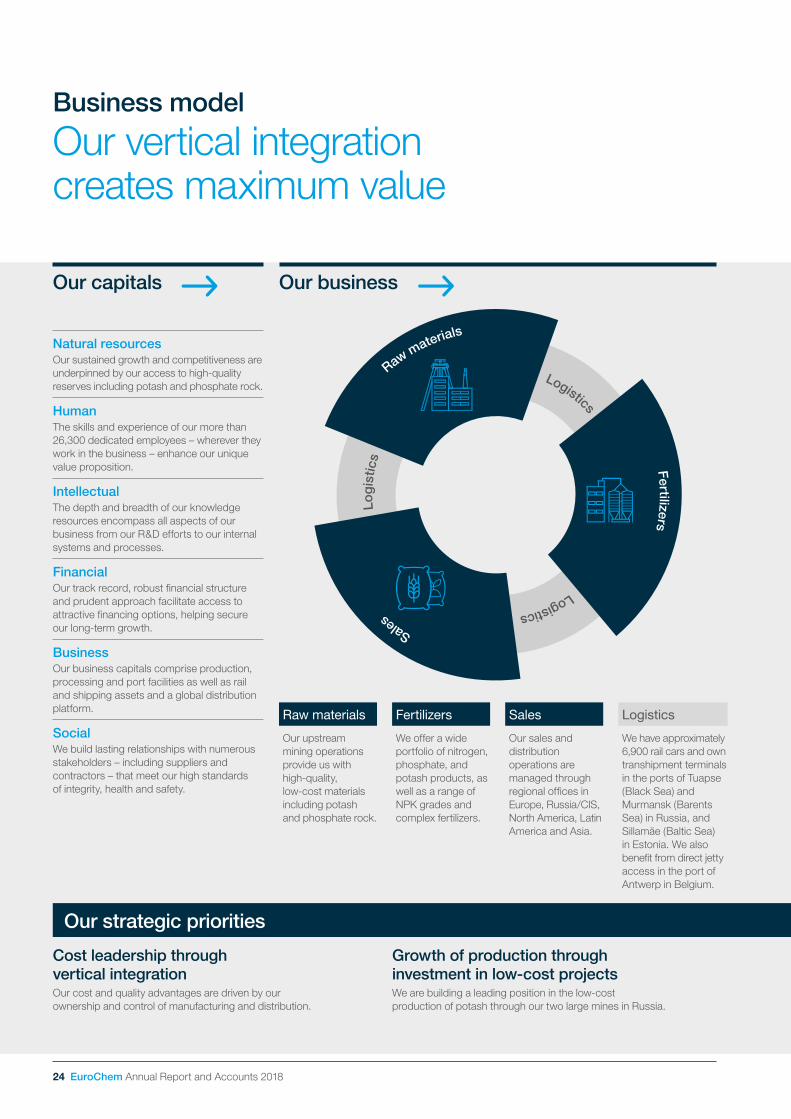
Business model
Our vertical integration creates maximum value
Our strategic priorities
Natural resources Our sustained growth and competitiveness are underpinned by our access to high-quality reserves including potash and phosphate rock.
HumanThe skills and experience of our more than 26,300 dedicated employees – wherever they work in the business – enhance our unique value proposition.
IntellectualThe depth and breadth of our knowledge resources encompass all aspects of our business from our R&D efforts to our internal systems and processes.
FinancialOur track record, robust financial structure and prudent approach facilitate access to attractive financing options, helping secure our long-term growth.
BusinessOur business capitals comprise production, processing and port facilities as well as rail and shipping assets and a global distribution platform.
SocialWe build lasting relationships with numerous stakeholders – including suppliers and contractors – that meet our high standards of integrity, health and safety.
Raw materials Fertilizers Sales Logistics
Our upstream mining operations provide us with high-quality, low-cost materials including potash and phosphate rock.
We offer a wide portfolio of nitrogen, phosphate, and potash products, as well as a range of NPK grades and complex fertilizers.
Our sales and distribution operations are managed through regional offices in Europe, Russia/CIS, North America, Latin America and Asia.
We have approximately 6,900 rail cars and own transhipment terminals in the ports of Tuapse (Black Sea) and Murmansk (Barents Sea) in Russia, and Sillamäe (Baltic Sea) in Estonia. We also benefit from direct jetty access in the port of Antwerp in Belgium.
Our capitals Our business
Raw materials
Fertilizers
S
ales
Logistics
Logistics
Log
istic
s
Cost leadership through vertical integrationOur cost and quality advantages are driven by our ownership and control of manufacturing and distribution.
Growth of production through investment in low-cost projects We are building a leading position in the low-cost production of potash through our two large mines in Russia.

Strategic Report Corporate Governance Financial Statements
EuroChem Annual Report and Accounts 2018 25
Creating sustainable value
Our commitment to driving sustainable value creation is at the heart of everything we do. Along with economic success, we also uphold the highest standards of employee relations, safety, environmental stewardship and stakeholder engagement.
Our strategic priorities
Low cost Low-cost raw materials, our portfolio of commodity and premium products and an international reach drive us closer to global leadership.
All-nutrientEuroChem is one of three global fertilizer companies with capacity in all three primary nutrients: ammonia, phosphates and potash.
Specialty productsChanging environmental and farming requirements mean that our proprietary advanced and specialty fertilizers are an essential part of our portfolio.
Corporate governanceOur robust system of corporate governance ensures that all aspects of our business are conducted responsibly, transparently and ethically.
Our stakeholders
Employees A skilled and engaged workforce supports our growth. We provide attractive careers with prospects for advancement through training and development.
Shareholders Our business model generates investment opportunities across our value chain, delivering long-term financial stability and sustainable returns.
Farmers Farmers are challenged to deliver increasing quantities of food to sustain the world’s growing population. We provide them with the products they need.
Government We foster strong working relationships with federal, regional and local authorities, reinforcing our commitment to the economies in which we operate.
Local communities We play an active part in our local communities, investing in local facilities to improve people’s quality of life.
Media We share news of our successes to highlight the value we create and our commitment to sustainable business growth.
Vertical integration Our business model delivers cost-efficient and flexible production capacity, increases our investment returns and minimises our financial risks.
Global production Our expanding global footprint means that our production facilities are located close to our high-quality raw material sources as well as our key markets.
Competitive feedstockWe have access to high-quality natural resources for our industrial processes, which are supported by a cost-efficient logistics platform.
Global distributionOperating across key global markets, we are able to deliver the required volumes of products on time to our customers all year round.
What makes us different
Read more on our approach to sustainability from page 44
Strong financial positionConservative financial policy and completion of our large-scale investment projects will see us deleverage and increase free cash flow.
Proximity to customers Strong end-user relationships are key to ensuring we provide the necessary support, services and products.
Read more on our strategic priorities on page 28-29
26 EuroChem Annual Report and Accounts 2018
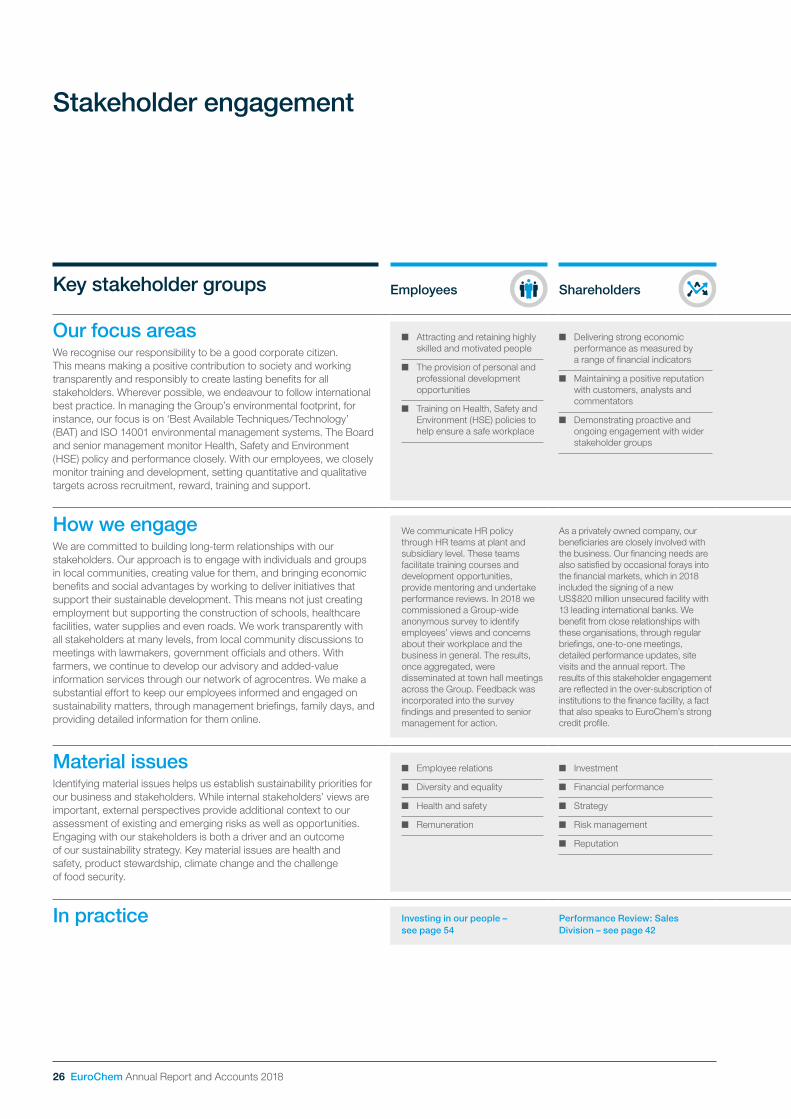
Stakeholder engagement
Key stakeholder groups Employees Shareholders Farmers
and suppliers Government Local communities Media
Our focus areasWe recognise our responsibility to be a good corporate citizen. This means making a positive contribution to society and working transparently and responsibly to create lasting benefits for all stakeholders. Wherever possible, we endeavour to follow international best practice. In managing the Group’s environmental footprint, for instance, our focus is on ‘Best Available Techniques/Technology’ (BAT) and ISO 14001 environmental management systems. The Board and senior management monitor Health, Safety and Environment (HSE) policy and performance closely. With our employees, we closely monitor training and development, setting quantitative and qualitative targets across recruitment, reward, training and support.
■ Attracting and retaining highly skilled and motivated people
■ The provision of personal and professional development opportunities
■ Training on Health, Safety and Environment (HSE) policies to help ensure a safe workplace
■ Delivering strong economic performance as measured by a range of financial indicators
■ Maintaining a positive reputation with customers, analysts and commentators
■ Demonstrating proactive and ongoing engagement with wider stakeholder groups
■ Provision of education and advice on environmentally optimal practices and techniques
■ Collaboration on new, low-impact products, ensuring these meet their needs
■ Working with suppliers to ensure timely delivery of high-quality products as needed
■ Stimulate national and local economic development, which creates employment and generates wealth
■ Production and social infrastructure development
■ Instituting environmental controls that meet the needs of regional and/or local authorities
■ Generation of long-term employment
■ Economic development and explanation of the benefits to the region
■ Environmental aspects of operations, their impact and mitigation
■ Transparent and open communications on the Company’s performance and activities
How we engageWe are committed to building long-term relationships with our stakeholders. Our approach is to engage with individuals and groups in local communities, creating value for them, and bringing economic benefits and social advantages by working to deliver initiatives that support their sustainable development. This means not just creating employment but supporting the construction of schools, healthcare facilities, water supplies and even roads. We work transparently with all stakeholders at many levels, from local community discussions to meetings with lawmakers, government officials and others. With farmers, we continue to develop our advisory and added-value information services through our network of agrocentres. We make a substantial effort to keep our employees informed and engaged on sustainability matters, through management briefings, family days, and providing detailed information for them online.
We communicate HR policy through HR teams at plant and subsidiary level. These teams facilitate training courses and development opportunities, provide mentoring and undertake performance reviews. In 2018 we commissioned a Group-wide anonymous survey to identify employees’ views and concerns about their workplace and the business in general. The results, once aggregated, were disseminated at town hall meetings across the Group. Feedback was incorporated into the survey findings and presented to senior management for action.
As a privately owned company, our beneficiaries are closely involved with the business. Our financing needs are also satisfied by occasional forays into the financial markets, which in 2018 included the signing of a new US$820 million unsecured facility with 13 leading international banks. We benefit from close relationships with these organisations, through regular briefings, one-to-one meetings, detailed performance updates, site visits and the annual report. The results of this stakeholder engagement are reflected in the over-subscription of institutions to the finance facility, a fact that also speaks to EuroChem’s strong credit profile.
We engage with farmers directly and also through our partners, such as distributors. We also provide a wide range of advisory services in many countries via our network of agrocentres. We regularly attend exhibitions, conferences and other events, meeting with farmers, cooperatives, trade bodies, and other producer groups.
We allocate considerable resources in engagement with national, regional and local governments. We carry out public affairs work with governments and discuss issues of industry concern with trade bodies that also conduct high-level meetings on our behalf. We meet government representatives wherever we operate or plan to invest to ensure we understand their requirements for economic and social development.
Investment in communities around our plants and facilities. Engagement involves building relations with local stakeholders, including other employers, infrastructure owners, residents, schools, and others. Many plants run site visits, open days and other community events, including those specifically targeted at local residents, employees, their friends and families, and the wider public. As well as information distribution, these events provide many opportunities for consultation and active participation.
Besides a regular programme of diary activities including financial results announcements, annual report publication and public events, we engage proactively with media at all levels, providing expert comment and analysis on issues of public concern, publishing media releases, features and other content, and attending public conferences and exhibitions. We also host regular visits to key company locations, inviting journalists to inspect progress. EuroChem’s growing media profile is testament to the success of the Company’s communications strategy.
Material issuesIdentifying material issues helps us establish sustainability priorities for our business and stakeholders. While internal stakeholders’ views are important, external perspectives provide additional context to our assessment of existing and emerging risks as well as opportunities. Engaging with our stakeholders is both a driver and an outcome of our sustainability strategy. Key material issues are health and safety, product stewardship, climate change and the challenge of food security.
■ Employee relations
■ Diversity and equality
■ Health and safety
■ Remuneration
■ Investment
■ Financial performance
■ Strategy
■ Risk management
■ Reputation
■ Farmer engagement through agrocentres and distributors, exhibitions and conferences
■ Product launches
■ National and local investment levels
■ Feedback from government partners
■ Level of investment in sport, health facilities, education provision, environmental control, local charities and cultural activities
■ Appropriate and correct payments of tax wherever EuroChem operates
■ Stakeholder knowledge and understanding of company strategy and activities
■ Regular media calls and briefings held throughout the year
In practice Investing in our people – see page 54
Performance Review: Sales Division – see page 42
Performance Review; Fertilizers Division – see page 38
Environmental responsibility – see page 51
Local communities – see page 59
Media visits Usolskiy Potash Project – see page 36

Strategic Report Corporate Governance Financial Statements
EuroChem Annual Report and Accounts 2018 27
Key stakeholder groups Employees Shareholders Farmers
and suppliers Government Local communities Media
Our focus areasWe recognise our responsibility to be a good corporate citizen. This means making a positive contribution to society and working transparently and responsibly to create lasting benefits for all stakeholders. Wherever possible, we endeavour to follow international best practice. In managing the Group’s environmental footprint, for instance, our focus is on ‘Best Available Techniques/Technology’ (BAT) and ISO 14001 environmental management systems. The Board and senior management monitor Health, Safety and Environment (HSE) policy and performance closely. With our employees, we closely monitor training and development, setting quantitative and qualitative targets across recruitment, reward, training and support.
■ Attracting and retaining highly skilled and motivated people
■ The provision of personal and professional development opportunities
■ Training on Health, Safety and Environment (HSE) policies to help ensure a safe workplace
■ Delivering strong economic performance as measured by a range of financial indicators
■ Maintaining a positive reputation with customers, analysts and commentators
■ Demonstrating proactive and ongoing engagement with wider stakeholder groups
■ Provision of education and advice on environmentally optimal practices and techniques
■ Collaboration on new, low-impact products, ensuring these meet their needs
■ Working with suppliers to ensure timely delivery of high-quality products as needed
■ Stimulate national and local economic development, which creates employment and generates wealth
■ Production and social infrastructure development
■ Instituting environmental controls that meet the needs of regional and/or local authorities
■ Generation of long-term employment
■ Economic development and explanation of the benefits to the region
■ Environmental aspects of operations, their impact and mitigation
■ Transparent and open communications on the Company’s performance and activities
How we engageWe are committed to building long-term relationships with our stakeholders. Our approach is to engage with individuals and groups in local communities, creating value for them, and bringing economic benefits and social advantages by working to deliver initiatives that support their sustainable development. This means not just creating employment but supporting the construction of schools, healthcare facilities, water supplies and even roads. We work transparently with all stakeholders at many levels, from local community discussions to meetings with lawmakers, government officials and others. With farmers, we continue to develop our advisory and added-value information services through our network of agrocentres. We make a substantial effort to keep our employees informed and engaged on sustainability matters, through management briefings, family days, and providing detailed information for them online.
We communicate HR policy through HR teams at plant and subsidiary level. These teams facilitate training courses and development opportunities, provide mentoring and undertake performance reviews. In 2018 we commissioned a Group-wide anonymous survey to identify employees’ views and concerns about their workplace and the business in general. The results, once aggregated, were disseminated at town hall meetings across the Group. Feedback was incorporated into the survey findings and presented to senior management for action.
As a privately owned company, our beneficiaries are closely involved with the business. Our financing needs are also satisfied by occasional forays into the financial markets, which in 2018 included the signing of a new US$820 million unsecured facility with 13 leading international banks. We benefit from close relationships with these organisations, through regular briefings, one-to-one meetings, detailed performance updates, site visits and the annual report. The results of this stakeholder engagement are reflected in the over-subscription of institutions to the finance facility, a fact that also speaks to EuroChem’s strong credit profile.
We engage with farmers directly and also through our partners, such as distributors. We also provide a wide range of advisory services in many countries via our network of agrocentres. We regularly attend exhibitions, conferences and other events, meeting with farmers, cooperatives, trade bodies, and other producer groups.
We allocate considerable resources in engagement with national, regional and local governments. We carry out public affairs work with governments and discuss issues of industry concern with trade bodies that also conduct high-level meetings on our behalf. We meet government representatives wherever we operate or plan to invest to ensure we understand their requirements for economic and social development.
Investment in communities around our plants and facilities. Engagement involves building relations with local stakeholders, including other employers, infrastructure owners, residents, schools, and others. Many plants run site visits, open days and other community events, including those specifically targeted at local residents, employees, their friends and families, and the wider public. As well as information distribution, these events provide many opportunities for consultation and active participation.
Besides a regular programme of diary activities including financial results announcements, annual report publication and public events, we engage proactively with media at all levels, providing expert comment and analysis on issues of public concern, publishing media releases, features and other content, and attending public conferences and exhibitions. We also host regular visits to key company locations, inviting journalists to inspect progress. EuroChem’s growing media profile is testament to the success of the Company’s communications strategy.
Material issuesIdentifying material issues helps us establish sustainability priorities for our business and stakeholders. While internal stakeholders’ views are important, external perspectives provide additional context to our assessment of existing and emerging risks as well as opportunities. Engaging with our stakeholders is both a driver and an outcome of our sustainability strategy. Key material issues are health and safety, product stewardship, climate change and the challenge of food security.
■ Employee relations
■ Diversity and equality
■ Health and safety
■ Remuneration
■ Investment
■ Financial performance
■ Strategy
■ Risk management
■ Reputation
■ Farmer engagement through agrocentres and distributors, exhibitions and conferences
■ Product launches
■ National and local investment levels
■ Feedback from government partners
■ Level of investment in sport, health facilities, education provision, environmental control, local charities and cultural activities
■ Appropriate and correct payments of tax wherever EuroChem operates
■ Stakeholder knowledge and understanding of company strategy and activities
■ Regular media calls and briefings held throughout the year
In practice Investing in our people – see page 54
Performance Review: Sales Division – see page 42
Performance Review; Fertilizers Division – see page 38
Environmental responsibility – see page 51
Local communities – see page 59
Media visits Usolskiy Potash Project – see page 36
We operate a complex global business, involving many people, from our more than 26,300 employees to our 10,000+ customers in over 100 countries. Consistent and effective engagement with our diverse range of stakeholders is therefore crucial and underpins our licence to operate. The touch points are many and varied, for example, when we are defining strategy and risks, when we set objectives and targets at a Group or plant level, when making community investments or when recruiting and training employees. The relationships we have with our key stakeholders are summarised below.
28 EuroChem Annual Report and Accounts 2018
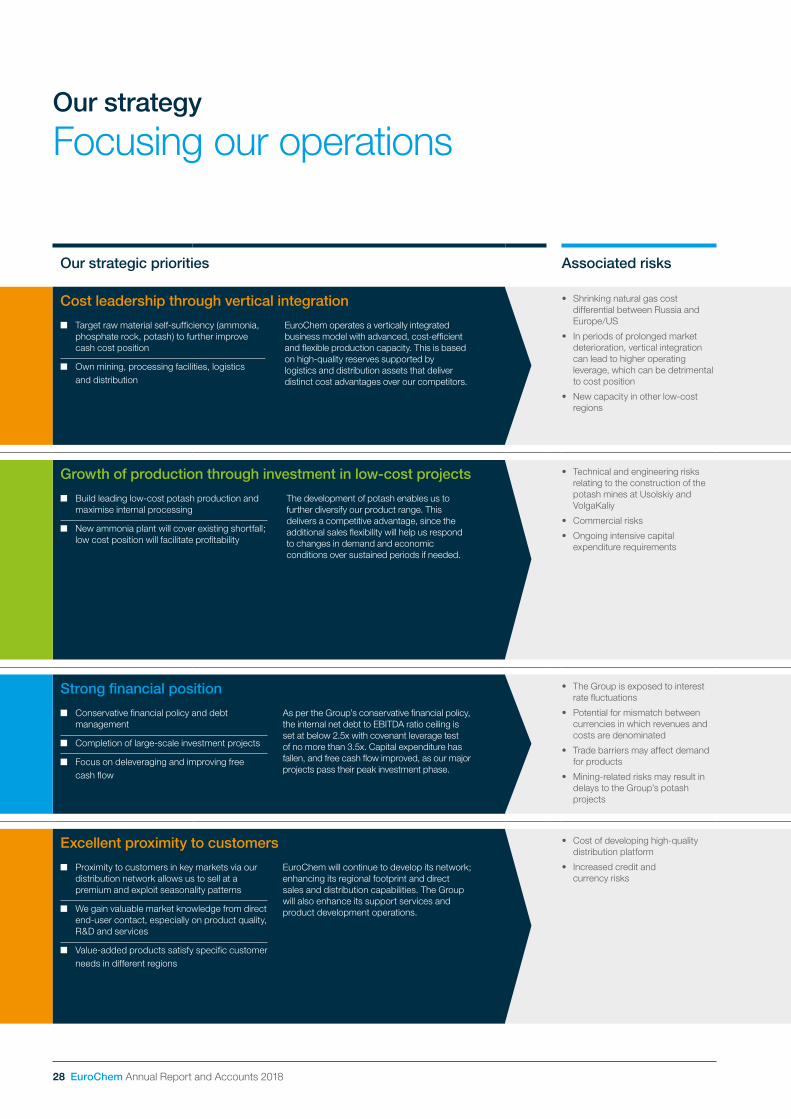
Our strategy
Focusing our operations
Our strategic priorities Associated risks Achievements in 2018 Performance Strategy in action
Cost leadership through vertical integration
■ Target raw material self-sufficiency (ammonia, phosphate rock, potash) to further improve cash cost position
■ Own mining, processing facilities, logistics and distribution
EuroChem operates a vertically integrated business model with advanced, cost-efficient and flexible production capacity. This is based on high-quality reserves supported by logistics and distribution assets that deliver distinct cost advantages over our competitors.
• Shrinking natural gas cost differential between Russia and Europe/US
• In periods of prolonged market deterioration, vertical integration can lead to higher operating leverage, which can be detrimental to cost position
• New capacity in other low-cost regions
We improved intra-Group shipments of phosphate rock by increasing production at Kovdorskiy GOK and the Group’s Kazakhstan operations.
We progressed on schedule with the construction of the EuroChem-Northwest ammonia plant at Kingsisepp, Russia, due to open in 2019.
Our competitiveness depends on the continued high quality of our products and close monitoring of the cost of delivery to key markets.
Our cost and quality advantages are driven by the ownership and control we have over the manufacturing and distribution of our products.
Increased vertical integration, improved efficiency and greater raw material self-sufficiency will strengthen our cost leadership position. This entails boosting production capacity at Nevinnomysskiy Azot and Phosphorit, completing the ammonia plant at Kingisepp, launching potash production and expanding mining output at Kovdorskiy GOK.
New efficiency measures will reduce costs, while increased sales of speciality value-added products will help offset the volatility of earnings.
Growth of production through investment in low-cost projects
■ Build leading low-cost potash production and maximise internal processing
■ New ammonia plant will cover existing shortfall; low cost position will facilitate profitability
The development of potash enables us to further diversify our product range. This delivers a competitive advantage, since the additional sales flexibility will help us respond to changes in demand and economic conditions over sustained periods if needed.
• Technical and engineering risks relating to the construction of the potash mines at Usolskiy and VolgaKaliy
• Commercial risks
• Ongoing intensive capital expenditure requirements
Test production of potassium chloride began at Usolskiy. At the year end, 15 mining machines were operating. Two shafts and two trains are fully operational in test mode, working at projected capacity.
At VolgaKaliy, engineers are devising a plan to address the new water inflow; operation of the two existing shafts will be unaffected.
Pre-commissioning activities commenced at EuroChem-Northwest ammonia plant, Kingisepp.
Phase 1 of our Usolskiy project is expected to be complete during 2019 and fully ramped-up by 2022. Production of potassium chloride (KCl) was 250 KMT in 2018. The first granulation line came on stream in early 2019.
The two existing shafts are designed to produce 10-12 MMT of ore per year, but are restricted to 7.5 MMT by the regulator while in test mode.
The Kingisepp ammonia plant is on track to open in 2019.
Successful production of potash at Usolskiy and VolgaKaliy will transform EuroChem’s profile in the industry, putting the Group at the most efficient end of the potash production cost curve.
Operating costs, location of production assets and distance to market are key drivers of competitiveness. Implementation of leading-edge technologies, coupled with world-class logistics at Usolskiy and VolgaKaliy, will make EuroChem one of the world’s most competitive potash producers.
The Kingisepp plant’s projected capacity of 1 MMT will take EuroChem beyond self-sufficiency in ammonia.
Strong financial position
■ Conservative financial policy and debt management
■ Completion of large-scale investment projects
■ Focus on deleveraging and improving free cash flow
As per the Group’s conservative financial policy, the internal net debt to EBITDA ratio ceiling is set at below 2.5x with covenant leverage test of no more than 3.5x. Capital expenditure has fallen, and free cash flow improved, as our major projects pass their peak investment phase.
• The Group is exposed to interest rate fluctuations
• Potential for mismatch between currencies in which revenues and costs are denominated
• Trade barriers may affect demand for products
• Mining-related risks may result in delays to the Group’s potash projects
We introduced tighter financial controls, managed our capex down and reduced our net debt/EBITDA ratio to 2.29x.
EBITDA was 18% above budget, due principally to positive pricing effects for our main fertilizers and iron ore.
Net debt/EBITDA ratio and free cash flow are key metrics for evaluating our financial performance.
Current scores from credit rating agencies recognise EuroChem’s sustainable cost competitiveness, which is supported by our vertically integrated business model.
Positioned at the lower end of the cost curve, our major projects are nearing completion, reducing our capital expenditure.
We have large-scale operations, a diversity of product mix and established positions in regional and global markets. Our sustainable cost-competitiveness supports relatively high margins and has been helped by a weaker rouble.
Excellent proximity to customers
■ Proximity to customers in key markets via our distribution network allows us to sell at a premium and exploit seasonality patterns
■ We gain valuable market knowledge from direct end-user contact, especially on product quality, R&D and services
■ Value-added products satisfy specific customer needs in different regions
EuroChem will continue to develop its network; enhancing its regional footprint and direct sales and distribution capabilities. The Group will also enhance its support services and product development operations.
• Cost of developing high-quality distribution platform
• Increased credit and currency risks
We continued to expand our direct distribution footprint with new outlets across Russia and Europe. We also continued the integration of assets acquired during 2016 and 2017 – including Fertilizantes Tocantins, Emerger Fertilizantes and Hispalense de Liquidos.
Additional investment was directed to increase storage, blending or other production capabilities.
The development of our global distribution capacity has enabled us to move closer to our customers. Developing strong end-user relationships is a priority, as we seek to align our business in terms of support services and product development.
Investment in new operations included Fertilizantes Tocantins, Brazil, where we opened two new blending plants in 2018 at Sinop and Catalão. With six other plants across the country, Tocantins is one of the biggest fertilizer providers in Brazil and gives EuroChem a significant customer base.

Strategic Report Corporate Governance Financial Statements
EuroChem Annual Report and Accounts 2018 29
Our strategic priorities Associated risks Achievements in 2018 Performance Strategy in action
Cost leadership through vertical integration
■ Target raw material self-sufficiency (ammonia, phosphate rock, potash) to further improve cash cost position
■ Own mining, processing facilities, logistics and distribution
EuroChem operates a vertically integrated business model with advanced, cost-efficient and flexible production capacity. This is based on high-quality reserves supported by logistics and distribution assets that deliver distinct cost advantages over our competitors.
• Shrinking natural gas cost differential between Russia and Europe/US
• In periods of prolonged market deterioration, vertical integration can lead to higher operating leverage, which can be detrimental to cost position
• New capacity in other low-cost regions
We improved intra-Group shipments of phosphate rock by increasing production at Kovdorskiy GOK and the Group’s Kazakhstan operations.
We progressed on schedule with the construction of the EuroChem-Northwest ammonia plant at Kingsisepp, Russia, due to open in 2019.
Our competitiveness depends on the continued high quality of our products and close monitoring of the cost of delivery to key markets.
Our cost and quality advantages are driven by the ownership and control we have over the manufacturing and distribution of our products.
Increased vertical integration, improved efficiency and greater raw material self-sufficiency will strengthen our cost leadership position. This entails boosting production capacity at Nevinnomysskiy Azot and Phosphorit, completing the ammonia plant at Kingisepp, launching potash production and expanding mining output at Kovdorskiy GOK.
New efficiency measures will reduce costs, while increased sales of speciality value-added products will help offset the volatility of earnings.
Growth of production through investment in low-cost projects
■ Build leading low-cost potash production and maximise internal processing
■ New ammonia plant will cover existing shortfall; low cost position will facilitate profitability
The development of potash enables us to further diversify our product range. This delivers a competitive advantage, since the additional sales flexibility will help us respond to changes in demand and economic conditions over sustained periods if needed.
• Technical and engineering risks relating to the construction of the potash mines at Usolskiy and VolgaKaliy
• Commercial risks
• Ongoing intensive capital expenditure requirements
Test production of potassium chloride began at Usolskiy. At the year end, 15 mining machines were operating. Two shafts and two trains are fully operational in test mode, working at projected capacity.
At VolgaKaliy, engineers are devising a plan to address the new water inflow; operation of the two existing shafts will be unaffected.
Pre-commissioning activities commenced at EuroChem-Northwest ammonia plant, Kingisepp.
Phase 1 of our Usolskiy project is expected to be complete during 2019 and fully ramped-up by 2022. Production of potassium chloride (KCl) was 250 KMT in 2018. The first granulation line came on stream in early 2019.
The two existing shafts are designed to produce 10-12 MMT of ore per year, but are restricted to 7.5 MMT by the regulator while in test mode.
The Kingisepp ammonia plant is on track to open in 2019.
Successful production of potash at Usolskiy and VolgaKaliy will transform EuroChem’s profile in the industry, putting the Group at the most efficient end of the potash production cost curve.
Operating costs, location of production assets and distance to market are key drivers of competitiveness. Implementation of leading-edge technologies, coupled with world-class logistics at Usolskiy and VolgaKaliy, will make EuroChem one of the world’s most competitive potash producers.
The Kingisepp plant’s projected capacity of 1 MMT will take EuroChem beyond self-sufficiency in ammonia.
Strong financial position
■ Conservative financial policy and debt management
■ Completion of large-scale investment projects
■ Focus on deleveraging and improving free cash flow
As per the Group’s conservative financial policy, the internal net debt to EBITDA ratio ceiling isset at below 2.5x with covenant leverage test of no more than 3.5x. Capital expenditure has fallen, and free cash flow improved, as our major projects pass their peak investment phase.
• The Group is exposed to interest rate fluctuations
• Potential for mismatch between currencies in which revenues and costs are denominated
• Trade barriers may affect demand for products
• Mining-related risks may result in delays to the Group’s potash projects
We introduced tighter financial controls, managed our capex down and reduced our net debt/EBITDA ratio to 2.29x.
EBITDA was 18% above budget, due principally to positive pricing effects for our main fertilizers and iron ore.
Net debt/EBITDA ratio and free cash flow are key metrics for evaluating our financial performance.
Current scores from credit rating agencies recognise EuroChem’s sustainable cost competitiveness, which is supported by our vertically integrated business model.
Positioned at the lower end of the cost curve, our major projects are nearing completion, reducing our capital expenditure.
We have large-scale operations, a diversity of product mix and established positions in regional and global markets. Our sustainable cost-competitiveness supports relatively high margins and has been helped by a weaker rouble.
Excellent proximity to customers
■ Proximity to customers in key markets via our distribution network allows us to sell at a premium and exploit seasonality patterns
■ We gain valuable market knowledge from direct end-user contact, especially on product quality, R&D and services
■ Value-added products satisfy specific customer needs in different regions
EuroChem will continue to develop its network; enhancing its regional footprint and direct sales and distribution capabilities. The Group will also enhance its support services and product development operations.
• Cost of developing high-quality distribution platform
• Increased credit and currency risks
We continued to expand our direct distribution footprint with new outlets across Russia and Europe. We also continued the integration of assets acquired during 2016 and 2017 – including Fertilizantes Tocantins, Emerger Fertilizantes and Hispalense de Liquidos.
Additional investment was directed to increase storage, blending or other production capabilities.
The development of our global distribution capacity has enabled us to move closer to our customers. Developing strong end-user relationships is a priority, as we seek to align our business in terms of support services and product development.
Investment in new operations included Fertilizantes Tocantins, Brazil, where we opened two new blending plants in 2018 at Sinop and Catalão. With six other plants across the country, Tocantins is one of the biggest fertilizer providers in Brazil and gives EuroChem a significant customer base.
Sta
keho
lder
s en
gag
ed
30 EuroChem Annual Report and Accounts 2018
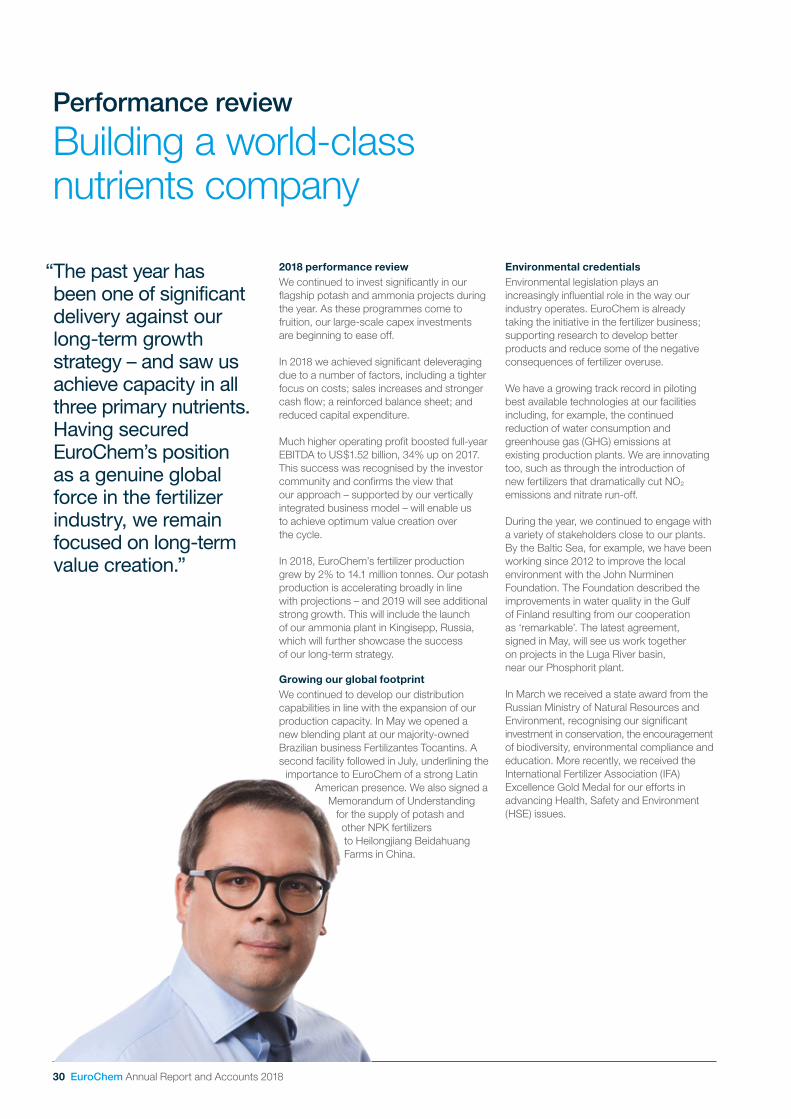
“ The past year has been one of significant delivery against our long-term growth strategy – and saw us achieve capacity in all three primary nutrients. Having secured EuroChem’s position as a genuine global force in the fertilizer industry, we remain focused on long-term value creation.”
Building a world-class nutrients company
Performance review
2018 performance review We continued to invest significantly in our flagship potash and ammonia projects during the year. As these programmes come to fruition, our large-scale capex investments are beginning to ease off.
In 2018 we achieved significant deleveraging due to a number of factors, including a tighter focus on costs; sales increases and stronger cash flow; a reinforced balance sheet; and reduced capital expenditure.
Much higher operating profit boosted full-year EBITDA to US$1.52 billion, 34% up on 2017. This success was recognised by the investor community and confirms the view that our approach – supported by our vertically integrated business model – will enable us to achieve optimum value creation over the cycle.
In 2018, EuroChem’s fertilizer production grew by 2% to 14.1 million tonnes. Our potash production is accelerating broadly in line with projections – and 2019 will see additional strong growth. This will include the launch of our ammonia plant in Kingisepp, Russia, which will further showcase the success of our long-term strategy.
Growing our global footprintWe continued to develop our distribution capabilities in line with the expansion of our production capacity. In May we opened a new blending plant at our majority-owned Brazilian business Fertilizantes Tocantins. A second facility followed in July, underlining the
importance to EuroChem of a strong Latin American presence. We also signed a
Memorandum of Understanding for the supply of potash and other NPK fertilizers to Heilongjiang Beidahuang Farms in China.
Environmental credentialsEnvironmental legislation plays an increasingly influential role in the way our industry operates. EuroChem is already taking the initiative in the fertilizer business; supporting research to develop better products and reduce some of the negative consequences of fertilizer overuse.
We have a growing track record in piloting best available technologies at our facilities including, for example, the continued reduction of water consumption and greenhouse gas (GHG) emissions at existing production plants. We are innovating too, such as through the introduction of new fertilizers that dramatically cut NO2 emissions and nitrate run-off.
During the year, we continued to engage with a variety of stakeholders close to our plants. By the Baltic Sea, for example, we have been working since 2012 to improve the local environment with the John Nurminen Foundation. The Foundation described the improvements in water quality in the Gulf of Finland resulting from our cooperation as ‘remarkable’. The latest agreement, signed in May, will see us work together on projects in the Luga River basin, near our Phosphorit plant.
In March we received a state award from the Russian Ministry of Natural Resources and Environment, recognising our significant investment in conservation, the encouragement of biodiversity, environmental compliance and education. More recently, we received the International Fertilizer Association (IFA) Excellence Gold Medal for our efforts in advancing Health, Safety and Environment (HSE) issues.
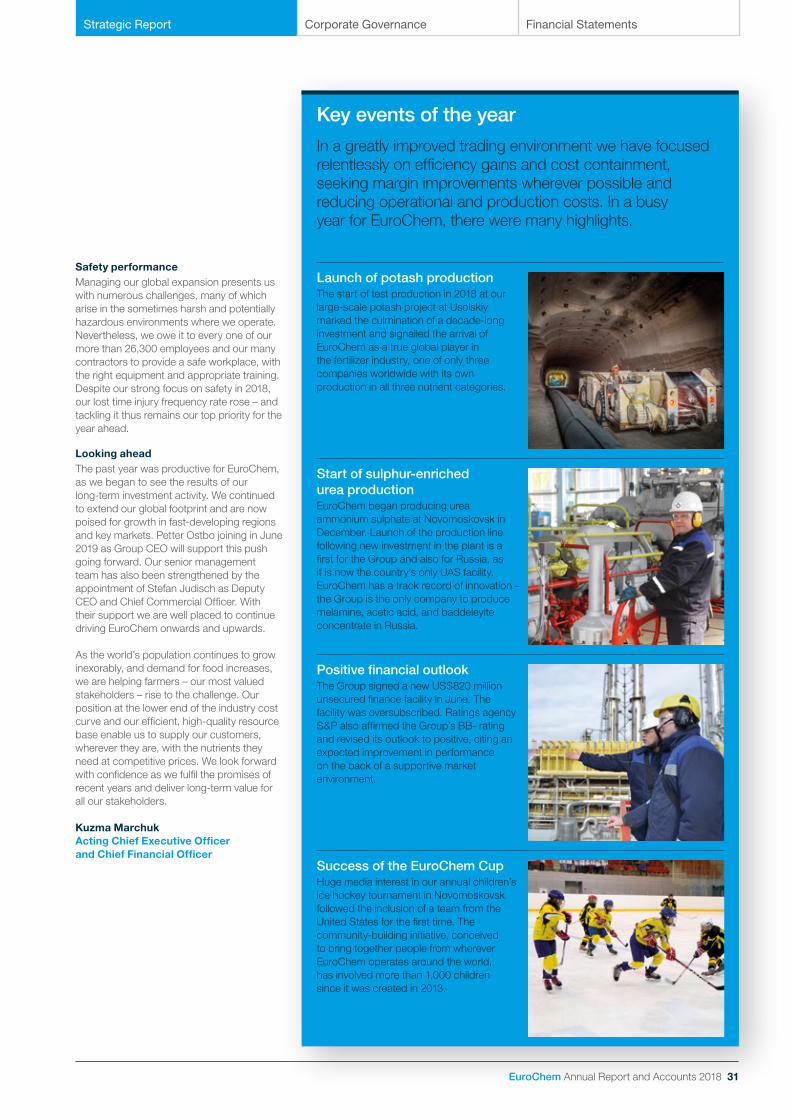
EuroChem Annual Report and Accounts 2018 31
Safety performanceManaging our global expansion presents us with numerous challenges, many of which arise in the sometimes harsh and potentially hazardous environments where we operate. Nevertheless, we owe it to every one of our more than 26,300 employees and our many contractors to provide a safe workplace, with the right equipment and appropriate training. Despite our strong focus on safety in 2018, our lost time injury frequency rate rose – and tackling it thus remains our top priority for the year ahead.
Looking aheadThe past year was productive for EuroChem, as we began to see the results of our long-term investment activity. We continued to extend our global footprint and are now poised for growth in fast-developing regions and key markets. Petter Ostbo joining in June 2019 as Group CEO will support this push going forward. Our senior management team has also been strengthened by the appointment of Stefan Judisch as Deputy CEO and Chief Commercial Officer. With their support we are well placed to continue driving EuroChem onwards and upwards.
As the world’s population continues to grow inexorably, and demand for food increases, we are helping farmers – our most valued stakeholders – rise to the challenge. Our position at the lower end of the industry cost curve and our efficient, high-quality resource base enable us to supply our customers, wherever they are, with the nutrients they need at competitive prices. We look forward with confidence as we fulfil the promises of recent years and deliver long-term value for all our stakeholders.
Kuzma MarchukActing Chief Executive Officer and Chief Financial Officer
Strategic Report Corporate Governance Financial Statements
Key events of the year
In a greatly improved trading environment we have focused relentlessly on efficiency gains and cost containment, seeking margin improvements wherever possible and reducing operational and production costs. In a busy year for EuroChem, there were many highlights.
Launch of potash productionThe start of test production in 2018 at our large-scale potash project at Usolskiy marked the culmination of a decade-long investment and signalled the arrival of EuroChem as a true global player in the fertilizer industry, one of only three companies worldwide with its own production in all three nutrient categories.
Start of sulphur-enriched urea productionEuroChem began producing urea ammonium sulphate at Novomoskovsk in December. Launch of the production line following new investment in the plant is a first for the Group and also for Russia, as it is now the country’s only UAS facility. EuroChem has a track record of innovation – the Group is the only company to produce melamine, acetic acid, and baddeleyite concentrate in Russia.
Positive financial outlook The Group signed a new US$820 million unsecured finance facility in June. The facility was oversubscribed. Ratings agency S&P also affirmed the Group’s BB- rating and revised its outlook to positive, citing an expected improvement in performance on the back of a supportive market environment.
Success of the EuroChem CupHuge media interest in our annual children’s ice hockey tournament in Novomoskovsk followed the inclusion of a team from the United States for the first time. The community-building initiative, conceived to bring together people from wherever EuroChem operates around the world, has involved more than 1,000 children since it was created in 2013.

32 EuroChem Annual Report and Accounts 2018
“ We have delivered a very strong sales performance, rounding off a solid year. This leaves us well positioned to ramp up our new potash and ammonia projects – and we expect continued growth in 2019.”
The Group’s consolidated sales for the year ended 31 December 2018 were US$5.58 billion compared with US$4.87 billion in 2017; an increase of 15%. This growth was primarily the result of stronger pricing dynamics for the Group’s main fertilizer products and improvement in the overall sales mix. The higher pricing – and beneficial foreign exchange effects on rouble-denominated costs – helped to deliver EBITDA for the year of US$1.52 billion, a 34% increase on 2017.
Fertilizer sales volumes for the year amounted to 14.1 million metric tonnes (MMT), 2% ahead of last year’s figure of 13.8 MMT. All product lines delivered improved sales volumes, with the exception of nitrogen fertilizers. While the Group’s sales of its own nitrogen fertilizer products remained stable, there was a reduction in third-party sales due to reduced production by a large contractor.
Sales of complex and blended fertilizers rose by 9% in 2018. This was primarily due to higher sales in Brazil, where Fertilizantes Tocantins launched two new blending plants during the year. Sales volumes of feed phosphates increased by 15%, due to an improved balance across the Group’s key target markets in Europe, the US and Russia.
Iron ore sales were broadly in line with 2017, with strong demand in Russia resulting in fewer shipments to Asia. Sales of EuroChem’s industrial products grew, mainly as a result of strong performances from technical ammonium nitrate and industrial urea, each of which rose 31% on the previous year.
Performance review
Kuzma Marchuk Acting Chief Executive Officer and Chief Financial Officer
Group performance
Highlights
Change y-o-y
+15% +34% -6% 1. Last 12 months.
2. Including net income from associates and joint ventures.
Sales (US$m)
5,57
7
4,86
6
2017 2018
EBITDA (US$m)
1,51
7
1,13
0
2017 2018
Cash from operations (US$m)
982
1,04
9
2017 2018
Net covenant debt/LTM1 EBITDA2
2.29
2.88
2017 2018

EuroChem Annual Report and Accounts 2018 33
Strategic Report Corporate Governance Financial Statements
Sales of EuroChem fertilizer products – excluding third-party products – amounted to 10.0 MMT, broadly in line with 2017 volumes. Third-party sales volumes for the year rose slightly to 4.1 MMT from 3.8 MMT in 2017, due mainly to stronger sales in Brazil.
Mining products sales volumes grew 1% to 5.98 MMT in 2018 while industrial products delivered an increase of 9% to 1.87 MMT.
Europe, Russia and the CIS are the Group’s home markets. In 2018 they accounted for 29% and 24% of total sales, compared with 32% and 27%, in 2017, respectively.
EuroChem continued to reinforce its marketing capabilities in the CIS, signing new long-term distribution agreements in Armenia and Georgia during the year. The Group’s stronger market presence also supported increased deliveries to Azerbaijan and Moldova.
For more information on sales performance, see pages 42-43.
Selected sales volumes(KMT)
EuroChem and third-party products FY
2018FY
2017
Changey-o-y
%
Nitrogen products 7,813 8,073 -3%
Nitrogen fertilizers 7,797 8,055 -3%
Other products 16 18 -11%
Phosphate and complex products 5,685 5,319 +7%
Phosphate fertilizers 2,379 2,304 +3%
Complex fertilizers 2,907 2,667 +9%
Feed phosphates 399 348 +15%
Potash fertilizers 632 454 +39%
Total fertilizers (incl. feed phosphates) 14,130 13,846 +2%
Mining products 5,977 5,912 +1%
Iron ore concentrate 5,844 5,878 -1%
Other products 133 34 +291%
Industrial products and other 1,871 1,716 +9%
Geography of sales (as proportion of total sales, %)
29%
21% 19%
15%
9%
5%
2%
2018
1. Including associate states, excluding Russia.
Europe
Latin America
Russia
North America
Asia Pacific
CIS1
Africa32%
20%16%
13%
10%
7%2%
2017
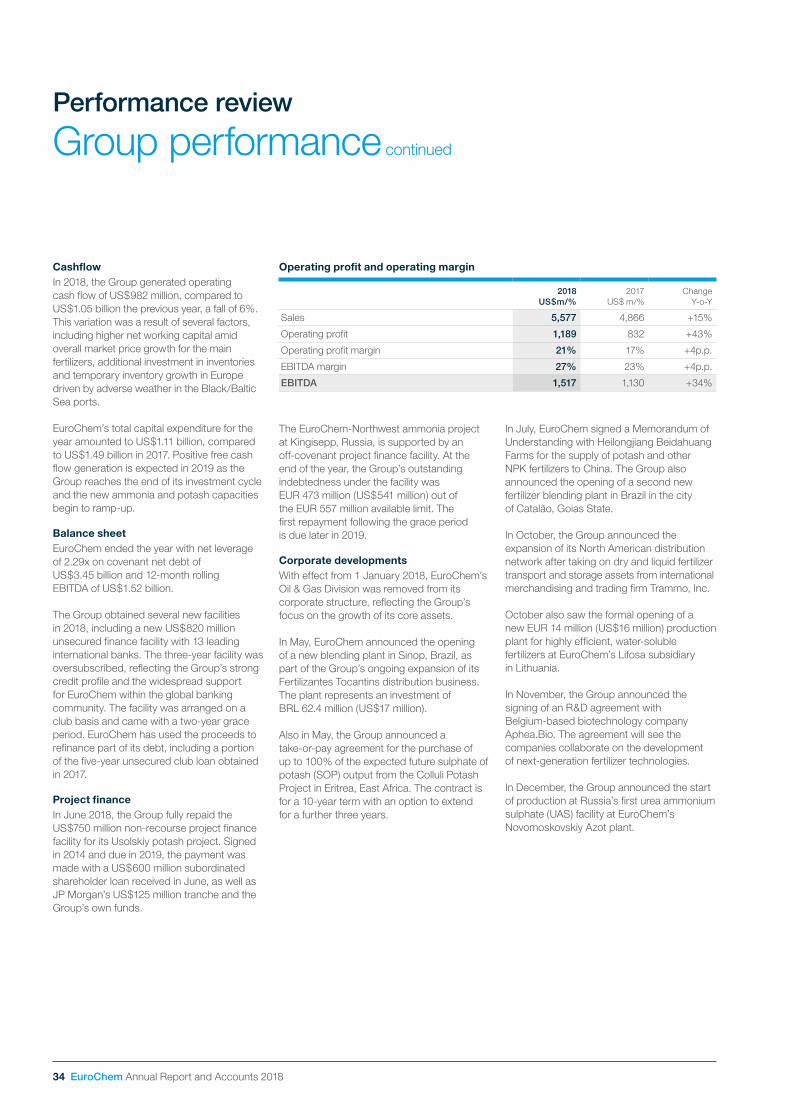
34 EuroChem Annual Report and Accounts 2018
CashflowIn 2018, the Group generated operating cash flow of US$982 million, compared to US$1.05 billion the previous year, a fall of 6%. This variation was a result of several factors, including higher net working capital amid overall market price growth for the main fertilizers, additional investment in inventories and temporary inventory growth in Europe driven by adverse weather in the Black/Baltic Sea ports.
EuroChem’s total capital expenditure for the year amounted to US$1.11 billion, compared to US$1.49 billion in 2017. Positive free cash flow generation is expected in 2019 as the Group reaches the end of its investment cycle and the new ammonia and potash capacities begin to ramp-up.
Balance sheet EuroChem ended the year with net leverage of 2.29x on covenant net debt of US$3.45 billion and 12-month rolling EBITDA of US$1.52 billion.
The Group obtained several new facilities in 2018, including a new US$820 million unsecured finance facility with 13 leading international banks. The three-year facility was oversubscribed, reflecting the Group’s strong credit profile and the widespread support for EuroChem within the global banking community. The facility was arranged on a club basis and came with a two-year grace period. EuroChem has used the proceeds to refinance part of its debt, including a portion of the five-year unsecured club loan obtained in 2017.
Project financeIn June 2018, the Group fully repaid the US$750 million non-recourse project finance facility for its Usolskiy potash project. Signed in 2014 and due in 2019, the payment was made with a US$600 million subordinated shareholder loan received in June, as well as JP Morgan’s US$125 million tranche and the Group’s own funds.
Group performance continued
Performance review
Operating profit and operating margin
2018US$m/%
2017US$ m/%
ChangeY-o-Y
Sales 5,577 4,866 +15%
Operating profit 1,189 832 +43%
Operating profit margin 21% 17% +4p.p.
EBITDA margin 27% 23% +4p.p.
EBITDA 1,517 1,130 +34%
The EuroChem-Northwest ammonia project at Kingisepp, Russia, is supported by an off-covenant project finance facility. At the end of the year, the Group’s outstanding indebtedness under the facility was EUR 473 million (US$541 million) out of the EUR 557 million available limit. The first repayment following the grace period is due later in 2019.
Corporate developments With effect from 1 January 2018, EuroChem’s Oil & Gas Division was removed from its corporate structure, reflecting the Group’s focus on the growth of its core assets.
In May, EuroChem announced the opening of a new blending plant in Sinop, Brazil, as part of the Group’s ongoing expansion of its Fertilizantes Tocantins distribution business. The plant represents an investment of BRL 62.4 million (US$17 million).
Also in May, the Group announced a take-or-pay agreement for the purchase of up to 100% of the expected future sulphate of potash (SOP) output from the Colluli Potash Project in Eritrea, East Africa. The contract is for a 10-year term with an option to extend for a further three years.
In July, EuroChem signed a Memorandum of Understanding with Heilongjiang Beidahuang Farms for the supply of potash and other NPK fertilizers to China. The Group also announced the opening of a second new fertilizer blending plant in Brazil in the city of Catalão, Goias State.
In October, the Group announced the expansion of its North American distribution network after taking on dry and liquid fertilizer transport and storage assets from international merchandising and trading firm Trammo, Inc.
October also saw the formal opening of a new EUR 14 million (US$16 million) production plant for highly efficient, water-soluble fertilizers at EuroChem’s Lifosa subsidiary in Lithuania.
In November, the Group announced the signing of an R&D agreement with Belgium-based biotechnology company Aphea.Bio. The agreement will see the companies collaborate on the development of next-generation fertilizer technologies.
In December, the Group announced the start of production at Russia’s first urea ammonium sulphate (UAS) facility at EuroChem’s Novomoskovskiy Azot plant.
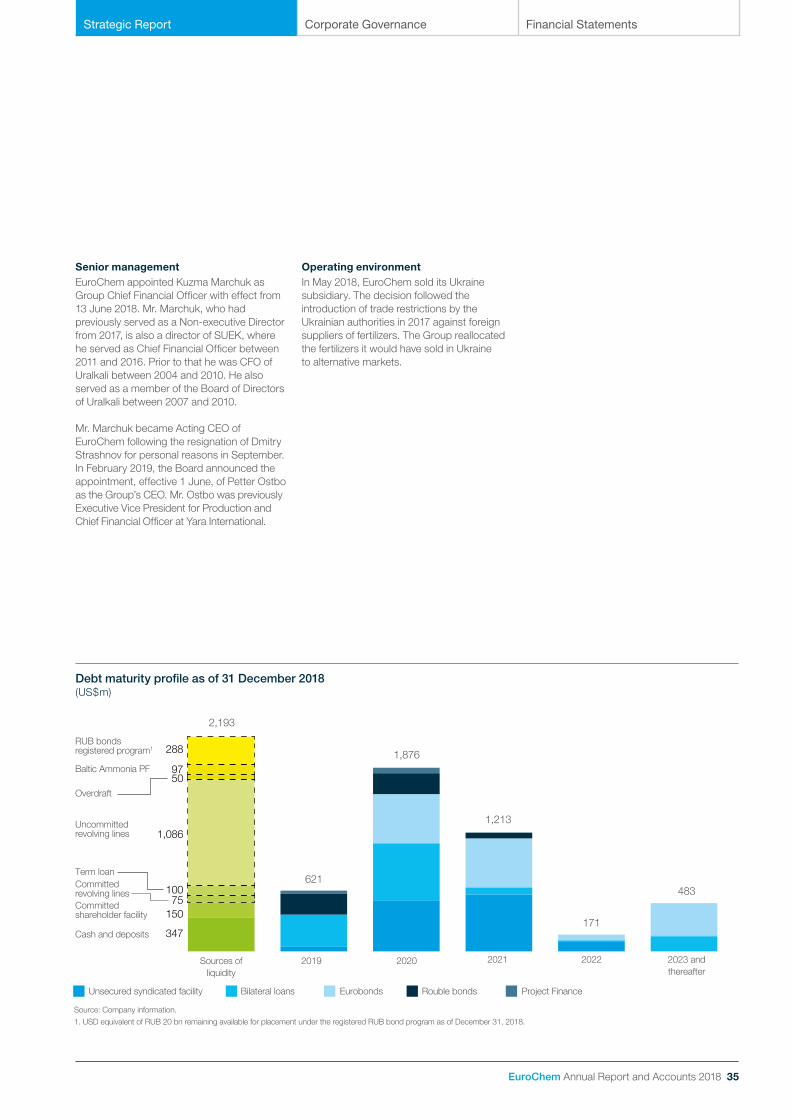
Strategic Report Corporate Governance Financial Statements
EuroChem Annual Report and Accounts 2018 35
RUB bonds registered program1
Baltic Ammonia PF
Overdraft
Uncommitted revolving lines
Term loanCommitted revolving linesCommitted shareholder facility
Cash and deposits
Sources of liquidity
2019
Unsecured syndicated facility
Source: Company information.1. USD equivalent of RUB 20 bn remaining available for placement under the registered RUB bond program as of December 31, 2018.
Bilateral loans Eurobonds Rouble bonds Project Finance
2020 2021 2022 2023 and thereafter
150
347
75100
1,086
5097
288
621
1,876
1,213
171
483
2,193
Debt maturity profile as of 31 December 2018 (US$m)
Senior management EuroChem appointed Kuzma Marchuk as Group Chief Financial Officer with effect from 13 June 2018. Mr. Marchuk, who had previously served as a Non-executive Director from 2017, is also a director of SUEK, where he served as Chief Financial Officer between 2011 and 2016. Prior to that he was CFO of Uralkali between 2004 and 2010. He also served as a member of the Board of Directors of Uralkali between 2007 and 2010.
Mr. Marchuk became Acting CEO of EuroChem following the resignation of Dmitry Strashnov for personal reasons in September. In February 2019, the Board announced the appointment, effective 1 June, of Petter Ostbo as the Group’s CEO. Mr. Ostbo was previously Executive Vice President for Production and Chief Financial Officer at Yara International.
Operating environmentIn May 2018, EuroChem sold its Ukraine subsidiary. The decision followed the introduction of trade restrictions by the Ukrainian authorities in 2017 against foreign suppliers of fertilizers. The Group reallocated the fertilizers it would have sold in Ukraine to alternative markets.
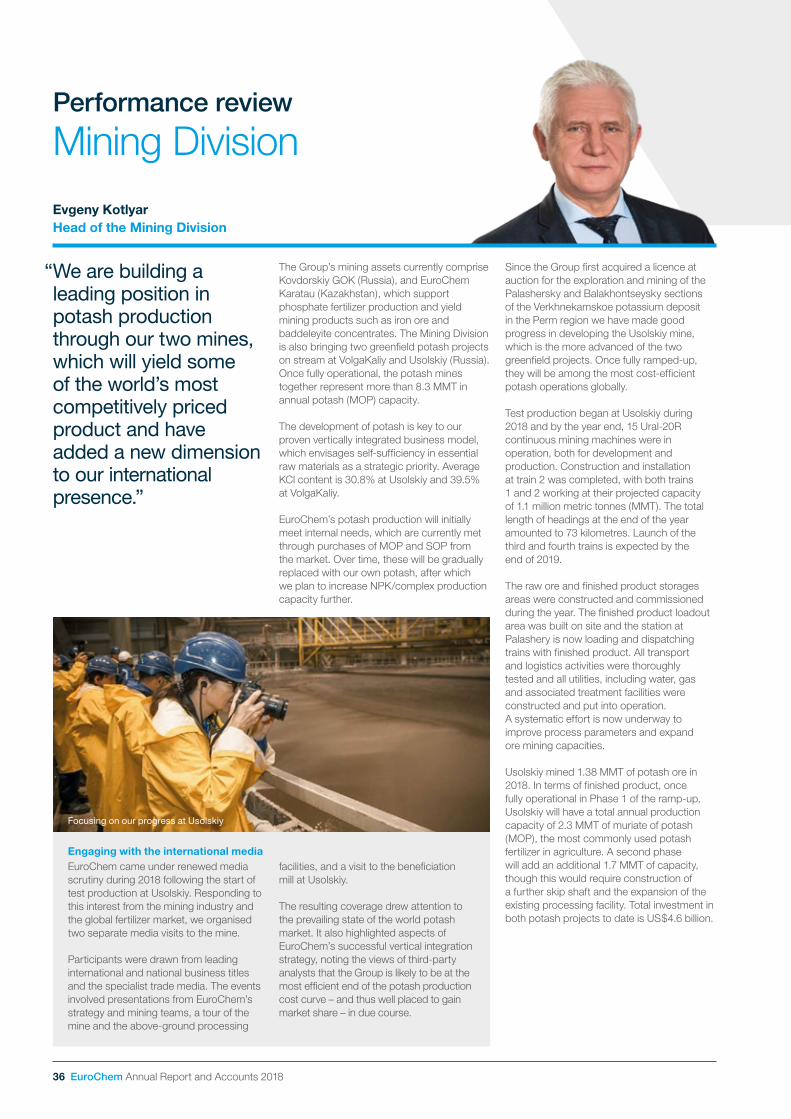
36 EuroChem Annual Report and Accounts 2018
“ We are building a leading position in potash production through our two mines, which will yield some of the world’s most competitively priced product and have added a new dimension to our international presence.”
The Group’s mining assets currently comprise Kovdorskiy GOK (Russia), and EuroChem Karatau (Kazakhstan), which support phosphate fertilizer production and yield mining products such as iron ore and baddeleyite concentrates. The Mining Division is also bringing two greenfield potash projects on stream at VolgaKaliy and Usolskiy (Russia). Once fully operational, the potash mines together represent more than 8.3 MMT in annual potash (MOP) capacity.
The development of potash is key to our proven vertically integrated business model, which envisages self-sufficiency in essential raw materials as a strategic priority. Average KCl content is 30.8% at Usolskiy and 39.5% at VolgaKaliy.
EuroChem’s potash production will initially meet internal needs, which are currently met through purchases of MOP and SOP from the market. Over time, these will be gradually replaced with our own potash, after which we plan to increase NPK/complex production capacity further.
Since the Group first acquired a licence at auction for the exploration and mining of the Palashersky and Balakhontseysky sections of the Verkhnekamskoe potassium deposit in the Perm region we have made good progress in developing the Usolskiy mine, which is the more advanced of the two greenfield projects. Once fully ramped-up, they will be among the most cost-efficient potash operations globally.
Test production began at Usolskiy during 2018 and by the year end, 15 Ural-20R continuous mining machines were in operation, both for development and production. Construction and installation at train 2 was completed, with both trains 1 and 2 working at their projected capacity of 1.1 million metric tonnes (MMT). The total length of headings at the end of the year amounted to 73 kilometres. Launch of the third and fourth trains is expected by the end of 2019.
The raw ore and finished product storages areas were constructed and commissioned during the year. The finished product loadout area was built on site and the station at Palashery is now loading and dispatching trains with finished product. All transport and logistics activities were thoroughly tested and all utilities, including water, gas and associated treatment facilities were constructed and put into operation. A systematic effort is now underway to improve process parameters and expand ore mining capacities.
Usolskiy mined 1.38 MMT of potash ore in 2018. In terms of finished product, once fully operational in Phase 1 of the ramp-up, Usolskiy will have a total annual production capacity of 2.3 MMT of muriate of potash (MOP), the most commonly used potash fertilizer in agriculture. A second phase will add an additional 1.7 MMT of capacity, though this would require construction of a further skip shaft and the expansion of the existing processing facility. Total investment in both potash projects to date is US$4.6 billion.
Engaging with the international mediaEuroChem came under renewed media scrutiny during 2018 following the start of test production at Usolskiy. Responding to this interest from the mining industry and the global fertilizer market, we organised two separate media visits to the mine.
Participants were drawn from leading international and national business titles and the specialist trade media. The events involved presentations from EuroChem’s strategy and mining teams, a tour of the mine and the above-ground processing
facilities, and a visit to the beneficiation mill at Usolskiy.
The resulting coverage drew attention to the prevailing state of the world potash market. It also highlighted aspects of EuroChem’s successful vertical integration strategy, noting the views of third-party analysts that the Group is likely to be at the most efficient end of the potash production cost curve – and thus well placed to gain market share – in due course.
Mining DivisionPerformance review
Evgeny KotlyarHead of the Mining Division
Focusing on our progress at Usolskiy

EuroChem Annual Report and Accounts 2018 37
Strategic Report Corporate Governance Financial Statements
Mining in numbers To date, we have invested US$4.6bn1 on both projects.
Our two new potash mines at Usolskiy and VolgaKaliy will together represent more than 8.3 MMT in annual MOP capacity.
At Usolskiy, 15 Ural-20R machines were in operation at the year end, both for development and production.
1. Historical currency rates were used for the calculation of the investment.
Average KCl content at VolgaKaliy
39.5%
Length of headings at Usolskiy at year-end
73km
Annual ore hoisting capacity at VolgaKaliy
10MMT
Work also advanced at our VolgaKaliy project, where we are developing the Gremyachinskoe potash deposit in the Volgograd region. Below ground, the two skip shafts were successfully connected and the implementation of the cage shaft programme continued.
As previously disclosed, the cage shaft at VolgaKaliy suffered manageable water inflow in 2015. In December 2018, water inflow in the shaft reoccurred and we implemented additional remedial measures to address the problem. The incident is not expected to significantly impact the project’s progress.
Similar incidents have occurred with other operators’ shafts in North America and elsewhere, with facilities later being reclaimed and continuing to operate. Although the water inflow at VolgaKaliy’s cage shaft caused an initial delay, the volume of ore mined at the site is expected to be sufficient for the operations during the initial stage of production set out in the Group’s plan.
Work continued to develop the mine using the other two skip shafts. A freeze wall currently being built around the cage shaft will eliminate water inflow. Above ground the flotation plant is in commissioning mode, with the first concentrate obtained in July 2018. The total hoisting capacity of the two skip shafts is 10 MMT of ore per annum, which will allow the mine to ramp-up to Phase 1 full production capacity of 7.3 MMT of ore in 2021-22.
The second phase assumes the availability of a third shaft and a new processing plant. Construction of the third shaft, also under the protection of a freeze wall at a depth of 810m, has been delayed due to water inflow that initially occurred in 2015. Six new additional wells were drilled and frozen to mitigate the effects of the water inflow. A second ring of wells will establish a new freeze wall, enabling construction of the third shaft to be completed in 2024. The third shaft will increase capacity for ore mining and extraction from 10 MMT up to 14.6 MMT per year.
The water inflow in the third shaft is not expected to significantly delay the continued implementation of the project. The third shaft is not connected to the mine, so the water inflow will not cause flooding of the mine or any loss of reserves.
“ My husband and I both previously worked at a potash company in the Perm region – but our lives have been transformed in the past year, thanks to EuroChem. With its excellent reputation, we knew a move here would be good for our careers. When our applications were accepted, we moved to Kotelnikovo and now work at VolgaKaliy. We’re very happily settled in our new community and intend to make the most of the professional opportunities that lie ahead. It’s wonderful that our skills have been recognised – and we’re proud that we’re now contributing to EuroChem’s success.”
Natalya GolubinovaHead of Reagents Department, Beneficiation Plant, EuroChem-VolgaKaliy LLC
Voice from the workplace
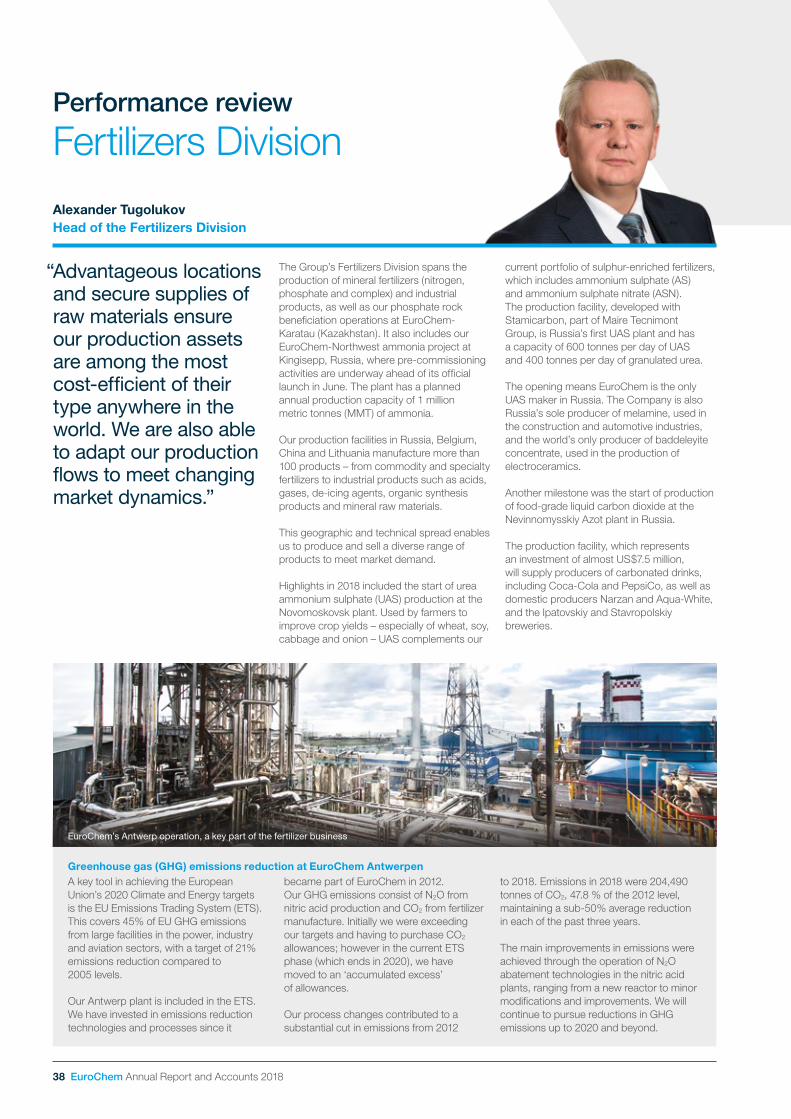
38 EuroChem Annual Report and Accounts 2018
“ Advantageous locations and secure supplies of raw materials ensure our production assets are among the most cost-efficient of their type anywhere in the world. We are also able to adapt our production flows to meet changing market dynamics.”
The Group’s Fertilizers Division spans the production of mineral fertilizers (nitrogen, phosphate and complex) and industrial products, as well as our phosphate rock beneficiation operations at EuroChem-Karatau (Kazakhstan). It also includes our EuroChem-Northwest ammonia project at Kingisepp, Russia, where pre-commissioning activities are underway ahead of its official launch in June. The plant has a planned annual production capacity of 1 million metric tonnes (MMT) of ammonia.
Our production facilities in Russia, Belgium, China and Lithuania manufacture more than 100 products – from commodity and specialty fertilizers to industrial products such as acids, gases, de-icing agents, organic synthesis products and mineral raw materials.
This geographic and technical spread enables us to produce and sell a diverse range of products to meet market demand.
Highlights in 2018 included the start of urea ammonium sulphate (UAS) production at the Novomoskovsk plant. Used by farmers to improve crop yields – especially of wheat, soy, cabbage and onion – UAS complements our
current portfolio of sulphur-enriched fertilizers, which includes ammonium sulphate (AS) and ammonium sulphate nitrate (ASN). The production facility, developed with Stamicarbon, part of Maire Tecnimont Group, is Russia’s first UAS plant and has a capacity of 600 tonnes per day of UAS and 400 tonnes per day of granulated urea.
The opening means EuroChem is the only UAS maker in Russia. The Company is also Russia’s sole producer of melamine, used in the construction and automotive industries, and the world’s only producer of baddeleyite concentrate, used in the production of electroceramics.
Another milestone was the start of production of food-grade liquid carbon dioxide at the Nevinnomysskiy Azot plant in Russia.
The production facility, which represents an investment of almost US$7.5 million, will supply producers of carbonated drinks, including Coca-Cola and PepsiCo, as well as domestic producers Narzan and Aqua-White, and the Ipatovskiy and Stavropolskiy breweries.
Greenhouse gas (GHG) emissions reduction at EuroChem AntwerpenA key tool in achieving the European Union’s 2020 Climate and Energy targets is the EU Emissions Trading System (ETS). This covers 45% of EU GHG emissions from large facilities in the power, industry and aviation sectors, with a target of 21% emissions reduction compared to 2005 levels.
Our Antwerp plant is included in the ETS. We have invested in emissions reduction technologies and processes since it
became part of EuroChem in 2012. Our GHG emissions consist of N2O from nitric acid production and CO2 from fertilizer manufacture. Initially we were exceeding our targets and having to purchase CO2 allowances; however in the current ETS phase (which ends in 2020), we have moved to an ‘accumulated excess’ of allowances.
Our process changes contributed to a substantial cut in emissions from 2012
to 2018. Emissions in 2018 were 204,490 tonnes of CO2, 47.8 % of the 2012 level, maintaining a sub-50% average reduction in each of the past three years.
The main improvements in emissions were achieved through the operation of N2O abatement technologies in the nitric acid plants, ranging from a new reactor to minor modifications and improvements. We will continue to pursue reductions in GHG emissions up to 2020 and beyond.
Fertilizers DivisionPerformance review
Alexander Tugolukov Head of the Fertilizers Division
EuroChem’s Antwerp operation, a key part of the fertilizer business

EuroChem Annual Report and Accounts 2018 39
Fertilizers in numbers EuroChem’s ammonia plant at Kingisepp, Russia, is adjacent to the Group’s Phosphorit phosphate fertilizer facility and thus well positioned to deliver to key markets. EuroChem-Northwest, coming on stream in the second quarter of 2019, has a design capacity of 2,700 tonnes per day or 1 million tonnes per annum. In addition to the ammonia production facility, the project also includes utilities and offsite buildings, including a warehouse for storage of liquid ammonia.
Invested in EuroChem-Northwest (US$)
1bn
Workers involved in construction phase
2,000Long-term jobs created at EuroChem-Northwest
300
From Kingisepp to the Baltic Sea
50km
Total Group fertilizer output
14.1MMT
Different grades of NPK products manufactured at Antwerp
35
Strategic Report Corporate Governance Financial Statements
Innovating to improve water qualityIn 2012, EuroChem began cooperation with the John Nurminen Foundation, an independent charitable organisation working to protect the Baltic Sea. The joint project focused on transforming the ecological quality of the Luga River basin, adjacent to our Phosphorit facility at Kingisepp. The work included the development of a system of dams and other measures, which led to a significant decrease in phosphorus discharged into the Luga and thus the Baltic Sea.
The Foundation supervised independent testing of water quality within the Luga basin and Baltic Sea, as well as the effectiveness of the plant’s water purification system. Marjukka Porvari, Director of the Foundation’s Baltic Sea
projects, described the results as ‘remarkable’, adding: “In terms of its positive impact on the environment… this is the largest environmental project ever implemented in the Gulf of Finland in the Baltic Sea.”
The John Nurminen Foundation and EuroChem have agreed to continue working on measures to improve the environment in the Luga River basin and the Gulf of Finland.
Under the terms of the agreement, EuroChem will continue to invest in water quality and efficiency, with the Foundation acting as an independent monitor and observer.
In October, we opened a new US$16 million facility for the production of crystalline urea phosphate at Lifosa in Lithuania. The plant, which has a projected capacity of 25,000 tonnes per year, was constructed in just 12 months. It adds to the range of fertilizers currently produced at Lifosa, including diammonium phosphate (DAP), and water-soluble crystal monoammonium phosphate (MAP).
A substantial number of investment projects were undertaken during 2018, including new facilities to improve occupational health and safety and reduce our environmental emissions.
At our NPK plant at EuroChem-Antwerpen, we installed a state-of-the-art industrial dust and gas-scrubbing unit to remove particles and gases from industrial exhaust streams at the plant. At Kingisepp, we commissioned a new collection system to take surface waste water to our facility at Phosphorit. The effluent will be used in the operating processes of our adjacent ammonia plant when it begins operations, thereby helping reduce Phosphorit’s effluent discharges by more than 70%.
Marjukka Porvari (left) of the John Nurminen Foundation, with (centre) Vladimir Erlykov, Executive Director of Phosphorit.
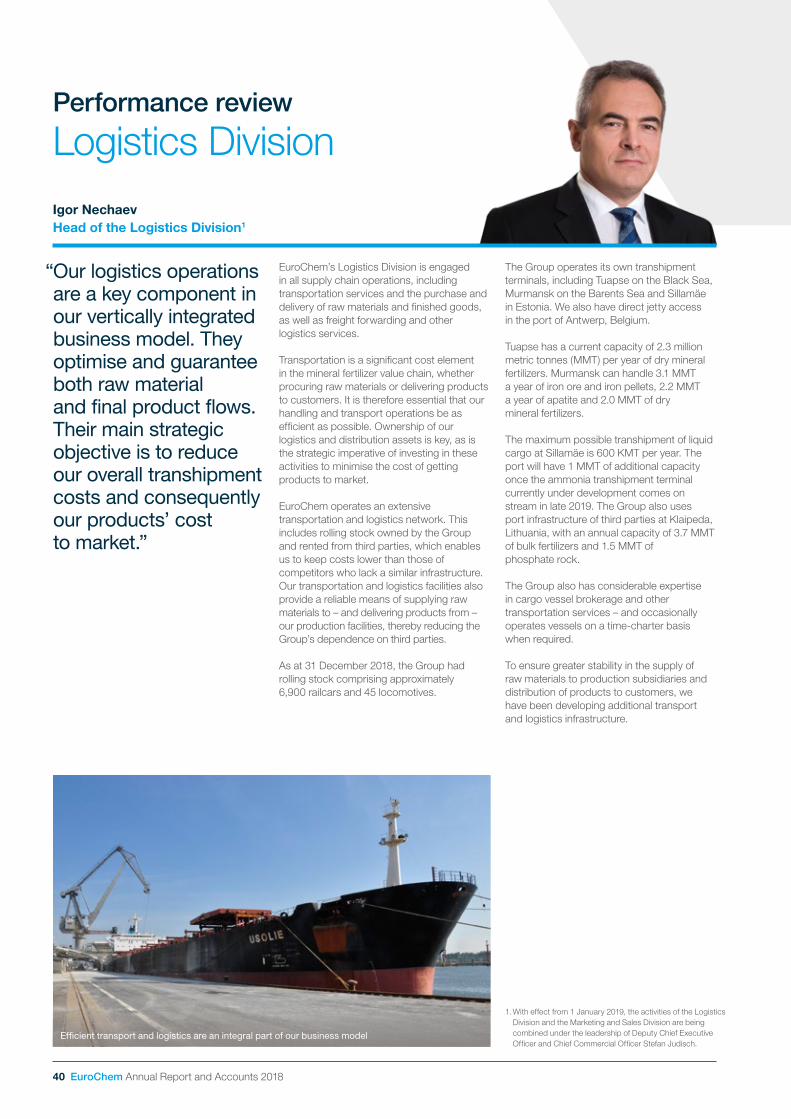
40 EuroChem Annual Report and Accounts 2018
“ Our logistics operations are a key component in our vertically integrated business model. They optimise and guarantee both raw material and final product flows. Their main strategic objective is to reduce our overall transhipment costs and consequently our products’ cost to market.”
EuroChem’s Logistics Division is engaged in all supply chain operations, including transportation services and the purchase and delivery of raw materials and finished goods, as well as freight forwarding and other logistics services.
Transportation is a significant cost element in the mineral fertilizer value chain, whether procuring raw materials or delivering products to customers. It is therefore essential that our handling and transport operations be as efficient as possible. Ownership of our logistics and distribution assets is key, as is the strategic imperative of investing in these activities to minimise the cost of getting products to market.
EuroChem operates an extensive transportation and logistics network. This includes rolling stock owned by the Group and rented from third parties, which enables us to keep costs lower than those of competitors who lack a similar infrastructure. Our transportation and logistics facilities also provide a reliable means of supplying raw materials to – and delivering products from – our production facilities, thereby reducing the Group’s dependence on third parties.
As at 31 December 2018, the Group had rolling stock comprising approximately 6,900 railcars and 45 locomotives.
Logistics DivisionPerformance review
Igor Nechaev Head of the Logistics Division1
The Group operates its own transhipment terminals, including Tuapse on the Black Sea, Murmansk on the Barents Sea and Sillamäe in Estonia. We also have direct jetty access in the port of Antwerp, Belgium.
Tuapse has a current capacity of 2.3 million metric tonnes (MMT) per year of dry mineral fertilizers. Murmansk can handle 3.1 MMT a year of iron ore and iron pellets, 2.2 MMT a year of apatite and 2.0 MMT of dry mineral fertilizers.
The maximum possible transhipment of liquid cargo at Sillamäe is 600 KMT per year. The port will have 1 MMT of additional capacity once the ammonia transhipment terminal currently under development comes on stream in late 2019. The Group also uses port infrastructure of third parties at Klaipeda, Lithuania, with an annual capacity of 3.7 MMT of bulk fertilizers and 1.5 MMT of phosphate rock.
The Group also has considerable expertise in cargo vessel brokerage and other transportation services – and occasionally operates vessels on a time-charter basis when required.
To ensure greater stability in the supply of raw materials to production subsidiaries and distribution of products to customers, we have been developing additional transport and logistics infrastructure.
1. With effect from 1 January 2019, the activities of the Logistics Division and the Marketing and Sales Division are being combined under the leadership of Deputy Chief Executive Officer and Chief Commercial Officer Stefan Judisch.
Efficient transport and logistics are an integral part of our business model

EuroChem Annual Report and Accounts 2018 41
Strategic Report Corporate Governance Financial Statements
Logistics in numbers EuroChem uses its own logistics assets – supplemented by occasional rentals from third parties. In 2018 the Group moved 18 MMT of raw materials and fertilizers. Owned logistics assets enable more efficient, cost-effective delivery of products to customers in major markets, ensuring continuity through consistent supply of adequate quality feedstock and export of finished products.
Railcar capacity of maintenance depot at Nevinnomyssk
5,000Rail track at EuroChem plants
326km
Total railcars after the purchase of new hopper railcars for Usolskiy potash plant
8,600
Panamax vessels (Usolie, Iron Kovdor)
2
Annual loading capacity of fertilizers, EuroChem Antwerpen
2.9MMT
Fertilizer storage volume at Tuapse
80KMT
Maximum possible transhipment of liquid cargo at Sillamäe
600KMT
EuroChem owns 45 locomotives and almost 7,000 rail cars
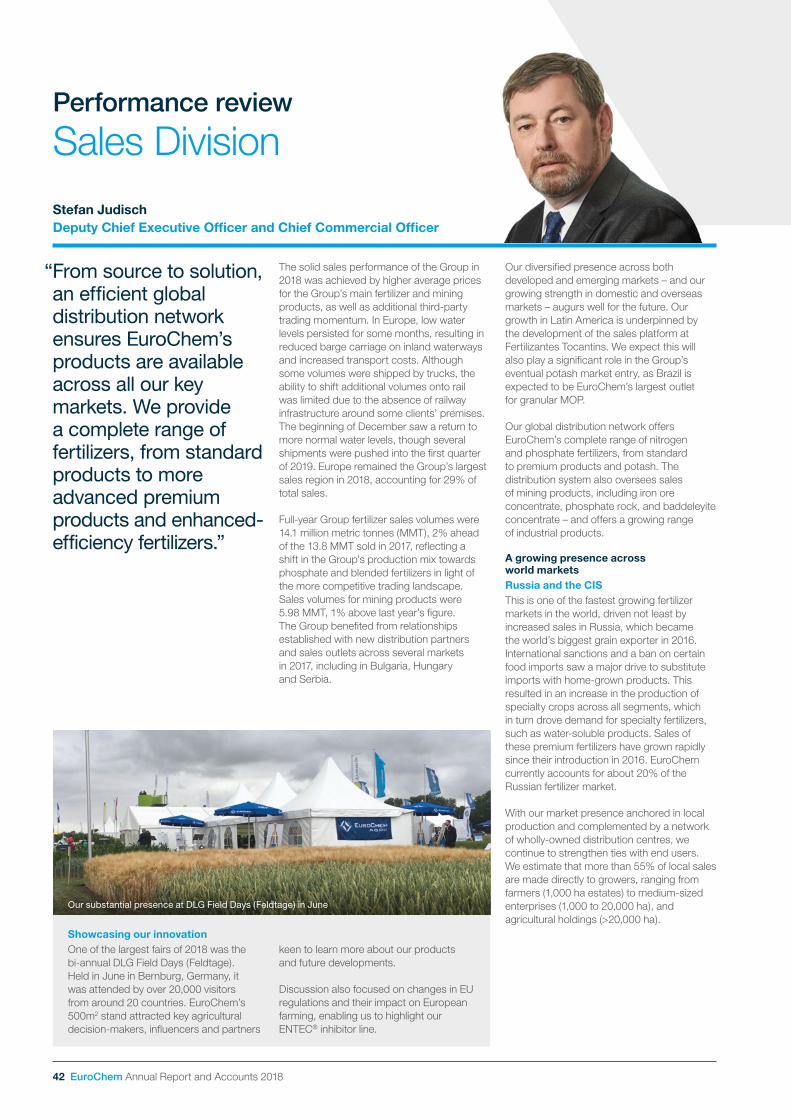
42 EuroChem Annual Report and Accounts 2018
“ From source to solution, an efficient global distribution network ensures EuroChem’s products are available across all our key markets. We provide a complete range of fertilizers, from standard products to more advanced premium products and enhanced-efficiency fertilizers.”
The solid sales performance of the Group in 2018 was achieved by higher average prices for the Group’s main fertilizer and mining products, as well as additional third-party trading momentum. In Europe, low water levels persisted for some months, resulting in reduced barge carriage on inland waterways and increased transport costs. Although some volumes were shipped by trucks, the ability to shift additional volumes onto rail was limited due to the absence of railway infrastructure around some clients’ premises. The beginning of December saw a return to more normal water levels, though several shipments were pushed into the first quarter of 2019. Europe remained the Group’s largest sales region in 2018, accounting for 29% of total sales.
Full-year Group fertilizer sales volumes were 14.1 million metric tonnes (MMT), 2% ahead of the 13.8 MMT sold in 2017, reflecting a shift in the Group’s production mix towards phosphate and blended fertilizers in light of the more competitive trading landscape. Sales volumes for mining products were 5.98 MMT, 1% above last year’s figure. The Group benefited from relationships established with new distribution partners and sales outlets across several markets in 2017, including in Bulgaria, Hungary and Serbia.
Showcasing our innovationOne of the largest fairs of 2018 was the bi-annual DLG Field Days (Feldtage). Held in June in Bernburg, Germany, it was attended by over 20,000 visitors from around 20 countries. EuroChem’s 500m2 stand attracted key agricultural decision-makers, influencers and partners
keen to learn more about our products and future developments.
Discussion also focused on changes in EU regulations and their impact on European farming, enabling us to highlight our ENTEC® inhibitor line.
Sales DivisionPerformance review
Stefan JudischDeputy Chief Executive Officer and Chief Commercial Officer
Our diversified presence across both developed and emerging markets – and our growing strength in domestic and overseas markets – augurs well for the future. Our growth in Latin America is underpinned by the development of the sales platform at Fertilizantes Tocantins. We expect this will also play a significant role in the Group’s eventual potash market entry, as Brazil is expected to be EuroChem’s largest outlet for granular MOP.
Our global distribution network offers EuroChem’s complete range of nitrogen and phosphate fertilizers, from standard to premium products and potash. The distribution system also oversees sales of mining products, including iron ore concentrate, phosphate rock, and baddeleyite concentrate – and offers a growing range of industrial products.
A growing presence across world markets Russia and the CIS This is one of the fastest growing fertilizer markets in the world, driven not least by increased sales in Russia, which became the world’s biggest grain exporter in 2016. International sanctions and a ban on certain food imports saw a major drive to substitute imports with home-grown products. This resulted in an increase in the production of specialty crops across all segments, which in turn drove demand for specialty fertilizers, such as water-soluble products. Sales of these premium fertilizers have grown rapidly since their introduction in 2016. EuroChem currently accounts for about 20% of the Russian fertilizer market.
With our market presence anchored in local production and complemented by a network of wholly-owned distribution centres, we continue to strengthen ties with end users. We estimate that more than 55% of local sales are made directly to growers, ranging from farmers (1,000 ha estates) to medium-sized enterprises (1,000 to 20,000 ha), and agricultural holdings (>20,000 ha).
Our substantial presence at DLG Field Days (Feldtage) in June
EuroChem Annual Report and Accounts 2018 43
Strategic Report Corporate Governance Financial Statements
EuropeNew EU regulations will trigger demand for more advanced, enhanced-efficiency products. We expect to see increasing sales of nitrification and urease inhibited solutions, as well as biological and organic-based products. These changes are positive for EuroChem, since our objective is to continue growing sales of premium products through the introduction of new product lines, as well as increasing deliveries of NPKs produced at Nevinnomyssk in Russia.
Although premium products in Western European markets suffered from supply-driven global market conditions, substantial growth in Eastern Europe, where we have established new distribution arrangements, helped to offset this trend. We remain the second-largest European fertilizer supplier, with substantial manufacturing presence at EuroChem Antwerpen and Lifosa in Lithuania – and a sales presence in Mannheim, Germany – with a wide network across the continent.
Our European sales team maintains a network of established offices. Our colleagues are recognised for their agricultural expertise and knowledge of premium products, such as Nitrophoska® and ENTEC®. EuroChem participated in 22 major agricultural fairs and events across nine European countries in 2018. These events allowed our local teams to showcase our products and represented a potential outreach to nearly 900,000 farmers and agricultural distributors.
Marketing excellence As a natural extension to its ownership of EuroChem Antwerpen, the Group has secured the rights to use the ‘Horse & Lion’ seal, originally used as a corporate logo for BASF. The seal carries a reputation for integrity and quality – and is a sought-after mark of excellence in Asian fertilizer markets.
Sales in numbers EuroChem’s efficient sales and distribution network ensures our fertilizers are widely available to farmers on a timely basis. Proximity to customers is one of our key strategic goals and we will continue expanding our presence.
Latin American sales as proportion of the total
21%
Customers worldwide
>10,000Total fertilizer sales volumes in 2018
14.1MMT
Latin AmericaGaining a firm foothold in Latin America has been a notable feature of EuroChem’s recent global expansion strategy.
Sales to Latin America received a boost from the Group’s new Brazilian assets as well as from growing sales at Emerger Fertilizantes, the distribution business acquired in Argentina in 2017.
In fact, Brazil has the largest potential of arable land among the world’s main commodity producers and therefore offers a significant market opportunity. The integration of Tocantins proceeded in line with expectations and its contribution to the business has been significant, enabling us to boost our share of the market considerably.
North AmericaNorth America has long been a key market for EuroChem. The combination of EuroChem products, international and domestic supply contracts and BenTrei’s best-in-class logistics service has helped us extend our customer base. The Group plans to build on recent growth, expanding in coastal areas and developing trading relationships with local producers to support market share gains in the central US, while we develop premium product sales.
In 2018, we extended our North American distribution network by taking on dry and liquid fertilizer transport and storage assets from international merchandising and trading firm Trammo, Inc. The move substantially expands EuroChem’s fertilizer storage capacity in the US, and enables us to strengthen our presence into Western Canada as well as on the East Coast.
EuroChem now operates 25 warehouses in the US, with a current storage capacity of about 500,000 metric tonnes. North America accounted for about 15% of Group sales in 2018.
AsiaAsia is one of the world’s leading consumers of NPK products and imports substantial quantities. Our Nitrophoska® NPKs combine all nutrients in one granule, with a lower acidifying effect than ammonium sulphate or urea-based fertilizers. This is crucial in Asia, where acid soils, particularly in the uplands of South-East Asia, have defied efforts by farmers to develop them for agricultural use. New blends of fertilizer are making a difference as farmers work to develop land and improve yields.
EuroChem’s brands are well known in Asian markets, where our strategy has been largely focused on sales of premium fertilizers, as well as a wide range of industrial and mining products. The Group has two regional sales offices in Asia and we expect the region will continue to be a key destination for our potash-based fertilizer products. In 2018, the Asia Pacific region accounted for 9% of Group sales.
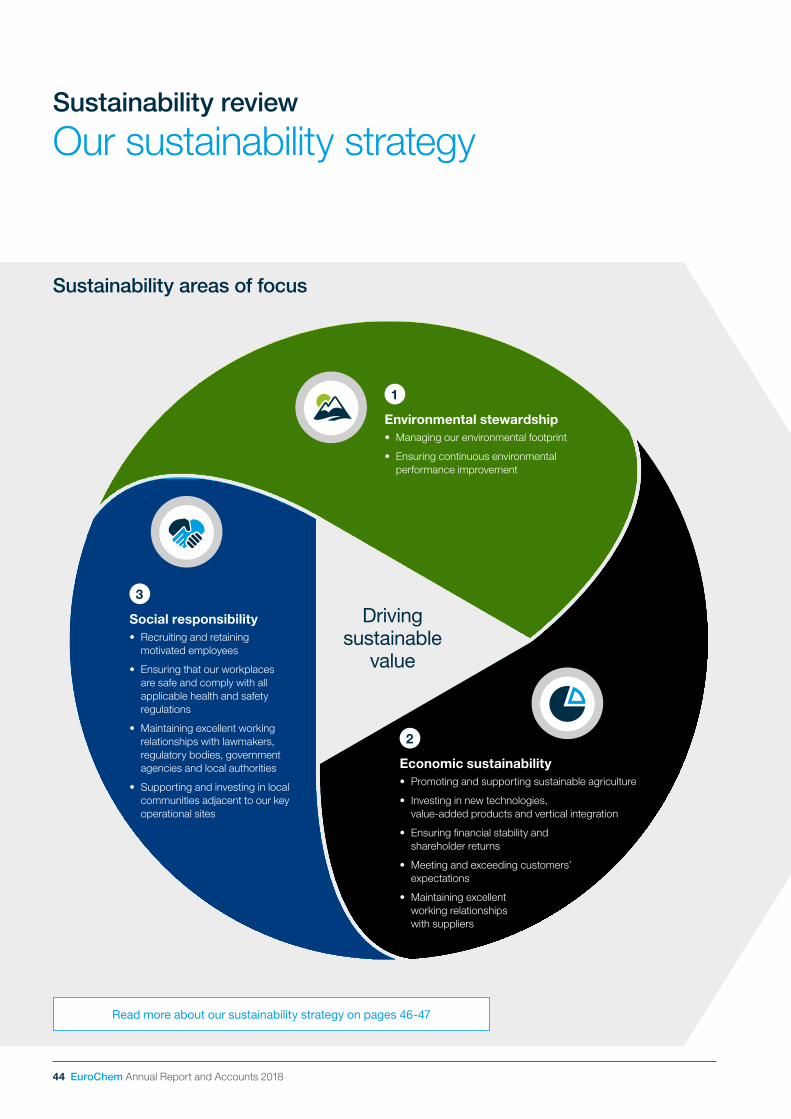
44 EuroChem Annual Report and Accounts 2018
Our sustainability strategySustainability review
Driving sustainable
value
Sustainability areas of focus
1
Environmental stewardship • Managing our environmental footprint
• Ensuring continuous environmental performance improvement
2
Economic sustainability • Promoting and supporting sustainable agriculture
• Investing in new technologies, value-added products and vertical integration
• Ensuring financial stability and shareholder returns
• Meeting and exceeding customers’ expectations
• Maintaining excellent working relationships with suppliers
3
Social responsibility • Recruiting and retaining
motivated employees
• Ensuring that our workplaces are safe and comply with all applicable health and safety regulations
• Maintaining excellent working relationships with lawmakers, regulatory bodies, government agencies and local authorities
• Supporting and investing in local communities adjacent to our key operational sites
Read more about our sustainability strategy on pages 46-47

EuroChem Annual Report and Accounts 2018 45
EuroChem is a key player in the drive for sustainable production of food for a rapidly expanding global population. We believe that high efficiency fertilizers with a dramatically lower environmental footprint, accessible to farmers and growers, will have an increasingly important role to play in delivering sustainable food production. Our product development and R&D efforts therefore focus on the creation and sale of innovative, sustainable products.
Our mining and manufacturing processes involve significant levels of cooperation amongst our employees and with our partners – and need to be managed in a safe and environmentally sound way. In essence, we believe that a future for sustainable products can only be assured through operating a sustainable business in the long term. Our sustainability strategy is therefore built around:
Sustainability governanceOur Board and CEO oversee the Group’s sustainability strategy. They work with counterparts in each of our Divisions and operating companies, ensuring consistent application of the strategy when new assets are commissioned and when new sites and companies are acquired.
Our approach to sustainability is aligned to the Group’s values of integrity, openness, trust and respect. Our Code of Conduct is a key reference for all Directors and employees when interacting with each other, our stakeholders, communities and the environment. All Group Compliance policies and procedures are regularly reviewed and updated when necessary. Regular audits performed by Internal Audit teams control and regulate risk management and governance across the Group – including people and processes associated with material sustainability issues.
Managing sustainabilityThe strategy focuses on environmental, social and economic goals. Performance against these goals is communicated to the Board through regular meetings and detailed updates.
Our management systems cover production, financial, environmental, social, legal, and other aspects of sustainability. These work across all our sites and operations in order to maintain our performance and to ensure we meet our commitments.
Reporting on our performanceWe have published a standalone sustainability report since 2006. These documents have followed best practice. This year, for the first time, we have merged sustainability into our annual financial report. This reflects our view that we are in the business of supporting long-term sustainable food production and operating in a way that is environmentally, socially and economically sound. Hence, this combined document allows us to focus on the bigger picture, corporate strategy and product development. At the same time, we define risks and materiality and – as in previous years – describe our approach and performance around key sustainability metrics. This new format also reflects a direction of travel for performance reporting, where sustainability is measured and presented as a key element of our business vision and strategy.
Our direct economic performance is described in more detail throughout this report. Our indirect economic impact is described within the ‘Community’ section of this chapter, alongside sections on health and safety, environment and people.
Sustainability metricsWe have previously followed the GRI G4 ‘Core’ guidelines. For the 2018 reporting year, we have followed the GRI Reporting Standards. Our material sustainability issues reflect our strategic risks assessment (see page 62), stakeholder engagement and our sustainability strategy (as described below).
Process for defining sustainability contentThis report and the sustainability section is generated and managed by the communications and investor relations teams with input from all key strategy owners – chiefly the Board, environment, health and safety, HR, community engagement, finance and operations. These owners manage and monitor performance against the strategy and are responsible for compiling reporting data from across all parts of the Group on material issues.
The topics covered are deemed material across the Group and in varying degrees at operating sites. The table overleaf describes these issues (linked to the sustainability strategy), with associated indicators.
Strategic Report Corporate Governance Financial Statements
Alexander LandiaChairman of the Board
“ EuroChem continuously strives to be a good corporate citizen: whether as an employer, neighbour, customer or supplier. Given the nature of our business, we are also acutely aware of our obligations towards the natural environment.”

46 EuroChem Annual Report and Accounts 2018
Our sustainability strategy in actionSustainability review
Environmental stewardship
Strategic goals 2018 highlights
Managing our environmental footprint ■ Developed further specialty, low-impact products for different soil types
Ensuring continuous environmental performance improvement
■ Applied BAT to control emissions and comply with legislation
■ Addressed regional (Baltic Sea and John Nurminen Foundation) and global (climate change) environmental challenges (e.g. GHG reduction at our Antwerp plant and cooperation with Coca-Cola, Pepsi and other beverage companies on carbon capture at our Nevinnomyssk site
■ Monitoring performance with engagement from stakeholders at a local level at all of our sites
Social responsibility
Strategic goals 2018 highlights
Recruiting and retaining motivated employees
■ Ensuring the future supply of talent by continuing to support science and engineering at schools and universities
■ Launched EuroChem Talent Pool, a programme designed to identify and fast-track high potential (HiPo) employees
Ensuring our employees work in an environment that complies with all applicable health and safety regulations
■ Focused on fall prevention and underground works safety
■ Launched In-Vehicle Monitoring System to help improve driver behaviour and road safety
Maintaining excellent working relationships with lawmakers, regulatory bodies, government agencies and local authorities
■ Cooperated with environmental regulators and industry groups, including the International Fertilizer Association (IFA) and Fertilizers Europe
■ Working with EU bodies to endorse environmentally best-performing products
Supporting and investing in local communities adjacent to our key operational sites
■ Expanded our international ice hockey tournament, the EuroChem Cup
■ Continued to open science and engineering centres for school pupils
■ Sponsored ‘Hyperborea’ cultural programme in Russia
Strategic Report Corporate Governance Financial Statements
EuroChem Annual Report and Accounts 2018 47
Economic sustainability
Strategic goals 2018 highlights
Promoting and supporting sustainable agriculture
■ Continued our R&D collaboration with universities in Europe and the US
■ Continued to engage with farmers through our distributors and advisory service
Investing in new technologies, value-added products and vertical integration
■ Established partnership with Aphea.Bio to develop the next generation of sustainable fertilizers
Ensuring financial stability and shareholder returns
■ Continued to develop premium products, launched potash production, delivered strong financial results
Meet or exceed customers’ expectations ■ Providing an industry-leading product portfolio and continuing to engage with customers through our advisory and after-sales services
Maintain excellent working relationships with suppliers
■ Continued to collaborate and maintain excellent relationships across our global supply chain
“ I really value the freedom to build workflows in my department in whatever way I consider to be the most effective. I pair beginners with more experienced staff to accelerate their development. Once a colleague is trained-up, I develop their skills in other areas and continuously assign people to new training programmes to boost our flexibility. We supply all parts of the plant with equipment, so we need to work like a Swiss watch in terms of delivery. I’ve been here nearly 10 years and really feel I’ve put down roots – both at the plant and within the team.”
Evgeny BishkoSenior Equipment Specialist at Novomoskovskiy Azot
Voice from the workplace

48 EuroChem Annual Report and Accounts 2018
The wellbeing of our people is of paramount importance, and a robust safety culture is embedded throughout all our operations. A strong focus on health and safety is vital as we operate hazardous facilities that can present risks. As a result, several programmes and projects aimed at preventing workplace injuries, accidents and occupational illnesses are in place across the business.
2018 was the first full year of operation for our first dedicated ‘working at height’ safety training facility at Novomoskovskiy Azot. Following its successful launch, other state-of-the-art centres are being established across the Group. Our experience confirms that we must maintain our focus on this aspect of workplace safety, since it is a part of the daily routine for many employees across EuroChem’s sites. We provide detailed, mandatory training to all colleagues who work on scaffolding or tall structures.
Last year, we organised regular refresher training courses at divisional and plant level for employees to ensure their continued safety and update them on best practice. Safety committees deliver training through dedicated working groups that identify specific activities relevant to their site or operation.
Besides working at height, other project priorities have typically included the on-site movement of pedestrians and ensuring electrical safety. Instruction is not merely theoretical – employees must complete practical exercises which, for safety at height training, includes instruction on the use of flexible anchor lines, rope work and ladders with safety devices, as well as guidance on the lifting of weights and operating on pitched roofs.
EuroChem’s Health, Safety and Environment (HSE) policy and procedures apply to all our operational sites, employees and on-site contractors. In May 2018 we signed up to the global Vision Zero initiative for companies that commit to improving the health, safety and wellbeing of their employees. Developed by the International Association of Social Security (IASS), the initiative defines a systemic approach to ensuring workplace safety and preventing occupational injuries.
Health and safetySustainability review
Vision Zero is a transformational approach to prevention that integrates the three dimensions of safety, health and wellbeing at all levels of work. Safe and healthy working conditions are not only a legal and moral obligation – they also pay off economically. International research on the return on investments in prevention proves that every dollar invested in safety and health generates a potential benefit of more than two dollars in positive economic effects.
Vision Zero clearly defines the respective obligations of managers, employees and contractors with regard to HSE goals and objectives and is based on the premise that industrial accidents can be prevented. EuroChem was one of the first companies in Russia to join this global programme.
Igor Nechaev, General Director of MCC EuroChem, the Group’s Russian subsidiary, said Vision Zero would help everyone at the Company adhere to safety principles in their daily work: “We already allocate billions of roubles each year to implementing international best practice to promote health and safety at work. The provisions of Vision Zero will underline that effort and ensure we all pay the closest attention to the question of labour protection.”
Managers across the business play key roles in ensuring the wellbeing and safety of their teams. On a practical level, they initiate any necessary changes to prevent injuries, illnesses and accidents, and improve working conditions.
Managers also lead by example. They ensure compliance with HSE requirements and encouraging and recognising HSE leadership and commitment among their colleagues. Managers ensure that the Group’s HSE objectives are met along with production and financial plans, cooperating with other business units to achieve common HSE targets.
Our approach
Who is responsible
■ CEO
■ Management Board
■ Head of HSE
■ Divisional HSE Managers
■ HSE Managers and groups
Policies and guidelines
■ Business strategy
■ HSE Policy
■ OHSAS 18001
■ H&S laws in countries of operation
■ Equator Principles
■ Responsible Care
■ Vision Zero
Key stakeholders
■ Customers
■ Government
■ Shareholders
■ Suppliers/contractors
■ Trades unions
■ Employees
■ Local communities

EuroChem Annual Report and Accounts 2018 49
Responsibility for evaluating risks associated with contractors lies at plant level. All EuroChem sites and operations assess contractor-specific risks and develop and implement action plans to minimise them. Contractors are assigned a dedicated EuroChem manager who ensures their awareness of – and compliance with – the Group’s HSE requirements.
The Group cannot achieve its HSE objectives without the active engagement of all employees. All colleagues are therefore required to be aware of the Group’s HSE policy, treat each other with care and respect, and comply with all relevant regulations such as those governing workplace hygiene and the safe use of equipment. Employees are obliged to alert managers and site HSE representatives to all safety-related incidents – including ‘near misses’.
Strategic Report Corporate Governance Financial Statements
The nature of EuroChem’s business means that many of our employees and contractors work in uniquely challenging conditions. In particular, our mining, production and construction sites present a range of potential hazards that require constant vigilance and high levels of competence to ensure safe working.
Group Health, Safety and Environment (HSE) management structure
Business level Responsible people Approach
Corporate ■ Board of Directors, CEO, Management Board
■ HSE Department
HSE is recognised as a core business process and performance indicator overseen by the Management Board and the Board of Directors
Division ■ Divisional Directors
■ Divisional HSE Managers
HSE is a core Divisional function alongside Finance and Human Resources
Plant ■ Managing Directors
■ HSE Managers and groups
HSE programmes are aimed at achieving continuous performance improvement
Material issues
Why it is important Who has a stake What we measure
We operate hazardous facilities that may pose health and safety risks
■ Employees
■ Management
■ The Board
■ Suppliers
■ Lost-Time Injury Frequency Rate (LTIFR; per 1m man-hours)
Our priorities ■ Reduce the frequency and severity
of incidents and accidents
■ Improve contractor management, awareness and training
■ Contribute to industry schemes that promote best practice in health and safety

50 EuroChem Annual Report and Accounts 2018
Health and safety continued
Sustainability review
Targeting road safety In 2018, employees in our Russian Sales Division ran a six-month trial of an In-Vehicle Monitoring System. The system used advanced telematics to identify individual drivers and monitor their position, speed, acceleration, seatbelt use, braking habits and fuel consumption. It was installed in all 65 company cars operated by the business unit across 11 Russian regions.
“Contrary to common belief, years of driving experience and the absence of fines and traffic accidents does not mean that an employee necessarily drives safely,” said Vladimir Baranovsky, Acting Group HR Director. “The safety trial allowed us to identify the most common potential errors and risks associated with driving.”
Results from the trial were accessible online – and highlighted certain behaviours that could lead to increased risks, such as heavy braking, over revving or recurrent speeding. Management and HSE teams were subsequently able to implement corrective actions via mentoring and training programmes to improve colleagues’ driving skills.
Following analysis of the trial data, nine employees who had displayed exemplary driving behaviour throughout the trial period each received a cash reward. The trial led to a 22% decrease in at-fault accidents in the division; this positive result means we plan to roll out similar initiatives for other divisions across the Group.
“ I always tell everyone, from regular colleagues to site visitors, that safety starts with each of us. It’s my sixth year at the Company and I’m very pleased to be part of such a big, global project like this development in the Perm region – and to be able to positively influence safety here. I have a real passion for creating a safe environment for my colleagues. We all have an obligation to follow procedures and make EuroChem a safe place to work. The wellbeing of everyone here is our top priority and we monitor all aspects of our activities carefully so there are no compromises. I love doing what I do and challenge myself daily to grow along with the Company.”
Nikita KorzhSenior Health and Safety Specialist, Usolskiy
Comprehensive investigation of incidents and accidents helps establish their causes and patterns and can help prevent future occurrences. All Group operations are required to report and investigate all such events using a root-cause analysis. Results of investigations – along with corrective action plans – are communicated to senior management. We also analyse data on past safety events in order to identify specific areas for improvement.
Our performanceIn 2018, there were 53 recorded lost-time injuries (LTIs), of which 42 involved employees and 11 involved contractors. The Group Lost Time Injury Frequency Rate (LTIFR) was 0.89 per million man-hours compared with 0.76 in 2017.
Regrettably, we experienced two work-related fatalities in 2018. In July, a contractor died after falling from height at our Nevinnomyssk plant. In November, a contractor at our Kovdor mine died following the collapse of a trench wall.
The most common causes of employee accidents involved mechanical instrument use, slips, trips, falls, and working at height. For contractors, working at height and falling objects were the most frequent cause of accidents.
Voice from the workplace
Road safety remains a priority at EuroChem

EuroChem Annual Report and Accounts 2018 51
Environmental responsibility
Strategic Report Corporate Governance Financial Statements
The CEO, Group management, and senior managers across our plants have primary responsibility for meeting targets related to our environmental management priorities. They are supported by the HSE Department and on-site HSE groups. The Group HSE team contains more than 180 specialists, engineering and policy professionals.
The HSE team works to a framework that defines what we expect from all managers and employees across the Group. This references how we reduce our impacts on the environment and rational use of natural resources and continuous HSE improvement, as well as associated targets.
We are committed to international best practice, in particular the application of ‘Best Available Techniques/Technology’ (BAT) and ISO 14001 environmental management systems. The key HSE policies and governance structure are described in the Health and safety section.
Our performance Water useLarge volumes of water are essential for fertilizer production. We have invested in water conservation and efficiency measures across our plants, in line with international best practice. Our Clean Water Programme has been recognised as an industry-leading initiative by Russia’s Ministry of Natural Resources and Environmental Protection.
The programme implemented state-of-the-art conservation and treatment technologies at our plants across six regions in Russia. Our aim was to reduce the volumes of water used in production, and our programme cut fresh water consumption in these plants by more than 11 million cubic metres a year.
In 2018, the Group used 2.2 m3 of non-recycled water per tonne of production, unchanged from a year ago. Volumes of waste water and effluent discharges per tonne of production fell – down 10% from 2.1 m3 in 2017 to 1.9 m3.
Our priorities ■ Continually reduce emissions,
effluent discharges and solid waste along with the consumption of water, heat and energy
■ Effectively cooperate with our employees, contractors, suppliers, governmental authorities, municipalities, trade unions, media, NGOs and other stakeholders on health, safety and environmental matters
■ Comply with applicable laws and regulations
Material issues
Why it is important Who has a stake What we measure
WaterSome of our operations require large volumes of water for production
■ Communities
■ Utilities
■ Suppliers
■ Local government
■ National government
■ Water consumption, m3 per tonne of production
AirWe operate complex processes that emit a range of gases, some of which can be harmful to humans and the environment
■ Employees
■ Communities
■ NGOs
■ Local government
■ National government
■ Air emissions, kg per tonne of production
Waste and effluentWe produce and manage solid waste and effluent
■ Employees
■ Communities
■ NGOs
■ Local government
■ National government
■ Effluent, m3 per tonne of production

52 EuroChem Annual Report and Accounts 2018
This improvement reflected the ongoing success of the Clean Water Programme and investment in repair work at Nevinnomysskiy Azot, which has prevented inflows of groundwater into the sewerage system.
Air emissionsOur mineral extraction, manufacturing and distribution activities result in a variety of emissions to the air. These include sulphur oxides, carbon monoxide, nitrogen oxides, ammonia, particulates and hydrocarbons. Air quality around our production facilities is continuously monitored – and we share this data with regulatory authorities and the local community.
In 2018, Group operations generated an average of 0.82 kg of air emissions per tonne of production, up from the 0.77 kg per tonne of production emitted in 2017. This was due to a higher generation of overburden.
Waste and effluentOur plants generate a range of inert wastes. Fertilizer manufacturing produces large volumes of two by-products in particular:
• Phosphogypsum from the production of phosphate fertilizer
• Overburden and concentration tailings from mining operations
For both of these by-products, we work to minimise any adverse environmental impact arising from their storage and/or disposal. We also began marketing phosphogypsum to farmers near our Belorechensk facility in the Krasnodar Region, Russia. The application of phosphogypsum has been shown to help improve the quality of soil and we sold 50,000 tonnes to farmers last year. Phosphogypsum helps tackle poor soil conditions caused by inadequate drainage or compaction from heavy machinery, and excess salinity by adding sulphur and calcium to the soil.
The effluent (waste water) generated by our processes can contain organic products, suspended matter, ammonium, nitrates, sulphates, chlorides, fluorine and phosphorous. We therefore focus on reducing effluent discharges into waterways and water bodies. For example, our US$1 billion new ammonia plant at Kingisepp will use a waste water management system to maximum efficiency. This has been a key aspect of our work with the John Nurminen Foundation to improve water quality in the Baltic Sea (case study on page 39). We estimate that up to 75% of waste water generated at Kingisepp could be recycled.
Environmental responsibility continued
Sustainability review
Collaboration in innovationWe are dedicated to helping farmers optimise nutrient use, enabling them to enhance their yields. In November we announced the formation of an R&D partnership with Belgium-based biotechnology company Aphea.Bio. Our collaboration will focus on developing
next-generation fertilizer technologies designed to significantly boost the take-up of key nutrients by plants. The research will utilise data and samples from scientific field trials at 10 different European locations. This exciting alliance further strengthens EuroChem’s commitment to investing in innovation.
29.6
31.9
30.0
29.3
29.7
28.7
28.1
24.7
24.9
1.15 1.16 1.09 1.04 1.04 1.020.77 0.77 0.82
27.1
2009 2010 2011 2012 2013 2014 2015 2016 2017 2018
Air emissions, total thousand tonnesAir emissions, kg per tonne of production
0.92
Air emissions per tonne of production (kg/tonne)
Effluent per tonne of production (m3/tonne)
86.8
89.2
90.0
87.9
83.9
81.4
76.0
71.2
67.8
3.3 3.2 3.3 3.1 2.9 2.92.2 2.1 1.9
62.2
2009 2010 2011 2012 2013 2014 2015 2016 2017 2018
Effluent, total million m3
Effluent, m3 per tonne of production
2.6
Energy consumption per tonne of production (kWh/tonne)
3,33
0
3,57
5
3,67
1
3,65
4
3,57
8
3,55
2
3,60
0
3,64
1
3,65
4
128.3
129.6132.9
129.5
125.1
126.6113.2
113.0
111.4
3,67
8
2009 2010 2011 2012 2013 2014 2015 2016 2017 2018
Energy consumption, total (million kWh)Energy consumption, kWh per tonne of production
118.4
82.3
90.2
91.2
88.2
83.2
80.5
78.5
72.4
70.6
3.2 3.3 3.3 3.1 2.9 2.92.3 2.2 2.2
72.1
2009 2010 2011 2012 2013 2014 2015 2016 2017 2018
Water consumption, total million m3
Water consumption, m3 per tonne of production
2.6
Non-recycled water consumption (m3 per tonne of production)

EuroChem Annual Report and Accounts 2018 53
Strategic Report Corporate Governance Financial Statements
Product stewardshipThe fertilizer industry has prioritised product and nutrient stewardship – setting standards for product environmental footprints and optimising their use. We are rising to this challenge via a targeted environmental approach, which includes enhanced water and energy efficiency and the design and manufacture of advanced fertilizer products. These have properties that reduce NO2 emissions and nitrate run-off from fertilizer application.
We believe more effective, environmentally sensitive fertilizers will enable us to produce more food from existing stocks of agricultural land. At our R&D centre in Mannheim, Germany, we are working on next-generation crop nutrient solutions to help meet this demand.
Greenhouse gas (GHG) emissionsIn line with industry efforts to address climate change, we continue to implement energy efficiency and GHG reduction measures across our operations.
One significant example in 2018 was the launch of food-grade carbon dioxide production in Russia. The US$7.5 million facility captures the 32,000 tonnes of CO2 produced each year at our Nevinnomyssk nitrogen plant and processes it using state-of-the-art purification technology. The CO2, which would otherwise be released into the atmosphere, is supplied primarily to the carbonated drinks sector. It is also used in a range of other industrial applications, including the manufacture of dry ice, in greenhouse plant nutrition and as a fire suppressant.
Upgrades to our phosphates plants at Lifosa, Phosphorit, and Belorechensk saw the introduction of heat recuperation technology. This limits the release of water vapour and enables heat produced in the production of sulphuric acid to be recycled, warming the plants themselves. At Lifosa, for instance, about 100,000 MWh of the heat energy can be supplied to the city of Ke
.dainiai and about
250 m kWh of electricity can be produced.
During the year we used an estimated 111.4 kWh/t of energy compared to 113.1 kWh/t in 2017.
Mode of action UTEC®
■ UTEC® reduces N losses in form of gaseous ammonia by delaying the conversion of urea into ammonium.
Benefits of UTEC®
■ Urea as a fertilizer becomes more efficient, as ammonia emissions can be reduced.
■ Applied nitrogen remains in the field for plant uptake and negative environmental effects are avoided.
■ Makes application timing of urea more flexible.
The next generation Smarter agriculture means giving farmers the tools to identify their land’s nutrient needs, which will in turn drive demand for targeted fertilizers. Enhanced-efficiency Fertilizers (EEFs) are the latest step in encouraging farmers to manage nutrients. They not only represent a science-based answer to the environmental challenges facing farmers, but also help address the issue of growing enough food for the world’s burgeoning population.
Research indicates that EEFs or ‘inhibited’ fertilizers can play a significant role in more sustainable agricultural production – and EuroChem is at the forefront of work on these products. EEFs can control nutrient release – or influence their use by converting nitrogen into different forms, which may reduce their loss to the environment – such as through ground leaching, nitrous oxide emissions or as ammonia gas.
We are committed to reducing our environmental footprint and enhancing the sustainability of our activities. This applies right across our value chain: from extraction of raw materials and the production process to the distribution and end use of our fertilizers.
N2Onitrous
oxide losses
NH3ammonia
losses
N2O/N2nitrous oxide/
molecular nitrogen losses
NO3-
nitrate losses
Fertilizer with relevant ammonium concentration + NI
Urea + UI
pH
vola
tiliz
atio
n
nitrification NO3- nitrate
leac
hing
deni
trific
atio
n
NO3-
nitrate
NH4+
ammoniumNH4
+
ammoniumhydrolysis(urease)
Benefits of ENTEC®
■ Availability of N is adapted to the plant’s needs making the fertilization more efficient.
■ Secures N supply independent of weather conditions, promoting high yields and crop quality.
■ Cost reduction and time saving on farm with the combination of fertilizer applications (1 application less), possible by the stabilization of N with ENTEC®.
■ Reduces leaching (shift of N out of root zone and water pollution) and significantly reduces greenhouse gas emissions.
Mode of action ENTEC®
■ ENTEC® delays the transformation of ammonium-N into nitrate.
■ Nitrate leaching losses and greenhouse gas emissions are reduced.
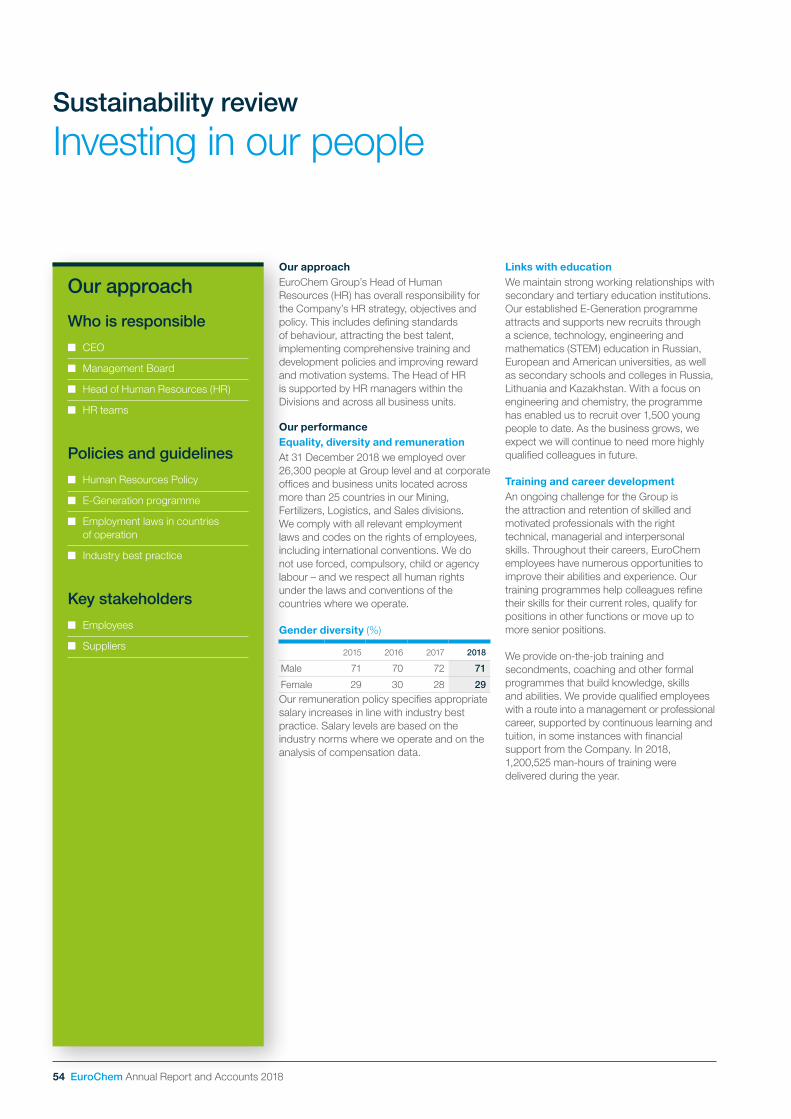
54 EuroChem Annual Report and Accounts 2018
Investing in our peopleSustainability review
Our approachEuroChem Group’s Head of Human Resources (HR) has overall responsibility for the Company’s HR strategy, objectives and policy. This includes defining standards of behaviour, attracting the best talent, implementing comprehensive training and development policies and improving reward and motivation systems. The Head of HR is supported by HR managers within the Divisions and across all business units.
Our performanceEquality, diversity and remunerationAt 31 December 2018 we employed over 26,300 people at Group level and at corporate offices and business units located across more than 25 countries in our Mining, Fertilizers, Logistics, and Sales divisions. We comply with all relevant employment laws and codes on the rights of employees, including international conventions. We do not use forced, compulsory, child or agency labour – and we respect all human rights under the laws and conventions of the countries where we operate.
Gender diversity (%)
2015 2016 2017 2018
Male 71 70 72 71
Female 29 30 28 29
Our remuneration policy specifies appropriate salary increases in line with industry best practice. Salary levels are based on the industry norms where we operate and on the analysis of compensation data.
Links with educationWe maintain strong working relationships with secondary and tertiary education institutions. Our established E-Generation programme attracts and supports new recruits through a science, technology, engineering and mathematics (STEM) education in Russian, European and American universities, as well as secondary schools and colleges in Russia, Lithuania and Kazakhstan. With a focus on engineering and chemistry, the programme has enabled us to recruit over 1,500 young people to date. As the business grows, we expect we will continue to need more highly qualified colleagues in future.
Training and career developmentAn ongoing challenge for the Group is the attraction and retention of skilled and motivated professionals with the right technical, managerial and interpersonal skills. Throughout their careers, EuroChem employees have numerous opportunities to improve their abilities and experience. Our training programmes help colleagues refine their skills for their current roles, qualify for positions in other functions or move up to more senior positions.
We provide on-the-job training and secondments, coaching and other formal programmes that build knowledge, skills and abilities. We provide qualified employees with a route into a management or professional career, supported by continuous learning and tuition, in some instances with financial support from the Company. In 2018, 1,200,525 man-hours of training were delivered during the year.
Our approach
Who is responsible
■ CEO
■ Management Board
■ Head of Human Resources (HR)
■ HR teams
Policies and guidelines
■ Human Resources Policy
■ E-Generation programme
■ Employment laws in countries of operation
■ Industry best practice
Key stakeholders
■ Employees
■ Suppliers
Strategic Report Corporate Governance Financial Statements
EuroChem Annual Report and Accounts 2018 55
Investing in our people is an investment in the future of EuroChem. As we continue to grow the business, we remain committed to the professional and personal development of each of our more than 26,300 employees. Maintaining a positive and supportive workplace culture is a key priority.
Material issues
Why it is important Who has a stake What we measure
Training and educationThe sustainable growth of our business is predicated on our ability to attract and retain talent, particularly our cohort of young professionals
■ The Board
■ Employees
■ Educational institutions
■ Investment in training centres
■ Training partnerships
■ Teaching standards
Employee relationsEmployee relations are crucial as we continue to grow our business internationally
■ The Board
■ Employees
■ Investors
■ Suppliers
■ National government
■ Local government
■ Utilities
■ Communities
■ Management to employee ratio
■ Employee turnover
■ Sales per employee
■ Production per person
■ Personnel costs
Diversity and equalityWe employ more than 26,300 people at more than 75 locations in 25 countries
■ The Board
■ Employees
■ National government
■ Local government
■ Communities
■ Educational institutions
■ Level of investment
■ Employee numbers
■ Percentage of women in management positions
RemunerationWe aim to attract and retain the best people.
■ The Board
■ Employees
■ Variable remuneration
■ Fixed remuneration
■ Average full-time equivalent wage
■ Changes in average monthly wage
Our priorities ■ Ensure staff development, processes,
organisational structure, corporate culture and service levels are effective and best in class
■ Refine annual performance reviews and improve key performance indicators
■ Continue to update HR strategy to promote professionalism and address all current and emerging issues
■ Ensure employment systems and processes are clear, transparent, understandable, effective and results-oriented
■ Develop a corporate culture that promotes and embraces our global outlook and ambitions

56 EuroChem Annual Report and Accounts 2018
Investing in our people continued
Sustainability review
Laying the talent pipeline The EuroChem Careers Day was launched in the autumn at five Russian universities, as part of a drive to create a pipeline of top talent to the Company. The initiative expands on EuroChem’s presence at university careers fairs in previous years – reflecting the Company’s status as the largest employer in many of the communities where it operates.
The events were held in Ivanovo, Rostov-on-Don, Nevinnomyssk (two institutes) and Belorechensk.
Under the slogan ‘Build your Future with a Leader’, they highlighted the many graduate and entry-level opportunities available at EuroChem.
“We value diversity and look for people from all backgrounds – and do everything we can to make sure we attract, support and develop the best talent,” said Vladimir Baranovsky, Acting Head of Human Resources for EuroChem Group. “EuroChem offers terrific career opportunities for motivated, driven students willing to learn and take responsibility.
Our graduate programmes combine structured, professional development with on-the-job experience.”
The Careers Days included presentations by employees drawn from a diverse range of disciplines including geology, engineering, trading, logistics and finance. The events also featured games, quizzes, team activities, an intra-university competition and an exhibition on the Company’s activities and its worldwide locations.
A data-driven futureEuroChem Antwerpen is a major sponsor of the 2018/19 EFFECT2 lecture series on industrial uses for engineering and chemical technologies. This region-wide series for engineers and students – in Flanders and beyond – aims to develop stronger links between academia and industry and persuade students to consider the relevance of their skills in today’s workplace.
The lecture series, ‘Resources for a Successful Bio- and Chemical Industry’, consists of events, discussions and site visits across four industrial centres. Each day covers one of four key topics: data, people, resources and materials.
In October 2018, EuroChem Antwerpen opened the series with a day-long programme at its plant, focused on ‘Big Data for an Evolving Chemical Industry’.
A tour of the plant was followed by presentations by data specialists and a keynote lecture, ‘Introduction to Big Data’. Practical examples of data science and analytics were provided by three leading technology companies, and the event concluded with a networking reception.
“ EuroChem is in the well-established chemical/petrochemical cluster in Antwerp. We embrace innovation and the intelligent application of technology to generate better commercial, environmental and social outcomes.”
Filip Dejongh CEO EuroChem Antwerpen
Careers Day: EuroChem looks for talented individuals for all parts of the business
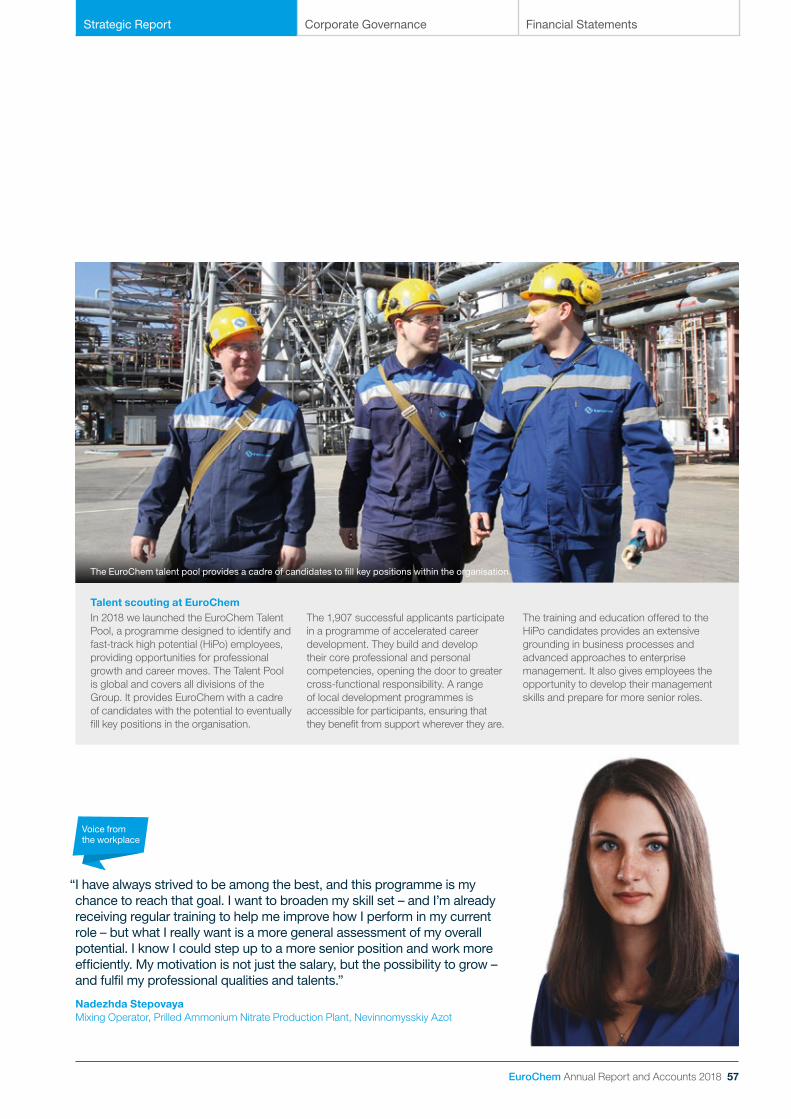
Strategic Report Corporate Governance Financial Statements
EuroChem Annual Report and Accounts 2018 57
Talent scouting at EuroChem In 2018 we launched the EuroChem Talent Pool, a programme designed to identify and fast-track high potential (HiPo) employees, providing opportunities for professional growth and career moves. The Talent Pool is global and covers all divisions of the Group. It provides EuroChem with a cadre of candidates with the potential to eventually fill key positions in the organisation.
The 1,907 successful applicants participate in a programme of accelerated career development. They build and develop their core professional and personal competencies, opening the door to greater cross-functional responsibility. A range of local development programmes is accessible for participants, ensuring that they benefit from support wherever they are.
The training and education offered to the HiPo candidates provides an extensive grounding in business processes and advanced approaches to enterprise management. It also gives employees the opportunity to develop their management skills and prepare for more senior roles.
“ I have always strived to be among the best, and this programme is my chance to reach that goal. I want to broaden my skill set – and I’m already receiving regular training to help me improve how I perform in my current role – but what I really want is a more general assessment of my overall potential. I know I could step up to a more senior position and work more efficiently. My motivation is not just the salary, but the possibility to grow – and fulfil my professional qualities and talents.”
Nadezhda Stepovaya Mixing Operator, Prilled Ammonium Nitrate Production Plant, Nevinnomysskiy Azot
The EuroChem talent pool provides a cadre of candidates to fill key positions within the organisation
Voice from the workplace

58 EuroChem Annual Report and Accounts 2018
Investing in our people continued
Sustainability review
Employment in numbers
Employees
>26,300
Students working through programmes at our partner universities
281Students completing work placements at EuroChem
1,047
Students receiving a corporate scholarship at EuroChem
163Man-hours of training delivered in 2018 (1,298,756 in 2017)
1,200,525
“ I’ve worked at EuroChem for almost 10 years. Previously I could never have imagined a working environment that was so dynamic and offered so much variety. Even when construction at the Gremyachinskiy deposit is finished and we come on stream, there will be plenty to organise. There’s just so much interesting work at EuroChem that it’s impossible to grow bored. We’re still expanding and developing!”
Ilya Polyakov Head of Engineering Department, EuroChem-VolgaKaliy LLC
Key HR indicators1
2015 2016 2017 2018
Full-time equivalent employee numbers (people)2 23,459 24,819 25,854 26,376
Management to staff ratio (%) 13.1 13.2 13.5 13.3
Staff turnover at production facilities (%) 3.6 2.8 3.2 3.5
Group sales per employee (US$/person) 193,544 176,280 188,198 211,461
Productivity per main type of product per person, average (tonnes) 2,193 2,391 2,386 2,433
Personnel costs (US$m) 443.7 462.6 611.5 580.7
Changes in personnel costs (% year-on-year) (21.4) 4.2 32.2 (5.0)
Fixed remuneration (US$m) 276.5 287.5 353.5 355.4
Variable remuneration (US$m) 167.3 175.1 258.0 225.3
Average full-time equivalent wage (US$/month) 1,034 1,050 1,217 1,207
Changes in average monthly wage (%) (26.1) 1.5 16.0 (0.9)1. HR indicators were calculated according to PwC Saratoga methodology; financial indicators were prepared in accordance with IFRS.
2. Including temporary employees; all related indicators are calculated based on this figure.
Voice from the workplace

Strategic Report Corporate Governance Financial Statements
EuroChem Annual Report and Accounts 2018 59
Local communities
Our approachThe EuroChem Board oversees all investments in community projects and infrastructure. These decisions are guided by our corporate and plant management teams, which are embedded within their communities and thus well placed to assess local needs. This is especially the case in remote regions, where EuroChem is a key employer and economic player. Investments are normally co-created and co-financed with local government or non-governmental organisations (NGOs).
Our performanceIn 2018, we continued to grow our community investment portfolio and contributed US$6.75 million to projects across eight locations globally. These projects continue our track record of supporting masterplanning and city improvement, cultural development and sports, healthcare and education infrastructure.
Our 2018 projects were wide-ranging and influential. We are a major employer in many of the regions where we operate, which means we have a particular responsibility to the communities in which we live and work. The health, stability and sustainability of our neighbourhoods directly impacts our employees and their ability to be productive at work – and play an active part in their local communities.
We work hard to ensure that every contribution or commitment we make is relevant to our communities’ needs. Our involvement ranges from the practical, such as rebuilding the water supply and waste water infrastructure in Novomoskovsk, to masterplanning in Kazakhstan. We also support an annual international hockey tournament and recently invested in a tourism initiative associated with local legends in Kovdor.
The community in Kovdor, within the Arctic Circle and close to the Finnish border, grew out of mining and industrial operations early last century, but the surrounding region of Hyperborea has a rich and varied culture. The name was coined by the ancient Greeks, referring to a mythical race of giants that lived in the lands ‘beyond the North wind.’ Recognition of this legacy led to plans for a city brand for Kovdor aligned with Hyperborea’s heritage, which will open up important new economic and tourism opportunities.
As a major employer, we already play an important role in the region’s economy. EuroChem’s commitment to community development also extends to urban planning. In July 2018, the Union of Town Planners of Kazakhstan convened a masterplanning forum in the Kazakh capital Astana, attended by over 200 delegates. The forum focused on the benefits of masterplanning for communities such as those in the southern region of Zhambyl. EuroChem funded an update of the 2012 masterplan for the city of Zhanatas, close to our phosphate rock development project.
Proposals under discussion with local stakeholders include the building of a new leisure centre, incorporating the city’s first municipal swimming pool, a cinema, sports facilities and cafes. Community consultation also highlighted the need for a multi-purpose events space for conferences, seminars and training programmes. EuroChem has committed US$1 million a year to support ongoing community initiatives and infrastructure development in Zhanatas.
Our approach
Who is responsible
■ CEO
■ Management Board
■ Heads of Social Responsibility and Communications
■ Plant managers, plant administration directors
Policies and guidelines
■ Community investment programme
Key stakeholders
■ Employees
■ National and local government
■ Communities
Our priorities ■ Maintain excellent working
relationships with government
■ Support and invest in local communities
60 EuroChem Annual Report and Accounts 2018
Local communities continued
Sustainability review
Town planning also features in our contribution to addressing socio-economic issues in Berezniki, near our Usolskiy potash project in the Perm region. In 2018 we continued to develop the housing, health, sports, parkland and transport infrastructure needed at our urban development in Berezniki.
By 2025 EuroChem will have built 98,000 square metres of housing in Berezniki, providing high-quality accommodation and related facilities for employees and their families. The design and construction of the residential project was agreed with the Perm authorities as part of a special investment contract concluded in 2016.
Close consultation with local stakeholders is key to the success of all our projects. As our ammonia plant at Kingisepp, Russia, comes on stream, we can reflect on the successful engagement we continue to have with the community.
From the beginning, EuroChem communicated regularly and openly to keep local residents and activists informed of our plans and progress. Throughout the construction phase, we have hosted a succession of open days and public meetings, enabling local residents and media to meet EuroChem employees responsible for the US$1bn facility, question senior managers and review technical information on the plant.
One more plant open day is envisaged before the facility’s formal opening in 2019. Our transparent approach has been positively received locally, as has our contribution to the regional economy; the facility will provide employment for 300 people once production is fully underway.
Material issues
Why it is important Who has a stake What we measure
It relates to our market presence and the way we engage with local stakeholders, where we operate, and growth and investment plans
■ The Board
■ Employees
■ Suppliers
■ National government
■ Local government
■ Local communities
■ Level of investment
■ Feedback from government and communities
■ Credit ratings
EuroChem is a significant employer and its operations can have a considerable impact on local environments and economies
■ Employees
■ Communities
■ Local government
■ National government
■ Educational and social
■ Institutions
■ Local suppliers
■ NGOs
■ Levels of community investment
■ Feedback from local government officials and community leaders

Strategic Report Corporate Governance Financial Statements
EuroChem Annual Report and Accounts 2018 61
EuroChem Cup in numbers
EuroChem Group investment in local community ice rinks (US$)
10m
Children training at EuroChem sponsored ice rinks
2,500Number of countries sending teams to the EuroChem Cup 2018
8
Number of children training daily at the Novomoskovsk ice arenas
500Number of children taking part in this year’s EuroChem Cup
204
Number of children who’ve taken part in the EuroChem Cup since its inception in 2013
>1,000Average size of a country delegation, comprising players and accompanying adults
25
Linking our world through sportAs a valued part of its sustainability drive, EuroChem runs an annual international ice hockey tournament for children aged 10-12. The EuroChem Cup is staged at the Jubilee Ice Palace in Novomoskovsk, a short drive south of Moscow, every May.
Although it initially brought together teams from countries around the world where the Company had a presence, the rules were later relaxed to allow others to take part. For the first time in 2018, the tournament featured a team from the United States, the Albany Capitals, coached by former National Hockey League player Brad Chartrand.
The other entrants were from Belgium, Estonia, Finland, Germany, Lithuania, Russia and Switzerland.
More than 1,000 children have taken part in the EuroChem Cup since it was first held in 2013. The competition has attracted wide public and commercial support, and has been heralded by respected institutions such as the International Ice Hockey Federation as a highly worthwhile community-building endeavour.
“The tournament is held in a warm atmosphere of friendship, respect and acceptance,” said Igor Nechaev, the General Director of MCC EuroChem in Russia. “The children forge life-long friendships with kids from other countries, and have the privilege of experiencing new societies, traditions, customs and languages at a formative age,” he added.
Local schools in Novomoskovsk are involved in the tournament, ‘adopting’ teams that they then support during the competition. The players themselves tour the local city and schools, and they also pay a sightseeing visit to Red Square in Moscow.
“This is why teams come back year after year,” Mr. Nechaev said. “It’s a unique and unmissable experience.”
EuroChem began funding the construction of ice rinks in 2011 in towns and cities where it operated in Russia. More than 2,500 children train regularly at EuroChem-sponsored ice rinks, which together represent an investment by EuroChem in youth sport of more than US$10 million.
EuroChem Cup participants came from eight countries in 2018
62 EuroChem Annual Report and Accounts 2018
Understanding and managing our risks
Risks and uncertainties
Understanding and managing our risksEffective identification and management of risk is essential for EuroChem to achieve its strategic objectives and secure long-term sustainable growth. Ultimate responsibility for the oversight of EuroChem’s risk management processes lies with the Board of Directors. The Board assesses and approves the Group’s overall risk appetite, monitors risk exposure and sets Group-wide limits. Specific risk-related responsibilities are delegated to the Board’s Audit Committee, chaired by Geoffery Merszei. The Group’s Internal Audit function provides objective scrutiny regarding the effectiveness of risk management and our system of internal controls and governance.
Risk management strategy We take a proactive, efficient approach to risk across the Group, applying international standards and incorporating elements of ISO 31000 and COSO ERM in the way we manage our risk exposures. We continuously review and refine our risk management methodology, ensuring that it is fit for purpose, whatever the scenario.
Risk management is an enterprise-wide, integral and ongoing activity throughout EuroChem, encompassing strategic – and other – management, operational and support functions. All parts of the business regularly review those risks that are specific to their operations. Process owners are responsible for defining the associated risk mitigation and maintaining appropriate internal controls, whereas senior management takes a more holistic, cross-silo view of risk within the Group.
Key developmentsWe continued to drive improvements to our risk management processes across the business and strengthened the collaboration between our Internal Audit and Quality Management functions. This resulted in greater synergies, improved information and experience sharing as well as a considerable reduction in process duplication.
A significant feature of this joint work is the annual risk assessment. During the year, all divisions and Group functions participated in risk assessment interviews, which were conducted jointly by the Group Quality Management function and Internal Audit. The evaluation process follows an assessment of the respective impact and probability of each threat, employing both qualitative and quantitative criteria.
We also developed risk management training programmes for different business processes and increased the amount of training delivered to reinforce the Group’s risk management culture.
Following an audit of its integrated Management System, the Group – and its business units – achieved recertification for compliance with ISO 9001:2015, 14001:2015 and OHSAS 18001:2015.
We continue to enhance our approach to risk assessment of large projects. Our Enterprise Risk Management process will be improved through the addition of advanced stochastic risk modelling methodologies and a sharper focus on the monitoring of risk mitigation.
Principal risks in 2018 EuroChem is exposed to a wide variety of risks and uncertainties, which fall into in four main categories:
• External environment risks
• Strategic and project risks
• Operational risks
• Financial risks
In this section we outline the principal risks and uncertainties faced by EuroChem in 2018 – and summarise the mitigating activities in place for each. For each risk that we identify, we assess its likelihood, consider its potential impact on the Group and compare how it has increased or decreased since the previous year. The list of risks below is by no means exhaustive, nor does its running order reflect their probability or degree of potential harm. It simply highlights the key areas of focus for the Group during the year under review. Depending on the prevailing circumstances – whether international or domestic, economic, political or financial – our risk priorities will inevitably change from year to year.
External environment risksFertilizer price variations have a significant impact on EuroChem’s cash flow. Minimising the negative consequences of price fluctuations (through careful portfolio management and permanent cost control) is therefore an integral part of our business model and day-to-day business activities. The latter half of 2018 and the start of 2019 saw reduced risk exposure however; a result of potential negative price fluctuations combined with EuroChem’s own programmes to soften the adverse effects of price variations.
“ We take a proactive approach to risk management at EuroChem. The focus of our activities may change from year to year – but one thing that doesn’t alter is our commitment to ‘best practice’ in everything we do. It’s a dynamic, challenging and intensely rewarding aspect of the business.”
Markus Kistler Head of Internal Audit
Voice from the workplace

Strategic Report Corporate Governance Financial Statements
EuroChem Annual Report and Accounts 2018 63
Rising geopolitical tensions have prompted an increased risk in market protectionism and trade defence. Throughout 2018 we closely monitored developments in trade legislation and the growing number of market-restricting initiatives. We introduced several measures to protect the Group, including steps to ensure EuroChem’s full compliance with all sanction rulings.
We expect this trend to continue; hence management attention is focused on further strengthening our global monitoring systems and risk mitigation activities in this field.
Strategic and project risksDisruptive new technologies have the potential to significantly reduce global demand for fertilizers; they also have the potential to open doors to new markets. This combination of ‘threat’ and ‘opportunity’ represents an ongoing challenge for EuroChem, prompting us to focus on R&D, innovation and portfolio management during the year.
EuroChem’s growth path requires considerable investment in the construction of new extraction and manufacturing facilities. Given their size and complexity, these schemes require strong state-of-the-art project management and high technical expertise in order to meet deadlines and budgets. Throughout 2018 we strengthened our project management competences, processes and tools – improving our chances of hitting the targets for these large investment projects.
Operational risksUnplanned business interruptions and plant shutdowns due to bottlenecks in the logistics chain, accidents or technical failures can have grave consequences – not just for individual business units, but for EuroChem’s overall performance. Throughout 2018 we reduced our risk exposure through enhanced maintenance and repair programmes. We also replaced ageing equipment and invested further in new technologies. Cyberattacks and terrorism also present serious operational risks.
EuroChem’s facilities run complex chemical production processes, which require the highest standards of expertise and professionalism to protect the environment from harm. At the same time it is a core requirement that we operate all our facilities safely for all our employees and contractors. The Company applies a ‘zero tolerance’ policy regarding health, safety and the environment. During 2018 our actions successfully reduced the potential risk to the environment at several of our operations. We also strengthened our monitoring systems and training programmes related to health and safety. HSE remains a permanent management priority and we continue working to embed and improve our positive safety culture across the business.
Financial risksAs an organisation that operates globally, EuroChem is exposed to the effects of currency fluctuations. Our Treasury function manages the Group’s day-to-day transactional and operating foreign exchange exposure to keep our risk at acceptable levels. The function successfully managed the Company’s liquidity during 2018 through a combination of rigorous planning and cash flow forecasting.
As EuroChem has expanded into new geographic markets, so the risk of failing to collect outstanding receivables has increased. In 2018 we further strengthened our credit management competences and processes globally, enabling us to better assess counterparties’ creditworthiness, manage credit limits and collect outstanding debts.
Voice from the workplace
“ Our emergence as a global force in fertilizers means compliance is more important than ever. It’s good for business, not just a tickbox exercise but something with significant positive benefits for the organisation. That’s really what compliance is all about. Not simply a list of rules and regulations to follow diligently, but rather a philosophy for ensuring long-term, sustainable growth.”
Elena Kholmanskikh Head of Compliance

64 EuroChem Annual Report and Accounts 2018
Understanding and managing our risks continued
Risks and uncertainties
Overview of principal risks and uncertainties in 2019
1. Geopolitical tensions, protectionism
2. Competitive pressure on price premiums
3. Unplanned business interruptions and plant shutdowns
4. Management of major complex projects
5. Environmental concerns and compliance with relevant legislation
6. Challenge of integrating acquisitions
7. Price and availability of raw materials, including energy
8. Cybersecurity
9. Climate change
10. Demand-disruptive new technologies
Impact
Lik
elih
oo
d
Disclaimer: The representation and positioning of risks are based on EuroChem management’s expectations and assumptions, many of which are beyond the Group’s control and are subject to a number of uncertainties and factors, including, but not limited to those described in this section of the 2018 annual report.
The 2019 risk environmentAll of the risks, threats and uncertainties we faced in 2018 remain current to some degree. We have however, identified a set of primary risks that we need to manage in the year ahead. These will receive close attention during the year, with an emphasis on managing circumstances within our control and mitigating any potential harm.
The trend of increasing protectionism looks set to continue, with both economic and politically motivated sanctions, export duties and tariff/non-tariff restrictions combining to create a tougher trading environment. EuroChem is also exposed to pressure on price premiums, with new entrants in the market and competitors expanding into the premium product sector.
Unplanned business interruptions and plant shutdowns also threaten our overall performance with their impact on production flows and the supply chain. Likewise, any delays to large investment projects could result in missed deadlines and budget overspend. The impact of our products and production processes on the environment – and their compliance with relevant legislation remains a key consideration for us in the year ahead.
We are also mindful of the need to focus on challenges presented by – for example – post-merger integration and the price and availability of raw materials including energy. New uncertainties also continue to emerge and redefine the changing risk landscape, such as the threat of cyberattack and the longer-term impact of climate change.
Following the 2018 risk assessment process, a series of risk mitigation plans has been created with process owners; Internal Audit will review their progress in due course.
Low
Mod
erat
e
Low Moderate High
Hig
h
10
8
3
41
52
7
6
9

Corporate Governance
66 Board of Directors
68 Corporate Governance report
74 Audit Committee
76 Strategy Committee
78 Nomination and Remuneration Committee
EuroChem Annual Report and Accounts 2018 65
Strategic Report Corporate Governance Financial Statements
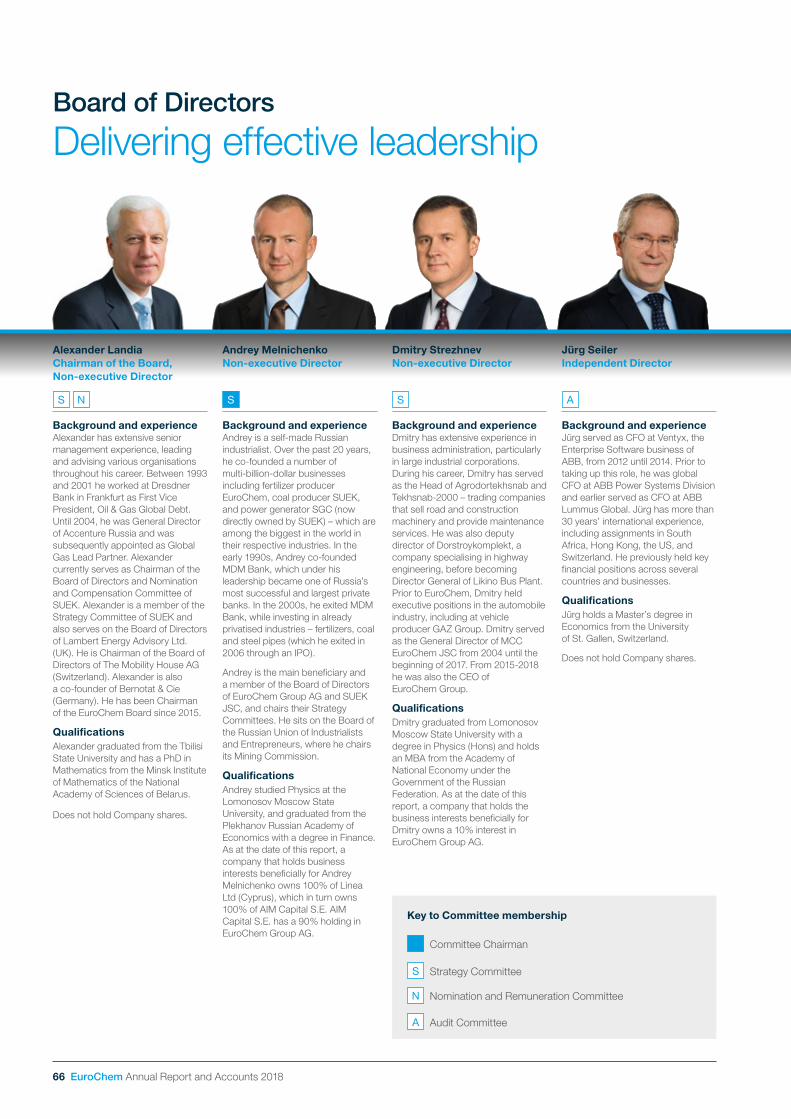
66 EuroChem Annual Report and Accounts 2018
Delivering effective leadershipBoard of Directors
Background and experienceAlexander has extensive senior management experience, leading and advising various organisations throughout his career. Between 1993 and 2001 he worked at Dresdner Bank in Frankfurt as First Vice President, Oil & Gas Global Debt. Until 2004, he was General Director of Accenture Russia and was subsequently appointed as Global Gas Lead Partner. Alexander currently serves as Chairman of the Board of Directors and Nomination and Compensation Committee of SUEK. Alexander is a member of the Strategy Committee of SUEK and also serves on the Board of Directors of Lambert Energy Advisory Ltd. (UK). He is Chairman of the Board of Directors of The Mobility House AG (Switzerland). Alexander is also a co-founder of Bernotat & Cie (Germany). He has been Chairman of the EuroChem Board since 2015.
QualificationsAlexander graduated from the Tbilisi State University and has a PhD in Mathematics from the Minsk Institute of Mathematics of the National Academy of Sciences of Belarus.
Does not hold Company shares.
Background and experienceJürg served as CFO at Ventyx, the Enterprise Software business of ABB, from 2012 until 2014. Prior to taking up this role, he was global CFO at ABB Power Systems Division and earlier served as CFO at ABB Lummus Global. Jürg has more than 30 years’ international experience, including assignments in South Africa, Hong Kong, the US, and Switzerland. He previously held key financial positions across several countries and businesses.
QualificationsJürg holds a Master’s degree in Economics from the University of St. Gallen, Switzerland.
Does not hold Company shares.
Background and experienceAndrey is a self-made Russian industrialist. Over the past 20 years, he co-founded a number of multi-billion-dollar businesses including fertilizer producer EuroChem, coal producer SUEK, and power generator SGC (now directly owned by SUEK) – which are among the biggest in the world in their respective industries. In the early 1990s, Andrey co-founded MDM Bank, which under his leadership became one of Russia’s most successful and largest private banks. In the 2000s, he exited MDM Bank, while investing in already privatised industries – fertilizers, coal and steel pipes (which he exited in 2006 through an IPO).
Andrey is the main beneficiary and a member of the Board of Directors of EuroChem Group AG and SUEK JSC, and chairs their Strategy Committees. He sits on the Board of the Russian Union of Industrialists and Entrepreneurs, where he chairs its Mining Commission.
QualificationsAndrey studied Physics at the Lomonosov Moscow State University, and graduated from the Plekhanov Russian Academy of Economics with a degree in Finance. As at the date of this report, a company that holds business interests beneficially for Andrey Melnichenko owns 100% of Linea Ltd (Cyprus), which in turn owns 100% of AIM Capital S.E. AIM Capital S.E. has a 90% holding in EuroChem Group AG.
Background and experienceDmitry has extensive experience in business administration, particularly in large industrial corporations. During his career, Dmitry has served as the Head of Agrodortekhsnab and Tekhsnab-2000 – trading companies that sell road and construction machinery and provide maintenance services. He was also deputy director of Dorstroykomplekt, a company specialising in highway engineering, before becoming Director General of Likino Bus Plant. Prior to EuroChem, Dmitry held executive positions in the automobile industry, including at vehicle producer GAZ Group. Dmitry served as the General Director of MCC EuroChem JSC from 2004 until the beginning of 2017. From 2015-2018 he was also the CEO of EuroChem Group.
QualificationsDmitry graduated from Lomonosov Moscow State University with a degree in Physics (Hons) and holds an MBA from the Academy of National Economy under the Government of the Russian Federation. As at the date of this report, a company that holds the business interests beneficially for Dmitry owns a 10% interest in EuroChem Group AG.
Alexander LandiaChairman of the Board, Non-executive Director
Dmitry StrezhnevNon-executive Director
Andrey MelnichenkoNon-executive Director
Jürg SeilerIndependent Director
S N S S A
Key to Committee membership
Committee Chairman
S Strategy Committee
N Nomination and Remuneration Committee
A Audit Committee

Strategic Report Corporate Governance Financial Statements
EuroChem Annual Report and Accounts 2018 67
Background and experienceFrom 2010 to 2016, Sergey was Senior Vice President, Strategic Planning and Transactions at LyondellBasell, where he led a team responsible for corporate strategy, capital allocation (CapEx, M&A, JVs), and investor relations. He was responsible for the specialty plastics unit within the global polypropylene compounding business, serving the automotive and consumer durable markets. From 1996 to 2010, Sergey worked in New York at several leading investment banks, including Barclays and Lehman Brothers. His roles included serving as Head of Lehman’s global chemical research group, responsible for identifying and developing investment ideas for the largest global, US private and public investment funds. He started his career as an industrial research scientist at Union Carbide in 1990, and authored eight US and world patents in polymer technology. He was previously a member of the Texas Petrochemical Company (TPC Group) Board of Directors and its Audit and Strategy Committees.
QualificationsSergey graduated with a Master of Science degree at Novosibirsk State University and was a George Soros Scholar at Oxford University; he later earned an MBA degree (Finance) from Rutgers University in the US.
Does not hold Company shares.
Background and experience Geoffery started his career at the Royal Bank of Canada. From 1977 to 2001 and from 2005 to 2013, he served in a number of senior executive positions at The Dow Chemical Company, including Executive Vice President and CFO, and CEO and Chairman of the Board of Dow Europe, Middle East and Africa. He served on Dow’s Board from 2005 to 2009, was lead director of Dow Corning Corporation from 2005 to 2010, and was a director on the boards of the Chemical Financial Corporation and Chemical Bank from 2006 to 2010, respectively. From 2001 to 2005 he was Executive Vice President and CFO of Alcan. Geoffery also served as an executive committee member of the European Chemical Industry Council (CEFIC) from 2009 to 2012. Geoffery brings more than 30 years’ experience in corporate governance and finance to EuroChem. He currently serves on the boards of OC Oerlikon AG and Clariant AG and is also Chairman and CEO of Zolenza AG, an investment and advisory firm based in Switzerland.
QualificationsGeoffery holds a BA in Economics from Albion College, Michigan, US.
Does not hold Company shares.
Background and experienceClark served as EuroChem’s Head of Mining from 2013 to 2018 and was responsible for several major developments, including the Kovdorsky GOK phosphate rock and iron ore mining facility, the development of the Group’s two potash deposits in Russia, and a phosphate rock project in Kazakhstan. Before joining EuroChem, Clark worked at PotashCorp as Senior Vice President, Projects and Technical Services in Saskatoon, Saskatchewan from 2007 to 2012, as well as Director & General Manager – Capital Projects (PCS Nitrogen) in Chicago, Illinois and Vice President, Operations (PCS Nitrogen) in Memphis, Tennessee. Prior to his 16 years at PotashCorp, Clark spent 15 years at Fish Engineering & Construction Inc based in Houston, Texas.
QualificationsClark is a mechanical engineer, a graduate of the University of Texas at Austin, and a member of the American Society of Mechanical Engineers (ASME).
Does not hold Company shares.
Background and experienceSamir held senior management positions at Asea and ABB Power Generation between 1983 and 2000, before moving to Alstom where he served as Chief International Operations Officer and Senior Vice-President, and CEO of Alstom Kraftwerke in Germany. In 2003, he became CEO of ABB Lummus Global and in 2005 he was appointed to the Group Executive Committee of ABB Ltd, and served as Head of the Power Systems Division at ABB Group. From 2006 to 2016, Samir was CEO of Amec. Foster Wheeler (formerly Amec) Samir was the 2009 and 2016 chair of the World Economic Forum’s Engineering and Construction Board. He served as chair of the Forum’s Disaster Resource Partnership and is currently co-chair of the Forum’s Infrastructure & Urban Development Industries Committee.
QualificationsSamir holds a Master of Science degree in Thermal Technology from the Royal Institute of Technology in Stockholm, Sweden. He received an Honorary Doctorate from Cranfield University in the UK. He is also a graduate of the Young Managers Programme at INSEAD and the Senior Executive Programme at Stanford University.
Does not hold Company shares.
Sergey VasnetsovIndependent Director
Clark BaileyNon-executive Director
Geoffery MerszeiIndependent Director
Samir BrikhoIndependent Director
S N A S N

68 EuroChem Annual Report and Accounts 2018
Maintaining effective stewardshipCorporate Governance report
The Board’s strategic roleThe primary focus of the Board is to steer, support and oversee the Company’s strategic development. EuroChem’s Board of Directors is responsible for the overall stewardship of the Group. It is accountable for determining that the Group’s affairs are conducted and managed in such a way to achieve this objective. The Board’s mission is to ensure there is a solid and consistent strategy for the business, enabling EuroChem to achieve its business goals and deliver long-term sustainable shareholder and stakeholder value.
The Board also ensures that EuroChem adopts and maintains international standards and best practices. It monitors the Group’s accounting function, its risk management processes, internal controls and governance framework. Its activities are aligned with the principles set out in the Articles of Association and the Regulations of the Board of Directors.
Each member of the Board is expected to have a good understanding of the Group’s business and the industry in which it operates. Directors develop relationships with the management team, enabling them to readily obtain information on key material issues as well as strategy implementation and risk management.
Decision makingTo fulfil its function, the Board receives up-to-date, comprehensive information in a timely manner. In addition to materials prepared for scheduled quarterly meetings, Directors receive additional occasional updates. These include management accounts, safety updates and media coverage summaries, as well as details of corporate events, strategic investment projects and any legal proceedings.
Directors are advised of all significant corporate events at the earliest opportunity by the senior management team. This communication process is defined in a policy and in associated procedures, and enables the Board to make balanced and informed assessments of the Company’s performance, position and prospects.
The EuroChem Board makes full use of each Director’s unique experience and perspective, ensuring that each individual has ample opportunity to freely express their opinion. To enhance their understanding of our operations, Directors undertake an annual site visit to one of the Group’s facilities.
The agenda for Board meetings is planned a year in advance, taking into account the optimal cycle for reviewing recurrent issues such as budgets, financial reporting and strategies. The timing, expectations and goals of these reviews are well understood by both the Directors and the management team. They include detailed updates on core operational areas, investment projects and strategy.
EffectivenessAt its meetings towards the end of the year, the Board reviews its activity for the previous 12 months and discusses how it can improve its overall performance. During the most recent assessment, the focus was once again on the Board’s greater involvement in the Company’s core business activities and strategic direction, including through curatorship. Additionally, it was agreed to introduce the mechanism of task distribution among Board members, which will deepen coordination with the management in specific focus areas. This will deliver not just a deeper understanding of our business and the fertilizer industry as a whole, but a more productive Board-management relationship.
This year, the Nomination and Remuneration Committee discussed the Company’s curatorship activities over recent years, shared its appraisals of curators’ past performance and made proposals for further development. The discussion focused on the current issues requiring deeper engagement on the part of the Board, specifically in the development of key strategic projects.
Induction processOn joining the Board, each new Director is provided with a clear and comprehensive picture of the Group and its operations. This formal induction process includes a series of meetings with key managers from across the Group. It also requires a Director to become familiar with the regulations pertaining to Board procedures and standing items on the Board’s forward agenda. New Directors also have the opportunity to visit EuroChem facilities to obtain a better understanding of the Group’s operations at first hand.
This year, two new Directors joined the Board and undertook a comprehensive induction to the Company. This involved a combination of presentations, seminars, face-to-face meetings with management and other activities.
Directors’ independence We apply the UK Corporate Governance Code’s definition of ‘independent’ Director. A key criterion is that the individual is free from any conflicts of interest. Should actual or potential conflicts arise, independent Directors are notified and required to act appropriately.
All Directors are required to inform the Company of any events that could compromise their independent status. New Directors must declare any conflicts of interest and sign up to the Group’s Board Regulations. This requires them to refrain from taking any action that could lead to any conflict, with an obligation to inform the Chairman at the earliest opportunity, should such a situation arise.
At the end of 2018, four of the Board’s eight Directors were fully independent of the Company’s executives, affiliates and major counterparties. Their status as ‘independent’ is confirmed after each election or re-election to the Board, using a standard questionnaire relating to the declaration of interests. The Non-Executive Directors exercise independent, objective judgement in respect of Board decisions, and scrutinise and challenge management.
Leading by exampleThe Chairman of the Board oversees and steers its deliberations, while ensuring its effectiveness by facilitating open communications and cultivating an atmosphere of mutual respect and constructive debate. The Chairman’s specific responsibilities are set out in the Board Regulations.
The Board establishes the Company’s strategy, monitors its progress and holds the Management Board to account for its execution. The CEO and members of the Management Board are responsible for the day-to-day management and operation of the Company. The Management Board comprises key managers with responsibility for daily operations, finance, fertilizer production, mining, sales and marketing, logistics and administration.
The Board is responsible for appointing the CEO and Management Board; it also determines the length of their terms.
Strategic Report Corporate Governance Financial Statements
EuroChem Annual Report and Accounts 2018 69
The Board delegates certain responsibilities to its three Committees:
Committee Principal function
Audit Committee
Oversees the reliability and integrity of financial reporting, accounting policies and disclosure practices. Ensures the adequacy and effectiveness of the management reporting and control systems in managing risks and ensuring compliance.
Strategy Committee
Makes recommendations on the Company’s strategic direction, evaluates strategies towards growth opportunities, sales and marketing and operations. Assesses new business proposals including acquisitions/joint ventures and makes appropriate recommendations. Together with the Nomination and Remuneration Committee, it oversees the Company’s corporate reputation, and social and HSE-related strategic goals.
Nomination and Remuneration Committee
Focuses on remuneration and incentive programmes. Considers succession planning for directors and other senior executives with a view to challenges and opportunities facing the Company, and the skills and expertise needed on the Board in future. It places a strong emphasis on HSE performance and oversees compliance with relevant laws and regulations.
Further details on the Group’s Board and Committees are available in the Corporate Governance section of EuroChem’s corporate website at www.eurochemgroup.com.
Equal opportunitiesWe are committed to attracting the best people with the right talent, experience and attitude to EuroChem. We promote a working environment free from discrimination, and treat colleagues equally, regardless of age, disability, gender, ethnicity, marital status, sexual orientation or religion.
EuroChem’s Board exhibits a mix of experience, age, and nationality. We continue to look at ways of achieving greater female representation in senior roles, including at Board level. Our E-Generation programme identifies talented, motivated young individuals within EuroChem and plays a key role in our drive to provide new opportunities for women and prepare them for leadership roles within the Group.
Corporate behaviour and complianceWe strive to uphold the highest ethical standards across all our activities, in line with EuroChem’s values, goals and objectives. The Board and senior management of the Group set the ‘tone at the top’, which is underpinned by our Code of Conduct. New Directors and all employees are given a copy of the Code during their induction process. The Code is accessible via the Corporate Governance section of the Company’s website at www.eurochemgroup.com.
The Group’s geographical expansion, together with increasingly onerous regulatory requirements, necessitates a robust system of monitoring.
Early warning of any changes in relevant legislation is also essential to the Group’s planning and compliance activities. We continued to develop the Group Compliance Function in 2018, revising and updating the existing policies as required on a continuing basis. The Group Compliance Programme is maintained by ongoing education and training of our employees on Code of Conduct and compliance policies. New employees receive compliance training as part of their onboarding, and the Group’s Compliance function provides refresher compliance training and updates for existing employees.
The compliance policies are accessible to all employees of the Group via the Company’s intranet.
Our approach to governanceEuroChem’s corporate governance system is based on the following principles:
• Treating our shareholders fairly; recognising and protecting their rights
• Operating an effective system of internal control and audit
• Ensuring access to the Company’s information, and financial transparency
• Applying the highest levels of business ethics
• Providing an excellent working environment, career progression and effective communication mechanisms for employees
Board prioritiesThe Board’s principal activities include:
• Developing and setting the Group’s overall strategy
• Overseeing the Group borrowings and treasury policy
• Reviewing and deciding on material acquisitions, contracts, major capital expenditure projects and budgets (supported by the Strategy Committee)
• Overseeing risk management and internal controls (supported by the Audit Committee)
• Reviewing and deciding on succession planning and appointments (supported by the Nomination and Remuneration Committee)
• Overseeing corporate governance and compliance issues (supported by the Audit Committee)
• Reviewing and endorsing corporate policies

70 EuroChem Annual Report and Accounts 2018
The legal and regulatory environmentThe EuroChem Group comprises the parent entity, EuroChem Group AG, and its subsidiaries (collectively the ‘Group’ or ‘EuroChem Group’). The Company was incorporated under the laws of Switzerland on 16 July 2014 and has its registered office at Baarerstrasse 37, 6300, Zug, Switzerland.
We have introduced the principles recommended by the UK Corporate Governance Code and apply recognised international best practice, including:
• The positions of Chairman of the Board of Directors and Chief Executive Officer are separate
• Board Directors are elected and the Board’s performance is assessed annually
• The Board has a majority of independent and non-executive Directors
• The independence of individual members is verified by the Board annually
• Individual Board members avoid potential conflicts of interests when making decisions
Shareholder structureAs at 31 December 2018, AIM Capital SE owned 90% (31 December 2017: 90%) of the share capital of EuroChem Group AG: the remaining 10% of the Company was held indirectly by Dmitry Strezhnev (31 December 2017: 10%). A company that holds business interests beneficially for Andrey Melnichenko owned 100% of Linea Ltd. registered in Cyprus, which in turn indirectly owns 100% of AIM Capital SE (31 December 2017: 100%).
Share capitalEuroChem Group AG share capital consists of CHF 100,000 (one hundred thousand) and is divided into 1,000 (one thousand) registered shares with a par value of CHF 100 (one hundred) each.
Governance structure EuroChem’s highest-ranking corporate governance body is the General Meeting of Shareholders (GM). The Board of Directors is elected by – and reports directly to – the GM. The Board of Directors appoints the Chief Executive Officer (CEO) and the Management Board, and determines the length of their mandates. The CEO and Management Board report directly to the Board of Directors, which is represented by the Chairman.
The Board works to a forward agenda. This is updated annually and considers all issues that are referred to it by law, the Company’s Articles of Association and Regulations on the Board of Directors. The meeting schedule for the year includes six joint-presence meetings covering issues that require substantive discussion. The Board also holds supplementary meetings to address any significant matters that may arise during the year. These are held either by teleconference or, for procedural issues, by absentee voting.
The Company’s Legal function oversees the preparations for the Board and Committee meetings. The agenda is prepared in conjunction with the Chairman, the CEO and the Company Secretary. Materials on specific topics are distributed to the Board and Committee members in advance by email and uploaded to the Board portal.
Key Company documents that define EuroChem’s approach to corporate governance are:
• Articles of Association
• Regulations on the Board of Directors
• Organisational Regulations on the Management Board and the Chief Executive Officer
• Audit Committee Regulations
• Nomination and Remuneration Committee Regulations
• Strategy Committee Regulations
• Code of ConductEuroChem Group AG shareholders
As of 31.12.2018 As of 31.12.2017
Shares No.Share capital
% Shares No.Share capital
%
AIM Capital SE 900 90 900 90
Midstream Group Limited 100 10 100 10
Board compositionAt the start of 2018, the Board comprised eight Directors: Alexander Landia (Chairman), Andrey Melnichenko, Kuzma Marchuk, Garth William Moore, Jürg Seiler, Dmitry Strezhnev, Sergey Vasnetsov and Manfred Wennemer.
At the Annual General Meeting of Shareholders on 28 June 2018, the following members were elected to the Board: Alexander Landia (Chairman), Andrey Melnichenko, Clark Dillon Bailey, Samir Brikho, Stefan Judisch, Geoffery Merszei, Jürg Seiler, Dmitry Strashnov, Dmitry Strezhnev and Sergey Vasnetsov.
As at 31 December 2018, EuroChem’s Board of Directors comprised eight Directors, as presented on pages 66-67 of this report.
Developments in 2018Samir Brikho and Geoffery Merszei joined the Board in February 2018. Garth Moore and Manfred Wennemer left the Board. Kuzma Marchuk left the Board to take up the position of Chief Financial Officer on 13 June.
Dmitry Strashnov, who joined EuroChem in November 2017 as Chief Operating Officer, was appointed Chief Executive Officer on 1 July but stepped down due to personal reasons on 24 September. He was replaced on an acting basis by Mr. Marchuk.
Maintaining effective stewardship continued
Corporate Governance report

Strategic Report Corporate Governance Financial Statements
EuroChem Annual Report and Accounts 2018 71
2018 Board agendaKey agenda items discussed by the Board of Directors during the year included:
Strategic developmentThe annual review of the Group’s business and strategy indicated that EuroChem will continue focusing its efforts on the same strategic goals. Specifically, these include sustaining global competitiveness through vertical integration and continuous performance enhancement, expanding the portfolio of industrial and value added products, and developing further international distribution capabilities in target markets.
The main objective for the next two to three years is to continue developing efficient procedures for the production and processing of potash at the Group’s two potash projects in Usolskiy, Perm Region, and VolgaKaliy, Volgograd Region, and to reach designed capacity. The launch of potash means that EuroChem has become one of just three companies worldwide to have in-house production of all three NPK nutrients and will therefore be able to offer customers all types of fertilizers.
EuroChem exited the oil and gas business in late 2017 with the sale of Severneft-Urengoy, its gas exploration and production company.
Board committees and attendanceIn 2018, the Board held six meetings in person and twelve in absentia.
Board attendanceCommittee attendance
(meetings and teleconferences)
Director
Attended/held in 2018 In person In absentia Audit
Nomination and
Remuneration Strategy
Non-executive directors
Andrey Melnichenko 18/18 6/6 12/12 – – 6/6
Dmitry Strezhnev 18/18 6/6 12/12 – 4/6 6/6
Alexander Landia 18/18 6/6 12/12 – 6/6 6/6
Clark Dillon Bailey1 8/18 2/6 6/12 – 1/6 3/6
Independent directors
Samir Brikho2 14/18 5/6 9/12 – 5/6 5/6
Geoffery Merszei2 15/18 6/6 9/12 9/10 3/6 6/6
Jürg Seiler 18/18 6/6 12/12 10/10 3/6 6/6
Sergey Vasnetsov 18/18 6/6 12/12 – 6/6 6/6
1. Mr. Bailey joined the Board in June 2018.
2. Mr. Brikho and Mr. Merszei joined the Board in February 2018.
Strategic prioritiesStrategic priorities underpinning EuroChem’s ongoing development:
• In-house production of all three NPK nutrients
• Offering customers all types of fertilizers
• Ongoing work to increase efficiency, global cost efficiency
• Expanding the portfolio of industrial and value-added products
• Extending global presence and developing distribution in target markets
• Research and investment into new products and technologies, working with partners where appropriate
Vertical integrationThe backbone of EuroChem’s strategy remains its vertical integration, from production of natural resources to the sale of finished products to end consumers. This:
• Allows the Group to have high-quality, competitive assets and be a reliable, long-term partner in the fertilizer industry
• Reduces the risks related to supply of raw materials and services by third parties
• Enables the Group to develop a better understanding of buyers’ needs and adapt more quickly to changing market conditions
• Ensures efficient supply of all products to customers
• Delivers synergies in cases of further business expansionThis leaves EuroChem better positioned to
focus on the commercial optimisation of the existing business, reducing costs, building an efficient supply chain management process and enhancing product management.
The Group will continue growing its presence in the premium products segment, including developing new water-soluble and specialty fertilizers, as well as other compound NPK products. Growing market interest in products with a reduced environmental footprint and on specialty products for high-value crops represents a significant opportunity for EuroChem as the Company broadens its research and development activities, allying with partners where appropriate to meet the changing needs of farmers around the world.
Elsewhere, development of a project in Kazakhstan for the extraction of phosphate raw materials and construction of a chemical complex will reduce the Group’s dependence on third parties for raw materials procurement. Management will also work on defining options for expanding EuroChem’s presence in the phosphate segment.
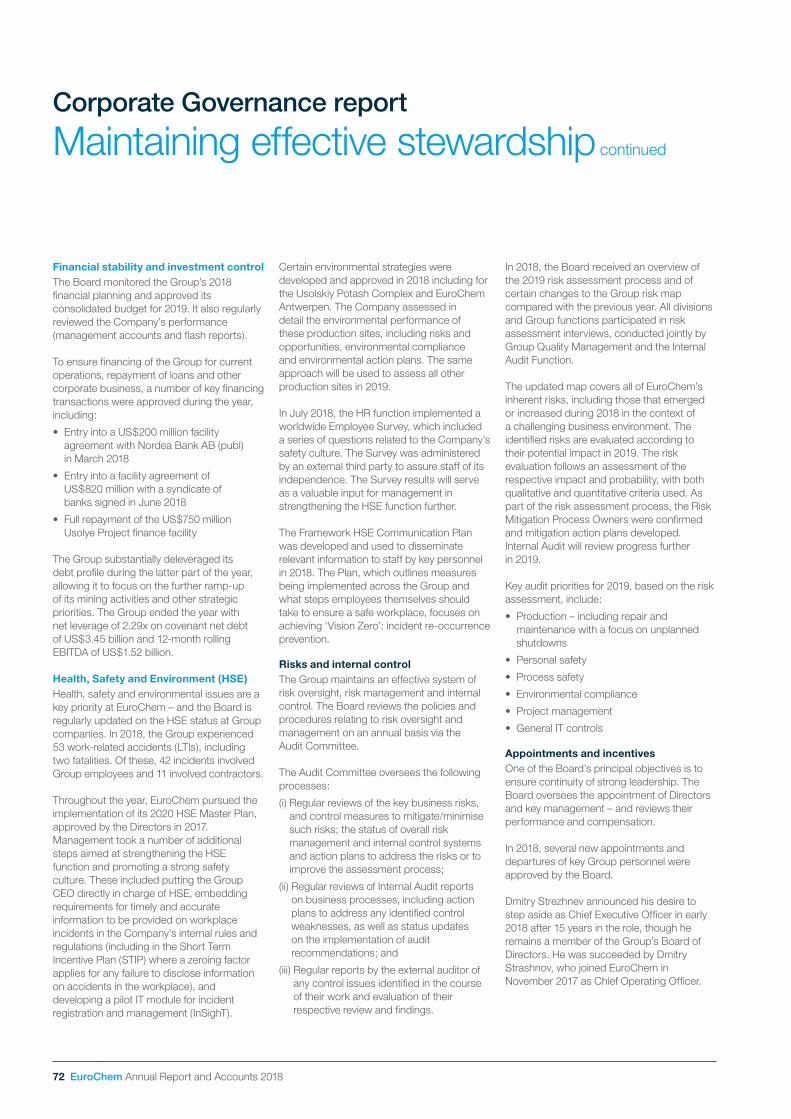
72 EuroChem Annual Report and Accounts 2018
Financial stability and investment controlThe Board monitored the Group’s 2018 financial planning and approved its consolidated budget for 2019. It also regularly reviewed the Company’s performance (management accounts and flash reports).
To ensure financing of the Group for current operations, repayment of loans and other corporate business, a number of key financing transactions were approved during the year, including:
• Entry into a US$200 million facility agreement with Nordea Bank AB (publ) in March 2018
• Entry into a facility agreement of US$820 million with a syndicate of banks signed in June 2018
• Full repayment of the US$750 million Usolye Project finance facility
The Group substantially deleveraged its debt profile during the latter part of the year, allowing it to focus on the further ramp-up of its mining activities and other strategic priorities. The Group ended the year with net leverage of 2.29x on covenant net debt of US$3.45 billion and 12-month rolling EBITDA of US$1.52 billion.
Health, Safety and Environment (HSE)Health, safety and environmental issues are a key priority at EuroChem – and the Board is regularly updated on the HSE status at Group companies. In 2018, the Group experienced 53 work-related accidents (LTIs), including two fatalities. Of these, 42 incidents involved Group employees and 11 involved contractors.
Throughout the year, EuroChem pursued the implementation of its 2020 HSE Master Plan, approved by the Directors in 2017. Management took a number of additional steps aimed at strengthening the HSE function and promoting a strong safety culture. These included putting the Group CEO directly in charge of HSE, embedding requirements for timely and accurate information to be provided on workplace incidents in the Company’s internal rules and regulations (including in the Short Term Incentive Plan (STIP) where a zeroing factor applies for any failure to disclose information on accidents in the workplace), and developing a pilot IT module for incident registration and management (InSighT).
Certain environmental strategies were developed and approved in 2018 including for the Usolskiy Potash Complex and EuroChem Antwerpen. The Company assessed in detail the environmental performance of these production sites, including risks and opportunities, environmental compliance and environmental action plans. The same approach will be used to assess all other production sites in 2019.
In July 2018, the HR function implemented a worldwide Employee Survey, which included a series of questions related to the Company’s safety culture. The Survey was administered by an external third party to assure staff of its independence. The Survey results will serve as a valuable input for management in strengthening the HSE function further.
The Framework HSE Communication Plan was developed and used to disseminate relevant information to staff by key personnel in 2018. The Plan, which outlines measures being implemented across the Group and what steps employees themselves should take to ensure a safe workplace, focuses on achieving ‘Vision Zero’: incident re-occurrence prevention.
Risks and internal controlThe Group maintains an effective system of risk oversight, risk management and internal control. The Board reviews the policies and procedures relating to risk oversight and management on an annual basis via the Audit Committee.
The Audit Committee oversees the following processes:
(i) Regular reviews of the key business risks, and control measures to mitigate/minimise such risks; the status of overall risk management and internal control systems and action plans to address the risks or to improve the assessment process;
(ii) Regular reviews of Internal Audit reports on business processes, including action plans to address any identified control weaknesses, as well as status updates on the implementation of audit recommendations; and
(iii) Regular reports by the external auditor of any control issues identified in the course of their work and evaluation of their respective review and findings.
In 2018, the Board received an overview of the 2019 risk assessment process and of certain changes to the Group risk map compared with the previous year. All divisions and Group functions participated in risk assessment interviews, conducted jointly by Group Quality Management and the Internal Audit Function.
The updated map covers all of EuroChem’s inherent risks, including those that emerged or increased during 2018 in the context of a challenging business environment. The identified risks are evaluated according to their potential impact in 2019. The risk evaluation follows an assessment of the respective impact and probability, with both qualitative and quantitative criteria used. As part of the risk assessment process, the Risk Mitigation Process Owners were confirmed and mitigation action plans developed. Internal Audit will review progress further in 2019.
Key audit priorities for 2019, based on the risk assessment, include:
• Production – including repair and maintenance with a focus on unplanned shutdowns
• Personal safety
• Process safety
• Environmental compliance
• Project management
• General IT controls
Appointments and incentivesOne of the Board’s principal objectives is to ensure continuity of strong leadership. The Board oversees the appointment of Directors and key management – and reviews their performance and compensation.
In 2018, several new appointments and departures of key Group personnel were approved by the Board.
Dmitry Strezhnev announced his desire to step aside as Chief Executive Officer in early 2018 after 15 years in the role, though he remains a member of the Group’s Board of Directors. He was succeeded by Dmitry Strashnov, who joined EuroChem in November 2017 as Chief Operating Officer.
Maintaining effective stewardship continued
Corporate Governance report
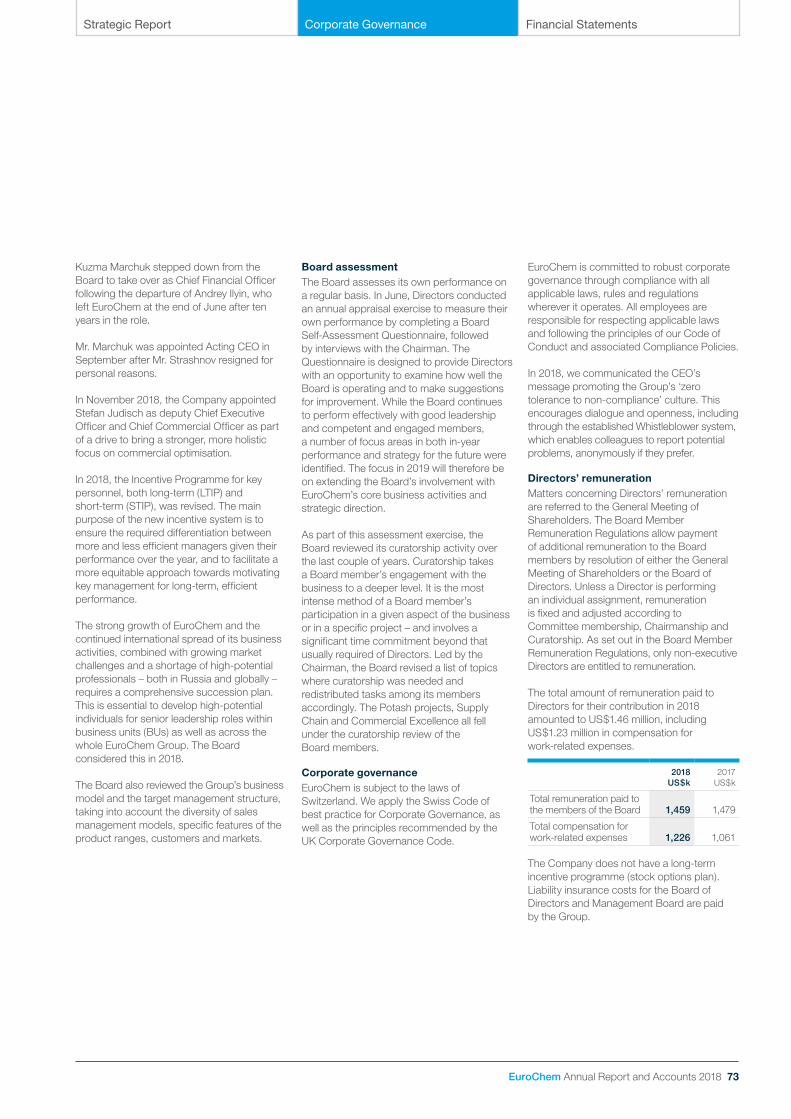
Strategic Report Corporate Governance Financial Statements
EuroChem Annual Report and Accounts 2018 73
Kuzma Marchuk stepped down from the Board to take over as Chief Financial Officer following the departure of Andrey Ilyin, who left EuroChem at the end of June after ten years in the role.
Mr. Marchuk was appointed Acting CEO in September after Mr. Strashnov resigned for personal reasons.
In November 2018, the Company appointed Stefan Judisch as deputy Chief Executive Officer and Chief Commercial Officer as part of a drive to bring a stronger, more holistic focus on commercial optimisation.
In 2018, the Incentive Programme for key personnel, both long-term (LTIP) and short-term (STIP), was revised. The main purpose of the new incentive system is to ensure the required differentiation between more and less efficient managers given their performance over the year, and to facilitate a more equitable approach towards motivating key management for long-term, efficient performance.
The strong growth of EuroChem and the continued international spread of its business activities, combined with growing market challenges and a shortage of high-potential professionals – both in Russia and globally – requires a comprehensive succession plan. This is essential to develop high-potential individuals for senior leadership roles within business units (BUs) as well as across the whole EuroChem Group. The Board considered this in 2018.
The Board also reviewed the Group’s business model and the target management structure, taking into account the diversity of sales management models, specific features of the product ranges, customers and markets.
Board assessmentThe Board assesses its own performance on a regular basis. In June, Directors conducted an annual appraisal exercise to measure their own performance by completing a Board Self-Assessment Questionnaire, followed by interviews with the Chairman. The Questionnaire is designed to provide Directors with an opportunity to examine how well the Board is operating and to make suggestions for improvement. While the Board continues to perform effectively with good leadership and competent and engaged members, a number of focus areas in both in-year performance and strategy for the future were identified. The focus in 2019 will therefore be on extending the Board’s involvement with EuroChem’s core business activities and strategic direction.
As part of this assessment exercise, the Board reviewed its curatorship activity over the last couple of years. Curatorship takes a Board member’s engagement with the business to a deeper level. It is the most intense method of a Board member’s participation in a given aspect of the business or in a specific project – and involves a significant time commitment beyond that usually required of Directors. Led by the Chairman, the Board revised a list of topics where curatorship was needed and redistributed tasks among its members accordingly. The Potash projects, Supply Chain and Commercial Excellence all fell under the curatorship review of the Board members.
Corporate governanceEuroChem is subject to the laws of Switzerland. We apply the Swiss Code of best practice for Corporate Governance, as well as the principles recommended by the UK Corporate Governance Code.
EuroChem is committed to robust corporate governance through compliance with all applicable laws, rules and regulations wherever it operates. All employees are responsible for respecting applicable laws and following the principles of our Code of Conduct and associated Compliance Policies.
In 2018, we communicated the CEO’s message promoting the Group’s ‘zero tolerance to non-compliance’ culture. This encourages dialogue and openness, including through the established Whistleblower system, which enables colleagues to report potential problems, anonymously if they prefer.
Directors’ remuneration Matters concerning Directors’ remuneration are referred to the General Meeting of Shareholders. The Board Member Remuneration Regulations allow payment of additional remuneration to the Board members by resolution of either the General Meeting of Shareholders or the Board of Directors. Unless a Director is performing an individual assignment, remuneration is fixed and adjusted according to Committee membership, Chairmanship and Curatorship. As set out in the Board Member Remuneration Regulations, only non-executive Directors are entitled to remuneration.
The total amount of remuneration paid to Directors for their contribution in 2018 amounted to US$1.46 million, including US$1.23 million in compensation for work-related expenses.
2018US$k
2017US$k
Total remuneration paid to the members of the Board 1,459 1,479
Total compensation for work-related expenses 1,226 1,061
The Company does not have a long-term incentive programme (stock options plan). Liability insurance costs for the Board of Directors and Management Board are paid by the Group.

74 EuroChem Annual Report and Accounts 2018
The Audit Committee supervises EuroChem’s financial and sustainability reporting and the integrity of information disclosure. The Committee ensures the adequacy of the Company’s compliance activities, including risk management. The Committee oversees the Company’s relationship with its external auditor and directs and monitors the performance of the Internal Audit function.
The Audit Committee’s role, responsibilities, composition and membership requirements are documented in the Committee Regulations approved by the Board and available in the Corporate Governance section of our website (www.eurochemgroup.com).
2018 Audit Committee meetings and attendanceAs at 31 December 2018, the Committee had two members: Committee Chairman Geoffery Merszei and Jürg Seiler (IND).
In 2018, the Committee held a total of ten meetings, six in person and four in the form of conference calls. The 2018 attendance table is on page 71.
The Group CFO, General Counsel and Chief Compliance Officer, as well as senior representatives from PwC and Internal Audit, attended every scheduled meeting of the Audit Committee throughout the period.
The Audit Committee’s role, responsibilities, composition and membership requirements are documented in the Committee Regulations approved by the Board and available in the Corporate Governance section of our corporate website.
Audit CommitteeEuroChem Group AG Committees
Geoffery Merszei (IND) Chairman
Priorities
Key priorities for 2018 Overview of activity
Oversee the Company’s tax policy, further development of efficient tax planning
■ Addressed the main aspects of the Group tax and transfer compliance processes
■ Held several in-depth discussions and workshops on tax management and financial risk management with the Company’s senior personnel
Review the Company’s treasury policies, including hedging
■ Reviewed the efficiency of the Group’s hedging strategy
■ Analysed the Group approach to foreign exchange (FX) hedging
■ Reviewed the effectiveness of the Group hedging performance
Further strengthen the Group’s Compliance Function
■ Reviewed the status of the Compliance Programme development regularly, including Sanctions Compliance
■ Held regular meetings with the Chief Compliance Officer and General Counsel on pertinent issues
Drive the Group Global Internal Audit function to play a more prominent role and continue to focus on key strategic and operational risks
■ Reviewed the effectiveness of the Internal Audit Function, focusing on improving the implementation rate of corrective actions. Relevant reporting and escalation procedures were introduced

EuroChem Annual Report and Accounts 2018 75
Strategic Report Corporate Governance Financial Statements
“ We strengthened the Group’s Compliance Function, recognising the importance of reporting, control and compliance procedures in the Group.”
External auditor ■ Reviewing the performance of the
Group’s external auditor and its independence status
■ Reviewing the annual plans of the external auditor, and overseeing the auditors’ work throughout the year, including the assessment of their effectiveness
■ Approving annual fee for audit services; overseeing compliance with the policy for non-audit services
■ Holding regular private meetings with the external auditor
Financial reporting and budgeting ■ Reviewing and making recommendations
to the Board for approval of the annual audited consolidated financial statements; approving consolidated interim financial statements
■ Monitoring evolution of accounting standards and expected relevant changes in legislation
■ Reviewing significant accounting, financial reporting and other issues raised by management, internal and external auditors
■ Reviewing budgeting process and annual budget for 2019
Risk management and internal control ■ Reviewing the Group’s risk map, risk
management framework and strategy
■ Reviewing existing internal controls and their efficiency
■ Reviewing the Group’s insurance policy including D&O coverage
■ Reviewing compliance issues on a regular basis, overseeing development of the Group compliance programme
■ Reviewing the Group tax planning strategy
Internal Audit ■ Reviewing the performance and
effectiveness of the Internal Audit function.
■ Approving the Internal Audit plan and budget for 2019
■ Assessing the independence of the Internal Audit function and the adequacy of its resources and funds
■ Considering key findings of Internal Audit reviews and management’s response to these
■ Holding regular private meetings with the Head of Internal Audit
Information disclosure ■ Reviewing the quality and integrity of
financial and non-financial data, including the annual report, as well as financial press releases published during the period
■ Reviewing and endorsing the risk management and corporate governance sections of the annual report
Audit Committee activity in 2018
Committee membership:
Members
2Number of meetings
10
Geoffery Merszei (IND), Jürg Seiler (IND)
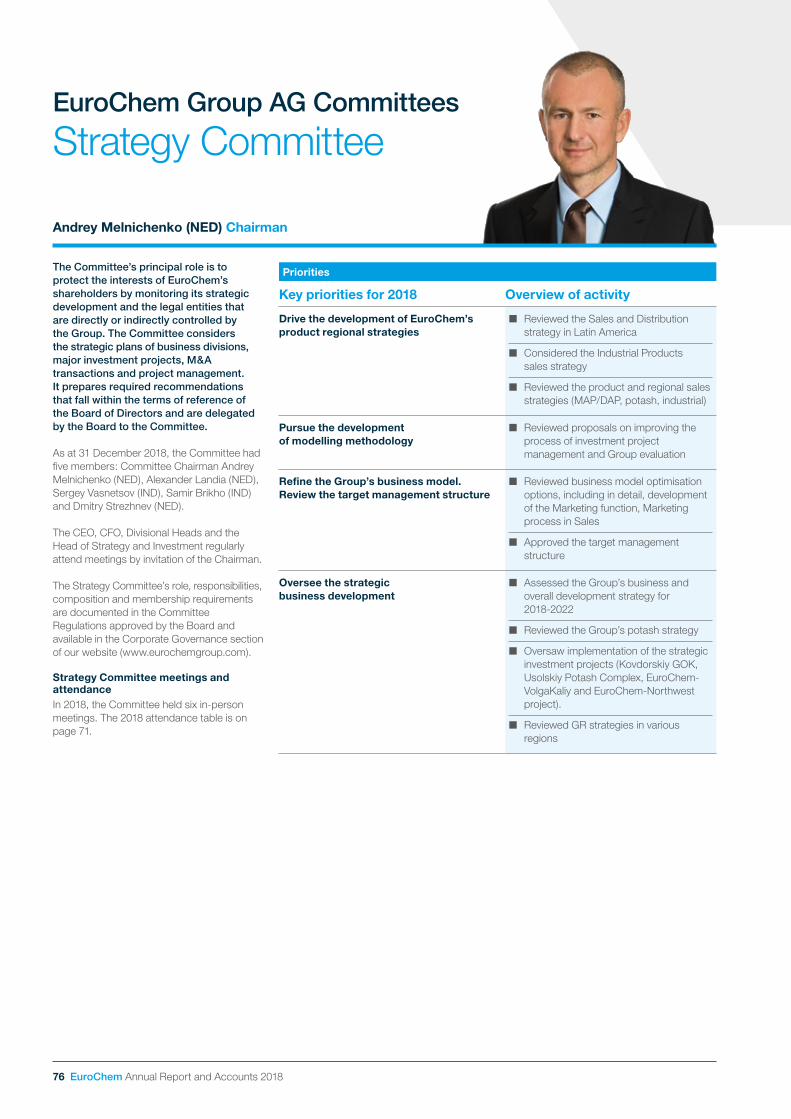
76 EuroChem Annual Report and Accounts 2018
The Committee’s principal role is to protect the interests of EuroChem’s shareholders by monitoring its strategic development and the legal entities that are directly or indirectly controlled by the Group. The Committee considers the strategic plans of business divisions, major investment projects, M&A transactions and project management. It prepares required recommendations that fall within the terms of reference of the Board of Directors and are delegated by the Board to the Committee.
As at 31 December 2018, the Committee had five members: Committee Chairman Andrey Melnichenko (NED), Alexander Landia (NED), Sergey Vasnetsov (IND), Samir Brikho (IND) and Dmitry Strezhnev (NED).
The CEO, CFO, Divisional Heads and the Head of Strategy and Investment regularly attend meetings by invitation of the Chairman.
The Strategy Committee’s role, responsibilities, composition and membership requirements are documented in the Committee Regulations approved by the Board and available in the Corporate Governance section of our website (www.eurochemgroup.com).
Strategy Committee meetings and attendanceIn 2018, the Committee held six in-person meetings. The 2018 attendance table is on page 71.
Strategy CommitteeEuroChem Group AG Committees
Andrey Melnichenko (NED) Chairman
Priorities
Key priorities for 2018 Overview of activity
Drive the development of EuroChem’s product regional strategies
■ Reviewed the Sales and Distribution strategy in Latin America
■ Considered the Industrial Products sales strategy
■ Reviewed the product and regional sales strategies (MAP/DAP, potash, industrial)
Pursue the development of modelling methodology
■ Reviewed proposals on improving the process of investment project management and Group evaluation
Refine the Group’s business model. Review the target management structure
■ Reviewed business model optimisation options, including in detail, development of the Marketing function, Marketing process in Sales
■ Approved the target management structure
Oversee the strategic business development
■ Assessed the Group’s business and overall development strategy for 2018-2022
■ Reviewed the Group’s potash strategy
■ Oversaw implementation of the strategic investment projects (Kovdorskiy GOK, Usolskiy Potash Complex, EuroChem-VolgaKaliy and EuroChem-Northwest project).
■ Reviewed GR strategies in various regions
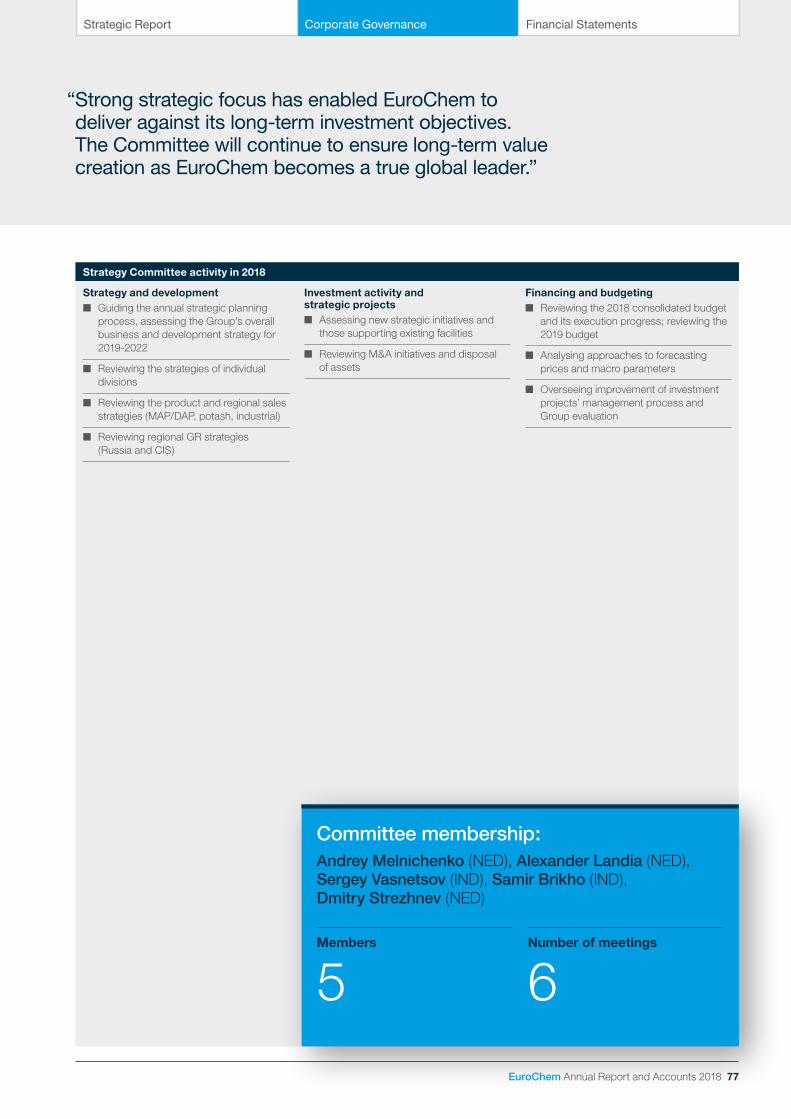
EuroChem Annual Report and Accounts 2018 77
Strategic Report Corporate Governance Financial Statements
“ Strong strategic focus has enabled EuroChem to deliver against its long-term investment objectives. The Committee will continue to ensure long-term value creation as EuroChem becomes a true global leader.”
Strategy and development ■ Guiding the annual strategic planning
process, assessing the Group’s overall business and development strategy for 2019-2022
■ Reviewing the strategies of individual divisions
■ Reviewing the product and regional sales strategies (MAP/DAP, potash, industrial)
■ Reviewing regional GR strategies (Russia and CIS)
Investment activity and strategic projects
■ Assessing new strategic initiatives and those supporting existing facilities
■ Reviewing M&A initiatives and disposal of assets
Financing and budgeting ■ Reviewing the 2018 consolidated budget
and its execution progress; reviewing the 2019 budget
■ Analysing approaches to forecasting prices and macro parameters
■ Overseeing improvement of investment projects’ management process and Group evaluation
Strategy Committee activity in 2018
Committee membership:
Members
5Number of meetings
6
Andrey Melnichenko (NED), Alexander Landia (NED), Sergey Vasnetsov (IND), Samir Brikho (IND), Dmitry Strezhnev (NED)
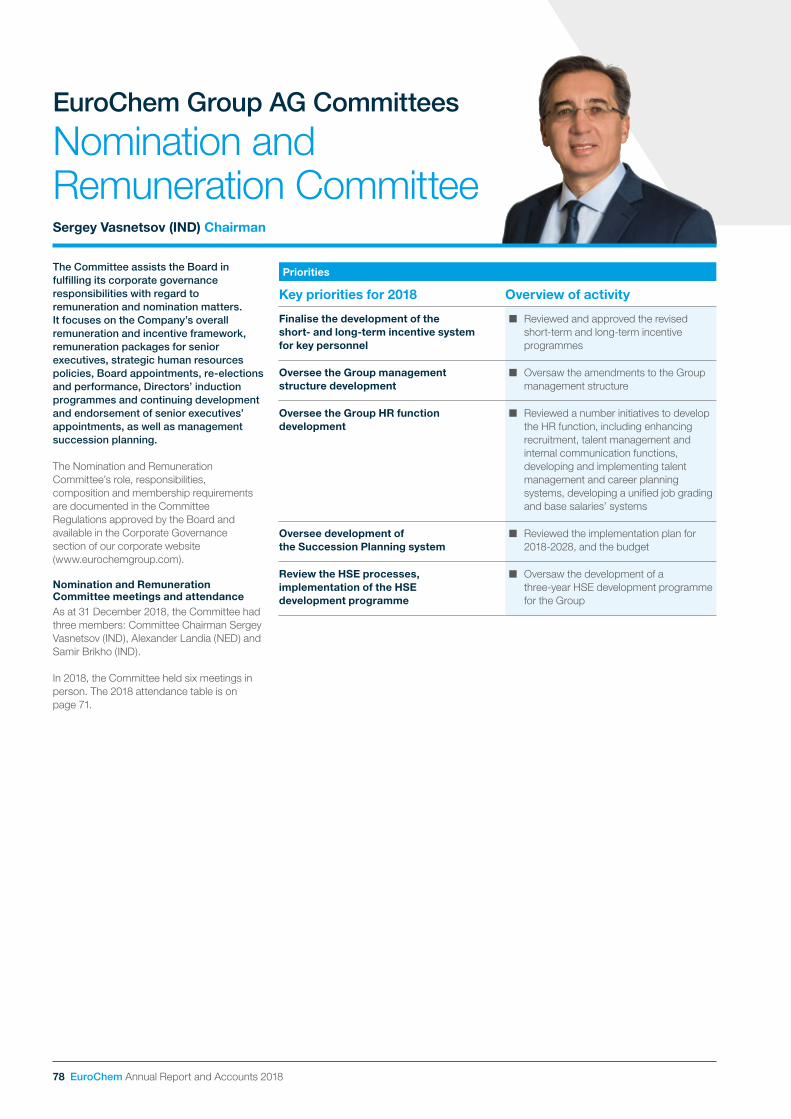
78 EuroChem Annual Report and Accounts 2018
The Committee assists the Board in fulfilling its corporate governance responsibilities with regard to remuneration and nomination matters. It focuses on the Company’s overall remuneration and incentive framework, remuneration packages for senior executives, strategic human resources policies, Board appointments, re-elections and performance, Directors’ induction programmes and continuing development and endorsement of senior executives’ appointments, as well as management succession planning.
The Nomination and Remuneration Committee’s role, responsibilities, composition and membership requirements are documented in the Committee Regulations approved by the Board and available in the Corporate Governance section of our corporate website (www.eurochemgroup.com).
Nomination and Remuneration Committee meetings and attendanceAs at 31 December 2018, the Committee had three members: Committee Chairman Sergey Vasnetsov (IND), Alexander Landia (NED) and Samir Brikho (IND).
In 2018, the Committee held six meetings in person. The 2018 attendance table is on page 71.
Nomination and Remuneration Committee
EuroChem Group AG Committees
Sergey Vasnetsov (IND) Chairman
Priorities
Key priorities for 2018 Overview of activity
Finalise the development of the short- and long-term incentive system for key personnel
■ Reviewed and approved the revised short-term and long-term incentive programmes
Oversee the Group management structure development
■ Oversaw the amendments to the Group management structure
Oversee the Group HR function development
■ Reviewed a number initiatives to develop the HR function, including enhancing recruitment, talent management and internal communication functions, developing and implementing talent management and career planning systems, developing a unified job grading and base salaries’ systems
Oversee development of the Succession Planning system
■ Reviewed the implementation plan for 2018-2028, and the budget
Review the HSE processes, implementation of the HSE development programme
■ Oversaw the development of a three-year HSE development programme for the Group
EuroChem Annual Report and Accounts 2018 79
Strategic Report Corporate Governance Financial Statements
“ The Committee continued to focus on the reorganisation of key processes and functions, with a view to driving further performance and productivity improvement in line with the KPI system.”
Corporate governance ■ Ensuring regular cooperation of the
Committee with executive bodies and HR service via business meetings and joint sessions on the Committee’s operational issues
■ Reviewing amendments to the management structure
■ Assessing Board performance, evaluating Board composition and required skills/diversity, redistributing tasks among Board members
HSE performance ■ Reviewing HSE performance at Group
companies on a regular basis
■ Overseeing the development of the HSE programme and the implementation of agreed action plan
Personnel strategy and policy ■ Endorsing HR budget for 2019
■ Overseeing development of short- and long-term incentive programmes
■ Reviewing 2019 targets for key personnel, evaluating results of individual target delivery by key personnel and providing recommendations to the Board
■ Overseeing the job evaluation project (grading)
■ Reviewing the recruitment and career planning projects
Appointments and incentives ■ Endorsing appointments and incentives
for key personnel, dismissals and terms of termination contracts (CEO, CFO)
■ Reviewing amendments to the terms of employment contracts with key personnel
Induction and professional development
■ Assessing succession planning including requirements and development plans
■ Overseeing development of the Group internal communications and a new intranet site.
Nomination and Remuneration Committee activity in 2018
Committee membership:
Members
3Number of meetings
6
Sergey Vasnetsov (IND), Alexander Landia (NED), Samir Brikho (IND)

80 EuroChem Annual Report and Accounts 2018
Financial Statements
81 Independent Auditors’ Report
86 Consolidated Statement of Financial Position
88 Consolidated Statement of Profit or Loss
89 Consolidated Statement of Comprehensive Income
90 Consolidated Statement of Cash Flows
92 Consolidated Statement of Changes in Equity
93 Notes to the Consolidated Financial Statements
155 Contact information
156 EuroChem reporting awards

Strategic Report Corporate Governance Financial Statements
EuroChem Annual Report and Accounts 2018 81
Independent Auditors’ Report
Report of the statutory auditor to the General Meeting of EuroChem Group AG, Zug
Report on the audit of the consolidated financial statementsOpinionWe have audited the consolidated financial statements of EuroChem Group AG and its subsidiaries (the Group), which comprise the consolidated statement of financial position as at 31 December 2018 and the consolidated statement of profit or loss, consolidated statement of comprehensive income, consolidated statement of cash flows and consolidated statement of changes in equity for the year then ended, and notes to the consolidated financial statements, (pages 86 to 154), including a summary of significant accounting policies.
In our opinion, the accompanying consolidated financial statements give a true and fair view of the consolidated financial position of the Group as at 31 December 2018 and its consolidated financial performance and its consolidated cash flows for the year then ended in accordance with the International Financial Reporting Standards (IFRS) and comply with Swiss law.
Basis for opinionWe conducted our audit in accordance with Swiss law, International Standards on Auditing (ISAs) and Swiss Auditing Standards. Our responsibilities under those provisions and standards are further described in the “Auditor’s responsibilities for the audit of the consolidated financial statements” section of our report.
We are independent of the Group in accordance with the provisions of Swiss law and the requirements of the Swiss audit profession, as well as the IESBA Code of Ethics for Professional Accountants, and we have fulfilled our other ethical responsibilities in accordance with these requirements. We believe that the audit evidence we have obtained is sufficient and appropriate to provide a basis for our opinion.
Our audit approach
Overall Group materiality: US$39.8 million • We conducted full scope audit work at 9 significant reporting units audited by component teams
in 6 countries.
• In addition, we performed an audit of significant financial statement line items of 8 reporting units, with the involvement of component teams in 4 countries.
• Our audit scope addressed 81% of the Group’s total revenue and 78% of the Group’s total assets.
As key audit matter the following area of focus has been identified:
• Impairment assessment of potash mine projects and related mineral rights
Overview
MaterialityThe scope of our audit was influenced by our application of materiality. Our audit opinion aims to provide reasonable assurance that the consolidated financial statements are free from material misstatement.
Misstatements may arise due to fraud or error. They are considered material if, individually or in aggregate, they could reasonably be expected to influence the economic decisions of users taken on the basis of the consolidated financial statements.
Based on our professional judgement, we determined certain quantitative thresholds for materiality, including the overall Group materiality for the consolidated financial statements as a whole as set out in the table below. These, together with qualitative considerations, helped us to determine the scope of our audit and the nature, timing and extent of our audit procedures and to evaluate the effect of misstatements, both individually and in aggregate, on the consolidated financial statements as a whole.
Overall Group materiality US$39.8 million
How we determined it 5% of average profit before tax for the last three years
Rationale for the materiality benchmark applied
We chose profit before tax as the benchmark because, in our view, it is the benchmark against which the performance of the Group is most commonly measured by users, and is a generally accepted benchmark. The use of the average number for the last three years helps dampen the potential effect of short-term volatility in fertiliser prices and foreign currency rates.

82 EuroChem Annual Report and Accounts 2018
Independent Auditors’ Report
Report of the statutory auditor continued
to the General Meeting of EuroChem Group AG, Zug
Audit scopeWe tailored the scope of our audit in order to perform sufficient work to enable us to provide an opinion on the consolidated financial statements as a whole, taking into account the structure of the Group, the accounting processes and controls, and the industry in which the Group operates.
As part of designing our audit, we determined materiality and assessed the risks of material misstatement in the consolidated financial statements. In particular, we considered where subjective judgements were made by management; for example, in respect of significant accounting estimates that involved making assumptions and considering future events that are inherently uncertain. We also addressed the risk of management override of internal controls, including among other matters consideration of whether there was evidence of bias that represented a risk of material misstatement due to fraud.
The Group’s consolidated financial statements are prepared based on the financial information of its components, i.e. individual companies of the Group, and represent a consolidation of over 80 companies in over 20 countries comprising the Group’s operating business and head office functions.
For the purpose of the Group audit, the significance of components was assessed based on the component’s individual share (more than 10%) of the Group’s revenue, expenses, total assets or total liabilities.
If we considered a component to be significant, we performed a full scope audit, which involved an audit of its financial information based on the materiality level determined for the component in the context of the Group audit. In certain cases, when additional audit evidence for the purpose of expressing our opinion on the consolidated financial statements was required, we performed audit procedures for individual financial statement line items and types of transactions on selected components of the Group. We selected these components for audit procedures on individual balances and types of transactions separately for each financial statement line item included in the scope of our audit, considering the level of audit evidence obtained from the audit of the financial information of significant components.
In the audit process, the group engagement team worked closely with component audit teams in Germany, Belgium, Russian Federation, United States of America, Brazil and Lithuania. As part of providing direction and supervision over the work of the component auditors, we determined the nature and extent of the audit procedures for components of the Group to ensure that we performed enough work to be able to give an opinion on the consolidated financial statements as a whole.
For the purpose of our audit procedures over certain complex and specific areas, we also engaged specialists in taxation, IFRS application, as well as experts in the valuation of non-current assets and pension liabilities.
Overall, audit procedures performed at the level of significant components and other components of the Group, including testing of selected controls, detailed testing, analytical procedures and procedures on the consolidation provided us with a coverage of 81% of the Group’s total revenue and 78% of the Group’s total assets.
By performing the procedures at components, combined with additional procedures at the Group level, we have obtained sufficient and appropriate audit evidence regarding the financial information of the Group as a whole to provide a basis for our opinion on the consolidated financial statements.
Key audit mattersKey audit matters are those matters that, in our professional judgement, were of most significance in our audit of the consolidated financial statements of the current period. These matters were addressed in the context of our audit of the consolidated financial statements as a whole, and in forming our opinion thereon, and we do not provide a separate opinion on these matters.

Strategic Report Corporate Governance Financial Statements
EuroChem Annual Report and Accounts 2018 83
Impairment assessment of potash mine projects and related mineral rights
Key audit matter How our audit addressed the key audit matter
As at 31 December 2018, the carrying amount of non-current assets (property, plant and equipment, construction in progress and mineral rights) related to two potash mine projects, Verkhnekamskoe in the Perm and Gremyachinskoe in the Volgograd region (the “Potash mine projects”), is US$3,246 million, including mineral rights of US$130 million.
We continued to focus on the impairment assessment of the Potash mine projects and related mineral rights due to the significance of these assets to the consolidated financial statements (about 42% of total non-current assets as at 31 December 2018) and the subjective nature of judgements and assumptions that management are required to make in determining whether there are impairment indicators and in performing an impairment assessment, which are affected by the projected future market and economic terms that are inherently uncertain.
In 2018, production commenced at Verkhnekamskoe field, while Gremyachinskoe field continued to be under construction as at 31 December 2018.
Management considered the long-term development period, requirements for timely completion of projects, possible delays in reaching full production capacity and license compliance as potential impairment indicators as at 31 October 2018 and therefore proceeded with a full impairment assessment of these assets.
Under the impairment assessment, management updated value in use models based on discounted cash flows (DCF). The Group’s management performed analysis of the business performance, industry outlook and operational plans and calculated the recoverable amounts of non-current assets including mineral rights by cash generating unit.
Management assessed the risk of possible delays in: • the construction and development of the potash deposits including the ones
resulting from the water inflow at one of the shafts at Gremyachinskoe field, and
• the production reaching full capacity at Verkhnekamskoe field,
which may result in the risk of non-compliance with the terms of the mining licenses and potential impairment of the related non-current assets.
Management has compared the recoverable amount of non-current assets related to the two potash mine projects, including mineral rights, determined as their value in use, with the carrying amount of these assets and concluded that no impairment should be recognised in respect of these assets as at 31 December 2018.
Refer to Note 2 ‘Basis of preparation and significant accounting policies’, 9 ‘Mineral rights’ and Note 8 ‘Property, plant and equipment’ for more information.
We obtained the valuation models for each Potash mine project (discounted cash flow models) used by management to determine the recoverable amount of the relevant assets. We engaged our internal valuation experts to assist us in evaluating the methodology and assumptions used in the impairment assessment described below.
Our audit procedures related to management’s assessment of non-current assets impairment of Potash mine projects and related mineral rights included:
• analysis of the methodology used by management for the impairment test;
• examination of the mathematical accuracy of the valuation models for each potash mine project;
• assessment of key assumptions such as macroeconomic forecasts: inflation rates, foreign exchange rates, future market potash prices, and those specific to the Group: capital investments, sales volumes and discount rate (weighted average cost of capital (WACC)) applied and whether these are in line with the approved budgets and strategy – the Group’s potash strategy for 2019-2023, external available and reliable sources (including macroeconomic forecasts);
• comparison, on a sample basis and with the benefit of hindsight, of the accuracy of budgets used in prior year valuation models with the actual results of the current year;
• re-performance of sensitivity analysis around the key assumptions such as future market potash prices, discount rate, sales volume, capital investments, foreign exchange rates and inflation rates to ascertain the extent of change in those assumptions that either individually or collectively would be required for the non-current assets and mineral rights to be impaired;
• obtaining management’s and Board of Directors’ written representations related to the impairment test including their position in relation to the partial water inflow and its effect for the overall development of the potash mine project in the Volgograd region.
Our audit procedures in relation to management’s assessment of the risk of possible delays in the construction and development of the potash deposits and production reaching full capacity at Verkhnekamskoe field, which may result in the risk of non-compliance with the terms of the mining licenses and potential impairment of the related non-current assets and mineral rights, comprised:
• testing of compliance with the key terms of the licenses, including analysis of supporting documentation provided by management to confirm that all key dates and key terms stated in the licenses have been complied with, on a sample basis;
• interviews with geologists responsible for the potash projects and discussion of the stage of the mining processes, as well as the current estimate of reserves;
• obtaining confirmation from management and the Board of Directors that they regularly monitor the status of the development and production stages of the potash mine projects, the companies are ready to execute the terms of the licenses with respect to mining conditions, all required reports have been submitted on a timely basis and there have been no issues of non-compliance with the terms of mining licenses.
Based on the above procedures, we found that the key assumptions and judgements used for the assessment of impairment for the potash mine projects in the Perm and Volgograd regions are reasonable, consistently applied and supported by the available evidence. Finally, we compared the recoverable amount of the non-current assets related to the Potash mine projects, including mineral rights, determined as their fair value in use, with the carrying amount of these assets. As a result of the performed procedures we concur with the conclusion that an impairment is not required.

84 EuroChem Annual Report and Accounts 2018
Other information in the annual reportThe Board of Directors is responsible for the other information in the annual report. The other information comprises all information included in the annual report, but does not include the consolidated financial statements of EuroChem Group AG and our auditor’s report thereon. The annual report is expected to be made available to us after the date of this auditor’s report.
Our opinion on the consolidated financial statements does not cover the other information in the annual report and we will not express any form of assurance conclusion thereon.
In connection with our audit of the consolidated financial statements, our responsibility is to read the other information in the annual report when it becomes available and, in doing so, consider whether the other information is materially inconsistent with the consolidated financial statements or our knowledge obtained in the audit, or otherwise appears to be materially misstated.
Responsibilities of the Board of Directors for the consolidated financial statementsThe Board of Directors is responsible for the preparation of the consolidated financial statements that give a true and fair view in accordance with IFRS and the provisions of Swiss law, and for such internal control as the Board of Directors determines is necessary to enable the preparation of consolidated financial statements that are free from material misstatement, whether due to fraud or error.
In preparing the consolidated financial statements, the Board of Directors is responsible for assessing the Group’s ability to continue as a going concern, disclosing, as applicable, matters related to going concern and using the going concern basis of accounting unless the Board of Directors either intends to liquidate the Group or to cease operations, or has no realistic alternative but to do so.
Auditor’s responsibilities for the audit of the consolidated financial statementsOur objectives are to obtain reasonable assurance about whether the consolidated financial statements as a whole are free from material misstatement, whether due to fraud or error, and to issue an auditor’s report that includes our opinion. Reasonable assurance is a high level of assurance, but is not a guarantee that an audit conducted in accordance with Swiss law, ISAs and Swiss Auditing Standards will always detect a material misstatement when it exists. Misstatements can arise from fraud or error and are considered material if, individually or in the aggregate, they could reasonably be expected to influence the economic decisions of users taken on the basis of these consolidated financial statements.
As part of an audit in accordance with Swiss law, ISAs and Swiss Auditing Standards, we exercise professional judgment and maintain professional scepticism throughout the audit. We also:
• Identify and assess the risks of material misstatement of the consolidated financial statements, whether due to fraud or error, design and perform audit procedures responsive to those risks, and obtain audit evidence that is sufficient and appropriate to provide a basis for our opinion. The risk of not detecting a material misstatement resulting from fraud is higher than for one resulting from error, as fraud may involve collusion, forgery, intentional omissions, misrepresentations, or the override of internal control.
• Obtain an understanding of internal control relevant to the audit in order to design audit procedures that are appropriate in the circumstances, but not for the purpose of expressing an opinion on the effectiveness of the Group’s internal control.
• Evaluate the appropriateness of accounting policies used and the reasonableness of accounting estimates and related disclosures made.
• Conclude on the appropriateness of the Board of Directors’ use of the going concern basis of accounting and, based on the audit evidence obtained, whether a material uncertainty exists related to events or conditions that may cast significant doubt on the Group’s ability to continue as a going concern. If we conclude that a material uncertainty exists, we are required to draw attention in our auditor’s report to the related disclosures in the consolidated financial statements or, if such disclosures are inadequate, to modify our opinion. Our conclusions are based on the audit evidence obtained up to the date of our auditor’s report. However, future events or conditions may cause the Group to cease to continue as a going concern.
• Evaluate the overall presentation, structure and content of the consolidated financial statements, including the disclosures, and whether the consolidated financial statements represent the underlying transactions and events in a manner that achieves fair presentation.
• Obtain sufficient appropriate audit evidence regarding the financial information of the entities or business activities within the Group to express an opinion on the consolidated financial statements. We are responsible for the direction, supervision and performance of the Group audit. We remain solely responsible for our audit opinion.
Independent Auditors’ Report
Report of the statutory auditor continued
to the General Meeting of EuroChem Group AG, Zug

Strategic Report Corporate Governance Financial Statements
EuroChem Annual Report and Accounts 2018 85
We communicate with the Board of Directors or its relevant committee regarding, among other matters, the planned scope and timing of the audit and significant audit findings, including any significant deficiencies in internal control that we identify during our audit.
We also provide the Board of Directors or its relevant committee with a statement that we have complied with relevant ethical requirements regarding independence, and to communicate with them all relationships and other matters that may reasonably be thought to bear on our independence, and where applicable, related safeguards.
From the matters communicated with the Board of Directors or its relevant committee, we determine those matters that were of most significance in the audit of the consolidated financial statements of the current period and are therefore the key audit matters. We describe these matters in our auditor’s report unless law or regulation precludes public disclosure about the matter or when, in extremely rare circumstances, we determine that a matter should not be communicated in our report because the adverse consequences of doing so would reasonably be expected to outweigh the public interest benefits of such communication.
Report on other legal and regulatory requirementsIn accordance with article 728a paragraph 1 item 3 CO and Swiss Auditing Standard 890, we confirm that an internal control system exists which has been designed for the preparation of consolidated financial statements according to the instructions of the Board of Directors.
We recommend that the consolidated financial statements submitted to you be approved.
PricewaterhouseCoopers AG
Joanne Burgener Christopher VohrerAudit expert Audit expertAuditor in charge
Zug, 6 February 2019
Enclosure: Consolidated financial statements (consolidated statement of financial position, consolidated statement of profit or loss, consolidated statement of comprehensive income, consolidated statement of cash flows, consolidated statement of changes in equity and notes)

86 EuroChem Annual Report and Accounts 2018
(all amounts are presented in thousands of US dollars, unless otherwise stated)
Note31 December
201831 December
2017, adjusted1 January
2017, adjusted
ASSETS
Non-current assets:
Property, plant and equipment 8 6,666,090 6,918,004 5,297,313
Mineral rights 9 315,753 372,809 455,488
Goodwill 10 475,797 516,830 468,223
Intangible assets 11 102,838 142,924 163,625
Investment in associates and joint ventures 12 38,198 43,152 36,500
Originated loans 3,864 51,046 53,178
Restricted cash 15 2,276 22,345 18,170
Derivative financial assets 21 – 7,189 –
Deferred income tax assets 31 82,613 55,360 112,517
Other non-current assets 71,011 52,199 83,690
Total non-current assets 7,758,440 8,181,858 6,688,704
Current assets:
Inventories 13 1,044,690 781,622 713,919
Trade receivables 14 366,836 288,959 267,786
Prepayments, other receivables and other current assets 14 289,201 326,637 315,185
Income tax receivable 15,428 58,999 32,133
Originated loans – – 412
Restricted cash 15 2,850 20,101 45,994
Derivative financial assets 21 1,126 18,955 13,602
Fixed-term deposits 15 1,801 151 294
Cash and cash equivalents 15 341,911 228,613 285,605
Total current assets 2,063,843 1,724,037 1,674,930
TOTAL ASSETS 9,822,283 9,905,895 8,363,634
The accompanying notes on pages 93-154 are an integral part of these consolidated financial statements.
Consolidated Statement of Financial Positionas at 31 December 2018

Strategic Report Corporate Governance Financial Statements
EuroChem Annual Report and Accounts 2018 87
(all amounts are presented in thousands of US dollars, unless otherwise stated)
Note31 December
201831 December
2017, adjusted1 January
2017, adjusted
LIABILITIES AND EQUITY
Equity attributable to owners of the parent:
Share capital 17 111 111 111
Cumulative currency translation differences (2,403,963) (1,347,833) (1,749,745)
Retained earnings and other reserves 6,578,487 5,442,999 4,993,073
4,174,635 4,095,277 3,243,439
Non-controlling interests 117 165 1,371
Total equity 4,174,752 4,095,442 3,244,810
Non-current liabilities:
Bank borrowings and other loans received 18 2,003,275 1,110,205 1,305,671
Project Finance 19 420,070 959,373 573,022
Bonds issued 20 1,211,261 1,512,413 824,848
Derivative financial liabilities 21 57,103 – 75,209
Deferred income tax liabilities 31 212,721 231,259 214,290
Other non-current liabilities and deferred income 22 178,057 192,401 166,456
Total non-current liabilities 4,082,487 4,005,651 3,159,496
Current liabilities:
Bank borrowings and other loans received 18 371,133 770,405 1,075,418
Project Finance 19 21,612 – –
Bonds issued 20 215,850 87,091 323,856
Derivative financial liabilities 21 12,629 61,821 703
Trade payables 24 470,264 513,004 284,549
Other accounts payable and accrued expenses 24 407,191 334,519 221,396
Income tax payable 37,539 10,909 18,912
Other taxes payable 28,826 27,053 34,494
Total current liabilities 1,565,044 1,804,802 1,959,328
Total liabilities 5,647,531 5,810,453 5,118,824
TOTAL LIABILITIES AND EQUITY 9,822,283 9,905,895 8,363,634
The accompanying notes on pages 93-154 are an integral part of these consolidated financial statements.

88 EuroChem Annual Report and Accounts 2018
(all amounts are presented in thousands of US dollars, unless otherwise stated)
Note 2018 2017
Sales 25 5,577,472 4,865,664
Cost of sales 26 (3,437,727) (3,079,029)
Gross profit 2,139,745 1,786,635
Distribution costs 27 (744,985) (701,487)
General and administrative expenses 28 (208,292) (217,775)
Other operating income/(expenses), net 29 2,956 (35,100)
Operating profit 1,189,424 832,273
Share of profit/(loss) from associates and joint ventures, net 3,395 (2,803)
Gain/(loss) from disposal of subsidiaries, net (45,753) (60,205)
Interest income 8,130 11,864
Interest expense (94,480) (131,393)
Financial foreign exchange gain/(loss), net (162,070) 569
Other financial gain/(loss), net 30 (159,804) 46,305
Profit before taxation 738,842 696,610
Income tax expense 31 (200,421) (243,244)
Profit 538,421 453,366
Profit/(loss) attributable to:
Owners of the parent 538,448 453,466
Non-controlling interests (27) (100)
538,421 453,366
Earnings per share – basic and diluted 32 538.45 453.47
The accompanying notes on pages 93-154 are an integral part of these consolidated financial statements.
Consolidated Statement of Profit or Lossfor the year ended 31 December 2018

Strategic Report Corporate Governance Financial Statements
EuroChem Annual Report and Accounts 2018 89
(all amounts are presented in thousands of US dollars, unless otherwise stated)
Consolidated Statement of Comprehensive Incomefor the year ended 31 December 2018
Note 2018 2017
Profit 538,421 453,366
Other comprehensive income/(loss) that may be reclassified to profit or loss in subsequent periods
Currency translation differences (1,080,523) 402,254
Share of other comprehensive income/(loss) of associates and joint ventures, net 12 (917) (247)
Currency translation differences on disposed subsidiaries reclassified to profit or loss 16 25,289 –
Total other comprehensive income/(loss) that may be reclassified to profit or loss in subsequent periods (1,056,151) 402,007
Other comprehensive income/(loss) that will not be reclassified to profit or loss in subsequent periods
Remeasurements of post-employment benefit obligations, net of tax 1,361 (390)
Change in fair value of financial assets measured at fair value through other comprehensive income (4,321) –
Total other comprehensive income/(loss) for the period that will not be reclassified to profit or loss in subsequent periods (2,960) (390)
Total other comprehensive income/(loss) (1,059,111) 401,617
Total comprehensive income/(loss) (520,690) 854,983
Total comprehensive income/(loss) attributable to:
Owners of the parent (520,642) 854,988
Non-controlling interests (48) (5)
(520,690) 854,983
The accompanying notes on pages 93-154 are an integral part of these consolidated financial statements.

90 EuroChem Annual Report and Accounts 2018
(all amounts are presented in thousands of US dollars, unless otherwise stated)
Note 2018 2017
Operating profit 1,189,424 832,273
Income tax paid (140,364) (177,255)
Operating profit less income tax paid 1,049,060 655,018
Depreciation and amortisation 28 308,336 277,090
(Gain)/loss on disposals, impairment and write-off of property, plant and equipment, net 7,570 10,314
Change in ECL allowance of receivables and provision for obsolete and damaged inventories, net 18,276 19,953
Other non-cash (income)/expenses, net (41,820) (18,384)
Gross cash flow 1,341,422 943,991
Cash proceeds/(payments) on operation derivatives, net (38,935) 25,155
Changes in operating assets and liabilities:
Trade receivables (119,787) (7,547)
Advances to suppliers 14,282 (49,582)
Other receivables (16,228) (13,257)
Inventories (403,778) (35,587)
Trade payables 46,425 104,735
Advances from customers 90,563 16,961
Other payables 49,809 22,603
Restricted cash 17,942 41,148
Net cash – operating activities 981,715 1,048,620
Cash flows from investing activities
Capital expenditure on property, plant and equipment and intangible assets (1,100,134) (1,479,152)
Purchase of mineral rights (357) –
Other payments related to mineral rights (10,913) (10,374)
Deferred payment for investment in associate/Investment in associate (2,769) (4,517)
Investment in joint venture – (1,997)
Proceeds from sale of interest in associate 33 – 60,749
Acquisition of subsidiaries, net of cash acquired – (3,204)
Deferred compensation related to business combination, paid (3,004) (6,795)
Proceeds from sale of property, plant and equipment 589 4,828
Proceeds from sale of subsidiary – 225,174
Net change in fixed-term deposits (1,701) 137
Originated loans (503) (38,554)
Repayment of originated loans 24,100 11,963
Interest received 7,783 13,488
Other investing activities 11,369 (9,414)
Net cash – investing activities (1,075,540) (1,237,668)
Free cash inflow/(outflow) (93,825) (189,048)
The accompanying notes on pages 93-154 are an integral part of these consolidated financial statements.
Consolidated Statement of Cash Flowsfor the year ended 31 December 2018

Strategic Report Corporate Governance Financial Statements
EuroChem Annual Report and Accounts 2018 91
(all amounts are presented in thousands of US dollars, unless otherwise stated)
Note 2018 2017
Cash flows from financing activities
Proceeds from bank borrowings and other loans received 2,723,656 3,128,323
Funds received under the Project Finance Facilities 219,309 416,938
Repayment of bank borrowings and other loans (2,136,094) (3,655,674)
Repayment of Project Finance Facility 19 (750,000) –
Proceeds from bonds, net of transaction costs – 767,522
Repayment of bonds (79,697) (324,033)
Prepaid and additional transaction costs related to bank borrowings and bonds (10,898) (17,129)
Prepaid and additional transaction costs related to Project Finance Facilities (5,285) (4,463)
Interest paid (219,873) (210,585)
Cash proceeds/(payments) on derivatives, net 21 (110,572) 24,316
Capital contribution 17 600,000 –
Dividends paid to non-controlling interests in subsidiary – (598)
Other financial activities (3,972) (3,214)
Net cash – financing activities 226,574 121,403
Effect of exchange rate changes on cash and cash equivalents (19,451) 10,653
Net increase/(decrease) in cash and cash equivalents 113,298 (56,992)
Cash and cash equivalents at the beginning of the period 15 228,613 285,605
Cash and cash equivalents at the end of the period 15 341,911 228,613
The accompanying notes on pages 93-154 are an integral part of these consolidated financial statements.

92 EuroChem Annual Report and Accounts 2018
(all amounts are presented in thousands of US dollars, unless otherwise stated)
Attributable to owners of the parent
Share capital
Cumulative currency
translation differences
Retained earnings and
other reserves Total
Non-controlling interests Total equity
Balance at 31 December 2016 as previously reported 111 (1,749,745) 4,966,855 3,217,221 1,371 3,218,592
Adjustment due to change in accounting policy for transportation expenses (Note 2) – – 26,218 26,218 – 26,218
Balance at 1 January 2017, adjusted 111 (1,749,745) 4,993,073 3,243,439 1,371 3,244,810
Comprehensive income/(loss)
Profit/(loss) – – 453,466 453,466 (100) 453,366
Other comprehensive income/(loss)
Currency translation differences – 402,159 – 402,159 95 402,254
Share of other comprehensive income/(loss) of associates and joint ventures, net – (247) – (247) – (247)
Remeasurements of post-employment benefit obligations, net of tax – – (390) (390) – (390)
Total other comprehensive income/(loss) – 401,912 (390) 401,522 95 401,617
Total comprehensive income/(loss) – 401,912 453,076 854,988 (5) 854,983
Transactions with owners
Dividends paid to non-controlling interests in subsidiaries – – – – (598) (598)
Acquisition of additional interest in subsidiary – – – – (603) (603)
Total transactions with owners – – – – (1,201) (1,201)
Balance at 31 December 2017 111 (1,347,833) 5,446,149 4,098,427 165 4,098,592
Adjustment due to adoption of IFRS 9 (Note 2) – – (3,150) (3,150) – (3,150)
Balance at 1 January 2018, adjusted 111 (1,347,833) 5,442,999 4,095,277 165 4,095,442
Comprehensive income/(loss)
Profit/(loss) – – 538,448 538,448 (27) 538,421
Other comprehensive income/(loss)
Currency translation differences – (1,080,502) – (1,080,502) (21) (1,080,523)
Share of other comprehensive income/(loss) of associates and joint ventures, net – (917) – (917) – (917)
Currency translation differences on disposed subsidiaries reclassified to profit or loss – 25,289 – 25,289 – 25,289
Change in fair value of financial assets measured at fair value through other comprehensive income – – (4,321) (4,321) – (4,321)
Remeasurements of post-employment benefit obligations, net of tax – – 1,361 1,361 – 1,361
Total other comprehensive income/(loss) – (1,056,130) (2,960) (1,059,090) (21) (1,059,111)
Total comprehensive income/(loss) – (1,056,130) 535,488 (520,642) (48) (520,690)
Transactions with owners
Capital contribution (Note 17) – – 600,000 600,000 – 600,000
Total transactions with owners – – 600,000 600,000 – 600,000
Balance at 31 December 2018 111 (2,403,963) 6,578,487 4,174,635 117 4,174,752
Consolidated Statement of Changes in Equityfor the year ended 31 December 2018

Strategic Report Corporate Governance Financial Statements
EuroChem Annual Report and Accounts 2018 93
(all amounts are presented in thousands of US dollars, unless otherwise stated)
Notes to the Consolidated Financial Statementsfor the year ended 31 December 2018
1. EuroChem Group and its operationsEuroChem Group comprises the parent entity, EuroChem Group AG (the “Company”) and its subsidiaries (collectively the “Group” or “EuroChem Group”). The Company was incorporated under the laws of Switzerland on 16 July 2014 and has its registered office at: Baarerstrasse 37, 6300, Zug, Switzerland.
These consolidated financial statements were authorised for issue by the Board of Directors of the Company on 6 February 2019.
A company that holds business interests beneficially for Mr. Andrey Melnichenko indirectly owns 100% of AIM Capital S.E., registered in the Republic of Cyprus (31 December 2017: 100%), which in turn owns 90% (31 December 2017: 90%) of the share capital of EuroChem Group AG. The remaining 10% of the Company are held indirectly by Mr. Dmitry Strezhnev (31 December 2017: 10%).
The Group’s principal activity is the production of mineral fertilizers (nitrogen- and phosphate-based) as well as mineral extraction (apatite, phosphate rock, iron-ore, baddeleyite and potash), and the operation of a distribution network. The Group is developing two potassium salts deposits. Test production of potassium fertilizer began at EuroChem Usolskiy, from the Verkhnekamskoe deposit, in the first half of 2018. The Group’s main production facilities are located in Russia, Lithuania, Belgium, Kazakhstan and China (the joint venture’s production facilities). The Group’s distribution assets are located globally across Europe, Russia, North and Latin America, and Central and South-East Asia.
2. Basis of preparation and significant accounting policies Basis of preparationThese consolidated financial statements have been prepared in accordance with International Financial Reporting Standards (“IFRS”) under the historical cost convention, as modified by the initial recognition of financial instruments based on fair value and derivative financial instruments, which are accounted for at fair value.
The principal accounting policies applied in the preparation of these consolidated financial statements are set out below. Apart from the accounting policy changes resulting from the adoption of IFRS 9 and IFRS 15 effective from 1 January 2018 and amendments to the accounting policy for transportation expenses, these policies have been consistently applied to all periods presented, unless otherwise stated. The principal accounting policies in respect of financial instruments and revenue recognition applied till 31 December 2017 are presented accordingly.
Disclosure of changes in applying accounting policiesEffective 1 January 2018, the Group applies changes in accounting policy for transportation expenses which are to be capitalised as a part of inventory until the moment of sale. This change in approach is driven by the global expansion of the Group’s distribution network and the increasing share of sales to the final end users of its products.
The Group adopted the following new and amended standards effective 1 January 2018:
IFRS 9, Financial Instruments. The Group used an exemption in IFRS 9 allowing it not to restate prior periods presented as a result of adoption of the new measurement requirements, but rather recognise any differences in the retained earnings as at 1 January 2018. The standard requires the financial assets to be classified in the following measurement categories: those to be measured subsequently at amortised cost, those to be measured at fair value through profit or loss, and those to be measured at fair value through other comprehensive income. The initial application of the standard did not result in any reclassifications of the Group’s financial instruments or any material changes in their measurement, therefore, the opening retained earnings were not adjusted. The standard also introduces the expected credit losses impairment model, which means that anticipated as opposed to incurred credit losses will be recognised resulting in earlier recognition of impairment.
IFRS 15, Revenue from Contracts with Customers. The standard outlines the principles an entity must apply to measure and recognise revenue. As the majority of the Group’s revenue is derived from arrangements in which the transfer of control coincides with the transfer of risk and rewards, the changes in respect of the timing and amount of revenue recognised do not have a material impact on these consolidated financial statements.

94 EuroChem Annual Report and Accounts 2018
(all amounts are presented in thousands of US dollars, unless otherwise stated)
Notes to the Consolidated Financial Statementsfor the year ended 31 December 2018 continued
2. Basis of preparation and significant accounting policies continuedAt 1 January 2017, the effect of changes was as follows:
Balance at 31 December 2016,
as previously reported
Adjustment, accounting
policy
Balance at 1 January 2017,
adjusted
Inventories/finished goods 678,754 35,165 713,919
Deferred income tax assets 121,464 (8,947) 112,517
Retained earnings and other reserves 4,966,855 26,218 4,993,073
Total equity attributable to owners of the parent 3,217,221 26,218 3,243,439
At 1 January 2018, the effect of changes was as follows:
Balance at 31 December 2017,
as previously reported
Adjustment, accounting
policyAdjustment,
IFRS 9
Balance at 1 January 2018,
adjusted
Trade receivables/ (ECL allowance) 293,101 – (4,142) 288,959
Inventories 746,457 35,165 – 781,622
Deferred income tax assets 63,315 (8,947) 992 55,360
Retained earnings and other reserves 5,419,931 26,218 (3,150) 5,442,999
Total equity attributable to owners of the parent 4,072,209 26,218 (3,150) 4,095,277
The adjusted consolidated statements of financial position as of 1 January 2017 and 1 January 2018 are presented in these consolidated financial statements as a result of the above changes.
Changes in presentationFor the segment reporting, sales to Mexico are reallocated from Latin America to North America (Note 7).
Since 2018 the Group has elected to present a statement of profit or loss and a statement of comprehensive income, rather than a single statement of profit or loss and other comprehensive income combining the two elements. Comparatives are presented in two statements accordingly.
Functional and presentation currencyThe functional currency of each of the Group’s entities is the currency of the primary economic environment in which the entity operates.
While the Company’s functional currency is the US dollar (“US$”), the functional currency for each of the Group’s subsidiaries is determined separately. The functional currency of subsidiaries located in Russia is the Russian rouble (“RUB”); the functional currency of subsidiaries located in the Eurozone is the Euro (“EUR”), the functional currency of subsidiaries in North America and in Switzerland carrying trading activities is the US$.
Monetary assets and liabilities are translated into each entity’s functional currency at the official exchange rate at the respective reporting dates. Foreign exchange gains and losses resulting from the settlement of the transactions and from the translation of monetary assets and liabilities into each entity’s functional currency at year-end official exchange rates are recognised in profit and loss. Translation differences on non-monetary financial assets and liabilities such as equities held at fair value through profit and loss are recognised in profit and loss as part of the fair value gain or loss. Translation differences on non-monetary financial assets such as equities classified as financial instruments measured at fair value through other comprehensive income are recognised in other comprehensive income.
Foreign exchange gains and losses that relate to bank borrowings, third party loans, intragroup loans and deposits are presented in the consolidated statement of profit or loss in a separate line “Financial foreign exchange gain/(loss), net”. All other foreign exchange gains and losses are presented in the consolidated statement of profit or loss within “Other operating income/(expenses), net”.
Goodwill and fair value adjustments arising on the acquisition of a foreign entity are treated as assets and liabilities of the foreign entity and translated at the closing rate.

Strategic Report Corporate Governance Financial Statements
EuroChem Annual Report and Accounts 2018 95
(all amounts are presented in thousands of US dollars, unless otherwise stated)
The presentation currency of the Group is the US$ since the management considers the US$ to be more appropriate for the understanding and comparability of consolidated financial statements. The results and financial position of each of the Group’s subsidiaries were translated to the presentation currency as required by IAS 21, The Effects of Changes in Foreign Exchange Rates:
(i) assets and liabilities for each consolidated statement of financial position presented are translated at the closing rate at the date of that consolidated statement of financial position;
(ii) income and expenses for each consolidated statement of profit or loss are translated at monthly average exchange rates (unless this average is not a reasonable approximation of the cumulative effect of the rates prevailing on the transaction dates, in which case income and expenses are translated at the dates of the transactions);
(iii) components of equity are translated at a historical rate; and
(iv) all resulting exchange differences are recognised as currency translation differences in other comprehensive income.
At 31 December 2018, the official exchange rates were: US$1 = RUB 69.4706, US$1 = EUR 0.8743 (31 December 2017: US$1 = RUB 57.6002, US$1 = EUR 0.8364). Average rates for the year ended 31 December 2018 were: US$1 = RUB 62.7078, US$1 = EUR 0.8465 (2017: US$1 = RUB 58.3529, US$1 = EUR 0.8855).
Consolidated financial statementsSubsidiaries are entities (including structured entities) over which the Group has control. The Group controls an entity when the Group is exposed to, or has rights to, variable returns from its involvement with the entity and has the ability to affect those returns through its power over the entity. Subsidiaries are fully consolidated from the date on which control is transferred to the Group (acquisition date) and are deconsolidated from the date that control ceases.
The acquisition method of accounting is used to account for business combinations. Identifiable assets acquired and liabilities and contingent liabilities assumed in a business combination are measured at their fair values at the acquisition date, irrespective of the extent of any non-controlling interest. The Group measures non-controlling interest on a transaction-by-transaction basis, either at: (a) fair value, or (b) the non-controlling interest’s proportionate share of net assets of the acquiree.
Goodwill is measured by deducting the net assets of the acquiree from the aggregate of the consideration transferred for the acquiree, the amount of non-controlling interest in the acquiree and fair value of an interest in the acquiree held immediately before the acquisition date. Any negative amount (“negative goodwill” or “bargain purchase”) is recognised in profit or loss, after management reassesses whether it identified all the assets acquired and all liabilities and contingent liabilities assumed and reviews the appropriateness of their measurement.
The consideration transferred for the acquiree is measured at the fair value of the assets given up, equity instruments issued and liabilities incurred or assumed, including fair value of assets or liabilities from contingent consideration arrangements but excludes acquisition related costs such as advisory, legal, valuation and similar professional services. Transaction costs related to the acquisition and incurred for issuing equity instruments are deducted from equity; transaction costs incurred for issuing debt as part of the business combination are deducted from the carrying amount of the debt and all other transaction costs associated with the acquisition are expensed.
Intercompany transactions, balances and unrealised gains on transactions between Group companies are eliminated; unrealised losses are also eliminated unless the cost cannot be recovered.
The Company and all of its subsidiaries use uniform accounting policies consistent with the Group’s policies.
Non-controlling interest is that part of the net results and of the equity of a subsidiary attributable to interests which are not owned, directly or indirectly, by the Company. Non-controlling interest forms a separate component of the Group’s equity.
Purchases and sales of non-controlling interestsThe Group applies the economic entity model to account for transactions with owners of non-controlling interests that do not result in a loss of control. Any difference between the purchase consideration and the carrying amount of non-controlling interest acquired is recorded as a capital transaction directly in equity. The Group recognises the difference between sales consideration and carrying amount of non-controlling interest sold as a capital transaction in the consolidated statement of changes in equity.
Disposals of subsidiaries and associatesWhen the Group ceases to have control or significant influence, any retained interest is remeasured to its fair value at the date when control or significant influence is lost, with the change in carrying amount recognised in profit or loss.
96 EuroChem Annual Report and Accounts 2018
(all amounts are presented in thousands of US dollars, unless otherwise stated)
Notes to the Consolidated Financial Statementsfor the year ended 31 December 2018 continued
2. Basis of preparation and significant accounting policies continuedProperty, plant and equipmentProperty, plant and equipment are stated at historical cost, less accumulated depreciation and a provision for impairment, where required.
Subsequent costs are included in the asset’s carrying amount or recognised as a separate asset, as appropriate, only when it is probable that future economic benefits associated with the item will flow to the Group and the cost of the item can be measured reliably. The cost of replacing major parts or components of property, plant and equipment items is capitalised and the replaced part is retired. Minor repair and maintenance costs are expensed when incurred.
At each reporting date management assesses whether there is any indication of impairment of property, plant and equipment. If any such indication exists, management estimates the recoverable amount, which is determined as the higher of an asset’s fair value less costs of disposal and its value in use. The carrying amount is reduced to the recoverable amount and the impairment loss is recognised in profit or loss. An impairment loss recognised for an asset in prior years is reversed if there has been a change in the estimates used to determine the asset’s value in use or fair value less costs to sell.
Gains and losses on disposals determined by comparing proceeds with carrying amount are recognised in profit or loss.
Capitalisation of borrowing costsGeneral and specific borrowing costs directly attributable to the acquisition, construction or production of assets that necessarily take a substantial time to get ready for intended use or sale (qualifying assets) are capitalised as part of the costs of those assets, if the commencement date for capitalisation is on or after 1 January 2009. The commencement date for capitalisation is when (a) the Group incurs expenditures for the qualifying asset; (b) it incurs borrowing costs; and (c) it undertakes activities that are necessary to prepare the asset for its intended use or sale. Capitalisation of borrowing costs continues up to the date when the assets are substantially ready for their use or sale.
The Group capitalises borrowing costs that could have been avoided if it had not made capital expenditure on qualifying assets. Borrowing costs capitalised are calculated at the Group’s average funding cost (the weighted average interest cost is applied to the expenditures on the qualifying assets), except to the extent that funds are borrowed specifically for the purpose of obtaining a qualifying asset. Where this occurs, actual borrowing costs incurred less any investment income on the temporary investment of those borrowings are capitalised.
DepreciationLand as well as assets under construction are not depreciated. Depreciation of other items of property, plant and equipment (other than oil and gas and mining assets) is calculated using the straight-line method to allocate their cost to their residual values over their estimated useful lives from the time they are ready for use:
Depreciation method Useful lives in years (for straight-line method)
Buildings and land improvements straight-line/unit-of-production 15 to 85
Transfer devices straight-line/unit-of-production 25 to 50
Machinery and equipment straight-line 2 to 35
Transport straight-line 5 to 40
Other items straight-line 1 to 15
Depreciation of oil and gas and mining assets is calculated using the unit-of-production method.
The residual value of an asset is the estimated amount that the Group would currently obtain from disposing of the asset less the estimated costs of disposal, if the asset were already of the age and in the condition expected at the end of its useful life. The residual value of an asset is nil if the Group expects to use the asset until the end of its physical life. The assets’ residual values and useful lives are reviewed, and adjusted if appropriate, at each reporting date.
Remaining useful life of property, plant and equipmentManagement assesses the remaining useful life of property, plant and equipment in accordance with the current technical conditions of assets and the estimated period during which these assets will bring economic benefit to the Group.
Development expendituresDevelopment expenditures incurred by the Group are capitalised and accumulated separately in the assets under construction category for each area of interest in which economically recoverable resources have been identified. Such expenditures comprise cost directly attributable to the construction of a mine and the related infrastructure.

Strategic Report Corporate Governance Financial Statements
EuroChem Annual Report and Accounts 2018 97
(all amounts are presented in thousands of US dollars, unless otherwise stated)
Exploration assetsExploration and evaluation costs related to an area of interest are written off as incurred except where they are carried forward as an asset in the consolidated statement of financial position if the rights of the area of interest are current and it is considered probable that the costs will be recouped through successful development and exploitation of the area of interest. Capitalised costs include costs directly related to exploration and evaluation activities in the relevant area of interest. In accordance with IFRS 6, ‘Exploration for and Evaluation of Mineral Resources’, exploration assets are measured applying the cost model described in IAS 16, ‘Property, Plant and Equipment’ after initial recognition. Depreciation and amortisation are not calculated for exploration assets because the economic benefits that the assets represent are not consumed until the production phase. Capitalised exploration and evaluation expenditure is written off where the above conditions are no longer satisfied.
All capitalised exploration and evaluation expenditures are assessed for impairment if facts and circumstances indicate that impairment may exist. Exploration and evaluation assets are also tested for impairment once commercial reserves are found, before the assets are transferred to development properties.
Operating leasesWhere the Group is a lessee in a lease which does not transfer substantially all the risks and rewards incidental to ownership from the lessor to the Group, the total lease payments are charged to profit or loss on a straight-line basis over the period of the lease. The lease term is the non-cancellable period for which the lessee has contracted to lease the asset together with any further terms for which the lessee has the option to continue to lease the asset, with or without further payment, when at the inception of the lease it is reasonably certain that the lessee will exercise the option.
When assets are leased out under an operating lease, the lease payments receivable are recognised as rental income on a straight-line basis over the lease term.
GoodwillGoodwill is carried at cost less accumulated impairment losses, if any. The Group tests goodwill for impairment at least annually and whenever there are indications that goodwill may be impaired. The carrying value of CGU containing goodwill is compared to the relevant amount, which is the higher of value in use and the fair value less cost of disposal. Any impairment is recognised immediately as an expense and is not subsequently reversed. Goodwill is allocated to the cash-generating units, or groups of cash-generating units, that are expected to benefit from the synergies of the business combination. Such units or groups of units represent the lowest level at which the Group monitors goodwill and are not larger than an operating segment.
Gains or losses on disposal of an operation within a cash generating unit to which goodwill has been allocated include the carrying amount of goodwill associated with the operation disposed of, generally measured on the basis of the relative values of the operation disposed of and the portion of the cash-generating unit which is retained.
Mineral rightsMineral rights include rights for evaluation, exploration and production of mineral resources under the licences or agreements. Such assets are carried at cost, amortisation is charged on a straight-line basis over the shorter of the valid period of the license or the agreement, or the expected life of mine, starting from the date when production activities commence. The costs directly attributable to acquisition of rights for evaluation, exploration and production or related costs unavoidably arising from licences and related agreements (such as social and infrastructure objects construction) are capitalised as a part of the mineral rights. If the reserves related to the mineral rights are not economically viable, the carrying amount of such mineral rights is written off.
Mineral resources are recognised as assets when acquired as part of a business combination and then depleted using the unit-of-production method based on total proved mineral reserves. Proved mineral reserves reflect the economically recoverable quantities which can be legally recovered in the future from known mineral deposits and are determined by independent professional appraisers when acquired as part of a business combination and are subject to updates in future periods.
Intangible assets other than goodwillThe Group’s intangible assets other than goodwill have definite useful lives and primarily include acquired core process technology, distribution agreements, customer relationships, trademarks, capitalised computer software costs and other intangible assets.
These assets are capitalised on the basis of the costs incurred to acquire and bring them to use.

98 EuroChem Annual Report and Accounts 2018
(all amounts are presented in thousands of US dollars, unless otherwise stated)
Notes to the Consolidated Financial Statementsfor the year ended 31 December 2018 continued
2. Basis of preparation and significant accounting policies continuedIntangible assets other than goodwill continuedIntangible assets with definite useful lives are amortised using the straight-line method over their useful lives:
Useful lives in years
Land use rights 50
Know-how and production technology 5 to 18
Trademarks 15
Customer relationships 10
Distribution agreement 8
Software licences 5
The Group tests intangible assets for impairment whenever there are indications that intangible assets may be impaired.
If impaired, the carrying amount of intangible assets is written down to the higher of value in use and fair value less cost of disposal.
Impairment of non-financial assetsAssets that are subject to depreciation and amortisation are reviewed for impairment whenever events or changes in circumstances indicate that the carrying amount may not be recoverable. Prior impairments of non-financial assets (other than goodwill) are reviewed for possible reversal at each reporting date.
Financial instruments – key measurement termsFair value is the price that would be received to sell an asset or paid to transfer a liability in an orderly transaction between market participants at the measurement date. The best evidence of fair value is the price in an active market. An active market is one in which transactions for the asset or liability take place with sufficient frequency and volume to provide pricing information on an ongoing basis.
Fair value of financial instruments traded in an active market is measured as the product of the quoted price for the individual asset or liability and the number of instruments held by the entity. This is the case even if a market’s normal daily trading volume is not sufficient to absorb the quantity held and placing orders to sell the position in a single transaction might affect the quoted price. The quoted market price used to value financial assets is the current bid price; the quoted market price for financial liabilities is the current asking price.
Valuation techniques such as discounted cash flow models or models based on recent arm’s length transactions or consideration of financial data of the investees are used to measure fair value of certain financial instruments for which external market pricing information is not available.
Fair value measurements are analysed by level in the fair value hierarchy as follows: (i) level one are measurements at quoted prices (unadjusted) in active markets for identical assets or liabilities, (ii) level two measurements are valuations techniques with all material inputs observable for the asset or liability, either directly (that is, as prices) or indirectly (that is, derived from prices), and (iii) level three measurements are valuations not based on solely observable market data (that is, the measurement requires significant unobservable inputs).
Transaction costs are incremental costs that are directly attributable to the acquisition, issue or disposal of a financial instrument. An incremental cost is one that would not have been incurred if the transaction had not taken place. Transaction costs include fees and commissions paid to agents (including employees acting as selling agents), advisors, brokers and dealers, levies by regulatory agencies and securities exchanges, and transfer taxes and duties. Transaction costs do not include debt premiums or discounts, financing costs or internal administrative or holding costs.
Amortised cost is the amount at which the financial instrument was recognised at initial recognition less any principal repayments, plus accrued interest, and for financial assets less any allowance for expected credit losses (“ECL”). Accrued interest includes amortisation of transaction costs deferred at initial recognition and of any premium or discount to the maturity amount using the effective interest method. Accrued interest income and accrued interest expense, including both accrued coupon and amortised discount or premium (including fees deferred at origination, if any), are not presented separately and are included in the carrying values of the related items in the consolidated statement of financial position.
Strategic Report Corporate Governance Financial Statements
EuroChem Annual Report and Accounts 2018 99
(all amounts are presented in thousands of US dollars, unless otherwise stated)
The effective interest method is a method of allocating interest income or interest expense over the relevant period, so as to achieve a constant periodic rate of interest (effective interest rate) on the carrying amount. The effective interest rate is the rate that exactly discounts estimated future cash payments or receipts (excluding future credit losses) through the expected life of the financial instrument or a shorter period, if appropriate, to the net carrying amount of the financial instrument. The effective interest rate discounts cash flows of variable interest instruments to the next interest repricing date, except for the premium or discount which reflects the credit spread over the floating rate specified in the instrument, or other variables that are not reset to market rates. Such premiums or discounts are amortised over the whole expected life of the instrument. The present value calculation includes all fees paid or received between parties to the contract that are an integral part of the effective interest rate.
Classification and subsequent measurement of financial assetsFrom 1 January 2018, the Group classifies its financial assets in the following measurement categories:
• those to be measured subsequently at fair value (either through other comprehensive income or profit or loss), and
• those to be measured at amortised cost.
The classification depends on the Group’s business model for managing the financial assets and the contractual terms of the cash flows.
For debt instruments, the recognition of gains and losses depends on the business model in which the investment is held: Assets that are held for collection of contractual cash flows, where those cash flows represent solely payments of principal and interest, are measured at amortised cost. Interest income from these financial assets is included in finance income using the effective interest rate method. Any gains or losses arising from derecognition are recognised directly in profit or loss.
Assets that are held for collection of contractual cash flows and for sale, where the assets’ cash flows represent solely payments of principal and interest, are measured at fair value through other comprehensive income (FVOCI).
Assets that do not meet the criteria for amortised cost or FVOCI are measured at fair value through profit or loss (FVPL).
For investments in equity instruments that are not held for trading, when the Group has made an irrevocable election at the time of initial recognition to account for the equity investment at FVOCI, there is no subsequent reclassification of gains and losses to profit or loss. Dividends from such investments are recognised in profit or loss, when the Group’s right to receive payments is established. There are no impairment requirements for equity investments measured at FVOCI.
Trade and other receivablesTrade and other receivables are recognised initially at fair value and subsequently measured at amortised cost using the effective interest method, less ECL allowance.
Initial recognition of financial instrumentsDerivatives are initially recorded at their fair value. All other financial assets and liabilities are initially recorded at their fair value plus transaction costs. The fair value at initial recognition is best evidenced by the transaction price. A gain or loss on initial recognition is only recorded if there is a difference between the fair value and the transaction price which can be evidenced by other observable current market transactions in the same instrument or by a valuation technique whose inputs include only data from observable markets.
All purchases and sales of financial assets that require delivery within the time frame established by regulation or market convention (“regular way” purchases and sales) are recorded at their trade date, which is the date that the Group commits to deliver a financial asset. All other purchases are recognised when the Group becomes a party to the contractual provisions of the instrument.
Reclassification of financial assetsFinancial instruments are reclassified only when the business model for managing the portfolio as a whole changes. The reclassification takes place from the beginning of the first reporting period that follows after the change in the business model. The entity did not change its business model during the current and comparative period and did not make any reclassifications.
Financial assets impairment – credit loss allowance for ECLThe Group has changed the accounting policy for impairment losses of financial assets held at amortised cost by replacing the incurred loss model with an ECL model following the transition to IFRS 9.
Under IFRS 9, loss allowances are measured on either of the following bases: 12-month ECLs that result from default events that are possible within the 12 months after the reporting date; and lifetime ECLs that result from all possible default events over the expected life of a financial instrument.

100 EuroChem Annual Report and Accounts 2018
(all amounts are presented in thousands of US dollars, unless otherwise stated)
Notes to the Consolidated Financial Statementsfor the year ended 31 December 2018 continued
2. Basis of preparation and significant accounting policies continuedFinancial assets impairment – credit loss allowance for ECL continuedAs permitted by IFRS 9, the Group measures loss allowances for trade receivables applying a simplified approach at an amount equal to lifetime ECL. In calculating the expected credit loss, the Group considers the credit rating for each counterparty, adjusted with forward-looking factors specific to the debtors and economic environment in which they operate, and historical credit loss experience.
For other financial assets loss allowances are measured as 12-month ECL unless there has been a significant increase in credit risk since initial recognition or if the instrument contains a significant financing component. In those cases the allowance is based on the lifetime ECL.
The loans granted are analysed individually based on credit history of each borrower with the Group, financial performance and external credit ratings. The amount of ECL is assessed based on market risk premium that is taken as probability of default.
The Group recognises a loss allowance based on the difference between the contractual cash flows and all the cash flows that the Group expects to receive, discounted at the original effective interest rate. The calculation of the present value of the estimated future cash flows of a collateralised financial asset reflects the cash flows that may result from foreclosure less costs for obtaining and selling the collateral, whether or not foreclosure is probable.
Financial assets – write-offFinancial assets are written-off, in whole or in part, when the Group has exhausted all practical recovery efforts and concluded that there is no reasonable expectation of recovery. The Group may write off financial assets that are still subject to enforcement activity when it seeks to recover amounts that are contractually due but there is no reasonable expectation of recovery.
Modification of financial assetsThe Group sometimes renegotiates or otherwise modifies the contractual terms of the financial assets. The Group assesses whether the risks and rewards of the modified asset are substantially different as a result of the contractual modification by comparing the original and revised expected cash flows to assets. If the modified terms are substantially different, the Group derecognises the original financial asset and recognises a new asset at its fair value. If the risks and rewards do not change, the modification does not result in derecognition, the Group recalculates the gross carrying amount by discounting the modified contractual cash flows by the original effective interest rate, and recognises a modification gain or loss in profit or loss.
Derecognition of financial assetsThe Group derecognises financial assets when (i) the assets are redeemed or the rights to cash flows from the assets have otherwise expired or (ii) the Group has transferred substantially all the risks and rewards of ownership of the assets or (iii) the Group has neither transferred nor retained substantially all risks and rewards of ownership but has not retained control. Control is retained if the counterparty does not have the practical ability to sell the asset in its entirety to an unrelated third party without needing to impose additional restrictions on the sale.
Previous accounting policy applied to financial assets under IAS 39 till 31 December 2017Classification of financial assetsThe Group classified its financial assets into the following measurement categories: (a) loans and receivables; (b) available-for-sale financial assets; (c) financial assets held to maturity and (d) financial assets at fair value through profit and loss. Financial assets at fair value through profit and loss had two subcategories: (i) assets designated as such upon initial recognition, and (ii) those classified as held for trading.
Loans and receivables represented unquoted non-derivative financial assets with fixed or determinable payments other than those that the Group intended to sell in the near term. They were included in the current assets, except for those with maturities greater than 12 months after the reporting date, which were classified as non-current assets.
Reclassification of financial assetsThe Group might choose to reclassify a non-derivative trading financial asset out of the fair value through profit or loss category if the asset was no longer held for the purpose of selling it in the near term. Financial assets other than loans and receivables were permitted to be reclassified out of the fair value through profit or loss category only in rare circumstances arising from a single event that was unusual and highly unlikely to reoccur in the near term. Financial assets that met the definition of loans and receivables might be reclassified if the Group had the intention and ability to hold these financial assets for the foreseeable future or until maturity.
Strategic Report Corporate Governance Financial Statements
EuroChem Annual Report and Accounts 2018 101
(all amounts are presented in thousands of US dollars, unless otherwise stated)
Impairment of financial assets carried at amortised costImpairment losses were recognised in profit or loss when incurred as a result of one or more events (“loss events”) that occurred after the initial recognition of the financial asset and which had an impact on the amount or timing of the estimated future cash flows of the financial asset or group of financial assets that could be reliably estimated. If the Group determined that no objective evidence existed that impairment had been incurred for an individually assessed financial asset, whether significant or not, it included the asset in a group of financial assets with similar credit risk characteristics, and collectively assessed them for impairment. The primary factors that the Group considered in determining whether a financial asset was impaired were its overdue status and realisability of related collateral, if any. The following other principal criteria were also used to determine whether there was objective evidence that an impairment loss had occurred:
• the counterparty experienced a significant financial difficulty as evidenced by its financial information that the Group obtained;
• the counterparty considered bankruptcy or a financial reorganisation;
• there was adverse change in the payment status of the counterparty as a result of changes in the national or local economic conditions that impacted the counterparty; or
• the value of collateral, if any, significantly decreased as a result of deteriorating market conditions.
For the purposes of a collective evaluation of impairment, financial assets were grouped on the basis of similar credit risk characteristics. Those characteristics were relevant to the estimation of future cash flows for groups of such assets by being indicative of the debtors’ ability to pay all amounts due according to the contractual terms of the assets being evaluated. Future cash flows, in a group of financial assets that were collectively evaluated for impairment, were estimated on the basis of the contractual cash flows of the assets and the experience of management in respect of the extent to which amounts would become overdue as a result of past loss events and the success of recovery of overdue amounts. Past experience was adjusted on the basis of current observable data to reflect the effects of current conditions that did not affect past periods, and to remove the effects of past conditions that did not exist.
Impairment losses were always recognised through an allowance account to write down the asset’s carrying amount to the present value of expected cash flows (which excluded future credit losses that had not been incurred) discounted at the original effective interest rate of the asset. The calculation of the present value of the estimated future cash flows of a collateralised financial asset reflected the cash flows that might result from foreclosure less costs for obtaining and selling the collateral, whether or not foreclosure was probable.
If, in a subsequent period, the amount of the impairment loss decreased and the decrease could be related objectively to an event occurring after the impairment was recognised (such as an improvement in the debtor’s credit rating), the previously recognised impairment loss was reversed by adjusting the allowance account through profit or loss for the year.
Financial assets – write-offUncollectible assets were written off against the related impairment loss provision after all the necessary procedures to recover the asset had been completed and the amount of the loss had been determined.
Modification of financial assetsIf the terms of an impaired financial asset held at amortised cost were renegotiated or were otherwise modified because of financial difficulties of the counterparty, impairment was measured using the original effective interest rate before the modification of terms. The renegotiated asset was then derecognised and a new asset was recognised at its fair value only if the risks and rewards of the asset had substantially changed. This was normally evidenced by a substantial difference between the present values of the original cash flows and the new expected cash flows.
Classification and derecognition of financial liabilitiesThe Group’s financial liabilities have the following measurement categories: (a) derivative liabilities (see Derivative financial instruments below) and (b) other financial liabilities. Other financial liabilities are carried at amortised cost. The Group’s other financial liabilities comprise “trade and other payables”, “borrowings and bonds” and “Project Finance” in the consolidated statement of financial position. The Group derecognises financial liabilities when, and only when, the Group’s obligations are discharged, cancelled or they expire.
Derivative financial instrumentsThe Group’s derivative financial instruments comprise forwards, options and swap contracts in foreign exchange, securities and commodities. Derivative financial instruments, including forward rate agreements, options and interest rate swaps, are carried at their fair value. All derivative instruments are carried as assets when their fair value is positive and as liabilities when their fair value is negative. Changes in the fair value of derivative instruments are included in profit or loss (as financial gain/loss or operating income/expense) in the period in which they arise (Note 21).
The Group has no derivatives accounted for as hedges.

102 EuroChem Annual Report and Accounts 2018
(all amounts are presented in thousands of US dollars, unless otherwise stated)
Notes to the Consolidated Financial Statementsfor the year ended 31 December 2018 continued
2. Basis of preparation and significant accounting policies continuedOffsetting financial instrumentsFinancial assets and liabilities are offset and the net amount is reported in the consolidated statement of financial position only when there is a legally enforceable right to offset the recognised amounts, and there is an intention to either settle on a net basis, or to realise the asset and settle the liability simultaneously. Such a right to offset (a) must not be contingent on a future event and (b) must be legally enforceable in all of the following circumstances: (i) in the normal course of business, (ii) in the event of default and (iii) in the event of insolvency or bankruptcy.
AssociatesAssociates are entities over which the Group has significant influence (directly or indirectly), but not control, generally accompanying a shareholding of between 20 and 50 percent of the voting rights. Investments in associates are accounted for using the equity method of accounting and are initially recognised at cost, and the carrying amount is increased or decreased to recognise the investor’s share of the profit or loss of the investee after the date of acquisition. Dividends received from associates reduce the carrying value of the investment in associates. Post-acquisition changes in the Group’s share of net assets of an associate are recognised as follows: (i) the Group’s share of profits or losses of associates is recorded in the consolidated profit or loss for the year as the share of results of associates, (ii) the Group’s share of other comprehensive income is recognised in other comprehensive income and presented separately, (iii) all other changes in the Group’s share of the carrying value of net assets of associates are recognised in profit or loss within the share of results of associates.
However, when the Group’s share of losses in an associate equals or exceeds its interest in the associate, including any other unsecured receivables, the Group does not recognise further losses, unless it has incurred obligations or made payments on behalf of the associate. Unrealised gains on transactions between the Group and its associates are eliminated to the extent of the Group’s interest in the associates; unrealised losses are also eliminated unless the transaction provides evidence of an impairment of the asset transferred.
Joint arrangementsUnder IFRS 11, investments in joint arrangements are classified as either joint operations or joint ventures depending on the contractual rights and obligations of each investor. The Group has assessed the nature of its joint arrangements and determined them to be joint ventures. Joint ventures are accounted for using the equity method.
Under the equity method of accounting, interests in joint ventures are initially recognised at cost and adjusted thereafter to recognise the Group’s share of the post-acquisition profits or losses, or movements in other comprehensive income. When the Group’s share of losses in a joint venture equals or exceeds its interests in the joint ventures (which includes any long-term interests that, in substance, form part of the Group’s net investment in the joint ventures), the Group does not recognise further losses, unless it has incurred obligations or made payments on behalf of the joint ventures.
Unrealised gains on transactions between the Group and its joint ventures are eliminated to the extent of the Group’s interest in the joint ventures. Unrealised losses are also eliminated unless the transaction provides evidence of an impairment of the asset transferred. Accounting policies of the joint ventures have been changed where necessary to ensure consistency with the policies adopted by the Group.
Income taxesIncome taxes have been provided for in the consolidated financial statements in accordance with tax legislation enacted or substantively enacted by the reporting date for each country where the Group companies are registered. The income tax expense comprises current tax and deferred tax and is recognised in profit or loss unless it relates to transactions that are recognised in other comprehensive income or directly in equity.
The Group companies are subject to tax rates depending on the country of domicile (Note 31).
Current tax is the amount expected to be paid to or recovered from the tax authorities in respect of taxable profits or losses for the current and prior periods. Deferred income tax is provided using the balance sheet liability method for tax loss carry forwards and temporary differences arising between the tax bases of assets and liabilities and their carrying amounts for financial reporting purposes. In accordance with the initial recognition exemption, deferred taxes are not recorded for temporary differences on initial recognition of an asset or a liability in a transaction other than a business combination if the transaction, when initially recorded, affects neither accounting nor taxable profit.
Deferred tax liabilities are not recorded for temporary differences on initial recognition of goodwill and subsequently for goodwill which is not deductible for tax purposes. Deferred tax balances are measured at tax rates enacted or substantively enacted at the reporting date which are expected to apply to the period when the temporary differences will reverse or the tax loss carry forwards will be utilised. Deferred tax assets for deductible temporary differences and tax loss carry forwards are recorded only to the extent that it is probable that the temporary difference will reverse in the future and there is sufficient future taxable profit available against which the deductions can be utilised. Deferred income tax assets and liabilities are offset when there is a legally enforceable right to offset current tax assets against current tax liabilities and when the deferred

Strategic Report Corporate Governance Financial Statements
EuroChem Annual Report and Accounts 2018 103
(all amounts are presented in thousands of US dollars, unless otherwise stated)
income taxes assets and liabilities relate to income taxes levied by the same taxation authority on either the same taxable entity or different taxable entities where there is an intention to settle the balances on a net basis.
Deferred income tax is provided on post-acquisition retained earnings of subsidiaries, except where the Group controls the subsidiary’s dividend policy and it is probable that the difference will not be reversed through dividends or upon disposal in the foreseeable future.
Deferred income tax liabilities are provided on taxable temporary differences arising from investments in associates and joint arrangements except for deferred income tax liabilities for which the timing of the reversal of the temporary difference is controlled by the Group and it is probable that the temporary differences will not be reversed in the foreseeable future. Generally the Group is unable to control the reversal of the temporary difference for associates. Only where there is an agreement in place that gives the Group the ability to control the reversal of the temporary difference, a deferred income tax liability is not recognised.
Deferred income tax assets are recognised on deductible temporary differences arising from investments in associates and joint arrangements only to the extent that it is probable the temporary difference will be reversed in the future and there is sufficient taxable profit available against which the temporary difference can be utilised.
Uncertain tax positionsThe Group’s uncertain tax positions are reassessed by management at the end of each reporting period. Liabilities are recorded for income tax positions that are determined by management as more likely than not to result in additional taxes being levied if the positions were to be challenged by the tax authorities. The assessment is based on the interpretation of tax laws that have been enacted or substantively enacted by the end of the reporting period, and any known court or other rulings on such issues. Liabilities for penalties, interest and taxes other than on income are recognised based on management’s best estimate of the expenditure required to settle the obligations at the end of the reporting period. Adjustments for uncertain income tax positions are recorded within the income tax charge.
InventoriesInventories are recorded at the lower of cost and net realisable value. The cost of inventory is determined on the weighted-average basis. The cost of finished goods and work in progress comprises direct costs such as raw material, labour, other direct costs and related production overheads (based on normal operating capacity) as well as transportation expenses to the point of sale, but excludes borrowing costs. Net realisable value is the estimated selling price in the ordinary course of business, less the estimated cost of completion and selling expenses.
Factoring arrangementsThe Group enters into non-recourse factoring arrangements under which trade receivables can be sold and therefore are derecognised in the full amount from trade receivables as the Group does not retain substantially all risks and rewards of ownership and no longer retains control over the asset sold. The Group continues to collect and service the receivables and then transfers to the purchaser the collected amounts of the trade receivables sold less loss reserve. Loss reserve is recognised as other receivable. Factoring fees (e.g. running costs etc.) are recognised as other financial expense.
PrepaymentsPrepayments are carried at cost less provision for impairment. A prepayment is classified as non-current when the goods or services relating to the prepayment are expected to be obtained after one year, or when the prepayment relates to an asset which will itself be classified as non-current upon initial recognition. Prepayments to acquire assets are transferred to the carrying amount of the asset once the Group has obtained control of the asset and it is probable that future economic benefits associated with the asset will flow to the Group. Other prepayments are recognised in profit or loss when the goods or services relating to the prepayments are received. If there is an indication that the assets, goods or services relating to a prepayment will not be received, the carrying value of the prepayment is written down accordingly and a corresponding impairment is recognised in profit or loss for the year.
Cash and cash equivalentsCash and cash equivalents include cash in hand, term deposits held with banks, and other short-term highly liquid investments with original maturities of three months or less.
Term deposits for longer than three months that are repayable on demand within one working day without penalties or that can be redeemed/withdrawn, subject to the interest income being forfeited, are classified as cash equivalents if the deposit is held to meet short-term cash needs and there is no significant risk of a change in value as a result of an early withdrawal. Other term deposits are included in fixed-term deposits.
Cash and cash equivalents are carried at amortised cost using the effective interest method.

104 EuroChem Annual Report and Accounts 2018
(all amounts are presented in thousands of US dollars, unless otherwise stated)
Notes to the Consolidated Financial Statementsfor the year ended 31 December 2018 continued
2. Basis of preparation and significant accounting policies continuedCash and cash equivalents continuedRestricted balances are excluded from cash and cash equivalents. Balances restricted from being exchanged or used to settle a liability for at least 12 months after the reporting date are included in non-current assets in the consolidated statement of financial position.
In managing the business, management focuses on a number of cash flow measures including “gross cash flow” and “free cash flow”. Gross cash flow refers to the operating profit after income tax and adjusted for items which are not of a cash nature, which have been charged or credited to profit and loss. The gross cash flow is available to finance movements in operating assets and liabilities, investing and financing activities.
Free cash flows are the cash flows available to the debt or equity holders of the business.
Since these terms are not standard IFRS measures EuroChem Group’s definition of gross cash flow and free cash flow may differ from that of other companies.
Fixed-term depositsFixed-term deposits are deposits held with banks and have various original maturities and can be withdrawn with early notification and/or with penalty accrued or interest income forfeited. They are included in the current assets, except for those with maturities greater than 12 months after the reporting date, which are classified as non-current assets.
Share capitalOrdinary shares are classified as equity. Incremental costs directly attributable to the issue of new shares are shown in equity as a deduction, net of tax, from the proceeds. Any excess of the fair value of consideration received over the par value of shares issued is presented in the consolidated statement of changes in equity as a share premium.
Capital contributionCapital contributions received from shareholders in a form of a perpetual loan which does not require repayment, or for which the Group will be able to avoid any payments is classified as a component of equity within retained earnings and others reserves in the consolidated statement of changes in equity.
DividendsDividends are recognised as a liability and deducted from equity in the period in which they are declared and approved. Dividends are disclosed when they are proposed before the reporting date or proposed or declared after the reporting date but before the consolidated financial statements are authorised for issue.
Value added tax (“VAT”)Output VAT related to sales is payable to tax authorities on the earlier of (a) collection of receivables from customers or (b) delivery of goods or services to customers. VAT incurred on purchases may be offset, subject to certain restrictions, against VAT related to revenues, or can be reclaimed in cash from the tax authorities under certain circumstances. VAT related to sales and purchases is recognised in the consolidated statement of financial position on a gross basis and disclosed separately as an asset and liability. Where provision has been made for the impairment of receivables, the impairment loss is recorded for the gross amount of the debtor, including VAT.
BorrowingsBorrowings are initially recognised at fair value, net of transaction costs incurred, and are subsequently stated at amortised cost using the effective interest method.
Trade and other payablesTrade payables are accrued when the counterparty performs its obligations under the contract and are recognised initially at fair value and subsequently measured at amortised cost using the effective interest method.
Investment grantsInvestment grants are recognised at their fair value where there is a reasonable assurance that the grant will be received and the Group will comply with all attached conditions. Investment grants relating to the purchase of property, plant and equipment are included in non-current liabilities as deferred income and are credited to profit and loss on a straight-line basis over the expected lives of the related assets.
Strategic Report Corporate Governance Financial Statements
EuroChem Annual Report and Accounts 2018 105
(all amounts are presented in thousands of US dollars, unless otherwise stated)
Provisions for liabilities and chargesProvisions for liabilities and charges are recognised when the Group has a present legal or constructive obligation as a result of past events, it is probable that an outflow of resources will be required to settle the obligation, and a reliable estimate of the amount can be made. Provisions are measured at the present value of the expenditures expected to be required to settle the obligation using a pre-tax rate that reflects current market assessments of the time value of money and the risks specific to the obligation. The increase in the provision due to the passage of time is recognised as an interest expense.
Where the Group expects a provision to be reimbursed, for example under an insurance contract, the reimbursement is recognised as a separate asset but only when the reimbursement is virtually certain.
Levies and charges, such as taxes other than income tax or regulatory fees based on information related to a period before the obligation to pay arises, are recognised as liabilities when the obligating event that gives rise to pay a levy occurs, as identified by the legislation that triggers the obligation to pay the levy. If a levy is paid before the obligating event, it is recognised as a prepayment.
Asset retirement obligationsThe Group’s mining, extraction and processing activities are subject to requirements under federal, state and local environmental regulations which result in asset retirement obligations. Such retirement obligations include restoration costs primarily relating to mining and drilling operations, decommissioning of underground and surfacing operating facilities.
The present value of a liability for asset retirement obligation is recognised in the period in which it is incurred if respective costs could be reliably estimated. The estimated future land restoration costs discounted to present value are capitalised in underlying items of property, plant and equipment and then depreciated over the useful life of such assets based on the unit-of-production method for oil and gas assets and on the straight-line basis for other assets. The unwinding of the obligation is recognised in profit or loss as part of other financial gain/loss. Actual restoration costs are recognised as expenses against the provision when incurred.
Changes to estimated future costs are recognised in the consolidated statement of financial position by either increasing or decreasing the provision for land restoration and the asset to which it relates. The Group reassesses its estimation of land restoration provision as at the end of each reporting period.
Revenue recognitionRevenue from contracts with customers is recognised when control of the goods or services is transferred to a customer. The amount of revenue recognised reflects the consideration the Group expects to receive in exchange for goods or services, taking into account any trade, volume and other discounts. Advances received before the control passes to a customer are recognised as the contract liabilities. There are no other contract liabilities. The amount of consideration does not contain a significant financial component as payment terms for the majority of contracts are less than one year.
Contracts with customers for the supply of products use a variety of delivery terms. In a number of contracts the Group is responsible for providing shipping services after the date at which control of the goods passes to the customer at the loading point. Under IFRS 15 such shipping revenue is required to be accounted for as a separate performance obligation and should be recognised over time as the service is rendered. The Group allocates the transaction price to each performance obligation based on the relative stand-alone selling prices of the product and shipping services.
In the sales disclosure the revenue of certain product groups includes the proceeds from shipping services presented in the note as well. Costs related to rendering of shipping services are mainly represented by transportation expenses and included in distribution costs disclosed in the corresponding note.
Sales are shown net of VAT and other sales taxes.
Interest income is recognised on a time-proportion basis using the effective interest method.
Previous accounting policy applied under IAS 18, ‘Revenue’ till 31 December 2017Revenues from sales of goods were recognised at the point of transfer of risks and rewards of ownership of the goods. If the Group agreed to transport goods to a specified location, revenue was recognised when the goods were passed to the customer at the destination point. Revenues from sales of services were recognised in the period the services were provided, by reference to the stage of completion of the specific transaction assessed on the basis of the actual service provided as a proportion of the total services to be provided.

106 EuroChem Annual Report and Accounts 2018
(all amounts are presented in thousands of US dollars, unless otherwise stated)
Notes to the Consolidated Financial Statementsfor the year ended 31 December 2018 continued
2. Basis of preparation and significant accounting policies continuedEmployee benefitsWages, salaries, contributions to the state pension and social insurance funds, paid annual leave and sick leave, bonuses, and non-monetary benefits are accrued in the year in which the associated services are rendered by the employees of the Group.
A number of the Group’s European subsidiaries operate defined benefit pension plans, which represent an amount of pension benefit that an employee will receive on retirement, usually dependent on one or more factors such as age, years of service and compensation. The defined benefit obligation is calculated annually by independent actuaries using the projected unit credit method. Remeasurements of post-employment benefit obligations are recognised in other comprehensive income. The defined pension obligation of the Group is not material.
Earnings/(loss) per shareEarnings/(loss) per share is determined by dividing the profit or loss attributable to equity holders of the Company by the weighted average number of ordinary shares outstanding during the reporting period.
Segment reportingA segment is a component of the Group that is engaged in business activities from which it may earn revenues and incur expenses. Operating segments are reported in a manner consistent with the internal reporting provided to the chief operating decision-maker. The chief operating decision-maker is responsible for allocating resources and assessing performance of the operating segments.
3. Critical accounting estimates and judgements in applying accounting policiesThe Group makes estimates and assumptions that affect the amounts recognised in the consolidated financial statements and the carrying amounts of assets and liabilities. Estimates and judgements are continually evaluated and are based on management’s experience and other factors, including expectations of future events that are believed to be reasonable under the circumstances. Management also makes certain judgements, apart from those involving estimations, in the process of applying the accounting policies. Judgements that have the most significant effect on the amounts recognised in the consolidated financial statements and estimates that can cause an adjustment to the carrying amount of assets and liabilities include:
TaxationJudgements are required in determining tax liabilities (Note 34). The Group recognises liabilities for taxes based on estimates of whether additional taxes will be due. Where the final outcome of various tax matters is different from the amounts that were initially recorded, such differences will impact the tax assets and liabilities in the period in which such determination is made.
Deferred income tax asset recognitionThe recognised deferred tax assets represent income taxes recoverable through future deductions from taxable profits and are recorded in the consolidated statement of financial position. Deferred income tax assets are recorded to the extent that realisation of the related tax benefit is probable. This includes temporary difference expected to reverse in the future and the availability of sufficient future taxable profit against which the deductions can be utilised. The future taxable profits and the amount of tax benefits that are probable in the future are based on the medium term business plan prepared by management and extrapolated results thereafter. The business plan is based on management expectations that are believed to be reasonable under the circumstances (Note 31).
Related party transactionsThe Group enters into transactions with related parties in the normal course of business (Note 33). These transactions are priced at market rates. Judgement is applied in determining whether transactions are priced at market or non-market rates where there is no active market for such transactions. Judgements are made by comparing prices for similar types of transactions with unrelated parties.
Capital contributionThe Group classified the capital contribution received from a shareholder in a form of perpetual loan which does not require repayment, or for which the Group will be able to avoid any payments as a component of equity.

Strategic Report Corporate Governance Financial Statements
EuroChem Annual Report and Accounts 2018 107
(all amounts are presented in thousands of US dollars, unless otherwise stated)
Recognition of 100% interest in Fertilizantes Tocantins Ltda.In 2016, the Group entered into agreement with Fertilizantes Tocantins Ltda, according to which the Group acquired 50% interest plus one share and entered into put and call options for the remaining 50% interest minus one share to be executed in 2022. Since put and call options will be executed simultaneously at the same exercise price, the judgement was applied that the risks and rewards associated with a 100% interest in Fertilizantes Tocantins Ltda were transferred to the Group on 1 September 2016, thus, no non-controlling interest was recognised and the transaction was accounted for as the acquisition of a 100% interest in the company. The liability under the put and call options scheme payable in 2022 is assessed on an annual basis and subject to unwinding. The valuation technique used to measure the liability arising from contingent consideration is based on calculating the present value of the future expected cash flows.
4. Adoption of new or revised standards and interpretationsIn addition to those disclosed in note 2, other new amendments and improvements to standards set out below became effective 1 January 2018 and did not have any impact or did not have a material impact on the Group’s consolidated financial statements:
• Amendments to IFRS 10 and IAS 28 regarding the sale or contribution of assets between an investor and its associate or joint venture;
• Amendments to IFRS 2, Share-based Payment;
• Amendments to IFRS 4, Applying IFRS 9 Financial instruments with IFRS 4, Insurance contracts;
• Annual Improvements to IFRSs 2014-2016 cycle – amendments to IFRS 1 and IAS 28;
• IFRIC 22, Foreign Currency Transactions and Advance Consideration;
• Amendments to IAS 40, Transfers of Investment property.
A number of new standards, amendments to standards and interpretations are not yet effective as at 31 December 2018, and have not been early adopted by the Group:
• IFRS 16, Leases. The standard provides a comprehensive model to the identification of leases, distinguishing between a lease and a service contract on the basis of whether the customer controls the asset. Under the new standard, the Group is required to recognise the present value of the unavoidable lease payments as a lease liability in the statement of financial position (including those currently classified as operating leases) with a corresponding right of use asset. The unwinding of the financial charge on the lease liability and amortisation of the right-of-use asset are recognised in the statement of profit or loss based on the implied interest rate and contract term respectively. The Group envisages adopting the modified retrospective approach, through which the cumulative effect of the initial application will be recognised as at 1 January 2019 without any restatement of comparative information. Thus the Group will recognise a right-of-use asset for operating lease at the date of initial application at an amount equal to the lease liability, adjusted by the amount of any prepaid payments relating to that lease recognised in the statement of financial position immediately before the date of initial application. The Group has finalised its review of the impact of IFRS 16 and assessed that the amount of right of use assets and lease liabilities that will be recognised upon adoption as at 1 January 2019 is estimated to be US$65 million.
• IFRS 17, Insurance contracts;
• IFRIC 23, Uncertainty over Income Tax Treatments;
• Amendments to IFRS 9, Prepayment Features with Negative Compensation;
• Amendments to IAS 28, Long-term Interests in Associates and Joint Ventures;
• Annual improvements to IFRSs 2015-2017 cycle;
• Amendments to IAS 19, Plan Amendment, Curtailment or Settlement;
• Amendments to the Conceptual Framework for Financial Reporting;
• Amendments to IFRS 3, Definition of a business;
• Amendments to IAS 1 and IAS 8; Definition of materiality.
Unless otherwise described above, the new standards, amendments to standards and interpretations are expected to have no impact or to have a non-material impact on the Group’s consolidated financial statements.
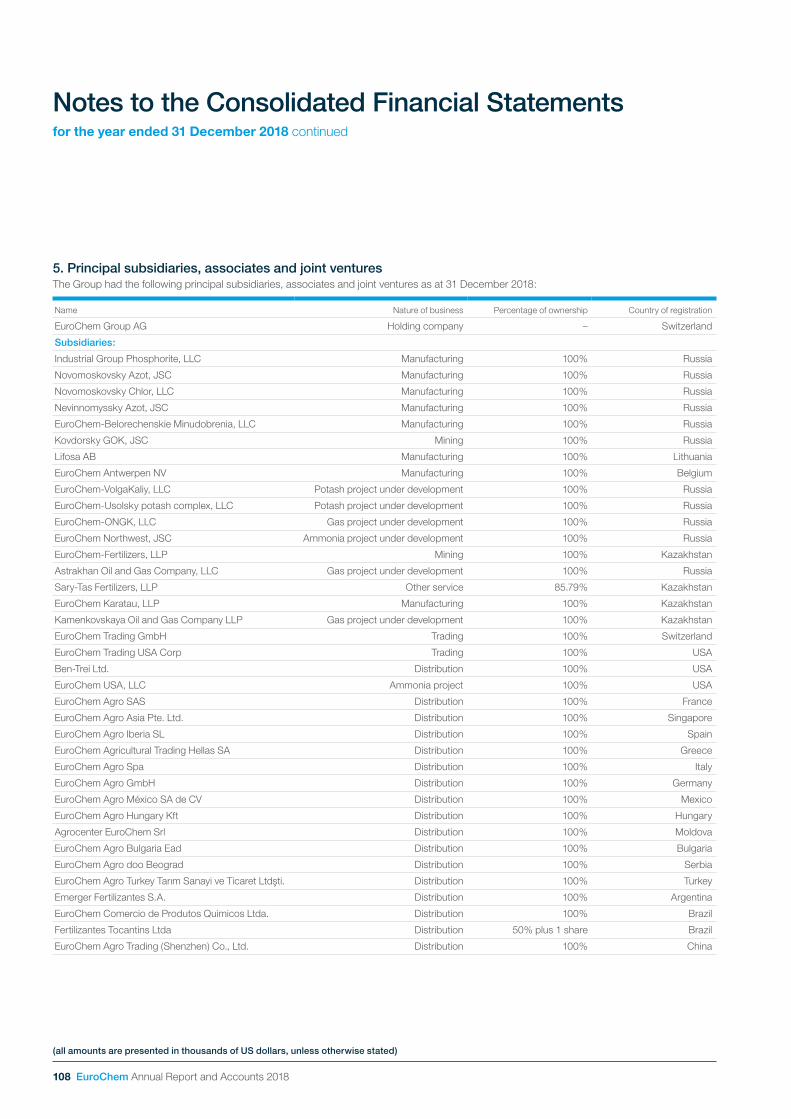
108 EuroChem Annual Report and Accounts 2018
(all amounts are presented in thousands of US dollars, unless otherwise stated)
Notes to the Consolidated Financial Statementsfor the year ended 31 December 2018 continued
5. Principal subsidiaries, associates and joint venturesThe Group had the following principal subsidiaries, associates and joint ventures as at 31 December 2018:
Name Nature of business Percentage of ownership Country of registration
EuroChem Group AG Holding company – Switzerland
Subsidiaries:
Industrial Group Phosphorite, LLC Manufacturing 100% Russia
Novomoskovsky Azot, JSC Manufacturing 100% Russia
Novomoskovsky Chlor, LLC Manufacturing 100% Russia
Nevinnomyssky Azot, JSC Manufacturing 100% Russia
EuroChem-Belorechenskie Minudobrenia, LLC Manufacturing 100% Russia
Kovdorsky GOK, JSC Mining 100% Russia
Lifosa AB Manufacturing 100% Lithuania
EuroChem Antwerpen NV Manufacturing 100% Belgium
EuroChem-VolgaKaliy, LLC Potash project under development 100% Russia
EuroChem-Usolsky potash complex, LLC Potash project under development 100% Russia
EuroChem-ONGK, LLC Gas project under development 100% Russia
EuroChem Northwest, JSC Ammonia project under development 100% Russia
EuroChem-Fertilizers, LLP Mining 100% Kazakhstan
Astrakhan Oil and Gas Company, LLC Gas project under development 100% Russia
Sary-Tas Fertilizers, LLP Other service 85.79% Kazakhstan
EuroChem Karatau, LLP Manufacturing 100% Kazakhstan
Kamenkovskaya Oil and Gas Company LLP Gas project under development 100% Kazakhstan
EuroChem Trading GmbH Trading 100% Switzerland
EuroChem Trading USA Corp Trading 100% USA
Ben-Trei Ltd. Distribution 100% USA
EuroChem USA, LLC Ammonia project 100% USA
EuroChem Agro SAS Distribution 100% France
EuroChem Agro Asia Pte. Ltd. Distribution 100% Singapore
EuroChem Agro Iberia SL Distribution 100% Spain
EuroChem Agricultural Trading Hellas SA Distribution 100% Greece
EuroChem Agro Spa Distribution 100% Italy
EuroChem Agro GmbH Distribution 100% Germany
EuroChem Agro México SA de CV Distribution 100% Mexico
EuroChem Agro Hungary Kft Distribution 100% Hungary
Agrocenter EuroChem Srl Distribution 100% Moldova
EuroChem Agro Bulgaria Ead Distribution 100% Bulgaria
EuroChem Agro doo Beograd Distribution 100% Serbia
EuroChem Agro Turkey Tarım Sanayi ve Ticaret Ltdsti. Distribution 100% Turkey
Emerger Fertilizantes S.A. Distribution 100% Argentina
EuroChem Comercio de Produtos Quimicos Ltda. Distribution 100% Brazil
Fertilizantes Tocantins Ltda Distribution 50% plus 1 share Brazil
EuroChem Agro Trading (Shenzhen) Co., Ltd. Distribution 100% China
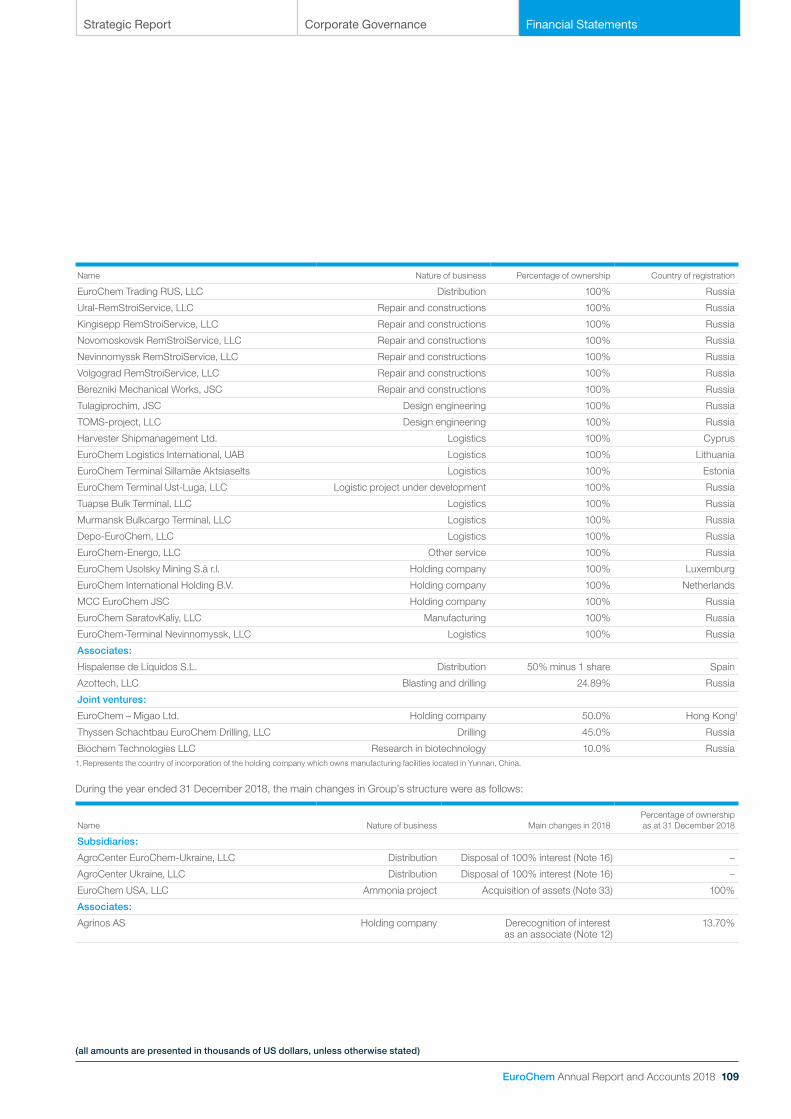
Strategic Report Corporate Governance Financial Statements
EuroChem Annual Report and Accounts 2018 109
(all amounts are presented in thousands of US dollars, unless otherwise stated)
Name Nature of business Percentage of ownership Country of registration
EuroChem Trading RUS, LLC Distribution 100% Russia
Ural-RemStroiService, LLC Repair and constructions 100% Russia
Kingisepp RemStroiService, LLC Repair and constructions 100% Russia
Novomoskovsk RemStroiService, LLC Repair and constructions 100% Russia
Nevinnomyssk RemStroiService, LLC Repair and constructions 100% Russia
Volgograd RemStroiService, LLC Repair and constructions 100% Russia
Berezniki Mechanical Works, JSC Repair and constructions 100% Russia
Tulagiprochim, JSC Design engineering 100% Russia
TOMS-project, LLC Design engineering 100% Russia
Harvester Shipmanagement Ltd. Logistics 100% Cyprus
EuroChem Logistics International, UAB Logistics 100% Lithuania
EuroChem Terminal Sillamäe Aktsiaselts Logistics 100% Estonia
EuroChem Terminal Ust-Luga, LLC Logistic project under development 100% Russia
Tuapse Bulk Terminal, LLC Logistics 100% Russia
Murmansk Bulkcargo Terminal, LLC Logistics 100% Russia
Depo-EuroChem, LLC Logistics 100% Russia
EuroChem-Energo, LLC Other service 100% Russia
EuroChem Usolsky Mining S.à r.l. Holding company 100% Luxemburg
EuroChem International Holding B.V. Holding company 100% Netherlands
MCC EuroChem JSC Holding company 100% Russia
EuroChem SaratovKaliy, LLC Manufacturing 100% Russia
EuroChem-Terminal Nevinnomyssk, LLC Logistics 100% Russia
Associates:
Hispalense de Líquidos S.L. Distribution 50% minus 1 share Spain
Azottech, LLC Blasting and drilling 24.89% Russia
Joint ventures:
EuroChem – Migao Ltd. Holding company 50.0% Hong Kong1
Thyssen Schachtbau EuroChem Drilling, LLC Drilling 45.0% Russia
Biochem Technologies LLC Research in biotechnology 10.0% Russia1. Represents the country of incorporation of the holding company which owns manufacturing facilities located in Yunnan, China.
During the year ended 31 December 2018, the main changes in Group’s structure were as follows:
Name Nature of business Main changes in 2018Percentage of ownership as at 31 December 2018
Subsidiaries:
AgroCenter EuroChem-Ukraine, LLC Distribution Disposal of 100% interest (Note 16) –
AgroCenter Ukraine, LLC Distribution Disposal of 100% interest (Note 16) –
EuroChem USA, LLC Ammonia project Acquisition of assets (Note 33) 100%
Associates:
Agrinos AS Holding company Derecognition of interest as an associate (Note 12)
13.70%

110 EuroChem Annual Report and Accounts 2018
(all amounts are presented in thousands of US dollars, unless otherwise stated)
Notes to the Consolidated Financial Statementsfor the year ended 31 December 2018 continued
6. Fair value of financial instruments Management applies judgement in categorising financial instruments using the fair value hierarchy. The significance of a valuation input is assessed against the fair value measurement in its entirety.
Recurring fair value measurementsRecurring fair value measurements are those that the accounting standards require or permit in the consolidated statement of financial position at the end of each reporting period.
(a) Financial instruments carried at fair valuesThe recurring fair value measurements are included in Level 2 of the fair value hierarchy and are as follows.
31 December 2018
31 December 2017
Financial assets
Current financial assets
Non-deliverable foreign exchange forward contracts 74 2,530
Deliverable foreign exchange forward contracts 806 954
Swap contracts 246 –
Cross-currency interest swaps – 15,471
Total current financial assets 1,126 18,955
Non-current financial assets
Non-deliverable foreign exchange forward contracts – 645
Cross-currency interest swaps – 6,544
Total non-current financial assets – 7,189
Total assets recurring fair value measurements 1,126 26,144
Financial liabilities
Current financial liabilities
Non-deliverable foreign exchange forward contracts 6,752 –
Deliverable foreign exchange forward contracts 1,278 –
Commodity swaps – 30
Cross-currency interest swaps 4,599 61,791
Total current financial liabilities 12,629 61,821
Non-current financial liabilities
Non-deliverable foreign exchange forward contracts 6,869 –
Cross-currency interest swaps 50,234 –
Total non-current financial liabilities 57,103 –
Total liabilities recurring fair value measurements 69,732 61,821
For derivative financial instruments at fair value through profit or loss, which typically include foreign exchange forward contracts, cross currency interest rate swaps, commodity swaps etc., the fair values are based on recurring mark-to-market valuations provided by the financial institutions which deal in these financial instruments.

Strategic Report Corporate Governance Financial Statements
EuroChem Annual Report and Accounts 2018 111
(all amounts are presented in thousands of US dollars, unless otherwise stated)
(b) Assets and liabilities not measured at fair value but for which fair value is disclosedFinancial assets and liabilities carried at amortised costThe carrying amounts of trade and other receivables, trade and other payables, contingent consideration related to business combinations and originated loans approximate their fair values and are included in level 3 of fair value hierarchy. Cash and cash equivalents and fixed-term deposits are carried at amortised cost which approximates their current fair value, included in level 2 of fair value hierarchy. The fair values in level 2 and level 3 of the fair value hierarchy were estimated using the discounted cash flows valuation technique.
Loans received and bank borrowings are carried at amortised cost. The fair value of floating rate instruments normally approximates their carrying amount. The estimated fair value of fixed interest rate instruments is based on estimated future cash flows expected to be received discounted at current interest rates for new instruments with similar credit risk and remaining maturity.
Fair values analysed by level in the fair value hierarchy and the carrying value of liabilities not measured at fair value are as follows:
31 December 2018
Level 1 Fair value
Level 2 Fair value
Level 3 Fair value Carrying value
Financial liabilities
– RUB-denominated bonds payable 435,810 – – 431,332
– US$-denominated bonds payable 979,785 – – 995,779
– Long-term US$-denominated fixed interest loans – – 545,297 550,000
– Long-term RUB-denominated fixed interest loans – – 61,267 66,863
– Long-term BRL-denominated fixed interest loans – – 1,837 2,019
Total financial liabilities 1,415,595 – 608,401 2,045,993
31 December 2017
Level 1 Fair value
Level 2 Fair value
Level 3 Fair value Carrying value
Financial liabilities
– RUB-denominated bonds payable 626,654 – – 606,790
– US$-denominated bonds payable 1,004,905 – – 992,714
– Long-term RUB-denominated fixed interest loans – – 22,662 26,042
– Long-term BRL-denominated fixed interest loans – – 16,785 17,265
Total financial liabilities 1,631,559 – 39,447 1,642,811
The following information sets out the key inputs relevant to the determination of the fair value of the liabilities for which fair value information is provided as a disclosure only.
• For US$ and RUB-denominated bonds traded on organised financial markets (Irish stock exchange and Moscow Exchange), quotations or executable prices are used as the key inputs to fair value determination. These instruments are included in level 1 of the fair value hierarchy.
• The fair value of long-term loans and borrowings bearing a fixed interest rate is determined by a discounted cash flows method. The discount factor applied to principal and interest repayments in the valuation model is calculated as a risk free rate at the reporting date adjusted for the Group’s credit risk. The Group’s credit risk component in the discount factor at inception is assumed to remain unchanged on the reporting date and is calculated as a difference between the contract interest rate and the risk-free interest rate, in effect at loan inception date for debt instruments with similar maturities. These instruments are included in level 3 of the fair value hierarchy.

112 EuroChem Annual Report and Accounts 2018
(all amounts are presented in thousands of US dollars, unless otherwise stated)
Notes to the Consolidated Financial Statementsfor the year ended 31 December 2018 continued
6. Fair value of financial instruments continuedDuring the years ended 31 December 2018 and 31 December 2017 there were no transfers between levels 1, 2 and 3 of the fair value hierarchy.
The Group’s financial assets and liabilities were as follows:
Measurement categories
as at 31 December
201831 December
2018
Measurement categories
as at 31 December
2017
31 December 2017,
adjusted
Financial assets
Non-current financial assets
Restricted cash AC1 2,276 LR4 22,345
Originated loans AC1 3,864 LR4 51,046
Derivative financial assets FVPL2 – FVPL2 7,189
Other non-current assets including:
Long-term other receivables AC1 – LR4 2,514
Interest receivables AC1 – LR4 698
Long-term receivables due to sale of subsidiaries AC1 9,431 LR4 –
Other assets FVOCI3 4,012 – –
Total non-current financial assets 19,583 83,792
Current financial assets
Restricted cash AC1 2,850 LR4 20,101
Trade receivables AC1 366,836 LR4 288,959
Derivative financial assets FVPL2 1,126 FVPL2 18,955
Other receivables and other current assets including:
Other receivables AC1 27,426 LR4 3,316
Collateral held by banks to secure derivative transactions AC1 – LR4 672
Interest receivables AC1 580 LR4 272
Fixed-term deposits AC1 1,801 LR4 151
Cash and cash equivalents AC1 341,911 LR4 228,613
Total current financial assets 742,530 561,039
Total financial assets 762,113 644,8311. Financial assets measured at amortised cost.
2. Financial assets measured at fair value through profit or loss.
3. Financial assets measured at fair value through other comprehensive income.
4. Loans and receivables.

Strategic Report Corporate Governance Financial Statements
EuroChem Annual Report and Accounts 2018 113
(all amounts are presented in thousands of US dollars, unless otherwise stated)
Measurement categories
as at 31 December
201831 December
2018
Measurement categories
as at 31 December
201731 December
2017
Financial liabilities
Non-current financial liabilities
Bank borrowings and other loans received AC1 2,003,275 LR3 1,110,205
Bonds issued AC1 1,211,261 LR3 1,512,413
Project Finance AC1 420,070 LR3 959,373
Derivative financial liabilities FVPL2 57,103 FVPL2 –
Other non-current liabilities including:
Contingent liability related to business combination AC1 122,866 LR3 123,001
Long-term portion of deferred payables related to acquisition of additional interest in subsidiary AC1 1,821 LR3 3,000
Long-term portion of deferred payables related to mineral rights acquisition AC1 11,088 LR3 11,785
Total non-current financial liabilities 3,827,484 3,719,777
Current financial liabilities
Bank borrowings and other loans received AC1 371,133 LR3 770,405
Project Finance AC1 21,612 LR3 –
Bonds issued AC1 215,850 LR3 87,091
Derivative financial liabilities FVPL2 12,629 FVPL2 61,821
Trade payables AC1 470,264 LR3 513,004
Other accounts payable and accrued expenses including:
Interest payables AC1 27,457 LR3 29,604
Payable for acquisition of associate AC1 – LR3 3,229
Short-term portion of deferred payables related to business combinations and acquisition of additional interest in subsidiary AC1 1,500 LR3 4,697
Short-term portion of deferred payables related to mineral rights acquisition AC1 1,460 LR3 1,875
Total current financial liabilities 1,121,905 1,471,726
Total financial liabilities 4,949,389 5,191,5031. Financial liabilities measured at amortised cost.
2. Financial liabilities measured at fair value through profit or loss.
3. Loans and receivables.

114 EuroChem Annual Report and Accounts 2018
(all amounts are presented in thousands of US dollars, unless otherwise stated)
Notes to the Consolidated Financial Statementsfor the year ended 31 December 2018 continued
6. Fair value of financial instruments continuedAs required by the amendment of IAS 7 the Group presents the reconciliation of movements in liabilities arising from financing activities:
Bank borrowings
and otherloans received
Bondsissued
Project Finance
Interest payable Total
Balance at 1 January 2018 1,880,610 1,599,504 959,373 29,604 4,469,091
Cash flows
Proceeds from bank borrowings and other loans received 2,723,656 – – – 2,723,656
Funds received under the Project Finance Facility – – 219,309 – 219,309
Repayment of bank borrowings and other loans (2,136,094) – – – (2,136,094)
Repayment of Project Finance Facility – – (750,000) – (750,000)
Repayment of bonds – (79,697) – – (79,697)
Prepaid and additional transaction costs (10,836) (62) (5,285) – (16,183)
Interest paid – – – (219,873) (219,873)
Non-cash flows
Interest expenses accrued – – – 220,473 220,473
Amortisation of transaction costs 5,157 3,182 18,313 – 26,652
Financial foreign exchange (gain)/loss, net (70,068) 93,037 126,370 1,286 150,625
Currency translation difference, net (18,017) (188,853) (126,398) (4,033) (337,301)
Balance at 31 December 2018 2,374,408 1,427,111 441,682 27,457 4,270,658
Bank borrowings
and other loans received
Bonds issued
Project Finance
Interest payable
Other non-current
assets Total
Balance at 1 January 2017 2,381,089 1,148,704 573,022 18,003 (49,134) 4,071,684
Cash flows
Proceeds from bank borrowings and other loans received 3,128,323 – – – – 3,128,323
Funds received under the Project Finance Facilities – – 416,938 – – 416,938
Proceeds from bonds, net of transaction costs – 767,522 – – – 767,522
Repayment of bank borrowings and other loans (3,655,674) – – – – (3,655,674)
Repayment of bonds – (324,033) – – – (324,033)
Prepaid and additional transaction costs (11,566) (5,563) (4,463) – – (21,592)
Interest paid – – – (210,585) – (210,585)
Non-cash flows
Loans acquired in a business combination 6,585 – – – – 6,585
Interest expenses accrued – – – 220,733 – 220,733
Amortisation of transaction costs 16,567 2,728 15,050 – – 34,345
Financial foreign exchange gain/(loss), net 15,388 (33,317) (30,338) (344) – (48,611)
Currency translation difference, net (102) 43,463 40,603 1,797 (2,305) 83,456
Reclassification of prepaid and additional transaction costs related to Project Finance Facilities – – (51,439) – 51,439 –
Balance at 31 December 2017 1,880,610 1,599,504 959,373 29,604 – 4,469,091

Strategic Report Corporate Governance Financial Statements
EuroChem Annual Report and Accounts 2018 115
(all amounts are presented in thousands of US dollars, unless otherwise stated)
7. Segment information The Group has a vertically integrated business model conducted by four operating divisions, representing reportable segments, which are Mining, Fertilizers, Logistics and Sales:
• Mining Division encompasses the extraction of ores to obtain apatite, baddeleyite, iron-ore concentrates and phosphorite; as well as the potash production at the Verkhnekamskoe deposit that started in 2018 and the development of the second potassium salt deposit (potash) at the Gremyachinskoe deposit;
• Fertilizers Division includes the production of mineral fertilizers (nitrogen, phosphate and complex and industrial products;
• Logistics Division covers all supply chain operations including transportation services, purchase and delivery of raw materials and finished goods, as well as freight forwarding and other logistics services;
• Sales Division is responsible for the sale of the complete range of products produced by the Group as well as third-party products through the Group’s global distribution network spanning across Europe, Russia, North and Latin America, and Central and South East Asia.
Activities not assigned to a particular division are reported in “Other”. These include certain service activities, central management and other items. Effective 1 January 2018, the Oil & Gas division was removed from the Group’s corporate structure. The operating results of this division for the year ended 31 December 2017 reported in “Other” also included results of the company that was engaged in production of hydrocarbons and sold at the end of 2017.
All intersegment transactions and unrealised profit in inventory from intragroup sales are eliminated through “Elimination”.
The review of financial reports of the Group, evaluation of the operating results and allocation of resources between the operating divisions are performed by the Management Board (considered to be the chief operating decision-maker in the Group). The development and approval of strategies, market and risk analysis, investment focus, and technological process changes are undertaken mostly in accordance with the operating divisions. Budgets and financial reports are prepared in a standard format according to the IFRS accounting policy adopted by the Group. Sales between divisions are carried out on an arm’s length basis.
The Management Board assesses the performance of the operating divisions based on, among other factors, a measure of EBITDA (profit before taxation adjusted by interest expense, depreciation and amortisation, financial foreign exchange gain or loss, other non-cash and one-off items, excluding profit attributed to non-controlling interests), allocated by division according to internal rules. Since the EBITDA term is not a standard IFRS measure, EuroChem Group’s definition of EBITDA may differ from that of other companies.
The division results for the year ended 31 December 2018 were:
External sales Internal sales Total sales EBITDA
Mining 11,601 675,608 687,209 304,401
Fertilizers 66,653 3,364,594 3,431,247 1,032,777
Logistics 46,298 195,799 242,097 93,887
Sales 5,450,384 11,198 5,461,582 207,918
Other 2,536 14,259 16,795 (39,336)
Elimination – (4,261,458) (4,261,458) (82,721)
Total 5,577,472 – 5,577,472 1,516,926
The division results for the year ended 31 December 2017 were:
External sales Internal sales Total sales EBITDA
Mining 11,067 630,163 641,230 287,268
Fertilizers 54,743 2,892,290 2,947,033 690,165
Logistics 39,003 187,489 226,492 96,342
Sales 4,727,633 9,738 4,737,371 90,836
Other 33,218 116,056 149,274 (22,656)
Elimination – (3,835,736) (3,835,736) (11,517)
Total 4,865,664 – 4,865,664 1,130,438

116 EuroChem Annual Report and Accounts 2018
(all amounts are presented in thousands of US dollars, unless otherwise stated)
Notes to the Consolidated Financial Statementsfor the year ended 31 December 2018 continued
7. Segment information continuedA reconciliation of EBITDA to profit before taxation is provided below:
Note 2018 2017
EBITDA 1,516,926 1,130,438
Depreciation and amortisation 28 (308,336) (277,090)
(Impairment)/reversal of impairment/(write-off) of idle property, plant and equipment (1,459) (4,971)
Non-recurring income/(expenses), net 29 (6,155) (6,943)
Gain/(loss) from disposal of subsidiaries, net (45,753) (60,205)
Interest expense (94,480) (131,393)
Financial foreign exchange gain/(loss), net (162,070) 569
Other financial gain/(loss), net 30 (159,804) 46,305
Non-controlling interests (27) (100)
Profit before taxation 738,842 696,610
The divisional capital expenditure on property, plant and equipment, intangible assets and mineral rights for the years ended 31 December 2018 and 31 December 2017 were:
2018 2017
Mining 594,559 770,106
Fertilisers 447,863 634,805
Logistics 34,828 17,414
Sales 35,093 27,608
Other 19,431 43,224
Elimination (20,370) (3,631)
Total capital expenditure 1,111,404 1,489,526
The analysis of non-current assets other than financial instruments, deferred income tax assets and other non-current assets by geographical location was:
31 December
201831 December
2017
Russia 6,236,501 6,576,921
Europe 806,921 837,556
Brazil 241,154 256,642
Kazakhstan 221,441 179,345
Other countries 92,659 143,439
Total 7,598,676 7,993,903
The main Group’s manufacturing facilities are based in Russia, Lithuania, Belgium, Kazakhstan and China (joint venture’s production facilities).

Strategic Report Corporate Governance Financial Statements
EuroChem Annual Report and Accounts 2018 117
(all amounts are presented in thousands of US dollars, unless otherwise stated)
The analysis of Group sales by region was:
2018 2017
Europe 1,600,106 1,534,840
Latin America 1,154,193 780,256
Russia 1,062,519 965,249
North America 841,997 618,099
Asia Pacific 526,780 490,088
CIS1 262,158 362,579
Africa 129,719 114,553
Total sales 5,577,472 4,865,6641. Including associate states.
The sales are allocated to regions based on the destination country. During the year ended 31 December 2018, the Group had sales in excess of 10% to Russia, Brazil and the United States of America, representing 19.1%, 16.5% and 12.8% of total revenues, respectively (2017: sales to Russia, Brazil and the United States of America, represented 19.9%, 12.5% and 11.0% of the total revenues, respectively).
During the years ended 31 December 2018 and 31 December 2017, there were no sales in excess of 10% to one customer.
8. Property, plant and equipmentMovements in the carrying amount of property, plant and equipment were:
Buildings
Landand land
improvementsTransfer devices
Machinery and
equipment Transport OtherAssets under construction Total
Cost
Balance at 1 January 2018 615,509 648,835 312,685 2,067,848 300,785 145,970 4,469,708 8,561,340
Additions and transfers from assets under construction 400,607 459,387 34,396 372,155 35,257 17,810 (12,627) 1,306,985
Disposal due to sale of subsidiaries (2,052) (1,140) – (1,815) (29,652) (309) (1,321) (36,289)
Disposals (9,866) (5,633) (2,249) (23,257) (6,176) (1,978) (186) (49,345)
Changes in estimates of asset retirement obligations (Note 23) – (6,138) – – – – – (6,138)
(Impairment)/reversal of impairment/(write-off) of idle property, plant and equipment (67) – (7) (396) (18) (521) (1,323) (2,332)
Currency translation difference (115,019) (142,392) (49,358) (322,073) (47,079) (24,180) (757,220) (1,457,321)
Balance at 31 December 2018 889,112 952,919 295,467 2,092,462 253,117 136,792 3,697,031 8,316,900
Accumulated Depreciation
Balance at 1 January 2018 (168,789) (153,046) (146,030) (963,000) (130,602) (81,869) – (1,643,336)
Charge for the year (31,207) (37,501) (23,585) (183,636) (23,467) (15,870) – (315,266)
Disposal due to sale of subsidiaries 289 184 – 742 3,873 135 – 5,223
Disposals 7,322 5,128 2,097 21,022 5,502 1,684 – 42,755
(Impairment)/reversal of impairment/(write-off) of idle property, plant and equipment 33 – 7 326 18 489 – 873
Currency translation difference 25,842 25,748 22,807 147,812 22,457 14,275 – 258,941
Balance at 31 December 2018 (166,510) (159,487) (144,704) (976,734) (122,219) (81,156) – (1,650,810)
Net Carrying Value
Balance at 1 January 2018 446,720 495,789 166,655 1,104,848 170,183 64,101 4,469,708 6,918,004
Balance at 31 December 2018 722,602 793,432 150,763 1,115,728 130,898 55,636 3,697,031 6,666,090

118 EuroChem Annual Report and Accounts 2018
(all amounts are presented in thousands of US dollars, unless otherwise stated)
Notes to the Consolidated Financial Statementsfor the year ended 31 December 2018 continued
8. Property, plant and equipment continued
Buildings
Land and land
improvementsTransfer devices
Machinery and
equipment Transport OtherAssets under construction Total
Cost
Balance at 1 January 2017 549,402 620,761 299,921 1,671,370 244,569 125,182 3,130,257 6,641,462
Additions through business combinations 1,088 458 – 308 – – – 1,854
Additions and transfers from assets under construction 49,016 125,541 27,802 319,406 54,668 16,648 1,216,313 1,809,394
Disposal due to sale of subsidiary (7,889) (136,632) (35,325) (15,141) (739) (2,300) (51,022) (249,048)
Disposals (4,623) – (1,589) (29,101) (11,759) (872) (3,961) (51,905)
Changes in estimates of asset retirement obligations (Note 23) – 4,350 – – – – – 4,350
(Impairment)/reversal of impairment/(write-off) of idle property, plant and equipment (3,424) (1,383) (224) (1,935) 30 (156) 1,205 (5,887)
Currency translation difference 31,939 35,740 22,100 122,941 14,016 7,468 176,916 411,120
Balance at 31 December 2017 615,509 648,835 312,685 2,067,848 300,785 145,970 4,469,708 8,561,340
Accumulated Depreciation
Balance at 1 January 2017 (138,104) (123,421) (123,777) (780,770) (113,865) (64,212) – (1,344,149)
Charge for the year (27,192) (38,273) (23,761) (155,829) (21,353) (15,791) – (282,199)
Disposal due to sale of subsidiary 2,427 15,791 9,314 6,082 587 1,595 – 35,796
Disposals 3,324 – 1,122 25,742 10,813 733 – 41,734
(Impairment)/reversal of impairment/(write-off) of idle property, plant and equipment 46 7 – 849 (3) 17 – 916
Currency translation difference (9,290) (7,150) (8,928) (59,074) (6,781) (4,211) – (95,434)
Balance at 31 December 2017 (168,789) (153,046) (146,030) (963,000) (130,602) (81,869) – (1,643,336)
Net Carrying Value
Balance at 1 January 2017 411,298 497,340 176,144 890,600 130,704 60,970 3,130,257 5,297,313
Balance at 31 December 2017 446,720 495,789 166,655 1,104,848 170,183 64,101 4,469,708 6,918,004
Evaluation and exploration expenditures Potash fieldsAt 31 December 2018, the Group has capitalised expenses relating to the evaluation and exploration stages of the potash fields of US$42,108 thousand, including borrowing costs capitalised of US$4,809 thousand (31 December 2017: US$34,213 thousand, including borrowing costs capitalised of US$4,468 thousand).
Hydrocarbon fieldsAt 31 December 2018, the Group has capitalised expenses relating to the evaluation and exploration stages of the hydrocarbon fields of US$25,475 thousand (31 December 2017: US$20,463 thousand).
These expenses were included in the assets under construction of “Property, plant and equipment” in the consolidated statement of financial position. Substantially, these costs have been paid in the same period when incurred.
Borrowing costs capitalisedDuring the year ended 31 December 2018, borrowing costs totalling US$151,465 thousand were capitalised in property, plant and equipment at an average interest rate of 5.66% p.a. (2017: US$123,692 thousand capitalised at an average interest rate of 5.42% p.a.).

Strategic Report Corporate Governance Financial Statements
EuroChem Annual Report and Accounts 2018 119
(all amounts are presented in thousands of US dollars, unless otherwise stated)
Operating leasesAs at 31 December 2018 and 31 December 2017, the land plots under the main production facilities were owned by the Group. Also, several Group subsidiaries occupied the land under non-cancellable operating lease agreements, for which the future minimum payments are as follows:
31 December 2018
31 December 2017
Less than 1 year 3,381 3,798
Between 1 and 5 years 12,208 13,677
More than 5 years 90,219 96,465
Total payments 105,808 113,940
9. Mineral rights
31 December
201831 December
2017
Rights for exploration and production:
Verkhnekamskoe potash deposit 63,775 75,456
Gremyachinskoe potash deposit 66,611 75,397
Kok-Jon and Gimmelfarbskoe phosphate deposits 11,417 13,842
Kovdorsky apatite deposit 2,016 2,541
Rights for exploration, evaluation and extraction:
Belopashninskiy potash deposit 12,741 15,366
Ozinsky hydrocarbon deposit 3,549 4,281
Perelyubsko-Rubezhinskiy hydrocarbon deposit 318 383
Vostochno-Perelyubskiy potash deposit 432 521
Zapadno-Perelyubskiy potash deposit 337 406
Rights for proven and unproven mineral resources:
Astrakhan hydrocarbon deposit 123,298 148,708
Kamenkovsky hydrocarbon deposit 31,259 35,908
Total mineral rights 315,753 372,809
Under the terms of valid licences for the exploration and development of mineral resource deposits, the Group is required to comply with a number of conditions, including preparation of design documentation, commencement of the construction of mining facilities and commencement of the extraction of mineral resources by certain dates. If the Group fails to materially comply with the terms of the licence agreements there are circumstances whereby the licences can be revoked. Management of the Group believes that the Group faces no material regulatory risks in relation to the validity and operation of any of its licences.
Verkhnekamskoe and Gremyachinskoe potash depositsIn accordance with the conditions of licence agreements and related licence amendments for developing the potash deposits, the Group has major commitments in respect of the timing for the construction of the mining facilities and for the potash extraction.
The Group is in compliance with the licence terms and continues with construction of the mining and surface facilities at both sites.
Management believes that each stage under the current licence terms for both of the Verkhnekamskoe and the Gremyachinskoe potash deposits development will be completed according to the schedules.

120 EuroChem Annual Report and Accounts 2018
(all amounts are presented in thousands of US dollars, unless otherwise stated)
Notes to the Consolidated Financial Statementsfor the year ended 31 December 2018 continued
9. Mineral rights continuedVerkhnekamskoe and Gremyachinskoe potash deposits continuedAs at 31 December 2018, both of the Verkhnekamskoe and Gremyachinskoe potash deposits were in the development phase with the shaft sinking completed for the first two shafts at Verkhnekamskoe and two shafts at Gremyachinskoe while the third shaft has been delayed due to a water inflow which is being managed. Management has worked out a program which will allow the Group to continue sinking at the third shaft without breaching any of the terms of the licence agreement for the Gremyachinskoe deposit.
As at 31 December 2018, the carrying amount of property, plant and equipment (including construction in progress) related to Verkhnekamskoe and Gremyachinskoe potash deposits was US$3,116 million (2017: US$3,174 million).
For the purpose of impairment testing of the Verkhnekamskoe and Gremyachinskoe potash deposits, management has compared the recoverable amount of the non-current assets related to these projects, determined as their value in use with consideration of a recent industry outlook and the operational plans, with the carrying amount of these assets and concluded that no impairment should be recognised in respect of these assets as at 31 December 2018 and 31 December 2017.
10. GoodwillMovements in goodwill arising from the acquisition of subsidiaries are:
2018 2017
Carrying amount at 1 January 516,830 468,223
Acquisition of subsidiaries – 11,580
Disposal of subsidiaries (60) –
Currency translation difference (40,973) 37,027
Carrying amount at 31 December 475,797 516,830
Goodwill impairment testGoodwill is allocated to cash-generating units (CGUs) which represent the lowest level within the Group at which the goodwill is monitored by management and which are not larger than a segment, as follows:
31 December 2018
31 December 2017
EuroChem Antwerpen NV 295,050 308,412
EuroChem Agro 19,880 20,781
Ben-Trei Ltd. 20,803 20,803
Fertilizantes Tocantins Ltda 123,123 144,265
TOMS-project, LLC 10,089 11,753
Emerger Fertilizantes S.A. 2,632 5,301
Other 4,220 5,515
Total carrying amount of goodwill 475,797 516,830
The recoverable amount of each CGU was determined based on value-in-use calculations. These calculations use cash flow projections based on development strategy and financial budgets approved by management covering a five-year period. Cash flows beyond the five-year period are extrapolated using the estimated growth rates stated below. The growth rates do not exceed the long-term average growth rate for the business sector of the economy in which the CGU operates.
Management determined budgeted prices and expenses based on past performance and market expectations. The weighted average growth rate used is consistent with the forecasts included in industry reports.
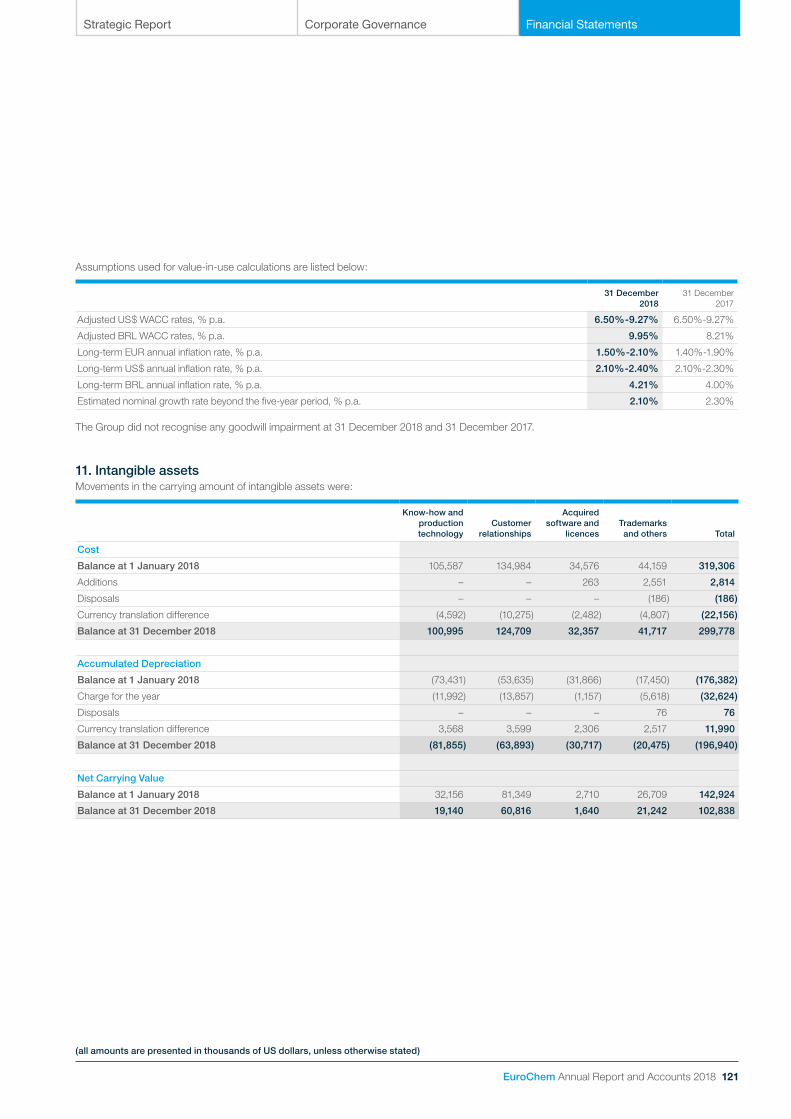
Strategic Report Corporate Governance Financial Statements
EuroChem Annual Report and Accounts 2018 121
(all amounts are presented in thousands of US dollars, unless otherwise stated)
Assumptions used for value-in-use calculations are listed below:
31 December 2018
31 December 2017
Adjusted US$ WACC rates, % p.a. 6.50%-9.27% 6.50%-9.27%
Adjusted BRL WACC rates, % p.a. 9.95% 8.21%
Long-term EUR annual inflation rate, % p.a. 1.50%-2.10% 1.40%-1.90%
Long-term US$ annual inflation rate, % p.a. 2.10%-2.40% 2.10%-2.30%
Long-term BRL annual inflation rate, % p.a. 4.21% 4.00%
Estimated nominal growth rate beyond the five-year period, % p.a. 2.10% 2.30%
The Group did not recognise any goodwill impairment at 31 December 2018 and 31 December 2017.
11. Intangible assetsMovements in the carrying amount of intangible assets were:
Know-how and production technology
Customer relationships
Acquired software and
licencesTrademarks and others Total
Cost
Balance at 1 January 2018 105,587 134,984 34,576 44,159 319,306
Additions – – 263 2,551 2,814
Disposals – – – (186) (186)
Currency translation difference (4,592) (10,275) (2,482) (4,807) (22,156)
Balance at 31 December 2018 100,995 124,709 32,357 41,717 299,778
Accumulated Depreciation
Balance at 1 January 2018 (73,431) (53,635) (31,866) (17,450) (176,382)
Charge for the year (11,992) (13,857) (1,157) (5,618) (32,624)
Disposals – – – 76 76
Currency translation difference 3,568 3,599 2,306 2,517 11,990
Balance at 31 December 2018 (81,855) (63,893) (30,717) (20,475) (196,940)
Net Carrying Value
Balance at 1 January 2018 32,156 81,349 2,710 26,709 142,924
Balance at 31 December 2018 19,140 60,816 1,640 21,242 102,838

122 EuroChem Annual Report and Accounts 2018
(all amounts are presented in thousands of US dollars, unless otherwise stated)
Notes to the Consolidated Financial Statementsfor the year ended 31 December 2018 continued
11. Intangible assets continued
Know-how and production technology
Customer relationships
Acquired software and
licencesTrademarks and others Total
Cost
Balance at 1 January 2017 93,508 125,801 30,396 41,491 291,196
Additions – 276 598 870 1,744
Disposal due to sale of subsidiary – – (12) – (12)
Disposals – – – (1,206) (1,206)
Currency translation difference 12,079 8,907 3,594 3,004 27,584
Balance at 31 December 2017 105,587 134,984 34,576 44,159 319,306
Accumulated Depreciation
Balance at 1 January 2017 (54,128) (32,875) (27,330) (13,238) (127,571)
Charge for the year (11,469) (16,042) (1,281) (3,493) (32,285)
Disposal due to sale of subsidiary – – 12 – 12
Disposals – – – 4 4
Currency translation difference (7,834) (4,718) (3,267) (723) (16,542)
Balance at 31 December 2017 (73,431) (53,635) (31,866) (17,450) (176,382)
Net Carrying Value
Balance at 1 January 2017 39,380 92,926 3,066 28,253 163,625
Balance at 31 December 2017 32,156 81,349 2,710 26,709 142,924
12. Investment in associates and joint venturesThe Group’s investment in associates and joint ventures was as follows:
31 December
201831 December
2017
Investment in joint venture EuroChem-Migao Ltd. 23,019 20,845
Investment in associate Agrinos AS – 5,401
Others 15,179 16,906
Total 38,198 43,152
The category “Others” includes investments in joint ventures Thyssen Schachtbau EuroChem Drilling LLC, Biochem Technologies LLC and associates Hispalense de Liquidos S.L., and Azottech LLC, which are individually immaterial.

Strategic Report Corporate Governance Financial Statements
EuroChem Annual Report and Accounts 2018 123
(all amounts are presented in thousands of US dollars, unless otherwise stated)
Movements in the carrying amount of the Group’s investment in associates and joint ventures were:
2018 2017
Carrying amount at 1 January 43,152 36,500
Acquisition of interest in associates and joint ventures – 9,347
Other movement of investment in associate (201) –
Disposal of interest held in associate due to loss of significant influence (5,401) –
Share of profit/(loss) of associates and joint ventures, net 3,395 (2,803)
Share of other comprehensive income/(loss) of associates and joint ventures, net (917) (247)
Currency translation difference (1,830) 355
Carrying amount at 31 December 38,198 43,152
Reconciliation of the summarised financial information presented to the carrying amount of the Group’s interest in associates and joint ventures as at 31 December 2018 and 31 December 2017:
EuroChem-Migao Ltd. Others
Opening net assets at 1 January 2018 41,690 19,598
Profit/(loss) for the period, net 5,943 456
Other comprehensive income/(loss) for the period, net (1,596) (237)
Disposal of net assets of Agrinos AS due to loss of significant influence – 5,864
Currency translation difference arising on consolidation – (3,369)
Closing net assets at 31 December 2018 46,037 22,312
Interest, % 50.00% N/a
Interest in associates and joint ventures 23,019 9,870
Currency translation difference – (425)
Goodwill – 5,734
Carrying value at 31 December 2018 23,019 15,179
EuroChem-Migao Ltd. Others
Opening net assets at 1 January 2017 41,033 32,693
Net assets at acquisition date – 8,801
Profit/(loss) for the period 1,481 (23,345)
Other comprehensive income/(loss) for the period, net (824) 592
Currency translation difference arising on consolidation – 857
Closing net assets at 31 December 2017 41,690 19,598
Interest, % 50.00% N/a
Interest in associates and joint ventures 20,845 10,120
Goodwill – 12,187
Carrying value at 31 December 2017 20,845 22,307
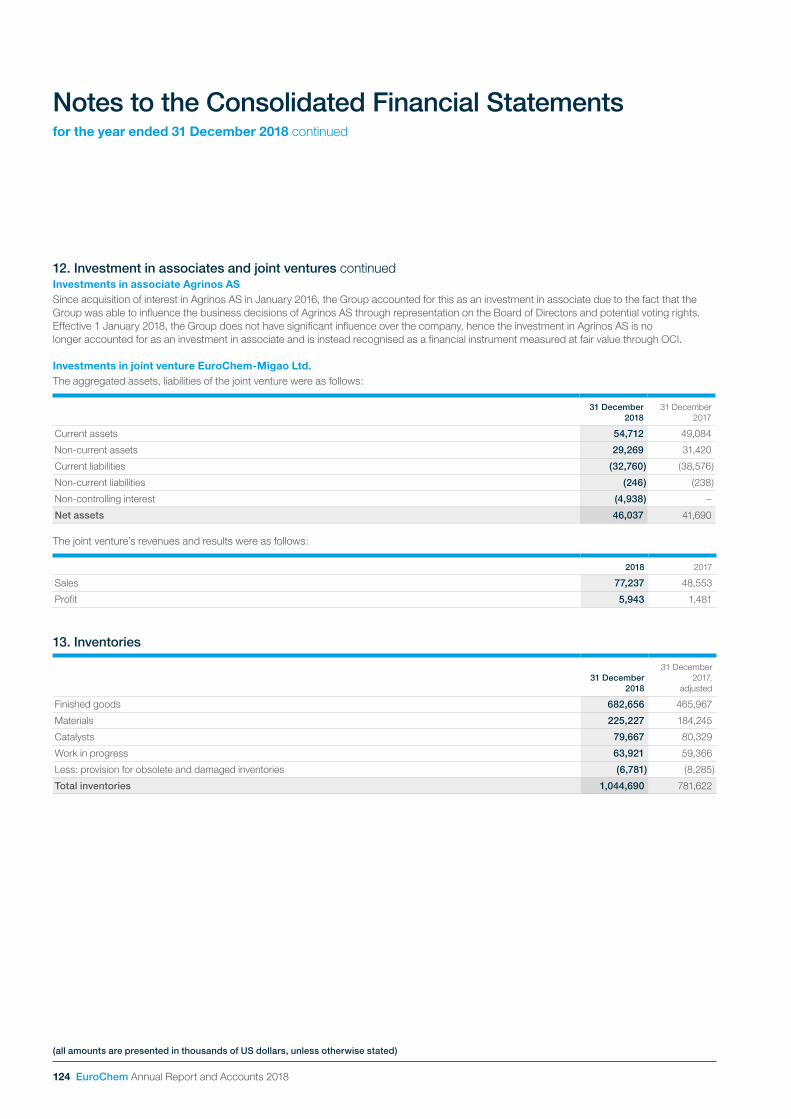
124 EuroChem Annual Report and Accounts 2018
(all amounts are presented in thousands of US dollars, unless otherwise stated)
Notes to the Consolidated Financial Statementsfor the year ended 31 December 2018 continued
12. Investment in associates and joint ventures continuedInvestments in associate Agrinos ASSince acquisition of interest in Agrinos AS in January 2016, the Group accounted for this as an investment in associate due to the fact that the Group was able to influence the business decisions of Agrinos AS through representation on the Board of Directors and potential voting rights. Effective 1 January 2018, the Group does not have significant influence over the company, hence the investment in Agrinos AS is no longer accounted for as an investment in associate and is instead recognised as a financial instrument measured at fair value through OCI.
Investments in joint venture EuroChem-Migao Ltd.The aggregated assets, liabilities of the joint venture were as follows:
31 December 2018
31 December 2017
Current assets 54,712 49,084
Non-current assets 29,269 31,420
Current liabilities (32,760) (38,576)
Non-current liabilities (246) (238)
Non-controlling interest (4,938) –
Net assets 46,037 41,690
The joint venture’s revenues and results were as follows:
2018 2017
Sales 77,237 48,553
Profit 5,943 1,481
13. Inventories
31 December 2018
31 December 2017,
adjusted
Finished goods 682,656 465,967
Materials 225,227 184,245
Catalysts 79,667 80,329
Work in progress 63,921 59,366
Less: provision for obsolete and damaged inventories (6,781) (8,285)
Total inventories 1,044,690 781,622
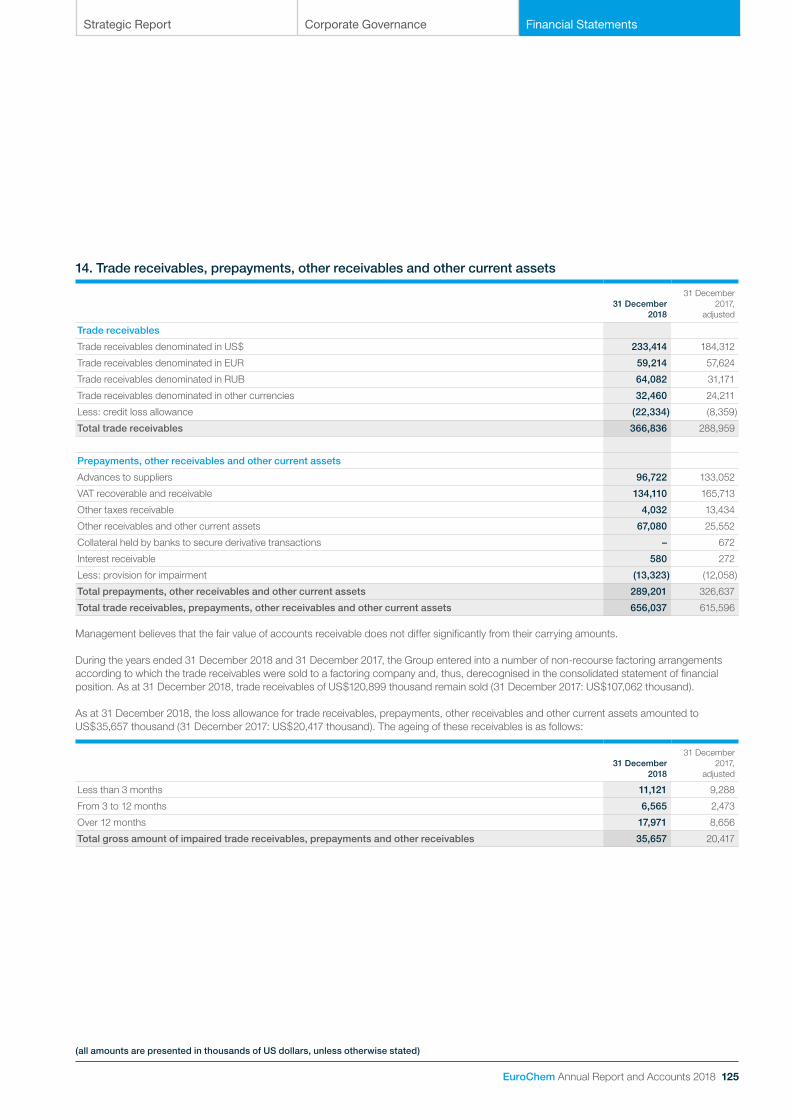
Strategic Report Corporate Governance Financial Statements
EuroChem Annual Report and Accounts 2018 125
(all amounts are presented in thousands of US dollars, unless otherwise stated)
14. Trade receivables, prepayments, other receivables and other current assets
31 December 2018
31 December 2017,
adjusted
Trade receivables
Trade receivables denominated in US$ 233,414 184,312
Trade receivables denominated in EUR 59,214 57,624
Trade receivables denominated in RUB 64,082 31,171
Trade receivables denominated in other currencies 32,460 24,211
Less: credit loss allowance (22,334) (8,359)
Total trade receivables 366,836 288,959
Prepayments, other receivables and other current assets
Advances to suppliers 96,722 133,052
VAT recoverable and receivable 134,110 165,713
Other taxes receivable 4,032 13,434
Other receivables and other current assets 67,080 25,552
Collateral held by banks to secure derivative transactions – 672
Interest receivable 580 272
Less: provision for impairment (13,323) (12,058)
Total prepayments, other receivables and other current assets 289,201 326,637
Total trade receivables, prepayments, other receivables and other current assets 656,037 615,596
Management believes that the fair value of accounts receivable does not differ significantly from their carrying amounts.
During the years ended 31 December 2018 and 31 December 2017, the Group entered into a number of non-recourse factoring arrangements according to which the trade receivables were sold to a factoring company and, thus, derecognised in the consolidated statement of financial position. As at 31 December 2018, trade receivables of US$120,899 thousand remain sold (31 December 2017: US$107,062 thousand).
As at 31 December 2018, the loss allowance for trade receivables, prepayments, other receivables and other current assets amounted to US$35,657 thousand (31 December 2017: US$20,417 thousand). The ageing of these receivables is as follows:
31 December 2018
31 December 2017,
adjusted
Less than 3 months 11,121 9,288
From 3 to 12 months 6,565 2,473
Over 12 months 17,971 8,656
Total gross amount of impaired trade receivables, prepayments and other receivables 35,657 20,417

126 EuroChem Annual Report and Accounts 2018
(all amounts are presented in thousands of US dollars, unless otherwise stated)
Notes to the Consolidated Financial Statementsfor the year ended 31 December 2018 continued
14. Trade receivables, prepayments, other receivables and other current assets continuedAs at 31 December 2018, trade receivables of US$58,654 thousand (31 December 2017: US$38,655 thousand) were past due but not impaired. Of this amount US$35,318 thousand (31 December 2017: US$19,540 thousand) were covered either by bank guarantees or backed by solid ratings from independent rating agencies or by internal creditworthiness rating and internal payment discipline rating (Note 35). The ageing analysis of these trade receivables from past due date is:
31 December
201831 December
2017
Less than 3 months 54,627 25,329
From 3 to 12 months 2,504 6,710
Over 12 months 1,523 6,616
Trade accounts receivable past due not impaired 58,654 38,655
Analysis of the credit quality of trade receivables is presented in Note 35.
The movements in the ECL allowance/provision for impairment of accounts receivable are:
Trade receivables
Other receivables
As at 1 January 2018 8,359 12,058
ECL allowance 15,888 4,534
Write-offs (272) (244)
ECL allowance reversed (1,031) (1,047)
Disposal of ECL allowance due to sale of subsidiary (64) –
Currency translation difference (546) (1,978)
Total ECL allowance and provision for impairment of accounts receivable as at 31 December 2018 22,334 13,323
Trade receivables
Other receivables
As at 1 January 2017 5,429 7,670
Provision charged 14,958 7,103
Provision used (14,854) (1,082)
Provision reversed (919) (899)
Disposal of provision due to sale of subsidiary (588) (933)
Currency translation difference 191 199
Total provision for impairment of accounts receivable as at 31 December 2017 4,217 12,058
Adjustment due to adoption of IFRS 9 4,142 –
Total ECL allowance and provision for impairment of accounts receivable as at 31 December 2017, adjusted 8,359 12,058

Strategic Report Corporate Governance Financial Statements
EuroChem Annual Report and Accounts 2018 127
(all amounts are presented in thousands of US dollars, unless otherwise stated)
15. Cash and cash equivalents, fixed-term deposits and restricted cash
31 December 2018
31 December 2017
Cash on hand1 5,777 1,798
Bank balances denominated in US$ 96,829 80,898
Bank balances denominated in RUB 16,827 11,174
Bank balances denominated in EUR 91,140 48,726
Bank balances denominated in other currencies 10,110 9,016
Term deposits denominated in US$ 77,214 42
Term deposits denominated in RUB 9,467 26,479
Term deposits denominated in Euro 296 –
Term deposits denominated in other currencies 34,251 50,480
Total cash and cash equivalents 341,911 228,613
Fixed-term deposits in different currencies 1,801 151
Total fixed-term deposits 1,801 151
Current restricted cash 2,850 20,101
Non-current restricted cash 2,276 22,345
Total restricted cash 5,126 42,4461. Includes cash on hand denominated in different currencies.
Term deposits as at 31 December 2018 and 31 December 2017 were held to meet short-term cash needs and had various original maturities but could be withdrawn on request without any restrictions.
Fixed-term deposits have various original maturities and can be withdrawn with an early notification and/or with a penalty accrued or interest income forfeited.
No bank balances, term or fixed-term deposits are past due or impaired. The credit quality of bank balances, term and fixed-term deposits which is based on the credit ratings of independent rating agencies, Standard & Poor’s and Fitch Ratings, is as follows2:
31 December
201831 December
2017
A to AAA rated 76,970 67,384
BB- to BBB+ rated 251,675 190,222
B- to B+ rated 2,491 6,342
C to CCC rated 2,293 13
Unrated 9,632 5,451
Total3 343,061 269,4122. Credit ratings as at 16 January 2019 and 17 January 2018, respectively.
3. The rest of the consolidated statement of financial position item ‘cash and cash equivalents’ is cash on hand.
At 31 December 2018, non-current restricted cash consisted of US$1,865 thousand held in bank accounts as security deposits for third parties (31 December 2017: US$2,153 thousand) and US$411 thousand held in deposit against possible environmental obligations in compliance with the statutory rules of the Republic of Kazakhstan (31 December 2017: US$459 thousand). In June 2018, cash held in a debt service reserve account as required by the Usolsky Project Finance Facility Agreement was released due to early repayment of the Facility (31 December 2017: US$19,733 thousand) (Note 19).
At 31 December 2018, current restricted cash consisted of US$954 thousand received under targeted loan agreements with a state industrial development fund (31 December 2017: US$18,166 thousand) and of US$1,896 thousand held at banks under regulatory requirements for state contracts (31 December 2017: US$1,935 thousand).

128 EuroChem Annual Report and Accounts 2018
(all amounts are presented in thousands of US dollars, unless otherwise stated)
Notes to the Consolidated Financial Statementsfor the year ended 31 December 2018 continued
16. Disposal of subsidiariesIn May 2018, the Board of Directors of the Group made a decision to sell two subsidiaries, within the Sales division, located in Ukraine. By the end of May 2018, the Group sold a 100% share in both companies to third parties for a consideration of US$53,064 thousand payable in five years in the form of promissory notes denominated in the Ukrainian hryvnia which were discounted to US$29,397 thousand. In the third quarter 2018, a portion of the promissory notes with the carrying value of US$18,043 thousand was sold to a related party for a consideration of US$28,638 thousand denominated in the Ukrainian hryvnia. The result from the sale of promissory notes was recognised within “Gain/(loss) from disposal of subsidiaries, net” in the consolidated statement of profit or loss. The respective receivable was accounted for within “Prepayments, other receivables and other current assets” as at 31 December 2018. In the fourth quarter 2018, the portion of receivable of US$3,768 thousand was repaid. The remaining part was accounted for within “Other non-current assets” in the consolidated statement of financial position.
As at date of disposal the assets and liabilities of subsidiaries were as follows:
Cash and cash equivalents 3,477
Trade receivables 5,957
Prepayments, other receivables and other current assets 13,047
Inventories 34,891
Total current assets 57,372
Goodwill 60
Property, plant and equipment 5,541
Total non-current assets 5,601
Trade payables (5,756)
Other accounts payable and accrued expenses (1,892)
Income tax payable (551)
Total current liabilities (8,199)
Deferred income tax liabilities (114)
Total non-current liabilities (114)
Net assets 54,660
Discounted consideration (29,397)
Currency translation differences reclassified to profit or loss 25,289
Loss on disposal 50,552
The Group recognised a loss on disposal of US$50,552 thousand.
17. EquityShare capitalAs at 31 December 2018 and 31 December 2017, the nominal registered amount of the Company’s issued share capital in Swiss francs (“CHF”) was CHF 100 thousand (US$111 thousand). The total authorised number of ordinary shares is 1,000 shares with a par value of CHF 100 (US$111) per share. All authorised shares were issued and fully paid in 2014.
DividendsDuring 2018 and 2017 the Group did not declare or pay dividends.
Capital contributionIn 2016, the Group signed an agreement and subsequently several amendments with AIM Capital S.E. to receive a capital contribution in a form of a perpetual loan up to US$1 billion with the availability period to 31 December 2020. In 2016 and in June 2018 the Group received funds of US$250 million and US$600 million, respectively.
Other reserves within “Retained earnings and other reserves”At 31 December 2018 and 31 December 2017, other reserves of the Company included a cash contribution of US$5,000 thousand from AIM Capital S.E., the parent company.
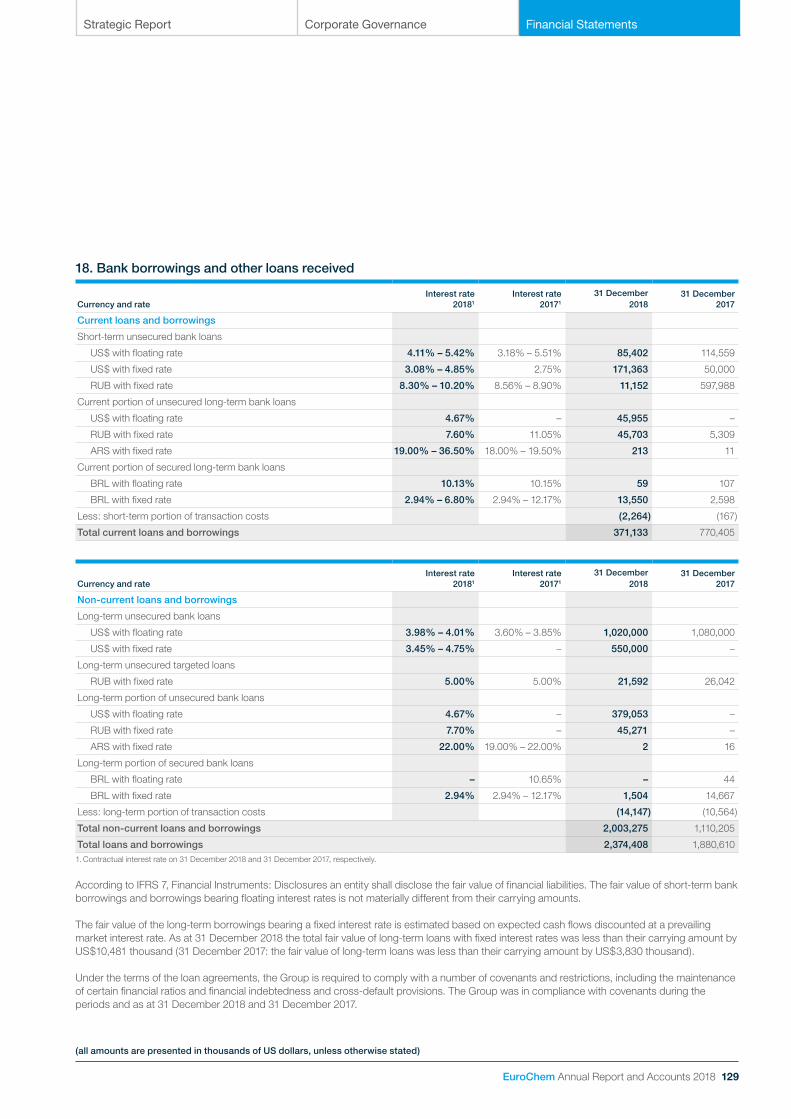
Strategic Report Corporate Governance Financial Statements
EuroChem Annual Report and Accounts 2018 129
(all amounts are presented in thousands of US dollars, unless otherwise stated)
18. Bank borrowings and other loans received
Currency and rateInterest rate
20181
Interest rate 20171
31 December2018
31 December2017
Current loans and borrowings
Short-term unsecured bank loans
US$ with floating rate 4.11% – 5.42% 3.18% – 5.51% 85,402 114,559
US$ with fixed rate 3.08% – 4.85% 2.75% 171,363 50,000
RUB with fixed rate 8.30% – 10.20% 8.56% – 8.90% 11,152 597,988
Current portion of unsecured long-term bank loans
US$ with floating rate 4.67% – 45,955 –
RUB with fixed rate 7.60% 11.05% 45,703 5,309
ARS with fixed rate 19.00% – 36.50% 18.00% – 19.50% 213 11
Current portion of secured long-term bank loans
BRL with floating rate 10.13% 10.15% 59 107
BRL with fixed rate 2.94% – 6.80% 2.94% – 12.17% 13,550 2,598
Less: short-term portion of transaction costs (2,264) (167)
Total current loans and borrowings 371,133 770,405
Currency and rateInterest rate
20181
Interest rate 20171
31 December2018
31 December2017
Non-current loans and borrowings
Long-term unsecured bank loans
US$ with floating rate 3.98% – 4.01% 3.60% – 3.85% 1,020,000 1,080,000
US$ with fixed rate 3.45% – 4.75% – 550,000 –
Long-term unsecured targeted loans
RUB with fixed rate 5.00% 5.00% 21,592 26,042
Long-term portion of unsecured bank loans
US$ with floating rate 4.67% – 379,053 –
RUB with fixed rate 7.70% – 45,271 –
ARS with fixed rate 22.00% 19.00% – 22.00% 2 16
Long-term portion of secured bank loans
BRL with floating rate – 10.65% – 44
BRL with fixed rate 2.94% 2.94% – 12.17% 1,504 14,667
Less: long-term portion of transaction costs (14,147) (10,564)
Total non-current loans and borrowings 2,003,275 1,110,205
Total loans and borrowings 2,374,408 1,880,6101. Contractual interest rate on 31 December 2018 and 31 December 2017, respectively.
According to IFRS 7, Financial Instruments: Disclosures an entity shall disclose the fair value of financial liabilities. The fair value of short-term bank borrowings and borrowings bearing floating interest rates is not materially different from their carrying amounts.
The fair value of the long-term borrowings bearing a fixed interest rate is estimated based on expected cash flows discounted at a prevailing market interest rate. As at 31 December 2018 the total fair value of long-term loans with fixed interest rates was less than their carrying amount by US$10,481 thousand (31 December 2017: the fair value of long-term loans was less than their carrying amount by US$3,830 thousand).
Under the terms of the loan agreements, the Group is required to comply with a number of covenants and restrictions, including the maintenance of certain financial ratios and financial indebtedness and cross-default provisions. The Group was in compliance with covenants during the periods and as at 31 December 2018 and 31 December 2017.
130 EuroChem Annual Report and Accounts 2018
(all amounts are presented in thousands of US dollars, unless otherwise stated)
Notes to the Consolidated Financial Statementsfor the year ended 31 December 2018 continued
18. Bank borrowings and other loans received continuedInterest rates and outstanding amounts of major loans and borrowingsIn December 2018, the Group signed an uncommitted revolving credit facility with a Russian bank. The funds through this facility may be obtained in multiple currencies. As at 31 December 2018, the outstanding amount was US$150 million.
In June 2018, the Group signed a US$820 million committed credit facility bearing a floating interest rate and maturing in July 2021. As at 31 December 2018, the outstanding amount was US$820 million.
In March 2018, the Group signed a US$200 million committed credit facility bearing a floating interest rate and maturing in April 2021. As at 31 December 2018, the outstanding amount was US$200 million.
In 2017, the Group signed a 3-year uncommitted facility agreement with a Russian bank. The funds through this facility may be obtained in multiple currencies with a credit limit up to US$550 million. As at 31 December 2018, the outstanding amount was RUB 6,320 million (31 December 2017: RUB 14,250 million).
In 2017, the Group signed a US$750 million unsecured credit facility bearing a floating interest rate and maturing in September 2022. As at 31 December 2018, the outstanding amount was US$425 million (31 December 2017: US$750 million).
In 2014, the Group signed an uncommitted revolving credit facility with a Russian bank. The funds through this facility may be obtained in multiple currencies. As at 31 December 2018, the outstanding amount was US$500 million (31 December 2017: US$330 million).
Undrawn facilitiesAs at 31 December 2018, the below facilities had no outstanding balances and are available to the Group:
• US$125 million uncommitted revolving credit facility bearing a floating interest rate, signed in April 2016, maturing in April 2019;
• US$100 million committed credit facility bearing a floating interest rate, signed in December 2018, maturing in December 2023. The drawdown was made in the full amount in January 2019.
• US$100 million uncommitted revolving credit facility bearing a floating interest rate, signed in May 2012, maturing in May 2020.
• RUB 20 billion uncommitted revolving credit agreement, signed in September 2016, maturing in September 2019.
Collaterals and pledgesAs at 31 December 2018, loans of a Brazilian subsidiary totalling US$15,113 thousand were collateralised by property, plant and equipment with a carrying value of US$17,155 thousand (31 December 2017: loans of US$17,416 thousand were collateralised by property, plant and equipment with a carrying value of US$30,748 thousand).
As at 31 December 2018 and 31 December 2017, all other bank borrowings and loans received listed in Note 18 were not secured.
19. Project FinanceDue to the non-recourse nature of the Project Finance facilities they are excluded from financial covenant calculations in accordance with the Group’s various debt, project, finance, legal and other documents and are presented as a separate line “Project Finance” in the consolidated statement of financial position.
Usolskiy potash projectIn 2014, the Group signed a US$750 million Non-recourse Project Finance Facility Agreement (“Project Financing” or the “Facility”) maturing at the end of 2022 with a floating interest rate based on 3-month Libor for financing the Usolskiy potash project located in the Perm region of Russia.
In June 2018, the Project Finance Facility was repaid. As at 31 December 2017, the outstanding balance was US$732,255 thousand shown net of transaction costs of US$17,745 thousand.
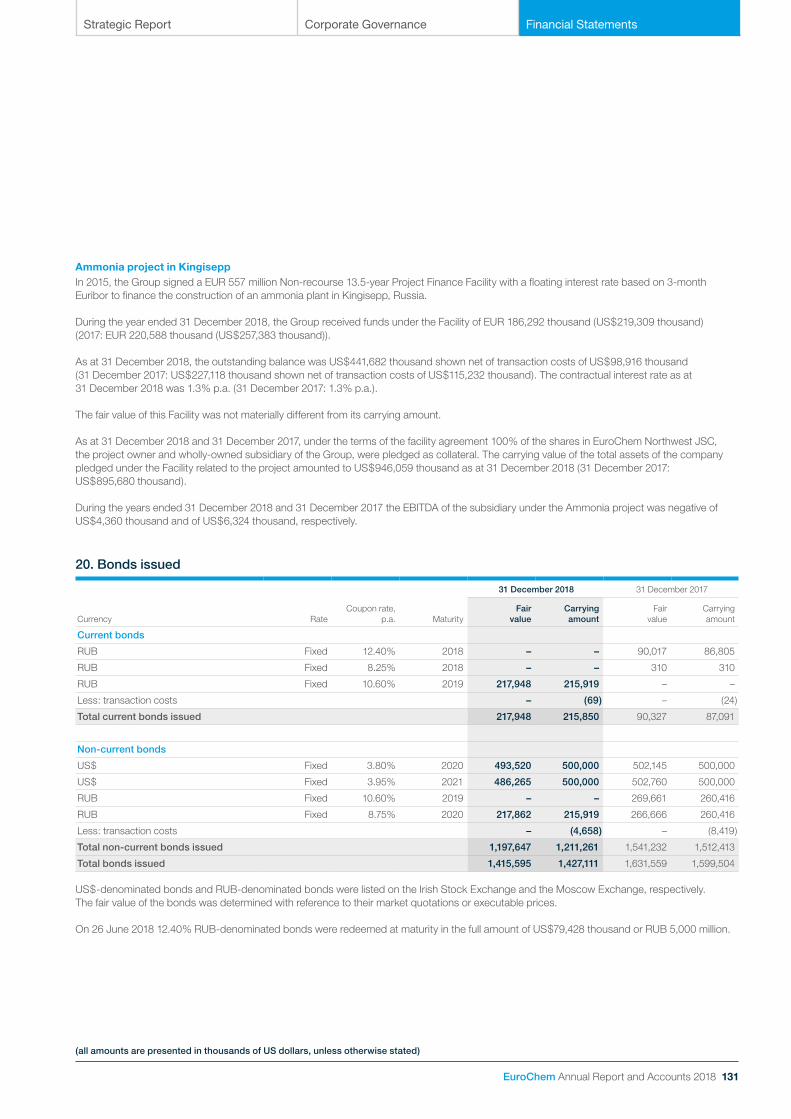
Strategic Report Corporate Governance Financial Statements
EuroChem Annual Report and Accounts 2018 131
(all amounts are presented in thousands of US dollars, unless otherwise stated)
Ammonia project in KingiseppIn 2015, the Group signed a EUR 557 million Non-recourse 13.5-year Project Finance Facility with a floating interest rate based on 3-month Euribor to finance the construction of an ammonia plant in Kingisepp, Russia.
During the year ended 31 December 2018, the Group received funds under the Facility of EUR 186,292 thousand (US$219,309 thousand) (2017: EUR 220,588 thousand (US$257,383 thousand)).
As at 31 December 2018, the outstanding balance was US$441,682 thousand shown net of transaction costs of US$98,916 thousand (31 December 2017: US$227,118 thousand shown net of transaction costs of US$115,232 thousand). The contractual interest rate as at 31 December 2018 was 1.3% p.a. (31 December 2017: 1.3% p.a.).
The fair value of this Facility was not materially different from its carrying amount.
As at 31 December 2018 and 31 December 2017, under the terms of the facility agreement 100% of the shares in EuroChem Northwest JSC, the project owner and wholly-owned subsidiary of the Group, were pledged as collateral. The carrying value of the total assets of the company pledged under the Facility related to the project amounted to US$946,059 thousand as at 31 December 2018 (31 December 2017: US$895,680 thousand).
During the years ended 31 December 2018 and 31 December 2017 the EBITDA of the subsidiary under the Ammonia project was negative of US$4,360 thousand and of US$6,324 thousand, respectively.
20. Bonds issued
31 December 2018 31 December 2017
Currency RateCoupon rate,
p.a. MaturityFair
valueCarrying amount
Fairvalue
Carrying amount
Current bonds
RUB Fixed 12.40% 2018 – – 90,017 86,805
RUB Fixed 8.25% 2018 – – 310 310
RUB Fixed 10.60% 2019 217,948 215,919 – –
Less: transaction costs – (69) – (24)
Total current bonds issued 217,948 215,850 90,327 87,091
Non-current bonds
US$ Fixed 3.80% 2020 493,520 500,000 502,145 500,000
US$ Fixed 3.95% 2021 486,265 500,000 502,760 500,000
RUB Fixed 10.60% 2019 – – 269,661 260,416
RUB Fixed 8.75% 2020 217,862 215,919 266,666 260,416
Less: transaction costs – (4,658) – (8,419)
Total non-current bonds issued 1,197,647 1,211,261 1,541,232 1,512,413
Total bonds issued 1,415,595 1,427,111 1,631,559 1,599,504
US$-denominated bonds and RUB-denominated bonds were listed on the Irish Stock Exchange and the Moscow Exchange, respectively. The fair value of the bonds was determined with reference to their market quotations or executable prices.
On 26 June 2018 12.40% RUB-denominated bonds were redeemed at maturity in the full amount of US$79,428 thousand or RUB 5,000 million.
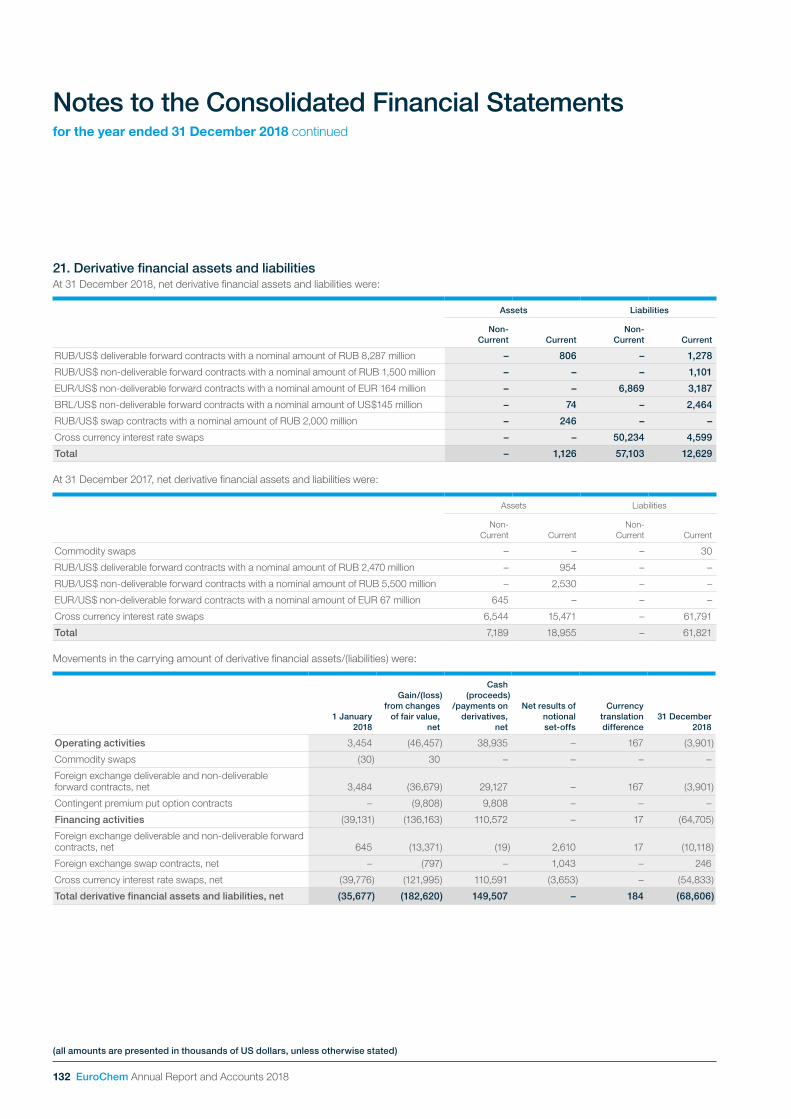
132 EuroChem Annual Report and Accounts 2018
(all amounts are presented in thousands of US dollars, unless otherwise stated)
Notes to the Consolidated Financial Statementsfor the year ended 31 December 2018 continued
21. Derivative financial assets and liabilities At 31 December 2018, net derivative financial assets and liabilities were:
Assets Liabilities
Non-Current Current
Non-Current Current
RUB/US$ deliverable forward contracts with a nominal amount of RUB 8,287 million – 806 – 1,278
RUB/US$ non-deliverable forward contracts with a nominal amount of RUB 1,500 million – – – 1,101
EUR/US$ non-deliverable forward contracts with a nominal amount of EUR 164 million – – 6,869 3,187
BRL/US$ non-deliverable forward contracts with a nominal amount of US$145 million – 74 – 2,464
RUB/US$ swap contracts with a nominal amount of RUB 2,000 million – 246 – –
Cross currency interest rate swaps – – 50,234 4,599
Total – 1,126 57,103 12,629
At 31 December 2017, net derivative financial assets and liabilities were:
Assets Liabilities
Non-Current Current
Non-Current Current
Commodity swaps – – – 30
RUB/US$ deliverable forward contracts with a nominal amount of RUB 2,470 million – 954 – –
RUB/US$ non-deliverable forward contracts with a nominal amount of RUB 5,500 million – 2,530 – –
EUR/US$ non-deliverable forward contracts with a nominal amount of EUR 67 million 645 – – –
Cross currency interest rate swaps 6,544 15,471 – 61,791
Total 7,189 18,955 – 61,821
Movements in the carrying amount of derivative financial assets/(liabilities) were:
1 January 2018
Gain/(loss) from changes
of fair value, net
Cash(proceeds)
/payments on derivatives,
net
Net results of notional set-offs
Currency translation difference
31 December 2018
Operating activities 3,454 (46,457) 38,935 – 167 (3,901)
Commodity swaps (30) 30 – – – –
Foreign exchange deliverable and non-deliverable forward contracts, net 3,484 (36,679) 29,127 – 167 (3,901)
Contingent premium put option contracts – (9,808) 9,808 – – –
Financing activities (39,131) (136,163) 110,572 – 17 (64,705)
Foreign exchange deliverable and non-deliverable forward contracts, net 645 (13,371) (19) 2,610 17 (10,118)
Foreign exchange swap contracts, net – (797) – 1,043 – 246
Cross currency interest rate swaps, net (39,776) (121,995) 110,591 (3,653) – (54,833)
Total derivative financial assets and liabilities, net (35,677) (182,620) 149,507 – 184 (68,606)

Strategic Report Corporate Governance Financial Statements
EuroChem Annual Report and Accounts 2018 133
(all amounts are presented in thousands of US dollars, unless otherwise stated)
Changes in the fair value of derivatives, which are entered into for the purpose of mitigating risks linked to cash flows from operating activities of the Group, are recognised in “Other operating income/(expenses), net” (Note 29), foreign currency derivative contracts and contingent premium put option contracts are recognised in “Foreign exchange gain/(loss) from operating activities, net” and commodity swaps are recognised in “Other operating income/(expenses), net”.
Changes in the fair value of derivatives, which are entered into for the purpose of hedging the financing and investing cash flows, are recognised in “Other financial gain/(loss), net” (Note 30).
Cross currency interest rate swapsIn June 2018, the Group signed RUB/US$ cross currency interest rate swap agreements with a total notional amount of RUB 6,320 million, which mature in the period from June 2019 to September 2020.
Outstanding at the beginning of the year, RUB/US$ cross currency interest rate swap agreements with a total notional amount of RUB 34,250 million matured in the period from July to September 2018.
Outstanding at the beginning of the year, RUB/US$ cross currency interest rate swap agreements with a total notional amount of US$235 million matured in September 2018. Settlement of the swaps was performed subject to netting of RUB-denominated payments partly with RUB/US$ deliverable forward contracts signed in the period from August to September 2018 with a total notional amount of RUB 8,132 million that matured in September 2018 and partly with RUB/US$ swap contracts signed in September 2018 with a total notional amount of RUB 2,000 million, which mature in April 2019.
Foreign exchange non-deliverable forward contractsOutstanding at the beginning of the year, RUB/US$ non-deliverable forward contracts with a total notional amount of RUB 5,500 million matured in the period from January to April 2018.
In the period from January to May 2018, the Group signed EUR/US$ non-deliverable forward contracts with a total notional amount of EUR 97 million, which mature in the period from May 2020 to November 2021.
In the period from February to April 2018, the Group signed RUB/US$ non-deliverable forward contracts with a total notional amount of RUB 23,598 million, out of which contracts with a total notional amount of RUB 22,098 million matured in the period from May to December 2018, and the outstanding contract matures in January 2019.
Foreign exchange deliverable forward contractsOutstanding at the beginning of the year, RUB/US$ deliverable forward contracts with a total notional amount of RUB 2,470 million matured in the period from March to June 2018.
In the period from March to September 2018, the Group signed RUB/US$ deliverable forward contracts with a total notional amount of RUB 11,600 million, out of which contracts with a total notional amount of RUB 3,313 million matured in the period from June to October 2018, and the outstanding contracts mature in the period from March to April 2019.
Put option contractsIn the period from January to March 2018, the Group signed contingent premium RUB/US$ put option contracts with a total notional amount of US$249 million which matured in the period from July to October 2018.

134 EuroChem Annual Report and Accounts 2018
(all amounts are presented in thousands of US dollars, unless otherwise stated)
Notes to the Consolidated Financial Statementsfor the year ended 31 December 2018 continued
22. Other non-current liabilities and deferred income
Note31 December
201831 December
2017
Liability from contingent consideration related to business combination 33 122,866 123,001
Deferred payable related to acquisition of additional interest in subsidiary 1,500 3,000
Deferred payable related to business combination 321 –
Deferred payable related to mineral rights acquisition 11,088 11,785
Provisions for age premium, retirement benefits, pensions and similar obligations 22,768 25,683
Provision for land restoration 23 17,625 26,348
Deferred income − Investment grants received 1,889 2,584
Total other non-current liabilities and deferred income 178,057 192,401
23. Provision for land restorationIn accordance with federal, state and local environmental regulations the Group’s mining, drilling and processing activities result in asset retirement obligations to restore the disturbed land in regions in which the Group operates.
Movements in the amount of provision for land restoration were as follows:
Note 2018 2017
As at 1 January 26,348 21,433
Change in estimates 8 (6,138) 4,350
Unwinding of the present value discount 30 1,903 1,857
Disposal of provision due to sale of subsidiary – (2,486)
Currency translation difference (4,488) 1,194
Total provision for land restoration as at 31 December 17,625 26,348
During the years ended 31 December 2018 and 31 December 2017, the Group reassessed estimates of provision for land restoration due to changes in inflation, discount rates and expected timing for land restoration. Therefore, the amount of provision for land restoration was recalculated and the appropriate changes were disclosed as a change in estimates.
The principal assumptions used for the calculation of land restoration provision were as follows:
31 December 2018
31 December 2017
Discount rates 8.18% – 8.95% 6.97% – 9.10%
Expected inflation rates in Russia 3.60% – 4.00% 2.60% – 4.00%
Expected timing for land restoration 2021 – 2070 2021 – 2063

Strategic Report Corporate Governance Financial Statements
EuroChem Annual Report and Accounts 2018 135
(all amounts are presented in thousands of US dollars, unless otherwise stated)
The present value of expected costs to be incurred for the settlement of land restoration obligations was as follows:
31 December 2018
31 December 2017
Between 1 and 5 years 307 359
Between 6 and 10 years – 1,369
Between 11 and 20 years 4,261 4,637
More than 20 years 13,057 19,983
Total provision for land restoration 17,625 26,348
24. Trade payables, other accounts payable and accrued expenses
31 December 2018
31 December 2017
Trade payables
Trade payables denominated in US$ 136,147 170,190
Trade payables denominated in EUR 143,060 167,176
Trade payables denominated in RUB 86,380 127,298
Trade payables denominated in other currencies 23,972 10,257
Trade payables denominated in RUB with irrevocable documentary letter of credit 80,705 38,083
Total trade payables 470,264 513,004
Other accounts payable and accrued expenses
Advances received 157,773 82,414
Payroll and social tax 14,933 13,082
Accrued liabilities and other creditors 204,068 199,618
Interest payable 27,457 29,604
Payables for acquisition of associate – 3,229
Short-term part of deferred payable related to mineral rights acquisition 1,460 1,875
Short-term part of deferred payables related to business combination and acquisition of additional interest in subsidiary 1,500 4,697
Total other payables 407,191 334,519
Total trade payables, other accounts payable and accrued expenses 877,455 847,523
As at 31 December 2018, trade payables included payables to suppliers of property, plant and equipment and construction companies of US$123,116 thousand (31 December 2017: US$174,748 thousand). Trade payables included payables with irrevocable documentary letters of credit with a deferred term of payment opened in the amount of US$72,120 thousand (31 December 2017: US$38,083 thousand) under the contracts with the construction companies, of US$6,709 thousand under the contract with suppliers of property, plant and equipment (31 December 2017: nil) and of US$1,875 thousand under operating activities contracts (31 December 2017: nil).

136 EuroChem Annual Report and Accounts 2018
(all amounts are presented in thousands of US dollars, unless otherwise stated)
Notes to the Consolidated Financial Statementsfor the year ended 31 December 2018 continued
25. SalesThe external sales by product group were:
2018 2017
Sales volume (thousand
metric tonnes)
Sales (thousand
US$)
Sales volume (thousand
metric tonnes)
Sales (thousand
US$)
Nitrogen products 7,813 1,837,985 8,073 1,704,825
Nitrogen fertilizers 7,797 1,835,278 8,055 1,702,101
Other products 16 2,707 18 2,724
Phosphate and complex fertilizers 5,685 2,317,795 5,319 1,899,473
Phosphate fertilizers 2,379 1,044,475 2,304 848,918
Complex fertilizers 2,907 1,097,168 2,667 915,183
Feed phosphates 399 176,152 348 135,372
Potash fertilizers 632 235,705 454 148,590
Mining products 5,977 422,252 5,912 435,859
Iron ore concentrate 5,844 381,800 5,878 405,562
Other products 133 40,452 34 30,297
Industrial products 1,871 632,003 1,642 532,104
Hydrocarbons – – 74 24,860
Other sales – 131,732 – 119,953
Logistic services – 43,728 – 36,998
Other products – 31,937 – 36,597
Other services – 56,067 – 46,358
Total sales 5,577,472 4,865,664
The sales of fertilizers, mining and industrial products for year ended 31 December 2018 include US$273,449 thousand of revenues from delivery of these products to customers (2017: US$259,950 thousand).
26. Cost of salesThe components of cost of sales were:
2018 2017
Raw materials 1,204,587 1,025,391
Goods for resale 1,403,816 1,024,779
Other materials 184,508 180,752
Energy 184,709 178,330
Utilities and fuel 84,542 73,478
Labour, including contributions to social funds 244,770 231,737
Depreciation and amortisation 255,366 227,348
Repairs and maintenance 53,253 55,725
Production overheads 78,756 70,150
Property tax, rent payments for land and related taxes 27,236 38,598
Impairment/(reversal of impairment)/write-off of idle property, plant and equipment, net 920 (480)
Provision/(reversal of provision) for obsolete and damaged inventories, net (68) (290)
Changes in work in progress and finished goods (293,288) (47,756)
Other costs/(compensations), net 8,620 21,267
Total cost of sales 3,437,727 3,079,029

Strategic Report Corporate Governance Financial Statements
EuroChem Annual Report and Accounts 2018 137
(all amounts are presented in thousands of US dollars, unless otherwise stated)
27. Distribution costs Distribution costs were:
2018 2017
Transportation 530,320 511,379
Labour, including contributions to social funds 87,650 79,672
Depreciation and amortisation 41,511 37,414
Repairs and maintenance 8,033 7,140
Provision/(reversal of provision) for impairment of receivables, net 16,307 14,531
Other costs 61,164 51,351
Total distribution costs 744,985 701,487
28. General and administrative expensesGeneral and administrative expenses were:
2018 2017
Labour, including contributions to social funds 122,366 122,130
Depreciation and amortisation 11,459 12,328
Audit, consulting and legal services 13,150 14,927
Rent 6,737 7,060
Bank charges 3,436 4,261
Social expenditure 3,227 4,272
Repairs and maintenance 2,401 2,359
Provision/(reversal of provision) for impairment of receivables, net 2,037 5,712
Other expenses 43,479 44,726
Total general and administrative expenses 208,292 217,775
The total depreciation and amortisation expenses included in the consolidated statement of profit or loss amounted to US$308,336 thousand (2017: US$277,090 thousand).
The total labour costs (including social expenses) included in the consolidated statement of profit or loss amounted to US$454,786 thousand (2017: US$433,539 thousand).
The total statutory pension contributions included in all captions of the consolidated statement of profit or loss amounted to US$64,837 thousand (2017: US$63,880 thousand).
The fees for the audit of the consolidated and statutory financial statements for the year ended 31 December 2018 amounted to US$3,063 thousand (2017: US$3,798 thousand). The auditors also provided the Group with other non-audit services amounting to US$152 thousand (2017: US$718 thousand).

138 EuroChem Annual Report and Accounts 2018
(all amounts are presented in thousands of US dollars, unless otherwise stated)
Notes to the Consolidated Financial Statementsfor the year ended 31 December 2018 continued
29. Other operating income and expensesThe components of other operating (income) and expenses were:
2018 2017
Sponsorship 6,752 21,013
(Gain)/loss on disposal of property, plant and equipment and intangible assets, net 8,409 8,708
Foreign exchange (gain)/loss from operating activities, net (3,676) 5,758
Impairment/(reversal of impairment)/write-off of idle property plant and equipment, net 539 5,451
(Gain)/loss on sales and purchases of foreign currencies, net (4,780) (1,661)
Non-recurring (income)/expenses, net 6,155 6,943
Other operating (income)/expenses, net (16,355) (11,112)
Total other operating (income)/expenses, net (2,956) 35,100
30. Other financial gain and lossThe components of other financial (gain) and loss were:
Note 2018 2017
Changes in fair value of cross currency interest rate swaps 21 121,995 (58,970)
Changes in fair value of foreign exchange deliverable and non-deliverable forward contracts 21 13,371 (1,424)
Change in fair value of foreign exchange swap contracts 797 –
Unwinding of liability from contingent consideration related to business combination 19,095 18,879
Unwinding of discount on deferred payables 707 796
Unwinding of discount on land restoration obligation 23 1,903 1,857
Other financial (gain)/loss, net 1,936 (7,443)
Total other financial (gain)/loss, net 159,804 (46,305)
31. Income tax
2018 2017
Income tax expense – current 213,953 148,216
Deferred income tax – origination and reversal of temporary differences, net (21,853) 62,238
Prior periods adjustments for income tax 2,163 (6,339)
Reassessment of deferred tax assets/liabilities due to change in the tax rate 6,158 39,129
Income tax expense 200,421 243,244

Strategic Report Corporate Governance Financial Statements
EuroChem Annual Report and Accounts 2018 139
(all amounts are presented in thousands of US dollars, unless otherwise stated)
A reconciliation between theoretical income tax charge calculated at the applicable tax rates enacted in the countries where Group companies are incorporated, and actual income tax expense calculated as follows:
2018 2017
Profit before taxation 738,842 696,610
Theoretical tax charge at statutory rate of subsidiaries (176,315) (177,190)
Tax effect of items which are not deductible or assessable for taxation purposes:
– Non-deductible expenses (16,189) (14,564)
– (Unrecognised tax loss for the year)/recovery of previously unrecognised tax loss carry forward, net 2,169 (6,596)
– Adjustment on deferred tax assets/liabilities on prior periods (1,765) (12,104)
– Reassessment of deferred tax assets/liabilities due to change in the tax rate (6,158) (39,129)
Prior periods adjustments recognised in the current period for income tax (2,163) 6,339
Income tax expense (200,421) (243,244)
The Group companies are subject to tax rates depending on the country of domicile.
Subsidiaries located in Russia applied a tax rate of 20.0% on taxable profits during the year ended 31 December 2018 (2017: 20.0%). Reduced income tax rates are applied at several subsidiaries within a range from 15.5% to 19.3% according to regional tax law and agreements with regional authorities (2017: within a range from 15.5% to 19.3%).
In the third quarter 2018, the Group signed a special investment contract with the Russian authorities in respect of its ammonia project subsidiary, EuroChem Northwest, JSC enacted from 24 July 2018 and effective till 31 December 2025. Under the terms of the contract, the income tax rate is reduced to 5%, the respective effect from reassessment of deferred tax assets and liabilities amounted to US$6,158 thousand for the year ended 31 December 2018.
At the end of 2016, the Group signed special investment contracts with the Russian authorities in respect of its potash project subsidiaries, EuroChem-VolgaKaliy LLC and EuroChem-Usolsky potash complex LLC enacted from 1 January 2017 and effective till 31 December 2025. Under the terms of the contracts, the income tax rates may be reduced to 5% and 0% respectively for the above mentioned subsidiaries. As EuroChem-Usolsky potash complex LLC had a tax loss for the year ended 31 December 2018, the reduced income tax rate was not applied for the year 2018. Under the contract terms of EuroChem-VolgaKaliy LLC, the subsidiary needs to generate revenue from its primary activity to apply for the income tax rate reduction. As at 31 December 2018 the subsidiary did not generate revenue from the production, therefore the reduced income tax rate was not applied by EuroChem-VolgaKaliy LLC for the year 2018.
Subsidiaries located in Europe, North and Latin America and Asia are subject to income tax rates ranging from 7.8% to 34.0% (2017: 7.8% to 39.5%).
Starting 1 January 2018, income tax rates in the US and Belgium were decreased to 26.50% and 29.58%, respectively, following changes in tax legislation in December 2017 (2017: income tax rates in the US and Belgium were 39.50% and 33.99%, respectively). Starting 1 January 2020, the tax rate in Belgium will be decreased to 25.00%.

140 EuroChem Annual Report and Accounts 2018
(all amounts are presented in thousands of US dollars, unless otherwise stated)
Notes to the Consolidated Financial Statementsfor the year ended 31 December 2018 continued
31. Income tax continuedAt 31 December 2018, the Group had US$171,681 thousand (31 December 2017: US$184,800 thousand) of unused accumulated tax losses carried forwards in respect of which a deferred tax asset of US$34,336 thousand (31 December 2017: US$36,960 thousand) had not been recognised as it is not probable that future taxable profit will be available against which the Group can utilise such benefits. These tax losses carried forward expire as follows:
31 December
201831 December
2017
Tax losses carry forwards expiring by:
– 31 December 2020 1,901 –
– 31 December 2021 35,840 35,490
– 31 December 2022 37,224 38,720
– 31 December 2025 42,178 66,050
– 31 December 2026 44,565 44,540
– 31 December 2027 9,973 –
Tax loss carry forwards 171,681 184,800
The movement in deferred tax (assets) and liabilities during 2018 was as follows:
1 January 2018
Differences recognition
and reversalsDisposal of
subsidiaries
Reassessment of deferred tax assets/
liabilities due to change in the tax rate
Currency translation difference
31 December 2018
Tax effects of (deductible)/taxable temporary differences:
Property, plant and equipment and Intangible assets 335,944 42,727 – – (50,916) 327,755
Accounts receivable (4,207) (4,346) – – 189 (8,364)
Accounts payable (2,350) 3,868 – – 314 1,832
Inventories (14,491) (19,054) (114) – 690 (32,969)
Other 9,787 (4,129) – – 432 6,090
Tax losses carried forward (185,744) (38,750) – 6,158 19,764 (198,572)
Less: Unrecognised deferred tax assets 36,960 (2,169) – – (455) 34,336
Net deferred tax (asset)/liability 175,899 (21,853) (114) 6,158 (29,982) 130,108
Recognised deferred tax assets (55,360) (33,827) – – 6,574 (82,613)
Recognised deferred tax liabilities 231,259 11,974 (114) 6,158 (36,556) 212,721
Net deferred tax (asset)/liability 175,899 (21,853) (114) 6,158 (29,982) 130,108
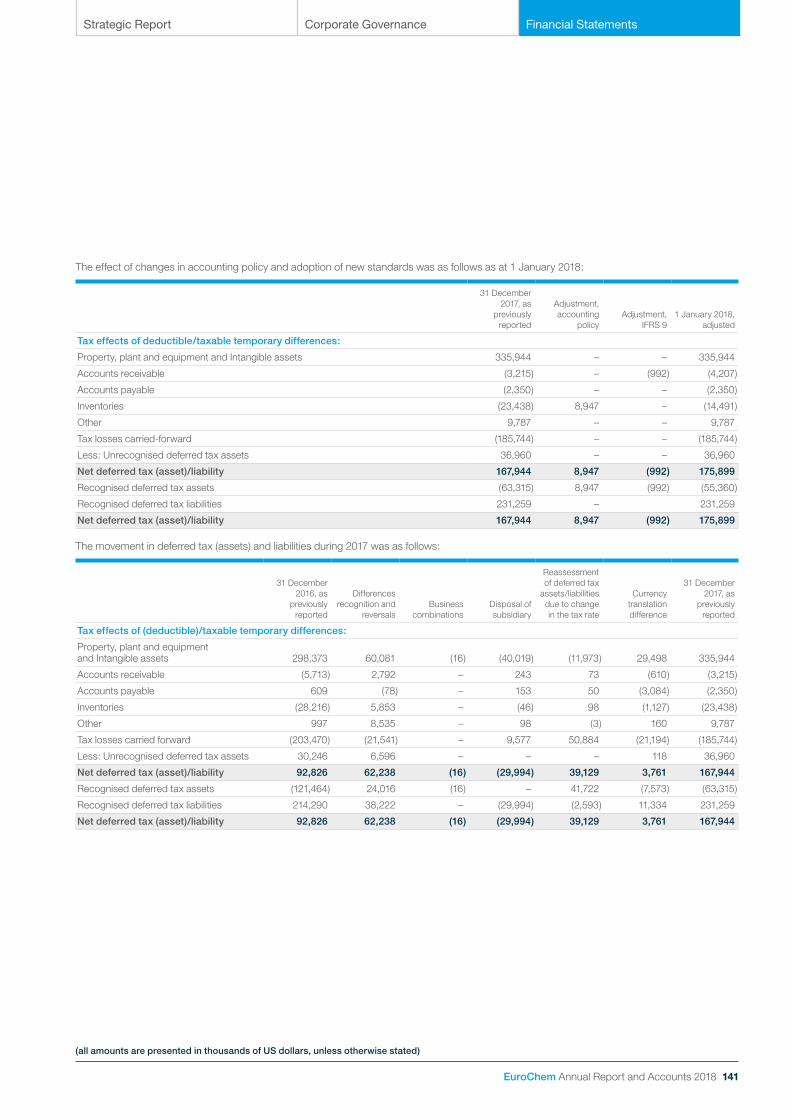
Strategic Report Corporate Governance Financial Statements
EuroChem Annual Report and Accounts 2018 141
(all amounts are presented in thousands of US dollars, unless otherwise stated)
The effect of changes in accounting policy and adoption of new standards was as follows as at 1 January 2018:
31 December 2017, as
previously reported
Adjustment, accounting
policyAdjustment,
IFRS 91 January 2018,
adjusted
Tax effects of deductible/taxable temporary differences:
Property, plant and equipment and Intangible assets 335,944 – – 335,944
Accounts receivable (3,215) – (992) (4,207)
Accounts payable (2,350) – – (2,350)
Inventories (23,438) 8,947 – (14,491)
Other 9,787 – – 9,787
Tax losses carried-forward (185,744) – – (185,744)
Less: Unrecognised deferred tax assets 36,960 – – 36,960
Net deferred tax (asset)/liability 167,944 8,947 (992) 175,899
Recognised deferred tax assets (63,315) 8,947 (992) (55,360)
Recognised deferred tax liabilities 231,259 – 231,259
Net deferred tax (asset)/liability 167,944 8,947 (992) 175,899
The movement in deferred tax (assets) and liabilities during 2017 was as follows:
31 December 2016, as
previously reported
Differences recognition and
reversalsBusiness
combinationsDisposal of subsidiary
Reassessment of deferred tax
assets/liabilities due to change
in the tax rate
Currency translation difference
31 December 2017, as
previously reported
Tax effects of (deductible)/taxable temporary differences:
Property, plant and equipment and Intangible assets 298,373 60,081 (16) (40,019) (11,973) 29,498 335,944
Accounts receivable (5,713) 2,792 – 243 73 (610) (3,215)
Accounts payable 609 (78) – 153 50 (3,084) (2,350)
Inventories (28,216) 5,853 – (46) 98 (1,127) (23,438)
Other 997 8,535 – 98 (3) 160 9,787
Tax losses carried forward (203,470) (21,541) – 9,577 50,884 (21,194) (185,744)
Less: Unrecognised deferred tax assets 30,246 6,596 – – – 118 36,960
Net deferred tax (asset)/liability 92,826 62,238 (16) (29,994) 39,129 3,761 167,944
Recognised deferred tax assets (121,464) 24,016 (16) – 41,722 (7,573) (63,315)
Recognised deferred tax liabilities 214,290 38,222 – (29,994) (2,593) 11,334 231,259
Net deferred tax (asset)/liability 92,826 62,238 (16) (29,994) 39,129 3,761 167,944

142 EuroChem Annual Report and Accounts 2018
(all amounts are presented in thousands of US dollars, unless otherwise stated)
Notes to the Consolidated Financial Statementsfor the year ended 31 December 2018 continued
31. Income tax continuedThe effect of changes in accounting policy was as follows as at 1 January 2017:
31 December 2016, as
previously reported
Adjustment, accounting
policy1 January 2017,
adjusted
Tax effects of deductible/taxable temporary differences:
Property, plant and equipment and intangible assets 298,373 – 298,373
Accounts receivable (5,713) – (5,713)
Accounts payable 609 – 609
Inventories (28,216) 8,947 (19,269)
Other 997 – 997
Tax losses carried forward (203,470) – (203,470)
Less: Unrecognised deferred tax assets 30,246 – 30,246
Net deferred tax (asset)/liability 92,826 8,947 101,773
Recognised deferred tax assets (121,464) 8,947 (112,517)
Recognised deferred tax liabilities 214,290 – 214,290
Net deferred tax (asset)/liability 92,826 8,947 101,773
The total amount of the deferred tax charge for 2018 and 2017 is recognised in profit or loss.
32. Earnings per shareBasic earnings per share are calculated by dividing the profit attributable to equity holders of the Company by the weighted average number of ordinary shares in issue during the period. The Company has no dilutive potential ordinary shares and, therefore, the diluted earnings per share equals the basic earnings per share.
2018 2017
Profit for the period attributable to owners of the parent 538,448 453,466
Weighted average number of ordinary shares outstanding 1,000 1,000
Earnings per share – basic and diluted 538.45 453.47
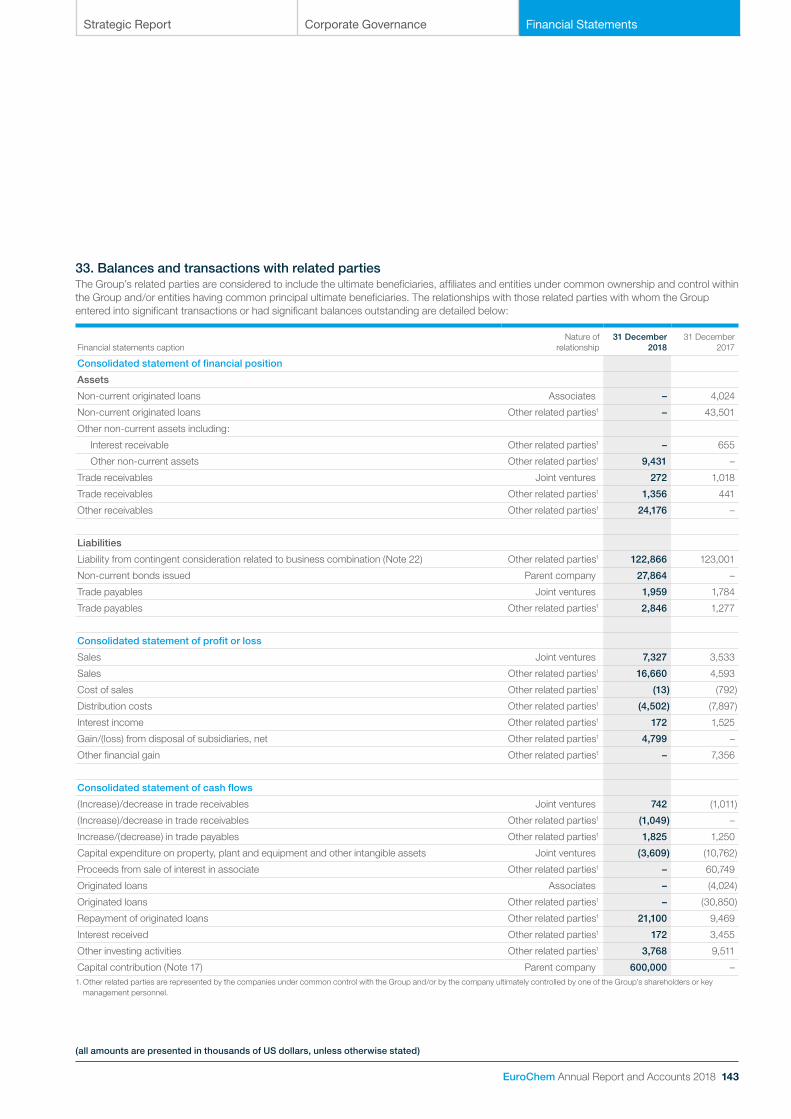
Strategic Report Corporate Governance Financial Statements
EuroChem Annual Report and Accounts 2018 143
(all amounts are presented in thousands of US dollars, unless otherwise stated)
33. Balances and transactions with related partiesThe Group’s related parties are considered to include the ultimate beneficiaries, affiliates and entities under common ownership and control within the Group and/or entities having common principal ultimate beneficiaries. The relationships with those related parties with whom the Group entered into significant transactions or had significant balances outstanding are detailed below:
Financial statements captionNature of
relationship31 December
201831 December
2017
Consolidated statement of financial position
Assets
Non-current originated loans Associates – 4,024
Non-current originated loans Other related parties1 – 43,501
Other non-current assets including:
Interest receivable Other related parties1 – 655
Other non-current assets Other related parties1 9,431 –
Trade receivables Joint ventures 272 1,018
Trade receivables Other related parties1 1,356 441
Other receivables Other related parties1 24,176 –
Liabilities
Liability from contingent consideration related to business combination (Note 22) Other related parties1 122,866 123,001
Non-current bonds issued Parent company 27,864 –
Trade payables Joint ventures 1,959 1,784
Trade payables Other related parties1 2,846 1,277
Consolidated statement of profit or loss
Sales Joint ventures 7,327 3,533
Sales Other related parties1 16,660 4,593
Cost of sales Other related parties1 (13) (792)
Distribution costs Other related parties1 (4,502) (7,897)
Interest income Other related parties1 172 1,525
Gain/(loss) from disposal of subsidiaries, net Other related parties1 4,799 –
Other financial gain Other related parties1 – 7,356
Consolidated statement of cash flows
(Increase)/decrease in trade receivables Joint ventures 742 (1,011)
(Increase)/decrease in trade receivables Other related parties1 (1,049) –
Increase/(decrease) in trade payables Other related parties1 1,825 1,250
Capital expenditure on property, plant and equipment and other intangible assets Joint ventures (3,609) (10,762)
Proceeds from sale of interest in associate Other related parties1 – 60,749
Originated loans Associates – (4,024)
Originated loans Other related parties1 – (30,850)
Repayment of originated loans Other related parties1 21,100 9,469
Interest received Other related parties1 172 3,455
Other investing activities Other related parties1 3,768 9,511
Capital contribution (Note 17) Parent company 600,000 –1. Other related parties are represented by the companies under common control with the Group and/or by the company ultimately controlled by one of the Group’s shareholders or key
management personnel.

144 EuroChem Annual Report and Accounts 2018
(all amounts are presented in thousands of US dollars, unless otherwise stated)
Notes to the Consolidated Financial Statementsfor the year ended 31 December 2018 continued
33. Balances and transactions with related parties continuedIn the first quarter 2018, the Group acquired from the parent company of the Group, AIM Capital S.E., a company owning a land plot for a project to construct a nitrogen fertilizers plant. The company is located in the US. The Group treats this transaction as an asset acquisition.
In November 2018, the Group sold two subsidiaries, each owning a bulk carrier sea vessel, to a company which is a related party of the Group.
Management compensationThe total key management personnel compensation amounted to US$16,496 thousand and US$17,933 thousand for the year ended 31 December 2018 and 31 December 2017, respectively. This compensation relates to individuals, who are members of the Management Board, for their services in full time positions. Compensation is made up of an annual fixed remuneration plus a performance bonus accrual.
34. Contingencies, commitments and operating risks(i) Capital expenditure commitmentsAs at 31 December 2018, the Group had contractual commitments for capital expenditures of US$499,134 thousand (31 December 2017: US$846,280 thousand), including amounts denominated in RUB of US$253,368 thousand and in EUR of US$162,235 thousand, which will represent cash outflows in the next five years according to the contractual terms.
US$130,154 thousand and US$166,135 thousand of the total amount relate to the development of potassium salt deposits and the construction of mining facilities at the Gremyachinskoe and Verkhnekamskoe potash licence areas, respectively (31 December 2017: US$184,809 thousand and US$253,578 thousand, respectively).
US$57,235 thousand of the total amount relates to the construction of the Ammonia Plant at Kingisepp, Russia (31 December 2017: US$212,928 thousand).
(ii) Tax legislationManagement of the Group believes that its interpretation of the tax legislation is appropriate and the Group’s tax position will be sustained.
Given the scale and international nature of the Group’s business, intra-group transfer pricing and issues such as controlled foreign corporations’ legislation, beneficial ownership, permanent establishment and tax residence issues, are inherent tax risks just as they are for other international businesses. Changes in tax laws or their application with respect to tax matters in the countries where the Group has subsidiaries could increase the Group’s effective tax rate.
The majority of the Group’s production subsidiaries are located in Russia and are required to comply with Russian tax, currency and customs legislation. The Russian tax authorities may be taking a more assertive position in their interpretation of the legislation and assessments than the Management of the Group, and it is possible that transactions and activities that have not been challenged in the past may be challenged. Fiscal periods remain open to review by the authorities in respect of taxes for three calendar years preceding the year of review with possible extension of this period under certain circumstances.
Where management believes that it is probable that certain tax positions taken by the Group may not be sustained if challenged by the tax authorities, the Group recognises provisions for related taxes, interest and penalties. There were no such provisions recorded by the Group at 31 December 2018 and 31 December 2017.
Strategic Report Corporate Governance Financial Statements
EuroChem Annual Report and Accounts 2018 145
(all amounts are presented in thousands of US dollars, unless otherwise stated)
(iii) Insurance policiesThe Group obtains risk insurance cover as mandated by statutory requirements. The Group also holds voluntary insurance policies covering directors’ and officers’ liability (D&O insurance), general third party and product liability, physical property damage and business interruption insurance at major production plants, as well as insurance policies related to trade operations, including export shipments, and credit insurance of certain trade debtors.
The Group also carries voluntary life and accident insurance for employees.
As part of the Verkhnekamskoe potash project, the Group has insured construction risks of all mining and surface facilities related to this project including third party liability during construction works. The insurance covers the risks of destruction and damage related to all facilities including those previously constructed starting from November 2014 to July 2020, which are not handed-over to date, including a two year guarantee period, which already started in respect of the handed-over facilities. The operational part of the project has been insured under property and business interruption cover.
As part of the ammonia project at Kingisepp, the Group has insured construction risks of all facilities related to this project including third party liability, project cargo, delay in start-up, insurance covering loan payments and compulsory insurance of hazardous objects.
(iv) Environmental mattersThe Group’s plants and operations are subject to numerous national, state and local environmental laws and regulations. The Group’s management regularly evaluates its obligations under these laws and regulations and believes that the Group’s plants and operations are in compliance with environmental laws and regulations. The estimated cost of known environmental obligations has been provided for in these consolidated financial statements in accordance with the Group’s accounting policies.
The environmental laws and regulations are essentially complex and tend to change over time. The scope, extent and speed of this change may vary substantially in different jurisdictions. Accordingly, the Group’s management system provides for ongoing monitoring of the key trends in applicable environmental laws and regulations, though it is inherently difficult to estimate precisely all costs associated with current and newly proposed environmental requirements. The Group’s management does not expect these costs to have a material effect on the Group’s financial position or liquidity.
(v) Legal proceedingsDuring the reporting period, the Group was involved in a number of court proceedings (both as a plaintiff and a defendant) arising in the ordinary course of business. In the opinion of management, there are no current legal proceedings or other claims outstanding which could have a material effect on the results of operations or the financial position of the Group.
(vi) Operating environment of the Group The Group operates in the fertilizer industry with production assets in Russia, Lithuania, Belgium, Kazakhstan, China and sales networks in Europe, Russia, the CIS, North and Latin America and Central and South-East Asia. The highly competitive nature of the market makes prices of the Group’s key products relatively volatile.
Possible deteriorating economic conditions may have an impact on management’s cash flow forecasts and assessment of the impairment of financial and non-financial assets. Debtors of the Group may also become adversely affected by the financial and economic environment, which could in turn impact their ability to repay amounts owed or fulfil obligations undertaken.
Management is unable to predict all developments which could have an impact on the industry and the wider economy and consequently what effect, if any, they could have on the future financial position of the Group. Management believes all necessary measures are being taken to support the sustainability and growth of the Group’s business in the current circumstances.

146 EuroChem Annual Report and Accounts 2018
(all amounts are presented in thousands of US dollars, unless otherwise stated)
Notes to the Consolidated Financial Statementsfor the year ended 31 December 2018 continued
35. Financial and capital risk management35.1 Financial risk managementThe Group’s activities expose it to a variety of financial risks: market risk (including foreign currency risk, interest rate risk and price risk), credit risk and liquidity risk. The overall risk management program seeks to minimise potential adverse effects on the financial performance of the Group.
(a) Market risk (i) Foreign currency risk The Group is exposed to foreign exchange risk to the extent that its future cash inflows and outflows over a certain period of time are denominated in different currencies.
The objective of the Group’s foreign exchange risk management is to minimise the volatility of the Group’s cash flows arising from fluctuations in exchange rates versus the US$ (which is viewed by the Group as its base currency), while simultaneously achieving at least average annual market exchange rates for the Group’s non-US$ purchases. Management focuses on assessing the Group’s future cash flows in currencies other than US$ and managing operational currency position – the gaps arising between inflows and outflows. Management also pursues to avoid open transactional currency positions by balancing non-dollar cash assets and liabilities.
The Group includes a number of subsidiaries with the Russian rouble as their functional currency and a significant volume of US$-denominated transactions as well as several subsidiaries with US$ functional currency having RUB-denominated transactions. At 31 December 2018, if the RUB had been down/up against the US$ by 10%, all other things being equal, the after tax result for the year and equity would have been US$59,378 thousand lower/higher (2017: US$60,086 thousand lower/higher), purely as a result of foreign exchange gains/losses on translation of US$-denominated assets and liabilities at subsidiaries with RUB as a functional currency and RUB-denominated assets and liabilities at subsidiaries with US$ as a functional currency and with no regard to the impact of this appreciation/depreciation on sales.
The Group is disclosing the impact of such a 10% shift in the manner set out above to ease the calculation for the users of these consolidated financial statements of the impact on the after tax profit and equity resulting from subsequent future exchange rate changes; this information is not used by the management for foreign currency risk management purposes.
The Group believes that it benefits from the strengthening of US$ exchange rate versus the RUB and the EUR, and the other way around. This is mainly due to the fact that in terms of economic substance, as opposed to purely settlement perspective, the Group’s revenues are directly or indirectly, US$-denominated, whereas a significant portion of its operating and/or capital costs is denominated in RUB and EUR.
During 2018 and 2017, the Group entered into foreign exchange non-deliverable and deliverable forward contracts in order to achieve lower RUB and EUR exchange rates for its RUB and EUR purchases than the average annual exchange rates. The Group also routinely enters into forward and swap agreements aimed at lowering the cost of its debt portfolio in US$ terms.

Strategic Report Corporate Governance Financial Statements
EuroChem Annual Report and Accounts 2018 147
(all amounts are presented in thousands of US dollars, unless otherwise stated)
The table below summarises the Group’s financial assets and liabilities which are subject to foreign currency risk as at 31 December 2018:
Functional currency RUB US$Other foreign
currencies
Foreign currency US$ RUBOther foreign
currencies
ASSETS
Non-current financial assets:
Restricted cash – – 876
US$/RUB cross currency swaps (gross amount) – 273,182 –
Other non-current assets – – 9,431
Total non-current financial assets – 273,182 10,307
Current financial assets:
Trade receivables – – 106,223
Other receivables – – 24,176
US$/RUB cross currency swaps (gross amount) – 98,746 –
RUB/US$ deliverable forward contracts – 119,288 –
Cash and cash equivalents 17,258 3,760 117,394
Total current financial assets 17,258 221,794 247,793
Total financial assets 17,258 494,976 258,100
LIABILITIES
Non-current financial liabilities:
Bank borrowings – 45,271 –
Bonds issued 500,000 – –
Project Finance – – 509,460
EUR/US$ non-deliverable forward contracts – – 6,869
Liability from contingent consideration related to business combination – – 122,866
Deferred payable related to acquisition of additional interest in subsidiary 1,500 – –
Deferred payable related to mineral rights acquisition – – 10,295
Total non-current financial liabilities 501,500 45,271 649,490
Current liabilities:
Bank borrowings and loans received – 45,703 106,765
Project Finance – – 31,138
EUR/US$ non-deliverable forward contracts – – 3,187
RUB/US$ non-deliverable forward contracts – 1,101 –
BRL/US$ non-deliverable forward contracts – – 2,464
Trade payables 4,299 – 112,122
Interest payables 4,169 458 3,102
Deferred payable related to acquisition of additional interest in subsidiary 1,500 – –
Deferred payable related to mineral rights acquisition – – 1,225
Total current financial liabilities 9,968 47,262 260,003
Total financial liabilities 511,468 92,533 909,493

148 EuroChem Annual Report and Accounts 2018
(all amounts are presented in thousands of US dollars, unless otherwise stated)
Notes to the Consolidated Financial Statementsfor the year ended 31 December 2018 continued
35. Financial and capital risk management continued35.1 Financial risk management continued(a) Market risk continuedThe Group’s financial assets and liabilities subject to foreign currency risk as at 31 December 2017 are presented below:
Functional currency RUB US$Other foreign
currencies
Foreign currency US$ RUBOther foreign
currencies
ASSETS
Non-current financial assets:
Restricted cash 19,733 – 1,024
Originated loans 43,501 – –
US$/RUB cross currency swaps (gross amount) – 294,564 –
EUR/US$ non-deliverable forward contracts – – 645
Total non-current financial assets 63,234 294,564 1,669
Current financial assets:
Trade receivables 757 – 49,223
Interest receivables 655 – –
US$/RUB cross currency swaps (gross amount) – 840,232 –
RUB/US$ non-deliverable forward contracts – 2,530 –
Cash and cash equivalents 25,028 274 55,066
Total current financial assets 26,440 843,036 104,289
Total financial assets 89,674 1,137,600 105,958
LIABILITIES
Non-current financial liabilities:
Bonds issued 500,000 – –
Project Finance 750,000 – 342,350
Liability from contingent consideration related to business combination – – 123,001
Deferred payable related to acquisition of additional interest in subsidiary 3,000 – –
Deferred payable related to mineral rights acquisition – – 10,656
Total non-current financial liabilities 1,253,000 – 476,007
Current liabilities:
Bank borrowings and loans received – 594,616 24,559
Trade payables 8,011 – 204,970
Interest payables 8,269 2,091 1,696
Deferred payable related to acquisition of additional interest in subsidiary 1,500 – –
Deferred payable related to acquisition of associate – – 3,229
Deferred payable related to mineral rights acquisition – – 1,600
Total current financial liabilities 17,780 596,707 236,054
Total financial liabilities 1,270,780 596,707 712,061

Strategic Report Corporate Governance Financial Statements
EuroChem Annual Report and Accounts 2018 149
(all amounts are presented in thousands of US dollars, unless otherwise stated)
The Group’s sales for the years ended 31 December 2018 and 31 December 2017 are presented in the table below:
US$ EUR RUBOther
currencies Total
2018 2,802,514 1,120,085 1,091,677 563,196 5,577,472
50% 20% 20% 10% 100%
2017 2,370,967 974,492 985,285 534,920 4,865,664
49% 20% 20% 11% 100%
In practice, as noted above, while assessing and managing its exposure to foreign currency risk, the Group’s Treasury views most of the Group’s sales as predominantly US$-denominated, regardless of the settlement currency. The Group’s Treasury views all currencies other than the US$ as foreign currency risk exposures of the Group, while the US$ is viewed as the Group’s base economic currency against which all exposures are measured.
(ii) Interest rate riskThe Group’s income and operating cash flows are substantially independent of changes in market interest rates. The Group’s principal interest rate risk arises from long-term and short-term borrowings.
The Group is exposed to the risk from floating interest rates primary from borrowings and loans denominated in foreign currencies.
The Group had US$1,530,410 thousand of US$-denominated loans outstanding at 31 December 2018 (31 December 2017: US$1,944,559 thousand) bearing floating interest rates varying from 1-month Libor +1.55% to 1-month Libor +2.20%, 3-month Libor +2.00%, 6-month Libor +2.75% (2017: from 1-month Libor +1.65% to 1-month Libor +2.32%, from 3-month Libor +1.7% to 3-month Libor +3.5%, from 12-month Libor +2.95% to 12-month Libor +3.4%).
The Group’s profit after tax for the year ended 31 December 2018 and equity would have been US$1,261 thousand, or 0.2 % lower/higher (2017: US$2,115 thousand, or 0.5 % lower/higher) if the US$ Libor interest rate was 10 bps higher/lower than its actual level during the year.
During 2018 and 2017, the Group did not hedge this exposure using financial instruments.
The Group has a formal policy of determining how much maximum unhedged exposure it should have to interest rate risk on the basis of the assessment of the likely interest rate changes on the Group’s cash flows. The Group performs periodic analysis of the current interest rate environment on the basis of which management makes decisions on the appropriate mix of fixed-rate and variable-rate debt for both existing and planned new borrowings.
(iii) Financial investments riskThe Group can be exposed to equity securities price risk because of investments that can be held by the Group. As at 31 December 2018 and 31 December 2017, the Group was not exposed to equity securities price risk.
The Group does not enter into any transactions with financial instruments whose value is exposed to the value of any commodities traded on a public market.

150 EuroChem Annual Report and Accounts 2018
(all amounts are presented in thousands of US dollars, unless otherwise stated)
Notes to the Consolidated Financial Statementsfor the year ended 31 December 2018 continued
35. Financial and capital risk management continued35.1 Financial risk management continued(b) Credit risk Credit risk arises from the possibility that counterparties to transactions may default on their obligations, causing financial losses for the Group. Financial assets, which potentially subject Group entities to credit risk, consist principally of originated loans, trade receivables, and advances to suppliers and contractors, as well as cash and bank deposits. The objective of managing credit risk is to prevent losses of liquid funds deposited with or invested in financial institutions or the loss in value of receivables.
The maximum exposure to credit risk resulting from financial assets is equal to the carrying amount of the Group’s financial assets, which at 31 December 2018 amounted to US$762,113 thousand (31 December 2017: US$644,831 thousand). The Group has no significant concentrations of credit risk.
Cash and cash equivalents, restricted cash and fixed-term depositsCash and term deposits are mainly placed in major multinational banks and banks with independent credit ratings. No bank balances and term deposits are past due or impaired. (See the analysis by credit quality of bank balances, term and fixed-term deposits in Note 15).
Originated loansOriginated loans are issued to companies which are under common control with the Group and to associated Companies or joint ventures of the Group.
Trade receivablesTrade receivables are subject to a policy of active credit risk management which focuses on an assessment of ongoing credit evaluation and account monitoring procedures. The objective of the management of trade receivables is to sustain the growth and profitability of the Group by optimising asset utilisation while maintaining risk at an acceptable level.
Receivables management is geared towards collecting all outstanding accounts punctually and in full to avoid the loss of receivables. Additionally, the Group sells certain trade receivables to a factor on a non-recourse basis.
Advances to suppliers and contractorsAdvances given to suppliers and contractors are subject to a policy of supplier credit risk management which focuses on ongoing credit limit evaluation and monitoring goods/services supply contract performance.
The monitoring and controlling of credit risk is performed by the corporate treasury function of the Group. The credit policy requires the performance of credit evaluations and ratings of all counterparties, including customers, suppliers and contractors. The credit quality of each new customer, supplier or contractor is analysed using internal credit rating before the Group provides it with the terms of delivery and payment, or terms of advance payments in the case of suppliers and contractors. The Group gives preference to counterparties with an independent credit rating. New counterparties without an independent credit rating are evaluated with reference to Group’s credit policy which is based on a minimum of two ratings: internal creditworthiness rating and internal payment discipline rating. The credit quality of other counterparties is assessed taking into account their financial position, past experience and other factors.
Customers, suppliers and contractors that do not meet the credit quality requirements are supplied on a prepayment basis only and receive no advance payments.
Although the collection of receivables could be influenced by economic factors, management believes that there is no significant risk of loss to the Group beyond the provision already recorded (Note 14).
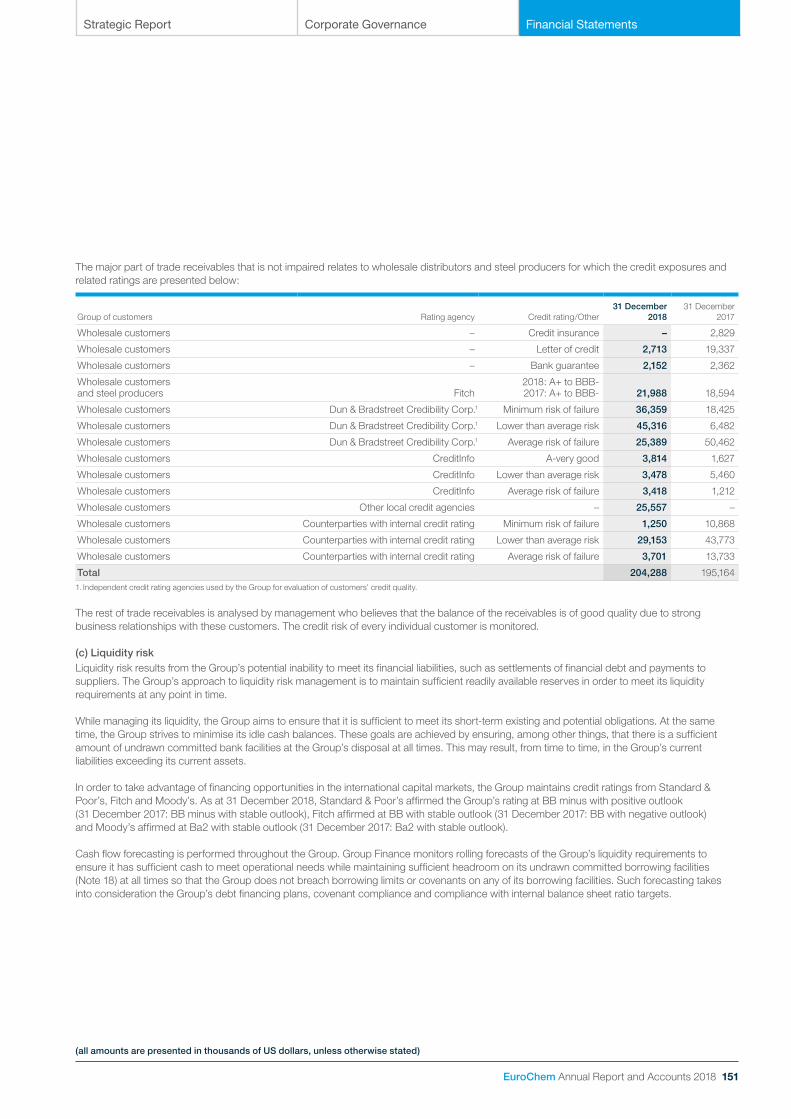
Strategic Report Corporate Governance Financial Statements
EuroChem Annual Report and Accounts 2018 151
(all amounts are presented in thousands of US dollars, unless otherwise stated)
The major part of trade receivables that is not impaired relates to wholesale distributors and steel producers for which the credit exposures and related ratings are presented below:
Group of customers Rating agency Credit rating/Other31 December
201831 December
2017
Wholesale customers – Credit insurance – 2,829
Wholesale customers – Letter of credit 2,713 19,337
Wholesale customers – Bank guarantee 2,152 2,362
Wholesale customers and steel producers Fitch
2018: A+ to BBB-2017: A+ to BBB- 21,988 18,594
Wholesale customers Dun & Bradstreet Credibility Corp.1 Minimum risk of failure 36,359 18,425
Wholesale customers Dun & Bradstreet Credibility Corp.1 Lower than average risk 45,316 6,482
Wholesale customers Dun & Bradstreet Credibility Corp.1 Average risk of failure 25,389 50,462
Wholesale customers CreditInfo A-very good 3,814 1,627
Wholesale customers CreditInfo Lower than average risk 3,478 5,460
Wholesale customers CreditInfo Average risk of failure 3,418 1,212
Wholesale customers Other local credit agencies – 25,557 –
Wholesale customers Counterparties with internal credit rating Minimum risk of failure 1,250 10,868
Wholesale customers Counterparties with internal credit rating Lower than average risk 29,153 43,773
Wholesale customers Counterparties with internal credit rating Average risk of failure 3,701 13,733
Total 204,288 195,1641. Independent credit rating agencies used by the Group for evaluation of customers’ credit quality.
The rest of trade receivables is analysed by management who believes that the balance of the receivables is of good quality due to strong business relationships with these customers. The credit risk of every individual customer is monitored.
(c) Liquidity riskLiquidity risk results from the Group’s potential inability to meet its financial liabilities, such as settlements of financial debt and payments to suppliers. The Group’s approach to liquidity risk management is to maintain sufficient readily available reserves in order to meet its liquidity requirements at any point in time.
While managing its liquidity, the Group aims to ensure that it is sufficient to meet its short-term existing and potential obligations. At the same time, the Group strives to minimise its idle cash balances. These goals are achieved by ensuring, among other things, that there is a sufficient amount of undrawn committed bank facilities at the Group’s disposal at all times. This may result, from time to time, in the Group’s current liabilities exceeding its current assets.
In order to take advantage of financing opportunities in the international capital markets, the Group maintains credit ratings from Standard & Poor’s, Fitch and Moody’s. As at 31 December 2018, Standard & Poor’s affirmed the Group’s rating at BB minus with positive outlook (31 December 2017: BB minus with stable outlook), Fitch affirmed at BB with stable outlook (31 December 2017: BB with negative outlook) and Moody’s affirmed at Ba2 with stable outlook (31 December 2017: Ba2 with stable outlook).
Cash flow forecasting is performed throughout the Group. Group Finance monitors rolling forecasts of the Group’s liquidity requirements to ensure it has sufficient cash to meet operational needs while maintaining sufficient headroom on its undrawn committed borrowing facilities (Note 18) at all times so that the Group does not breach borrowing limits or covenants on any of its borrowing facilities. Such forecasting takes into consideration the Group’s debt financing plans, covenant compliance and compliance with internal balance sheet ratio targets.
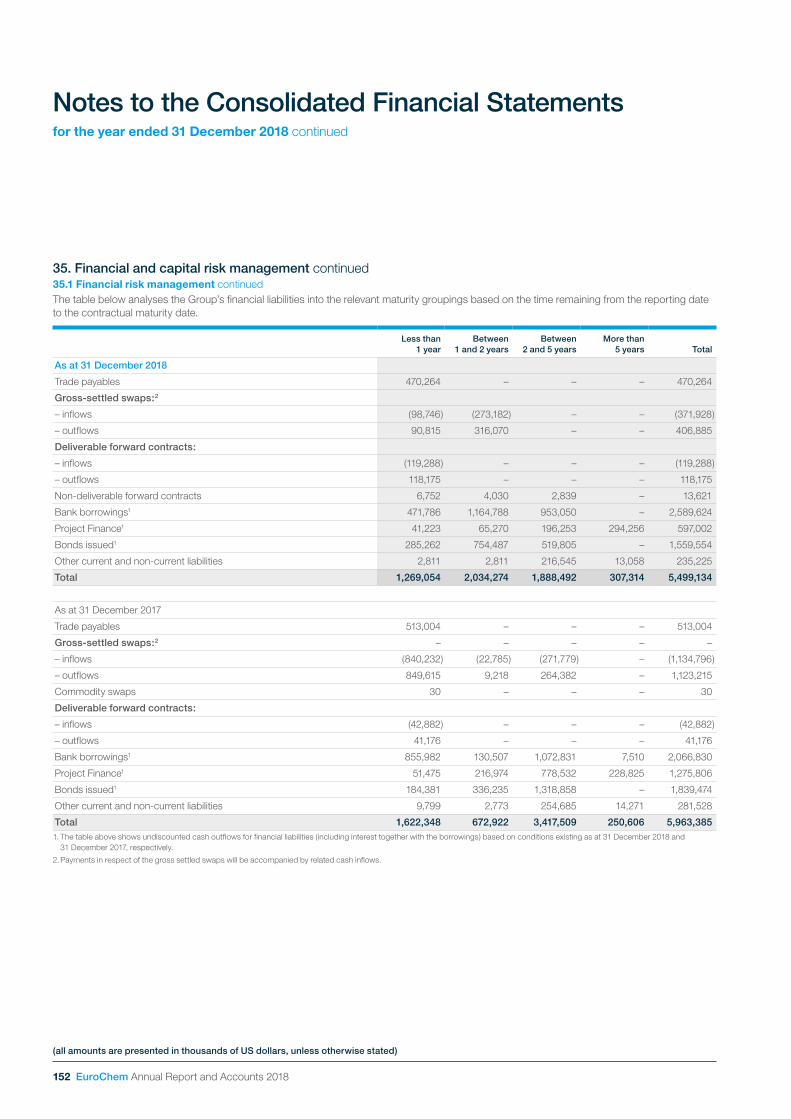
152 EuroChem Annual Report and Accounts 2018
(all amounts are presented in thousands of US dollars, unless otherwise stated)
Notes to the Consolidated Financial Statementsfor the year ended 31 December 2018 continued
35. Financial and capital risk management continued35.1 Financial risk management continuedThe table below analyses the Group’s financial liabilities into the relevant maturity groupings based on the time remaining from the reporting date to the contractual maturity date.
Less than 1 year
Between 1 and 2 years
Between 2 and 5 years
More than 5 years Total
As at 31 December 2018
Trade payables 470,264 – – – 470,264
Gross-settled swaps:2
– inflows (98,746) (273,182) – – (371,928)
– outflows 90,815 316,070 – – 406,885
Deliverable forward contracts:
– inflows (119,288) – – – (119,288)
– outflows 118,175 – – – 118,175
Non-deliverable forward contracts 6,752 4,030 2,839 – 13,621
Bank borrowings1 471,786 1,164,788 953,050 – 2,589,624
Project Finance1 41,223 65,270 196,253 294,256 597,002
Bonds issued1 285,262 754,487 519,805 – 1,559,554
Other current and non-current liabilities 2,811 2,811 216,545 13,058 235,225
Total 1,269,054 2,034,274 1,888,492 307,314 5,499,134
As at 31 December 2017
Trade payables 513,004 – – – 513,004
Gross-settled swaps:2 – – – – –
– inflows (840,232) (22,785) (271,779) – (1,134,796)
– outflows 849,615 9,218 264,382 – 1,123,215
Commodity swaps 30 – – – 30
Deliverable forward contracts:
– inflows (42,882) – – – (42,882)
– outflows 41,176 – – – 41,176
Bank borrowings1 855,982 130,507 1,072,831 7,510 2,066,830
Project Finance1 51,475 216,974 778,532 228,825 1,275,806
Bonds issued1 184,381 336,235 1,318,858 – 1,839,474
Other current and non-current liabilities 9,799 2,773 254,685 14,271 281,528
Total 1,622,348 672,922 3,417,509 250,606 5,963,3851. The table above shows undiscounted cash outflows for financial liabilities (including interest together with the borrowings) based on conditions existing as at 31 December 2018 and
31 December 2017, respectively.
2. Payments in respect of the gross settled swaps will be accompanied by related cash inflows.
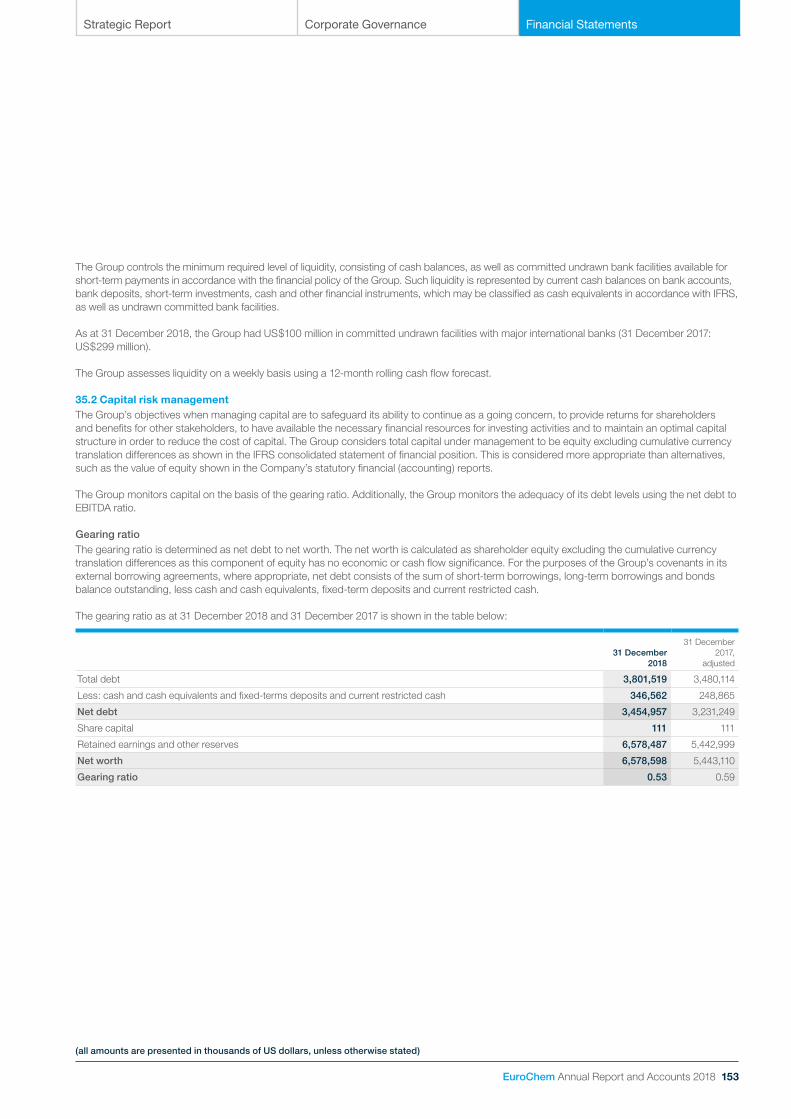
Strategic Report Corporate Governance Financial Statements
EuroChem Annual Report and Accounts 2018 153
(all amounts are presented in thousands of US dollars, unless otherwise stated)
The Group controls the minimum required level of liquidity, consisting of cash balances, as well as committed undrawn bank facilities available for short-term payments in accordance with the financial policy of the Group. Such liquidity is represented by current cash balances on bank accounts, bank deposits, short-term investments, cash and other financial instruments, which may be classified as cash equivalents in accordance with IFRS, as well as undrawn committed bank facilities.
As at 31 December 2018, the Group had US$100 million in committed undrawn facilities with major international banks (31 December 2017: US$299 million).
The Group assesses liquidity on a weekly basis using a 12-month rolling cash flow forecast.
35.2 Capital risk managementThe Group’s objectives when managing capital are to safeguard its ability to continue as a going concern, to provide returns for shareholders and benefits for other stakeholders, to have available the necessary financial resources for investing activities and to maintain an optimal capital structure in order to reduce the cost of capital. The Group considers total capital under management to be equity excluding cumulative currency translation differences as shown in the IFRS consolidated statement of financial position. This is considered more appropriate than alternatives, such as the value of equity shown in the Company’s statutory financial (accounting) reports.
The Group monitors capital on the basis of the gearing ratio. Additionally, the Group monitors the adequacy of its debt levels using the net debt to EBITDA ratio.
Gearing ratioThe gearing ratio is determined as net debt to net worth. The net worth is calculated as shareholder equity excluding the cumulative currency translation differences as this component of equity has no economic or cash flow significance. For the purposes of the Group’s covenants in its external borrowing agreements, where appropriate, net debt consists of the sum of short-term borrowings, long-term borrowings and bonds balance outstanding, less cash and cash equivalents, fixed-term deposits and current restricted cash.
The gearing ratio as at 31 December 2018 and 31 December 2017 is shown in the table below:
31 December 2018
31 December 2017,
adjusted
Total debt 3,801,519 3,480,114
Less: cash and cash equivalents and fixed-terms deposits and current restricted cash 346,562 248,865
Net debt 3,454,957 3,231,249
Share capital 111 111
Retained earnings and other reserves 6,578,487 5,442,999
Net worth 6,578,598 5,443,110
Gearing ratio 0.53 0.59

154 EuroChem Annual Report and Accounts 2018
(all amounts are presented in thousands of US dollars, unless otherwise stated)
Notes to the Consolidated Financial Statementsfor the year ended 31 December 2018 continued
35. Financial and capital risk management continued35.2 Capital risk management continuedNet Debt/EBITDAThe Group’s covenants under the terms of loan agreements and issued Eurobonds stipulate that Net Debt/EBITDA should not exceed the level of three and a half times (3.5x). For the purpose of the ratio calculation, net debt is determined in the same way as described in the Gearing ratio section.
The ratio of net debt to EBITDA as at 31 December 2018 and 31 December 2017 is shown in the table below:
Note 2018 2017
EBITDA 7 1,516,926 1,130,438
Elimination of EBITDA of subsidiaries under the Project Finance 19 4,360 5,015
Elimination of EBITDA of Ukrainian subsidiaries from 1 January 2018 to the date of disposal (3,755) –
Elimination of EBITDA of disposed shipping companies from 1 January 2018 to the date of disposal (6,352) –
Elimination of EBITDA of LLC Severneft-Urengoy from 1 January 2017 to the date of sale – (15,580)
EBITDA of acquired assets from 1 January 2017 to the date of acquisition – 1,734
EBITDA of Hispalense de Liquidos SL from 1 January 2017 to the date of acquisition – 481
Covenant EBITDA 1,511,179 1,122,088
Net debt 3,454,957 3,231,249
Net debt/Covenant EBITDA 2.29 2.88
For the purpose of this calculation, covenant EBITDA includes EBITDA of acquired associates and subsidiaries for the period from 1 January to the date of acquisition, excluding EBITDA of subsidiaries under the Project Finance for the year and EBITDA of subsidiaries from 1 January to the date of sale.
Strategic Report Corporate Governance Financial Statements
EuroChem Annual Report and Accounts 2018 155
EuroChem Group AGAddress: Baarerstrasse 37, 6300 Zug, Switzerland
Tel: +41 (41) 727 16 00
Fax: +41 (41) 727 76 06
Website: www.eurochemgroup.com
Investor RelationsE-mail: [email protected]
Communications DepartmentE-mail: [email protected]
EuroChem’s statutory auditorFull name: PricewaterhouseCoopers AG
Short name: PwC
Address: Gotthardstrasse 2, 6302 Zug, Switzerland
Tel: +41 58 792 68 00
Website: www.pwc.com
Contact information
Forward-looking statementsThis Annual Report has been prepared by EuroChem Group AG (‘EuroChem’ or the ‘Company’) for informational purposes, and may include forward-looking statements or projections. These forward-looking statements or projections include matters that are not historical facts or statements and reflect the Company’s intentions, beliefs or current expectations concerning, among other things, the Company’s results of operations, financial condition, liquidity, performance, prospects, growth, strategies, and the industry in which the Company operates. By their nature, forwarding-looking statements and projections involve risks and uncertainties because they relate to events and depend on circumstances that may or may not occur in the future. The Company cautions you that forward-looking statements and projections are not guarantees of future performance and that the actual results of operations, financial condition and liquidity of the Company and the development of the industry in which the Company operates may differ materially from those made in or suggested by the forward-looking statements or projections contained in this publication. Factors that could cause the actual results to differ materially from those contained in forward-looking statements or projections in this publication may include, among other things, general economic conditions in the markets in which the Company operates, the competitive environment in, and risks associated with operating in, such markets, market change in the fertilizer and related industries, as well as many other risks affecting the Company and its operations. In addition, even if the Company’s results of operations, financial condition and liquidity and the development of the industry in which the Company operates are consistent with the forward-looking statements or projections contained in this publication, those results or developments may not be indicative of results or developments in future periods. The Company does not undertake any obligation to review or confirm expectations or estimates or to update any forward-looking statements or projections to reflect events that occur or circumstances that arise after the date of this publication.
Statements regarding competitive positionStatements referring to EuroChem’s competitive position are based on the Company’s belief and, in some cases, rely on a range of sources, including investment analysts’ reports, independent market studies and EuroChem’s internal assessments of market share based on publicly available information about the financial results and performance of market participants.

156 EuroChem Annual Report and Accounts 2018
EuroChem reporting awards
Corporate & Financial AwardsIn November, our 2017 Annual Report won bronze at Communicate Magazine’s Corporate & Financial Awards in the Best Printed Report Unlisted Company category.
EuroChem Industry AwardEuroChem also received the International Fertilizer Association (IFA) SHE Excellence Gold Medal for its work on Employee Safety Performance, Employee Safety Perceptions, Environmental Performance and Energy Efficiency & CO2 Emissions.
Each year, the (IFA) focuses on a key issue for the industry. 2018 was the ‘Year of the Benchmark’, highlighting the growing importance of measuring and disclosing commercial, environmental and social metrics.
“ EuroChem leads by example in the international fertilizer industry in terms of advancing the agenda of Safety, Health and Environment issues. We are proud to have EuroChem among our valued members and look to the company as a guiding light.”
Rakesh Kapur IFA President
“ Continuing to achieve sustainable growth is a key measure of success, along with effective people management, safety, environmental stewardship and stakeholder engagement.”
Egor Yurkin Head of EuroChem’s Health, Safety and Environment department

Designed and produced by Instinctif Partners www.creative.instinctif.com

www.eurochemgroup.com