delivering, growing, innovating
TRANSCRIPT

Delivering,
Growing, InnovatingInvestor and Analyst Presentation
Mortgage Advice Bureau (Holdings) plc
Final results for the year ended 31 December 2020
1

Contents
Highlights
Market backdrop
Financial review
Strategy
Summary and outlook
Appendices
2
3
9
20
6
16
22

Highlights
3

4
Final Dividend
• Total dividend for the year of 25.6p,
including 6.4p catch up dividend (2019:
17.5p)
(-16% excl. First Mortgage)
Adj. EPS1
Financial Highlights
£148.3m | +3% £39.8m | +9% £17.8m | -5%
28.6p | -5% 112%19.2p | +200%
Revenue
(-1% excl. First Mortgage)
Gross Profit
(-3% excl. First Mortgage)
Adj. PBT1
(-17% excl. First Mortgage)
1. Adjusted in 2020 for £0.4m (2019: £0.2m) amortisation of acquired intangibles and £0.9m (2019: £0.4m) of additional non-cash operating expenses relating to the put and call option agreement to acquire the
remaining 20% of First Mortgage. In 2019, £0.4m of one-off costs associated with the acquisition of First Mortgage were also adjusted. PBT and EPS are also adjusted for impairment of loans to related parties
of £1.7m in 2020 (2019: £nil), £1.4m net of tax.
2. Adjusted cash conversion is cash generated from operating activities adjusted for movements in non-trading items, including loans to Appointed Representative firms ("ARs") and associates totalling £(1.5)m
and increases in restricted cash balances of £0.6m in 2020, as a percentage of adjusted operating profit.
Cash Conversion2

Market Share2
(+10% excl. First Mortgage)
Strategic progress
(+8% excl. First Mortgage)
Adviser Numbers3
Revenue Per
Active Adviser4
(-7% excl. First Mortgage)
Mortgage Completions1
(+3% excl. First Mortgage)
Operational Highlights
£17.6bn | +5% 6.3% | +11%
1,580| +8% £101.9k | -5%
1. MAB’s gross mortgage completions, including product transfers.
2. Market share of gross new mortgage lending (excluding product transfers).
3. Includes the Advisers of a firm previously authorised under an Appointed Representative agreement with MAB until 7 December 2020. MAB continues to provide services to this firm, now directly authorised by the FCA.
4. Based on average number of active advisers for the period. An active adviser is an adviser who had not been furloughed, and was therefore able to write business
Digital business acceleration
• Platform roll out
• Remote advice/security
• Lead Generation
• Compliance transformation
M&A / Joint Ventures
New Build
International
Addressable Market
5

Market Backdrop
6

-
5,000
10,000
15,000
20,000
25,000
30,000
£m
First time buyers Home-owner movers
Home-owner remortgages BTL purchases
BTL remortgages Other (inc. lifetime and further advances)
Gross new mortgage lending values1 Commentary
Mortgage Lending Market
1. Source: UK Finance. Chart excludes product transfers.
2. Includes further advances and lifetime mortgages, excludes product transfers.
3. Source: UK Finance.
Q1: +4% Q2: -32% Q3: -14% Q4: +5%Year-on-year changes:
• Gross new mortgage lending of £243.1bn2, down 9%
as a result of the closure of the housing market in Q2
Purchase market:
• Purchase mortgage activity most adversely impacted
in Q2 (down 46%)
• Q3 activity continued to be impacted due to pipeline
conversion timeframes (down 11%)
• Sharp return to growth in Q4 (up 28%)
Re-financing market:
• External re-mortgage activity less impacted in Q2
(down 18%)
• Activity remained low in Q3 (down 22%) and Q4
(down 30%) due the volume of borrowers only being
able to internally transfer their mortgages
• Product transfers: up 1% for the year to £168bn3
7

8
0
20,000
40,000
60,000
80,000
100,000
120,000
140,000
England Scotland Wales Northern Ireland
UK property transactions by volume1 Commentary
Property Market
1. Sources: UK Finance. Q4 2020 figures are provisional.
2. Source: Land Registry. House price inflation is the increase in house prices from December 2019 to December 2020.
The increase in average house price is the year-on-year increase in average house prices for the year.
• Q1 broadly flat year-on-year (-1%)
• Q2 property transaction volumes down 44% in
England, as housing market shut for nearly 2 months.
• In Scotland, where the housing market was shut for
3 months, Q2 volumes decreased by 63%
• Despite the market recovery, Q3 volumes
(down 16%) were still impacted due to pipeline
conversion timeframes
• Q4 data shows a 17% increase in
transaction volumes
• House price inflation c.9%, with 3% increase in
average house price for the year2
Q1: -1% Q2: -47% Q3: -16% Q4: +17%Year-on-year changes:

Financial Review
9

Financial KPIs
1. Adjusted in 2020 for £0.4m (2019 £0.2m) amortisation of acquired intangibles and £0.9m (2019 £0.4m) of additional non-cash operating expenses relating to the put and call option agreement to
acquire the remaining 20% of First Mortgage. In 2019, £0.4m of one-off costs associated with the acquisition of First Mortgage were also adjusted.
2. Adjusted for items in note (1) above and impairment of loans to related parties of £1.7m in 2020.
Number of advisers: 1,580
26.9% gross profit margin
23.8%
2017
23.1%
2018
23.1%
2019
2.2%
22.7%
2020
4.2%
1,078
2017
1,213
2018
1,375
2019
82
1,483
2020
97
14.5% overheads1 as % of revenue
12.0% adj. PBT margin2
13.4%
2017
12.7%
2018
12.4%
2019
0.6%
10.4%
2020
1.6%
10.9%
2017
10.7%
2018
10.8%
2019
1.6%
11.9%
2020
2.6%
MAB excl. First Mortgage
Impact of First Mortgage
10
Revenue: income source
11
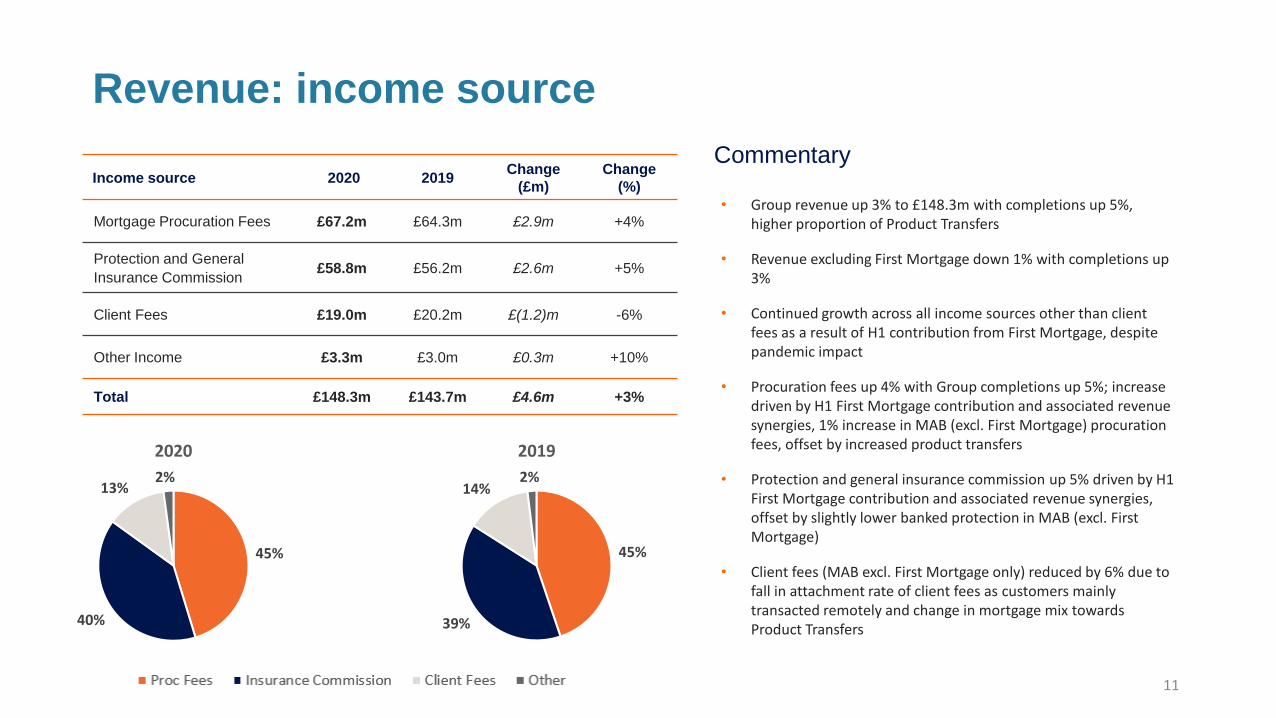
Income source 2020 2019Change
(£m)
Change
(%)
Mortgage Procuration Fees £67.2m £64.3m £2.9m +4%
Protection and General
Insurance Commission£58.8m £56.2m £2.6m +5%
Client Fees £19.0m £20.2m £(1.2)m -6%
Other Income £3.3m £3.0m £0.3m +10%
Total £148.3m £143.7m £4.6m +3%
Commentary
45%
40%
13%2%
2020
45%
39%
14%2%
2019
• Group revenue up 3% to £148.3m with completions up 5%, higher proportion of Product Transfers
• Revenue excluding First Mortgage down 1% with completions up 3%
• Continued growth across all income sources other than client fees as a result of H1 contribution from First Mortgage, despite pandemic impact
• Procuration fees up 4% with Group completions up 5%; increase driven by H1 First Mortgage contribution and associated revenue synergies, 1% increase in MAB (excl. First Mortgage) procuration fees, offset by increased product transfers
• Protection and general insurance commission up 5% driven by H1 First Mortgage contribution and associated revenue synergies, offset by slightly lower banked protection in MAB (excl. First Mortgage)
• Client fees (MAB excl. First Mortgage only) reduced by 6% due to fall in attachment rate of client fees as customers mainly transacted remotely and change in mortgage mix towards Product Transfers

Y-o-y revenue change Q1 Q2 Q3 Q4 Year
£3.8m
£7.3m
£2.1m
£3.6m
£2.0m
£3.2m £2.8m
£0.7m
£1.3m
£6.6m
8.0
6.0
4.0
2.0
0.0
2.0
4.0
6.0
8.0
Revenue: quarterly
12
Commentary
Quarterly revenue Q1 Q2 Q3 Q4 Year
Revenue
(y-o-y change)
£35.0m
(+£7.0m)
£28.5m
(-£4.5m)
£37.1m
(-£2.8m)
£47.7m
(+£4.9m)
£148.3m
(+£4.6m)
Average active
Advisers1,457 1,348 1,455 1,552 1,455
Average revenue per
active Adviser£24.0k £21.2k £25.5k £30.8k £101.9k
Change in Revenue vs 2019 (£m)
• Q1 strong post December 2019 General Election
• Q2 heavily impacted both in terms of active Advisers and banked and written productivity
• Q3 banked productivity continued to be impacted despite considerable increase in written business activity from increase in house purchase volumes
• Strong Q4 banked and written productivity

Strong cash conversion supports growing dividend
1. Adjusted cash conversion is cash generated from operating activities adjusted for movements in non-trading items, including loans to Appointed Representative firms and loans to associates,
totalling £(1.5)m in 2020 (2019: £0.9m) and increases in restricted cash balances of £0.5m in 2020 (2019: £2.2m) as a percentage of adjusted operating profit.
112% Cash Conversion1
£11.7m Excess Capital
Commitment to dividends
Unrestricted Cash Balance
109%113%
119%
112%
2017 2018 2019 2020
£9.5m
£12.0m £11.7m
£17.1m
£2.5m £2.8m £3.1m £3.4m
31/12/2017 31/12/2018 31/12/2019 31/12/2020
Excess FCA Requirement
£13.2m £13.9m
£7.0m
£18.6m
31/12/2017 31/12/2018 31/12/2019 31/12/2020
9.5p 10.6p 11.1p
6.4p
11.9p12.7p
6.4p
19.26.4p
2017 2018 2019 2020
Interim Final Series3
13

Income Statement
1. Adjusted in 2020 for £0.4m (2019 £0.2m) amortisation of acquired intangibles and £0.9m
(2019 £0.4m) of additional non-cash operating expenses relating to the put and call
option agreement to acquire the remaining 20% of First Mortgage. In 2019, £0.4m of one-
off costs associated with the acquisition of First Mortgage were also adjusted. Also
adjusted for impairment of loans to related parties of £1.7m in 2020 (2019: £nil).
2. An active adviser is an adviser who had not been furloughed, and was therefore able to
write business.
Commentary
14
• Revenue up 3% to £148.3m, including £14.7m
from First Mortgage
• Gross profit margin increase, growth in
administrative expenses and overheads ratio
mainly reflect the full year impact of the First
Mortgage acquisition
• Overheads ratio also impacted by lower revenue
growth despite overhead savings of c.£3m
• Adjusted Profit Before Tax1 down 5% to £17.8m in
a year heavily affected by Covid-19
• Adjusted Profit Before Tax1 Margin of 12.0%
(2019: 13.0%)
• Adjusted EPS1 down 5% to 28.6p (2019: 30.1p)
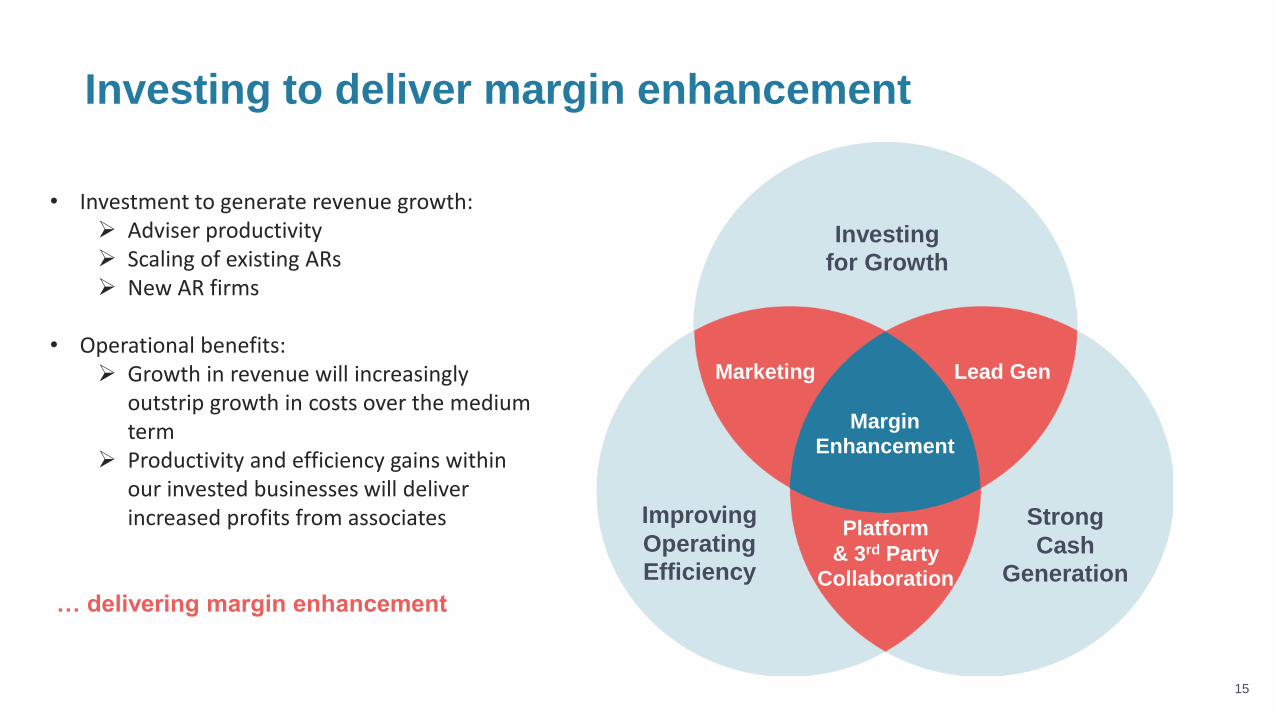
Investing to deliver margin enhancement
Investing
for Growth
Improving
Operating
Efficiency
Strong
Cash
Generation
Marketing Lead Gen
Platform
& 3rd Party
Collaboration
• Investment to generate revenue growth:➢ Adviser productivity➢ Scaling of existing ARs➢ New AR firms
• Operational benefits:➢ Growth in revenue will increasingly
outstrip growth in costs over the medium term
➢ Productivity and efficiency gains within our invested businesses will deliver increased profits from associates
… delivering margin enhancement
15
Margin
Enhancement

Strategy
16

Investing in future ready capabilities
17
Further develop our business model to help
our ARs to have deeper and longer-lasting
relationship with their customers
Platform developments will
enhance scalability and agility
resulting in improving overheads
ratio in the medium term
Deliver a platform solution and data
analytics that enable our AR partners to
flex in scale and scope quickly and cost
effectively
Provide customers with the
optimum balance of efficient
digital solutions, combined with
the reassurance of human
interaction and advice
Transform risk management
process and strengthen our
technology infrastructure
Digital
Business
Acceleration
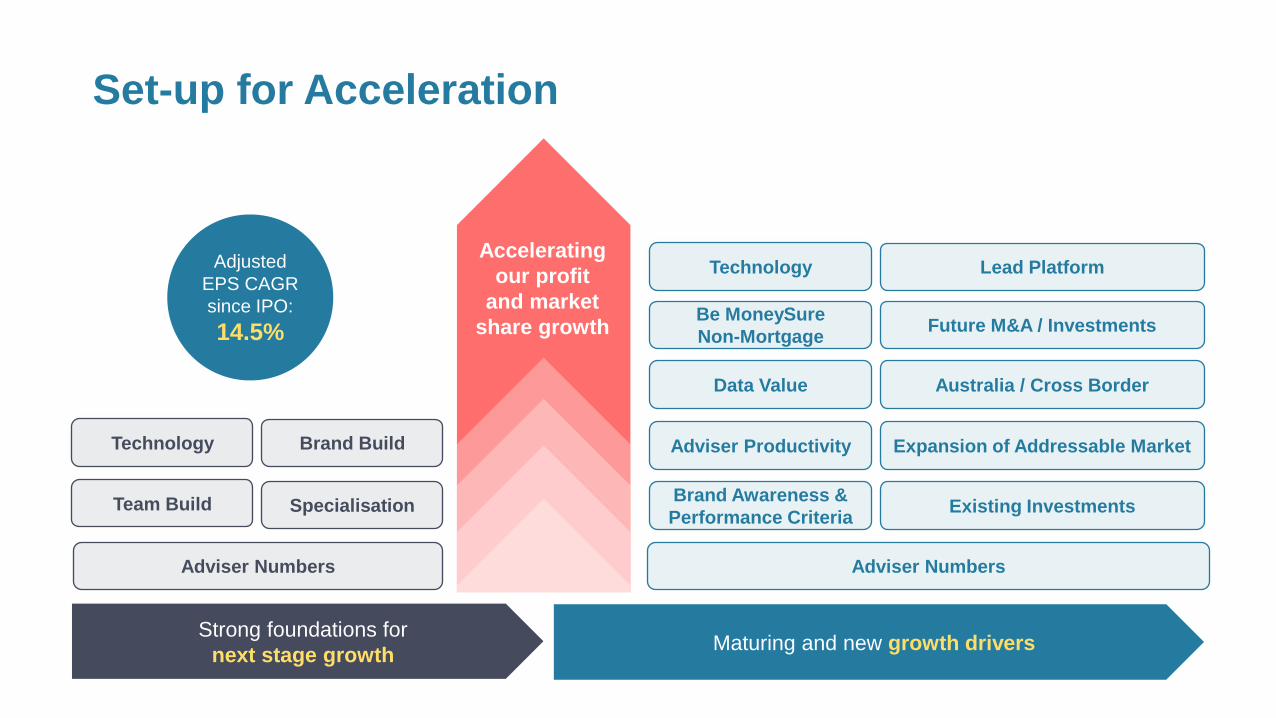
Set-up for Acceleration
Team Build Specialisation
Adviser Numbers
Brand Build
Existing InvestmentsBrand Awareness &
Performance Criteria
Adviser Productivity
Adviser Numbers
Australia / Cross BorderData Value
Future M&A / Investments
Lead Platform
Expansion of Addressable MarketTechnology
TechnologyAccelerating
our profit
and market
share growth
Strong foundations for
next stage growthMaturing and new growth drivers
Adjusted
EPS CAGR
since IPO:
14.5%Be MoneySure
Non-Mortgage

• Exclusive partnership
with innovative new
property portal
• Major focus on millions
of homeowners and
future buyers in early
stages of research
• Savings and investing
app launches mortgage
service in partnership
with MAB
• Helping hundreds of
thousands of customers
save for their first home
through its popular
Lifetime ISAs and other
products
• Strategic partnership to
deliver MAB Home
Buying Buddy app
• Digital coaching
technology engages and
nurtures consumers to
achieve their life goals
• Customer insights will
deliver a more
personalised experience
• Collaboration with
technology firm MQube
leveraging its expertise
and investment in data
• Explore and deliver
practical implications of
machine learning and AI
for mortgages
*see Appendix for further information
• New MAB brand for
planned increase in
non-mortgage related
products and services
• Initial launch with MAB
Wealth Management
and home moving
services
Adviser Growth
Adviser Productivity
Addressable Market
New Products & Services
Lead Generation
Customer Experience
19
Q1 2021 Progress on our initiatives
* **

Summary
and Outlook
20

Summary & outlook
21
• Strong performance and market share growth demonstrates
the resilience of our operating model.
• Significant progress made through securing major new lead
sources that are fundamental to MAB’s growth strategy.
• Healthy pipeline of both Adviser recruitment and written
business, despite the various lockdown restrictions.
• Strong fundamentals of house purchase demand will be
supported by recent Budget announcement.
• Current trading is in line with Board expectations.
• Maturing and new growth drivers will support future profits
and market share growth.

Appendices
22

Award Winning
23

Company Overview
• Mortgage Advice Bureau (“MAB”) is a leading UK mortgage
intermediary network
• Directly authorised by FCA, MAB operates an Appointed
Representative (AR) network which specialises in providing
mortgage advice to customers as well as advice on protection
and general insurance
• Over 1,600 Advisers, almost all employed or engaged by ARs
• All compliance supervision undertaken by MAB employees
• Broad geographical spread across the UK
• Developed leading in-house proprietary trading platform called
MIDAS Pro
• Won over 150 awards
24

ManagementExecutive Team Non-Executive Team
* David Preece retired as Chief Operating Officer on 30 June 2019 and became a Non-executive Director.
25

80% 100%
25% 49%
49%
25% 49%
49%
25%
20% 49%
43%
49%
48%
40% 49%
New Build
First Mortgage Acquisition
Telephony / Network
Telephony
Online Leads
Specialist New Build
Protection
Conveyancing
Surveys
International
New Build / Shared Ownership
-
-
-
-
Growth Focus – our investments
SpecialismStrategicDistribution Shareholding1
Clear
Vita
Mortgage Focus
Vita
MAB Australia
1. Initial Maximum
North East
Clear
2. In March 2021, Meridian agreed to acquire Metro Finance Brokers Ltd. The acquisition is subject to FCA approval 26
+ +

Cash Balance Waterfall Unrestricted net cash balances1
1. Unrestricted net cash balances are for operational purposes; they exclude restricted balances (AR retained commission in case of clawback) and £12m Natwest Revolving Credit Facility loan.
2. Cash generated from operating activities of £22.1m, less £0.2m dividends received from associates and movements in restricted balances of £0.5m.
3. Principal elements of lease payments of £0.35m. Interest received of £0.1m, less interest paid of £0.2m. 27
£7.0m
£21.4m
£4.3m £0.2m
£6.8m
£4.4m
£0.3m£2.3m
£0.5m£18.6m
-
5.0
10.0
15.0
20.0
25.0
30.0
35.0
40.0
Unrestricted balancesat 1 January 2020
Cash generated fromoperations excl.associates andmovement in
restricted balances
Issue of shares Dividends receivedfrom associates
Dividends paid Tax paid Capital expenditure Investments inassociates
Net interest paid andprincipal element of
lease payments
Unrestricted balancesat 31 December 2020
£m
2
3

Balance Sheet – Strong financial position
28

-24 months Completion +60 months
-18 months
+36 months+12 months-12 months
-6 months +24 months +48 months
Property Search
Mortgage Platforms
Estate Agents
Builders
Mortgage Shops
Online
Tenants / LISA Savers
Workplace/employees Home Services
Financial Planning
Protection Reviews
Remo / Product Transfer
Capture / Nurture Nurture / Financial Reviews
Growth Focus –
early customer capture / nurture
29

Our latest
Partnerships
30

Our latest
Partnerships
31

32
Our latest
Partnerships