delivering pain management in a rural setting · 2017-12-06 · skype • variable ... – 0.045%...
TRANSCRIPT

Delivering pain management in a rural setting
the why and how
Malcolm Hogg Royal Melbourne Hospital

Summary
• Health perspectives in rural areas
• Pain management delivery – Policies – Models
• Experience in a provincial setting

Pain and the rural sector
• Higher number middle aged men • Higher unemployment • Lower life expectancy
– ? 4 yrs, 44% higher death rate – MVA 3, suicide 1.66 odds ratio
• More back pain » ABS Social Trends 2011
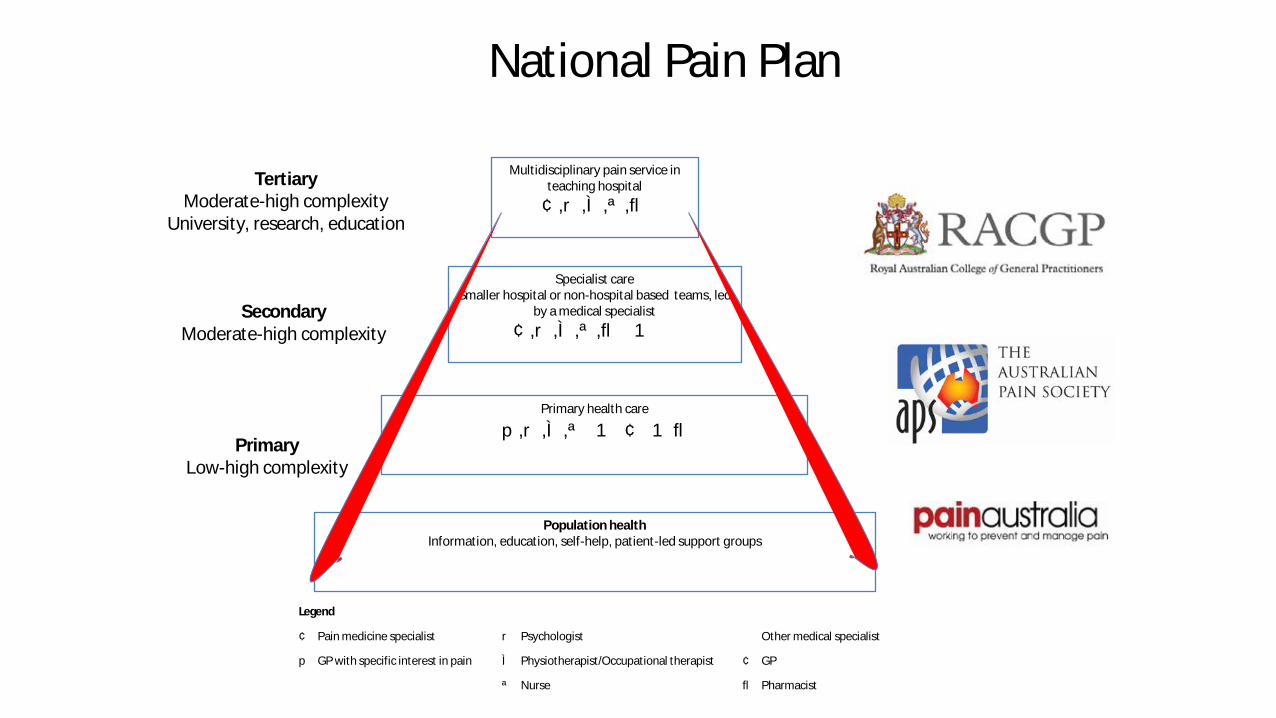
National Pain Plan
Population health Information, education, self-help, patient-led support groups
Primary health care
p,r,Ì,ã 1 ¢ 1 ¯
Specialist care Smaller hospital or non-hospital based teams, led
by a medical specialist ¢,r,Ì,ã,¯ 1 ò
Multidisciplinary pain service in teaching hospital ¢,r,Ì,ã,¯
Tertiary Moderate-high complexity
University, research, education
Secondary Moderate-high complexity
Primary Low-high complexity
Legend
¢ Pain medicine specialist
p GP with specific interest in pain
r Psychologist
Ì Physiotherapist/Occupational therapist
ã Nurse
ò Other medical specialist
¢ GP
¯ Pharmacist

Ballarat
• Regional centre – Catchment to outer western Victoria
• grampians region 224000 population (2010) • regional cancer centre (2014)
– CTS allied health pain management – Medical clinic to support
• MBS model, 0.1 FTE VMO • registrar support • medical student involvement
– 20% chronic compensable – Established model
• infrastructure

Ballarat
• Demand > supply – opioid permit policy – inpatient referrals for outpatient care – review/maintainence therapy – DOH: 0.23% pop/yr: estimate 500/yr
• End June 2013 – $ 34,000 income/donation pa + medicolegal – staff retention issue

VicPPOC: pilot 2013-4
• Dr Carolyn Arnold, CGMC + DHHS • 2 City + Ballarat
– recruitment, HREC difficult – lower S/E, diversity – more males, more likely WCA – no intake questionnaire differences
• difficult to extrapolate outcomes although comparable • low education: assistance to complete study • 10% reduction on VNRS, interference at 6 mths
– no disability change
• Clinical impression – less disabled, more medication reliance, still respond to therapy program

Other funding model
• Rural Health Outreach Fund – Amalgamation of a number of support programs (November 2012)
• retained Medical Outreach Indigenous Chronic Disease Program – Competitive funding rounds (up to 3 yrs)
• multidisciplinary teams • integration with local services • chronic disease management one of the priorities • emphasis on RA3 (outer regional)- RA5 (very remote) classification
– Driven by fundholders proposals
• governance requirements – not for salaries (except backfill)
• needs analysis with Medicare Locals/Local Heath Services


Telehealth
• MBS incentive program – outside RA-1, minimum 15 km
distance • Except RACF, Aboriginal health
– on-board incentive $3,900 – billing consents – 2820
• 50% add on to MBS items – 2801 $128 – 2806 $64 – (122 $220)
– incentives up to June 2014 • specialist $39 • bulk-billing $13

Experience Ave: $650/session
Potential for efficiency gains by using case conference, time mx

Telehealth
• Ideal for pain medicine – limited exam required – potential for pt, GP, staff education – mixed services: excellent for reviews – cost effective
» Thaker D. MJA 2013; 199: 414
• Variable uptake – 80% GP practices in Grampians region telehealth enabled – need broader telehealth items numbers
• GP’s to non billing specialists, RACF’s, specialist allied health staff – lack of government policies
» Medicare Local Alliance report 2013

Activity data
• 18 mth MBS data – 0.27% population (number) had been involved in a telehealth consultation – 40% specialist consults unsupported: direct to patient – 35% total “patient end” claimed by GP/practice – low uptake by pall care, geriatric medicine despite need

? Skype
• Variable technology – Skype, Vidyo, Go To Meeting: positive – Cisco Jabber: difficulties re configuration requirements – Mmex: WA – HealthDirect
• Skype concerns
– Security, reliability – Bandwidth use high

Community care
• Lower access in provincial/rural area – 0.045% ps vs 0.17%
» Hogg M MJA 2012; 196:386
– unmet need in rural community • lower socioeconomic • higher corporate GP
• Pharmaceutical misuse
– anecdotally higher – PBS higher outer urban – no difference in opioids 90 day post op
» Clarke H. BMJ 2014; 348
– nil published re Australia » Roxburgh A. MJA 2011; 195: 280

Atlas in Healthcare Variation 2015
Opioid dispensing

Variability re regions and S/E

• US National Vital Statistics System, Centres for Disease Control & Prevention • International Narcotics Control Board. Narcotic drugs: estimated world
requirements for 2013. Statistics for 2011. New York: United Nations, 2012. • Roxburgh A, Burns L. Accidental drug-induced deaths due to opioids in
Australia, 2011. Sydney: National Drug and Alcohol Research Centre, 2015
Opioid use DDD per thousand people
Opioid related deaths per million people
Opioid related deaths with medical prescription
USA 51.1 (2011) 87.8 (2014)
50%
Australia 14.2 (2011) 30.6 (2011)
70%
USA : Australia comparisons

Median wait time = 55 days

Outcomes at episode end (N=2801)
• Percent using opioids >2 days/week decreased from 58% to 35% • Daily morphine equivalent reduced 69mg to 46mg • 42% of patients reduced the number of drugs groups

Cannabis is big business
