dell inc....our company is a delaware corporation and was founded in 1984 by michael dell on a...
TRANSCRIPT
UNITED STATESSECURITIES AND EXCHANGE COMMISSION
Washington, D.C. 20549
Form 10-K(Mark One)
≤ ANNUAL REPORT PURSUANT TO SECTION 13 OR 15(d) OF THE SECURITIESEXCHANGE ACT OF 1934
For the fiscal year ended: January 30, 2009or
n TRANSITION REPORT PURSUANT TO SECTION 13 OR 15(d) OF THE SECURITIESEXCHANGE ACT OF 1934
For the transition period from to
Commission file number: 0-17017
Dell Inc.(Exact name of registrant as specified in its charter)
Delaware 74-2487834(State or other jurisdiction ofincorporation or organization)
(I.R.S. EmployerIdentification No.)
One Dell Way, Round Rock, Texas 78682(Address of principal executive offices) (Zip Code)
Registrant’s telephone number, including area code: (512) 338-4400
Securities registered pursuant to Section 12(b) of the Act:Title of each class Name of each exchange on which registered
Common Stock, par value $.01 per share The NASDAQ Stock Market LLC
Securities Registered Pursuant to Section 12(g) of the Act: None
Indicate by check mark if the registrant is a well-known seasoned issuer, as defined in Rule 405 of the Securities Act. Yes ¥ No n
Indicate by check mark if the registrant is not required to file reports pursuant to Section 13 or Section 15(d) of the Act. Yes n No ¥
Indicate by check mark whether the registrant (1) has filed all reports required to be filed by Section 13 or 15(d) of the SecuritiesExchange Act of 1934 during the preceding 12 months (or for such shorter period that the registrant was required to file such reports), and(2) has been subject to such filing requirements for the past 90 days. Yes ¥ No n
Indicate by check mark if disclosure of delinquent filers pursuant to Item 405 of Regulation S-K is not contained herein, and will not becontained, to the best of registrant’s knowledge, in definitive proxy or information statements incorporated by reference in Part III of thisForm 10-K or any amendment to this Form 10-K. n
Indicate by check mark whether the registrant is a large accelerated filer, an accelerated filer, a non-accelerated filer, or a smallerreporting company. See the definitions of “large accelerated filer”, “accelerated filer”, and “smaller reporting company” in Rule 12b-2 ofthe Exchange Act. (Check One):
Large accelerated filer ¥ Accelerated filer n
Non-accelerated filer n (do not check if smaller reporting company) Smaller reporting company n
Indicate by check mark whether the registrant is a shell company (as defined in Rule 12b-2 of the Act). Yes n No ¥
Approximate aggregate market value of the registrant’s common stock held by non-affiliates as of August 1,2008, based upon the closing price reported for such date on The NASDAQ Stock Market . . . . . . . . . . . . . $41.8 billion
Number of shares of common stock outstanding as of March 13, 2009 . . . . . . . . . . . . . . . . . . . . . . . . . . . . . . . 1,951,045,734

DOCUMENTS INCORPORATED BY REFERENCE
The information required by Part III of this report, to the extent not set forth herein, is incorporated by reference from the registrant’sproxy statement relating to the 2009 annual meeting of stockholders. Such proxy statement will be filed with the Securities and ExchangeCommission within 120 days after the end of the fiscal year to which this report relates.

PART I Table of Contents Page
Item 1. Business. . . . . . . . . . . . . . . . . . . . . . . . . . . . . . . . . . . . . . . . . . . . . . . . . . . . . . . . . . . . . . . . . . . . . . . . . . 1
Item 1A. Risk Factors . . . . . . . . . . . . . . . . . . . . . . . . . . . . . . . . . . . . . . . . . . . . . . . . . . . . . . . . . . . . . . . . . . . . . . . 10
Item 1B. Unresolved Staff Comments . . . . . . . . . . . . . . . . . . . . . . . . . . . . . . . . . . . . . . . . . . . . . . . . . . . . . . . . . . . 14
Item 2. Properties . . . . . . . . . . . . . . . . . . . . . . . . . . . . . . . . . . . . . . . . . . . . . . . . . . . . . . . . . . . . . . . . . . . . . . . . . 15Item 3. Legal Proceedings . . . . . . . . . . . . . . . . . . . . . . . . . . . . . . . . . . . . . . . . . . . . . . . . . . . . . . . . . . . . . . . . . . 16
Item 4. Submission of Matters to a Vote of Security Holders . . . . . . . . . . . . . . . . . . . . . . . . . . . . . . . . . . . . . . . . . 16
PART II
Item 5. Market for Registrant’s Common Equity, Related Stockholder Matters and Issuer Purchases of EquitySecurities . . . . . . . . . . . . . . . . . . . . . . . . . . . . . . . . . . . . . . . . . . . . . . . . . . . . . . . . . . . . . . . . . . . . . . . . . 17
Item 6. Selected Financial Data . . . . . . . . . . . . . . . . . . . . . . . . . . . . . . . . . . . . . . . . . . . . . . . . . . . . . . . . . . . . . . 20
Item 7. Management’s Discussion and Analysis of Financial Condition and Results of Operations . . . . . . . . . . . . . 21
Item 7A. Quantitative and Qualitative Disclosures About Market Risk . . . . . . . . . . . . . . . . . . . . . . . . . . . . . . . . . . . 48
Item 8. Financial Statements and Supplementary Data . . . . . . . . . . . . . . . . . . . . . . . . . . . . . . . . . . . . . . . . . . . . . . 49
Item 9. Changes in and Disagreements with Accountants on Accounting and Financial Disclosure . . . . . . . . . . . . . 94
Item 9A. Controls and Procedures . . . . . . . . . . . . . . . . . . . . . . . . . . . . . . . . . . . . . . . . . . . . . . . . . . . . . . . . . . . . . . 94
Item 9B. Other Information. . . . . . . . . . . . . . . . . . . . . . . . . . . . . . . . . . . . . . . . . . . . . . . . . . . . . . . . . . . . . . . . . . . 95
PART III . . . . . . . . . . . . . . . . . . . . . . . . . . . . . . . . . . . . . . . . . . . . . . . . . . . . . . . . . . . . . . . . . . . . . . . . . . . . . . . . 96
PART IV
Item 15. Exhibits, Financial Statement Schedules . . . . . . . . . . . . . . . . . . . . . . . . . . . . . . . . . . . . . . . . . . . . . . . . . . 96
Signatures . . . . . . . . . . . . . . . . . . . . . . . . . . . . . . . . . . . . . . . . . . . . . . . . . . . . . . . . . . . . . . . . . . . . . . . . . . . . . . . . 98
Exhibit Index . . . . . . . . . . . . . . . . . . . . . . . . . . . . . . . . . . . . . . . . . . . . . . . . . . . . . . . . . . . . . . . . . . . . . . . . . . . . . . . . 100
Exhibits (attached to the Report on Form 10-K)

This report contains forward-looking statements that are based on Dell’s current expectations. Actual results in future periodsmay differ materially from those expressed or implied by those forward-looking statements because of a number of risks anduncertainties. For a discussion of risk factors affecting our business and prospects, see “Part I — Item 1A — Risk Factors.”
All percentage amounts and ratios were calculated using the underlying data in thousands. Unless otherwise noted, all refer-ences to industry share and total industry growth data are for computer systems (including desktops, notebooks, and x86 serv-ers), and are based on information provided by IDC Worldwide Quarterly PC Tracker, February 17, 2009. Industry share data isfor the full calendar year and all our growth rates are on a fiscal year-over-year basis. Unless otherwise noted, all references totime periods refer to our fiscal periods.
ITEM 1 — BUSINESS
General
Dell listens to customers and delivers innovative technology and services they trust and value. As a leading technology company, we offera broad range of product categories, including mobility products, desktop PCs, software and peripherals, servers and networking,services, and storage. According to IDC, we are the number one supplier of computer systems in the United States and the number twosupplier worldwide.
Our company is a Delaware corporation and was founded in 1984 by Michael Dell on a simple concept: by selling computer systemsdirectly to customers, we can best understand their needs and efficiently provide the most effective computing solutions to meet thoseneeds. Over time we have expanded our business model to include a broader portfolio of products, including services, and we have alsoadded new distribution partners, such as retail, system integrators, value added resellers, and distributors, which allow us to reach evenmore end-users around the world. Our corporate headquarters are located in Round Rock, Texas, and we conduct operations worldwidethrough our subsidiaries. To optimize our global supply chain to best serve our global customer base, we have manufacturing locationsaround the world and are expanding our relationships with third-party original equipment manufacturers. When we refer to our companyand its business in this report, we are referring to the business and activities of our consolidated subsidiaries. We operate principally inone industry, and we manage our business in four operating segments: Americas Commercial; Europe, Middle East and Africa(“EMEA”) Commercial; Asia Pacific-Japan (“APJ”) Commercial; and Global Consumer.
We are committed to managing and operating our business in a responsible and sustainable manner around the globe. This includes ourcommitment to environmental responsibility in all areas of our business. See “Part I — Item 1— Business — Sustainability.” This alsoincludes our focus on maintaining a strong control environment, high ethical standards, and financial reporting integrity. See “Part II —Item 9A — Controls and Procedures.”
Business Strategy
Direct relationships with our customers give us an advantage of seeing changing customer requirements and needs earlier than companieswho do not have the same breadth of direct relationships. As a result, we are able to develop products with simpler and more productivetechnology to better serve our customers. As we continue to expand our global presence, we are further diversifying our revenue andprofit streams. Our strategy is to focus on higher margin products, services, and solutions to increase overall profitability as we balanceour liquidity, profitability, and growth. We are also focused on improving our competitiveness by reducing overall costs. In May 2008, weannounced a $3 billion cost reduction initiative, which includes both cost of goods sold and operating expenses. In the fourth quarter ofFiscal 2009, we identified additional savings opportunities and have increased our cost-reduction target to $4 billion by the end of Fiscal2011. Our growth strategy involves reaching more customers worldwide through new distribution partners, such as retail, expanding ourrelationships with value-added resellers and distributors, and augmenting select areas of our business through targeted acquisitions. Ourgoal continues to be to optimize the balance of liquidity, profitability, and growth with a focus on increasing the mix of our productportfolio to higher margin products and recurring revenue streams.
• Provide great value to customers and partners through direct relationships. We are committed to innovating without legacy, creatingefficient solutions, and providing price, performance, and feature leadership across all of our businesses. In addition, we will deliver thepower of cloud computing and connect with our customers through the Internet. We are focused on helping customers identify andremove unnecessary cost and complexity in IT architecture and operations. In addition, we seek to broaden our profit stream to capturecomplementary opportunities in new solutions for customers that include search, services, and 3G originations. To that end, duringFiscal 2009 we released a broad lineup of dedicated virtualization solutions, including software, servers, services, and storage.
1

• Optimize the balance of liquidity, profitability, and growth with a focus on increasing the mix of our product portfolio to higher marginproducts and recurring revenue streams. We will balance our mix of products and services to increase profitability over time. We arecommitted to shifting our solutions portfolio to higher margin solutions and recurring revenue streams in software, servers, services,and storage. Our services business has growth opportunities both in driving attachment of services onto existing product platforms andexpanding into new solution offerings. We expect to expand our presence in the enterprise solution arena as we add more capabilitiesthat are attractive to existing and new customers. We are committed to improving our storage and server products and services asevidenced by our new building IT-as-a-Service solution, an integrated service delivery platform that is simple, modular, and flexible,and which provides businesses with remote and lifecycle management, e-mail backup, and software license management, among otherservices. In addition to services, system software presents another opportunity for us to further strengthen our portfolio.
Product Development
We focus on developing standards-based technologies that incorporate highly desirable features and capabilities at competitive prices.We employ a collaborative approach to product design and development where our engineers, along with direct customer input, designinnovative solutions and work with a global network of technology companies to architect new system designs, influence the direction offuture development, and integrate new technologies into our products. Through this collaborative, customer-focused approach, we striveto deliver new and relevant products and services to the market quickly and efficiently. We are continuing to expand our use of originaldesign manufacturing partnerships and manufacturing outsourcing relationships to generate cost efficiencies, deliver products faster, andbetter serve our customers in certain product categories, customer segments, and geographical areas. Our research, development, andengineering expenses were $665 million for Fiscal 2009, $693 million for Fiscal 2008, and $498 million for Fiscal 2007, includingacquisition related in-process research and development of $2 million for Fiscal 2009 and $83 million for Fiscal 2008.
Products and Services
We design, develop, manufacture, market, sell, and support a wide range of products that in many cases are customized to individualcustomer requirements. Our product categories include mobility products, desktop PCs, software and peripherals, servers andnetworking, services, and storage. See “Part II — Item 7 — Management’s Discussion and Analysis of Financial Condition and Resultsof Operations — Revenue by Product and Service Categories” and Note 11 of Notes to Consolidated Financial Statements included in“Part II — Item 8 — Financial Statements and Supplementary Data.”
• Mobility — The XPSTM and AlienwareTM lines of notebook computers are targeted at customers seeking the best experiences anddesigns available, from sleek, elegant, thin, and light notebooks to the highest performance gaming systems. In Fiscal 2009, weintroduced the new stylish Studio line of consumer notebooks with powerful multimedia elements. The InspironTM line of notebookcomputers is designed for consumers seeking the latest technology and high performance in a stylish and affordable package. In Fiscal2009, we added the 3G enabled Mini, a light, highly mobile notebook, to the Inspiron line. The LatitudeTM line is designed to helpbusiness, government, and institutional customers manage their total cost of ownership through managed product lifecycles and thelatest offerings in performance, security, and communications. The VostroTM line is designed to customize technology, services, andexpertise to suit the specific needs of small businesses. The Dell PrecisionTM line of mobile workstations is intended for professionalusers who demand exceptional performance to run sophisticated applications. This year, we also had the largest global product launchin our company’s history with our new E-Series commercial Latitude and Dell Precision notebooks.
• Desktop PCs — The XPSTM and AlienwareTM lines of desktop computers are targeted at customers seeking the best experiences anddesigns available, from multimedia capability to the highest gaming performance. The OptiPlexTM line is designed to help business,government, and institutional customers manage their total cost of ownership by offering a portfolio of secure, manageable, and stablelifecycle products. The InspironTM line of desktop computers is designed for mainstream PC users requiring the latest features for theirproductivity and entertainment needs. The VostroTM line is designed to provide technology and services to suit the specific needs ofsmall businesses. In July 2008, we introduced the Studio line of compact and stylish consumer desktops, which includes the Hybrid,our most power efficient consumer desktop.
Dell PrecisionTM desktop workstations are intended for professional users who demand exceptional performance from hardwareplatforms optimized and certified to run sophisticated applications, such as those needed for three-dimensional computer-aided design,digital content creation, geographic information systems, computer animation, software development, computer-aided engineering,game development, and financial analysis.
2
• Software and Peripherals — We offer Dell-branded printers and displays and a multitude of competitively priced third-party peripheralproducts, including software titles, printers, televisions, notebook accessories, networking and wireless products, digital cameras,power adapters, scanners, and other products.
– Software. We sell a wide range of third-party software products, including operating systems, business and office applications,anti-virus and related security software, entertainment software, and products in various other categories. In Fiscal 2009, welaunched the Dell Download Store, an online software store for consumers and small-and-medium-sized businesses.
– Printers. We offer a wide array of Dell-branded printers, ranging from all-in-one ink jet printers for consumers to largemultifunction devices for corporate workgroups. In Fiscal 2009, we further expanded our product portfolio and launched the world’ssmallest color laser printer. Dell-branded printers continue to win awards for reliability and value.
– Displays. We offer a broad line of branded and non-branded display products, including flat panel monitors and projectors. Wecontinue to win awards for quality, performance, and value across our monitors and projector product lines. The M109s on-the-goprojector was the first pocket projector to ship in the industry at the end of calendar 2008 and won the prestigious CES Innovations2009 award in January 2009.
• Servers and Networking — Our standards-based PowerEdgeTM line of servers is designed to offer customers affordable performance,reliability, and scalability. Options include high performance rack, blade, and tower servers for enterprise customers and value towerservers for small organizations, networks, and remote offices. We also offer customized Dell server solutions for very large data centercustomers. During the Fiscal 2009, we released a broad line-up of dedicated virtualization solutions, including new servers, tools, andservices. We expect to refresh our servers and networking product portfolio in Fiscal 2010.
Our PowerConnectTM switches connect computers and servers in small-to-medium-sized networks. PowerConnectTM products offercustomers enterprise-class features and reliability at a high value for our customers.
• Services — Our global services business offers a broad range of configurable IT services that help commercial customers and channelpartners plan, implement, and manage IT operations and consumers install, protect, and maintain their computer systems andaccessories. Our service solutions help customers simplify IT, thus maximizing the performance, reliability, and cost-effectiveness ofIT operations.
– Infrastructure Consulting Services. Our consulting services help customers evaluate, design, and implement standards-based ITinfrastructures. These customer-oriented consulting services are designed to be focused and efficient, providing customers access toour experience and guidance on how to best architect and operate IT operations.
– Deployment Services. Our deployment services simplify and accelerate the deployment of enterprise products and computersystems in customers’ environments. Our processes and deployment technologies enable customers to get systems up and runningquickly and reliably, with minimal end-user disruption.
– Asset Recovery and Recycling Services. We offer a variety of flexible services for the secure and environmentally safe recoveryand disposal of owned and leased IT equipment. Various options, including resale, recycling, donation, redeployment, employeepurchase, and lease return, help customers retain value while facilitating regulatory compliance and minimizing storage costs.
– Training Services. We help customers develop the skills and knowledge of key technologies and systems needed to increase theirproductivity. Courses include hardware and software training as well as computer system skills and professional developmentclasses available through instructor-led, virtual, or self-directed online courses.
– Support Services. Our suite of scalable support services is designed for IT professionals and end-users whose needs range frombasic phone support to rapid response and resolution of complex problems. We offer flexible levels of support that span fromdesktop and notebook PCs to complex servers and storage systems, helping customers maximize uptime and stay productive. Oursupport services include warranty services and proactive maintenance offerings to help prevent problems as well as rapid responseand resolution of problems. These services are supported by our network of Global Command Centers in the U.S., Ireland, China,Japan, and Malaysia, providing rapid, around-the-clock support for critical commercial systems.
– Managed Services. We offer a full suite of managed service solutions for companies who desire outsourcing of some or all of theirIT management. From planning to deployment to ongoing technical support, our managed services are modular in nature so thatcustomers can customize a plan based on their current and future needs. We can manage a portion of their IT tasks or provide anend-to-end solution.
3
• Storage — We offer a comprehensive portfolio of advanced storage solutions, including storage area networks, network-attachedstorage, direct-attached storage, disk and tape backup systems, and removable disk backup. With our advanced storage solutions formainstream buyers, we offer customers functionality and value while reducing complexity in the enterprise. Our storage systems areeasy to deploy, manage, and maintain. The flexibility and scalability offered by Dell PowerVaultTM, Dell EqualLogicTM, and Dell � EMCstorage systems help organizations optimize storage for diverse environments with varied requirements. During the fiscal year, weexpanded our storage portfolio by adding increasingly flexible storage choices that allow customers to grow capacity, add performanceand protect their data in a more economical manner.
Financial Services
We offer or arrange various customer financial services for our business and consumer customers in the U.S. through Dell FinancialServices L.L.C. (“DFS”), a wholly-owned subsidiary of Dell. DFS offers a wide range of financial services, including originating,collecting, and servicing customer receivables related to the purchase of Dell products. DFS offers private label credit financingprograms through CIT Bank to qualified consumer and small business customers and offers leases and fixed-term financings to businesscustomers. Financing through DFS is one of many sources of funding that our customers may select. For additional information about ourfinancing arrangements, see “Part II — Item 7 — Management’s Discussion and Analysis of Financial Condition and Results ofOperations — Financing Receivables and Off-Balance Sheet Arrangements” and Note 6 of Notes to Consolidated Financial Statementsincluded in “Part II — Item 8 — Financial Statements and Supplementary Data.”
Sales and Marketing
We sell our products and services directly to customers through dedicated sales representatives, telephone-based sales, online atwww.dell.com, and through a variety of indirect sales channels. Our customers include large corporate, government, healthcare, andeducation accounts, as well as small and medium businesses and individual consumers. Within each of our geographic regions, we havedivided our sales and marketing resources among these various customer groups. No single customer accounted for more than 10% of ourconsolidated net revenue during any of the last three fiscal years.
Our sales and marketing efforts are organized around the evolving needs of our customers. Our direct business model provides directcommunication with our customers; thereby allowing us to refine our products and marketing programs for specific customer groups.Customers may offer suggestions for current and future Dell products, services, and operations on an interactive portion of our websitecalled Dell IdeaStorm. This constant flow of communication allows us to rapidly gauge customer satisfaction and target new or existingproducts.
For large business and institutional customers, we maintain a field sales force throughout the world. Dedicated account teams, whichinclude field-based system engineers and consultants, form long-term relationships to provide our largest customers with a single sourceof assistance, develop specific tailored solutions for these customers, and provide us with customer feedback. For large, multinationalcustomers, we offer several programs designed to provide single points of contact and accountability with global account specialists,special global pricing, and consistent global service and support programs. We also maintain specific sales and marketing programstargeted at federal, state, and local governmental agencies, as well as at specific healthcare and educational customers.
We market our products and services to small and medium businesses and consumers primarily by advertising on television and theInternet, advertising in a variety of print media, and mailing or emailing a broad range of direct marketing publications, such aspromotional materials, catalogs, and customer newsletters.
Our business strategy also includes indirect sales channels. Outside the U.S., we sell products indirectly through selected partners tobenefit from the partner’s existing end-user customer relationships and valuable knowledge of traditional customs and logistics in thecountry, to mitigate credit and country risk, and because sales in some countries may be too small to warrant a direct sales business unit.In the U.S., we sell products indirectly through third-party solution providers, system integrators, and third-party resellers. PartnerDirectbrings our existing partner initiatives under one umbrella globally. PartnerDirect includes partner training and certification, dealregistration, dedicated sales and customer care, and a dedicated web portal. We also offer select consumer products in retail stores inseveral countries in the Americas, EMEA, and APJ. Our goal is to have strategic relationships with a number of major retailers in ourlarger geographic regions. During Fiscal 2009, we continued to expand our global retail presence, and we now reach over 24,000 retaillocations worldwide. Our retailers include Best Buy, Staples, Wal-Mart, GOME, and Carrefour, among others.
4

Competition
We operate in an industry in which there are rapid technological advances in hardware, software, and service offerings and face on-goingproduct and price competition in all areas of our business from branded and generic competitors. We compete based on our ability to offerprofitable and competitive solutions to our customers that provide the most current and desired product features as well as customerservice, quality, and reliability. This is enabled by our direct relationships with customers, which allow us to recognize changingcustomer needs faster than other companies. This connection with our customers allows us to best serve customer needs and offers us acompetitive advantage.
According to IDC, we gained 0.2 points of share during calendar 2008 as our 11.1% growth in units outpaced the industry’s overallworldwide computer systems growth of 9.7%. Our gain in share was driven by a strong overall performance in the first half of Fiscal 2009followed by a decline in unit shipments in our commercial business in the second half of the year, which was partially offset by strength inour global consumer business. Our commercial business’s slower unit growth in the second half of Fiscal 2009 reflects our decision in aneroding demand environment to selectively pursue unit growth opportunities while protecting profitability. During the second half ofFiscal 2009, the entire industry faced a challenging IT end-user demand environment as current economic conditions influenced globalcustomer spending behavior.
Technology companies grow by expanding product offerings and penetrating new geographies. To achieve this growth, companiesinnovate and will also lower price. Our ability to maintain or gain share is predicated on our ability to be competitive on product featuresand functionality, geographic penetration, and pricing. Additionally, our efforts to balance our mix of products and services to optimizeprofitability, liquidity, and growth may put pressure on our industry unit share position in the short-term. At the end of Fiscal 2009, weremained the number one supplier of computer systems in the U.S. and the number two supplier worldwide.
Manufacturing and Materials
We manufacture many of the products we sell and have manufacturing locations worldwide to service our global customer base. See“Part I — Item 2 — Properties” for information about our manufacturing locations. In addition, we are continuing to expand our use oforiginal design manufacturing partnerships and manufacturing outsourcing relationships to generate cost efficiencies, deliver productsfaster, and better serve our customers in certain segments and geographical areas.
Our manufacturing process consists of assembly, software installation, functional testing, and quality control. Testing and quality controlprocesses are also applied to components, parts, sub-assemblies, and systems obtained from third-party suppliers. Quality control ismaintained through the testing of components, sub-assemblies, and systems at various stages in the manufacturing process. Qualitycontrol also includes a burn-in period for completed units after assembly, ongoing production reliability audits, failure tracking for earlyidentification of production and component problems, and information from customers obtained through services and support programs.We are certified worldwide by the International Standards Organization to the requirements of ISO 9001: 2000. This certificationincludes our design, manufacture, and service of computer products in all of our locations.
We purchase materials, supplies, product components, and products from a large number of vendors. In some cases, multiple sources ofsupply are not available and we have to rely on single-source vendors. In other cases, we may establish a working relationship with asingle source or a limited number of sources if we believe it is advantageous due to performance, quality, support, delivery, capacity, orprice considerations. This relationship and dependency has not caused material disruptions in the past, and we believe that any disruptionthat may occur because of our dependency on single- or limited-source vendors would not disproportionately disadvantage us relative toour competitors. See “Part I — Item 1A — Risk Factors” for information about the risks associated with single- or limited-sourcesuppliers.
We are actively reviewing all aspects of our facilities, logistics, supply chain, and manufacturing footprints. This review is focused onidentifying efficiencies and cost reduction opportunities and migration to a more variable cost manufacturing model, while maintaining astrong customer experience. Examples of these actions include the closure of our desktop manufacturing facility in Austin, Texas, thesale of our call center in El Salvador, the recent announcement of our migration and closure of manufacturing operations from ourLimerick, Ireland facility to our Polish facility and to original design manufacturers, and the sale of our customer contact center in thePhilippines.
Patents, Trademarks, and Licenses
As of January 30, 2009, we held a worldwide portfolio of 2,253 patents and had an additional 2,514 patent applications pending. We alsohold licenses to use numerous third-party patents. To replace expiring patents, we obtain new patents through our ongoing research and
5

development activities. The inventions claimed in our patents and patent applications cover aspects of our current and possible futurecomputer system products, manufacturing processes, and related technologies. Our product, business method, and manufacturingprocess patents may establish barriers to entry in many product lines. While we use our patented inventions and also license them toothers, we are not substantially dependent on any single patent or group of related patents. We have entered into a variety of intellectualproperty licensing and cross-licensing agreements. We have also entered into various software licensing agreements with othercompanies. We anticipate that our worldwide patent portfolio will be of value in negotiating intellectual property rights with others in theindustry.
We have obtained U.S. federal trademark registration for the DELL word mark and the Dell logo mark. We own registrations for 71 of ourother marks in the U.S. At January 30, 2009, we had pending applications for registration of 45 other trademarks. We believe thatestablishment of the DELL word mark and logo mark in the U.S. is material to our operations. We have also applied for or obtainedregistration of the DELL mark and several other marks in approximately 184 other countries.
From time to time, other companies and individuals assert exclusive patent, copyright, trademark, or other intellectual property rights totechnologies or marks that are important to the technology industry or our business. We evaluate each claim relating to our products and,if appropriate, seek a license to use the protected technology. The licensing agreements generally do not require the licensor to assist us induplicating its patented technology, nor do these agreements protect us from trade secret, copyright, or other violations by us or oursuppliers in developing or selling these products.
Employees
At the end of Fiscal 2009, we had approximately 78,900 total employees (consisting of 76,500 regular employees and 2,400 temporaryemployees), compared to approximately 88,200 total employees (consisting of 82,700 regular employees and 5,500 temporaryemployees) at the end of Fiscal 2008. Approximately 25,900 of the regular employees at the end of Fiscal 2009 were located inthe U.S., and approximately 50,600 regular employees were located in other countries.
We continue to comprehensively review costs across all processes and organizations, from product development and procurementthrough service and support delivery, with a goal to reduce costs, simplify structure, eliminate redundancies, and better align cost ofgoods sold and operating expenses with the current business environment and strategic growth opportunities. As part of this overall effort,we expect to further reduce our overall headcount; however, we may add headcount in certain strategic growth areas. We also mayrealign, sell, or close additional facilities depending on a number of factors, including end-user demand, capabilities, and our migration toa more variable cost manufacturing model. These actions will result in additional business realignment costs in the future, although noplans were finalized at January 30, 2009.
Government Regulation and Environment
Our business is subject to regulation by various federal and state governmental agencies. Such regulation includes the radio frequencyemission regulatory activities of the U.S. Federal Communications Commission; the anti-trust regulatory activities of the U.S. FederalTrade Commission, the Department of Justice, and the European Union; the consumer protection laws of the Federal Trade Commission;the export regulatory activities of the U.S. Department of Commerce and the U.S. Department of Treasury; the import regulatoryactivities of U.S. Customs and Border Protection; the product safety regulatory activities of the U.S. Consumer Product SafetyCommission; the investor protection and capital markets regulatory activities of the Securities and Exchange Commission; andenvironmental regulation by a variety of regulatory authorities in each of the areas in which we conduct business. We are also subject toregulation in other countries where we conduct business. We were not assessed any environmental fines, nor did we have any materialenvironmental remediation or other environmental costs, during Fiscal 2009.
Sustainability
Our focus on business efficiencies and customer satisfaction drives our environmental stewardship program in all areas of our business —reducing product energy consumption, reducing or eliminating materials for disposal, prolonging product life spans, and providingeffective and convenient equipment recovery solutions. We are committed to becoming the “greenest technology company on theplanet” — a long-term initiative we announced in June 2007. This multi-faceted campaign focuses on driving internal businessinnovations and efficiencies; enhancing customer satisfaction; and partnering with suppliers, stakeholders, and people who care about theenvironment.
6
In Fiscal 2008, we announced our commitment to becoming carbon neutral in our operations. We were the first company in our industryto offer a free worldwide recycling program for our consumers. We also provided no-charge recycling of any brand of used computer orprinter with the purchase of a new Dell computer or printer. We have streamlined our transportation network to reduce transit times,minimize air freight, and reduce emissions. When developing and designing products, we select materials guided by a precautionaryapproach. This means eliminating environmentally sensitive substances (where reasonable alternatives exist) from our products andworking towards developing reliable, environmentally sound, and commercially scalable solutions. We also created a series of tools thathelp customers assess their current operations and uncover ways to achieve their own environmental goals.
Backlog
We believe that backlog is not a meaningful indicator of net revenue that can be expected for any period. There can be no assurance thatthe backlog at any point in time will translate into net revenue in any subsequent period, as unfilled orders can generally be canceled atany time by the customer. Our business model generally gives us flexibility to manage backlog at any point in time by expediting shippingor prioritizing customer orders toward products that have shorter lead times, thereby reducing backlog and increasing current periodrevenue. Even though backlog at the end of Fiscal 2009 was higher than at the end of Fiscal 2008 and Fiscal 2007, it was not material.
Operating Business Segments
We conduct operations worldwide. Effective the first quarter of Fiscal 2009, we combined our consumer businesses of EMEA, APJ, andAmericas International (formerly reported through Americas Commercial) with our U.S. Consumer business and re-aligned ourmanagement and financial reporting structure. As a result, effective May 2, 2008, our operating segments consisted of the following foursegments: Americas Commercial, EMEA Commercial, APJ Commercial, and Global Consumer. Our commercial business includes salesto large corporate, government, healthcare, education, small and medium business customers, and value-added resellers and is managedthrough the Americas Commercial, EMEA Commercial, and APJ Commercial segments. The Americas Commercial segment, which isbased in Round Rock, Texas, encompasses the U.S., Canada, and Latin America. The EMEA Commercial segment, based in Bracknell,England, covers Europe, the Middle East, and Africa; and the APJ Commercial segment, based in Singapore, encompasses the Asiancountries of the Pacific Rim as well as Australia, New Zealand, and India. The Global Consumer segment, which is based in Round Rock,Texas, includes global sales and product development for individual consumers and retailers around the world. We revised previouslyreported operating segment information to conform to our new operating segments in effect during the first quarter of Fiscal 2009.
On December 31, 2008, we announced our intent during Fiscal 2010 to move from geographic commercial segments to global businessunits reflecting the impact of globalization on our customer base. Customer requirements now share more commonality based on theirsector rather than physical location. We expect to combine our current Americas Commercial, EMEA Commercial, and APJ Commercialsegments and realign our management structure. After this realignment, our operating structure will consist of the following segments:Global Large Enterprise, Global Public, Global Small and Medium Business (“SMB”), and our existing Global Consumer segment. Webelieve that these four distinct, global business organizations can capitalize on our competitive advantages and strengthen execution. Wewill begin reporting these four global businesses once we complete the realignment of our management and financial reporting structure,which is expected to be in the first half of Fiscal 2010.
We have invested in high growth countries such as Brazil, Russia, India, and China (“BRIC”) to design and manufacture products andsupport our customers, and we expect to continue our global expansion in the years ahead. Our continued expansion outside of theU.S. creates additional complexity in coordinating the design, development, procurement, manufacturing, distribution, and support ofour increasingly complex product and service offerings. As a result, we plan to continue to add additional resources to our offices inSingapore to better coordinate certain global activities, including the management of our original design manufacturers and utilization ofnon-U.S. Dell and supplier production capacity where most needed in light of product demand levels that vary by region. The expandedglobal operations in Singapore also coordinate product design and development efforts with procurement activities and sources of supply.We intend to continue to expand our global capabilities as our international business continues to grow. For financial information aboutthe results of our reportable operating segments for each of the last three fiscal years, see “Part II — Item 7 — Management’s Discussionand Analysis of Financial Condition and Results of Operations — Revenues by Segment” and Note 11 of Notes to ConsolidatedFinancial Statements included in “Part II — Item 8 — Financial Statements and Supplementary Data.” For information aboutpercentages of revenue outside the U.S. for each of the last three fiscal years, see “Part II — Item 7 — Management’s Discussionand Analysis of Financial Condition and Results of Operations.”
Our corporate headquarters are located in Round Rock, Texas. Our manufacturing and distribution facilities are located in Austin, Texas;Winston-Salem, North Carolina; Lebanon and Nashville, Tennessee; Miami, Florida; Limerick and Athlone, Ireland; Penang, Malaysia;Xiamen, China; Hortolândia, Brazil; Chennai, India; and Lodz, Poland. For additional information, see “Part I — Item 2 — Properties.”
7

Trademarks and Service Marks
Unless otherwise noted, trademarks appearing in this report are trademarks owned by us. We disclaim proprietary interest in the marksand names of others. EMC is a registered trademark of EMC Corporation.
Available Information
We maintain an Internet website at www.dell.com. All of our reports filed with the Securities and Exchange Commission (“SEC”)(including annual reports on Form 10-K, quarterly reports on Form 10-Q, current reports on Form 8-K, and Section 16 filings) areaccessible through the Investor Relations section of our website at www.dell.com/investor, free of charge, as soon as reasonablypracticable after electronic filing. The public may read and copy any materials that we file with the SEC at the SEC’s Public ReferenceRoom at 100 F Street, NE, Room 1580, Washington, DC 20549. You may obtain information on the operation of the Public ReferenceRoom by calling the SEC at 1-800-SEC-0330. The SEC maintains an Internet site that contains reports, proxy and informationstatements, and other information regarding issuers that file electronically with the SEC at www.sec.gov. Information on our website isnot incorporated by reference into this report.
Executive Officers of Dell
The following table sets forth the name, age, and position of each of the persons who were serving as our executive officers as of March 5,2009:
Name Age Title
Michael S. Dell . . . . . . . . . . . . . . . . . . . . . . . . . 44 Chairman of the Board and Chief Executive Officer
Bradley R. Anderson . . . . . . . . . . . . . . . . . . . . . 49 Senior Vice President, Enterprise Product Group
Paul D. Bell . . . . . . . . . . . . . . . . . . . . . . . . . . . 48 President, Global Public
Jeffrey W. Clarke . . . . . . . . . . . . . . . . . . . . . . . 46 Vice Chairman, Operations and Technology
Andrew C. Esparza . . . . . . . . . . . . . . . . . . . . . . 50 Senior Vice President, Human Resources
Stephen J. Felice . . . . . . . . . . . . . . . . . . . . . . . . 51 President, Global Small and Medium Business
Ronald G. Garriques . . . . . . . . . . . . . . . . . . . . . 45 President, Global Consumer
Brian T. Gladden . . . . . . . . . . . . . . . . . . . . . . . 44 Senior Vice President and Chief Financial Officer
Erin Nelson . . . . . . . . . . . . . . . . . . . . . . . . . . . 39 Vice President, Chief Marketing Officer
Stephen F. Schuckenbrock . . . . . . . . . . . . . . . . . 48 President, Global Large Enterprise
Lawrence P. Tu . . . . . . . . . . . . . . . . . . . . . . . . . 54 Senior Vice President, General Counsel and Secretary
Set forth below is biographical information about each of our executive officers.
• Michael S. Dell — Mr. Dell currently serves as Chairman of the Board of Directors and Chief Executive Officer. He has held the title ofChairman of the Board since he founded the Company in 1984. Mr. Dell served as Chief Executive Officer of Dell from 1984 until July2004 and resumed that role in January 2007. He serves on the Foundation Board of the World Economic Forum, serves on the executivecommittee of the International Business Council, and is a member of the U.S. Business Council. He also sits on the governing board ofthe Indian School of Business in Hyderabad, India.
• Bradley R. Anderson — Mr. Anderson joined us in July 2005 and has served as Senior Vice President, Enterprise Product Group sinceJanuary 2009. In this role, he is responsible for worldwide engineering, design, development and marketing of Dell’s enterpriseproducts including servers, networking and storage systems. From July 2005 until January 2009, Mr. Anderson served as Senior VicePresident, Business Product Group. Prior to joining Dell, Mr. Anderson was Senior Vice President and General Manager of the IndustryStandard Servers business at Hewlett-Packard Company (“HP”), where he was responsible for HP’s server solutions. Previously, hewas Vice President of Server, Storage, and Infrastructure for HP, where he led the team responsible for server, storage, peripheral, andinfrastructure products. Before joining HP in 1996, Mr. Anderson held top management positions at Cray Research in executive staff,field marketing, sales, finance, and corporate marketing. Mr. Anderson earned a Bachelor of Science in Petroleum Engineering fromTexas A&M University and a Master of Business Administration from Harvard University. He serves on the Texas A&M Look Collegeof Engineering Advisory Council.
• Paul D. Bell — Mr. Bell has been with us since 1996 and currently serves as President, Global Public. In this role he is responsible forleading the teams that help governments, education, healthcare and other public organizations make full use of Information
8

Technology. From March 2007 until January 2009, Mr. Bell served as Senior Vice President and President, Americas. In this role,Mr. Bell is responsible for all sales and customer support operations across the Americas region other than our consumer business.From February 2000 until March 2007, Mr. Bell served as Senior Vice President and President, Europe, Middle East, and Africa. Priorto this, Mr. Bell served as Senior Vice President, Home and Small Business. Prior to joining Dell in July 1996, Mr. Bell was amanagement consultant with Bain & Company for six years, including two years as a consultant on our account. Mr. Bell receivedBachelor’s degrees in Fine Arts and Business Administration from Pennsylvania State University and a Master of BusinessAdministration degree from the Yale School of Organization and Management.
• Jeffrey W. Clarke — Mr. Clarke currently serves as Vice Chairman, Operations and Technology. In this role he is responsible forworldwide engineering, design and development of Dell’s business client products, including Dell OptiPlex Desktops, LatitudeNotebooks and Precision Workstations, and production of all company products worldwide. From January 2003 until January 2009,Mr. Clarke served as Senior Vice President, Business Product Group. Mr. Clarke joined Dell in 1987 as a quality engineer and hasserved in a variety of engineering and management roles. In 1995 Mr. Clarke became the director of desktop development, and fromNovember 2001 to January 2003 he served as Vice President and General Manager, Relationship Product Group. Mr. Clarke received aBachelor’s degree in Electrical Engineering from the University of Texas at San Antonio.
• Andrew C. Esparza — Mr. Esparza joined us in 1997 as a director of Human Resources in the Product Group. He was named SeniorVice President, Human Resources in March 2007 and was named an executive officer in September 2007. In this role, he is responsiblefor driving the strategy and supporting initiatives to attract, motivate, develop, and retain world-class talent in support of our businessgoals and objectives. He also has responsibility for corporate security and corporate responsibility on a worldwide basis. He currently isan executive sponsor for aDellante, our internal networking group responsible for the development of Hispanic employees within thecompany. Prior to joining Dell, he held human resource positions with NCR Corporation from 1985 until 1997 and Bechtel PowerCorporation from 1981 until 1985. Mr. Esparza earned a Bachelor’s degree in Business Administration with a concentration in HumanResource Management from San Diego State University.
• Stephen J. Felice — Mr. Felice currently serves as President, Global Small and Medium Business. Mr. Felice leads the Dellorganization that creates and delivers specific solutions and technology to more than 72 million small and medium-sized businessesglobally. From March 2007 until January 2009, Mr. Felice served as Senior Vice President and President, Asia Pacific-Japan, afterhaving served as Vice President, Asia Pacific-Japan since August 2005. Mr. Felice was responsible for our operations throughout theAPJ region, including sales and customer service centers in Penang, Malaysia, and Xiamen, China. Mr. Felice joined us in February1999 and has held various executive roles in our sales and consulting services organizations. From February 2002 until July 2005,Mr. Felice was Vice President, Corporate Business Group, Dell Americas. Prior to joining Dell, Mr. Felice served as Chief ExecutiveOfficer and President of DecisionOne Corp. Mr. Felice also served as Vice President, Planning and Development, with Bell AtlanticCustomer Services, and he spent five years with Shell Oil in Houston. Mr. Felice holds a Bachelor’s degree in Business Administrationfrom the University of Iowa and a Master of Business Administration degree from the University of Houston.
• Ronald G. Garriques — Mr. Garriques joined us in February 2007 as President, Global Consumer Group. In this role he is responsiblefor Dell’s portfolio of consumer products, including desktops, notebooks, software and peripherals as well as product design and sales.Before joining Dell, Mr. Garriques served in various leadership roles at Motorola from February 2001 to February 2007, where he wasmost recently Executive Vice President and President, responsible for the Mobile Devices division. He was also Senior Vice Presidentand General Manager of the Europe, Middle East, and Africa region for the Personal Communications Services division, and SeniorVice President and General Manager of Worldwide Products Line Management for the Personal Communications Services division.Prior to joining Motorola, Mr. Garriques held management positions at AT&T Network Systems, Lucent Technologies, and PhilipsConsumer Communications. Mr. Garriques holds a Master’s degree in Business Administration from The Wharton School at theUniversity of Pennsylvania, a master’s degree in Mechanical Engineering from Stanford University, and a Bachelor’s degree inMechanical Engineering from Boston University.
• Brian T. Gladden — Mr. Gladden serves as Senior Vice President and Chief Financial Officer (“CFO”). In this role, he is responsiblefor all aspects of Dell’s finance function including accounting, financial planning and analysis, tax, treasury, audit, informationtechnology, and investor relations, and is also responsible for our global information systems and technology structure. Prior to joiningDell in June 2008, Mr. Gladden was President and CEO of SABIC Innovative Plastics Holding BV. Prior to joining SABIC InnovativePlastics, Mr. Gladden spent nearly 20 years with General Electric (“GE”) in a variety of financial and management leadership roles.During his career with the company, he served as Vice President and General Manager of GE Plastics’ resin business, CFO of GEPlastics and Vice President and CFO of GE Medical Systems Healthcare IT business. He was named a GE corporate officer in 2002 and
9
had formerly served on GE’s corporate audit staff for five years. Mr. Gladden earned a Bachelor of Science degree in BusinessAdministration and Finance from Millersville University in Millersville, PA.
• Erin Nelson — Ms. Nelson currently serves as Vice President and Chief Marketing Officer (“CMO”). In this role she is responsible forcustomer relationship management, communications, brand strategy, core research and analytics, and overall marketing agencymanagement. Before becoming CMO in January 2009, Ms. Nelson spent three years in Europe, most recently as Vice President ofMarketing for Dell’s business in Europe, the Middle East and Africa. Since joining Dell in 1999, she has held progressive leadershippositions in U.S. consumer marketing, U.S. public sales, EMEA home and small-business marketing, as well as eBusiness. Prior tojoining Dell, Ms. Nelson held positions in brand management at Procter & Gamble, corporate strategy at PepsiCo, and as amanagement consultant with A.T. Kearney. Ms. Nelson earned a Bachelor’s degree in Business Administration with a concentration inInternational Business and Marketing from the University of Texas at Austin.
• Stephen F. Schuckenbrock — Mr. Schuckenbrock currently serves as President, Global Large Enterprise, leading the delivery ofinnovative and globally consistent Dell solutions and services to the world’s largest corporate IT users. Mr. Schuckenbrock joined us inJanuary 2007 as Senior Vice President and President, Global Services. In September 2007, he assumed the additional role of ChiefInformation Officer, and served in those roles until January 2009. In those roles, he was responsible for all aspects of our servicesbusiness, with worldwide responsibility for Dell enterprise service offerings, and was also responsible for our global informationsystems and technology structure. Prior to joining us, Mr. Schuckenbrock served as Co-Chief Operating Officer and Executive VicePresident of Global Sales and Services for Electronic Data Systems Corporation (“EDS”). Before joining EDS in 2003, he was ChiefOperating Officer of The Feld Group, an information technology consulting organization. Mr. Schuckenbrock served as Global ChiefInformation Officer for PepsiCo from 1998 to 2000. Mr. Schuckenbrock earned a Bachelor’s degree in Business Administration fromElon University.
• Lawrence P. Tu — Mr. Tu joined us as Senior Vice President, General Counsel and Secretary in July 2004, and is responsible foroverseeing Dell’s global legal department, governmental affairs and ethics department. Before joining Dell, Mr. Tu served as ExecutiveVice President and General Counsel at NBC Universal for three years. Prior to his position at NBC, he was a partner with the law firm ofO’Melveny & Myers LLP, where he focused on energy, technology, internet, and media related transactions. He also served five yearsas managing partner of the firm’s Hong Kong office. Mr. Tu’s prior experience also includes serving as General Counsel Asia-Pacificfor Goldman Sachs, attorney for the U.S. State Department, and law clerk for U.S. Supreme Court Justice Thurgood Marshall. Mr. Tuholds Juris Doctor and Bachelor of Arts degrees from Harvard University, as well as a Master’s degree from Oxford University, wherehe was a Rhodes Scholar.
ITEM 1A — RISK FACTORS
There are many risk factors that affect our business and results of operations, some of which are beyond our control. The following is adescription of some of the important risk factors that may cause our actual results in future periods to differ substantially from those wecurrently expect or desire.
• Weakening global economic conditions and instability in financial markets could harm our business and result in reduced net revenueand profitability. We are a global company with customers in virtually every business and industry. There has been an erosion ofglobal consumer confidence amidst concerns over declining asset values, fluctuating energy costs, geopolitical issues, the availabilityand cost of credit, rising unemployment, and the stability and solvency of financial institutions, financial markets, businesses, andsovereign nations. These concerns have slowed global economic growth and have resulted in recessions in many countries, includingthe U.S. While these global economic issues persist, there are likely to be a number of follow-on effects on our business, includingcustomers or potential customers reducing or delaying their technology investments, insolvency of key suppliers resulting in productdelays, counterparty failures negatively impacting our treasury operations, the inability of customers to obtain credit to financepurchases of our products, and customer insolvencies, all of which could reduce demand for our product and services, impact ourability to effectively manage inventory levels and collect customer receivables, lengthen our cash conversion cycle and negativelyimpact liquidity, and ultimately decrease our net revenue and profitability.
• Weakening economic conditions and instability in financial markets could harm our financial services activities. Our financialservices activities are negatively affected in four major ways by the current economic environment — spending softness, increasingloan delinquencies and defaults, increasing funding costs, and reduced availability of funding through securitizations. Decreasedcustomer spending directly reduces the potential sales revenue that we can seek to finance. Loan delinquencies and defaults impact ournet credit losses and have been increasing for more than a year. If this trend continues, we may need to increase our reserves in ourcustomer receivables in the future. The debt and securitization markets have been experiencing and may continue to experience
10

extreme volatility and disruption, resulting in higher credit spreads in the capital markets and higher funding costs for us, as well asreduced availability of funding from securitizing our financing receivables.
We have continued to utilize securitizations to fund our financing activities. During Fiscal 2009 and Fiscal 2008, Dell transferred$1.4 billion and $1.2 billion, respectively, of fixed-term leases and loans and revolving loans to unconsolidated qualified specialpurpose entities to facilitate the funding of financing receivables in the capital markets. Deterioration in our business performance, acredit rating downgrade, continued volatility in the securitization markets, or adverse changes in the economy could lead to reductionsin debt availability for the qualified special purpose entities and could limit our ability to continue asset securitizations or otherfinancing from debt or capital sources, reduce the amount of financing receivables that we originate, or could adversely affect the costsor terms on which we may be able to obtain capital, which could unfavorably affect our profitability or cash flows.
• We face strong competition, which may adversely affect our market share, revenue, and profitability. We operate in an industry inwhich there are rapid technological advances in hardware, software and service offerings, and face aggressive product and pricecompetition from both branded and generic competitors. We compete based on our ability to profitably offer competitive solutions withthe most current and desired product features, as well as on customer service, quality and reliability. We expect that competition willcontinue to be intense and that our competitors’ products may be less costly, provide better performance or include additional features.Our efforts to balance our mix of products and services to optimize profitability, liquidity, and growth may also put pressure on ourindustry unit share position in the short-term. As we continue to expand globally, we may see new and increased competition indifferent geographic regions. In addition, barriers to entry in our businesses generally are low and products can be distributed broadlyand quickly at relatively low cost.
If our increasing reliance on third-party original equipment manufacturers, original design manufacturing partnerships, and man-ufacturing outsourcing relationships fails to generate cost efficiencies, our profitability could be adversely impacted. Our profitabilityis also affected by our ability to negotiate favorable pricing with our vendors, including vendor rebates, marketing funds, and othervendor funding. Because these supplier negotiations are continuous and reflect the ongoing competitive environment, the variability intiming and amount of incremental vendor discounts and rebates can affect our profitability. Our inability to establish a cost and productadvantage, or determine alternative means to deliver value to our customers, may adversely affect our market share, revenue, andprofitability.
• Our ability to generate substantial non-U.S. net revenue faces many additional risks and uncertainties. Sales outside theU.S. accounted for approximately 48% of our consolidated net revenue in Fiscal 2009. Our future growth rates and success aredependent on continued growth outside the U.S., including the key developing countries of Brazil, Russia, India, and China. Ourinternational operations face many risks and uncertainties, including varied local economic and labor conditions, political instability,and changes in the regulatory environment, trade protection measures, tax laws (including U.S. taxes on foreign operations), copyrightlevies, and foreign currency exchange rates. Any of these factors could adversely affect our operations and profitability.
• Our profitability may be affected by our product, customer, and geographic sales mix and by seasonal sales trends. Our profitmargins vary among products, customers, and geographies. In addition, our business is subject to certain seasonal sales trends. Forexample, sales to government customers (particularly the U.S. federal government) are typically stronger in our third fiscal quarter,sales in EMEA are often weaker in our third fiscal quarter, and consumer sales are typically strongest during our fourth fiscal quarter.As a result of these factors, our overall profitability for any particular period will be affected by the mix of products, customers, andgeographies reflected in our sales for that period, as well as by seasonal trends.
• Infrastructure failures and breaches in data security could harm our business. We depend on our information technology andmanufacturing infrastructure to achieve our business objectives. If a problem, such as a computer virus, intentional disruption by a thirdparty, natural disaster, manufacturing failure, telecommunications system failure, or lost connectivity impairs our infrastructure, wemay be unable to book or process orders, manufacture, ship in a timely manner, or otherwise carry on our business. An infrastructuredisruption could damage our reputation and cause us to lose customers and revenue, result in the unintentional disclosure of companyor customer information, and require us to incur significant expense to eliminate these problems and address related data securityconcerns. The harm to our business could be even greater if it occurs during a period of disproportionately heavy demand.
• Our inability to effectively manage product and services transitions could reduce the demand for our products and the profitability ofour operations. Continuing improvements in technology mean frequent new product introductions, short product life cycles, andimprovement in product performance characteristics. In addition, we are increasingly sourcing new products and transitioning existingproducts through our original design manufacturing partnerships and manufacturing outsourcing relationships in order to generate costefficiencies, deliver products faster and better serve our customers in certain segments and geographical areas. These product
11

transitions present execution challenges and risks. If we are unable to effectively manage a new product transition, our business andresults of operations could be unfavorably affected.
• Our growth strategy depends on our ability to successfully transform our sales capability and to add to the scope of our product andservices offerings. Our growth strategy involves reaching more customers worldwide through new distribution channels, such asconsumer retail, expanding our relationships with value-added resellers, and augmenting select areas of our business through targetedacquisitions. Our goal continues to be to optimize the balance of liquidity, profitability, and growth with a focus on moving the weightof the product portfolio to higher margin products and recurring revenue streams. Our ability to grow sales of these higher marginproducts, services and solutions depends on our ability to successfully transition our sales capabilities and add to the breadth of ourhigher margin offerings through selective acquisitions. If we are unable to effectively transition our sales capabilities and grow ourproduct and services offerings, our business and results of operations could be unfavorably affected.
• Disruptions in component or product availability could unfavorably affect our performance. Our manufacturing and supply chainefficiencies give us the ability to operate with reduced levels of component and finished goods inventories. Our financial success ispartly due to our supply chain management practices, including our ability to achieve rapid inventory turns. Because we maintainminimal levels of component and product inventories, a disruption in component or product availability could harm our financialperformance and our ability to satisfy customer needs.
• Our reliance on vendors for products and components creates risks and uncertainties. We require a high volume of quality productsand components from third party vendors. In addition, we are continuing to expand our use of original design manufacturingpartnerships and manufacturing outsourcing relationships in order to generate cost efficiencies, deliver products faster and better serveour customers in certain segments and geographical areas. Our increasing reliance on these vendors subjects us to a greater risk ofshortages, and reduced control over delivery schedules of components and products (which can harm efficiencies), as well as a greaterrisk of increases in product and component costs (which can harm our profitability). In addition, defective parts and products fromthese vendors could reduce product reliability and harm our reputation.
• We could experience manufacturing interruptions, delays, or inefficiencies if we are unable to timely and reliably procure componentsand products from single-source or limited-source suppliers. We maintain several single-source or limited-source supplier rela-tionships, either because multiple sources are not available or the relationship is advantageous due to performance, quality, support,delivery, capacity, or price considerations. If the supply of a critical single- or limited-source product or component is delayed orcurtailed, we may not be able to ship the related product in desired quantities and in a timely manner. Even where multiple sources ofsupply are available, qualification of the alternative suppliers and establishment of reliable supplies could result in delays and apossible loss of sales, which could harm operating results.
• Our business is increasingly dependent on our ability to access the capital markets. We are increasingly dependent on access to debtand capital sources to provide financing for our customers and to obtain funds in the U.S. for general corporate purposes, includingshare repurchases, funding customer receivables, and acquisitions. Additionally, we have customer financing relationships withcompanies whose business models rely on accessing the capital markets. The inability of these companies to access such markets couldforce us to self-fund transactions or forgo customer financing opportunities, potentially harming our financial performance. The debtand capital markets have been experiencing and may continue to experience extreme volatility and disruption. These issues, along withsignificant write-offs in the financial services sector, the re-pricing of credit risk, and the current weak economic conditions have made,and will likely continue to make, it difficult to obtain funding. The cost of accessing debt and capital markets has increased as manylenders and institutional investors require higher rates of return. Lenders have also tightened lending standards, and reduced or ceasedtheir lending to certain borrowers. We believe that we will be able to obtain appropriate financing from third parties even in light of thecurrent market conditions; nevertheless, changes in our credit ratings, deterioration in our business performance, or adverse changes inthe economy could limit our ability to obtain financing from debt or capital sources or could adversely affect the terms on which wemay be able to obtain capital, which could unfavorably affect our net revenue and profitability. See “Part II — Item 7 —Management’s Discussion and Analysis of Financial Condition and Results of Operations — Liquidity and Capital Commit-ments — Liquidity.”
• We face risks relating to our internal controls. If management is not successful in maintaining a strong internal control environment,material weaknesses could reoccur, causing investors to lose confidence in our reported financial information. This could lead to adecline in our stock price, limit our ability to access the capital markets in the future, and require us to incur additional costs to improveour internal control systems and procedures.
12

• Unfavorable results of legal proceedings could harm our business and result in substantial costs. We are involved in various claims,suits, investigations, and legal proceedings that arise from time to time in the ordinary course of our business and that are not yetresolved, including those that are set forth under Note 10 of Notes to Consolidated Financial Statements included in “Part II —Item 8 — Financial Statements and Supplementary Data.” Additional legal claims or regulatory matters may arise in the future andcould involve stockholder, consumer, antitrust, tax and other issues on a global basis. Litigation is inherently unpredictable. Regardlessof the merit of the claims, litigation may be both time-consuming and disruptive to our business. Therefore, we could incur judgmentsor enter into settlements of claims that could adversely affect our operating results or cash flows in a particular period. For example, wecould be exposed to enforcement or other actions with respect to the continuing SEC investigation into certain accounting and financialreporting matters. In addition, if any infringement or other intellectual property claim made against us by any third party is successful,or if we fail to develop non-infringing technology or license the proprietary rights on commercially reasonable terms and conditions,our business, operating results, and financial condition could be materially and adversely affected.
• The acquisition of other companies may present new risks. We acquire companies as a part of our overall growth strategy. Theseacquisitions may involve significant new risks and uncertainties, including distraction of management attention away from our currentbusiness operations, insufficient new revenue to offset expenses, inadequate return of capital, integration challenges, new regulatoryrequirements, and issues not discovered in our due diligence process. No assurance can be given that such acquisitions will besuccessful and will not adversely affect our profitability or operations.
• Failure to properly manage the distribution of our products and services may result in reduced revenue and profitability. We use avariety of distribution methods to sell our products and services, including directly to customers and through select retailers and third-party value-added resellers. As we reach more customers worldwide through an increasing number of new distribution channels, suchas consumer retail, and continue to expand our relationships with value-added resellers, inventory management becomes morechallenging and successful demand forecasting becomes more difficult. Our inability to properly manage and balance inventory levelsand potential conflicts among these various distribution methods could harm our operating results.
• If our cost cutting measures are not successful, we may become less competitive. A variety of factors could prevent us from achievingour goal of better aligning our product and service offerings and cost structure with customer needs in the current business environmentthrough reducing our operating expenses; reducing total costs in procurement, product design, and transformation; simplifying ourstructure; and eliminating redundancies. For example, we may experience delays in the anticipated timing of activities related to ourcost savings plans and higher than expected or unanticipated costs to implement them. As a result, we may not achieve our expectedcost savings in the time anticipated, or at all. In such case, our results of operations and profitability may be negatively impaired,making us less competitive and potentially causing us to lose market share.
• Failure to effectively hedge our exposure to fluctuations in foreign currency exchange rates and interest rates could unfavorably affectour performance. We utilize derivative instruments to hedge our exposure to fluctuations in foreign currency exchange rates andinterest rates. Some of these instruments and contracts may involve elements of market and credit risk in excess of the amountsrecognized in our financial statements.
• We are subject to counterparty default risks. We enter into numerous financing arrangements, including foreign currency optioncontracts and forward contracts, with a wide array of bank counterparties. As a result, we are subject to the risk that the counterparty toone or more of these contracts defaults, either voluntarily or involuntarily, on its performance under the contract. In times of marketdistress, a counterparty may default rapidly and without notice to us, and we may be unable to take action to cover our exposure, eitherbecause we lack the contractual ability or because market conditions make it difficult to take effective action. In the event of acounterparty default, we could incur significant losses, which could harm our business, results of operations, and financial condition. Inthe event that one of our counterparties becomes insolvent or files for bankruptcy, our ability to eventually recover any losses sufferedas a result of that counterparty’s default may be limited by the liquidity of the counterparty or the applicable legal regime governing thebankruptcy proceeding. In addition, our deposits at financial institutions are at risk. As of January 30, 2009, approximately 25% of ourcash and cash equivalents were deposited with two large financial institutions rated AA and A. If an institution which is holding ourdeposits fails, we could lose all uninsured funds in those accounts.
• Our continued business success may depend on obtaining licenses to intellectual property developed by others on commerciallyreasonable and competitive terms. If we or our suppliers are unable to obtain desirable technology licenses, we may be preventedfrom marketing products; could be forced to market products without desirable features; or could incur substantial costs to redesignproducts, defend legal actions, or pay damages. While our suppliers may be contractually obligated to obtain such licenses andindemnify us against such expenses, those suppliers could be unable to meet their obligations. In addition, our operating costs couldincrease because of copyright levies or similar fees by rights holders and collection agencies in European and other countries. For a
13

description of potential claims related to copyright levies, see Note 10 of Notes to Consolidated Financial Statements included in“Part II — Item 8 — Financial Statements and Supplementary Data — Legal Matters — Copyright Levies.”
• Our success depends on our ability to attract, retain, and motivate our key employees. We rely on key personnel to supportanticipated continued rapid international growth and increasingly complex product and service offerings. There can be no assurancethat we will be able to attract, retain, and motivate the key professional, technical, marketing, and staff resources we need.
• Loss of government contracts could harm our business. Government contracts are subject to future funding that may affect theextension or termination of programs and are subject to the right of the government to terminate for convenience or non-appropriation.In addition, if we violate legal or regulatory requirements, the government could suspend or disbar us as a contractor, which wouldunfavorably affect our net revenue and profitability.
• The expiration of tax holidays or favorable tax rate structures, or unfavorable outcomes in tax compliance and regulatory matters,could result in an increase of our effective tax rate in the future. Portions of our operations are subject to a reduced tax rate or are freeof tax under various tax holidays that expire in whole or in part during Fiscal 2010 through Fiscal 2018. Many of these holidays may beextended when certain conditions are met, or terminated if certain conditions are not met. If they are not extended, or if we fail to satisfythe conditions of the reduced tax rate, then our effective tax rate would increase in the future. Our effective tax rate could also increaseif our geographic sales mix changes. We are under audit in various tax jurisdictions. An unfavorable outcome in certain of these matterscould result in a substantial increase to our tax expense. In addition, changes in tax laws (including U.S. taxes on foreign operations)could adversely affect our operations and profitability.
• Current environmental laws, or laws enacted in the future, may harm our business. Our operations are subject to environmentalregulation in all of the areas in which we conduct business. Our product design and procurement operations must comply with new andfuture requirements relating to the materials composition, energy efficiency and collection, recycling, treatment, and disposal of ourelectronics products, including restrictions on lead, cadmium, and other substances. If we fail to comply with the rules and regulationsregarding the use and sale of such regulated substances, we could be subject to liability. While we do not expect that the impact of theseenvironmental laws and other similar legislation adopted in the U.S. and other countries will have a substantial unfavorable impact onour business, the costs and timing of costs under environmental laws are difficult to predict.
• Armed hostilities, terrorism, natural disasters, or public health issues could harm our business. Armed hostilities, terrorism, naturaldisasters, or public health issues, whether in the U.S. or abroad, could cause damage or disruption to us, our suppliers or customers, orcould create political or economic instability, any of which could harm our business. These events could cause a decrease in demand forour products, could make it difficult or impossible for us to deliver products or for our suppliers to deliver components, and could createdelays and inefficiencies in our supply chain.
ITEM 1B — UNRESOLVED STAFF COMMENTS
Not Applicable.
14

ITEM 2 — PROPERTIES
At January 30, 2009, we owned or leased a total of approximately 16.8 million square feet of office, manufacturing, and warehouse spaceworldwide, approximately 7.4 million square feet of which is located in the U.S. Approximately 1.0 million square feet, primarily in theU.S. and Canada, is vacant or sublet. We believe that our existing properties are suitable and adequate for our current needs and that wecan readily meet our requirements for additional space at competitive rates by extending expiring leases or by finding alternative space.
Our principal executive offices, including global headquarters, are located at One Dell Way, Round Rock, Texas, United States ofAmerica.
Americas Properties
Description Principal Locations Owned (square feet) Leased (square feet)
Headquarters � Round Rock, Texas 2.1 million -
BusinessCenters(a)
� Brazil - El Dorado Do Sul� Oklahoma - Oklahoma City� Panama - Panama City� Tennessee - Nashville� Texas - Austin and Round Rock
1.1 million 1.0 million
Manufacturingand Distribution
� Brazil - Hortolândia� Florida - Miami (Alienware)� North Carolina - Winston-Salem� Tennessee - Lebanon and Nashville� Texas - Austin
2.6 million 100,000
Design Centers � Texas - Austin and Round Rock� New Hampshire - Nashua� California - San Jose
700,000 100,000
EMEA Properties
Description Principal Locations Owned (square feet) Leased (square feet)
BusinessCenters(a)
� England - Bracknell� Germany - Halle� France - Montpellier� Ireland - Dublin and Limerick� Morocco - Casablanca� Slovakia - Bratislava
500,000 1.5 million
Manufacturingand Distribution
� Ireland - Limerick and Athlone (Alienware)� Poland - Lodz 1.0 million -
15

APJ Properties
Description Principal Locations Owned (square feet) Leased (square feet)
BusinessCenters(a)
� China - Dalian and Xiamen� India - Bangalore, Gurgaon, Hyderabad, and
Mohali� Japan - Kawasaki� Malaysia - Penang and Kuala Lumpur� Philippines - Metro Manila
300,000 3.2 million
Manufacturingand Distribution
� China - Xiamen� Malaysia - Penang� India - Chennai
1.1 million -
Design Centers � China - Shanghai� India - Bangalore� Singapore� Taiwan - Taipei
- 500,000
(a) Business center locations include facilities with capacity greater than 1,000 people. Operations within these centers include sales, technical support, administrative, andsupport functions. Locations of smaller business centers are not listed; however, the smaller centers are included in the square footage.
In general, our Americas, EMEA, and APJ regions use properties within their geographies. However, business centers in the Philippinesand India, which house sales, customer care, technical support, and administrative support functions, are used by each of our geographicregions. During Fiscal 2009, we closed a manufacturing plant in Austin, Texas and business centers in Ottawa and Edmonton, Canada,and we sold our call center in El Salvador and our small package hub operations in West Chester, Ohio. At the end of Fiscal 2009, abusiness center in Casablanca, Morocco was under construction. Additionally, we announced the disposition of the sale of our customercontact center in the Philippines in Fiscal 2010.
We plan to migrate all production of computer systems for customers in EMEA from our Limerick, Ireland manufacturing facility to ourfacility in Poland and third-party manufacturing partners over the next year. The manufacturing migration and subsequent closure of ourLimerick facility will be completed in a phased transition during calendar 2009. We may realign, sell, or close additional facilitiesdepending on a number of factors, including end-user demand, capabilities, and our migration to a more variable cost manufacturingmodel. These actions will result in additional business realignment costs in the future, although no plans were finalized at January 30,2009.
ITEM 3 — LEGAL PROCEEDINGS
The information required by this item is set forth under Note 10 of Notes to Consolidated Financial Statements included in “Part II —Item 8 — Financial Statements and Supplementary Data”, and is incorporated herein by reference.
ITEM 4 — SUBMISSION OF MATTERS TO A VOTE OF SECURITY HOLDERS
No matter was submitted to a vote of our stockholders, through the solicitation of proxies or otherwise, during the fourth quarter of Fiscal2009.
16

PART II
ITEM 5 — MARKET FOR REGISTRANT’S COMMON EQUITY, RELATED STOCKHOLDER MATTERS, ANDISSUER PURCHASES OF EQUITY SECURITIES
Market Information
Our common stock is listed on The NASDAQ Stock Market under the symbol DELL. Information regarding the market prices of ourcommon stock may be found in Note 13 of Notes to Consolidated Financial Statements included in “Part II — Item 8 — FinancialStatements and Supplementary Data.”
Holders
At March 13, 2009, there were 29,542 holders of record of Dell common stock.
Dividends
We have never declared or paid any cash dividends on shares of our common stock and currently do not anticipate paying any cashdividends in the immediate future. Any future determination to pay cash dividends will be at the discretion of our Board of Directors.
Redeemable Common Stock
In prior periods, we inadvertently failed to register with the SEC the issuance of some shares under certain employee benefit plans. Theseshares were purchased by participants between March 31, 2006, and April 3, 2007. As a result, certain purchasers of securities pursuant tothose plans may have had the right to rescind their purchases for an amount equal to the purchase price paid for the securities, plus interestfrom the date of purchase. On June 5, 2008, we announced a registered rescission offer to eligible plan participants, which becameeffective as of August 12, 2008 and provided for the repurchase of up to 1,852,486 units in the Dell Inc. Stock Fund through the Dell Inc.401(k) Plan. At February 1, 2008, and February 2, 2007, approximately 4 million shares ($94 million) and 5 million shares ($111 million),respectively, were classified outside of stockholders’ equity because the redemption features were not within our control. Prior to theeffective date of the rescission offer, as participants sold shares in the open market, the shares held outside of stockholder’s equity werereclassified to common stock and capital in excess of $0.01 par value, accordingly. These shares were treated as outstanding for financialreporting purposes. The registered rescission offer expired on September 26, 2008, and payments of $29 million under the offer have beensubstantially completed during Fiscal 2009. Upon expiration of the rescission offer, all remaining redeemable shares were reclassified towithin stockholder’s equity.
17

Purchases of Common Stock
Share Repurchase Program
We have a share repurchase program that authorizes us to purchase shares of common stock in order to increase shareholder value andmanage dilution resulting from shares issued under our equity compensation plans. However, we do not currently have a policy thatrequires the repurchase of common stock in conjunction with share-based payment arrangements. The following table sets forthinformation regarding our repurchases or acquisitions of common stock during the fourth quarter of Fiscal 2009 and the remainingauthorized amount for future purchases:
Period
Total Numberof Shares
Repurchased
AveragePrice Paidper Share
TotalNumber of
SharesRepurchased
as Part ofPublicly
AnnouncedPlans
ApproximateDollar Value
of Shares thatMay Yet BeRepurchased
Under theAnnounced
Plans
(in millions)Repurchases from November 1, 2008
through November 28, 2008 . . . . . . . . . . . . . . . . . . - N/A - $ 4,545
Repurchases from November 29, 2008through December 26, 2008 . . . . . . . . . . . . . . . . . . - N/A - $ 4,545
Repurchases from December 27, 2008through January 30, 2009* . . . . . . . . . . . . . . . . . . . 78,715 $22.23 78,715 $ 4,543
Total . . . . . . . . . . . . . . . . . . . . . . . . . . . . . . . . . . . . . 78,715 $22.23 78,715
* All shares were repurchased as a part of our registered rescission offer described above under Redeemable Common Stock.
18

Stock Performance Graph
The following graph compares the cumulative total return on Dell’s common stock during the last five fiscal years with the S&P 500Index and the Dow Jones Computer Index during the same period. The graph shows the value, at the end of each of the last five fiscalyears, of $100 invested in Dell common stock or the indices on January 31, 2004, and assumes the reinvestment of all dividends. Thegraph depicts the change in the value of common stock relative to the indices at the end of each fiscal year and not for any interim period.Historical stock price performance is not necessarily indicative of future stock price performance.
0
20
40
60
80
100
120
140
160
Dow Jones US Computer HardwareS&P 500Dell Inc.
200920082007200620052004
COMPARISION OF 5 YEAR CUMULATIVE TOTAL RETURN
2004 2005 2006 2007 2008 2009
Dell Inc. . . . . . . . . . . . . . . . . . . . . . . . . . . . . . . . . . . . . . . . . . . . . . . 100.00 122.79 87.50 70.33 60.86 28.41
S&P 500 . . . . . . . . . . . . . . . . . . . . . . . . . . . . . . . . . . . . . . . . . . . . . . . 100.00 106.23 117.26 134.28 131.17 80.50
Dow Jones US Computer Hardware . . . . . . . . . . . . . . . . . . . . . . . . . 100.00 107.65 123.03 140.85 146.69 95.63
19

ITEM 6 — SELECTED FINANCIAL DATA
The following selected financial data should be read in conjunction with “Part II — Item 7 — Management’s Discussion and Analysis ofFinancial Condition and Results of Operations” and “Part II — Item 8 — Financial Statements and Supplementary Data.”
The following balance sheet data as of January 30, 2009, February 1, 2008, February 2, 2007, and February 3, 2006, results of operations,and cash flows for Fiscal 2009, 2008, 2007, 2006, and 2005 are derived from our audited financial statements included in “Part II —Item 8 — Financial Statements and Supplementary Data” and from our previously filed Annual Reports on Form 10-K for Fiscal 2008and Fiscal 2007. The balance sheet data as of January 28, 2005, is derived from our unaudited financial statements for that period.
January 30,2009(a)
February 1,2008(a)
February 2,2007(a)
February 3,2006(b)
January 28,2005(c)
Fiscal Year Ended
(in millions, except per share data)Results of Operations:Net revenue . . . . . . . . . . . . . . . . . . . . . . . $ 61,101 $ 61,133 $ 57,420 $ 55,788 $ 49,121
Gross margin . . . . . . . . . . . . . . . . . . . . . . $ 10,957 $ 11,671 $ 9,516 $ 9,891 $ 9,018
Operating income . . . . . . . . . . . . . . . . . . $ 3,190 $ 3,440 $ 3,070 $ 4,382 $ 4,206
Income before income taxes . . . . . . . . . . . $ 3,324 $ 3,827 $ 3,345 $ 4,608 $ 4,403
Net income . . . . . . . . . . . . . . . . . . . . . . . $ 2,478 $ 2,947 $ 2,583 $ 3,602 $ 3,018
Earnings per common share:
Basic . . . . . . . . . . . . . . . . . . . . . . . . . . $ 1.25 $ 1.33 $ 1.15 $ 1.50 $ 1.20
Diluted . . . . . . . . . . . . . . . . . . . . . . . . $ 1.25 $ 1.31 $ 1.14 $ 1.47 $ 1.18
Number of weighted-average sharesoutstanding:
Basic . . . . . . . . . . . . . . . . . . . . . . . . . . 1,980 2,223 2,255 2,403 2,509
Diluted . . . . . . . . . . . . . . . . . . . . . . . . 1,986 2,247 2,271 2,449 2,568
Cash Flow & Balance Sheet Data:Net cash provided by operating
activities . . . . . . . . . . . . . . . . . . . . . . . $ 1,894 $ 3,949 $ 3,969 $ 4,751 $ 5,821
Cash, cash equivalents and investments. . . $ 9,546 $ 9,532 $ 12,445 $ 11,756 $ 14,101
Total assets . . . . . . . . . . . . . . . . . . . . . . . $ 26,500 $ 27,561 $ 25,635 $ 23,252 $ 23,318
Short-term borrowings . . . . . . . . . . . . . . . $ 113 $ 225 $ 188 $ 65 $ 74Long-term debt . . . . . . . . . . . . . . . . . . . . $ 1,898 $ 362 $ 569 $ 625 $ 662
Total stockholders’ equity . . . . . . . . . . . . $ 4,271 $ 3,735 $ 4,328 $ 4,047 $ 6,412
(a) Results for Fiscal 2009, Fiscal 2008, and Fiscal 2007 include stock-based compensation expense pursuant to Statement of Financial Accounting Standards No. 123(revised 2004), Share-Based Payment (“SFAS 123(R)”). See Note 5 of Notes to Consolidated Financial Statements included in “Part II — Item 8 — FinancialStatements and Supplementary Data.”
(b) Results for Fiscal 2006 include charges aggregating $421 million ($338 million of other product charges and $83 million in selling, general and administrativeexpenses) related to the cost of servicing or replacing certain OptiPlexTM systems that included a vendor part that failed to perform to our specifications, workforcerealignment, product rationalizations, excess facilities, and a write-off of goodwill recognized in the third quarter. The related tax effect of these items was $96 million.Fiscal 2006 also includes an $85 million income tax benefit related to a revised estimate of taxes on the repatriation of earnings under the American Jobs Creation Actof 2004 recognized in the second quarter.
(c) Results for Fiscal 2005 include an income tax charge of $280 million related to the repatriation of earnings under the American Jobs Creation Act of 2004 recorded inthe fourth quarter.
20

ITEM 7 — MANAGEMENT’S DISCUSSION AND ANALYSIS OF FINANCIAL CONDITION AND RESULTS OFOPERATIONS
SPECIAL NOTE: This section, “Management’s Discussion and Analysis of Financial Condition and Results of Operations,”contains forward-looking statements that are based on our current expectations. Actual results in future periods may differ materiallyfrom those expressed or implied by those forward-looking statements because of a number of risks and uncertainties. For a discussionof risk factors affecting our business and prospects, see “Part I — Item 1A — Risk Factors.” This section should be read inconjunction with “Part II — Item 8 — Financial Statements and Supplementary Data.”
All percentage amounts and ratios were calculated using the underlying data in thousands. Unless otherwise noted, all references toindustry share and total industry growth data are for computer systems (including desktops, notebooks, and x86 servers), and arebased on information provided by IDC Worldwide Quarterly PC Tracker, February 17, 2009. Industry share data is for the calendaryear and all our growth rates are on a fiscal year-over-year basis. Unless otherwise noted, all references to time periods refer to ourfiscal periods.
Overview
Our Company
As a leading technology company, we offer a broad range of product categories, including mobility, desktop PCs, software andperipherals, servers and networking, services, and storage. We are the number one supplier of computer systems in the United States, andthe number two supplier worldwide.
We have manufacturing locations around the world and relationships with third-party original equipment manufacturers. This structureallows us to optimize our global supply chain to best serve our global customer base. We continue to expand our supply chain whichallows us to enhance product design and features, shorten product development cycles, improve logistics, and lower costs, thus improvingour competitiveness.
We were founded on the core principle of a direct customer business model, which included build to order hardware for consumer andcommercial customers. The inherent velocity of this model, which included a highly efficient global supply chain, allowed for lowinventory levels and the ability to be among the industry leaders in selling the most relevant technology, at the best value, to ourcustomers. Our direct relationships with customers also allowed us to bring to market products that featured customer driven innovation,thereby allowing us to be on the forefront of changing user requirements and needs. Over time we have expanded our business model toinclude a broader portfolio of products, including services, and we have also added new distribution partners, such as retail, systemintegrators, value added resellers, and distributors, which allow us to reach even more end-users around the world. We also offer variousfinancing alternatives, asset management services, and other customer financial services for business and consumer customers. As a partof our overall growth strategy, we have executed targeted acquisitions to augment select areas of our business with more products,services, and technology.
Our new distribution partnerships include the launch in Fiscal 2008 of our global retail initiative, offering select products in retail stores inthe Americas, Europe, Middle East, and Africa (“EMEA”), and Asia Pacific-Japan (“APJ”) regions. In Fiscal 2008, we also launchedPartnerDirect, a global program that brings our existing value-added reseller programs under one umbrella including training,certification, deal registration, focused sales and customer care, and a dedicated web portal.
We continue to simplify technology, enhance value, and lower costs for our customers while expanding our business opportunities.Underpinning these goals is our commitment to achieving world-class competitiveness, any-to-any supply chain, services and solutions,and sales effectiveness. We are currently focused on five key growth priorities which, when coupled with our core competencies, webelieve will drive an optimal balance of long-term sustained growth, profitability, and liquidity:
– Global Consumer — In the first quarter of Fiscal 2009, we realigned our management and financial reporting structure to focus onworldwide sales to individual consumers and retailers as a part of an internal consolidation of our consumer business. Our globalconsumer business sells to customers through our on-line store at www.dell.com, over the phone, and through our retail channel. Theglobal consolidation of this business has improved our global sales execution and coverage through better customer alignment,targeted sales force investments in rapidly growing countries, and improved marketing tools. We are also designing new, innovativeproducts with faster development cycles and competitive features including the new Studio line of notebooks, which allow consumersgreater personalization and self expression. Finally, we have rapidly expanded our retail business in order to reach more consumers.
21

– Enterprise — In the enterprise, our solution mission is to help companies of all sizes simplify their IT environments. The completesolution includes servers, storage, services, and software. At the core of this simplification is the problem with complexity in ITarchitecture and operations developed over decades and ineffective services models that create unnecessary complexity and cost. Weare focused on helping customers identify and remove this unnecessary cost and complexity. This year we have strengthened ourstorage portfolio with expanded EqualLogic solutions, new PowerVault storage products, and fourth generation Dell C EMC storagesystems. We also invested in power and cooling solutions for our data center platforms, including blade servers, and as a result we havebecome the industry leader in server virtualization, power, and cooling performance.
– Notebooks — Our goal is to reclaim notebook leadership by creating the best products while shortening our development cycle andbeing the most innovative developer of notebooks. To help meet this goal, we have separated our consumer and commercial designfunctions to drive greater focus on our product development process. According to IDC data, the sale of notebook units globallyoutpaced that of desktops for the first time during the third quarter of calendar 2008; this trend is expected to continue into the future. Inthe third quarter of Fiscal 2009, we introduced a new addition to our Dell Inspiron products with our new 3G enabled Inspiron Mini. Inthe fourth quarter of Fiscal 2009, we launched our new Studio XPS 13, Studio XPS 16, and Inspiron 15 notebooks for consumers, andwe introduced our Latitude XT2 convertible tablet for our commercial customers. This year, we also had the largest global productlaunch in our company’s history with our new E-Series commercial Latitude and Dell Precision notebooks. We expect to continue tolaunch a number of new notebook products throughout Fiscal 2010, targeting various price and performance bands.
– Small and Medium Business — We are focused on providing small and medium businesses with the simplest and most complete ITsolution, customized for their needs, by extending our channel direct program (PartnerDirect) and expanding our offerings to mid-sized businesses. We are committed to improving our storage products and services as evidenced by our new building IT-as-a-Servicesolution, which provides businesses with remote and lifecycle management, e-mail backup, and software license management.
– Emerging countries — We are focused on and investing resources in emerging countries with an emphasis on Brazil, Russia, India,and China (“BRIC”), where we expect significant growth to occur over the next several years. We are also creating customizedproducts and services to meet the preferences and demands of individual countries and various regions, including the new Vostro Anotebooks and desktops designed specifically for cost sensitive growing businesses in emerging economies.
We continue to invest in initiatives that will align our new and existing products around customers’ needs in order to drive long-term,sustainable growth, profitability, and cash flow. We also continue to grow our business organically and through acquisitions. DuringFiscal 2009, we acquired three companies, with the largest being MessageOne, Inc. These acquisitions are targeted to further expand ourservice capabilities. We expect to make more acquisitions in the future.
Result of Operations
Consolidated Operations
The following table summarizes our consolidated results of operations for each of the past three fiscal years:
Dollars% of
Revenue % Change Dollars% of
Revenue % Change Dollars% of
Revenue
January 30, 2009 February 1, 2008 February 2, 2007
Fiscal Year Ended
(in millions, except per share amounts and percentages)
Net revenue . . . . . . . . . . . . . . . . . . . . . . . . . . $ 61,101 100.0% (0%) $ 61,133 100.0% 6% $ 57,420 100.0%
Gross margin . . . . . . . . . . . . . . . . . . . . . . . . . $ 10,957 17.9% (6%) $ 11,671 19.1% 23% $ 9,516 16.6%
Operating expenses . . . . . . . . . . . . . . . . . . . . $ 7,767 12.7% (6%) $ 8,231 13.5% 28% $ 6,446 11.2%
Operating income. . . . . . . . . . . . . . . . . . . . . . $ 3,190 5.2% (7%) $ 3,440 5.6% 12% $ 3,070 5.4%
Income tax provision . . . . . . . . . . . . . . . . . . . $ 846 1.4% (4%) $ 880 1.4% 16% $ 762 1.3%
Net income . . . . . . . . . . . . . . . . . . . . . . . . . . $ 2,478 4.1% (16%) $ 2,947 4.8% 14% $ 2,583 4.5%
Earnings per share — diluted . . . . . . . . . . . . . . $ 1.25 N/A (5%) $ 1.31 N/A 15% $ 1.14 N/A
Share Position — We shipped 43 million units in Fiscal 2009. According to IDC, in calendar year 2008, we maintained our second placeposition in the worldwide computer systems market with a share position of 15.1%. We gained share, both in the U.S. and internationally,as our worldwide growth of 11.1% for calendar 2008 exceeded the overall worldwide computer systems growth of 9.7%. Our gain inshare was driven by a strong overall performance in the first half of Fiscal 2009 followed by a decline in unit shipments in our commercialbusiness in the second half of the year, which was partially offset by strength in our global consumer business. Our commercial business’s
22

slower unit growth in the second half of Fiscal 2009 reflects our decision in an eroding demand environment to selectively pursue unitgrowth opportunities while protecting profitability. We will continue to focus on improving the mix of our product portfolio to highermargin products and recurring revenue streams.
Fiscal 2009 compared to Fiscal 2008
Fiscal 2009 was a year of mixed results for us. During the first half of the fiscal year we capitalized on growth opportunities andexperienced double digit growth driven by increased industry demand. This growth was followed by a period of challenging economicconditions, with a decline in global IT end-user demand. As a result, during the second half of Fiscal 2009, we realigned our balance ofliquidity, profitability, and growth, selectively focusing on areas that provided profitable growth opportunities. Throughout the year wetook actions to reduce operating expenses and optimize product costs. While no one can predict the severity and duration of the currentglobal economic slowdown, we are planning for a continued challenging end-user demand environment in Fiscal 2010. We willselectively invest in strategic growth opportunities, and we will continue our activity around optimizing and transforming our coststructure.
Net Revenue — Fiscal 2009 revenue remained flat year-over-year at $61.1 billion even though unit shipments increased 7%year-over-year. Our revenue performance is primarily attributed to a decrease in selling prices, as discussed further below. DuringFiscal 2009, our global commercial business revenue declined 2% year-over-year while unit shipment remained flat as a result of thechallenging economic environment that was prevalent in the second half of Fiscal 2009. Our global consumer business offset this declinein revenue by posting year-over-year revenue growth of 11% on unit growth of 35% for Fiscal 2009.
Our average selling price (total revenue per unit sold) during Fiscal 2009 decreased 7% year-over-year. Average selling prices wereimpacted by a change in revenue mix between our commercial and consumer business. Selling prices in our commercial business aretypically higher than our consumer business selling prices. During the year our global consumer unit shipments grew significantlywhereas our commercial unit shipments remained flat year over year. Our increased presence in consumer retail also contributed to ouraverage selling price decline as retail typically has lower average selling prices than our on-line and phone direct business. Averageselling prices were also impacted by a competitive pricing environment. Our market strategy has been to concentrate on solution sales todrive a more profitable mix of products and services, while pricing our products to remain competitive in the marketplace. During Fiscal2009, we continued to see competitive pressure, particularly for lower priced desktops and notebooks, as we targeted a broader range ofproducts and price bands. We expect this competitive pricing environment will continue for the foreseeable future.
Revenue outside the U.S. represented approximately 48% of Fiscal 2009 net revenue. Outside the U.S., we produced 4% year-over-yearrevenue growth for Fiscal 2009 as opposed to a 3% decline in revenue for the U.S. The decline in our U.S. revenue is mainly attributableto our commercial business in the U.S., which was impacted by the downturn in the global economy during the second half of Fiscal 2009.Our U.S. consumer business was also impacted by the economic slowdown; however, its revenue increased 5% year-over-year, aided byour expansion into retail through an increased number of worldwide retail locations. Outside of the U.S. we continue to focus on revenueand unit growth in the BRIC countries. BRIC revenue growth during Fiscal 2009 was 20% as we are tailoring solutions to meet specificregional needs, enhancing relationships to provide customer choice and flexibility, and expanding into these and other emergingcountries that represent the vast majority of the world’s population. From a worldwide product perspective, the continuing decline indesktop unit sales and prices, and decreases in mobility selling prices contributed heavily to our Fiscal 2009 performance.
During Fiscal 2009, the U.S. dollar experienced significant volatility relative to the other principal currencies in which we transactbusiness with the exception of the Japanese Yen. We manage our business on a U.S. Dollar basis, and as a result of our comprehensivehedging program, foreign currency fluctuations did not have a significant impact on our consolidated results of operations.
Operating Income — Operating income decreased 7% year-over-year to $3.2 billion in Fiscal 2009. The decrease was partially driven bya shift in product mix that resulted in lower average selling prices. Additionally, operating income was impacted by higher cost of sales,which lowered our gross margin percentage, partially offset by reduced operating expenses.
Net Income — For Fiscal 2009 net income decreased 16% year-over-year to $2.5 billion. Net income was impacted by a 7%year-over-year decline in operating income, a 65% decline in investment and other income, and an increase in our effective tax ratefrom 23.0% to 25.4%.
23

Fiscal 2008 compared to Fiscal 2007
Net Revenue — Fiscal 2008 revenue increased 6% year-over-year to $61.1 billion, with unit shipments up 5% year-over-year. Revenuegrew across all segments except for Global Consumer. Revenue outside the U.S. represented approximately 47% of Fiscal 2008 netrevenue, compared to approximately 44% in the prior year. Outside the U.S., we produced 14% year-over-year revenue growth for Fiscal2008. Combined BRIC revenue growth during Fiscal 2008 was 27%. Worldwide, all product categories grew revenue over the prior yearother than desktop PCs, which declined 1% as consumers continued to migrate to mobility products.
In Fiscal 2008, our average selling price increased 2% year-over-year, which primarily resulted from our pricing strategy, compared to a1% year-over-year increase for Fiscal 2007. In Fiscal 2008, we experienced intense competitive pressure, particularly for lower priceddesktops and notebooks, as competitors offered aggressively priced products with better product recognition and more relevant featuresets.
During Fiscal 2008, the U.S. dollar weakened relative to the other principal currencies in which we transact business; however, as a resultof our hedging activities, foreign currency fluctuations did not have a significant impact on our consolidated results of operations.
Operating Income — Operating income increased 12% year-over-year to $3.4 billion. The increased profitability was mainly a result ofstrength in mobility, solid demand for enterprise products, and a favorable component-cost environment. In Fiscal 2007, operatingincome was $3.1 billion.
Net Income — Net income increased 14% year-over-year to $2.9 billion for Fiscal 2008 from $2.6 billion in Fiscal 2007. Net income wasimpacted by a $112 million year-over-year increase in investment and other income, partially offset by an increase in our effective taxrate from 22.8% to 23.0%.
Revenues by Segment
We conduct operations worldwide. Effective in the first quarter of Fiscal 2009, we combined our consumer businesses of EMEA, APJ,and Americas International (formerly reported through Americas Commercial) with our U.S. Consumer business and re-aligned ourmanagement and financial reporting structure. As a result, effective in the first quarter of Fiscal 2009, our operating structure consisted ofthe following four segments: Americas Commercial, EMEA Commercial, APJ Commercial, and Global Consumer. Our commercialbusiness includes sales to corporate, government, healthcare, education, small and medium business customers, and value-addedresellers and is managed through the Americas Commercial, EMEA Commercial, and APJ Commercial segments. The AmericasCommercial segment, which is based in Round Rock, Texas, encompasses the U.S., Canada, and Latin America. The EMEA Commercialsegment, based in Bracknell, England, covers Europe, the Middle East, and Africa. The APJ Commercial segment, based in Singapore,encompasses the Asian countries of the Pacific Rim as well as Australia, New Zealand, and India. The Global Consumer segment, whichis based in Round Rock, Texas, includes global sales and product development for individual consumers and retailers around the world.We revised previously reported operating segment information to conform to our new operating structure in effect during the first quarterof Fiscal 2009.
On December 31, 2008, we announced our intent during Fiscal 2010 to move from geographic commercial segments to global businessunits reflecting the impact of globalization on our customer base. Customer requirements now share more commonality based on theirsector rather than physical location. We expect to combine our current Americas Commercial, EMEA Commercial, and APJ Commercialsegments and realign our management structure. After this realignment, our operating structure will consist of the following segments:Global Large Enterprise, Global Public, Global Small and Medium Business (“SMB”), and our existing Global Consumer segment. Webelieve that these four distinct, global business organizations can capitalize on our competitive advantages and strengthen execution. Weexpect to begin reporting the four global business segments once we complete the realignment of our management and financial reportingstructure, which is expected to be complete in the first half of Fiscal 2010.
During the second half of Fiscal 2008, we began selling desktop and notebook computers, printers, ink, and toner through retail channelsin the Americas, EMEA, and APJ in order to expand our customer base. Our goal is to have strategic relationships with a number of majorretailers in our larger geographic regions. During Fiscal 2009, we continued to expand our global retail presence, and we now reach over24,000 retail locations worldwide.
24

The following table summarizes our net revenue by reportable segment for each of the past three fiscal years:
Dollars% of
Revenue % Change Dollars% of
Revenue % Change Dollars% of
Revenue
January 30, 2009 February 1, 2008 February 2, 2007
Fiscal Year Ended
(in millions, except percentages)
Net revenue:
Americas Commercial . . . . . . . . . . . . . . . . . . . $ 28,614 47% (5%) $ 29,981 49% 6% $ 28,289 49%
EMEA Commercial . . . . . . . . . . . . . . . . . . . . . 13,617 22% 0% 13,607 22% 15% 11,842 21%
APJ Commercial . . . . . . . . . . . . . . . . . . . . . . . 7,341 12% 2% 7,167 12% 15% 6,223 11%
Global Consumer. . . . . . . . . . . . . . . . . . . . . . . 11,529 19% 11% 10,378 17% (6%) 11,066 19%
Net revenue . . . . . . . . . . . . . . . . . . . . . . . . . . $ 61,101 100% (0%) $ 61,133 100% 6% $ 57,420 100%
Fiscal 2009 compared to Fiscal 2008
Americas Commercial — Americas Commercial revenue decreased 5% with unit shipments down 7% year-over-year for Fiscal 2009.Revenue declined across all business sectors within Americas Commercial, except for Latin America and sales to the U.S. Federalgovernment, due to the decline in IT end-user demand environment. Growth in Latin America was led by Brazil and Argentina whichexperienced revenue growth of 18% and 10%, respectively, during Fiscal 2009 as compared to Fiscal 2008. Year-over-year, averageselling prices increased 2% as we improved our mix of products and services during the year. From a product perspective, the revenuedecline was primarily due to a decrease in desktop revenue of 14% on a unit decline of 9%, and a decrease in mobility revenue of 10% ona unit decline of 5%. Average selling prices for desktops and mobility products both decreased 6% year-over-year as a result ofcompetitive pricing pressures due to the slowdown in IT spending. The decline in desktop and mobility sales was partially offset byrevenue growth in services and software and peripherals, which increased 14% and 6%, respectively, during Fiscal 2009. We continue tofocus on selling solutions to our customers to provide greater value for each dollar of spend and to bolster our average selling prices.
EMEA Commercial — During Fiscal 2009 EMEA Commercial revenue remained flat year-over-year at $13.6 billion on unit growth of6%. This volume growth was mainly the result of a 21% year-over-year increase in mobility shipments. Even though mobility unitshipments increased 21%, revenue only increased 8% as average selling prices for mobility products declined 10% year-over-year. Dueto the decline in IT spending, downward pricing pressures negatively impacted selling prices for EMEA Commercial’s mobility productsas well as its desktop and servers and networking products as average selling prices for all products declined 6% year-over-year. Inaddition to mobility revenue growth, storage revenue and software and peripherals revenue grew 20% and 6%, respectively. Offsettingthis revenue growth were year-over-year revenue declines of 11% and 5% for desktops and servers and networking, respectively. DuringFiscal 2009, EMEA Commercial experienced challenging demand in Western Europe; however, there was double digit revenue growth inemerging countries such as the Czech Republic, Poland, and Ukraine. This growth, while consistent with our overall strategy, continuedto drive a mix shift in the EMEA Commercial revenue base, towards products in lower price bands, which reduced average selling prices.
APJ Commercial — During Fiscal 2009, APJ Commercial experienced a 2% year-over-year increase in revenue on a unit volumeincrease of 10% as average revenue per unit declined 6%. Consistent with our other commercial segments, selling prices werestrategically reduced to remain competitive in a slow global economy. Revenue grew across all product lines, year-over-year, except fordesktop and servers and networking products. Revenue from mobility products grew 8% on a unit growth of 21%, and desktop revenuedeclined 2% on unit growth of 5% due to the continued shift in customer preference from desktops to notebooks. Storage, services, andsoftware and peripherals revenue increased year-over-year by 12%, 6%, and 5%, respectively, for Fiscal 2009. From a countryperspective, our targeted countries of India, the Philippines, Vietnam, and Indonesia experienced high double digit revenue growth duringthe year. During Fiscal 2009, year-over-year revenue growth in China, which is APJ Commercial’s largest country by revenue and is alsoa target country, slowed significantly as revenue grew only 1% due to a weakening global economy.
Global Consumer — Global Consumer revenue increased 11% in Fiscal 2009 from Fiscal 2008 on a unit volume increase of 35%.Average revenue per unit declined 18% due to our participation in a wider distribution of price bands including lower average sales pricesrealized as we expanded our presence in retail through an increased number of worldwide retail locations. Retail typically has loweraverage selling prices than our on-line and phone direct business. Mobility revenue grew 32% year-over-year on unit growth of 67%, anddesktop revenue decreased 17% year-over-year on a unit decline of 5% as customer preference continued to shift from desktops tonotebooks. Also contributing to Global Consumer’s revenue growth was software and peripherals revenue increase of 13% and continuedstrength in emerging markets. During calendar 2008, we have grown nearly two times the industry rate of growth on a unit basis and
25

increased our global share to 8.7%, up from 7.8% in the previous year, driven by continued success in the global retail channel and a morediversified product portfolio. This growth was led by our APJ consumer business with a 45% year-over-year increase in revenue.
Fiscal 2008 compared to Fiscal 2007
Americas Commercial — Americas Commercial grew revenue as well as units by 6% in Fiscal 2008, compared to 3% revenue growth ona slight unit decline in Fiscal 2007. The increase in revenue in Fiscal 2008 resulted from strong sales of mobility products, servers andnetworking, services, and software and peripherals, which grew 9%, 8%, 9%, and 13%, respectively, year-over-year. The unit volumeincreases resulted from growth in notebooks. In Fiscal 2007, the slowdown of net revenue growth was due to desktop weakness, lowerdemand, and a significant decline in our Public business due to weakening sales to federal customers.
EMEA Commercial — For Fiscal 2008, EMEA Commercial represented 22% of our total consolidated net revenue as compared to 21% inFiscal 2007. EMEA Commercial had 15% year-over-year net revenue growth as a result of unit shipment growth of 12%. Average priceper unit increased 2%, which reflects the mix of products sold and a benefit from the strengthening of the Euro and British Pound againstthe U.S. dollar during Fiscal 2008, which influenced our pricing strategy. The revenue growth was primarily a result of higher demand formobility products, represented by a unit shipment increase of 30%. Additionally, revenue grew year-over-year for all product categorieswithin EMEA Commercial, led by growth in mobility, services, and software & peripherals revenue of 23%, 32%, and 18%, respectively.
APJ Commercial — During Fiscal 2008, APJ Commercial’s revenue continued to improve, with 15% revenue growth year-over-year.Consistent with the EMEA Commercial segment, these increases were mainly a result of strong growth in mobility. Unit sales of mobilityproducts increased 32% in Fiscal 2008 as compared to Fiscal 2007. Sales of mobility products grew due to a shift in customer preferencefrom desktops to notebooks as well as the strong reception of our VostroTM notebooks. APJ Commercial also reported 21% growth inservers and networking revenue primarily due to our focus on delivering greater value within customer data centers with our rackoptimized server platforms, whose average selling prices are higher than our tower servers. These increases were partially offset by adecrease in services revenue of 13%.
Global Consumer — Global Consumer revenue and unit volume decreased 6% and 12%, respectively, in Fiscal 2008, compared torevenue and unit decreases of 5% and 3%, respectively, in Fiscal 2007. Global Consumer revenue declined as compared to Fiscal 2007primarily due to a 23% decline in desktop unit volumes. In Fiscal 2008, this segment’s average selling price increased 6% year-over-yearmainly due to realigning prices and selling a more profitable product mix. In the fourth quarter of Fiscal 2008, the Global Consumerbusiness began to improve and posted revenue growth of 16% over the fourth quarter of Fiscal 2007, which reflected changes we made tothe business to reignite growth, including the introduction of four notebook families for consumers.
For additional information regarding our reportable segments, see Note 11 of Notes to Consolidated Financial Statements included in“Part II — Item 8 — Financial Statements and Supplementary Data.”
Revenue by Product and Services Categories
The following table summarizes our net revenue by product category:
Dollars% of
Revenue % Change Dollars% of
Revenue % Change Dollars% of
Revenue
January 30, 2009 February 1, 2008 February 2, 2007
Fiscal Year Ended
(in millions, except percentages)
Net revenue:
Mobility . . . . . . . . . . . . . . . . . . . . . . . . . . . . . $ 18,638 31% 7% $ 17,423 28% 13% $ 15,480 27%Desktop PCs . . . . . . . . . . . . . . . . . . . . . . . . . . 17,244 29% (12%) 19,573 32% (1%) 19,815 34%Software and peripherals . . . . . . . . . . . . . . . . . . 10,603 17% 7% 9,908 16% 10% 9,001 16%Servers and networking . . . . . . . . . . . . . . . . . . . 6,275 10% (3%) 6,474 11% 12% 5,805 10%Services . . . . . . . . . . . . . . . . . . . . . . . . . . . . . 5,715 9% 7% 5,320 9% 5% 5,063 9%Storage . . . . . . . . . . . . . . . . . . . . . . . . . . . . . . 2,626 4% 8% 2,435 4% 8% 2,256 4%
Net revenue . . . . . . . . . . . . . . . . . . . . . . . . . . . . $ 61,101 100% (0%) $ 61,133 100% 6% $ 57,420 100%
26

Fiscal 2009 compared to Fiscal 2008
Mobility — During Fiscal 2009 revenue from mobility products (which includes notebook computers and mobile workstations) grew 7%on unit growth of 24%. According to IDC, our unit growth rate for calendar 2008 was 31%, which was consistent with the industry’sgrowth rate of 32%. The average selling prices of our mobility products across all of our segments dropped 14% year-over-year due to asoft demand environment and the continued expansion into retail by our Global Consumer segment due to an increased number ofworldwide retail locations. Expansion into retail also contributed to our overall revenue growth as mobility revenue in Global Consumerincreased 32% year-over-year on unit growth of 67%, as opposed to a decline in mobility revenue of 2% on unit growth of 7% in ourglobal commercial business. APJ Commercial and EMEA Commercial both grew revenue by 8% on unit growth of 21%. However,Americas Commercial mobility revenue declined 10% year-over-year for Fiscal 2009 on a unit decline of 5% as we experiencedconservative customer spending across all business sectors within Americas Commercial, including Latin America. The slow revenuegrowth in our commercial business can also be partially attributed to our transition to the new LatitudeTM E-Series and Dell Precisionnotebook product lines during the second half of Fiscal 2009. Our new product lines range from the lightest ultra-portable in our history tothe most powerful mobile workstation. We believe the on-going trend to mobility products will continue, and we are therefore focused onexpanding our product platforms to cover broader price bands and functionalities.
In Fiscal 2009, we have launched industry leading mobility products such as the Inspiron 1525, Vostro, and 3G enabled Inspiron Mini. Wealso launched our ruggedized LatitudeTM XFR, which is designed for reliable performance in the harshest environments, and introducedour completely new line of LatitudeTM and Dell Precision notebooks. We introduced the VostroTM A-Series and the Dell 500 during Fiscal2009, which were specifically designed for emerging countries. All of our commercial products in emerging countries are now costoptimized. We will continue our cost optimization efforts in remaining products in Fiscal 2010.
Desktop PCs — During Fiscal 2009 revenue from desktop PCs (which includes desktop computer systems and workstations) decreasedyear-over-year 12% on a unit decline of 4%. The decline was primarily due to the on-going competitive pricing pressure for lower priceddesktops and a softening in global IT end-user demand. Consequently, our average selling price for desktops decreased 8%year-over-year during Fiscal 2009 as we aligned our prices and product offerings with the marketplace. For Fiscal 2009, desktoprevenue decreased across all segments. Our Global Consumer, Americas Commercial, EMEA Commercial, and APJ Commercialsegments experienced year-over-year revenue declines of 17%, 14%, 11% and 2% respectively. We are continuing to see rising end-userdemand for mobility products, which contributes to further slowing demand for desktop PCs as mobility growth is expected to continue tooutpace desktop growth. During Fiscal 2009, we introduced four new models of our OptiPlexTM commercial desktop systems. Thesesystems cut power consumption by up to 43%, speed serviceability time by more than 40% versus our competition, and include aportfolio of services that can be accessed by the user as needed.
Software and Peripherals — Revenue from sales of software and peripherals (“S&P”) consists of Dell-branded printers, monitors (notsold with systems), projectors, and a multitude of competitively priced third-party peripherals including plasma and LCD televisions,software, and other products. This revenue grew 7% year-over-year for Fiscal 2009, driven by strength in software licensing primarilydue to our acquisition of ASAP Software (“ASAP”) in the fourth quarter of Fiscal 2008. With ASAP, we now offer products from over2,000 software publishers. At a segment level, Global Consumer led the revenue growth with a 13% year-over-year growth rate for Fiscal2009. EMEA Commercial and Americas Commercial both experienced revenue growth of 6% during Fiscal 2009. S&P revenue for APJCommercial increased 5% year-over-year during Fiscal 2009. We continue to believe that software licensing is a revenue growthopportunity as customers continue to seek out consolidated software sources.
Servers and Networking — During Fiscal 2009 revenue from sales of servers and networking products decreased 3% year-over-year on aunit increase of 4%. The decline in our server and networking revenue is due to demand challenges across all regions. To address thedemand challenges and drive growth, we adjusted our pricing and product strategy to shift our product offerings to lower price bands.Consequently, our average selling price for servers and networking products decreased 7% year-over-year during Fiscal 2009. DuringFiscal 2009, we experienced double digit growth in blades, 4-Socket rack servers, and our cloud computing initiatives. We expanded ourserver coverage to 88% of the server space, and we plan to increase our coverage to 95% next year. For calendar 2008, we were againranked number one in the United States with a 35% share in server units shipped; worldwide, we were second with a 26% share. Duringthe fiscal year, we have released our broadest lineup of dedicated virtualization solutions ever, including more than a dozen new servers,tools, and services, as a part of our mission to help companies of all sizes simplify their IT environments.
Services — Services consists of a wide range of services including assessment, design and implementation, deployment, asset recoveryand recycling, training, enterprise support, client support, and managed lifecycle. Services revenue increased 7% year-over-year forFiscal 2009 to $5.7 billion, as our annuity of deferred services revenue amortization increases in our Americas Commercial segment anda 10% year-over-year increase in consulting services revenue for Fiscal 2009. The increase in services revenue was also aided by our new
27

ProSupport offerings, which distilled ten service offerings down to two customizable packages spanning our commercial product andsolutions portfolios with flexible options for service level and proactive management. We also expanded our services business with newofferings in enterprise solutions and remote infrastructure management. For Fiscal 2009, Americas Commercial and APJ Commercial ledyear-over-year revenue growth with increases of 14% and 6%, respectively. EMEA Commercial revenue declined 1% for Fiscal 2009.Our deferred service revenue balance increased 7% year-over-year to $5.6 billion at January 30, 2009, primarily due to strong unit growthin the first half of Fiscal 2009. We continue to view the services as a strategic growth opportunity and will continue to invest in ourofferings and resources focused on increasing our solution sales.
Storage — Revenue from sales of storage products increased 8% year-over-year for Fiscal 2009. Year-over-year storage growth was ledby strength in our PowerVault line and the strong performance of our EqualLogic iSCSI networked storage solutions, which we acquiredin Fiscal 2008. EMEA Commercial, APJ Commercial, and Americas Commercial all contributed to the increase in storage revenue withyear-over-year growth of 20%, 12% and 2%, respectively, for Fiscal 2009. During the fiscal year, we expanded our storage portfolio byadding increasingly flexible storage choices that allow customers to grow capacity, add performance and protect their data in a moreeconomical manner.
Fiscal 2008 compared to Fiscal 2007
Mobility — In Fiscal 2008, revenue from mobility products grew 13% year-over-year on unit growth of 16%. The growth was led by theAPJ Commercial and EMEA Commercial segments with 35% and 23% increases in revenue year-over-year, respectively, whileAmericas Commercial revenue increased 9%. Unit shipments grew year-over-year in these three segments by 32%, 30%, and 19%,respectively. Global Consumer mobility units were flat during Fiscal 2008 as compared to Fiscal 2007. Even though we posted mobilityunit growth of 16% during Fiscal 2008, according to IDC, our growth was below the industry’s growth of 34% during calendar 2007. Tocapitalize on the industry growth in mobility, we separated our consumer and commercial design functions — focusing our consumerteam on innovation and shorter design cycles. As a result, we launched four consumer notebook families, including InspironTM colornotebooks and XPSTM notebooks, for which the demand was better than expected. We also introduced VostroTM notebooks, specificallydesigned to meet the needs of small business customers. During the fourth quarter of Fiscal 2008, we launched our first tablet — theLatitudeTM XT, the industry’s only sub-four pound convertible tablet with pen and touch capability.
Desktop PCs — During Fiscal 2008, revenue from desktop PCs decreased slightly from Fiscal 2007 revenue on a unit decline of 2% eventhough worldwide industry unit sales grew 5% during calendar 2007. The decline was primarily due to us being out of product feature andprice position and consumers migrating to mobility products. Our Global Consumer segment continued to perform below expectation inFiscal 2008 with a 13% year-over-year decrease in desktop revenue. Global Consumer was the primary contributor to our worldwide fullyear decline in desktop revenue with Americas Commercial also contributing to the weaker performance during Fiscal 2008 as comparedto Fiscal 2007. The decline was partially offset by a strong performance in APJ Commercial where desktop revenue and units bothincreased 13% during Fiscal 2008 over prior year. In Fiscal 2008, we introduced VostroTM desktops specifically designed to meet theneeds of small business customers.
Software and Peripherals — In Fiscal 2008, S&P revenue increased 10% year-over-year. EMEA Commercial lead S&P revenue growthwith a year-over-year increase of 18%, and Americas Commercial and APJ Commercial revenue growth was 13% and 12%, respectively,during Fiscal 2008 as compared to Fiscal 2007. The increase in S&P revenue was primarily attributable to strength in imaging andprinting, digital displays, and software licensing. We also acquired ASAP during the year as we believe having stronger softwarelicensing offerings and related customer management tools are areas of strategic opportunity.
Servers and Networking — In Fiscal 2008, servers and networking revenue grew 12% on unit growth of 6% year-over-year as comparedto industry unit growth of 8%. Our unit growth was slightly behind the growth in the overall industry, while we improved our productfeature sets by transitioning to new platforms, and as we managed through the realignment of certain portions of our sales force to addresssales execution deficiencies. A significant portion of the revenue growth was due to higher average selling prices, which increased 5%during Fiscal 2008 as compared to the prior year. Fourth quarter year-over-year revenue growth of 2% was below industry growth and ourexpectations as conservatism in the U.S. commercial sectors affected sales of our server products. All regions experienced strongyear-over-year revenue growth with APJ Commercial leading the way with 21% growth on unit growth of 6%; additionally, server andnetworking revenue increased 16% and 8% in EMEA Commercial and Americas Commercial, respectively. For Fiscal 2008, we wereagain ranked number one in the United States with a 34% share in server units shipped; worldwide we were second with a 25% share.Servers and networking remains a strategic focus area. Late in the fourth quarter, we launched our 10G blade servers — the most energyefficient blade server solution on the market. Our PowerEdge servers were ranked number one in server benchmark testing for overallperformance, energy efficiency, and price.
28

Services — In Fiscal 2008, revenue from services (which includes the sale and servicing of our extended product warranties) increased5% year-over-year compared to a 20% increase in Fiscal 2007. EMEA Commercial drove services revenue growth with a 32% increase inFiscal 2008 as compared to Fiscal 2007, and Americas Commercial contributed with 9% revenue growth. This growth was offset byrevenue declines in Global Consumer and APJ Commercial of 25% and 13%, respectively. Strong Fiscal 2008 services sales increasedour deferred service revenue balance by approximately $1.0 billion in Fiscal 2008, a 25% increase to approximately $5.3 billion. DuringFiscal 2008, we acquired a number of service technologies and capabilities through acquisitions of certain companies. These capabilitiesare being used to build-out our mix of service offerings. We are continuing to make progress in services including ProSupport, remoteinfrastructure management, and Software as a Service (SaaS), which are aimed at simplifying IT for our customers.
Storage — In Fiscal 2008, storage revenue increased 8% as compared to a 21% increase in Fiscal 2007. The revenue growth was led byEMEA Commercial, which experienced strong growth of 18%; additionally, APJ Commercial and Americas Commercial increased 10%and 5%, respectively. In Fiscal 2008, we expanded both our PowerVault and Dell C EMC solutions that drove both additional increases inperformance and customer value. During the fourth quarter of Fiscal 2008, we completed the acquisition of EqualLogic, Inc., an industryleader in iSCSI SANs. With this acquisition, we now provide much broader product offerings for small and medium business consumers.
Gross Margin
The following table presents information regarding our gross margin during each of the past three fiscal years:
Dollars% of
Revenue%
Change Dollars% of
Revenue%
Change Dollars% of
Revenue
January 30, 2009 February 1, 2008 February 2, 2007
Fiscal Year Ended
(in millions, except percentages)
Net revenue . . . . . . . . . . . . . . . . . . . . . . . . . . $ 61,101 100.0% (0%) $ 61,133 100.0% 6% $ 57,420 100.0%
Gross margin . . . . . . . . . . . . . . . . . . . . . . . . . $ 10,957 17.9% (6%) $ 11,671 19.1% 23% $ 9,516 16.6%
Fiscal 2009 compared to Fiscal 2008
During Fiscal 2009, our gross margin decreased in absolute dollars by $714 million compared to the prior year with a correspondingdecrease in gross margin percentage to 17.9% from 19.1%. As a result of competitive pricing pressures and further expansion into retailthrough an increased number of worldwide retail locations, there was a decrease in our average selling prices, which contributed to adecline in gross margin. The year-over-year gross margin percentage decline can be further attributed to the fact that Fiscal 2008witnessed unusually high component costs declines, whereas Fiscal 2009 component cost declines returned to more typical levels.During Fiscal 2009 we made continued progress against our ongoing cost improvement initiatives, which resulted in a number of newcost optimized product launches during the second half of 2009.
We continue to actively review all aspects of our facilities, logistics, supply chain, and manufacturing footprints. This review is focusedon identifying efficiencies and cost reduction opportunities while maintaining a strong customer experience. Examples of this include theclosure of our desktop manufacturing facility in Austin, Texas, the sale of our call center in El Salvador, and the recent announcement ofour migration and closure of manufacturing operations from our Limerick, Ireland facility to our Polish facility and third partymanufacturers. The cost of these actions and other severance and business realignment reductions was $282 million in Fiscal 2009, ofwhich approximately $146 million affected gross margin. We expect to continue to reduce headcount, and we may realign or closeadditional facilities depending on a number of factors, including end-user demand, capabilities, and our migration to a more variable costmanufacturing model. These actions will result in additional business realignment costs in the future, although no plans were finalized atJanuary 30, 2009.
We continue to evaluate and optimize our global manufacturing and distribution network, including our relationships with original designmanufacturers, to better meet customer needs and reduce product cycle times. Our goal is to introduce the latest relevant technology andto deliver the best value to our customers worldwide. As we continue to evolve our inventory and manufacturing business model tocapitalize on component cost declines, we continuously negotiate with our suppliers in a variety of areas including availability of supply,quality, and cost. These real-time continuous supplier negotiations support our business model, which is able to respond quickly tochanging market conditions due to our direct customer model and real-time manufacturing. Because of the fluid nature of these ongoingnegotiations, the timing and amount of supplier discounts and rebates vary from time to time. These discounts and rebates are allocated tothe segments based on a variety of factors including strategic initiatives to drive certain programs.
29

In general, gross margin and margins on individual products will remain under downward pressure due to a variety of factors, includingcontinued industry wide global pricing pressures, increased competition, compressed product life cycles, potential increases in the costand availability of raw materials, and outside manufacturing services. We will continue to adjust our pricing strategy with the goals ofremaining in competitive price position while maximizing margin expansion through new higher margin products and lower costoptimized design and services where appropriate.
Fiscal 2008 compared to Fiscal 2007
During Fiscal 2008, our gross margin increased in absolute dollars and as a percentage of revenue from Fiscal 2007, driven by greater costdeclines. The cost environment was more favorable in the first half of Fiscal 2008 than the second half, which resulted in a decline in ourgross margin percentage from 19.6% in the first half to 18.6% in the second half of the year. The fourth quarter of Fiscal 2008 waspositively impacted by a $58 million reduction in accrued liabilities for a one-time adjustment related to a favorable ruling by the GermanFederal Supreme Court on a copyright levy case.
Operating Expenses
The following table presents information regarding our operating expenses during each of the past three fiscal years:
Dollars% of
Revenue%
Change Dollars% of
Revenue%
Change Dollars% of
Revenue
January 30, 2009 February 1, 2008 February 2, 2007Fiscal Year Ended
(in millions, except percentages)
Operating expenses:
Selling, general, and administrative . . . . . . . . . . . . $ 7,102 11.6% (6%) $ 7,538 12.4% 27% $ 5,948 10.3%
Research, development, and engineering . . . . . . . . . 663 1.1% 9% 610 1.0% 22% 498 0.9%
In-process research and development . . . . . . . . . . . 2 0.0% (98%) 83 0.1% N/A - -
Operating expenses . . . . . . . . . . . . . . . . . . . . . . . . . $ 7,767 12.7% (6%) $ 8,231 13.5% 28% $ 6,446 11.2%
Fiscal 2009 compared to Fiscal 2008
Selling, General, and Administrative — During Fiscal 2009, selling, general, and administrative (“SG&A”) expenses decreased 6% to$7.1 billion from $7.5 billion in Fiscal 2008. Compensation and benefits expense, excluding expenses related to headcount andinfrastructure reductions, decreased approximately $250 million in Fiscal 2009 compared to Fiscal 2008, driven primarily by decreasesin bonus-related expenses due to weaker company performance versus bonus plan targets and lower sales commission expenses.Compensation-related expenses also included $73 million of stock option acceleration in Fiscal 2009, while Fiscal 2008 included$76 million for the cash payments made for expiring stock options. Additionally, with the increase in retail volumes and the associatedcooperative advertising programs, as well as other factors, advertising expenses decreased approximately $130 million from Fiscal 2008.Furthermore, costs associated with the ongoing U.S. Securities and Exchange Commission (“SEC”) investigation and the AuditCommittee’s now completed independent investigation decreased by $117 million from $160 million for Fiscal 2008 to $43 million forFiscal 2009. These decreases were partially offset by an increase in SG&A expenses related to headcount and infrastructure reductionsthrough our on-going cost optimization efforts, which were $136 million for Fiscal 2009 compared to $92 million for Fiscal 2008.
Research, Development, and Engineering — Research, development, and engineering (“RD&E”) expenses increased 9% to $663 millionfor Fiscal 2009 compared to $610 million for Fiscal 2008, remaining at approximately 1% of revenue for both fiscal years. The increasein RD&E expense is primarily due to approximately $45 million increase in compensation and benefits expenses as we continue toexpand our research and development activities in our EqualLogic and Data Center Solutions offerings. We manage our research,development, and engineering spending by targeting those innovations and products that are most valuable to our customers and byrelying upon the capabilities of our strategic partners. We will continue to invest in research, development, and engineering activities tosupport our growth and to provide for new, competitive products. We have obtained 2,253 worldwide patents and have applied for 2,514additional worldwide patents as of January 30, 2009.
In-Process Research and Development — We recognized in-process research and development (“IPR&D”) charges in connection withacquisitions accounted for as business combinations, as more fully described in Note 7 of Notes to Consolidated Financial Statementsincluded in “Part II — Item 8 — Financial Statements and Supplementary Data.” We recorded IPR&D charges of $2 million duringFiscal 2009 and $83 million during Fiscal 2008. Prior to Fiscal 2008, there were no IPR&D charges related to acquisitions.
30
In May 2007, we announced that we had initiated a comprehensive review of costs across all processes and organizations with the goal tosimplify structure, eliminate redundancies, and better align operating expenses with the current business environment and strategicgrowth opportunities. These efforts are continuing. Since the second quarter of Fiscal 2008 and through the end of Fiscal 2009, we havereduced headcount by approximately 13,500 and closed some of our facilities. We expect to take further actions to reduce costs and investin strategic growth areas while focusing on scaling costs and improving productivity.
Fiscal 2008 compared to Fiscal 2007
Selling, General, and Administrative — During Fiscal 2008, SG&A expenses increased 27% to $7.5 billion. The increase was primarilydue to higher compensation and benefits expense, increased outside consulting fees, and investigation costs. Compensation-relatedexpenses and expenses related to headcount and infrastructure reductions increased approximately $1.0 billion in Fiscal 2008 comparedto Fiscal 2007. This increase was driven both by bonus-related expenses, which increased substantially compared to Fiscal 2007 whenbonuses were paid at a reduced amount, as well as an increased average headcount for Fiscal 2008. The increase in compensation relatedexpenses also includes $76 million (of the total of $107 million) of additional expense for cash payments for expiring stock options.SG&A expenses related to headcount and infrastructure reductions were $92 million for Fiscal 2008, and expenses related to the SEC andAudit Committee investigations were $160 million and $100 million for Fiscal 2008 and Fiscal 2007, respectively.
Research, Development, and Engineering — During Fiscal 2008, RD&E expenses increased 22% to $610 million compared to$498 million in Fiscal 2007. The increase in research, development, and engineering was primarily driven by significantly highercompensation costs. The higher compensation costs are partially attributed to increased focused investments in research and development(“R&D”), which are critical to our future growth and competitive position in the marketplace. During Fiscal 2008, we implemented our“Simplify IT” initiative for our customers. R&D is the foundation for this initiative, which is aimed at allowing customers to deploy ITfaster, run IT at a lower total cost, and grow IT smarter.
Operating Income
Fiscal 2009 compared to Fiscal 2008
Operating income decreased 7% year-over-year to $3.2 billion in Fiscal 2009 from $3.4 billion in Fiscal 2008. The decrease in operatingincome is primarily attributable to our gross margin decline, partially offset by a 6% reduction in operating expenses year-over-year dueto factors discussed in the Operating Expenses section. During Fiscal 2009, we experienced customer and product mix shift as our globalconsumer business grew significantly in both units and revenue as compared to Fiscal 2008 and as our commercial business revenuedeclined on flat unit shipments during the same time period. Also impacting operating income was the decline in profitability in ourEMEA Commercial segment and higher than historical average declines in component costs in Fiscal 2008, which returned to moretypical declines in Fiscal 2009.
Americas Commercial — For Fiscal 2009, operating income percentage increased 40 basis points year-over-year. Operating incomeimproved as a result of a year-over-year 2% increase in average selling prices due to an improved mix of products and services and lowercomponent costs during the second half of Fiscal 2009. Additionally, operating expenses declined 4% year-over-year as we managed ouroperating expenses tightly and streamlined our organizational operations.
EMEA Commercial — For Fiscal 2009, operating income percentage decreased approximately 300 basis points from Fiscal 2008, andoperating income dollars decreased 44% while revenue remained flat. Operating income dollars and percentage were adversely impactedby a 6% decrease in average selling prices as sales mix shifted toward lower price bands, especially in notebooks. Operating incomedollars and percentage were also adversely impacted by weaker western European markets coupled with significant growth in emergingmarkets where product sales are generally in the lower price and profitability bands. Also impacting operating income was a 2%year-over-year increase in operating expenses as well as increases in severance and business realignment expenses.
APJ Commercial — Operating income percentage increased approximately 30 basis points year-over-year from Fiscal 2008, andoperating income dollars increased 8% on a revenue increase of 2% due to lower component costs and an improved mix of products andservices. Partially offsetting the operating income improvement was a year-over-year increase in operating expenses of 7% during Fiscal2009 mainly due to increased severance and business realignment expenses.
Global Consumer — Global Consumer’s operating income percentage increased year-over-year by approximately 120 basis points to1%, and operating income dollars grew from $2 million in Fiscal 2008 to $143 million in Fiscal 2009 on revenue and unit growth of 11%and 35%, respectively. Operating income was negatively impacted by an 18% year-over-year decrease in average selling prices for Fiscal2009 as we participated in a broader spectrum of consumer product opportunities and continued our expansion into retail. Additionally,
31

operating expenses declined 19% year-over-year as we began to realize the benefits from our cost-improvement initiatives. In the near-term, we expect the operating income percentage for Global Consumer to be in the 1% - 2% range as we balance profitability, liquidityand growth in our expansion in this strategic market.
Fiscal 2008 compared to Fiscal 2007
Operating income increased 12% year-over-year to $3.4 billion. The increased profitability was mainly a result of strength in mobility,solid demand for enterprise products, and a favorable component-cost environment. In Fiscal 2007, operating income was $3.1 billion.
Americas Commercial — For Fiscal 2008, operating income percentage increased 30 basis points year-over-year, and operating incomedollars grew 9% year-over-year mainly due to lower component costs. The operating income improvement was partially offset by ayear-over-year increase in operating expenses of 26%.
EMEA Commercial — For Fiscal 2008, operating income percentage increased approximately 200 basis points from Fiscal 2007, andoperating income dollars increased due to significantly stronger gross margins. Partially offsetting this growth was a 170 basis pointsincrease in operating expenses as a percent of revenue.
APJ Commercial — Operating income percentage increased 50 basis points year-over-year from Fiscal 2007, and operating incomedollars increased 27% on revenue growth of 15%. Impacting the growth in operating income was lower component costs in Fiscal 2008 ascompared to Fiscal 2007 partially offset by a year-over-year increase in operating expenses as a percentage of revenue.
Global Consumer — Global Consumer’s operating income percentage decreased year-over-year by approximately 120 basis points, andoperating income dollars declined from $130 million in Fiscal 2007 to $2 million in Fiscal 2008 on revenue and unit decline of 6% and12%, respectively. A significant improvement in gross margins was more than offset by a 23% increase in operating expenses and ourexpansion into retail during the second half of Fiscal 2008.
Stock-Based Compensation
We use the 2002 Long-Term Incentive Plan, amended in December 2007, for stock-based incentive awards. These awards can be in theform of stock options, stock appreciation rights, stock bonuses, restricted stock, restricted stock units, performance units, or performanceshares.
Stock-based compensation expense totaled $418 million for Fiscal 2009, compared to $436 million and $368 million for Fiscal 2008 andFiscal 2007, respectively. Stock-based compensation expense for Fiscal 2009 includes $104 million of expense for accelerated options,and Fiscal 2008 includes cash payments of $107 million made for expired in-the-money stock options. Both of these items are discussedbelow.
We adopted Statement of Financial Accounting Standards (“SFAS”) No. 123 (revised 2004), Share-Based Payment (“SFAS 123(R)”)using the modified prospective transition method under SFAS 123(R) effective the first quarter of Fiscal 2007. Included in stock-basedcompensation is the fair value of stock-based awards earned during the year, including restricted stock, restricted stock units, and stockoptions, as well as the discount associated with stock purchased under our employee stock purchase plan (“ESPP”). The ESPP wasdiscontinued effective February 2008 as part of an overall assessment of our benefits strategy. For further discussion on stock-basedcompensation, see Note 5 of Notes to Consolidated Financial Statements included in “Part II — Item 8 — Financial Statements andSupplementary Data.”
At January 30, 2009, there was $1 million and $507 million of total unrecognized stock-based compensation expense related to stockoptions and non-vested restricted stock, respectively, with the unrecognized stock-based compensation expense expected to berecognized over a weighted-average period of 2.3 years and 2.0 years, respectively. At February 1, 2008, there was $93 million and$600 million of total unrecognized stock-based compensation expense related to stock options and non-vested restricted stock,respectively, with the unrecognized stock-based compensation expense expected to be recognized over a weighted-average period of2.0 years and 1.9 years, respectively. At February 2, 2007, there was $139 million and $356 million of total unrecognized stock-basedcompensation expense related to stock options and non-vested restricted stock, respectively, with the unrecognized stock-basedcompensation expense expected to be recognized over a weighted-average period of 1.7 years and 2.4 years, respectively.
On January 23, 2009, our Board of Directors approved the acceleration of the vesting of unvested “out-of-the-money” stock options(options that have an exercise price greater than the current market stock price) with exercise prices equal to or greater than $10.14 pershare for approximately 2,800 employees holding options to purchase approximately 21 million shares of common stock. We concludedthe modification to the stated vesting provisions was substantive after we considered the volatility of our share price and the exercise price
32
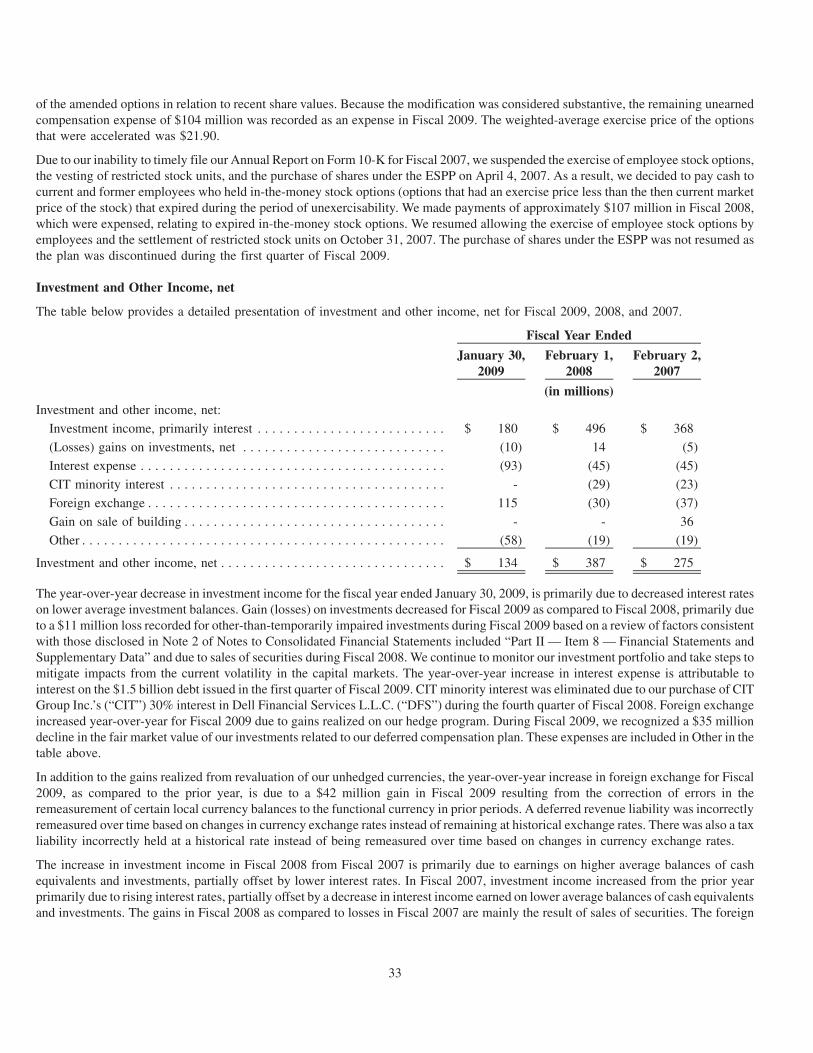
of the amended options in relation to recent share values. Because the modification was considered substantive, the remaining unearnedcompensation expense of $104 million was recorded as an expense in Fiscal 2009. The weighted-average exercise price of the optionsthat were accelerated was $21.90.
Due to our inability to timely file our Annual Report on Form 10-K for Fiscal 2007, we suspended the exercise of employee stock options,the vesting of restricted stock units, and the purchase of shares under the ESPP on April 4, 2007. As a result, we decided to pay cash tocurrent and former employees who held in-the-money stock options (options that had an exercise price less than the then current marketprice of the stock) that expired during the period of unexercisability. We made payments of approximately $107 million in Fiscal 2008,which were expensed, relating to expired in-the-money stock options. We resumed allowing the exercise of employee stock options byemployees and the settlement of restricted stock units on October 31, 2007. The purchase of shares under the ESPP was not resumed asthe plan was discontinued during the first quarter of Fiscal 2009.
Investment and Other Income, net
The table below provides a detailed presentation of investment and other income, net for Fiscal 2009, 2008, and 2007.
January 30,2009
February 1,2008
February 2,2007
Fiscal Year Ended
(in millions)Investment and other income, net:
Investment income, primarily interest . . . . . . . . . . . . . . . . . . . . . . . . . . $ 180 $ 496 $ 368
(Losses) gains on investments, net . . . . . . . . . . . . . . . . . . . . . . . . . . . . (10) 14 (5)
Interest expense . . . . . . . . . . . . . . . . . . . . . . . . . . . . . . . . . . . . . . . . . . (93) (45) (45)
CIT minority interest . . . . . . . . . . . . . . . . . . . . . . . . . . . . . . . . . . . . . . - (29) (23)
Foreign exchange . . . . . . . . . . . . . . . . . . . . . . . . . . . . . . . . . . . . . . . . . 115 (30) (37)
Gain on sale of building . . . . . . . . . . . . . . . . . . . . . . . . . . . . . . . . . . . . - - 36
Other . . . . . . . . . . . . . . . . . . . . . . . . . . . . . . . . . . . . . . . . . . . . . . . . . . (58) (19) (19)
Investment and other income, net . . . . . . . . . . . . . . . . . . . . . . . . . . . . . . . $ 134 $ 387 $ 275
The year-over-year decrease in investment income for the fiscal year ended January 30, 2009, is primarily due to decreased interest rateson lower average investment balances. Gain (losses) on investments decreased for Fiscal 2009 as compared to Fiscal 2008, primarily dueto a $11 million loss recorded for other-than-temporarily impaired investments during Fiscal 2009 based on a review of factors consistentwith those disclosed in Note 2 of Notes to Consolidated Financial Statements included “Part II — Item 8 — Financial Statements andSupplementary Data” and due to sales of securities during Fiscal 2008. We continue to monitor our investment portfolio and take steps tomitigate impacts from the current volatility in the capital markets. The year-over-year increase in interest expense is attributable tointerest on the $1.5 billion debt issued in the first quarter of Fiscal 2009. CIT minority interest was eliminated due to our purchase of CITGroup Inc.’s (“CIT”) 30% interest in Dell Financial Services L.L.C. (“DFS”) during the fourth quarter of Fiscal 2008. Foreign exchangeincreased year-over-year for Fiscal 2009 due to gains realized on our hedge program. During Fiscal 2009, we recognized a $35 milliondecline in the fair market value of our investments related to our deferred compensation plan. These expenses are included in Other in thetable above.
In addition to the gains realized from revaluation of our unhedged currencies, the year-over-year increase in foreign exchange for Fiscal2009, as compared to the prior year, is due to a $42 million gain in Fiscal 2009 resulting from the correction of errors in theremeasurement of certain local currency balances to the functional currency in prior periods. A deferred revenue liability was incorrectlyremeasured over time based on changes in currency exchange rates instead of remaining at historical exchange rates. There was also a taxliability incorrectly held at a historical rate instead of being remeasured over time based on changes in currency exchange rates.
The increase in investment income in Fiscal 2008 from Fiscal 2007 is primarily due to earnings on higher average balances of cashequivalents and investments, partially offset by lower interest rates. In Fiscal 2007, investment income increased from the prior yearprimarily due to rising interest rates, partially offset by a decrease in interest income earned on lower average balances of cash equivalentsand investments. The gains in Fiscal 2008 as compared to losses in Fiscal 2007 are mainly the result of sales of securities. The foreign
33

exchange loss in Fiscal 2008 and Fiscal 2007 is mainly due to higher net losses on derivative instruments. The gain on sale of buildingrelates to the sale of a building in EMEA.
Income Taxes
Our effective tax rate was 25.4%, 23.0%, and 22.8% for Fiscal 2009, 2008, and 2007, respectively. The differences between our effectivetax rate and the U.S. federal statutory rate of 35% principally result from our geographical distribution of taxable income and permanentdifferences between the book and tax treatment of certain items. The increase in our effective income tax rate for Fiscal 2009 from Fiscal2008 is primarily due to an increased mix of profits in higher tax rate jurisdictions. In the fourth quarter of Fiscal 2008, we were able toaccess $5.3 billion in cash from a subsidiary outside of the U.S. to fund share repurchases, acquisitions, and the continued growth of DFS.Accessing the cash slightly increased our effective tax rate in Fiscal 2008. The taxes related to accessing the foreign cash andnondeductibility of the in-process research and development acquisition charges were offset primarily by the increase of our consolidatedprofitability in lower tax rate jurisdictions during Fiscal 2008. Our foreign earnings are generally taxed at lower rates than in the UnitedStates. We do not expect our Fiscal 2010 effective tax rate to vary significantly from our Fiscal 2009 effective tax rate.
Deferred tax assets and liabilities for the estimated tax impact of temporary differences between the tax and book basis of assets andliabilities are recognized based on the enacted statutory tax rates for the year in which we expect the differences to reverse. A valuationallowance is established against a deferred tax asset when it is more likely than not that the asset or any portion thereof will not berealized. Based upon all the available evidence including expectation of future taxable income, we have determined that we will be able torealize all of our deferred tax assets, net of valuation allowances.
We adopted Financial Accounting Standards Board (FASB) Interpretation No. 48, Accounting for Uncertainty in Income Taxes — anInterpretation of FASB Statement No. 109 (“FIN 48”) effective February 3, 2007. FIN 48 clarifies the accounting and reporting foruncertainties in income taxes recognized in our financial statements in accordance with SFAS 109, Accounting for Income Taxes(“SFAS 109”). FIN 48 prescribes a comprehensive model for the financial statement recognition, measurement, presentation, anddisclosure of uncertain tax positions taken or expected to be taken in income tax returns. FIN 48 provides that a tax benefit from anuncertain tax position may be recognized in the financial statements only when it is more likely than not that the position will be sustainedupon examination, including resolution of any related appeals or litigation processes, based on the technical merits and a consideration ofthe relevant taxing authority’s widely understood administrative practices and precedents. Once the recognition threshold is met, theportion of the tax benefit that is recorded represents the largest amount of tax benefit that is greater than 50 percent likely to be realizedupon settlement with a taxing authority. The adoption of FIN 48 resulted in a decrease to stockholders’ equity of approximately$62 million in the first quarter of Fiscal 2008. For a further discussion of the impact of FIN 48, see Note 3 of Notes to ConsolidatedFinancial Statements included in “Part II — Item 8 — Financial Statements and Supplementary Data.”
We are currently under income tax audits in various jurisdictions, including the United States. The tax periods open to examination by themajor taxing jurisdictions to which we are subject include fiscal years 1997 through 2009. As a result of these audits, we maintainongoing discussions and negotiations relating to tax matters with the taxing authorities in these various jurisdictions. Our U.S. Federalincome tax returns for fiscal years 2004 through 2006 are under examination, and the Internal Revenue Service has proposed certainpreliminary assessments primarily related to transfer pricing matters. We anticipate this audit will take several years to resolve andcontinue to believe that we have provided adequate reserves related to the matters under audit. However, should we experience anunfavorable outcome in this matter, it could have a material impact on our financial statements. Although the timing of income tax auditresolution and negotiations with taxing authorities are highly uncertain, we do not anticipate a significant change to the total amount ofunrecognized income tax benefits within the next 12 months.
We take certain non-income tax positions in the jurisdictions in which we operate and have received certain non-income tax assessmentsfrom various jurisdictions. We are also involved in related non-income tax litigation matters in various jurisdictions. We believe ourpositions are supportable, a liability is not probable, and that we will ultimately prevail. However, significant judgment is required indetermining the ultimate outcome of these matters. In the normal course of business, our positions and conclusions related to our non-income taxes could be challenged and assessments may be made. To the extent new information is obtained and our views on ourpositions, probable outcomes of assessments, or litigation changes, changes in estimates to our accrued liabilities would be recorded inthe period in which the determination is made.
Out of Period Adjustments
During Fiscal 2009, adjustments to correct items related to prior periods, in the aggregate, increased income before taxes and net incomeby approximately $95 million and $33 million, respectively. Because these errors, both individually and in the aggregate, were not
34
material to any of the prior years’ financial statements and the impact of correcting these errors in the current year is not material to thefull year Fiscal 2009 Consolidated Financial Statements, we recorded the correction of these errors in the Fiscal 2009 ConsolidatedFinancial Statements.
Accounts Receivable
We sell products and services directly to customers and through a variety of sales channels, including retail distribution. At January 30,2009, our gross accounts receivable balance was $4.8 billion, a 20% decrease from our balance at February 1, 2008. This decrease inaccounts receivable was due to lower sales in the second half of Fiscal 2009 as compared to the prior year. We maintain an allowance fordoubtful accounts to cover receivables that may be deemed uncollectible. The allowance for losses is based on specific identifiablecustomer accounts that are deemed at risk and general historical bad debt experience. As of January 30, 2009 and February 1, 2008, theallowance for doubtful accounts was $112 million and $103 million, respectively. Based on our assessment, we believe we are adequatelyreserved for expected credit losses. We monitor the aging of our accounts receivable and have taken actions in Fiscal 2009 to reduce ourexposure to credit losses, including tightening our credit granting practices.
Financing Receivables
At January 30, 2009 and February 1, 2008, our net financing receivables balance was $2.2 billion and $2.1 billion respectively. Theincrease in financing receivables is primarily attributable to an increase in our investment in retained interest, partially offset by adecrease in gross revolving loan receivables. Retained interest increased $173 million from our balance at February 1, 2008, due to amodification to one of our securitization agreements, resulting in a scheduled amortization of the transaction. During the scheduledamortization period, additional purchases made on existing securitized revolving loans are transferred to the qualified special purposeentity, which increased our retained interest balance. See Off-Balance Sheet Arrangements for additional information.
Gross revolving loan receivables decreased $100 million from our balance at February 1, 2008, due to a reduction in the amount ofpromotional receivables. From time to time, we offer certain customers with the opportunity to finance their Dell purchases with specialprograms during which, if the outstanding balance is paid in full, no interest is charged. During Fiscal 2009, we reduced our promotionalofferings. Promotional receivables were $352 million and $668 million, at January 30, 2009, and February 1, 2008, respectively.
We expect growth in financing receivables throughout Fiscal 2010. To manage this growth, we will continue to balance the use of our ownworking capital and other sources of liquidity. The key decision factors in the funding decision are the cost of funds, required creditenhancements for receivables sold to the conduits, and the ability to access the capital markets. See Note 6 of Notes to ConsolidatedFinancial Statements included in “Part II — Item 8 — Financial Statements and Supplementary Data” for additional information aboutour financing receivables.
We maintain an allowance to cover financing receivable credit losses. Consistent with trends in the financial services industry, duringFiscal 2009 and Fiscal 2008, we experienced year-over-year increased financing receivable credit losses. Net principal charge-offs forFiscal 2009 and Fiscal 2008 were $86 million and $40 million, respectively. These amounts represent 5.5% and 2.7% of the averageoutstanding customer financing receivable balance (including accrued interest) for the respective years. We have taken underwritingactions to limit our exposure to losses, including reducing our credit approval rate. We continue to assess our portfolio risk and takeadditional underwriting actions as we deem necessary. Our estimate of subprime customer receivables was approximately 20% of thegross customer receivable balance at January 30, 2009, and February 1, 2008.
The allowance for losses is determined based on various factors, including historical and anticipated experience, past due receivables,receivable type, and customer risk profile. Substantial changes in the economic environment or any of the factors mentioned above couldchange the expectation of anticipated credit losses. As of January 30, 2009, and February 1, 2008, the allowance for financing receivablelosses was $149 million and $96 million, respectively. A 10% change in this allowance would not be material to our consolidated results.Based on our assessment of the customer financing receivables and the associated risks, we believe that we are adequately reserved.
See Note 6 of Notes to Consolidated Financial Statements included in “Part II — Item 8 — Financial Statements and SupplementaryData” for additional information.
35

Current Market Conditions
In connection with the weakened global economic conditions, during Fiscal 2009, we took the following actions to manage our risks:
• Diversified financial partner exposure.
• Monitored the financial health of our supplier base.
• Tightened requirements for customer credit.
• Monitored the risk concentration of our cash and cash equivalents balance.
• Continued to monitor our balance sheet exposure, primarily trade accounts receivable and financing receivables, to ensure that we donot have significant concentrations of risk with any single customer or industry group. As of January 30, 2009, no single industrygroup or specific customer represented more than 10% of our trade accounts or financing receivables balance.
• Updated our second quarter analysis of potential triggering events for goodwill and intangible asset impairment in the fourth quarterof Fiscal 2009. Based on this analysis, we concluded that there was no evidence that would indicate an impairment of goodwill orintangible assets.
• Changed our investment strategy to hold securities with shorter durations.
• Continued to monitor the effectiveness of our foreign currency hedging program.
We monitor credit risk associated with our financial counterparties using various market credit risk indicators such as reviews and actionstaken by rating agencies and changes in credit default swap levels. We perform periodic evaluations of our positions with thesecounterparties and may limit the amount of agreements or contracts entered into with any one counterparty in accordance with ourpolicies. We do not anticipate non-performance by any counterparty. We believe that no significant concentration of credit risk forinvestments exists. The impact on the financial statements of any credit adjustments related to these counterparties has been immaterial.
Market Risk
We are exposed to a variety of risks, including foreign currency exchange rate fluctuations and changes in the market value of ourinvestments. In the normal course of business, we employ established policies and procedures to manage these risks.
Foreign Currency Hedging Activities
Our objective in managing our exposures to foreign currency exchange rate fluctuations is to reduce the impact of adverse fluctuations onearnings and cash flows associated with foreign currency exchange rate changes. Accordingly, we utilize foreign currency optioncontracts and forward contracts to hedge our exposure on forecasted transactions and firm commitments in more than 20 currencies inwhich we transact business. Our exposure to foreign currency movements is comprised of certain principal currencies. During Fiscal2009, these principal currencies were the Euro, British Pound, Japanese Yen, Canadian Dollar, and Australian Dollar. We monitor ourforeign currency exchange exposures to ensure the overall effectiveness of our foreign currency hedge positions. However, there can beno assurance that our foreign currency hedging activities will continue to substantially offset the impact of fluctuations in currencyexchange rates on our results of operations and financial position in the future. During Fiscal 2009, the U.S. dollar strengthened relative tothe other principal currencies in which we transact business with the exception of the Japanese Yen. However, we manage our business ona U.S. dollar basis, and as a result of our comprehensive hedging program, foreign currency fluctuations did not have a significant impacton our consolidated results of operations.
Based on our foreign currency cash flow hedge instruments outstanding at January 30, 2009, and February 1, 2008, we estimate amaximum potential one-day loss in fair value of approximately $393 million and $57 million, respectively, using a Value-at-Risk(“VAR”) model. By using market implied rates and incorporating volatility and correlation among the currencies of a portfolio, the VARmodel simulates three thousand randomly generated market prices and calculates the difference between the fifth percentile and theaverage as the Value-at-Risk. In Fiscal 2009, both higher volatility and correlation increased the VAR significantly. Forecastedtransactions, firm commitments, fair value hedge instruments, and accounts receivable and payable denominated in foreign currencieswere excluded from the model. The VAR model is a risk estimation tool, and as such, is not intended to represent actual losses in fairvalue that will be incurred. Additionally, as we utilize foreign currency instruments for hedging forecasted and firmly committedtransactions, a loss in fair value for those instruments is generally offset by increases in the value of the underlying exposure.
36

Cash and Investments
At January 30, 2009, we had $9.5 billion of total cash, cash equivalents, and investments. The objective of our investment policy andstrategy is to manage our total cash and investments balances to preserve principal and maintain liquidity while maximizing the return onthe investment portfolio through the full investment of available funds. We diversify our investment portfolio by investing in multipletypes of investment-grade securities and through the use of third-party investment managers.
Of the $9.5 billion, $8.4 billion is classified as cash and cash equivalents. Our cash equivalents primarily consist of money market funds.Due to the nature of these investments, we consider it reasonable to expect that they will not be significantly impacted by a change ininterest rates, and that these investments can be liquidated for cash at short notice. As of January 30, 2009, our cash equivalents are atcarrying value.
The remaining $1.1 billion is primarily invested in fixed income securities including government, agency, asset-backed, mortgage-backed and corporate debt securities of varying maturities at the date of acquisition. The fair value of our portfolio is affected primarilyby interest rates more so than by the credit and liquidity issues currently facing the capital markets. We attempt to mitigate these risks byinvesting primarily in high credit quality securities with AAA and AA ratings and short-term securities with an A-1 rating, limiting theamount that can be invested in any single issuer, and by investing in short to intermediate term investments whose market value is lesssensitive to interest rate changes. As of January 30, 2009, and February 1, 2008, we did not hold any auction rate securities. Our exposureto asset and mortgage backed securities is less than 1% of the value of the portfolio. The total carrying value of investments in asset-backed and mortgage-backed debt securities was approximately $54 million and $550 million at January 30, 2009, and February 1, 2008,respectively. Based on our investment portfolio and interest rates at January 30, 2009, a 100 basis point increase or decrease in interestrates would result in a decrease or increase of approximately $5 million in the fair value of the investment portfolio.
We periodically review our investment portfolio to determine if any investment is other-than-temporarily impaired due to changes incredit risk or other potential valuation concerns. At January 30, 2009, our portfolio included securities with unrealized losses totaling$10 million, which have been recorded in other comprehensive income (loss), as we believe the investments are not other-than-tem-porarily impaired. While these available-for-sale securities have market values below cost, we believe it is probable that the principal andinterest will be collected in accordance with the contractual terms, and that the decline in the market value is primarily due to changes ininterest rates and not increased credit risk.
During Fiscal 2009, we recorded an $11 million other-than-temporary impairment loss based on a review of factors consistent with thosedisclosed in Note 2 of Notes to Consolidated Financial Statements included in “Part II — Item 8 — Financial Statements andSupplementary Data.” Factors considered in determining whether a loss is other-than-temporary include the length of time and extentto which fair value has been less than the cost basis, the financial condition and near-term prospects of the investee, previously recordedother-than-temporary impairment charges, and our intent and ability to hold the investment for a period of time sufficient to allow for anyanticipated recovery in market value. The investments other-than-temporarily impaired during Fiscal 2009 were asset-backed securitiesand were impaired due to severe price degradation or price degradation over an extended period of time, rise in delinquency rates andgeneral credit enhancement declines.
The fair value of our portfolio is based on prices provided from national pricing services, which we currently believe are indicative of fairvalue as our assessment is that the inputs are market observable. We will continue to evaluate whether the inputs are market observable inaccordance with SFAS No. 157, Fair Value Measurements (“SFAS 157”). We conduct reviews on a quarterly basis to verify pricing,assess liquidity, and determine if significant inputs have changed that would impact our SFAS 157 disclosures.
37
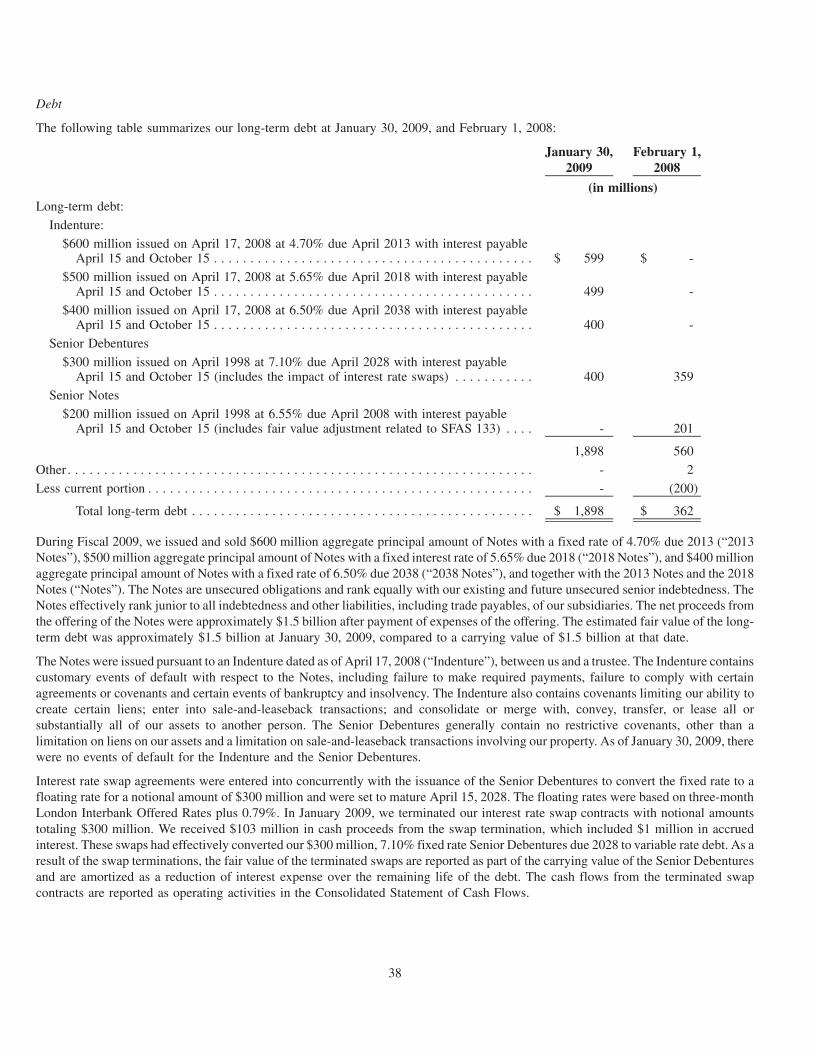
Debt
The following table summarizes our long-term debt at January 30, 2009, and February 1, 2008:
January 30,2009
February 1,2008
(in millions)Long-term debt:
Indenture:
$600 million issued on April 17, 2008 at 4.70% due April 2013 with interest payableApril 15 and October 15 . . . . . . . . . . . . . . . . . . . . . . . . . . . . . . . . . . . . . . . . . . . . $ 599 $ -
$500 million issued on April 17, 2008 at 5.65% due April 2018 with interest payableApril 15 and October 15 . . . . . . . . . . . . . . . . . . . . . . . . . . . . . . . . . . . . . . . . . . . . 499 -
$400 million issued on April 17, 2008 at 6.50% due April 2038 with interest payableApril 15 and October 15 . . . . . . . . . . . . . . . . . . . . . . . . . . . . . . . . . . . . . . . . . . . . 400 -
Senior Debentures
$300 million issued on April 1998 at 7.10% due April 2028 with interest payableApril 15 and October 15 (includes the impact of interest rate swaps) . . . . . . . . . . . 400 359
Senior Notes
$200 million issued on April 1998 at 6.55% due April 2008 with interest payableApril 15 and October 15 (includes fair value adjustment related to SFAS 133) . . . . - 201
1,898 560
Other . . . . . . . . . . . . . . . . . . . . . . . . . . . . . . . . . . . . . . . . . . . . . . . . . . . . . . . . . . . . . . . . - 2
Less current portion . . . . . . . . . . . . . . . . . . . . . . . . . . . . . . . . . . . . . . . . . . . . . . . . . . . . . - (200)
Total long-term debt . . . . . . . . . . . . . . . . . . . . . . . . . . . . . . . . . . . . . . . . . . . . . . . $ 1,898 $ 362
During Fiscal 2009, we issued and sold $600 million aggregate principal amount of Notes with a fixed rate of 4.70% due 2013 (“2013Notes”), $500 million aggregate principal amount of Notes with a fixed interest rate of 5.65% due 2018 (“2018 Notes”), and $400 millionaggregate principal amount of Notes with a fixed rate of 6.50% due 2038 (“2038 Notes”), and together with the 2013 Notes and the 2018Notes (“Notes”). The Notes are unsecured obligations and rank equally with our existing and future unsecured senior indebtedness. TheNotes effectively rank junior to all indebtedness and other liabilities, including trade payables, of our subsidiaries. The net proceeds fromthe offering of the Notes were approximately $1.5 billion after payment of expenses of the offering. The estimated fair value of the long-term debt was approximately $1.5 billion at January 30, 2009, compared to a carrying value of $1.5 billion at that date.
The Notes were issued pursuant to an Indenture dated as of April 17, 2008 (“Indenture”), between us and a trustee. The Indenture containscustomary events of default with respect to the Notes, including failure to make required payments, failure to comply with certainagreements or covenants and certain events of bankruptcy and insolvency. The Indenture also contains covenants limiting our ability tocreate certain liens; enter into sale-and-leaseback transactions; and consolidate or merge with, convey, transfer, or lease all orsubstantially all of our assets to another person. The Senior Debentures generally contain no restrictive covenants, other than alimitation on liens on our assets and a limitation on sale-and-leaseback transactions involving our property. As of January 30, 2009, therewere no events of default for the Indenture and the Senior Debentures.
Interest rate swap agreements were entered into concurrently with the issuance of the Senior Debentures to convert the fixed rate to afloating rate for a notional amount of $300 million and were set to mature April 15, 2028. The floating rates were based on three-monthLondon Interbank Offered Rates plus 0.79%. In January 2009, we terminated our interest rate swap contracts with notional amountstotaling $300 million. We received $103 million in cash proceeds from the swap termination, which included $1 million in accruedinterest. These swaps had effectively converted our $300 million, 7.10% fixed rate Senior Debentures due 2028 to variable rate debt. As aresult of the swap terminations, the fair value of the terminated swaps are reported as part of the carrying value of the Senior Debenturesand are amortized as a reduction of interest expense over the remaining life of the debt. The cash flows from the terminated swapcontracts are reported as operating activities in the Consolidated Statement of Cash Flows.
38

Our effective interest rate for the Senior Debentures was 4.57% for Fiscal 2009. The principal amount of the debt was $300 million atJanuary 30, 2009. The estimated fair value of the long-term debt was approximately $294 million at January 30, 2009, compared to acarrying value of $400 million at that date as a result of the termination of the interest rate swap agreements.
Prior to the termination of the interest rate swap contracts, the interest rate swaps qualified for hedge accounting treatment pursuant toSFAS No. 133, Accounting for Derivative Instruments and Hedging Activities, as amended. We designated the issuance of the SeniorDebentures and the related interest rate swap agreements as an integrated transaction. The changes in the fair value of the interest rateswap were reflected in the carrying value of the interest rate swaps on the balance sheet. The carrying value of the debt on the balancesheet was adjusted by an equal and offsetting amount. The differential to be paid or received on the interest rate swap agreements wasaccrued and recognized as an adjustment to interest expense as interest rates changed.
On April 15, 2008, we repaid the principal balance of the 1998 $200 million 6.55% fixed rate senior notes (the “Senior Notes”) upon theirmaturity. Interest rate swap agreements related to the Senior Notes had a notional amount of $200 million and also matured April 15,2008. Our effective interest rate for the Senior Notes, prior to repayment, was 4.03% for the first quarter of Fiscal 2009.
As of January 30, 2009, we have a $1.5 billion commercial paper program with a supporting $1.5 billion senior unsecured revolvingcredit facility. This program allows us to obtain favorable short-term borrowing rates. At January 30, 2009, $100 million was outstandingunder the program, and the weighted-average interest rate on those outstanding short-term borrowings was 0.19%. There were nooutstanding advances under the commercial paper program at February 1, 2008. We use the proceeds of the program and facility forshort-term liquidity purposes and believe we will be able to access the capital markets to meet these needs.
The credit facility requires compliance with conditions that must be satisfied prior to any borrowing, as well as ongoing compliance withspecified affirmative and negative covenants, including maintenance of a minimum interest coverage ratio. Amounts outstanding underthe facility may be accelerated for typical defaults, including failure to pay principal or interest, breaches of covenants, non-payment ofjudgments or debt obligations in excess of $200 million, occurrence of a change of control, and certain bankruptcy events. There were noevents of default as of January 30, 2009. On April 3, 2009, $500 million of the credit facility expires, and the remainder expires June 1,2011. We intend to have a new $500 million credit facility in place prior to the expiration of the current facility on April 3, 2009.
Standard and Poor’s Rating Services, Moody’s Investors Services and Fitch Ratings currently rate our senior unsecured long-term debtA�, A2, and A, and our short-term debt A-1, P-1, and F1, respectively. These rating agencies use proprietary and independent methods ofevaluating our credit risk. Factors used when determining our rating include, but are not limited to, publicly available information,industry trends and ongoing discussions between the company and the agencies. We are not aware of any planned changes to ourcorporate credit ratings by the rating agencies. However, in the event our rating was downgraded, our cost to borrow under the terms ofthe credit facility would increase. Also, a downgrade in our credit rating could increase our borrowing costs and may limit our ability toissue commercial paper or additional term debt.
Off-Balance Sheet Arrangements
Asset Securitization — During Fiscal 2009, we continued to transfer customer financing receivables to unconsolidated qualifying specialpurpose entities. The qualifying special purpose entities are bankruptcy remote legal entities with assets and liabilities separate fromours. The purpose of the qualifying special purpose entities is to facilitate the funding of customer receivables in the capital markets. Ourunconsolidated qualifying special purpose entities have entered into financing arrangements with three multi-seller conduits that, in turn,issue asset-backed debt securities in the capital markets. Two of the three conduits fund fixed-term leases and loans, and one conduitfunds revolving loans. During Fiscal 2009 and Fiscal 2008, we transferred $1.4 billion and $1.2 billion, respectively, of customerreceivables to unconsolidated qualifying special purpose entities. The principal balance of the securitized receivables at January 30,2009, and February 1, 2008, was $1.4 billion and $1.2 billion, respectively.
Certain transfers are accounted for as a sale in accordance with SFAS No. 140, Accounting for Transfers and Servicing of FinancialAssets and Extinguishment of Liabilities, (“SFAS 140”). Upon the sale of the customer receivables to qualifying special purpose entities,we recognize a gain on the sale and retain an interest in the assets sold. We provide credit enhancement to the securitization in the form ofover-collateralization. Receivables transferred to the qualified special purpose entities exceed the level of debt issued. We retain the rightto receive collections for assets securitized exceeding the amount required to pay interest, principal, and other fees and expenses (referredto as retained interest). Retained interest is included in Financing Receivables on the balance sheet. At January 30, 2009, and February 1,2008, our retained interest in securitized receivables was $396 million and $223 million, respectively. Our risk of loss related tosecuritized receivables is limited to the amount of our retained interest.
39
Our retained interest in the securitizations is determined by calculating the present value of excess cash flows over the expected durationof the transactions. In estimating the value of the retained interest, we make a variety of financial assumptions, including pool creditlosses, payment rates, and discount rates. These assumptions are supported by both our historical experience and anticipated trendsrelative to the particular receivable pool. The weighted average assumptions for valuing retained interest can be affected by the manyfactors, including the type of assets (revolving versus fixed), repayment terms, and the credit quality of assets being securitized. Wereview our investments in retained interest periodically for impairment, based on estimated fair values. All gains and losses arerecognized in income immediately. Retained interest balances and assumptions are disclosed in Note 6 of Notes to ConsolidatedFinancial Statements included in “Part II — Item 8 — Financial Statements and Supplementary Data.”
We service securitized contracts and earn a servicing fee. Our securitization transactions generally do not result in servicing assets andliabilities, as the contractual fees are adequate compensation in relation to the associated servicing cost.
During Fiscal 2009, the disruption in the debt and capital markets resulted in reduced liquidity and increased costs for funding of financialassets. Due to the proposed increase to the cost structure in our revolving credit conduit, we elected not to extend the terms of theagreement. This resulted in a scheduled amortization of the transaction. During this scheduled amortization period, no new debt will beissued and all principal collections will be used to pay down the outstanding debt amount related to the securitized assets. Our right toreceive cash collections is delayed until the debt is fully paid off.
During the scheduled amortization period, no transfers of new revolving loans will occur. Additional purchases made on existingsecuritized revolving loans (repeat purchases) will continue to be transferred to the qualified special purpose entity, which will increaseour retained interest on the balance sheet.
We will be required to consolidate the assets and liabilities relating to the revolving securitization transaction on our balance sheet oncethe amount of beneficial interest in the revolving credit conduit owned by third parties falls below 10%. We expect the securitizationtransaction related to revolving receivables to terminate completely in Fiscal 2010. The impact to our balance sheet is anticipated to beimmaterial. Our fixed-term lease and loan securitization programs will be up for renewal in Fiscal 2010. We expect to renew thesefacilities. As we negotiate these annual renewals, management will continue to assess the costs and benefits of using securitization tofund our receivables. We expect to be able to continue to offer or arrange financing for our customers, despite our reduced reliance onsecuritization as a means of funding receivables.
All of our securitization programs contain standard structural features related to the performance of the securitized receivables. Thesestructural features include defined credit losses, delinquencies, average credit scores, and excess collections above or below specifiedlevels. In the event one or more of these features are met and we are unable to restructure the program, no further funding of receivableswill be permitted, and the timing of expected retained interest cash flows will be delayed, which would impact the valuation of ourretained interest. Should these events occur, we do not expect a material adverse affect on the valuation of the retained interest.
Liquidity, Capital Commitments, and Contractual Cash Obligations
Liquidity
Our cash balances are held in numerous locations throughout the world, including substantial amounts held outside of the U.S.; however,the majority of our cash and investments that are located outside of the U.S. are denominated in the U.S. dollar. Most of the amounts heldoutside of the U.S. could be repatriated to the U.S., but under current law, would be subject to U.S. federal income taxes, less applicableforeign tax credits. In some countries, repatriation of certain foreign balances is restricted by local laws. We have provided for theU.S. federal tax liability on these amounts for financial statement purposes, except for foreign earnings that are considered indefinitelyreinvested outside of the U.S. Repatriation could result in additional U.S. federal income tax payments. We utilize a variety of taxplanning and financing strategies with the objective of having our worldwide cash available in the locations in which it is needed.
We have an active working capital management team that monitors the efficiency of our balance sheet by evaluating liquidity undervarious macroeconomic and competitive scenarios. These scenarios quantify risks to the financial statements and provide a basis foractions necessary to ensure adequate liquidity. We took a number of actions during Fiscal 2009 to improve short- and long-term liquidity.We have reprioritized capital expenditures and other discretionary spending. The movement of some of our manufacturing operations tothird party manufacturers and the associated closure of several of our manufacturing facilities has reduced the amount of capital requiredfor our business. Also, during the second half of Fiscal 2009, we slowed our share repurchases. We remained active in the commercialpaper market by issuing short-term borrowings with maturities extending into Fiscal 2010. We also increased the size of our commercialpaper program and supporting senior unsecured revolving credit facility by $500 million to $1.5 billion in April 2008. On April 3, 2009,$500 million of the credit facility will expire, and the remainder will expire June 1, 2011. We intend to have a new $500 million credit
40

facility in place prior to the expiration of the current facility on April 3, 2009. In November 2008, we filed a shelf registration statementwith the SEC, which provides us with the ability to issue additional term debt, subject to market conditions. We intend to establish theappropriate debt levels based upon cash flow expectations, the overall cost of capital, cash requirements for operations, and discretionaryspending — including items such as share repurchases, funding customer receivables, and acquisitions. Depending on our requirementsand market conditions, we may access the capital markets under our debt shelf registration statement that became effective in November2008. We do not believe that the overall credit concerns in the markets would impede our ability to access the capital markets in the futurebecause of the overall strength of our financial position.
The following table summarizes our ending cash, cash equivalents, and investments balances:
January 30,2009
February 1,2008
Fiscal Year Ended
(in millions)Cash, cash equivalents, and investments:
Cash and cash equivalents . . . . . . . . . . . . . . . . . . . . . . . . . . . . . . . . . . . . . . . . . . . . . . $ 8,352 $ 7,764
Debt securities . . . . . . . . . . . . . . . . . . . . . . . . . . . . . . . . . . . . . . . . . . . . . . . . . . . . . . . 1,079 1,657
Equity and other securities . . . . . . . . . . . . . . . . . . . . . . . . . . . . . . . . . . . . . . . . . . . . . . 115 111
Cash, cash equivalents, and investments . . . . . . . . . . . . . . . . . . . . . . . . . . . . . . . . . . . . . . $ 9,546 $ 9,532
We ended Fiscal 2009 and Fiscal 2008 with $9.5 billion in cash, cash equivalents, and investments. Since February 1, 2008, we have spent$2.9 billion on share repurchases offset primarily by our $1.5 billion debt issuance and $1.9 billion in cash flow from operations. We usecash generated by operations as our primary source of liquidity and believe that internally generated cash flows are sufficient to supportbusiness operations. Over the past year, we have utilized external capital sources to supplement our domestic liquidity to fund a numberof strategic initiatives. We ended the fourth quarter of Fiscal 2009 with a negative cash conversion cycle of 25 days, which is a contractionof 11 days from the fourth quarter of Fiscal 2008. The contraction is due to a decrease in our accounts payable balance, which is primarilydriven by a reduction in purchases related to declining unit volumes. A negative cash conversion cycle combined with a slowdown inrevenue growth could result in cash use in excess of cash generated. Generally, as our growth stabilizes, our cash generation fromoperating activities will improve. For further discussion of the results of our cash conversion cycle, see “Operating Activities” below.
The following table contains a summary of our Consolidated Statements of Cash Flows for the past three fiscal years:
January 30,2009
February 1,2008
February 2,2007
Fiscal Year Ended
(in millions)Net change in cash from:
Operating activities . . . . . . . . . . . . . . . . . . . . . . . . . . . . . . . . . . . . . . . . . . . $ 1,894 $ 3,949 $ 3,969
Investing activities . . . . . . . . . . . . . . . . . . . . . . . . . . . . . . . . . . . . . . . . . . . . 177 (1,763) 1,003
Financing activities . . . . . . . . . . . . . . . . . . . . . . . . . . . . . . . . . . . . . . . . . . . (1,406) (4,120) (2,551)
Effect of exchange rate changes on cash and cash equivalents . . . . . . . . . . . . (77) 152 71
Net increase (decrease) in cash and cash equivalents . . . . . . . . . . . . . . . . . . . . $ 588 $ (1,782) $ 2,492
Operating Activities — Cash flows from operating activities during Fiscal 2009, 2008, and 2007 resulted primarily from net income,which represents our principal source of cash. Cash flows from operating activities were $1.9 billion during Fiscal 2009, compared to$3.9 billion during Fiscal 2008 and $4.0 billion during Fiscal 2007. For Fiscal 2009, the decrease in operating cash flows was primarilyled by the deterioration of our cash conversion cycle, slower growth in deferred service revenue, and a decrease in net income. In Fiscal2008, the slight decrease in operating cash flows was primarily due to changes in working capital slightly offset by an increase in netincome. See discussion of our cash conversion cycle in “Key Performance Metrics” below.
41

Key Performance Metrics — Although our cash conversion cycle deteriorated from February 1, 2008, and February 2, 2007, our directbusiness model allows us to maintain an efficient cash conversion cycle, which compares favorably with that of others in our industry. Asour growth stabilizes, more typical cash generation and a resulting cash conversion cycle are expected to resume.
The following table presents the components of our cash conversion cycle for the fourth quarter of each of the past three fiscal years:
January 30,2009
February 1,2008
February 2,2007
Days of sales outstanding(a) . . . . . . . . . . . . . . . . . . . . . . . . . . . . . . . . . . . 35 36 31
Days of supply in inventory(b) . . . . . . . . . . . . . . . . . . . . . . . . . . . . . . . . . 7 8 5
Days in accounts payable(c) . . . . . . . . . . . . . . . . . . . . . . . . . . . . . . . . . . . (67) (80) (78)
Cash conversion cycle . . . . . . . . . . . . . . . . . . . . . . . . . . . . . . . . . . . . . (25) (36) (42)
(a) Days of sales outstanding (“DSO”) calculates the average collection period of our receivables. DSO is based on the ending net trade receivables and the most recentquarterly revenue for each period. DSO also includes the effect of product costs related to customer shipments not yet recognized as revenue that are classified in othercurrent assets. DSO is calculated by adding accounts receivable, net of allowance for doubtful accounts, and customer shipments in transit and dividing that sum byaverage net revenue per day for the current quarter (90 days). At January 30, 2009, February 1, 2008, and February 2, 2007, DSO and days of customer shipments notyet recognized were 31 and 4 days, 33 and 3 days, and 28 and 3 days, respectively.
(b) Days of supply in inventory (“DSI”) measures the average number of days from procurement to sale of our product. DSI is based on ending inventory and most recentquarterly cost of sales for each period. DSI is calculated by dividing inventory by average cost of goods sold per day for the current quarter (90 days).
(c) Days in accounts payable (“DPO”) calculates the average number of days our payables remain outstanding before payment. DPO is based on ending accounts payableand most recent quarterly cost of sales for each period. DPO is calculated by dividing accounts payable by average cost of goods sold per day for the current quarter(90 days).
Our cash conversion cycle contracted by eleven days at January 30, 2009, from February 1, 2008, driven by a thirteen day decrease inDPO offset by a one day decrease in DSO and a one day decrease in DSI. The decrease in DPO from February 1, 2008, is attributable toprocurement throughput declines as a result of declining demand, reduction in inventory levels, and a decrease in non-production supplierpayables as we continue to control our operating expense spending and the timing of purchases from and payments to suppliers during thefourth quarter of Fiscal 2009 as compared to the fourth quarter of Fiscal 2008. The decrease in DSO from February 1, 2008, is attributableto the timing of revenue due to seasonal impact, partially offset by a shift to customers with longer payment terms.
Our cash conversion cycle contracted by six days at February 1, 2008 compared to February 2, 2007. This deterioration was driven by afive day increase in DSO largely attributed to timing of payments from customers, a continued shift in sales mix from domestic tointernational, and an increased presence in the retail channel. In addition, DSI increased by three days, which was primarily due tostrategic materials purchases. The DSO and DSI declines were offset by a two-day increase in DPO largely attributed to an increase in theamount of strategic material purchases in inventory at the end of Fiscal 2008 and the number of suppliers with extended payment terms ascompared to Fiscal 2007.
We defer the cost of revenue associated with customer shipments not yet recognized as revenue until they are delivered. These deferredcosts are included in our reported DSO because we believe it presents a more accurate presentation of our DSO and cash conversioncycle. These deferred costs are recorded in other current assets in our Consolidated Statements of Financial Position and totaled$556 million, $519 million, and $424 million at January 30, 2009, February 1, 2008, and February 2, 2007, respectively.
Investing Activities — Cash provided by investing activities during Fiscal 2009 was $177 million, as compared to $1.8 billion cash usedby investing activities during Fiscal 2008 and $1.0 billion provided in Fiscal 2007. Cash generated or used in investing activitiesprincipally consists of the net of sales and maturities and purchases of investments; net capital expenditures for property, plant, andequipment; and cash used to fund strategic acquisitions, which was approximately $176 million during Fiscal 2009 compared to$2.2 billion during Fiscal 2008. In light of continued capital market and interest rate volatility, we decided to increase liquidity andchange the overall interest rate profile of the portfolio. As a result, during Fiscal 2009 we began repositioning our investment portfolio toshorter duration securities, thus impacting the volume of our sales and purchases of securities. In Fiscal 2009 as compared to Fiscal 2008,lower cash flow from operating activities and lower yields on investments resulted in lower net proceeds from maturities, sales, andpurchases. In Fiscal 2008 as compared to Fiscal 2007, we re-invested a lower amount of our proceeds from the maturity or sales ofinvestments to build liquidity for share repurchases and for cash payments made in connection with acquisitions.
Financing Activities — Cash used in financing activities during Fiscal 2009 was $1.4 billion, as compared to $4.1 billion in Fiscal 2008and $2.6 billion in Fiscal 2007. Financing activities primarily consist of the repurchase of our common stock, partially offset by proceeds
42

from the issuance of common stock under employee stock plans and other items. The year-over-year decrease in cash used for financingactivities is due primarily to the reduction of our share repurchase program during Fiscal 2009 and by proceeds from the issuance of long-term debt of $1.5 billion. During Fiscal 2009, we repurchased approximately 134 million shares at an aggregate cost of $2.9 billioncompared to approximately 179 million shares at an aggregate cost of $4.0 billion in Fiscal 2008. We also paid the principal on the SeniorNotes of $200 million that matured in April 2008 as discussed in Note 2 of Notes to Consolidated Financial Statements under “Part II —Item 8 — Financial Statements and Supplementary Data.”
In Fiscal 2008, the year-over-year increase in cash used in financing activities was due primarily to the repurchase of our common stockas the temporary suspension of our share repurchase program ended in the fourth quarter of Fiscal 2008. In Fiscal 2008, we repurchasedapproximately 179 million shares at an aggregate cost of $4.0 billion, and during Fiscal 2007, we repurchased approximately 118 millionshares at an aggregate cost of $3.0 billion.
We also have a commercial paper program that allows us to issue short-term unsecured notes in an aggregate amount not to exceed$1.5 billion. We use the proceeds for general corporate purposes. At January 30, 2009, there was $100 million outstanding under thecommercial paper program and no advances under the supporting credit facility. See Note 2 of Notes to Consolidated FinancialStatements under “Part II — Item 8 — Financial Statements and Supplementary Data” for further discussion on our long-term debt andcommercial paper program.
Capital Commitments
Share Repurchase Program — We have a share repurchase program that authorizes us to purchase shares of common stock in order toincrease shareholder value and manage dilution resulting from shares issued under our equity compensation plans. However, we do notcurrently have a policy that requires the repurchase of common stock to offset share-based compensation arrangements.
We typically repurchase shares of common stock through a systematic program of open market purchases. During Fiscal 2009, werepurchased approximately 134 million shares of common stock for an aggregate cost of $2.9 billion. During Fiscal 2008 we repurchasedapproximately 179 million shares at an aggregate cost of $4.0 billion compared to 118 million shares at an aggregate cost of $3.0 billionin Fiscal 2007. For more information regarding share repurchases, see “Part II — Item 5 — Market for Registrant’s Common Equity,Related Stockholder Matters and Issuer Purchases of Equity Securities.”
Capital Expenditures — During Fiscal 2009 and Fiscal 2008, we spent $440 million and $831 million, respectively, on property, plant,and equipment primarily on our global expansion efforts and infrastructure investments in order to support future growth. The significantdecrease in capital expenditures from Fiscal 2008 is primarily due to the completion of facilities related projects during Fiscal 2008 andother cost reduction actions. Product demand, product mix, and the increased use of contract manufacturers, as well as ongoinginvestments in operating and information technology infrastructure, influence the level and prioritization of our capital expenditures.Capital expenditures for Fiscal 2010, related to our continued expansion worldwide, are currently expected to reach approximately$400 million. These expenditures are expected to be funded from our cash flows from operating activities.
Restricted Cash — Pursuant to an agreement between DFS and CIT, we are required to maintain escrow cash accounts that are held asrecourse reserves for credit losses, performance fee deposits related to our private label credit card, and deferred servicing revenue.Restricted cash in the amount of $213 million and $294 million is included in other current assets at January 30, 2009, and February 1,2008, respectively.
43

Contractual Cash Obligations
The following table summarizes our contractual cash obligations at January 30, 2009:
TotalFiscal2010
Fiscal 2011-2012
Fiscal 2013-2014 Beyond
Payments Due by Period
(in millions)Contractual cash obligations:
Debt . . . . . . . . . . . . . . . . . . . . . . . . . . . . . . . . . . . . . . $ 1,797 $ 2 $ - $ 600 $ 1,195
Operating leases . . . . . . . . . . . . . . . . . . . . . . . . . . . . . 458 89 140 76 153
Commercial paper . . . . . . . . . . . . . . . . . . . . . . . . . . . . 100 100 - - -
Advances under credit facilities . . . . . . . . . . . . . . . . . . 12 12 - - -
Purchase obligations . . . . . . . . . . . . . . . . . . . . . . . . . . 787 590 196 1 -
Interest . . . . . . . . . . . . . . . . . . . . . . . . . . . . . . . . . . . . 1,578 104 208 193 1,073
Current portion of uncertain tax positions(a) . . . . . . . . . 6 6 - - -
Contractual cash obligations . . . . . . . . . . . . . . . . . . . . . . $ 4,738 $ 903 $ 544 $ 870 $ 2421
(a) The current portion of uncertain tax positions does not include approximately $1.7 billion in additional liabilities associated with uncertain tax positions that are notexpected to be liquidated in Fiscal 2010. We are unable to reliably estimate the expected payment dates for these additional non-current liabilities.
Debt — At January 30, 2009, we had outstanding $300 million in Senior Debentures with the principal balance due April 15, 2028. Wealso had outstanding $1.5 billion of long-term unsecured notes that were issued on April 17, 2008, in three tranches: $600 millionaggregate principal amount due 2013, $500 million aggregate principal amount due 2018, and $400 million aggregate principal amountdue 2038. Interest is payable semi-annually on April 15 and October 15 for the Senior Debentures and Notes. For additional informationregarding these debt issuances, see Note 2 of Notes to Consolidated Financial Statements included in “Part II — Item 8 — FinancialStatements and Supplementary Data.”
Operating Leases — We lease property and equipment, manufacturing facilities, and office space under non-cancellable leases. Certainof these leases obligate us to pay taxes, maintenance, and repair costs.
Commercial Paper — We have a commercial paper program that allows us to issue short-term unsecured notes in an aggregate amountnot to exceed $1.5 billion. We use the proceeds for general corporate purposes. At January 30, 2009, there was $100 million outstandingunder the commercial paper program and no advances under the supporting credit facility. See Note 2 of Notes to Consolidated FinancialStatements under “Part II — Item 8 — Financial Statements and Supplementary Data” for further discussion of our commercial paperprogram.
Advances Under Credit Facilities — Dell India Pvt Ltd., our wholly-owned subsidiary, maintains unsecured short-term credit facilitieswith Citibank N.A. Bangalore Branch India (“Citibank India”) that provide a maximum capacity of $30 million to fund Dell India’sworking capital and import buyers’ credit needs. Financing is available in both Indian Rupees and foreign currencies. The borrowings areextended on an unsecured basis based on our guarantee to Citibank N.A. Citibank India can cancel the facilities in whole or in partwithout prior notice, at which time any amounts owed under the facilities will become immediately due and payable. Interest on theoutstanding loans is charged monthly and is calculated based on Citibank India’s internal cost of funds plus 0.25%. At January 30, 2009,and February 1, 2008, outstanding advances from Citibank India totaled $12 million and $23 million, respectively, which are included inshort-term borrowings on our Consolidated Statement of Financial Position. There have been no events of default.
Purchase Obligations — Purchase obligations are defined as contractual obligations to purchase goods or services that are enforceableand legally binding on us. These obligations specify all significant terms, including fixed or minimum quantities to be purchased; fixed,minimum, or variable price provisions; and the approximate timing of the transaction. Purchase obligations do not include contracts thatmay be cancelled without penalty.
We utilize several suppliers to manufacture sub-assemblies for our products. Our efficient supply chain management allows us to enterinto flexible and mutually beneficial purchase arrangements with our suppliers in order to minimize inventory risk. Consistent withindustry practice, we acquire raw materials or other goods and services, including product components, by issuing to suppliersauthorizations to purchase based on our projected demand and manufacturing needs. These purchase orders are typically fulfilled within
44
30 days and are entered into during the ordinary course of business in order to establish best pricing and continuity of supply for ourproduction. Purchase orders are not included in the table above as they typically represent our authorization to purchase rather thanbinding purchase obligations.
Purchase obligations decreased to approximately $787 million at January 30, 2009, from $893 million at February 1, 2008. The decreaseis primarily due to the fulfillment of commitments to purchase key components and services partially offset by the renewal of or enteringinto new purchase contracts.
Interest — See Note 2 of Notes to the Consolidated Financial Statements included in “Part II — Item 8 — Financial Statements andSupplementary Data” for further discussion of our debt and related interest expense.
Risk Factors Affecting Our Business and Prospects
There are numerous risk factors that affect our business and the results of our operations. Some of these risks are beyond our control.These risk factors include:
• weakening global economic conditions and instability in financial markets;• strong competition;• our ability to generate substantial non-U.S. net revenue;• our ability to accurately predict product, customer, and geographic sales mix and seasonal sales trends;• information technology and manufacturing infrastructure failures;• our ability to effectively manage periodic product transitions;• our ability to successfully transform our sales capabilities and add to our product and service offerings;• disruptions in component or product availability;• our reliance on vendors;• our reliance on third-party suppliers for quality product components, including reliance on several single-sourced or limited-sourced
suppliers;• our ability to access the capital markets;• risks relating to our internal controls;• unfavorable results of legal proceedings;• our acquisition of other companies;• our ability to properly manage the distribution of our products and services;• our cost cutting measures;• effective hedging of our exposure to fluctuations in foreign currency exchange rates and interest rates;• risks related to counterparty default;• obtaining licenses to intellectual property developed by others on commercially reasonable and competitive terms;• our ability to attract, retain, and motivate key personnel;• loss of government contracts;• expiration of tax holidays or favorable tax rate structures or unfavorable outcomes in tax compliance and regulatory matters;• changing environmental laws; and• the effect of armed hostilities, terrorism, natural disasters, and public health issues.
For a discussion of these risk factors affecting our business and prospects, see “Part I — Item 1A — Risk Factors.”
Critical Accounting Policies
We prepare our financial statements in conformity with accounting principles generally accepted in the United States of America(“GAAP”). The preparation of financial statements in accordance with GAAP requires certain estimates, assumptions, and judgments tobe made that may affect our Consolidated Statement of Financial Position and Consolidated Statement of Income. We believe our mostcritical accounting policies relate to revenue recognition, business combinations, warranty accruals, income taxes, stock-basedcompensation, and loss contingencies. We have discussed the development, selection, and disclosure of our critical accounting policieswith the Audit Committee of our Board of Directors. These critical accounting policies and our other accounting policies are alsodescribed in Note 1 of Notes to Consolidated Financial Statements included in “Part II — Item 8 — Financial Statements andSupplementary Data.”
45

Revenue Recognition and Related Allowances — We frequently enter into sales arrangements with customers that contain multipleelements or deliverables such as hardware, software, peripherals, and services. Judgments and estimates are necessary to ensurecompliance with GAAP. These judgments relate to the allocation of the proceeds received from an arrangement to the multiple elements,the determination of whether any undelivered elements are essential to the functionality of the delivered elements, and the appropriatetiming of revenue recognition. We offer extended warranty and service contracts to customers that extend and/or enhance the technicalsupport, parts, and labor coverage offered as part of the base warranty included with the product. Revenue from extended warranty andservice contracts, for which we are obligated to perform, is recorded as deferred revenue and subsequently recognized over the term of thecontract or when the service is completed. Revenue from sales of third-party extended warranty and service contracts, for which we arenot obligated to perform, is recognized on a net basis at the time of sale, as we do not meet the criteria for gross recognition underEmerging Issues Task Force 99-19, “Reporting Revenue Gross as a Principal versus Net as an Agent.”
We record reductions to revenue for estimated customer sales returns, rebates, and certain other customer incentive programs. Thesereductions to revenue are made based upon reasonable and reliable estimates that are determined by historical experience, contractualterms, and current conditions. The primary factors affecting our accrual for estimated customer returns include estimated return rates aswell as the number of units shipped that have a right of return that has not expired as of the balance sheet date. If returns cannot be reliablyestimated, revenue is not recognized until a reliable estimate can be made or the return right lapses. Each quarter, we reevaluate ourestimates to assess the adequacy of our recorded accruals for customer returns and allowance for doubtful accounts, and adjust theamounts as necessary.
During Fiscal 2008, we began selling our products through retailers. Sales to our retail customers are generally made under agreementsallowing for limited rights of return, price protection, rebates, and marketing development funds. We have generally limited the returnrights through contractual caps. Our policy for sales to retailers is to defer the full amount of revenue relative to sales for which the rightsof return apply as we do not currently have sufficient historical data to establish reasonable and reliable estimates of returns, although weare in the process of accumulating the data necessary to develop reliable estimates in the future. All other sales for which the rights ofreturn do not apply are recognized upon shipment when all applicable revenue recognition criteria have been met. To the extent priceprotection and return rights are not limited, all of the revenue and related cost are deferred until the product has been sold by the retailer,the rights expire, or a reliable estimate of such amounts can be made. Generally, we record estimated reductions to revenue or an expensefor retail customer programs at the later of the offer or the time revenue is recognized in accordance with EITF 01-09. Our customerprograms primarily involve rebates, which are designed to serve as sales incentives to resellers of our products and marketing funds.
We report revenue net of any revenue-based taxes assessed by governmental authorities that are imposed on and concurrent with specificrevenue-producing transactions.
Business Combinations and Intangible Assets Including Goodwill — We account for business combinations using the purchase methodof accounting and accordingly, the assets and liabilities of the acquired entities are recorded at their estimated fair values at theacquisition date. Goodwill represents the excess of the purchase price over the fair value of net assets, including the amount assigned toidentifiable intangible assets. Given the time it takes to obtain pertinent information to finalize the acquired company’s balance sheet, itmay be several quarters before we are able to finalize those initial fair value estimates. Accordingly, it is not uncommon for the initialestimates to be subsequently revised. The results of operations of acquired businesses are included in the Consolidated FinancialStatements from the acquisition date.
Identifiable intangible assets with finite lives are amortized over their estimated useful lives. They are generally amortized on a non-straight-line approach based on the associated projected cash flows in order to match the amortization pattern to the pattern in which theeconomic benefits of the assets are expected to be consumed. They are reviewed for impairment if indicators of potential impairmentexist. Goodwill and indefinite lived intangibles assets are tested for impairment on an annual basis in the second fiscal quarter, or soonerif an indicator of impairment occurs. Given the rapid changes in the market place during the second half of Fiscal 2009, we updated ourimpairment analysis in the fourth quarter and concluded that there were no impairment triggering events.
Warranty — We record warranty liabilities at the time of sale for the estimated costs that may be incurred under the terms of the limitedwarranty. The specific warranty terms and conditions vary depending upon the product sold and country in which we do business, butgenerally include technical support, parts, and labor over a period ranging from one to three years. Factors that affect our warrantyliability include the number of installed units currently under warranty, historical and anticipated rates of warranty claims on those units,and cost per claim to satisfy our warranty obligation. The anticipated rate of warranty claims is the primary factor impacting ourestimated warranty obligation. The other factors are less significant due to the fact that the average remaining aggregate warranty periodof the covered installed base is approximately 20 months, repair parts are generally already in stock or available at pre-determined prices,and labor rates are generally arranged at pre-established amounts with service providers. Warranty claims are reasonably predictable
46
based on historical experience of failure rates. If actual results differ from our estimates, we revise our estimated warranty liability toreflect such changes. Each quarter, we reevaluate our estimates to assess the adequacy of the recorded warranty liabilities and adjust theamounts as necessary.
Income Taxes — We calculate a provision for income taxes using the asset and liability method, under which deferred tax assets andliabilities are recognized by identifying the temporary differences arising from the different treatment of items for tax and accountingpurposes. In determining the future tax consequences of events that have been recognized in our financial statements or tax returns,judgment is required. Differences between the anticipated and actual outcomes of these future tax consequences could have a materialimpact on our consolidated results of operations or financial position. Additionally, we use tax planning strategies as a part of our globaltax compliance program. Judgments and interpretation of statutes are inherent in this process. We provide related valuation reserves,where appropriate, in accordance with FIN 48.
Stock-Based Compensation — Effective February 4, 2006, stock-based compensation expense is recorded based on the grant date fairvalue estimate in accordance with the provisions of SFAS 123(R). In March 2005, the SEC issued Staff Accounting Bulletin No. 107(“SAB 107”) regarding the SEC’s interpretation of SFAS 123(R) and the valuation of share-based payments for public companies. Wehave applied the provisions of SAB 107 in our adoption of SFAS 123(R). Note 5 of Notes to Consolidated Financial Statements includedin “Part II — Item 8 — Financial Statements and Supplementary Data” for further discussion of stock-based compensation.
SFAS 123(R) requires the use of a valuation model to calculate the fair value of stock option awards. We have elected to use the Black-Scholes option pricing model, which incorporates various assumptions, including volatility, expected term, and risk-free interest rates.The volatility is based on a blend of implied and historical volatility of our common stock over the most recent period commensurate withthe estimated expected term of our stock options. We use this blend of implied and historical volatility, as well as other economic data,because we believe such volatility is more representative of prospective trends. The expected term of an award is based on historicalexperience and on the terms and conditions of the stock awards granted to employees. The dividend yield of zero is based on the fact thatwe have never paid cash dividends and have no present intention to pay cash dividends.
The cost of restricted stock awards is determined using the fair market value of our common stock on the date of grant.
Loss Contingencies — We are subject to the possibility of various losses arising in the ordinary course of business. We consider thelikelihood of loss or impairment of an asset or the incurrence of a liability, as well as our ability to reasonably estimate the amount of loss,in determining loss contingencies. An estimated loss contingency is accrued when it is probable that an asset has been impaired or aliability has been incurred and the amount of loss can be reasonably estimated. We regularly evaluate current information available to usto determine whether such accruals should be adjusted and whether new accruals are required. Third parties have in the past and may inthe future assert claims or initiate litigation related to exclusive patent, copyright, and other intellectual property rights to technologiesand related standards that are relevant to us. If any infringement or other intellectual property claim made against us by any third party issuccessful, or if we fail to develop non-infringing technology or license the proprietary rights on commercially reasonable terms andconditions, our business, operating results, and financial condition could be materially and adversely affected.
Recently Issued and Adopted Accounting Pronouncements
In September 2006, the FASB issued Statement of Financial Accounting Standard (“SFAS”) No. 157, Fair Value Measurements(“SFAS 157”), which defines fair value, provides a framework for measuring fair value, and expands the disclosures required for assetsand liabilities measured at fair value. SFAS 157 applies to existing accounting pronouncements that require fair value measurements; itdoes not require any new fair value measurements. We adopted the effective portions of SFAS 157 beginning the first quarter of Fiscal2009, with no material impact to our financial results. In February 2008, FASB issued FASB Staff Position (“FSP”) 157-2, Effective Dateof FASB Statement No. 157 (“FSP 157-2”), which delays the effective date of SFAS 157 for all nonfinancial assets and nonfinancialliabilities, except for items that are recognized or disclosed at fair value in the financial statements on a recurring basis (at least annually),until the beginning of the first quarter of Fiscal 2010. We are currently evaluating the inputs and techniques used in these measurements,including items such as impairment assessments of fixed assets and goodwill impairment testing. See Note 2 of Notes to ConsolidatedFinancial Statements included in “Part II — Item 8 — Financial Statements and Supplementary Data” for the impact of the adoption.
On October 10, 2008, the FASB issued FSP No. FAS 157-3 “Determining the Fair Value of a Financial Asset When the Market for thatAsset is Not Active” (“FSP FAS 157-3”), which clarifies the application of SFAS 157 in a market that is not active. Additional guidance isprovided regarding how the reporting entity’s own assumptions should be considered when relevant observable inputs do not exist, howavailable observable inputs in a market that is not active should be considered when measuring fair value, and how the use of marketquotes should be considered when assessing the relevance of inputs available to measure fair value. FSP FAS 157-3 became effective
47

immediately upon issuance. Dell considered the additional guidance with respect to the valuation of its financial assets and liabilities andtheir corresponding designation within the fair value hierarchy. Its adoption did not have a material effect on Dell’s consolidated financialstatements.
In February 2007, the FASB issued SFAS No. 159, The Fair Value Option for Financial Assets and Financial Liabilities (“SFAS 159”),which provides companies with an option to report selected financial assets and liabilities at fair value with the changes in fair valuerecognized in earnings at each subsequent reporting date. SFAS 159 provides an opportunity to mitigate potential volatility in earningscaused by measuring related assets and liabilities differently, and it may reduce the need for applying complex hedge accountingprovisions. While SFAS 159 became effective for our 2009 fiscal year, we did not elect the fair value measurement option for any of ourfinancial assets or liabilities.
Recently Issued Accounting Pronouncements
In December 2007, the FASB issued SFAS No. 141(R), Business Combinations (“SFAS 141(R)”). SFAS 141(R) requires that theacquisition method of accounting be applied to a broader set of business combinations and establishes principles and requirements forhow an acquirer recognizes and measures in its financial statements the identifiable assets acquired, liabilities assumed, anynoncontrolling interest in the acquiree, and the goodwill acquired. SFAS 141(R) also establishes the disclosure requirements to enablethe evaluation of the nature and financial effects of the business combination. SFAS 141(R) is effective for fiscal years beginning afterDecember 15, 2008 and is required to be adopted by us beginning in the first quarter of Fiscal 2010. Management believes the adoption ofSFAS 141(R) will not have an impact on our results of operations, financial position, and cash flows for acquisitions completed prior toFiscal 2010. The impact of SFAS 141 (R) on our future consolidated results of operations and financial condition will be dependent on thesize and nature of future combinations.
In December 2007, the FASB issued SFAS No. 160, Noncontrolling Interests in Consolidated Financial Statements — an amendment ofARB No. 51 (“SFAS 160”). SFAS 160 requires that the noncontrolling interest in the equity of a subsidiary be accounted for and reportedas equity, provides revised guidance on the treatment of net income and losses attributable to the noncontrolling interest and changes inownership interests in a subsidiary, and requires additional disclosures that identify and distinguish between the interests of thecontrolling and noncontrolling owners. SFAS 160 also establishes disclosure requirements that clearly identify and distinguish betweenthe interests of the parent and the interests of the noncontrolling owners. SFAS 160 is effective for fiscal years beginning afterDecember 15, 2008 and is required to be adopted by us beginning in the first quarter of Fiscal 2010. We do not expect SFAS 160 to have amaterial impact on our results of operations, financial position, and cash flows.
In March 2008, the FASB issued SFAS No. 161, Disclosures about Derivative Instruments and Hedging Activities, an amendment ofFASB Statement No. 133 (“SFAS 161”), which requires additional disclosures about the objectives of derivative instruments and hedgingactivities, the method of accounting for such instruments under SFAS No. 133, Accounting for Derivative Instruments and HedgingActivities (“SFAS 133”), and its related interpretations, and a tabular disclosure of the effects of such instruments and related hedgeditems on a company’s financial position, financial performance, and cash flows. SFAS 161 does not change the accounting treatment forderivative instruments and is effective for us beginning Fiscal 2010.
ITEM 7A — QUANTITATIVE AND QUALITATIVE DISCLOSURES ABOUT MARKET RISK
Response to this item is included in “Part II — Item 7 — Management’s Discussion and Analysis of Financial Condition and Results ofOperations — Market Risk” and is incorporated herein by reference.
48

ITEM 8 — FINANCIAL STATEMENTS AND SUPPLEMENTARY DATA
INDEX TO CONSOLIDATED FINANCIAL STATEMENTS
Page
Financial Statements:
Report of Independent Registered Public Accounting Firm . . . . . . . . . . . . . . . . . . . . . . . . . . . . . . . . . 50
Consolidated Statements of Financial Position at January 30, 2009 and February 1, 2008 . . . . . . . . . . . 51
Consolidated Statements of Income for the fiscal years ended January 30, 2009, February 1, 2008, andFebruary 2, 2007 . . . . . . . . . . . . . . . . . . . . . . . . . . . . . . . . . . . . . . . . . . . . . . . . . . . . . . . . . . . . . . 52
Consolidated Statements of Cash Flows for the fiscal years ended January 30, 2009, February 1, 2008,and February 2, 2007 . . . . . . . . . . . . . . . . . . . . . . . . . . . . . . . . . . . . . . . . . . . . . . . . . . . . . . . . . . . 53
Consolidated Statements of Stockholders’ Equity for the fiscal years ended January 30, 2009,February 1, 2008, and February 2, 2007 . . . . . . . . . . . . . . . . . . . . . . . . . . . . . . . . . . . . . . . . . . . . . 54
Notes to Consolidated Financial Statements. . . . . . . . . . . . . . . . . . . . . . . . . . . . . . . . . . . . . . . . . . . . . 55
Financial Statement Schedule:
Schedule II — Valuation and Qualifying Accounts for the fiscal years ended January 30, 2009,February 1, 2008, and February 2, 2007 . . . . . . . . . . . . . . . . . . . . . . . . . . . . . . . . . . . . . . . . . . . . . 97
All other schedules are omitted because they are not applicable.
49

Report of Independent Registered Public Accounting Firm
To the Board of Directors andShareholders of Dell Inc.:
In our opinion, the consolidated financial statements listed in the accompanying index present fairly, in all material respects, the financialposition of Dell Inc. and its subsidiaries (“Company”) at January 30, 2009 and February 1, 2008, and the results of their operations andtheir cash flows for each of the three years in the period ended January 30, 2009 in conformity with accounting principles generallyaccepted in the United States of America. In addition, in our opinion, the financial statement schedule listed in the accompanying indexpresents fairly, in all material respects, the information set forth therein when read in conjunction with the related consolidated financialstatements. Also in our opinion, the Company maintained, in all material respects, effective internal control over financial reporting as ofJanuary 30, 2009, based on criteria established in Internal Control — Integrated Framework issued by the Committee of SponsoringOrganizations of the Treadway Commission (COSO). The Company’s management is responsible for these financial statements and thefinancial statement schedule, for maintaining effective internal control over financial reporting, and for its assessment of the effectivenessof internal control over financial reporting included in Management’s Report on Internal Control Over Financial Reporting appearingunder Item 9A. Our responsibility is to express opinions on these financial statements, on the financial statement schedule, and on theCompany’s internal control over financial reporting based on our integrated audits. We conducted our audits in accordance with thestandards of the Public Company Accounting Oversight Board (United States). Those standards require that we plan and perform theaudits to obtain reasonable assurance about whether the financial statements are free of material misstatement and whether effectiveinternal control over financial reporting was maintained in all material respects. Our audits of the financial statements includedexamining, on a test basis, evidence supporting the amounts and disclosures in the financial statements, assessing the accountingprinciples used and significant estimates made by management, and evaluating the overall financial statement presentation. Our audit ofinternal control over financial reporting included obtaining an understanding of internal control over financial reporting, assessing therisk that a material weakness exists, and testing and evaluating the design and operating effectiveness of internal control based on theassessed risk. Our audits also included performing such other procedures as we considered necessary in the circumstances. We believethat our audits provide a reasonable basis for our opinions.
In Fiscal 2008, the Company adopted new accounting standards which changed the manner in which it accounts for uncertain taxpositions (Note 3) and certain hybrid financial instruments (Note 1).
A company’s internal control over financial reporting is a process designed to provide reasonable assurance regarding the reliability offinancial reporting and the preparation of financial statements for external purposes in accordance with generally accepted accountingprinciples. A company’s internal control over financial reporting includes those policies and procedures that (i) pertain to themaintenance of records that, in reasonable detail, accurately and fairly reflect the transactions and dispositions of the assets of thecompany; (ii) provide reasonable assurance that transactions are recorded as necessary to permit preparation of financial statements inaccordance with generally accepted accounting principles, and that receipts and expenditures of the company are being made only inaccordance with authorizations of management and directors of the company; and (iii) provide reasonable assurance regardingprevention or timely detection of unauthorized acquisition, use, or disposition of the company’s assets that could have a materialeffect on the financial statements.
Because of its inherent limitations, internal control over financial reporting may not prevent or detect misstatements. Also, projections ofany evaluation of effectiveness to future periods are subject to the risk that controls may become inadequate because of changes inconditions, or that the degree of compliance with the policies or procedures may deteriorate.
/s/ PRICEWATERHOUSECOOPERS LLP
Austin, TexasMarch 26, 2009
50

DELL INC.CONSOLIDATED STATEMENTS OF FINANCIAL POSITION
(in millions)
January 30,2009
February 1,2008
ASSETSCurrent assets:
Cash and cash equivalents . . . . . . . . . . . . . . . . . . . . . . . . . . . . . . . . . . . . . . . . . . . . . . . . . . . . . . . $ 8,352 $ 7,764Short-term investments . . . . . . . . . . . . . . . . . . . . . . . . . . . . . . . . . . . . . . . . . . . . . . . . . . . . . . . . . 740 208Accounts receivable, net . . . . . . . . . . . . . . . . . . . . . . . . . . . . . . . . . . . . . . . . . . . . . . . . . . . . . . . . 4,731 5,961Financing receivables, net . . . . . . . . . . . . . . . . . . . . . . . . . . . . . . . . . . . . . . . . . . . . . . . . . . . . . . . 1,712 1,732Inventories, net . . . . . . . . . . . . . . . . . . . . . . . . . . . . . . . . . . . . . . . . . . . . . . . . . . . . . . . . . . . . . . . 867 1,180Other current assets . . . . . . . . . . . . . . . . . . . . . . . . . . . . . . . . . . . . . . . . . . . . . . . . . . . . . . . . . . . 3,749 3,035
Total current assets . . . . . . . . . . . . . . . . . . . . . . . . . . . . . . . . . . . . . . . . . . . . . . . . . . . . . . . . . . 20,151 19,880Property, plant, and equipment, net . . . . . . . . . . . . . . . . . . . . . . . . . . . . . . . . . . . . . . . . . . . . . . . . . . 2,277 2,668Investments . . . . . . . . . . . . . . . . . . . . . . . . . . . . . . . . . . . . . . . . . . . . . . . . . . . . . . . . . . . . . . . . . . . 454 1,560Long-term financing receivables, net . . . . . . . . . . . . . . . . . . . . . . . . . . . . . . . . . . . . . . . . . . . . . . . . . 500 407Goodwill . . . . . . . . . . . . . . . . . . . . . . . . . . . . . . . . . . . . . . . . . . . . . . . . . . . . . . . . . . . . . . . . . . . . . 1,737 1,648Purchased intangible assets, net . . . . . . . . . . . . . . . . . . . . . . . . . . . . . . . . . . . . . . . . . . . . . . . . . . . . 724 780Other non-current assets . . . . . . . . . . . . . . . . . . . . . . . . . . . . . . . . . . . . . . . . . . . . . . . . . . . . . . . . . . 657 618
Total assets . . . . . . . . . . . . . . . . . . . . . . . . . . . . . . . . . . . . . . . . . . . . . . . . . . . . . . . . . . . . . . . . $ 26,500 $ 27,561
LIABILITIES AND EQUITYCurrent liabilities:
Short-term debt . . . . . . . . . . . . . . . . . . . . . . . . . . . . . . . . . . . . . . . . . . . . . . . . . . . . . . . . . . . . . . $ 113 $ 225Accounts payable . . . . . . . . . . . . . . . . . . . . . . . . . . . . . . . . . . . . . . . . . . . . . . . . . . . . . . . . . . . . . 8,309 11,492Accrued and other . . . . . . . . . . . . . . . . . . . . . . . . . . . . . . . . . . . . . . . . . . . . . . . . . . . . . . . . . . . . 3,788 4,323Short-term deferred service revenue. . . . . . . . . . . . . . . . . . . . . . . . . . . . . . . . . . . . . . . . . . . . . . . . 2,649 2,486
Total current liabilities . . . . . . . . . . . . . . . . . . . . . . . . . . . . . . . . . . . . . . . . . . . . . . . . . . . . . . . 14,859 18,526Long-term debt . . . . . . . . . . . . . . . . . . . . . . . . . . . . . . . . . . . . . . . . . . . . . . . . . . . . . . . . . . . . . . . . 1,898 362Long-term deferred service revenue . . . . . . . . . . . . . . . . . . . . . . . . . . . . . . . . . . . . . . . . . . . . . . . . . 3,000 2,774Other non-current liabilities . . . . . . . . . . . . . . . . . . . . . . . . . . . . . . . . . . . . . . . . . . . . . . . . . . . . . . . 2,472 2,070
Total liabilities . . . . . . . . . . . . . . . . . . . . . . . . . . . . . . . . . . . . . . . . . . . . . . . . . . . . . . . . . . . . . 22,229 23,732
Commitments and contingencies (Note 10)Redeemable common stock and capital in excess of $.01 par value; shares issued and outstanding:
0 and 4, respectively (Note 4) . . . . . . . . . . . . . . . . . . . . . . . . . . . . . . . . . . . . . . . . . . . . . . . . . . . . - 94
Stockholders’ equity:Preferred stock and capital in excess of $.01 par value; shares authorized: 5,000; shares issued and
outstanding: none . . . . . . . . . . . . . . . . . . . . . . . . . . . . . . . . . . . . . . . . . . . . . . . . . . . . . . . . . . . - -Common stock and capital in excess of $.01 par value; shares authorized: 7,000; shares issued:
3,338 and 3,320, respectively; shares outstanding: 1,944 and 2,060, respectively . . . . . . . . . . . . . 11,189 10,589Treasury stock at cost: 919 and 785 shares, respectively. . . . . . . . . . . . . . . . . . . . . . . . . . . . . . . . . (27,904) (25,037)Retained earnings . . . . . . . . . . . . . . . . . . . . . . . . . . . . . . . . . . . . . . . . . . . . . . . . . . . . . . . . . . . . . 20,677 18,199Accumulated other comprehensive income (loss) . . . . . . . . . . . . . . . . . . . . . . . . . . . . . . . . . . . . . . 309 (16)
Total stockholders’ equity . . . . . . . . . . . . . . . . . . . . . . . . . . . . . . . . . . . . . . . . . . . . . . . . . . . . . 4,271 3,735
Total liabilities and equity . . . . . . . . . . . . . . . . . . . . . . . . . . . . . . . . . . . . . . . . . . . . . . . . . . . . . $ 26,500 $ 27,561
The accompanying notes are an integral part of these consolidated financial statements.
51

DELL INC.CONSOLIDATED STATEMENTS OF INCOME
(in millions, except per share amounts)
January 30,2009
February 1,2008
February 2,2007
Fiscal Year Ended
Net revenue . . . . . . . . . . . . . . . . . . . . . . . . . . . . . . . . . . . . . . . . . . . . . . . . . . . . . . $ 61,101 $ 61,133 $ 57,420
Cost of net revenue . . . . . . . . . . . . . . . . . . . . . . . . . . . . . . . . . . . . . . . . . . . . . . . . 50,144 49,462 47,904
Gross margin . . . . . . . . . . . . . . . . . . . . . . . . . . . . . . . . . . . . . . . . . . . . . . . . . . . 10,957 11,671 9,516
Operating expenses:
Selling, general, and administrative . . . . . . . . . . . . . . . . . . . . . . . . . . . . . . . . . . . 7,102 7,538 5,948
In-process research and development . . . . . . . . . . . . . . . . . . . . . . . . . . . . . . . . . . 2 83 -
Research, development, and engineering . . . . . . . . . . . . . . . . . . . . . . . . . . . . . . . 663 610 498
Total operating expenses . . . . . . . . . . . . . . . . . . . . . . . . . . . . . . . . . . . . . . . . . 7,767 8,231 6,446
Operating income . . . . . . . . . . . . . . . . . . . . . . . . . . . . . . . . . . . . . . . . . . . . . . 3,190 3,440 3,070
Investment and other income, net . . . . . . . . . . . . . . . . . . . . . . . . . . . . . . . . . . . . . . 134 387 275
Income before income taxes . . . . . . . . . . . . . . . . . . . . . . . . . . . . . . . . . . . . . . . . 3,324 3,827 3,345Income tax provision . . . . . . . . . . . . . . . . . . . . . . . . . . . . . . . . . . . . . . . . . . . . . . . 846 880 762
Net income. . . . . . . . . . . . . . . . . . . . . . . . . . . . . . . . . . . . . . . . . . . . . . . . . . . . . $ 2,478 $ 2,947 $ 2,583
Earnings per common share:
Basic . . . . . . . . . . . . . . . . . . . . . . . . . . . . . . . . . . . . . . . . . . . . . . . . . . . . . . . . . $ 1.25 $ 1.33 $ 1.15
Diluted . . . . . . . . . . . . . . . . . . . . . . . . . . . . . . . . . . . . . . . . . . . . . . . . . . . . . . . . $ 1.25 $ 1.31 $ 1.14
Weighted-average shares outstanding:
Basic . . . . . . . . . . . . . . . . . . . . . . . . . . . . . . . . . . . . . . . . . . . . . . . . . . . . . . . . . 1,980 2,223 2,255
Diluted . . . . . . . . . . . . . . . . . . . . . . . . . . . . . . . . . . . . . . . . . . . . . . . . . . . . . . . . 1,986 2,247 2,271
The accompanying notes are an integral part of these consolidated financial statements.
52

DELL INC.CONSOLIDATED STATEMENTS OF CASH FLOWS
(in millions)
January 30,2009
February 1,2008
February 2,2007
Fiscal Year Ended
Cash flows from operating activities:Net income. . . . . . . . . . . . . . . . . . . . . . . . . . . . . . . . . . . . . . . . . . . . . . . . . . . . . $ 2,478 $ 2,947 $ 2,583Adjustments to reconcile net income to net cash provided by operating activities:
Depreciation and amortization . . . . . . . . . . . . . . . . . . . . . . . . . . . . . . . . . . . . . 769 607 471Stock-based compensation . . . . . . . . . . . . . . . . . . . . . . . . . . . . . . . . . . . . . . . . 418 329 368In-process research and development charges . . . . . . . . . . . . . . . . . . . . . . . . . . 2 83 -Effects of exchange rate changes on monetary assets and liabilities
denominated in foreign currencies . . . . . . . . . . . . . . . . . . . . . . . . . . . . . . . . (115) 30 37Deferred income taxes. . . . . . . . . . . . . . . . . . . . . . . . . . . . . . . . . . . . . . . . . . . 86 (308) (262)Other . . . . . . . . . . . . . . . . . . . . . . . . . . . . . . . . . . . . . . . . . . . . . . . . . . . . . . . 231 121 (19)
Changes in operating assets and liabilities, net of effects from acquisitions:Accounts receivable . . . . . . . . . . . . . . . . . . . . . . . . . . . . . . . . . . . . . . . . . 591 (990) (542)Financing receivables . . . . . . . . . . . . . . . . . . . . . . . . . . . . . . . . . . . . . . . . (302) (394) (163)Inventories . . . . . . . . . . . . . . . . . . . . . . . . . . . . . . . . . . . . . . . . . . . . . . . . 309 (498) (72)Other assets . . . . . . . . . . . . . . . . . . . . . . . . . . . . . . . . . . . . . . . . . . . . . . . (106) (121) (286)Accounts payable . . . . . . . . . . . . . . . . . . . . . . . . . . . . . . . . . . . . . . . . . . . (3,117) 837 505Deferred service revenue . . . . . . . . . . . . . . . . . . . . . . . . . . . . . . . . . . . . . 611 1,032 516Accrued and other liabilities . . . . . . . . . . . . . . . . . . . . . . . . . . . . . . . . . . . 39 274 833
Change in cash from operating activities . . . . . . . . . . . . . . . . . . . . . . . . . . . 1,894 3,949 3,969
Cash flows from investing activities:Investments:
Purchases . . . . . . . . . . . . . . . . . . . . . . . . . . . . . . . . . . . . . . . . . . . . . . . . . . . . (1,584) (2,394) (8,343)Maturities and sales. . . . . . . . . . . . . . . . . . . . . . . . . . . . . . . . . . . . . . . . . . . . . 2,333 3,679 10,320
Capital expenditures . . . . . . . . . . . . . . . . . . . . . . . . . . . . . . . . . . . . . . . . . . . . . . (440) (831) (896)Proceeds from sale of facility and land . . . . . . . . . . . . . . . . . . . . . . . . . . . . . . . . 44 - 40Acquisition of business, net of cash received . . . . . . . . . . . . . . . . . . . . . . . . . . . . (176) (2,217) (118)
Change in cash from investing activities . . . . . . . . . . . . . . . . . . . . . . . . . . . . 177 (1,763) 1,003
Cash flows from financing activities:Repurchase of common stock . . . . . . . . . . . . . . . . . . . . . . . . . . . . . . . . . . . . . . . (2,867) (4,004) (3,026)Issuance of common stock under employee plans. . . . . . . . . . . . . . . . . . . . . . . . . 79 136 314Issuance (payment) of commercial paper, net . . . . . . . . . . . . . . . . . . . . . . . . . . . . 100 (100) 100Proceeds from issuance of debt . . . . . . . . . . . . . . . . . . . . . . . . . . . . . . . . . . . . . . 1,519 66 52Repayments of debt . . . . . . . . . . . . . . . . . . . . . . . . . . . . . . . . . . . . . . . . . . . . . . (237) (165) (63)Other . . . . . . . . . . . . . . . . . . . . . . . . . . . . . . . . . . . . . . . . . . . . . . . . . . . . . . . . . - (53) 72
Change in cash from financing activities . . . . . . . . . . . . . . . . . . . . . . . . . . . (1,406) (4,120) (2,551)
Effect of exchange rate changes on cash and cash equivalents . . . . . . . . . . . . . . . . . (77) 152 71
Change in cash and cash equivalents . . . . . . . . . . . . . . . . . . . . . . . . . . . . . . . . . . . . 588 (1,782) 2,492Cash and cash equivalents at beginning of the year . . . . . . . . . . . . . . . . . . . . . . . . . 7,764 9,546 7,054
Cash and cash equivalents at end of the year . . . . . . . . . . . . . . . . . . . . . . . . . . . . . . $ 8,352 $ 7,764 $ 9,546
Income tax paid . . . . . . . . . . . . . . . . . . . . . . . . . . . . . . . . . . . . . . . . . . . . . . . . . . . $ 800 $ 767 $ 652Interest paid . . . . . . . . . . . . . . . . . . . . . . . . . . . . . . . . . . . . . . . . . . . . . . . . . . . . . . $ 74 $ 54 $ 57
The accompanying notes are an integral part of these consolidated financial statements.
53
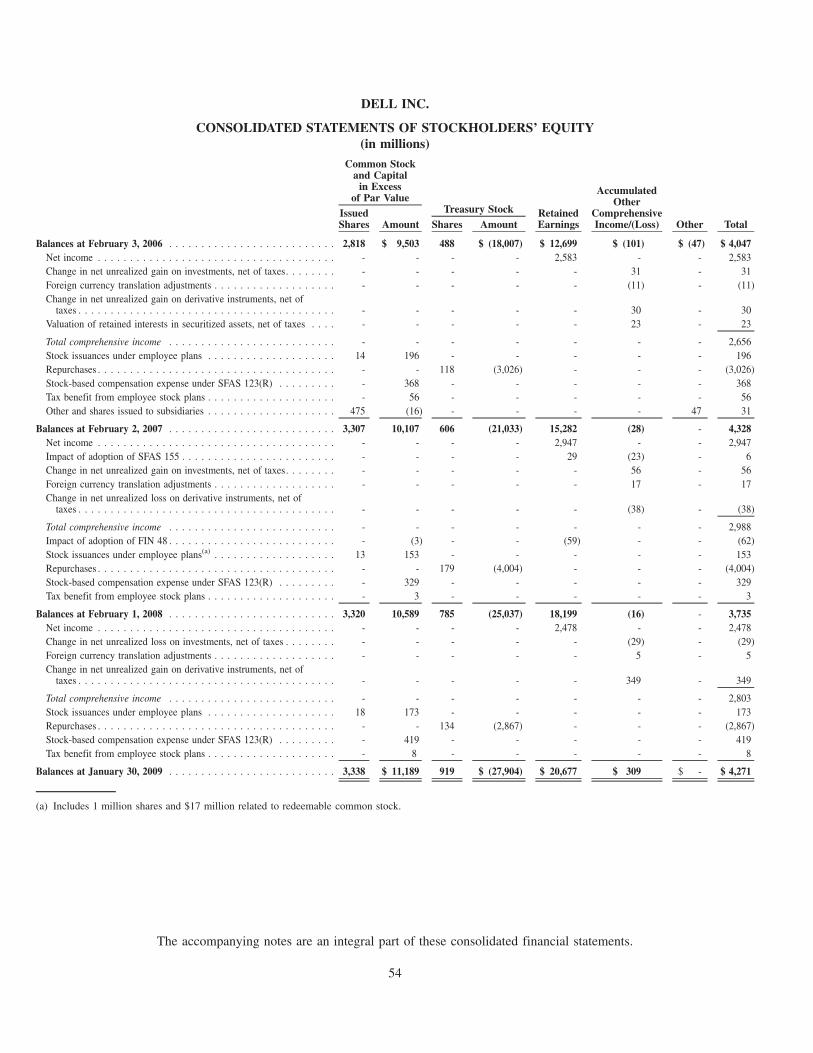
DELL INC.
CONSOLIDATED STATEMENTS OF STOCKHOLDERS’ EQUITY(in millions)
IssuedShares Amount Shares Amount
RetainedEarnings
AccumulatedOther
ComprehensiveIncome/(Loss) Other Total
Common Stockand Capital
in Excessof Par Value
Treasury Stock
Balances at February 3, 2006 . . . . . . . . . . . . . . . . . . . . . . . . . . 2,818 $ 9,503 488 $ (18,007) $ 12,699 $ (101) $ (47) $ 4,047Net income . . . . . . . . . . . . . . . . . . . . . . . . . . . . . . . . . . . . . - - - - 2,583 - - 2,583Change in net unrealized gain on investments, net of taxes. . . . . . . . - - - - - 31 - 31Foreign currency translation adjustments . . . . . . . . . . . . . . . . . . . - - - - - (11) - (11)Change in net unrealized gain on derivative instruments, net of
taxes . . . . . . . . . . . . . . . . . . . . . . . . . . . . . . . . . . . . . . . . - - - - - 30 - 30Valuation of retained interests in securitized assets, net of taxes . . . . - - - - - 23 - 23
Total comprehensive income . . . . . . . . . . . . . . . . . . . . . . . . . . - - - - - - - 2,656Stock issuances under employee plans . . . . . . . . . . . . . . . . . . . . 14 196 - - - - - 196Repurchases . . . . . . . . . . . . . . . . . . . . . . . . . . . . . . . . . . . . . - - 118 (3,026) - - - (3,026)Stock-based compensation expense under SFAS 123(R) . . . . . . . . . - 368 - - - - - 368Tax benefit from employee stock plans . . . . . . . . . . . . . . . . . . . . - 56 - - - - - 56Other and shares issued to subsidiaries . . . . . . . . . . . . . . . . . . . . 475 (16) - - - - 47 31
Balances at February 2, 2007 . . . . . . . . . . . . . . . . . . . . . . . . . . 3,307 10,107 606 (21,033) 15,282 (28) - 4,328Net income . . . . . . . . . . . . . . . . . . . . . . . . . . . . . . . . . . . . . - - - - 2,947 - - 2,947Impact of adoption of SFAS 155 . . . . . . . . . . . . . . . . . . . . . . . . - - - - 29 (23) - 6Change in net unrealized gain on investments, net of taxes. . . . . . . . - - - - - 56 - 56Foreign currency translation adjustments . . . . . . . . . . . . . . . . . . . - - - - - 17 - 17Change in net unrealized loss on derivative instruments, net of
taxes . . . . . . . . . . . . . . . . . . . . . . . . . . . . . . . . . . . . . . . . - - - - - (38) - (38)
Total comprehensive income . . . . . . . . . . . . . . . . . . . . . . . . . . - - - - - - - 2,988Impact of adoption of FIN 48 . . . . . . . . . . . . . . . . . . . . . . . . . . - (3) - - (59) - - (62)Stock issuances under employee plans(a) . . . . . . . . . . . . . . . . . . . 13 153 - - - - - 153Repurchases . . . . . . . . . . . . . . . . . . . . . . . . . . . . . . . . . . . . . - - 179 (4,004) - - - (4,004)Stock-based compensation expense under SFAS 123(R) . . . . . . . . . - 329 - - - - - 329Tax benefit from employee stock plans . . . . . . . . . . . . . . . . . . . . - 3 - - - - - 3
Balances at February 1, 2008 . . . . . . . . . . . . . . . . . . . . . . . . . . 3,320 10,589 785 (25,037) 18,199 (16) - 3,735Net income . . . . . . . . . . . . . . . . . . . . . . . . . . . . . . . . . . . . . - - - - 2,478 - - 2,478Change in net unrealized loss on investments, net of taxes . . . . . . . . - - - - - (29) - (29)Foreign currency translation adjustments . . . . . . . . . . . . . . . . . . . - - - - - 5 - 5Change in net unrealized gain on derivative instruments, net of
taxes . . . . . . . . . . . . . . . . . . . . . . . . . . . . . . . . . . . . . . . . - - - - - 349 - 349
Total comprehensive income . . . . . . . . . . . . . . . . . . . . . . . . . . - - - - - - - 2,803Stock issuances under employee plans . . . . . . . . . . . . . . . . . . . . 18 173 - - - - - 173Repurchases . . . . . . . . . . . . . . . . . . . . . . . . . . . . . . . . . . . . . - - 134 (2,867) - - - (2,867)Stock-based compensation expense under SFAS 123(R) . . . . . . . . . - 419 - - - - - 419Tax benefit from employee stock plans . . . . . . . . . . . . . . . . . . . . - 8 - - - - - 8
Balances at January 30, 2009 . . . . . . . . . . . . . . . . . . . . . . . . . . 3,338 $ 11,189 919 $ (27,904) $ 20,677 $ 309 $ - $ 4,271
(a) Includes 1 million shares and $17 million related to redeemable common stock.
The accompanying notes are an integral part of these consolidated financial statements.
54
DELL INC.
NOTES TO CONSOLIDATED FINANCIAL STATEMENTS
NOTE 1 — DESCRIPTION OF BUSINESS AND SUMMARY OF SIGNIFICANT ACCOUNTING POLICIES
Description of Business — Dell Inc., a Delaware corporation (both individually and together with its consolidated subsidiaries, “Dell”),offers a broad range of technology product categories, including mobility products, desktop PCs, software and peripherals, servers andnetworking products, services, and storage. Dell sells its products and services directly to customers through dedicated salesrepresentatives, telephone-based sales, and online at www.dell.com, and through a variety of indirect sales channels. Dell’s customersinclude large corporate, government, healthcare, and education accounts, as well as small and medium businesses and individualconsumers.
Fiscal Year — Dell’s fiscal year is the 52- or 53-week period ending on the Friday nearest January 31. The fiscal years ending January 30,2009, February 1, 2008, and February 2, 2007 included 52 weeks.
Principles of Consolidation — The accompanying consolidated financial statements include the accounts of Dell Inc. and its wholly-owned subsidiaries and have been prepared in accordance with accounting principles generally accepted in the United States of America(“GAAP”). All significant intercompany transactions and balances have been eliminated.
Dell was formerly a partner in Dell Financial Services L.L.C. (“DFS”), a joint venture with CIT Group Inc. (“CIT”). Dell purchased theremaining 30% interest in DFS from CIT effective December 31, 2007; therefore, DFS is a wholly-owned subsidiary at February 1, 2008.DFS’ financial results have previously been consolidated by Dell in accordance with Financial Accounting Standards Board (“FASB”)Interpretation No. 46R (“FIN 46R”), as Dell was the primary beneficiary. DFS allows Dell to provide its customers with various financingalternatives. See Note 6 of Notes to Consolidated Financial Statements for additional information.
Use of Estimates — The preparation of financial statements in accordance with GAAP requires the use of management’s estimates.These estimates are subjective in nature and involve judgments that affect the reported amounts of assets and liabilities, the disclosure ofcontingent assets and liabilities at fiscal year-end, and the reported amounts of revenues and expenses during the fiscal year. Actualresults could differ from those estimates.
Cash and Cash Equivalents — All highly liquid investments, including credit card receivables due from banks, with original maturitiesof three months or less at date of purchase are carried at cost and are considered to be cash equivalents. All other investments notconsidered to be cash equivalents are separately categorized as investments.
Investments — Dell’s investments in debt securities are classified as available-for-sale and are reported at fair value (based on quotedprices and market observable inputs) using the specific identification method. Unrealized gains and losses, net of taxes, are reported as acomponent of stockholders’ equity. Publicly traded equity securities are classified as trading and are reported at fair value (based onquoted prices and market observable inputs) using the specific identification method. Unrealized gains and losses are reported ininvestment and other income, net. Realized gains and losses on investments are included in investment and other income, net whenrealized. All other investments are initially recorded at cost. Any impairment loss to reduce an investment’s carrying amount to its fairmarket value is recognized in income when a decline in the fair market value of an individual security below its cost or carrying value isdetermined to be other than temporary.
Financing Receivables — Financing receivables consist of customer receivables, residual interest and retained interest in securitizedreceivables. Customer receivables include revolving loans and fixed-term leases and loans resulting from the sale of Dell products andservices. Financing receivables are presented net of the allowance for losses. See Note 6 of Notes to Consolidated Financial Statementsfor additional information.
Asset Securitization -— Dell transfers certain financing receivables to unconsolidated qualifying special purpose entities in securiti-zation transactions. These receivables are removed from the Consolidated Statement of Financial Position at the time they are sold inaccordance with Statement of Financial Accounting Standards (“SFAS”) No. 140, Accounting for Transfers and Servicing of FinancialAssets and Extinguishment of Liabilities — a Replacement of SFAS No. 125. Receivables are considered sold when the receivables aretransferred beyond the reach of Dell’s creditors, the transferee has the right to pledge or exchange the assets, and Dell has surrenderedcontrol over the rights and obligations of the receivables. Gains and losses from the sale of revolving loans and fixed-term leases andloans are recognized in the period the sale occurs, based upon the relative fair value of the assets sold and the remaining retained interest.Subsequent to the sale, retained interest estimates are periodically updated based upon current information and events to determine thecurrent fair value, with any changes in fair value recorded in earnings. In estimating the value of retained interest, Dell makes a variety of
55
financial assumptions, including pool credit losses, payment rates, and discount rates. These assumptions are supported by both Dell’shistorical experience and anticipated trends relative to the particular receivable pool. See Note 6 of Notes to Consolidated FinancialStatements for additional information.
Allowance for Doubtful Accounts — Dell recognizes an allowance for losses on accounts receivable in an amount equal to the estimatedprobable future losses. The allowance is based on an analysis of historical bad debt experience, current receivables aging, expected futurewrite-offs, as well as an assessment of specific identifiable customer accounts considered at risk or uncollectible. The expense associatedwith the allowance for doubtful accounts is recognized as selling, general, and administrative expense.
Allowance for Financing Receivables Losses — Dell recognizes an allowance for losses on financing receivables in an amount equal tothe probable future losses net of recoveries. The allowance for losses is determined based on a variety of factors, including historicalexperience, past due receivables, receivable type, and risk composition. Financing receivables are charged to the allowance at the earlierof when an account is deemed to be uncollectible or when the account is 180 days delinquent. Recoveries on receivables previouslycharged off as uncollectible are recorded to the allowance for losses on financing receivables. The expense associated with the allowancefor financing receivables losses is recognized as cost of net revenue. See Note 6 of Notes to Consolidated Financial Statements foradditional information.
Inventories — Inventories are stated at the lower of cost or market with cost being determined on a first-in, first-out basis.
Property, Plant, and Equipment — Property, plant, and equipment are carried at depreciated cost. Depreciation is provided using thestraight-line method over the estimated economic lives of the assets, which range from ten to thirty years for buildings and two to fiveyears for all other assets. Leasehold improvements are amortized over the shorter of five years or the lease term. Gains or losses related toretirements or disposition of fixed assets are recognized in the period incurred. Dell capitalizes eligible internal-use softwaredevelopment costs incurred subsequent to the completion of the preliminary project stage. Development costs are amortized overthe shorter of the expected useful life of the software or five years.
Impairment of Long-Lived Assets — In accordance with the provisions SFAS No. 144, “Accounting for the Impairment or Disposal ofLong-Lived Assets,” Dell reviews long-lived assets for impairment when circumstances indicate the carrying amount of an asset may notbe recoverable based on the undiscounted future cash flows of the asset. If the carrying amount of the asset is determined not to berecoverable, a write-down to fair value is recorded. Fair values are determined based on quoted market values, discounted cash flows, orexternal appraisals, as applicable. Dell reviews long-lived assets for impairment at the individual asset or the asset group level for whichthe lowest level of independent cash flows can be identified.
Business Combinations and Intangible Assets Including Goodwill — Dell accounts for business combinations using the purchase methodof accounting and accordingly, the assets and liabilities of the acquired entities are recorded at their estimated fair values at theacquisition date. Goodwill represents the excess of the purchase price over the fair value of net assets, including the amount assigned toidentifiable intangible assets. Given the time it takes to obtain pertinent information to finalize the fair value of the acquired assets andliabilities, it may be several quarters before Dell is able to finalize those initial fair value estimates. Accordingly, it is common for theinitial estimates to be subsequently revised. The results of operations of acquired businesses are included in the Consolidated FinancialStatements from the acquisition date.
Identifiable intangible assets with finite lives are amortized over their estimated useful lives. They are generally amortized on a non-straight line approach based on the associated projected cash flows in order to match the amortization pattern to the pattern in which theeconomic benefits of the assets are expected to be consumed. They are reviewed for impairment if indicators of potential impairmentexist. Goodwill and indefinite lived intangible assets are tested for impairment on an annual basis in the second fiscal quarter, or sooner ifan indicator of impairment occurs.
Foreign Currency Translation — The majority of Dell’s international sales are made by international subsidiaries, most of which havethe U.S. dollar as their functional currency. Dell’s subsidiaries that do not have the U.S. dollar as their functional currency translate assetsand liabilities at current rates of exchange in effect at the balance sheet date. Revenue and expenses from these international subsidiariesare translated using the monthly average exchange rates in effect for the period in which the items occur. Cumulative foreign currencytranslation adjustments totaled an $11 million loss, $16 million loss, and $33 million loss at January 30, 2009, February 1, 2008, and
56
DELL INC.
NOTES TO CONSOLIDATED FINANCIAL STATEMENTS (Continued)

February 2, 2007, respectively, and are included as a component of accumulated other comprehensive income (loss) in stockholders’equity.
Local currency transactions of international subsidiaries that have the U.S. dollar as the functional currency are remeasured intoU.S. dollars using current rates of exchange for monetary assets and liabilities and historical rates of exchange for nonmonetary assetsand liabilities. Gains and losses from remeasurement of monetary assets and liabilities are included in investment and other income, net.See Note 12 of Notes to Consolidated Financial Statements for additional information.
Hedging Instruments — Dell uses derivative financial instruments, primarily forwards, options, and swaps to hedge certain foreigncurrency and interest rate exposures. Dell also uses other derivative instruments not designated as hedges such as forwards to hedgeforeign currency balance sheet exposures. Dell does not use derivatives for speculative purposes.
Dell applies SFAS No. 133, Accounting for Derivative Instruments and Hedging Activities, (“SFAS 133”) as amended, which establishesaccounting and reporting standards for derivative instruments and hedging activities. SFAS 133 requires Dell to recognize all derivativesas either assets or liabilities in its Consolidated Statements of Financial Position and measure those instruments at fair value. See Note 2of Notes to Consolidated Financial Statements for a full description of Dell’s derivative financial instrument activities and relatedaccounting policies.
Treasury Stock — Dell accounts for treasury stock under the cost method and includes treasury stock as a component of stockholders’equity.
Revenue Recognition — Dell’s revenue recognition policy is in accordance with the requirements of Staff Accounting Bulletin (“SAB”)No. 104, Revenue Recognition, Emerging Issues Task Force (“EITF”) 00-21, Accounting for Revenue Arrangements with MultipleDeliverables, AICPA Statement of Position (“SOP”) No. 97-2, Software Revenue Recognition, EITF 01-09, Accounting for Consid-eration Given by a Vendor to a Customer (Including a Reseller of the Vendor’s Products) (“EITF 01-09”) and other applicable revenuerecognition guidance and interpretations. Net revenues include sales of hardware, software and peripherals, and services (includingextended service contracts and professional services). Dell recognizes revenue for these products when it is realized or realizable andearned. Revenue is considered realized and earned when:
• persuasive evidence of an arrangement exists;• delivery has occurred or services have been rendered;• Dell’s fee to its customer is fixed or determinable; and• collection of the resulting receivable is reasonably assured.
Revenue from the sale of products are recognized when title and risk of loss passes to the customer. Delivery is considered complete whenproducts have been shipped to Dell’s customer or services have been rendered, title and risk of loss has transferred to the customer, andcustomer acceptance has been satisfied through obtaining acceptance from the customer, the acceptance provision lapses, or Dell hasevidence that the acceptance provisions have been satisfied.
Dell sells its products and services either separately or as part of a multiple-element arrangement. Dell allocates revenue from multiple-element arrangements to the elements based on the relative fair value of each element, which is generally based on the relative sales priceof each element when sold separately. The allocation of fair value for a multiple-element arrangement involving software is based onvendor specific objective evidence (“VSOE”), or in the absence of VSOE for delivered elements, the residual method. Under the residualmethod, Dell allocates the residual amount of revenue from the arrangement to software licenses at the inception of the license term whenVSOE for all undelivered elements, such as Post Contract Customer Support (“PCS”), exists and all other revenue recognition criteriahave been satisfied. In the absence of VSOE for undelivered elements, revenue is deferred and subsequently recognized over the term ofthe arrangement. For sales of extended warranties with a separate contract price, Dell defers revenue equal to the separately stated price.Revenue associated with undelivered elements is deferred and recorded when delivery occurs or services are provided. Product revenue isrecognized, net of an allowance for estimated returns, when both title and risk of loss transfer to the customer, provided that no significantobligations remain. Revenue from extended warranty and service contracts, for which Dell is obligated to perform, is recorded asdeferred revenue and subsequently recognized over the term of the contract or when the service is completed. Revenue from sales ofthird-party extended warranty and service contracts or other products or software PCS, for which Dell is not obligated to perform, and for
57
DELL INC.
NOTES TO CONSOLIDATED FINANCIAL STATEMENTS (Continued)

which Dell does not meet the criteria for gross revenue recognition under EITF 99-19, Reporting Revenue Gross as a Principal versus Netas an Agent, is recognized on a net basis. All other revenue is recognized on a gross basis.
Dell records reductions to revenue for estimated customer sales returns, rebates, and certain other customer incentive programs. Thesereductions to revenue are made based upon reasonable and reliable estimates that are determined by historical experience, contractualterms, and current conditions. The primary factors affecting our accrual for estimated customer returns include estimated return rates aswell as the number of units shipped that have a right of return that has not expired as of the balance sheet date. If returns cannot be reliablyestimated, revenue is not recognized until a reliable estimate can be made or the return right lapses.
During Fiscal 2008, Dell began selling its products through retailers. Sales to Dell’s retail customers are generally made underagreements allowing for limited rights of return, price protection, rebates, and marketing development funds. Dell has generally limitedthe return rights through contractual caps. Dell’s policy for sales to retailers is to defer the full amount of revenue relative to sales forwhich the rights of return apply as Dell does not currently have sufficient historical data to establish reasonable and reliable estimates ofreturns, although Dell is in the process of accumulating the data necessary to develop reliable estimates in the future. All other sales forwhich the rights of return do not apply are recognized upon shipment when all applicable revenue recognition criteria have been met. Tothe extent price protection and return rights are not limited, all of the revenue and related cost are deferred until the product has been soldby the retailer, the rights expire, or a reliable estimate of such amounts can be made. Generally, Dell records estimated reductions torevenue or an expense for retail customer programs at the later of the offer or the time revenue is recognized in accordance withEITF 01-09. Dell’s customer programs primarily involve rebates, which are designed to serve as sales incentives to resellers of Dellproducts and marketing funds.
Dell defers the cost of shipped products awaiting revenue recognition until revenue is recognized. These deferred costs totaled$556 million and $519 million at January 30, 2009, and February 1, 2008, respectively, and are included in other current assets on Dell’sConsolidated Statement of Financial Position.
Dell records revenue from the sale of equipment under sales-type leases as product revenue at the inception of the lease. Sales-type leasesalso produce financing income, which Dell recognizes at consistent rates of return over the lease term. Customer revolving loan financingincome is recognized when billed to the customer.
Dell reports revenue net of any revenue-based taxes assessed by governmental authorities that are imposed on and concurrent withspecific revenue-producing transactions.
Warranty — Dell records warranty liabilities at the time of sale for the estimated costs that may be incurred under its limited warranty.The specific warranty terms and conditions vary depending upon the product sold and country in which Dell does business, but generallyincludes technical support, parts, and labor over a period ranging from one to three years. Factors that affect Dell’s warranty liabilityinclude the number of installed units currently under warranty, historical and anticipated rates of warranty claims on those units, and costper claim to satisfy Dell’s warranty obligation. The anticipated rate of warranty claims is the primary factor impacting the estimatedwarranty obligation. The other factors are less significant due to the fact that the average remaining aggregate warranty period of thecovered installed base is approximately 20 months, repair parts are generally already in stock or available at pre-determined prices, andlabor rates are generally arranged at pre-established amounts with service providers. Warranty claims are relatively predictable based onhistorical experience of failure rates. If actual results differ from the estimates, Dell revises its estimated warranty liability. Each quarter,Dell reevaluates its estimates to assess the adequacy of its recorded warranty liabilities and adjusts the amounts as necessary.
Vendor Rebates — Dell may receive consideration from vendors in the normal course of business. Certain of these funds are rebates ofpurchase price paid and others are related to reimbursement of costs incurred by Dell to sell the vendor’s products. Dell’s policy foraccounting for these funds is in accordance with EITF 02-16, Accounting by a Customer (Including a Reseller) for Certain ConsiderationReceived from a Vendor. The funds are recognized as a reduction of cost of goods sold and inventory if the funds are a reduction of theprice of the vendor’s products. If the consideration is a reimbursement of costs incurred by Dell to sell or develop the vendor’s products,then the consideration is classified as a reduction of that cost in the income statement, most often operating expenses. In order to berecognized as a reduction of operating expenses, the reimbursement must be for a specific, incremental, identifiable cost incurred by Dellin selling the vendor’s products or services.
58
DELL INC.
NOTES TO CONSOLIDATED FINANCIAL STATEMENTS (Continued)

Loss Contingencies — Dell is subject to the possibility of various losses arising in the ordinary course of business. Dell considers thelikelihood of loss or impairment of an asset or the incurrence of a liability, as well as Dell’s ability to reasonably estimate the amount ofloss, in determining loss contingencies. An estimated loss contingency is accrued when it is probable that an asset has been impaired or aliability has been incurred and the amount of loss can be reasonably estimated. Dell regularly evaluates current information available todetermine whether such accruals should be adjusted and whether new accruals are required. Third parties have in the past and may in thefuture assert claims or initiate litigation related to exclusive patent, copyright, and other intellectual property rights to technologies andrelated standards that are relevant to Dell.
Shipping Costs — Dell’s shipping and handling costs are included in cost of sales in the accompanying Consolidated Statements ofIncome for all periods presented.
Selling, General, and Administrative — Selling expenses include items such as sales salaries and commissions, marketing andadvertising costs, and contractor services. Advertising costs are expensed as incurred and were $811 million, $943 million, and$836 million, during Fiscal 2009, 2008, and 2007, respectively. General and administrative expenses include items for Dell’sadministrative functions, such as Finance, Legal, Human Resources, and Information Technology support. These functions includecosts for items such as salaries, maintenance and supplies, insurance, depreciation expense, and allowance for doubtful accounts.
Research, Development, and Engineering Costs — Research, development, and engineering costs are expensed as incurred, inaccordance with SFAS No. 2, Accounting for Research and Development Costs. Research, development, and engineering expensesprimarily include payroll and headcount related costs, contractor fees, infrastructure costs, and administrative expenses directly related toresearch and development support.
In Process Research and Development (“IPR&D”) — IPR&D represents the fair value of the technology acquired in a businesscombination where technological feasibility has not been established and no future alternative uses exist. IPR&D is expensedimmediately upon completion of the associated acquisition.
Website Development Costs — Dell expenses, as incurred, the costs of maintenance and minor enhancements to the features andfunctionality of its websites.
Income Taxes — Deferred tax assets and liabilities are recorded based on the difference between the financial statement and tax basis ofassets and liabilities using enacted tax rates in effect for the year in which the differences are expected to reverse. Dell calculates aprovision for income taxes using the asset and liability method, under which deferred tax assets and liabilities are recognized byidentifying the temporary differences arising from the different treatment of items for tax and accounting purposes. In determining thefuture tax consequences of events that have been recognized in the financial statements or tax returns, judgment and interpretation ofstatutes is required. Additionally, Dell uses tax planning strategies as a part of its global tax compliance program. Judgments andinterpretation of statutes are inherent in this process.
Comprehensive Income — Dell’s comprehensive income is comprised of net income, unrealized gains and losses on marketablesecurities classified as available-for-sale, unrealized gains and losses related to the change in valuation of retained interest in securitizedassets, foreign currency translation adjustments, and unrealized gains and losses on derivative financial instruments related to foreigncurrency hedging. Upon the adoption of SFAS No. 155, Accounting for Certain Hybrid Financial Instruments — an amendment of FASBStatements No. 133 and 140, beginning the first quarter of Fiscal 2008, all gains and losses in valuation of retained interest in securitizedassets are recognized in income immediately and no longer included as a component of accumulated other comprehensive income (loss).
Earnings Per Common Share — Basic earnings per share is based on the weighted-average effect of all common shares issued andoutstanding, and is calculated by dividing net income by the weighted-average shares outstanding during the period. Diluted earnings pershare is calculated by dividing net income by the weighted-average number of common shares used in the basic earnings per sharecalculation plus the number of common shares that would be issued assuming exercise or conversion of all potentially dilutive commonshares outstanding. Dell excludes equity instruments from the calculation of diluted earnings per share if the effect of including suchinstruments is antidilutive. Accordingly, certain stock-based incentive awards have been excluded from the calculation of dilutedearnings per share totaling 252 million, 230 million, and 268 million shares during Fiscal 2009, 2008, and 2007, respectively.
59
DELL INC.
NOTES TO CONSOLIDATED FINANCIAL STATEMENTS (Continued)

The following table sets forth the computation of basic and diluted earnings per share for each of the past three fiscal years:
January 30,2009
February 1,2008
February 2,2007
Fiscal Year Ended
(in millions, except per share amounts)Numerator:
Net income . . . . . . . . . . . . . . . . . . . . . . . . . . . . . . . . . . . . . . . . . . . . . $ 2,478 $ 2,947 $ 2,583
Denominator:
Weighted-average shares outstanding:
Basic . . . . . . . . . . . . . . . . . . . . . . . . . . . . . . . . . . . . . . . . . . . . . . . . . . 1,980 2,223 2,255
Effect of dilutive options, restricted stock units, restricted stock, andother . . . . . . . . . . . . . . . . . . . . . . . . . . . . . . . . . . . . . . . . . . . . . . . . 6 24 16
Diluted . . . . . . . . . . . . . . . . . . . . . . . . . . . . . . . . . . . . . . . . . . . . . . . . 1,986 2,247 2,271
Earnings per common share:
Basic . . . . . . . . . . . . . . . . . . . . . . . . . . . . . . . . . . . . . . . . . . . . . . . . . . $ 1.25 $ 1.33 $ 1.15
Diluted . . . . . . . . . . . . . . . . . . . . . . . . . . . . . . . . . . . . . . . . . . . . . . . . $ 1.25 $ 1.31 $ 1.14
Stock-Based Compensation — Effective February 4, 2006, stock-based compensation expense is recorded based on the grant date fairvalue estimate in accordance with the provisions of SFAS No. 123 (revised 2004), Share-Based Payment (“SFAS 123(R)”). In March2005, the SEC issued SAB No. 107 (“SAB 107”) regarding the SEC’s interpretation of SFAS 123(R) and the valuation of share-basedpayments for public companies. We have applied the provisions of SAB 107 in our adoption of SFAS 123(R). See Note 5 of Notes toConsolidated Financial Statements included for further discussion of stock-based compensation.
Recently Issued and Adopted Accounting Pronouncements — In September 2006, the FASB issued SFAS No. 157, Fair ValueMeasurements (“SFAS 157”), which defines fair value, provides a framework for measuring fair value, and expands the disclosuresrequired for assets and liabilities measured at fair value. SFAS 157 applies to existing accounting pronouncements that require fair valuemeasurements; it does not require any new fair value measurements. Dell adopted the effective portions of SFAS 157 beginning the firstquarter of Fiscal 2009, and it did not have a material impact to Dell’s consolidated financial statements. In February 2008, FASB issuedFASB Staff Position (“FSP”) 157-2, Effective Date of FASB Statement No. 157 (“FSP 157-2”), which delays the effective date ofSFAS 157 for all nonfinancial assets and nonfinancial liabilities, except for items that are recognized or disclosed at fair value in thefinancial statements on a recurring basis (at least annually), until the beginning of the first quarter of Fiscal 2010. Dell is currentlyevaluating the inputs and techniques used in these measurements, including items such as impairment assessments of fixed assets andgoodwill impairment testing. Management does not expect the adoption of FSP 157-2 to have a material impact on Dell’s results ofoperations, financial position, and cash flows. See Note 2 of Notes to Consolidated Financial Statements for the impact of the adoptionSFAS 157.
On October 10, 2008, the FASB issued FSP No. FAS 157-3 “Determining the Fair Value of a Financial Asset When the Market for thatAsset is Not Active” (“FSP FAS 157-3”), which clarifies the application of SFAS 157 in a market that is not active. Additional guidance isprovided regarding how the reporting entity’s own assumptions should be considered when relevant observable inputs do not exist, howavailable observable inputs in a market that is not active should be considered when measuring fair value, and how the use of marketquotes should be considered when assessing the relevance of inputs available to measure fair value. FSP FAS 157-3 became effectiveimmediately upon issuance. Dell considered the additional guidance with respect to the valuation of its financial assets and liabilities andtheir corresponding designation within the fair value hierarchy. Its adoption did not have a material effect on Dell’s consolidated financialstatements.
In February 2007, the FASB issued SFAS No. 159, The Fair Value Option for Financial Assets and Financial Liabilities (“SFAS 159”),which provides companies with an option to report selected financial assets and liabilities at fair value with the changes in fair valuerecognized in earnings at each subsequent reporting date. SFAS 159 provides an opportunity to mitigate potential volatility in earnings
60
DELL INC.
NOTES TO CONSOLIDATED FINANCIAL STATEMENTS (Continued)

caused by measuring related assets and liabilities differently, and it may reduce the need for applying complex hedge accountingprovisions. While SFAS 159 became effective for Dell’s 2009 fiscal year, Dell did not elect the fair value measurement option for any ofits financial assets or liabilities.
Recently Issued Accounting Pronouncements — In December 2007, the FASB issued SFAS No. 141(R), Business Combinations(“SFAS 141(R)”). SFAS 141(R) requires that the acquisition method of accounting be applied to a broader set of business combinationsand establishes principles and requirements for how an acquirer recognizes and measures in its financial statements the identifiable assetsacquired, liabilities assumed, any noncontrolling interest in the acquiree, and the goodwill acquired. SFAS 141(R) also establishes thedisclosure requirements to enable the evaluation of the nature and financial effects of the business combination. SFAS 141(R) is effectivefor fiscal years beginning after December 15, 2008, and is required to be adopted by Dell beginning in the first quarter of Fiscal 2010.Management believes the adoption of SFAS 141(R) will not have an impact on Dell’s results of operations, financial position, and cashflows for acquisitions completed prior to Fiscal 2010. The impact of SFAS 141 (R) on Dell’s future consolidated results of operations andfinancial condition will be dependent on the size and nature of future combinations.
In December 2007, the FASB issued SFAS No. 160, Noncontrolling Interests in Consolidated Financial Statements — an amendment ofARB No. 51 (“SFAS 160”). SFAS 160 requires that the noncontrolling interest in the equity of a subsidiary be accounted for and reportedas equity, provides revised guidance on the treatment of net income and losses attributable to the noncontrolling interest and changes inownership interests in a subsidiary and requires additional disclosures that identify and distinguish between the interests of thecontrolling and noncontrolling owners. SFAS 160 also establishes disclosure requirements that clearly identify and distinguish betweenthe interests of the parent and the interests of the noncontrolling owners. SFAS 160 is effective for fiscal years beginning afterDecember 15, 2008 and is required to be adopted by Dell beginning in the first quarter of Fiscal 2010. Management does not expect theadoption of SFAS 160 to have a material impact on Dell’s results of operations, financial position, and cash flows.
In March 2008, the FASB issued SFAS No. 161, Disclosures about Derivative Instruments and Hedging Activities, an amendment ofFASB Statement No. 133 (“SFAS 161”), which requires additional disclosures about the objectives of derivative instruments and hedgingactivities, the method of accounting for such instruments under SFAS 133 and its related interpretations, and a tabular disclosure of theeffects of such instruments and related hedged items on a company’s financial position, financial performance, and cash flows. SFAS 161does not change the accounting treatment for derivative instruments and is effective for Dell beginning Fiscal 2010.
Reclassifications — To maintain comparability among the periods presented, Dell has revised the presentation of certain prior periodamounts reported within cash flow from operations presented in the Consolidated Statements of Cash Flows. The revision had no impactto the total change in cash from operating activities. Dell has also revised the classification of certain prior period amounts within theNotes to Consolidated Financial Statements. For further discussion regarding the reclassification of deferred service revenue andwarranty liability, see Note 9 of Notes to Consolidated Financial Statements.
NOTE 2 — FINANCIAL INSTRUMENTS
Fair Value Measurements
On February 2, 2008, Dell adopted the effective portions of SFAS 157. In February 2008, the FASB issued FSP 157-2, which provides aone year deferral of the effective date of SFAS 157 for all nonfinancial assets and nonfinancial liabilities, except those that are recognizedor disclosed at fair value in the financial statements on a recurring basis (at least annually). Therefore, Dell adopted the provisions ofSFAS 157 with respect to only financial assets and liabilities. SFAS 157 defines fair value, establishes a framework for measuring fairvalue, and enhances disclosure requirements for fair value measurements. This statement does not require any new fair valuemeasurements. SFAS 157 defines fair value as the price that would be received to sell an asset or paid to transfer a liability in anorderly transaction between market participants at the measurement date. In determining fair value, Dell uses various methods includingmarket, income, and cost approaches. Dell utilizes valuation techniques that maximize the use of observable inputs and minimizes the useof unobservable inputs. The adoption of this statement did not have a material effect on the consolidated financial statements.
As a basis for categorizing these inputs, SFAS 157 establishes the following hierarchy, which prioritizes the inputs used to measure fairvalue from market based assumptions to entity specific assumptions:
• Level 1: Inputs based on quoted market prices for identical assets or liabilities in active markets at the measurement date.
61
DELL INC.
NOTES TO CONSOLIDATED FINANCIAL STATEMENTS (Continued)

• Level 2: Observable inputs other than quoted prices included in Level 1, such as quoted prices for similar assets and liabilities in activemarkets; quoted prices for identical or similar assets and liabilities in markets that are not active; or other inputs that are observable orcan be corroborated by observable market data.
• Level 3: Inputs reflect management’s best estimate of what market participants would use in pricing the asset or liability at themeasurement date. The inputs are unobservable in the market and significant to the instrument’s valuation.
The following table presents Dell’s hierarchy for its assets and liabilities measured at fair value on a recurring basis as of January 30,2009:
QuotedPrices in
ActiveMarkets for
IdenticalAssets
SignificantOther
ObservableInputs
SignificantUnobservable
Inputs
Level 1 Level 2 Level 3 Total
(in millions)
Investments — available for sale securities . . . . . . . . . . . . $ - $ 1,135 $ 27 $ 1,162
Investments — trading securities . . . . . . . . . . . . . . . . . . . 1 73 - 74
Retained interest . . . . . . . . . . . . . . . . . . . . . . . . . . . . . . . - - 396 396
Derivative instruments . . . . . . . . . . . . . . . . . . . . . . . . . . . - 627 - 627
Total assets measured at fair value on recurring basis . . $ 1 $ 1,835 $ 423 $ 2,259
Derivative instruments . . . . . . . . . . . . . . . . . . . . . . . . . . . $ - $ 131 $ - $ 131
Total liabilities measured at fair value on recurringbasis . . . . . . . . . . . . . . . . . . . . . . . . . . . . . . . . . . . . $ - $ 131 $ - $ 131
The following section describes the valuation methodologies Dell uses to measure financial instruments at fair value:
Investments Available for Sale — The majority of Dell’s investment portfolio consists of various fixed income securities such asU.S. government and agencies, U.S. and international corporate, and state and municipal bonds. This portfolio of investments, atJanuary 30, 2009, is valued based on model driven valuations whereby all significant inputs are observable or can be derived from orcorroborated by observable market data for substantially the full term of the asset. Dell utilizes a pricing service to obtain fair valuepricing for the majority of the investment portfolio. Pricing for securities is based on proprietary models and inputs are documented inaccordance with the SFAS 157 hierarchy. Dell conducts reviews on a quarterly basis to verify pricing, assess liquidity and determine ifsignificant inputs have changed that would impact the SFAS 157 hierarchy disclosure.
Investments Trading Securities — The majority of Dell’s trading portfolio consists of various mutual funds and a small amount of equitysecurities. The Level 1 securities are valued using quoted prices for identical assets in active markets. The Level 2 securities includevarious mutual funds that are not exchange-traded and valued at their net asset value, which can be market corroborated.
Retained Interest — The fair value of the retained interest in securitized receivables is determined using a discounted cash flow model.Significant assumptions to the model include pool credit losses, payment rates, and discount rates. These assumptions are supported byboth historical experience and anticipated trends relative to the particular receivable pool. Retained interest in securitized receivables isincluded in financing receivables, current and long-term, on the Consolidated Statement of Financial Position. See Note 6 of Notes toConsolidated Financial Statements for additional information about retained interest.
Derivative Instruments — Dell’s derivative financial instruments consist of foreign currency forward and purchased option contracts.The portfolio is valued using internal models based on market observable inputs, including forward and spot prices for currencies, andimplied volatilities. Upon adoption of SFAS 157 in the first quarter of Fiscal 2009, Dell began factoring credit risk into the fair value
62
DELL INC.
NOTES TO CONSOLIDATED FINANCIAL STATEMENTS (Continued)

calculation of its derivative instrument portfolio. Credit risk is quantified through the use of Credit Default Swaps spreads based on acomposite of Dell’s counterparties, which represents the cost of protection in the event the counterparty or Dell were to default on theobligation.
The following table shows a reconciliation of the beginning and ending balances for fair value measurements using significantunobservable inputs (Level 3) for the fiscal year ended January 30, 2009:
Fiscal Year Ended January 30, 2009RetainedInterest
InvestmentsAvailablefor Sale Total
(in millions)
Balance at February 1, 2008 . . . . . . . . . . . . . . . . . . . . . . . . . . . . . . . . . . . . . . . $ 223 $ - $ 223
Net unrealized (losses) gains included in earnings(a) . . . . . . . . . . . . . . . . . . . . (8) 2 (6)
Issuances and settlements, net . . . . . . . . . . . . . . . . . . . . . . . . . . . . . . . . . . . . 181 - 181
Purchases . . . . . . . . . . . . . . . . . . . . . . . . . . . . . . . . . . . . . . . . . . . . . . . . . . . - 25 25
Balance at January 30, 2009 . . . . . . . . . . . . . . . . . . . . . . . . . . . . . . . . . . . . . . . $ 396 $ 27 $ 423
(a) The unrealized gains on investments available for sale represent accrued interest.
Unrealized losses for the fiscal year ended January 30, 2009, related to the Level 3 retained interest asset and convertible debt securityasset still held at the reporting date, are reported in income.
Items Measured at Fair Value on a Nonrecurring Basis — Certain financial assets and liabilities are measured at fair value on anonrecurring basis and therefore not included in the recurring fair value table. The balances are not material relative to Dell’s balancesheet, and there were no material non-recurring adjustments to disclose under the provisions of SFAS 157 for the fiscal year endedJanuary 30, 2009.
Investments
The following table summarizes, by major security type, the fair value and cost of Dell’s investments. All investments with remainingmaturities in excess of one year are recorded as long-term investments in the Consolidated Statements of Financial Position.
FairValue Cost
UnrealizedGain
Unrealized(Loss)
FairValue Cost
UnrealizedGain
Unrealized(Loss)
January 30, 2009 February 1, 2008
(in millions)
Debt securities:
U.S. government and agencies . . . . . . . . . . $ 539 $ 537 $ 3 $ (1) $ 1,013 $ 991 $ 23 $ (1)
U.S. corporate . . . . . . . . . . . . . . . . . . . . . 457 464 2 (9) 571 569 10 (8)
International corporate . . . . . . . . . . . . . . . . 78 77 1 (0) 68 67 1 -
State and municipal governments . . . . . . . . 5 5 0 - 5 5 - -
Subtotal . . . . . . . . . . . . . . . . . . . . . . . . 1,079 1,083 6 (10) 1,657 1,632 34 (9)
Equity and other securities . . . . . . . . . . . . . . 115 115 - - 111 111 - -
Investments. . . . . . . . . . . . . . . . . . . . . . $ 1,194 $ 1,198 $ 6 $ (10) $ 1,768 $ 1,743 $ 34 $ (9)
Short-term . . . . . . . . . . . . . . . . . . . . . . . . . . $ 740 $ 737 $ 4 $ (1) $ 208 $ 206 $ 2 $ -
Long-term . . . . . . . . . . . . . . . . . . . . . . . . . . 454 461 2 (9) 1,560 1,537 32 (9)
Investments. . . . . . . . . . . . . . . . . . . . . . $ 1,194 $ 1,198 $ 6 $ (10) $ 1,768 $ 1,743 $ 34 $ (9)
63
DELL INC.
NOTES TO CONSOLIDATED FINANCIAL STATEMENTS (Continued)
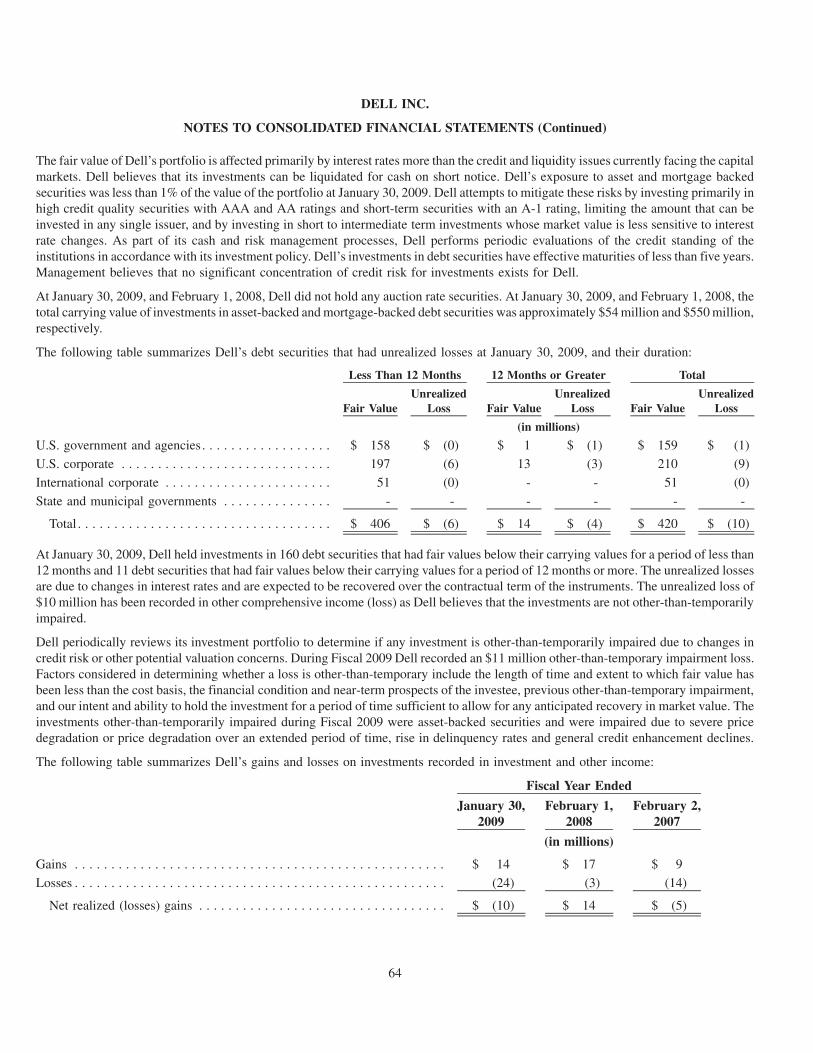
The fair value of Dell’s portfolio is affected primarily by interest rates more than the credit and liquidity issues currently facing the capitalmarkets. Dell believes that its investments can be liquidated for cash on short notice. Dell’s exposure to asset and mortgage backedsecurities was less than 1% of the value of the portfolio at January 30, 2009. Dell attempts to mitigate these risks by investing primarily inhigh credit quality securities with AAA and AA ratings and short-term securities with an A-1 rating, limiting the amount that can beinvested in any single issuer, and by investing in short to intermediate term investments whose market value is less sensitive to interestrate changes. As part of its cash and risk management processes, Dell performs periodic evaluations of the credit standing of theinstitutions in accordance with its investment policy. Dell’s investments in debt securities have effective maturities of less than five years.Management believes that no significant concentration of credit risk for investments exists for Dell.
At January 30, 2009, and February 1, 2008, Dell did not hold any auction rate securities. At January 30, 2009, and February 1, 2008, thetotal carrying value of investments in asset-backed and mortgage-backed debt securities was approximately $54 million and $550 million,respectively.
The following table summarizes Dell’s debt securities that had unrealized losses at January 30, 2009, and their duration:
Fair ValueUnrealized
Loss Fair ValueUnrealized
Loss Fair ValueUnrealized
Loss
Less Than 12 Months 12 Months or Greater Total
(in millions)
U.S. government and agencies. . . . . . . . . . . . . . . . . . $ 158 $ (0) $ 1 $ (1) $ 159 $ (1)
U.S. corporate . . . . . . . . . . . . . . . . . . . . . . . . . . . . . 197 (6) 13 (3) 210 (9)
International corporate . . . . . . . . . . . . . . . . . . . . . . . 51 (0) - - 51 (0)
State and municipal governments . . . . . . . . . . . . . . . - - - - - -
Total . . . . . . . . . . . . . . . . . . . . . . . . . . . . . . . . . . . $ 406 $ (6) $ 14 $ (4) $ 420 $ (10)
At January 30, 2009, Dell held investments in 160 debt securities that had fair values below their carrying values for a period of less than12 months and 11 debt securities that had fair values below their carrying values for a period of 12 months or more. The unrealized lossesare due to changes in interest rates and are expected to be recovered over the contractual term of the instruments. The unrealized loss of$10 million has been recorded in other comprehensive income (loss) as Dell believes that the investments are not other-than-temporarilyimpaired.
Dell periodically reviews its investment portfolio to determine if any investment is other-than-temporarily impaired due to changes incredit risk or other potential valuation concerns. During Fiscal 2009 Dell recorded an $11 million other-than-temporary impairment loss.Factors considered in determining whether a loss is other-than-temporary include the length of time and extent to which fair value hasbeen less than the cost basis, the financial condition and near-term prospects of the investee, previous other-than-temporary impairment,and our intent and ability to hold the investment for a period of time sufficient to allow for any anticipated recovery in market value. Theinvestments other-than-temporarily impaired during Fiscal 2009 were asset-backed securities and were impaired due to severe pricedegradation or price degradation over an extended period of time, rise in delinquency rates and general credit enhancement declines.
The following table summarizes Dell’s gains and losses on investments recorded in investment and other income:
January 30,2009
February 1,2008
February 2,2007
Fiscal Year Ended
(in millions)
Gains . . . . . . . . . . . . . . . . . . . . . . . . . . . . . . . . . . . . . . . . . . . . . . . . . . . $ 14 $ 17 $ 9
Losses . . . . . . . . . . . . . . . . . . . . . . . . . . . . . . . . . . . . . . . . . . . . . . . . . . . (24) (3) (14)
Net realized (losses) gains . . . . . . . . . . . . . . . . . . . . . . . . . . . . . . . . . . $ (10) $ 14 $ (5)
64
DELL INC.
NOTES TO CONSOLIDATED FINANCIAL STATEMENTS (Continued)
Foreign Currency Instruments
As part of its risk management strategy, Dell uses derivative instruments, primarily forward contracts and options, to hedge certainforeign currency exposures. Dell’s objective is to offset gains and losses resulting from these exposures with gains and losses on thederivative contracts used to hedge them, thereby reducing volatility of earnings and protecting fair values of assets and liabilities. Dellapplies hedge accounting based upon the criteria established by SFAS 133, whereby Dell designates its derivatives as fair value hedges orcash flow hedges. Dell estimates the fair values of derivatives based on quoted market prices or pricing models using current market ratesand records all derivatives in the Consolidated Statements of Financial Position at fair value.
Cash Flow Hedges
Dell uses a combination of forward contracts and options designated as cash flow hedges to protect against the foreign currency exchangerate risks inherent in its forecasted transactions denominated in currencies other than the U.S. dollar. The risk of loss associated withpurchased options is limited to premium amounts paid for the option contracts. The risk of loss associated with forward contracts is equalto the exchange rate differential from the time the contract is entered into until the time it is settled. These contracts typically expire in12 months or less. For derivative instruments that are designated and qualify as cash flow hedges, Dell records the effective portion of thegain or loss on the derivative instrument in accumulated other comprehensive income (loss) as a separate component of stockholders’equity and reclassifies these amounts into earnings in the period during which the hedged transaction is recognized in earnings. Dellreports the effective portion of cash flow hedges in the same financial statement line item, within earnings, as the changes in value of thehedged item.
For foreign currency option and forward contracts designated as cash flow hedges, Dell assesses hedge effectiveness both at the onset ofthe hedge as well as at the end of each fiscal quarter throughout the life of the derivative. Dell measures hedge ineffectiveness bycomparing the cumulative change in the fair value of the hedge contract with the cumulative change in the fair value of the hedged item,both of which are based on forward rates. Dell recognizes any ineffective portion of the hedge, as well as amounts not included in theassessment of effectiveness, currently in earnings as a component of investment and other income, net. Hedge ineffectiveness for cashflow hedges was not material for Fiscal 2009, 2008, and 2007. During Fiscal 2009, 2008, and 2007, Dell did not discontinue any cashflow hedges that had a material impact on Dell’s results of operations as substantially all forecasted foreign currency transactions wererealized in Dell’s actual results.
Changes in the aggregate unrealized net gain (loss) of Dell’s cash flow hedges that are recorded as a component of comprehensive income(loss), net of tax, are presented in the table below. Dell expects to reclassify substantially all of the unrealized net gain recorded inaccumulated other comprehensive income (loss) at January 30, 2009, into earnings during the next fiscal year, providing an offsettingeconomic impact against the settlement of the underlying transactions.
January 30,2009
February 1,2008
February 2,2007
Fiscal Year Ended
(in millions)
Aggregate unrealized net (losses) gains at beginning of year . . . . . . . . $ (25) $ 13 $ (17)
Net gains (losses) reclassified to earnings . . . . . . . . . . . . . . . . . . . . 603 (392) (260)
Change in fair value of cash flow hedges . . . . . . . . . . . . . . . . . . . . (254) 354 290
Aggregate unrealized net gains (losses) at end of year . . . . . . . . . . . . $ 324 $ (25) $ 13
Other Foreign Currency Derivative Instruments
Dell uses forward contracts to hedge monetary assets and liabilities, primarily receivables and payables, denominated in a foreigncurrency. The change in the fair value of these instruments represents a natural hedge as their gains and losses offset the changes in theunderlying fair value of the monetary assets and liabilities due to movements in currency exchange rates. These contracts generally
65
DELL INC.
NOTES TO CONSOLIDATED FINANCIAL STATEMENTS (Continued)

expire in three months or less. These contracts are not designated as hedges under SFAS 133, and therefore, the change in the instrument’sfair value is recognized currently in earnings as a component of investment and other income, net.
The gross notional value of foreign currency derivative financial instruments and the related net asset or liability was as follows:
GrossNotional
Net Asset(Liability)
GrossNotional
Net Asset(Liability)
January 30, 2009 February 1, 2008
(in millions)
Cash flow hedges . . . . . . . . . . . . . . . . . . . . . . . . . . . . . . . . . . . . $ 6,581 $ 542 $ 7,772 $ (9)
Other derivatives . . . . . . . . . . . . . . . . . . . . . . . . . . . . . . . . . . . . 581 (46) (1,338) 8
$ 7,162 $ 496 $ 6,434 $ (1)
Commercial Paper
Dell has a commercial paper program with a supporting senior unsecured revolving credit facility that allows Dell to obtain favorableshort-term borrowing rates. The commercial paper program and related revolving credit facility were increased from $1.0 billion to$1.5 billion on April 4, 2008. Dell pays facility commitment fees at rates based upon Dell’s credit rating. Unless extended, $500 millionexpires on April 3, 2009, and $1.0 billion expires on June 1, 2011. The credit facility requires compliance with conditions that must besatisfied prior to any borrowing, as well as ongoing compliance with specified affirmative and negative covenants, including maintenanceof a minimum interest coverage ratio. Amounts outstanding under the facility may be accelerated for typical defaults, including failure topay principal or interest, breaches of covenants, non-payment of judgments or debt obligations in excess of $200 million, occurrence of achange of control, and certain bankruptcy events. There were no events of default as of January 30, 2009.
At January 30, 2009, there was $100 million outstanding under the commercial paper program and no outstanding advances under therelated revolving credit facilities. The weighted-average interest rate on these outstanding short-term borrowings was 0.19%. AtFebruary 1, 2008, there were no outstanding advances under the commercial paper program or the related credit facility. Dell uses theproceeds of the program for short-term liquidity needs.
India Credit Facilities
Dell India Pvt Ltd. (“Dell India”), Dell’s wholly-owned subsidiary, maintains unsecured short-term credit facilities with Citibank N.A.Bangalore Branch India (“Citibank India”) that provide a maximum capacity of $30 million to fund Dell India’s working capital andimport buyers’ credit needs. The capacity increased from $30 million to $55 million on August 6, 2008. The incremental $25 million lineof credit expired on December 31, 2008, and was not renewed. Financing is available in both Indian Rupees and foreign currencies. Theborrowings are extended on an unsecured basis based on Dell’s guarantee to Citibank N.A. Citibank India can cancel the facilities inwhole or in part without prior notice, at which time any amounts owed under the facilities will become immediately due and payable.Interest on the outstanding loans is charged monthly and is calculated based on Citibank India’s internal cost of funds plus 0.25%. AtJanuary 30, 2009, and February 1, 2008, outstanding advances from Citibank India totaled $12 million and $23 million, respectively, andare included in short-term debt on Dell’s Consolidated Statement of Financial Position. There have been no events of default.
66
DELL INC.
NOTES TO CONSOLIDATED FINANCIAL STATEMENTS (Continued)

Long-Term Debt and Interest Rate Risk Management
The following table summarizes our long-term debt at:
January 30,2009
February 1,2008
(in millions)Long-term debt:
Indenture:
$600 million issued on April 17, 2008 at 4.70% due April 2013 with interestpayable April 15 and October 15 . . . . . . . . . . . . . . . . . . . . . . . . . . . . . . . . . . . . $ 599 $ -
$500 million issued on April 17, 2008 at 5.65% due April 2018 with interestpayable April 15 and October 15 . . . . . . . . . . . . . . . . . . . . . . . . . . . . . . . . . . . . 499 -
$400 million issued on April 17, 2008 at 6.50% due April 2038 with interestpayable April 15 and October 15 . . . . . . . . . . . . . . . . . . . . . . . . . . . . . . . . . . . . 400 -
Senior Debentures
$300 million issued on April 1998 at 7.10% due April 2028 with interest payableApril 15 and October 15 (includes the impact of interest rate swaps) . . . . . . . . . . 400 359
Senior Notes
$200 million issued on April 1998 at 6.55% due April 2008 with interest payableApril 15 and October 15 (includes fair value adjustment related to SFAS 133) . . . - 201
1,898 560
Other . . . . . . . . . . . . . . . . . . . . . . . . . . . . . . . . . . . . . . . . . . . . . . . . . . . . . . . . . . . . . . - 2
Less current portion . . . . . . . . . . . . . . . . . . . . . . . . . . . . . . . . . . . . . . . . . . . . . . . . . . . - (200)
Total long-term debt . . . . . . . . . . . . . . . . . . . . . . . . . . . . . . . . . . . . . . . . . . . . . . $ 1,898 $ 362
During Fiscal 2009, Dell Inc. issued and sold debt comprising $600 million aggregate principal amount due 2013 with a fixed interest rateof 4.70% (“2013 Notes”), $500 million aggregate principal amount due 2018 with a fixed interest rate of 5.65% (“2018 Notes”), and$400 million aggregate principal amount due 2038 with a fixed interest rate of 6.50% Notes (“2038 Notes”), and together with the 2013Notes and the 2018 Notes, (“Notes”). The Notes are unsecured obligations and rank equally with Dell’s existing and future unsecuredsenior indebtedness. The Notes effectively rank junior to all indebtedness and other liabilities, including trade payables, of Dell’ssubsidiaries. The net proceeds from the offering of the Notes were approximately $1.5 billion after payment of expenses of the offering.The estimated fair value of the long-term debt was approximately $1.5 billion at January 30, 2009, compared to a carrying value of$1.5 billion at that date.
The Notes were issued pursuant to an Indenture dated as of April 17, 2008 (“Indenture”), between Dell and a trustee. The Indenturecontains customary events of default with respect to the Notes, including failure to make required payments, failure to comply withcertain agreements or covenants and certain events of bankruptcy and insolvency. The Indenture also contains covenants limiting Dell’sability to create certain liens, enter into sale-and-leaseback transactions and consolidate or merge with, or convey, transfer or lease all orsubstantially all of Dell’s assets to, another person. The Notes will be redeemable, in whole or in part at any time, at Dell’s option, at a“make-whole premium” redemption price calculated by Dell equal to the greater of (i) 100% of the principal amount of the Notes to beredeemed; and (ii) the sum of the present values of the remaining scheduled payments of principal and interest thereon (not including anyportion of such payments of interest accrued as of the date of redemption) discounted to the date of redemption on a semi-annual basis(assuming a 360-day year consisting of twelve 30-day months) at the Treasury Rate (as defined in the Indenture) plus 35 basis points, plusaccrued interest thereon to the date of redemption.
The Senior Debentures generally contain no restrictive covenants, other than a limitation on liens on Dell’s assets and a limitation on sale-and-leaseback transactions involving Dell property. Interest rate swap agreements were entered into concurrently with the issuance of theSenior Debentures to convert the fixed rate to a floating rate for a notional amount of $300 million and were set to mature April 15, 2028.
67
DELL INC.
NOTES TO CONSOLIDATED FINANCIAL STATEMENTS (Continued)

The floating rates were based on three-month London Interbank Offered Rates plus 0.79%. In January 2009, Dell terminated its interestrate swap contracts with notional amounts totaling $300 million. Dell received $103 million in cash proceeds from the swap terminations,which included $1 million in accrued interest. These swaps had effectively converted its $300 million, 7.10% fixed rate SeniorDebentures due 2028 to variable rate debt. As a result of the swap terminations, the fair value of the terminated swaps are reported as partof the carrying value of the Senior Debentures and are amortized as a reduction of interest expense over the remaining life of the debt. Thecash flows from the terminated swap contracts are reported as operating activities in the Consolidated Statement of Cash Flows.
As of January 30, 2009, there were no events of default for the Indenture and the Senior Debentures.
Dell’s effective interest rate for the Senior Debentures was 4.57% for Fiscal 2009. The principal amount of the debt was $300 million atJanuary 30, 2009. The estimated fair value of the long-term debt was approximately $294 million at January 30, 2009, compared to acarrying value of $400 million at that date as a result of the termination of the interest rate swap agreements.
Prior to the termination of the interest rate swap contracts, the interest rate swaps qualified for hedge accounting treatment pursuant toSFAS No. 133, Accounting for Derivative Instruments and Hedging Activities, as amended. Dell designated the issuance of the SeniorDebentures and the related interest rate swap agreements as an integrated transaction. The changes in the fair value of the interest rateswaps were reflected in the carrying value of the interest rate swaps on the balance sheet. The carrying value of the debt on the balancesheet was adjusted by an equal and offsetting amount. The differential to be paid or received on the interest rate swap agreements wasaccrued and recognized as an adjustment to interest expense as interest rates changed.
On April 15, 2008, Dell repaid the principal balance of the 1998 $200 million 6.55% fixed rate senior notes (the “Senior Notes”) upontheir maturity. Interest rate swap agreement related to the Senior Notes had a notional amount of $200 million and also matured April 15,2008. Dell’s effective interest rate for the Senior Notes, prior to repayment, was 4.03% for the first quarter of Fiscal 2009.
In November 2008, Dell filed a shelf registration statement with the SEC, which provides Dell with the ability to issue additional termdebt up to $1.5 billion, subject to market conditions.
NOTE 3 — INCOME TAXES
Income before income taxes included approximately $2.6 billion, $3.2 billion, and $2.6 billion related to foreign operations in Fiscal2009, 2008 and 2007 respectively.
The provision for income taxes consisted of the following:
January 30,2009
February 1,2008
February 2,2007
Fiscal Year Ended
(in millions)Current:
Domestic . . . . . . . . . . . . . . . . . . . . . . . . . . . . . . . . . . . . . . . . . . . . . . . $ 465 $ 901 $ 846
Foreign . . . . . . . . . . . . . . . . . . . . . . . . . . . . . . . . . . . . . . . . . . . . . . . . 295 287 178
Deferred . . . . . . . . . . . . . . . . . . . . . . . . . . . . . . . . . . . . . . . . . . . . . . . . . 86 (308) (262)
Provision for income taxes . . . . . . . . . . . . . . . . . . . . . . . . . . . . . . . . . . . . $ 846 $ 880 $ 762
Deferred tax assets and liabilities for the estimated tax impact of temporary differences between the tax and book basis of assets andliabilities are recognized based on the enacted statutory tax rates for the year in which Dell expects the differences to reverse. Avaluationallowance is established against a deferred tax asset when it is more likely than not that the asset or any portion thereof will not berealized. Based upon all the available evidence including expectation of future taxable income, Dell has provided a valuation allowanceof $31 million related to state credit carryforwards, but determined that it will be able to realize the remainder of its deferred tax assets.
68
DELL INC.
NOTES TO CONSOLIDATED FINANCIAL STATEMENTS (Continued)

The components of Dell’s net deferred tax asset are as follows:
January 30,2009
February 1,2008
(in millions)Deferred tax assets:
Deferred revenue . . . . . . . . . . . . . . . . . . . . . . . . . . . . . . . . . . . . . . . . . . . . . . . . . . . . . $ 633 $ 597
Inventory and warranty provisions . . . . . . . . . . . . . . . . . . . . . . . . . . . . . . . . . . . . . . . . 36 46
Investment impairments and unrealized losses . . . . . . . . . . . . . . . . . . . . . . . . . . . . . . . . 5 10
Provisions for product returns and doubtful accounts . . . . . . . . . . . . . . . . . . . . . . . . . . . 53 61
Capital loss . . . . . . . . . . . . . . . . . . . . . . . . . . . . . . . . . . . . . . . . . . . . . . . . . . . . . . . . . 1 7
Leasing and financing . . . . . . . . . . . . . . . . . . . . . . . . . . . . . . . . . . . . . . . . . . . . . . . . . 242 302
Credit carryforwards. . . . . . . . . . . . . . . . . . . . . . . . . . . . . . . . . . . . . . . . . . . . . . . . . . . 47 3
Loss carryforwards . . . . . . . . . . . . . . . . . . . . . . . . . . . . . . . . . . . . . . . . . . . . . . . . . . . . 88 16
Stock-based and deferred compensation . . . . . . . . . . . . . . . . . . . . . . . . . . . . . . . . . . . . 233 188
Operating accruals . . . . . . . . . . . . . . . . . . . . . . . . . . . . . . . . . . . . . . . . . . . . . . . . . . . . 33 58
Compensation related accruals . . . . . . . . . . . . . . . . . . . . . . . . . . . . . . . . . . . . . . . . . . . 48 40
Other . . . . . . . . . . . . . . . . . . . . . . . . . . . . . . . . . . . . . . . . . . . . . . . . . . . . . . . . . . . . . . 116 78
Deferred tax assets . . . . . . . . . . . . . . . . . . . . . . . . . . . . . . . . . . . . . . . . . . . . . . . . . . 1,535 1,406
Deferred tax liabilities:
Property and equipment . . . . . . . . . . . . . . . . . . . . . . . . . . . . . . . . . . . . . . . . . . . . . . . . (160) (105)
Acquired intangibles. . . . . . . . . . . . . . . . . . . . . . . . . . . . . . . . . . . . . . . . . . . . . . . . . . . (204) (199)
Unrealized gains . . . . . . . . . . . . . . . . . . . . . . . . . . . . . . . . . . . . . . . . . . . . . . . . . . . . . (14) -
Other . . . . . . . . . . . . . . . . . . . . . . . . . . . . . . . . . . . . . . . . . . . . . . . . . . . . . . . . . . . . . . (59) (21)
Deferred tax liabilities . . . . . . . . . . . . . . . . . . . . . . . . . . . . . . . . . . . . . . . . . . . . . . . (437) (325)
Valuation allowance . . . . . . . . . . . . . . . . . . . . . . . . . . . . . . . . . . . . . . . . . . . . . . . . . . . (31) -
Net deferred tax asset . . . . . . . . . . . . . . . . . . . . . . . . . . . . . . . . . . . . . . . . . . . . . . . . $ 1,067 $ 1,081
Current portion (included in other current assets). . . . . . . . . . . . . . . . . . . . . . . . . . . . . . $ 499 $ 596
Non-current portion (included in other non-current assets) . . . . . . . . . . . . . . . . . . . . . . . 568 485
Net deferred tax asset . . . . . . . . . . . . . . . . . . . . . . . . . . . . . . . . . . . . . . . . . . . . . . . . $ 1,067 $ 1,081
As of January 30, 2009, Dell has recorded $76 million of deferred tax assets related to acquired net operating loss and creditcarryforwards. The offset for recording the acquired net operating loss and credit carryforwards was $56 million to goodwill and$20 million to additional-paid-in-capital. Utilization of the acquired carryforwards is subject to limitations due to ownership changes,which may delay the utilization of a portion of the acquired carryforwards. The carryforwards for significant taxing jurisdictions expirebeginning Fiscal 2017.
Deferred taxes have not been recorded on the excess book basis in the shares of certain foreign subsidiaries because these basisdifferences are not expected to reverse in the foreseeable future and are expected to be permanent in duration. These basis differences inthe amount of approximately $9.9 billion arose primarily from the undistributed book earnings of substantially all of the subsidiaries inwhich Dell intends to reinvest indefinitely. The basis differences could reverse through a sale of the subsidiaries or the receipt ofdividends from the subsidiaries, as well as various other events. Net of available foreign tax credits, residual income tax of approximately$3.2 billion would be due upon reversal of this excess book basis as of January 30, 2009.
69
DELL INC.
NOTES TO CONSOLIDATED FINANCIAL STATEMENTS (Continued)

A portion of Dell’s operations is subject to a reduced tax rate or is free of tax under various tax holidays that expire in whole or in partduring Fiscal 2010 through 2018. Many of these tax holidays and reduced tax rates may be extended when certain conditions are met ormay be terminated early if certain conditions are not met. The income tax benefits attributable to the tax status of these subsidiaries wereestimated to be approximately $338 million ($0.17 per share) in Fiscal 2009, $502 million ($0.23 per share) in Fiscal 2008, and$282 million ($0.13 per share) in Fiscal 2007.
In March 2007, China announced a broad program to reform tax rates and incentives, effective January 1, 2008, including theintroduction of phased-in transition rules that could significantly alter the Chinese tax structure for U.S. companies operating in China.Clarification of the rules, which phase in higher statutory tax rates over a five year period, was issued in late Fiscal 2008. As a result, Dellincreased the relevant deferred tax assets to reflect the enacted statutory rates for the year in which it expects the differences to reverse,which resulted in an additional tax benefit of $27 million in Fiscal 2008.
The effective tax rate differed from the statutory U.S. federal income tax rate as follows:
January 30,2009
February 1,2008
February 2,2007
Fiscal Year Ended
U.S. federal statutory rate. . . . . . . . . . . . . . . . . . . . . . . . . . . . . . . . . . . . . 35.0% 35.0% 35.0%
Foreign income taxed at different rates . . . . . . . . . . . . . . . . . . . . . . . . . . . (11.2) (13.6) (14.9)
Imputed intercompany charges . . . . . . . . . . . . . . . . . . . . . . . . . . . . . . . . . - - 2.0In-process research and development . . . . . . . . . . . . . . . . . . . . . . . . . . . . - 0.8 -
Other. . . . . . . . . . . . . . . . . . . . . . . . . . . . . . . . . . . . . . . . . . . . . . . . . . . . 1.6 0.8 0.7
Total . . . . . . . . . . . . . . . . . . . . . . . . . . . . . . . . . . . . . . . . . . . . . . . . . . 25.4% 23.0% 22.8%
The increase in Dell’s Fiscal 2009 effective tax rate, compared to Fiscal 2008, is due primarily to an increased profitability mix in highertax jurisdictions during Fiscal 2009 as compared to Fiscal 2008. The increase in Dell’s Fiscal 2008 effective tax rate, compared to Fiscal2007, is due to the tax related to accessing foreign cash and the nondeductibility of acquisition-related IPR&D charges offset primarily bythe increase of consolidated profitability in lower foreign tax jurisdictions during Fiscal 2008 as compared to Fiscal 2007.
Dell adopted FIN No. 48, Accounting for Uncertainty in Income Taxes — an interpretation of FASB Statement No. 109 (“FIN 48”)effective February 3, 2007. FIN 48 provides that a tax benefit from an uncertain tax position may be recognized in the financial statementsonly when it is more likely than not that the position will be sustained upon examination, including resolution of any related appeals orlitigation processes, based on the technical merits and a consideration of the relevant taxing authority’s widely understood administrativepractices and precedents. Once the recognition threshold is met, the portion of the tax benefit that is recorded represents the largestamount of tax benefit that is greater than 50 percent likely to be realized upon settlement with a taxing authority. The cumulative effect ofadopting FIN 48 was a $62 million increase in tax liabilities and a corresponding decrease to the February 2, 2007 stockholders’ equitybalance of which $59 million related to retained earnings and $3 million related to additional-paid-in-capital. In addition, consistent withthe provisions of FIN 48, Dell changed the classification of $1.1 billion of income tax liabilities from current to non-current becausepayment of cash is not anticipated within one year of the balance sheet date. These non-current income tax liabilities are recorded in other
70
DELL INC.
NOTES TO CONSOLIDATED FINANCIAL STATEMENTS (Continued)

non-current liabilities in the Consolidated Statements of Financial Position. A reconciliation of the beginning and ending amount ofunrecognized tax benefits is as follows:
Total
(in millions)Balance at February 3, 2007 (adoption) . . . . . . . . . . . . . . . . . . . . . . . . . . . . . . . . . . . . . . . . . . . . . . . . . . $ 1,096
Increases related to tax positions of the current year . . . . . . . . . . . . . . . . . . . . . . . . . . . . . . . . . . . . . . . 390
Increases related to tax positions of prior years . . . . . . . . . . . . . . . . . . . . . . . . . . . . . . . . . . . . . . . . . . . 34
Reductions for tax positions of prior years . . . . . . . . . . . . . . . . . . . . . . . . . . . . . . . . . . . . . . . . . . . . . . (13)
Lapse of statute of limitations . . . . . . . . . . . . . . . . . . . . . . . . . . . . . . . . . . . . . . . . . . . . . . . . . . . . . . . (6)
Settlements . . . . . . . . . . . . . . . . . . . . . . . . . . . . . . . . . . . . . . . . . . . . . . . . . . . . . . . . . . . . . . . . . . . . . (18)
Balance at February 1, 2008 . . . . . . . . . . . . . . . . . . . . . . . . . . . . . . . . . . . . . . . . . . . . . . . . . . . . . . . . . . $ 1,483
Increases related to tax positions of the current year . . . . . . . . . . . . . . . . . . . . . . . . . . . . . . . . . . . . . . . 298
Increases related to tax positions of prior years . . . . . . . . . . . . . . . . . . . . . . . . . . . . . . . . . . . . . . . . . . . 19
Reductions for tax positions of prior years . . . . . . . . . . . . . . . . . . . . . . . . . . . . . . . . . . . . . . . . . . . . . . (217)
Lapse of statute of limitations . . . . . . . . . . . . . . . . . . . . . . . . . . . . . . . . . . . . . . . . . . . . . . . . . . . . . . . (7)
Settlements . . . . . . . . . . . . . . . . . . . . . . . . . . . . . . . . . . . . . . . . . . . . . . . . . . . . . . . . . . . . . . . . . . . . . (38)
Balance at January 30, 2009 . . . . . . . . . . . . . . . . . . . . . . . . . . . . . . . . . . . . . . . . . . . . . . . . . . . . . . . . . . $ 1,538
Fiscal 2009 reductions for tax positions of prior years in the table above include $163 million of items that did not impact Dell’s effectivetax rate for Fiscal 2009. These items include foreign currency translation, withdrawal of positions expected to be taken for prior year taxfilings, and a reduction that is included in the deferred tax asset valuation allowance at January 30, 2009.
Associated with the unrecognized tax benefits of $1.5 billion at January 30, 2009, are interest and penalties as well as $166 million ofoffsetting tax benefits associated with estimated transfer pricing, the benefit of interest deductions, and state income tax benefits. The netamount of $1.8 billion, if recognized, would favorably affect Dell’s effective tax rate.
Interest and penalties related to income tax liabilities are included in income tax expense. The balance of gross accrued interest andpenalties recorded in the Consolidated Statements of Financial Position at January 30, 2009 and February 1, 2008, was $400 million and$288 million, respectively. During Fiscal 2009 and Fiscal 2008, $112 million and $88 million, respectively, related to interest andpenalties were included in income tax expense.
Dell is currently under income tax audits in various jurisdictions, including the U.S. The tax periods open to examination by the majortaxing jurisdictions to which Dell is subject include fiscal years 1997 through 2009. As a result of these audits, Dell maintains ongoingdiscussions and negotiations relating to tax matters with the taxing authorities in these various jurisdictions. Dell’s U.S. Federal incometax returns for fiscal years 2004 through 2006 are under examination, and the Internal Revenue Service has proposed certain preliminaryassessments primarily related to transfer pricing matters. Dell anticipates this audit will take several years to resolve and continues tobelieve that it has provided adequate reserves related to the matters under audit. However, should Dell experience an unfavorableoutcome in this matter, it could have a material impact on its results of operations, financial position, or cash flows. Although the timingof income tax audit resolution and negotiations with taxing authorities are highly uncertain, Dell does not anticipate a significant changeto the total amount of unrecognized income tax benefits within the next 12 months.
Dell takes certain non-income tax positions in the jurisdictions in which it operates and has received certain non-income tax assessmentsin various jurisdictions. Dell is also involved in related non-income tax litigation matters in various jurisdictions. Dell believes itspositions are supportable, a liability is not probable, and that it will ultimately prevail. However, significant judgment is required indetermining the ultimate outcome of these matters. In the normal course of business, Dell’s positions and conclusions related to its non-income taxes could be challenged and assessments may be made. To the extent new information is obtained and Dell’s views on itspositions, probable outcomes of assessments, or litigation changes, changes in estimates to Dell’s accrued liabilities would be recorded inthe period in which the determination is made.
71
DELL INC.
NOTES TO CONSOLIDATED FINANCIAL STATEMENTS (Continued)
NOTE 4 — CAPITALIZATION
Preferred Stock
Authorized Shares — Dell has the authority to issue five million shares of preferred stock, par value $.01 per share. At January 30, 2009,and February 1, 2008, no shares of preferred stock were issued or outstanding.
Redeemable Common Stock
In prior years, Dell inadvertently failed to register with the SEC the issuance of some shares under certain employee benefit plans. Theseshares were purchased by participants between March 31, 2006, and April 3, 2007. As a result, certain purchasers of securities pursuant tothose plans may have had the right to rescind their purchases for an amount equal to the purchase price paid for the securities, plus interestfrom the date of purchase. Dell made a registered rescission offer to eligible plan participants effective as of August 12, 2008. AtFebruary 1, 2008, and February 2, 2007, approximately 4 million shares ($94 million) and 5 million shares ($111 million), respectively,were classified outside stockholders’ equity because the redemption features were not within Dell’s control. Prior to the effective date ofthe rescission offer, as participants sold shares in the open market, the shares held outside of stockholders’ equity were reclassified tocommon stock and capital in excess of $0.01 par value, accordingly. These shares were treated as outstanding for financial reportingpurposes. The registered rescission offer expired on September 26, 2008, and payments of $29 million under the offer have beensubstantially completed. Upon expiration of the rescission offer, all remaining redeemable shares were reclassified to within stock-holders’ equity.
Common Stock
Authorized Shares — At January 30, 2009, Dell is authorized to issue 7.0 billion shares of common stock, par value $.01 per share.
Share Repurchase Program — Dell has a share repurchase program that authorizes it to purchase shares of common stock in order toincrease shareholder value and manage dilution resulting from shares issued under Dell’s equity compensation plans. However, Dell doesnot currently have a policy that requires the repurchase of common stock in conjunction with stock-based payment arrangements. DuringFiscal 2009, Dell repurchased approximately 134 million shares for an aggregate cost of approximately $2.9 billion. At January 30, 2009,Dell’s remaining authorized amount for share repurchases was $4.5 billion.
NOTE 5 — BENEFIT PLANS
Description of the Plans
Employee Stock Plans — Dell is currently issuing stock grants under the Dell Amended and Restated 2002 Long-Term Incentive Plan(“the 2002 Incentive Plan”), which was approved by shareholders on December 4, 2007. There are previous plans that have beenterminated except for options previously granted under those plans that are still outstanding. These are all collectively referred to as the“Stock Plans”.
The 2002 Incentive Plan provides for the granting of stock-based incentive awards to Dell’s employees and non-employee directors.Awards may be incentive stock options within the meaning of Section 422 of the Internal Revenue Code, nonqualified stock options,restricted stock, or restricted stock units. There were approximately 313 million, 292 million, and 271 million shares of Dell’s commonstock available for future grants under the Stock Plans at January 30, 2009, February 1, 2008, and February 2, 2007, respectively. Tosatisfy stock option exercises, Dell has a policy of issuing new shares as opposed to repurchasing shares on the open market.
Stock Option Agreements — The right to purchase shares pursuant to existing stock option agreements typically vests pro-rata at eachoption anniversary date over a three- to five-year period. The options, which are granted with option exercise prices equal to the fairmarket value of Dell’s common stock on the date of grant, generally expire within ten to twelve years from the date of grant.
Restricted Stock Awards — Awards of restricted stock may be either grants of restricted stock, restricted stock units, or performance-based stock units that are issued at no cost to the recipient. For restricted stock grants, at the date of grant, the recipient has all rights of astockholder, subject to certain restrictions on transferability and a risk of forfeiture. Restricted stock grants typically vest over a three- toseven-year period beginning on the date of grant. For restricted stock units, legal ownership of the shares is not transferred to the
72
DELL INC.
NOTES TO CONSOLIDATED FINANCIAL STATEMENTS (Continued)

employee until the unit vests, which is generally over a three- to five-year period. Dell also grants performance-based restricted stockunits as a long-term incentive in which an award recipient receives shares contingent upon Dell achieving performance objectives and theemployees’ continuing employment through the vesting period, which is generally over a three- to five-year period. Compensationexpense recorded in connection with these performance-based restricted stock units is based on Dell’s best estimate of the number ofshares that will eventually be issued upon achievement of the specified performance criteria and when it becomes probable that certainperformance goals will be achieved. The cost of these awards is determined using the fair market value of Dell’s common stock on thedate of the grant. Compensation expense for restricted stock awards with a service condition is recognized on a straight-line basis over thevesting term. Compensation expense for performance-based restricted stock awards is recognized on an accelerated multiple-awardapproach based on the most probable outcome of the performance condition.
Acceleration of Vesting of Options — On January 23, 2009, Dell’s Board of Directors approved the acceleration of the vesting ofunvested “out-of-the-money” stock options (options that have an exercise price greater than the current market stock price) with exerciseprices equal to or greater than $10.14 per share for approximately 2,800 employees holding options to purchase approximately 21 millionshares of common stock. Dell concluded the modification to the stated vesting provisions was substantive after Dell considered thevolatility of its share price and the exercise price of the amended options in relation to recent share values. Because the modification wasconsidered substantive, the remaining unearned compensation expense of $104 million was recorded as an expense in Fiscal 2009. Theweighted-average exercise price of the options that were accelerated was $21.90.
Temporary Suspension of Option Exercises, Vesting of Restricted Stock Units, and Employee Stock Purchase Plan (“ESPP”) Purchases— As a result of Dell’s inability to timely file its Annual Report on Form 10-K for Fiscal 2007, Dell suspended the exercise of employeestock options, the settlement of restricted stock units, and the purchase of shares under the ESPP on April 4, 2007. Dell resumed allowingthe exercise of employee stock options by employees and the settlement of restricted stock units on October 31, 2007. The purchase ofshares under the ESPP was not resumed as the plan was discontinued during the first quarter of Fiscal 2009.
Dell decided to pay cash to current and former employees who held “in-the-money” stock options (options that have an exercise price lessthan the current market stock price) that expired during the period of unexercisability due to Dell’s inability to timely file its AnnualReport on Form 10-K for Fiscal 2007. During Fiscal 2008, Dell made payments of approximately $107 million, which were expensed,relating to in-the-money stock options that expired in the second and third quarters of Fiscal 2008.
General Information
Stock Option Activity — The following table summarizes stock option activity for the Stock Plans during Fiscal 2009:
Numberof
Options
Weighted-AverageExercise
Price
Weighted-Average
RemainingContractual
Term
AggregateIntrinsic
Value(in millions) (per share) (in years) (in millions)
Options outstanding — February 1, 2008 . . . . . . . . . . . . . . . . . . . . 264 $ 32.30Granted. . . . . . . . . . . . . . . . . . . . . . . . . . . . . . . . . . . . . . . . . . . 13 19.71Exercised . . . . . . . . . . . . . . . . . . . . . . . . . . . . . . . . . . . . . . . . . (4) 19.08Forfeited . . . . . . . . . . . . . . . . . . . . . . . . . . . . . . . . . . . . . . . . . . (4) 23.97Cancelled/expired . . . . . . . . . . . . . . . . . . . . . . . . . . . . . . . . . . . (39) 33.14
Options outstanding — January 30, 2009 . . . . . . . . . . . . . . . . . . . . 230 $ 31.85
Vested and expected to vest (net of estimated forfeitures) —January 30, 2009(a)(b) . . . . . . . . . . . . . . . . . . . . . . . . . . . . . . . . . 230 $ 31.86 3.9 $ -
Exercisable — January 30, 2009(a)(b) . . . . . . . . . . . . . . . . . . . . . . . 230 $ 31.86 3.9 $ -
(a) For options vested and expected to vest and options exercisable, the aggregate intrinsic value in the table above represents the total pre-tax intrinsic value (the differencebetween Dell’s closing stock price on January 30, 2009, and the exercise price multiplied by the number of in-the-money options) that would have been received by theoption holders had the holders exercised their options on January 30, 2009. The intrinsic value changes based on changes in the fair market value of Dell’s commonstock.
(b) No options were in-the-money at January 30, 2009.
73
DELL INC.
NOTES TO CONSOLIDATED FINANCIAL STATEMENTS (Continued)

The following table summarizes stock option activity for the Stock Plans during Fiscal 2008:
Numberof
Options
Weighted-AverageExercise
Price
Weighted-Average
RemainingContractual
Term
AggregateIntrinsic
Value
(in millions) (per share) (in years) (in millions)
Options outstanding — February 2, 2007 . . . . . . . . . . . . . . . . . . . . . 314 $ 32.16
Granted . . . . . . . . . . . . . . . . . . . . . . . . . . . . . . . . . . . . . . . . . . . 12 24.45
Exercised . . . . . . . . . . . . . . . . . . . . . . . . . . . . . . . . . . . . . . . . . . (7) 18.99
Forfeited . . . . . . . . . . . . . . . . . . . . . . . . . . . . . . . . . . . . . . . . . . . (5) 26.80
Cancelled/expired . . . . . . . . . . . . . . . . . . . . . . . . . . . . . . . . . . . . (50) 32.01
Options outstanding — February 1, 2008 . . . . . . . . . . . . . . . . . . . . . 264 $ 32.30
Vested and expected to vest (net of estimated forfeitures) —February 1, 2008(a) . . . . . . . . . . . . . . . . . . . . . . . . . . . . . . . . . . . 259 $ 32.43 4.5 $ 13
Exercisable — February 1, 2008(a) . . . . . . . . . . . . . . . . . . . . . . . . . . 242 $ 32.89 4.2 $ 12
The following table summarizes stock option activity for the Stock Plans during Fiscal 2007:
Numberof
Options
Weighted-AverageExercise
Price
Weighted-Average
RemainingContractual
Term
AggregateIntrinsic
Value
(in millions) (per share) (in years) (in millions)
Options outstanding — February 3, 2006 . . . . . . . . . . . . . . . . . . . . . 343 $ 31.86
Granted . . . . . . . . . . . . . . . . . . . . . . . . . . . . . . . . . . . . . . . . . . . 10 25.97
Exercised . . . . . . . . . . . . . . . . . . . . . . . . . . . . . . . . . . . . . . . . . . (13) 14.09
Forfeited . . . . . . . . . . . . . . . . . . . . . . . . . . . . . . . . . . . . . . . . . . . (4) 25.84
Cancelled/expired . . . . . . . . . . . . . . . . . . . . . . . . . . . . . . . . . . . . (22) 36.43
Options outstanding — February 2, 2007 . . . . . . . . . . . . . . . . . . . . . 314 $ 32.16
Vested and expected to vest (net of estimated forfeitures) —February 2, 2007(a) . . . . . . . . . . . . . . . . . . . . . . . . . . . . . . . . . . . 309 $ 32.26 5.2 $ 148
Exercisable — February 2, 2007(a) . . . . . . . . . . . . . . . . . . . . . . . . . . 284 $ 32.74 5.1 $ 145
(a) For options vested and expected to vest and options exercisable, the aggregate intrinsic value in the table above represents the total pre-tax intrinsic value (thedifference between Dell’s closing stock price on February 1, 2008, and February 2, 2007, respectively, and the exercise price multiplied by the number of in-the-moneyoptions) that would have been received by the option holders had the holders exercised their options on February 1, 2008, and February 2, 2007, respectively. Theintrinsic value changes based on changes in the fair market value of Dell’s common stock.
74
DELL INC.
NOTES TO CONSOLIDATED FINANCIAL STATEMENTS (Continued)

Other information pertaining to stock options for the Stock Plans is as follows:
January 30,2009
February 1,2008
February 2,2007
Fiscal Years Ended
(in millions, except per option data)Weighted-average grant date fair value of stock options granted per
option . . . . . . . . . . . . . . . . . . . . . . . . . . . . . . . . . . . . . . . . . . . . . . . . . $ 5.87 $ 6.29 $ 6.90
Total fair value of options vested(a) . . . . . . . . . . . . . . . . . . . . . . . . . . . . . . $ 187 $ 208 $ 415
Total intrinsic value of options exercised(b) . . . . . . . . . . . . . . . . . . . . . . . . $ 15 $ 64 $ 171
(a) Includes the $104 million charge for the Fiscal 2009 acceleration of vesting of certain unvested and “out-of-the-money” stock options with exercise prices equal to orgreater than $10.14 per share previously awarded under equity compensation plans.
(b) The total intrinsic value of options exercised represents the total pre-tax intrinsic value (the difference between the stock price at exercise and the exercise pricemultiplied by the number of options exercised) that was received by the option holders who exercised their options during the fiscal year.
At January 30, 2009, approximately $1 million of total unrecognized stock-based compensation expense, net of estimated forfeitures,related to stock options is expected to be recognized over a weighted-average period of approximately 2.3 years.
Non-vested Restricted Stock Activity — Non-vested restricted stock awards and activities were as follows:
Numberof
Shares
Weighted-Average
Grant DateFair Value
Numberof
Shares
Weighted-Average
Grant DateFair Value
Numberof
Shares
Weighted-Average
Grant DateFair Value
Fiscal 2009 Fiscal 2008 Fiscal 2007
(in millions) (per share) (in millions) (per share) (in millions) (per share)
Non-vested restricted stock beginning balance . . . 36 $ 24.90 17 $ 28.76 2 $ 34.66
Granted . . . . . . . . . . . . . . . . . . . . . . . . . . . . . . 18 19.11 26 22.85 21 28.36
Vested . . . . . . . . . . . . . . . . . . . . . . . . . . . . . . . (10) 24.64 (3) 28.79 (1) 28.84
Forfeited . . . . . . . . . . . . . . . . . . . . . . . . . . . . . (8) 23.15 (4) 24.71 (5) 29.29
Non-vested restricted stock ending balance. . . . . . 36 $ 22.45 36 $ 24.90 17 $ 28.76
January 30,2009
February 1,2008
February 2,2007
Fiscal Years Ended
(in millions, except per option data)Weighted-average grant date fair value of restricted stock awards
granted . . . . . . . . . . . . . . . . . . . . . . . . . . . . . . . . . . . . . . . . . . . . . . . . $ 19.11 $ 22.85 $ 28.36
Total estimated grant date fair value of restricted stock awards vested . . . . $ 252 $ 103 $ 16
At January 30, 2009, $507 million of unrecognized stock-based compensation expense, net of estimated forfeitures, related to non-vestedrestricted stock awards is expected to be recognized over a weighted-average period of approximately 2.0 years.
75
DELL INC.
NOTES TO CONSOLIDATED FINANCIAL STATEMENTS (Continued)

Expense Information under SFAS 123(R)
Stock-based compensation expense was allocated as follows:
January 30,2009
February 1,2008
February 2,2007
Fiscal Year Ended
(in millions)
Cost of net revenue . . . . . . . . . . . . . . . . . . . . . . . . . . . . . . . . . . . . . . . . . $ 62 $ 62 $ 59
Operating expenses . . . . . . . . . . . . . . . . . . . . . . . . . . . . . . . . . . . . . . . . . 356 374 309
Stock-based compensation expense before taxes . . . . . . . . . . . . . . . . . . 418 436 368
Income tax benefit . . . . . . . . . . . . . . . . . . . . . . . . . . . . . . . . . . . . . . . . . . (131) (127) (110)
Stock-based compensation expense, net of income taxes . . . . . . . . . . . . $ 287 $ 309 $ 258
Stock-based compensation in the table above includes $104 million of expense for accelerated options and a reduction of $1 million forthe release of the accrual for expired stock options in Fiscal 2009 and $107 million of cash expense in Fiscal 2008 for expired stockoptions, as previously discussed.
Stock-based compensation expense is based on awards expected to vest, reduced for estimated forfeitures. SFAS 123(R) requiresforfeitures to be estimated at the time of grant and revised, if necessary, in subsequent periods if actual forfeitures differ from thoseestimates.
Valuation Information
SFAS 123(R) requires the use of a valuation model to calculate the fair value of stock option awards. Dell has elected to use the Black-Scholes option pricing model, which incorporates various assumptions, including volatility, expected term, and risk-free interest rates.The volatility is based on a blend of implied and historical volatility of Dell’s common stock over the most recent period commensuratewith the estimated expected term of Dell’s stock options. Dell uses this blend of implied and historical volatility, as well as othereconomic data, because management believes such volatility is more representative of prospective trends. The expected term of an awardis based on historical experience and on the terms and conditions of the stock awards granted to employees. The dividend yield of zero isbased on the fact that Dell has never paid cash dividends and has no present intention to pay cash dividends.
The weighted-average fair value of stock options and purchase rights under the employee stock purchase plan was determined based onthe Black-Scholes option pricing model weighted for all grants utilizing the assumptions in the following table:
January 30,2009
February 1,2008
February 2,2007
Fiscal Years Ended
Expected term:
Stock options . . . . . . . . . . . . . . . . . . . . . . . . . . . . . . . . . . . . . . . . . . . . 3.6 years 3.5 years 3.6 years
Employee stock purchase plan . . . . . . . . . . . . . . . . . . . . . . . . . . . . . . . N/A(a) N/A(a) 3 months
Risk-free interest rate (U.S. Government Treasury Note) . . . . . . . . . . . . . . 2.3% 4.4% 4.8%
Volatility . . . . . . . . . . . . . . . . . . . . . . . . . . . . . . . . . . . . . . . . . . . . . . . . . 37% 27% 26%
Dividends . . . . . . . . . . . . . . . . . . . . . . . . . . . . . . . . . . . . . . . . . . . . . . . . 0% 0% 0%
(a) No purchase rights were granted under the ESPP in Fiscal 2009 and Fiscal 2008 due to Dell suspending the ESPP on April 4, 2007, and subsequently discontinuing theplan effective the first quarter of Fiscal 2009 as a part of an overall assessment of its benefits strategy.
401(k) Plan — Dell has a defined contribution retirement plan (the “401(k) Plan”) that complies with Section 401(k) of the InternalRevenue Code. Substantially all employees in the U.S. are eligible to participate in the 401(k) Plan. Effective January 1, 2008, Dell
76
DELL INC.
NOTES TO CONSOLIDATED FINANCIAL STATEMENTS (Continued)

matches 100% of each participant’s voluntary contributions, subject to a maximum contribution of 5% of the participant’s compensation,and participants vest immediately in all Dell contributions to the 401(k) Plan. From January 1, 2005, to December 31, 2007, Dell matched100% of each participant’s voluntary contributions, subject to a maximum contribution of 4% of the participant’s compensation. Prior toJanuary 1, 2005, Dell matched 100% of each participant’s voluntary contributions, subject to a maximum contribution of 3% of theparticipant’s compensation. Dell’s contributions during Fiscal 2009, 2008, and 2007 were $93 million, $76 million, and $70 million,respectively. Dell’s contributions are invested according to each participant’s elections in the investment options provided under the Plan.Investment options include Dell stock, but neither participant nor Dell contributions are required to be invested in Dell stock.
Deferred Compensation Plan — Dell has a nonqualified deferred compensation plan (the “Deferred Compensation Plan”) for the benefitof certain management employees and non-employee directors. The Deferred Compensation Plan permits the deferral of base salary andannual incentive bonus. The deferrals are held in a separate trust, which has been established by Dell to administer the Plan. The assets ofthe trust are subject to the claims of Dell’s creditors in the event that Dell becomes insolvent. Consequently, the trust qualifies as a grantortrust for income tax purposes (i.e. a “Rabbi Trust”). In accordance with the provisions of EITF No. 97-14, Accounting for DeferredCompensation Arrangements Where Amounts Earned are Held in a Rabbi Trust and Invested, the assets and liabilities of the DeferredCompensation Plan are presented in long-term investments and accrued and other liabilities in the Consolidated Statements of FinancialPosition, respectively. The assets held by the trust are classified as trading securities with changes recorded to investment and otherincome, net. These assets are valued at $73 million and are disclosed in Note 2 of Notes to Consolidated Financial Statements. Changes inthe deferred compensation liability are recorded to compensation expense.
Employee Stock Purchase Plan — Dell discontinued its shareholder approved employee stock purchase plan during the first quarter ofFiscal 2009. Prior to discontinuance, the ESPP allowed participating employees to purchase common stock through payroll deductions atthe end of each three-month participation period at a purchase price equal to 85% of the fair market value of the common stock at the endof the participation period. Upon adoption of SFAS 123(R) in Fiscal 2007, Dell began recognizing compensation expense for the 15%discount received by the participating employees. No common stock was issued under this plan in Fiscal 2009 or Fiscal 2008 due to Dellsuspending the ESPP on April 4, 2007, and subsequently discontinuing the ESPP as part of an overall assessment of its benefits strategy.Common stock issued under ESPP totaled 6 million shares in Fiscal 2007, and the weighted-average fair value of the purchase rightsunder the ESPP during Fiscal 2007 was $3.89.
NOTE 6 — FINANCIAL SERVICES
Dell Financial Services L.L.C.
Dell offers or arranges various financing options and services for its business and consumer customers in the U.S. through DFS. a wholly-owned subsidiary of Dell. DFS’s key activities include the origination, collection, and servicing of customer receivables related to thepurchase of Dell products.
Dell utilizes DFS to facilitate financing for customers who elect to finance products sold by Dell. New financing originations, whichrepresent the amounts of financing provided to customers for equipment and related software and services through DFS, were$4.5 billion, $5.7 billion, and $6.1 billion, during the fiscal years ended January 30, 2009, February 1, 2008, and February 2, 2007,respectively.
CIT, formerly a joint venture partner of DFS, continues to have the right to purchase a percentage of new customer receivables facilitatedby DFS until January 29, 2010 (“Fiscal 2010”). CIT’s contractual funding right is up to 35% in Fiscal 2009 and up to 25% in Fiscal 2010.During Fiscal 2009 CIT’s funding percentage was approximately 34%. DFS services the receivables purchased by CIT. However, Dell’sobligation related to the performance of the DFS originated receivables purchased by CIT is limited to the cash funded credit reservesestablished at the time of funding.
77
DELL INC.
NOTES TO CONSOLIDATED FINANCIAL STATEMENTS (Continued)

Financing Receivables
The following table summarizes the components of Dell’s financing receivables, net of the allowance for financing receivables losses:
January 30,2009
February 1,2008
(in millions)Customer receivables:
Revolving loans, gross . . . . . . . . . . . . . . . . . . . . . . . . . . . . . . . . . . . . . . . . . . . . . . . . . $ 963 $ 1,063
Fixed-term leases and loans, gross . . . . . . . . . . . . . . . . . . . . . . . . . . . . . . . . . . . . . . . . 723 654
Customer receivables, gross . . . . . . . . . . . . . . . . . . . . . . . . . . . . . . . . . . . . . . . . . . . 1,686 1,717Customer receivables allowance . . . . . . . . . . . . . . . . . . . . . . . . . . . . . . . . . . . . . . . . . . (149) (96)
Customer receivables, net . . . . . . . . . . . . . . . . . . . . . . . . . . . . . . . . . . . . . . . . . . . . . 1,537 1,621
Residual interest . . . . . . . . . . . . . . . . . . . . . . . . . . . . . . . . . . . . . . . . . . . . . . . . . . . . . . . 279 295
Retained interest . . . . . . . . . . . . . . . . . . . . . . . . . . . . . . . . . . . . . . . . . . . . . . . . . . . . . . . 396 223
Financing receivables, net . . . . . . . . . . . . . . . . . . . . . . . . . . . . . . . . . . . . . . . . . . . . . $ 2,212 $ 2,139
Short-term . . . . . . . . . . . . . . . . . . . . . . . . . . . . . . . . . . . . . . . . . . . . . . . . . . . . . . . . . . . . $ 1,712 $ 1,732
Long-term . . . . . . . . . . . . . . . . . . . . . . . . . . . . . . . . . . . . . . . . . . . . . . . . . . . . . . . . . . . . 500 407
Financing receivables, net . . . . . . . . . . . . . . . . . . . . . . . . . . . . . . . . . . . . . . . . . . . . . $ 2,212 $ 2,139
Of the gross customer receivable balance at January 30, 2009, and February 1, 2008, $45 million and $444 million, respectively, representbalances which are due from CIT in connection with specified promotional programs.
Customer Receivables — The composition and credit quality of customer receivables vary from investment grade commercialcustomers to subprime consumers. Dell’s estimate of subprime customer receivables was approximately 20% of the gross customerreceivable balance at January 30, 2009, and February 1, 2008.
As of January 30, 2009, and February 1, 2008, customer financing receivables 60 days or more delinquent was $58 million and$34 million, respectively. These amounts represent 3.7% and 2.1% of the ending customer financing receivables balances for therespective years.
Net principal charge-offs for Fiscal 2009 and Fiscal 2008 were $86 million and $40 million, respectively. These amounts represent 5.5%and 2.7% of the average outstanding customer financing receivable balance (including accrued interest) for the respective years.
The following is a description of the components of customer receivables.
– Revolving loans offered under private label credit financing programs provide qualified customers with a revolving credit line forthe purchase of products and services offered by Dell. Revolving loans bear interest at a variable annual percentage rate that is tied tothe prime rate. Based on historical payment patterns, revolving loan transactions are typically repaid on average within 12 months.Revolving loans are included in short-term financing receivables in the table above. From time to time, account holders may havethe opportunity to finance their Dell purchases with special programs during which, if the outstanding balance is paid in full, nointerest is charged. These special programs generally range from 3 to 12 months. At January 30, 2009, and February 1, 2008,$352 million and $668 million, respectively, were receivable under these special programs.
– Dell enters into sales-type lease arrangements with customers who desire lease financing. Leases with business customers havefixed terms of two to five years. Future maturities of minimum lease payments at January 30, 2009 for future fiscal years are asfollows: 2010: $219 million; 2011: $144 million; 2012: $67 million; 2013: $7 million and 2014: $0.1 million. Fixed-term loans arealso offered to qualified small businesses, large commercial accounts, governmental organizations and educational entities.
78
DELL INC.
NOTES TO CONSOLIDATED FINANCIAL STATEMENTS (Continued)

Residual Interest — Dell retains a residual interest in the leased equipment. The amount of the residual interest is established at theinception of the lease based upon estimates of the value of the equipment at the end of the lease term using historical studies, industrydata, and future value-at-risk demand valuation methods. On a quarterly basis, Dell assesses the carrying amount of its recorded residualvalues for impairment. Anticipated declines in specific future residual values that are considered to be other-than-temporary are recordedin current earnings.
Retained Interest — Retained interest represents the residual beneficial interest Dell retains in certain pools of securitized financingreceivables. Retained interest is stated at the present value of the estimated net beneficial cash flows after payment of all senior interests.Dell values the retained interest at the time of each receivable transfer and at the end of each reporting period. The fair value of theretained interest is determined using a discounted cash flow model with various key assumptions, including payment rates, credit losses,discount rates, and remaining life of the receivables sold. These assumptions are supported by both Dell’s historical experience andanticipated trends relative to the particular receivable pool. The weighted average assumptions for retained interest can be affected by themany factors, including asset type (revolving versus fixed), repayment terms, and the credit quality of assets being securitized.
The implementation of SFAS 157 did not result in material changes to the models or processes used to value retained interest. See Note 2of Notes to Consolidated Financial Statements for the impact of the implementation of SFAS 157.
The following table summarizes the activity in retained interest balances and related cash flows:
January 30,2009
February 1,2008
February 2,2007
Fiscal Year Ended
(in millions)Retained interest:
Retained interest at beginning of year . . . . . . . . . . . . . . . . . . . . . . . . . . . . $ 223 $ 159 $ 90
Issuances . . . . . . . . . . . . . . . . . . . . . . . . . . . . . . . . . . . . . . . . . . . . . . . 427 173 167
Distributions from conduits. . . . . . . . . . . . . . . . . . . . . . . . . . . . . . . . . . (246) (132) (142)
Net accretion . . . . . . . . . . . . . . . . . . . . . . . . . . . . . . . . . . . . . . . . . . . . 16 31 17
Change in fair value for the period . . . . . . . . . . . . . . . . . . . . . . . . . . . . (24) (8) 27
Retained interest at end of year . . . . . . . . . . . . . . . . . . . . . . . . . . . . . . . . $ 396 $ 223 $ 159
Cash flows during the periods:
Proceeds from new securitizations . . . . . . . . . . . . . . . . . . . . . . . . . . . . $ 350 $ 538 $ 607
Distributions from conduits. . . . . . . . . . . . . . . . . . . . . . . . . . . . . . . . . . 246 132 142
Servicing and administration fees received . . . . . . . . . . . . . . . . . . . . . . 19 15 9
Repurchases of ineligible contracts . . . . . . . . . . . . . . . . . . . . . . . . . . . . (5) (11) (7)
Cash flows during the period . . . . . . . . . . . . . . . . . . . . . . . . . . . . . . . . . . $ 610 $ 674 $ 751
The table below summarizes the key assumptions used to measure the fair value of the retained interest as of January 30, 2009.
MonthlyPayment
RatesCreditLosses
DiscountRates Life
Weighted Average Key Assumptions
(lifetime) (annualized) (months)
Time of sale valuation of retained interest . . . . . . . . . . . . . . . . . . . 12% 8% 14% 14
Valuation of retained interest . . . . . . . . . . . . . . . . . . . . . . . . . . . . . 8% 12% 11% 11
79
DELL INC.
NOTES TO CONSOLIDATED FINANCIAL STATEMENTS (Continued)

The impact of adverse changes to the key valuation assumptions to the fair value of retained interest at January 30, 2009 is shown in thefollowing table (in millions):
Expected prepayment speed: 10% . . . . . . . . . . . . . . . . . . . . . . . . . . . . . . . . . . . . . . . . . . . . . . . . . . . . . . . . . $ (9)
Expected prepayment speed: 20% . . . . . . . . . . . . . . . . . . . . . . . . . . . . . . . . . . . . . . . . . . . . . . . . . . . . . . . . . $ (17)
Expected credit losses: 10% . . . . . . . . . . . . . . . . . . . . . . . . . . . . . . . . . . . . . . . . . . . . . . . . . . . . . . . . . . . . . $ (13)
Expected credit losses: 20% . . . . . . . . . . . . . . . . . . . . . . . . . . . . . . . . . . . . . . . . . . . . . . . . . . . . . . . . . . . . . $ (21)
Discount rate: 10% . . . . . . . . . . . . . . . . . . . . . . . . . . . . . . . . . . . . . . . . . . . . . . . . . . . . . . . . . . . . . . . . . . . . $ (5)
Discount rate: 20% . . . . . . . . . . . . . . . . . . . . . . . . . . . . . . . . . . . . . . . . . . . . . . . . . . . . . . . . . . . . . . . . . . . . $ (10)
The analyses above utilized 10% and 20% adverse variation in assumptions to assess the sensitivities in fair value of the retained interest.However, these changes generally cannot be extrapolated because the relationship between a change in one assumption to the resultingchange in fair value may not be linear. For the above sensitivity analyses, each key assumption was isolated and evaluated separately.Each assumption was adjusted by 10% and 20% while holding the other key assumptions constant. Assumptions may be interrelated, andchanges to one assumption may impact others and the resulting fair value of the retained interest. For example, increases in marketinterest rates may result in lower prepayments and increased credit losses. The effect of multiple assumption changes were not consideredin the analyses.
Asset Securitization
During Fiscal 2009 and Fiscal 2008, Dell transferred $1.4 billion and $1.2 billion respectively, of fixed-term leases and loans andrevolving loans to unconsolidated qualifying special purpose entities. The qualifying special purpose entities are bankruptcy remote legalentities with assets and liabilities separate from those of Dell. The purpose of the qualifying special purpose entities is to facilitate thefunding of financing receivables in the capital markets. The qualifying special purpose entities have entered into financing arrangementswith three multi-seller conduits that, in turn, issue asset-backed debt securities in the capital markets. Two of the three conduits fundfixed-term leases and loans, and one conduit funds revolving loans. The principal balance of the securitized receivables at the end ofFiscal 2009 and Fiscal 2008 was $1.4 billion and $1.2 billion, respectively.
Dell services securitized contracts and earns a servicing fee. Dell’s securitization transactions generally do not result in servicing assetsand liabilities as the contractual fees are adequate compensation in relation to the associated servicing cost.
During Fiscal 2009, the disruption in the debt and capital markets resulted in reduced liquidity and increased costs for funding of financialassets. Due to a proposed increase to the cost structure in Dell’s revolving securitization arrangement, Dell elected not to extend the termsof the agreement. This resulted in a scheduled amortization of the transaction. During this scheduled amortization period, all principalcollections will be used to pay down the outstanding debt amount related to the securitized assets. The right to receive cash collections isdelayed until the debt is fully paid.
During the scheduled amortization, no transfers of new revolving loans will occur. Additional purchases made on existing securitizedrevolving loans (repeat purchases) will continue to be transferred to the qualified special purpose entity and will increase the retainedinterest in securitized assets on the balance sheet.
Dell’s securitization programs contain standard structural features related to the performance of the securitized receivables. Thesestructural features include defined credit losses, delinquencies, average credit scores, and excess collections above or below specifiedlevels. In the event one or more of these features are met and Dell is unable to restructure the program, no further funding of receivableswill be permitted and the timing of expected retained interest cash flows will be delayed, which would impact the valuation of theretained interest. For the revolving transaction currently under scheduled amortization, performance features have been suspended.
As of January 30, 2009, and February 1, 2008, securitized financing receivables 60 days or more delinquent were $63 million and$54 million, respectively. These amounts represent 4.6% and 4.4% of the ending securitized financing receivables balances for therespective years.
Net principal charge-offs for Fiscal 2009 and Fiscal 2008, were $114 million and $81 million, respectively. These amounts represent8.2% and 7.0% of the average outstanding securitized financing receivable balance for the respective years.
80
DELL INC.
NOTES TO CONSOLIDATED FINANCIAL STATEMENTS (Continued)

NOTE 7 — ACQUISITIONS
Dell has recorded all of its acquisitions using the purchase method of accounting in accordance with SFAS No. 141, BusinessCombinations. Accordingly, the results of operations of the acquired companies have been included in Dell’s consolidated results sincethe date of each acquisition. Dell allocates the purchase price of its acquisitions to the tangible assets, liabilities, and intangible assetsacquired, which include IPR&D charges, based on their estimated fair values. The excess of the purchase price over the fair value of theidentified assets and liabilities has been recorded as goodwill. The fair value assigned to the assets acquired is based on valuations usingmanagement’s estimates and assumptions. Dell does not expect the majority of goodwill related to these acquisitions to be deductible fortax purposes. In compliance with SFAS No. 142, Goodwill and Other Intangible Assets, Dell defines its reporting units as its reportablebusiness segments. Dell has not presented pro forma results of operations because these acquisitions are not material to Dell’sconsolidated results of operations, financial position or cash flows on either an individual or an aggregate basis. Dell has included theresults of operations of these transactions prospectively from the respective date of the transaction.
The purchase price allocations for these acquisitions are preliminary and subject to revision as more detailed analyses are completed andadditional information about the fair value of assets and liabilities becomes available. Any change in the estimated fair value of the netassets, within one year of acquisition of the acquired companies, will change the amount of the purchase price allocable to goodwill.
Fiscal 2009 Acquisitions
Dell completed three acquisitions, The Networked Storage Company, MessageOne, Inc. (“MessageOne”), and Allin Corporation(“Allin”) during Fiscal 2009 for approximately $197 million in cash. Dell recorded approximately $136 million of goodwill andapproximately $64 million of purchased intangible assets related to these acquisitions. Dell also expensed approximately $2 million ofIPR&D related to these acquisitions in Fiscal 2009. The larger of these transactions was the purchase of MessageOne for approximately$164 million in cash plus an additional $10 million to be used for management retention. MessageOne and Allin have been integrated intoDell’s Global Services organization, which supports Dell’s Americas Commercial; Europe, Middle East, and Africa (“EMEA”)Commercial; and Asia Pacific-Japan (“APJ”) Commercial segments, and The Networked Storage Company has been integrated intoDell’s EMEA Commercial segment.
The acquisition of MessageOne was identified and acknowledged by Dell’s Board of Directors as a related party transaction becauseMichael Dell and his family held indirect ownership interests in MessageOne. Consequently, Dell’s Board directed management toimplement a series of measures designed to ensure that the transaction was considered, analyzed, negotiated, and approved objectivelyand independent of any control or influence from the related parties.
Fiscal 2008 Acquisitions
EqualLogic Acquisition
On January 25, 2008, Dell completed its acquisition of EqualLogic Inc. (“EqualLogic”), a provider of high performance Internet Protocol(IP) iSCSI storage area network (SAN) solutions uniquely designed for virtualization and ease-of-use. Dell acquired 100% of thecommon shares of EqualLogic for approximately $1.4 billion in cash. Dell originally recorded approximately $969 million of goodwilland $486 million of amortizable intangible assets. This acquisition will strengthen Dell’s product and channel position and assist Dell inits strategic efforts to simplify and virtualize IT for its customers globally. Dell also expensed IPR&D of $75 million resulting from theEqualLogic acquisition. Dell has included EqualLogic in its storage line of business for product revenue reporting purposes. Goodwill,which represents the excess of the purchase price over the net tangible and intangible assets acquired, is not deductible for tax purposes.
ASAP Software Acquisition
On November 9, 2007, Dell completed its acquisition of ASAP Software Express, Inc., (“ASAP”), a provider of software solutions andlicensing services for approximately $353 million in cash. This acquisition will help Dell to simplify information technology bycombining Dell’s reach as a leading supplier of commercial technology and services and ASAP’s expertise in software licensing andlicense management. In connection with the acquisition, Dell originally recorded approximately $130 million of goodwill and$171 million of amortizable intangible assets. Dell did not record any IPR&D in connection with the ASAP acquisition. Dell has
81
DELL INC.
NOTES TO CONSOLIDATED FINANCIAL STATEMENTS (Continued)
included ASAP in its software and peripherals line of business for product revenue reporting purposes. Goodwill, which represents theexcess of the purchase price over the net tangible and intangible assets acquired, is expected to be deductible for tax purposes.
Other Acquisitions in Fiscal 2008
Dell acquired three other companies in Fiscal 2008, Everdream Corporation, Silverback Technologies Inc., and Zing Systems Inc. Dellalso purchased CIT Group Inc.’s remaining 30% interest in DFS during Fiscal 2008. Total consideration for these purchases wasapproximately $553 million, which included direct transaction costs and certain liabilities recorded in connection with these acquisitions.The largest of these transactions was the purchase of CIT’s 30% minority interest in DFS for approximately $306 million, which resultedin recognition of $245 million of goodwill and gave Dell 100% ownership of DFS. With these acquisitions Dell expects to be able tobroaden its services and financing offerings to customers while simplifying IT. Dell originally recorded approximately $438 million ofgoodwill and $78 million of amortizable intangible assets in connection with these other acquisitions. Dell also expensed approximately$8 million of IPR&D related to these acquisitions in Fiscal 2008.
The following table summarizes the purchase price allocations of all Fiscal 2008 acquisitions, including original estimates and adjustedallocations:
OriginalAllocations
AdjustedAllocations
(in millions)
Cash, cash equivalents, and short- term investments. . . . . . . . . . . . . . . . . . . . . . . . . . . . . . . $ 31 $ 31
Other tangible assets . . . . . . . . . . . . . . . . . . . . . . . . . . . . . . . . . . . . . . . . . . . . . . . . . . . . . 239 358
Liabilities. . . . . . . . . . . . . . . . . . . . . . . . . . . . . . . . . . . . . . . . . . . . . . . . . . . . . . . . . . . . . . (382) (455)
Total net liabilities assumed . . . . . . . . . . . . . . . . . . . . . . . . . . . . . . . . . . . . . . . . . . . . . . (112) (66)
Amortizable intangible assets . . . . . . . . . . . . . . . . . . . . . . . . . . . . . . . . . . . . . . . . . . . . . . . 735 725
Indefinite lived intangible assets . . . . . . . . . . . . . . . . . . . . . . . . . . . . . . . . . . . . . . . . . . . . . 27 25
Total purchased intangibles . . . . . . . . . . . . . . . . . . . . . . . . . . . . . . . . . . . . . . . . . . . . . . . 762 750
Goodwill . . . . . . . . . . . . . . . . . . . . . . . . . . . . . . . . . . . . . . . . . . . . . . . . . . . . . . . . . . . . . . 1,538 1,510
IPR&D . . . . . . . . . . . . . . . . . . . . . . . . . . . . . . . . . . . . . . . . . . . . . . . . . . . . . . . . . . . . . . . 83 83
Total purchase price . . . . . . . . . . . . . . . . . . . . . . . . . . . . . . . . . . . . . . . . . . . . . . . . . . . . $ 2,271 $ 2,277
The amortizable intangible assets are being amortized over their estimated useful lives based upon their expected future cash flows. Thefollowing table summarizes the original and adjusted cost of amortizable intangible assets related to Fiscal 2008 acquisitions and theirweighted-average useful lives:
OriginalEstimated
Cost
OriginalWeighted-Average
Useful LifeAdjusted
Cost
AdjustedWeighted-Average
Useful Life
(in millions) (years) (in millions) (years)
Technology . . . . . . . . . . . . . . . . . . . . . . . . . . . . . . . . $ 484 5.8 $ 480 5.7
Customer relationships . . . . . . . . . . . . . . . . . . . . . . . . 220 9.4 212 9.0
Covenants not-to-compete . . . . . . . . . . . . . . . . . . . . . 22 3.9 22 4.9Tradenames . . . . . . . . . . . . . . . . . . . . . . . . . . . . . . . . 8 5.3 10 5.3
Other . . . . . . . . . . . . . . . . . . . . . . . . . . . . . . . . . . . . 1 3.4 1 3.4
Total amortizable intangible assets . . . . . . . . . . . . . $ 735 6.8 $ 725 6.6
82
DELL INC.
NOTES TO CONSOLIDATED FINANCIAL STATEMENTS (Continued)

NOTE 8 — GOODWILL AND INTANGIBLE ASSETS
Goodwill
Goodwill allocated to Dell’s business segments as of January 30, 2009, and February 1, 2008, and changes in the carrying amount ofgoodwill for the fiscal year ended January 30, 2009, were as follows:
AmericasCommercial
EMEACommercial
APJCommercial
GlobalConsumer Total
(in millions)
Balance at February 1, 2008 . . . . . . . . . . . . . . . . . $ 822 $ 412 $ 127 $ 287 $ 1,648
Goodwill acquired . . . . . . . . . . . . . . . . . . . . . . . . 78 37 21 - 136
Adjustments to goodwill . . . . . . . . . . . . . . . . . . . . (31) (14) (10) 8 (47)
Balance at January 30, 2009 . . . . . . . . . . . . . . . . . $ 869 $ 435 $ 138 $ 295 $ 1,737
January 30,2009
February 1,2008
(in millions)
Balance at beginning of the year . . . . . . . . . . . . . . $ 1,648 $ 110Goodwill acquired during the year . . . . . . . . . . . . 136 1,538
Adjustments to goodwill . . . . . . . . . . . . . . . . . . . . (47) -
Balance at end of the year . . . . . . . . . . . . . . . . . . $ 1,737 $ 1,648
Goodwill is tested annually during the second fiscal quarter and whenever events or circumstances indicate an impairment may haveoccurred. If the carrying amount of goodwill exceeds its fair value, estimated based on discounted cash flow analyses, an impairmentcharge would be recorded. Based on the results of its annual impairment tests, Dell determined that no impairment of goodwill existed atAugust 1, 2008, and for the fiscal years ended January 30, 2009, and February 1, 2008. The goodwill adjustments are primarily the resultof purchase price allocation adjustments related to the finalization of deferred tax calculations and the effects of foreign currencyadjustments where the purchase price was recorded in entities where the local currency is the functional currency. In the fourth quarter ofFiscal 2009, Dell updated its annual analysis of potential triggering events for goodwill and indefinite lived intangible asset impairments.Based on this analysis, Dell concluded that there was no evidence that would indicate an impairment of goodwill or indefinite livedintangible assets.
Intangible Assets
Dell’s intangible assets associated with completed acquisitions at January 30, 2009, and February 1, 2008, are as follows:
GrossAccumulatedAmortization Net Gross
AccumulatedAmortization Net
January 30, 2009 February 1, 2008
(in millions)
Technology . . . . . . . . . . . . . . . . . . . . . . . . . . . . $ 524 $ (82) $ 442 $ 492 $ (16) $ 476
Customer relationships . . . . . . . . . . . . . . . . . . . 243 (38) 205 231 (9) 222
Tradenames. . . . . . . . . . . . . . . . . . . . . . . . . . . . 41 (9) 32 39 (6) 33
Covenants not-to-compete . . . . . . . . . . . . . . . . . 26 (6) 20 23 (1) 22
Amortizable intangible assets . . . . . . . . . . . . . $ 834 $ (135) $ 699 $ 785 $ (32) $ 753
Indefinite lived intangible assets . . . . . . . . . . . . 25 - 25 27 - 27
Total intangible assets . . . . . . . . . . . . . . . . . . $ 859 $ (135) $ 724 $ 812 $ (32) $ 780
83
DELL INC.
NOTES TO CONSOLIDATED FINANCIAL STATEMENTS (Continued)

During Fiscal 2009 and Fiscal 2008, Dell recorded additions to intangible assets of $64 million and $762 million, respectively.Amortization expense related to finite-lived intangible assets was approximately $103 million and $27 million in Fiscal 2009 and inFiscal 2008. During the year ended January 30, 2009, Dell did not record any impairment charges as a result of its analysis of itsintangible assets.
Estimated future annual pre-tax amortization expense of finite-lived intangible assets as of January 30, 2009, over the next five fiscalyears and thereafter is as follows:
Fiscal Years (in millions)
2010 . . . . . . . . . . . . . . . . . . . . . . . . . . . . . $ 159
2011 . . . . . . . . . . . . . . . . . . . . . . . . . . . . . 144
2012 . . . . . . . . . . . . . . . . . . . . . . . . . . . . . 124
2013 . . . . . . . . . . . . . . . . . . . . . . . . . . . . . 100
2014 . . . . . . . . . . . . . . . . . . . . . . . . . . . . . 69
Thereafter . . . . . . . . . . . . . . . . . . . . . . . . . 103
Total . . . . . . . . . . . . . . . . . . . . . . . . . . . $ 699
NOTE 9 — WARRANTY LIABILITY AND RELATED DEFERRED SERVICE REVENUE
Revenue from extended warranty and service contracts, for which Dell is obligated to perform, is recorded as deferred revenue andsubsequently recognized over the term of the contract or when the service is completed. Dell records warranty liabilities at the time ofsale for the estimated costs that may be incurred under its standard warranty. Changes in Dell’s deferred revenue for extended warranties,and warranty liability for standard warranties which are included in other current and non-current liabilities on Dell’s ConsolidatedStatements of Financial Position, are presented in the following tables:
January 30,2009
February 1,2008
February 2,2007
Fiscal Year Ended
(in millions)Deferred service revenue:
Deferred service revenue at beginning of year . . . . . . . . . . . . . . . . . . . . . . $ 5,260 $ 4,221 $ 3,707
Revenue deferred for new extended warranty and service contractssold(b) . . . . . . . . . . . . . . . . . . . . . . . . . . . . . . . . . . . . . . . . . . . . . . . 3,545 3,806 3,188
Revenue recognized(c) . . . . . . . . . . . . . . . . . . . . . . . . . . . . . . . . . . . . . (3,156) (2,767) (2,674)
Deferred service revenue at end of year . . . . . . . . . . . . . . . . . . . . . . . . . . $ 5,649 $ 5,260 $ 4,221
Current portion . . . . . . . . . . . . . . . . . . . . . . . . . . . . . . . . . . . . . . . . . . $ 2,649 $ 2,486 $ 2,032
Non-current portion . . . . . . . . . . . . . . . . . . . . . . . . . . . . . . . . . . . . . . . 3,000 2,774 2,189
Deferred service revenue at end of year . . . . . . . . . . . . . . . . . . . . . . . . . . $ 5,649 $ 5,260 $ 4,221
84
DELL INC.
NOTES TO CONSOLIDATED FINANCIAL STATEMENTS (Continued)

January 30,2009
February 1,2008
February 2,2007
Fiscal Year Ended
(in millions)Warranty liability:
Warranty liability at beginning of year . . . . . . . . . . . . . . . . . . . . . . . . . . . $ 929 $ 958 $ 951
Costs accrued for new warranty contracts and changes in estimates forpre-existing warranties(a)(b) . . . . . . . . . . . . . . . . . . . . . . . . . . . . . . . . 1,180 1,176 1,255
Service obligations honored(c) . . . . . . . . . . . . . . . . . . . . . . . . . . . . . . . . (1,074) (1,205) (1,248)
Warranty liability at end of year . . . . . . . . . . . . . . . . . . . . . . . . . . . . . . . . $ 1,035 $ 929 $ 958
Current portion . . . . . . . . . . . . . . . . . . . . . . . . . . . . . . . . . . . . . . . . . . $ 721 $ 690 $ 768
Non-current portion . . . . . . . . . . . . . . . . . . . . . . . . . . . . . . . . . . . . . . . 314 239 190
Warranty liability at end of year . . . . . . . . . . . . . . . . . . . . . . . . . . . . . . . . $ 1,035 $ 929 $ 958
(a) Changes in cost estimates related to pre-existing warranties are aggregated with accruals for new standard warranty contracts. Dell’s warranty liability process doesnot differentiate between estimates made for pre-existing warranties and new warranty obligations.
(b) Includes the impact of foreign currency exchange rate fluctuations.
(c) Fiscal 2008 and Fiscal 2007 amounts have been revised to include foreign currency exchange rate fluctuations in revenue deferred for new extended warranty andservice contracts sold and costs accrued for new warranty contracts and changes in estimates for pre-existing warranties to conform to the current period presentation.
NOTE 10 — COMMITMENTS AND CONTINGENCIES
Severance Costs and Facility Closures — In Fiscal 2008, Dell announced a comprehensive review of costs that is currently ongoing.Since this announcement and through the end of Fiscal 2009, Dell reduced headcount and closed certain Dell facilities. Results ofoperations for Fiscal 2009 include net pre-tax charges of $282 million for these actions, which is comprised of $235 million related toheadcount and a net $47 million related to facilities actions, including accelerated depreciation. Additionally, the sales of three facilitieswere finalized during Fiscal 2009 resulting in $44 million of proceeds reflected in cash from investing activities in the ConsolidatedStatements of Cash Flows. As of January 30, 2009, and February 1, 2008, the accrual related to these cost reductions and efficiencyactions was $98 million and $35 million, respectively, which is included in accrued and other liabilities in the Consolidated Statements ofFinancial Position.
Lease Commitments — Dell leases property and equipment, manufacturing facilities, and office space under non-cancelable leases.Certain of these leases obligate Dell to pay taxes, maintenance, and repair costs. At January 30, 2009, future minimum lease paymentsunder these non-cancelable leases are as follows: $89 million in Fiscal 2010; $77 million in Fiscal 2011; $63 million in Fiscal 2012;$42 million in Fiscal 2013; $34 million in Fiscal 2014; and $153 million thereafter.
Rent expense under all leases totaled $116 million, $118 million, and $78 million for Fiscal 2009, 2008, and 2007 respectively.
Restricted Cash — Pursuant to an agreement between DFS and CIT, Dell is required to maintain escrow cash accounts that are held asrecourse reserves for credit losses, performance fee deposits related to Dell’s private label credit card, and deferred servicing revenue.Restricted cash in the amount of $213 million and $294 million is included in other current assets on Dell’s Consolidated Statements ofFinancial Position at January 30, 2009, and February 1, 2008, respectively.
Legal Matters — Dell is involved in various claims, suits, investigations, and legal proceedings. As required by SFAS No. 5, Accountingfor Contingencies, Dell accrues a liability when it believes that it is both probable that a liability has been incurred and that it canreasonably estimate the amount of the loss. Dell reviews these accruals at least quarterly and adjusts them to reflect ongoing negotiations,settlements, rulings, advice of legal counsel, and other relevant information. However, litigation is inherently unpredictable. Therefore,Dell could incur judgments or enter into settlements of claims that could adversely affect its operating results or cash flows in a particularperiod.
85
DELL INC.
NOTES TO CONSOLIDATED FINANCIAL STATEMENTS (Continued)
The following is a discussion of Dell’s significant legal matters.
• Investigations and Related Litigation — In August 2005, the SEC initiated an inquiry into certain of Dell’s accounting and financialreporting matters and requested that Dell provide certain documents. The SEC expanded that inquiry in June 2006 and entered a formalorder of investigation in October 2006. The SEC’s requests for information were joined by a similar request from the United StatesAttorney for the Southern District of New York (“SDNY”), who subpoenaed documents related to Dell’s financial reporting from andafter Fiscal 2002. In August 2006, because of potential issues identified in the course of responding to the SEC’s requests forinformation, Dell’s Audit Committee, on the recommendation of management and in consultation with PricewaterhouseCoopers LLP,Dell’s independent registered public accounting firm, initiated an independent investigation, which was completed in the third quarterof Fiscal 2008. Although the Audit Committee investigation has been completed, the investigations being conducted by the SEC andthe SDNY are ongoing. Dell continues to cooperate with the SEC and the SDNY.
Dell and several of its current and former directors and officers were named as parties to securities, Employee Retirement IncomeSecurity Act of 1974 (“ERISA”), and shareholder derivative lawsuits all arising out of the same events and facts.
Four putative securities class actions filed between September 13, 2006 and January 31, 2007, in the Western District of Texas, AustinDivision, against Dell and certain of its current and former officers were consolidated as In re Dell Securities Litigation, and a leadplaintiff was appointed by the court. The lead plaintiff asserted claims under sections 10(b), 20(a), and 20A of the Securities ExchangeAct of 1934 based on alleged false and misleading disclosures or omissions regarding Dell’s financial statements, governmentalinvestigations, internal controls, known battery problems and business model, and based on insiders’ sales of Dell securities. Thisaction also included Dell’s independent registered public accounting firm, PricewaterhouseCoopers LLP, as a defendant. On October 6,2008, the court dismissed all of the plaintiff’s claims with prejudice and without leave to amend. On November 3, 2008, the plaintifffiled a notice of appeal to the Fifth Circuit Court of Appeals with respect to the dismissal of Dell and the officer defendants.
Four other putative class actions filed between September 25, 2006 and October 5, 2006, in the Western District, Austin Division, bypurported participants in the Dell 401(k) Plan were consolidated as In re Dell ERISA Litigation, and lead plaintiffs were appointed bythe court. The lead plaintiffs asserted claims under ERISA based on allegations that Dell and certain current and former directors andofficers imprudently invested and managed participants’ funds and failed to disclose information regarding its stock held in the 401(k)Plan. On June 23, 2008, the court granted the defendants’ motion to dismiss as to the plaintiffs’ claims under ERISA based onallegations of imprudence, but the court denied the motion to dismiss as to the claims under ERISA based on allegations of a failure toaccurately disclose information. On October 29, 2008, the court dismissed all of the individual plaintiffs’ claims with prejudice.
In addition, seven shareholder derivative lawsuits filed between September 29, 2006 and January 22, 2007, in three separatejurisdictions were consolidated as In re Dell Derivative Litigation into three actions. One of those consolidated actions was pending inthe Western District of Texas, Austin Division, but was dismissed without prejudice by an order filed October 9, 2007. The secondconsolidated shareholder derivative action was pending in Delaware Chancery Court. On October 16, 2008, the Delaware court grantedthe parties’ stipulation to dismiss all of the plaintiffs’ claims in the Delaware lawsuit without prejudice. The third consolidatedshareholder derivative action is pending in state district court in Williamson County, Texas. These shareholder derivative lawsuitsnamed various current and former officers and directors as defendants and Dell as a nominal defendant, and asserted various claimsderivatively on behalf of Dell under state law, including breaches of fiduciary duties.
The Board of Directors received a shareholder demand letter, dated November 12, 2008, asserting allegations similar to those made inthe securities and derivative lawsuits against various current and former officers and directors and PricewaterhouseCoopers LLP, andrequesting that the Board of Directors investigate and assert claims relating to those allegations on behalf of Dell. The Board ofDirectors will consider and address the demand.
• Copyright Levies — Proceedings against the IT industry in Germany seek to impose levies on equipment such as personal computersand multifunction devices that facilitate making private copies of copyrighted materials. The total levies due, if imposed, would bebased on the number of products sold and the per-product amounts of the levies, which vary. Dell, along with other companies andvarious industry associations, are opposing these levies and instead are advocating compensation to rights holders through digital rightsmanagement systems.
86
DELL INC.
NOTES TO CONSOLIDATED FINANCIAL STATEMENTS (Continued)
On December 29, 2005, Zentralstelle Fur private Uberspielungrechte (“ZPU”), a joint association of various German collectionsocieties, instituted arbitration proceedings against Dell’s German subsidiary before the Arbitration Body in Munich. ZPU claims alevy of A18.4 per PC that Dell sold in Germany from January 1, 2002, through December 31, 2005. On July 31, 2007, the ArbitrationBody recommended a levy of A15 on each PC sold during that period for audio and visual copying capabilities. Dell and ZPU rejectedthe recommendation, and on February 21, 2008, ZPU filed a lawsuit in the German Regional Court in Munich. Dell plans to continue todefend this claim vigorously and does not expect the outcome to have a material adverse effect on its financial condition or results ofoperations.
Dell is involved in various other claims, suits, investigations, and legal proceedings that arise from time to time in the ordinary course ofits business. Dell does not expect that the outcome in any of these other legal proceedings, individually or collectively, will have amaterial adverse effect on its financial condition or results of operations.
Certain Concentrations — All of Dell’s foreign currency exchange and interest rate derivative instruments could involve elements ofmarket and credit risk in excess of the amounts recognized in the consolidated financial statements. The counterparties to the financialinstruments consist of a number of major financial institutions rated AA and A. In addition to limiting the amount of agreements andcontracts it enters into with any one party, Dell monitors its positions with, and the credit quality of the counterparties to, these financialinstruments. Dell does not anticipate nonperformance by any of the counterparties.
Dell’s investments in debt securities are in high quality financial institutions and companies. As part of its cash and risk managementprocesses, Dell performs periodic evaluations of the credit standing of the institutions in accordance with its investment policy. Dell’sinvestments in debt securities have effective maturities of less than five years. Management believes that no significant concentration ofcredit risk for investments exists for Dell.
As of January 30, 2009, approximately 25% of Dell’s cash and cash equivalents were deposited with two large financial institutions.
Dell markets and sells its products and services to large corporate clients, governments, healthcare and education accounts, as well assmall and medium businesses and individuals. No single customer accounted for more than 10% of Dell’s consolidated net revenueduring Fiscal 2009, 2008, and 2007.
Dell purchases a number of components from single or limited sources. In some cases, alternative sources of supply are not available. Inother cases, Dell may establish a working relationship with a single source or a limited number of sources if Dell believes it isadvantageous due to performance, quality, support, delivery, capacity, or price considerations.
NOTE 11 — SEGMENT INFORMATION
Dell conducts operations worldwide. Effective the first quarter of Fiscal 2009, Dell combined the consumer business of EMEA, APJ, andAmericas International (formerly reported through Americas Commercial) with the U.S. Consumer business and re-aligned itsmanagement and financial reporting structure. As a result, effective May 2, 2008, Dell’s operating segments consisted of the followingfour segments: Americas Commercial, EMEA Commercial, APJ Commercial, and Global Consumer. Dell’s commercial businessincludes sales to corporate, government, healthcare, education, small and medium business customers, and value-added resellers and ismanaged through the Americas Commercial, EMEA Commercial, and APJ Commercial segments. The Americas Commercial segment,which is based in Round Rock, Texas, encompasses the U.S., Canada, and Latin America. The EMEA Commercial segment, based inBracknell, England, covers Europe, the Middle East, and Africa; and the APJ Commercial segment, based in Singapore, encompasses theAsian countries of the Pacific Rim as well as Australia, New Zealand, and India. The Global Consumer segment, which is based in RoundRock, Texas, includes global sales and product development for individual consumers and retailers around the world. Dell revisedpreviously reported operating segment information to conform to its new operating segments in effect as of May 2, 2008.
On December 31, 2008, Dell announced its intent during Fiscal 2010 to move from geographic commercial segments to global businessunits reflecting the impact of globalization on its customer base. Customer requirements now share more commonality based on theirsector rather than physical location. Dell expects to combine its current Americas Commercial, EMEA Commercial, and APJCommercial segments and realign its management structure. After this realignment, Dell’s operating structure will consist of thefollowing segments: Global Large Enterprise, Global Public, Global Small and Medium Business, and its existing Global Consumer
87
DELL INC.
NOTES TO CONSOLIDATED FINANCIAL STATEMENTS (Continued)

segment. Dell will begin reporting these four global businesses once it completes the realignment of its management and financialreporting structure which is expected to be in the first half of Fiscal 2010.
Corporate expenses are included in Dell’s measure of segment operating income for management reporting purposes; however, with theadoption of SFAS 123(R), stock-based compensation expense is not allocated to Dell’s operating segments. Beginning in the fourthquarter of Fiscal 2008, acquisition-related charges such as in-process research and development and amortization of intangibles are notallocated to Dell’s operating segments. The asset totals disclosed by geography are directly managed by those regions and includeaccounts receivable, inventory, certain fixed assets, and certain other assets. Corporate assets primarily include cash and cash equivalents,investments, deferred tax assets, goodwill, intangible assets, and other assets.
The following tables present net revenue by Dell’s reportable segments as well as a reconciliation of consolidated segment operatingincome to Dell’s consolidated operating income:
January 30,2009
February 1,2008
February 2,2007
Fiscal Year Ended
(in millions)Net revenue
Americas Commercial . . . . . . . . . . . . . . . . . . . . . . . . . . . . . . . . . . . . . . . $ 28,614 $ 29,981 $ 28,289
EMEA Commercial . . . . . . . . . . . . . . . . . . . . . . . . . . . . . . . . . . . . . . . . . 13,617 13,607 11,842APJ Commercial . . . . . . . . . . . . . . . . . . . . . . . . . . . . . . . . . . . . . . . . . . . 7,341 7,167 6,223
Global Consumer . . . . . . . . . . . . . . . . . . . . . . . . . . . . . . . . . . . . . . . . . . . 11,529 10,378 11,066
Net revenue . . . . . . . . . . . . . . . . . . . . . . . . . . . . . . . . . . . . . . . . . . . . . $ 61,101 $ 61,133 $ 57,420
Consolidated operating income
Americas Commercial . . . . . . . . . . . . . . . . . . . . . . . . . . . . . . . . . . . . . . . $ 2,568 $ 2,566 $ 2,351EMEA Commercial . . . . . . . . . . . . . . . . . . . . . . . . . . . . . . . . . . . . . . . . . 544 978 622
APJ Commercial . . . . . . . . . . . . . . . . . . . . . . . . . . . . . . . . . . . . . . . . . . . 458 424 335
Global Consumer . . . . . . . . . . . . . . . . . . . . . . . . . . . . . . . . . . . . . . . . . . . 143 2 130
Consolidated segment operating income . . . . . . . . . . . . . . . . . . . . . . . . $ 3,713 $ 3,970 $ 3,438
Stock-based compensation expense(a) . . . . . . . . . . . . . . . . . . . . . . . . . . (418) (436) (368)
In-process research and development(b) . . . . . . . . . . . . . . . . . . . . . . . . . (2) (83) -
Amortization of intangible assets(b) . . . . . . . . . . . . . . . . . . . . . . . . . . . . (103) (11) -
Consolidated operating income . . . . . . . . . . . . . . . . . . . . . . . . . . . . . $ 3,190 $ 3,440 $ 3,070
(a) Stock-based compensation expense includes $104 million of expense for accelerated options in Fiscal 2009 and $107 million of cash expense for expired stock optionsin Fiscal 2008. See Note 5 of Notes to Consolidated Financial Statements for additional information.
(b) Prior to the fourth quarter of Fiscal 2008, amortization of intangibles and IPR&D expenses of $16 million and $5 million are included in total consolidated segmentoperating income in Fiscal 2008 and 2007, respectively.
88
DELL INC.
NOTES TO CONSOLIDATED FINANCIAL STATEMENTS (Continued)

The following tables present depreciation expense and capital expenditures by Dell’s reportable segments and assets by region:
January 30,2009
February 1,2008
February 2,2007
Fiscal Year Ended
(in millions)Depreciation expense:
Americas Commercial . . . . . . . . . . . . . . . . . . . . . . . . . . . . . . . . . . . . . . . $ 355 $ 286 $ 214
EMEA Commercial . . . . . . . . . . . . . . . . . . . . . . . . . . . . . . . . . . . . . . . . . 101 124 95
APJ Commercial . . . . . . . . . . . . . . . . . . . . . . . . . . . . . . . . . . . . . . . . . . . 80 86 71
Global Consumer . . . . . . . . . . . . . . . . . . . . . . . . . . . . . . . . . . . . . . . . . . . 130 103 91
Total . . . . . . . . . . . . . . . . . . . . . . . . . . . . . . . . . . . . . . . . . . . . . . . . $ 666 $ 599 $ 471
Capital expenditures:
Americas Commercial . . . . . . . . . . . . . . . . . . . . . . . . . . . . . . . . . . . . . . . $ 242 $ 387 $ 490
EMEA Commercial . . . . . . . . . . . . . . . . . . . . . . . . . . . . . . . . . . . . . . . . . 54 179 125
APJ Commercial . . . . . . . . . . . . . . . . . . . . . . . . . . . . . . . . . . . . . . . . . . . 56 125 103
Global Consumer . . . . . . . . . . . . . . . . . . . . . . . . . . . . . . . . . . . . . . . . . . . 88 140 178
Total . . . . . . . . . . . . . . . . . . . . . . . . . . . . . . . . . . . . . . . . . . . . . . . . $ 440 $ 831 $ 896
January 30,2009
February 1,2008
(in millions)Assets:
Corporate . . . . . . . . . . . . . . . . . . . . . . . . . . . . . . . . . . . . . . . . . . . . . . . . $ 12,664 $ 15,336
Americas . . . . . . . . . . . . . . . . . . . . . . . . . . . . . . . . . . . . . . . . . . . . . . . . . 8,781 6,524
EMEA. . . . . . . . . . . . . . . . . . . . . . . . . . . . . . . . . . . . . . . . . . . . . . . . . . . 3,026 3,597
APJ . . . . . . . . . . . . . . . . . . . . . . . . . . . . . . . . . . . . . . . . . . . . . . . . . . . . . 2,029 2,104
Total . . . . . . . . . . . . . . . . . . . . . . . . . . . . . . . . . . . . . . . . . . . . . . . . $ 26,500 $ 27,561
The following tables present net revenue and long-lived asset information allocated between the U.S. and foreign countries:
January 30,2009
February 1,2008
February 2,2007
Fiscal Year Ended
(in millions)Net revenue:
United States . . . . . . . . . . . . . . . . . . . . . . . . . . . . . . . . . . . . . . . . . . . . $ 31,569 $ 32,687 $ 32,361
Foreign countries . . . . . . . . . . . . . . . . . . . . . . . . . . . . . . . . . . . . . . . . . 29,532 28,446 25,059
Net revenue . . . . . . . . . . . . . . . . . . . . . . . . . . . . . . . . . . . . . . . . . . . $ 61,101 $ 61,133 $ 57,420
89
DELL INC.
NOTES TO CONSOLIDATED FINANCIAL STATEMENTS (Continued)

January 30,2009
February 1,2008
February 2,2007
(in millions)Long-lived assets:
United States . . . . . . . . . . . . . . . . . . . . . . . . . . . . . . . . . . . . . . . . . . . . $ 1,495 $ 1,622 $ 1,538
Foreign countries . . . . . . . . . . . . . . . . . . . . . . . . . . . . . . . . . . . . . . . . . 782 1,046 871
Long-lived assets . . . . . . . . . . . . . . . . . . . . . . . . . . . . . . . . . . . . . . . $ 2,277 $ 2,668 $ 2,409
The allocation between domestic and foreign net revenue is based on the location of the customers. Net revenue and long-lived assetsfrom any single foreign country did not comprise more than 10% of Dell’s consolidated net revenues or long-lived assets during Fiscal2009, 2008, and 2007. No single customer accounted for more than 10% of Dell’s consolidated net revenue during Fiscal 2009, 2008, and2007.
The following table presents net revenue by product groups:
January 30,2009
February 1,2008
February 2,2007
Fiscal Year Ended
(in millions)Net revenue:
Mobility. . . . . . . . . . . . . . . . . . . . . . . . . . . . . . . . . . . . . . . . . . . . . . . . $ 18,638 $ 17,423 $ 15,480
Desktop PCs . . . . . . . . . . . . . . . . . . . . . . . . . . . . . . . . . . . . . . . . . . . . 17,244 19,573 19,815
Software and peripherals . . . . . . . . . . . . . . . . . . . . . . . . . . . . . . . . . . . 10,603 9,908 9,001
Servers and networking . . . . . . . . . . . . . . . . . . . . . . . . . . . . . . . . . . . . 6,275 6,474 5,805
Enhanced services . . . . . . . . . . . . . . . . . . . . . . . . . . . . . . . . . . . . . . . . 5,715 5,320 5,063
Storage . . . . . . . . . . . . . . . . . . . . . . . . . . . . . . . . . . . . . . . . . . . . . . . . 2,626 2,435 2,256
Net revenue . . . . . . . . . . . . . . . . . . . . . . . . . . . . . . . . . . . . . . . . . . . . . . . $ 61,101 $ 61,133 $ 57,420
90
DELL INC.
NOTES TO CONSOLIDATED FINANCIAL STATEMENTS (Continued)
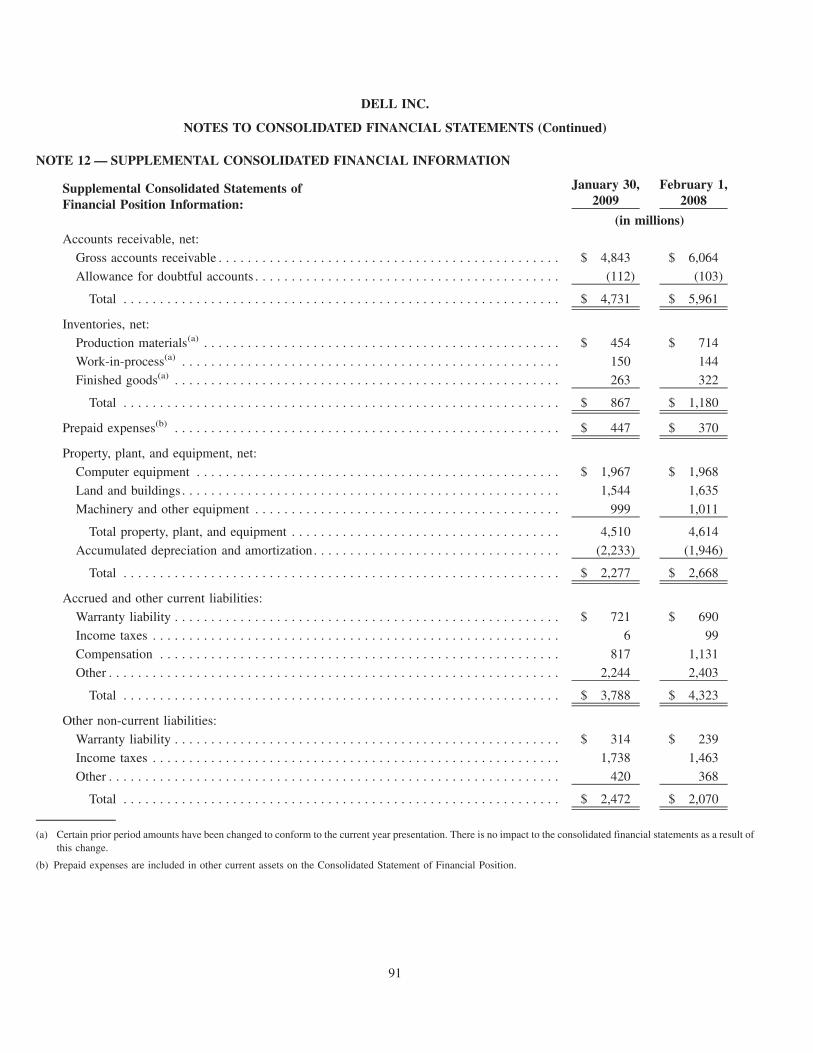
NOTE 12 — SUPPLEMENTAL CONSOLIDATED FINANCIAL INFORMATION
Supplemental Consolidated Statements ofFinancial Position Information:
January 30,2009
February 1,2008
(in millions)Accounts receivable, net:
Gross accounts receivable . . . . . . . . . . . . . . . . . . . . . . . . . . . . . . . . . . . . . . . . . . . . . . . $ 4,843 $ 6,064
Allowance for doubtful accounts . . . . . . . . . . . . . . . . . . . . . . . . . . . . . . . . . . . . . . . . . . (112) (103)
Total . . . . . . . . . . . . . . . . . . . . . . . . . . . . . . . . . . . . . . . . . . . . . . . . . . . . . . . . . . . . $ 4,731 $ 5,961
Inventories, net:
Production materials(a) . . . . . . . . . . . . . . . . . . . . . . . . . . . . . . . . . . . . . . . . . . . . . . . . . $ 454 $ 714
Work-in-process(a) . . . . . . . . . . . . . . . . . . . . . . . . . . . . . . . . . . . . . . . . . . . . . . . . . . . . 150 144
Finished goods(a) . . . . . . . . . . . . . . . . . . . . . . . . . . . . . . . . . . . . . . . . . . . . . . . . . . . . . 263 322
Total . . . . . . . . . . . . . . . . . . . . . . . . . . . . . . . . . . . . . . . . . . . . . . . . . . . . . . . . . . . . $ 867 $ 1,180
Prepaid expenses(b) . . . . . . . . . . . . . . . . . . . . . . . . . . . . . . . . . . . . . . . . . . . . . . . . . . . . . $ 447 $ 370
Property, plant, and equipment, net:
Computer equipment . . . . . . . . . . . . . . . . . . . . . . . . . . . . . . . . . . . . . . . . . . . . . . . . . . $ 1,967 $ 1,968
Land and buildings . . . . . . . . . . . . . . . . . . . . . . . . . . . . . . . . . . . . . . . . . . . . . . . . . . . . 1,544 1,635
Machinery and other equipment . . . . . . . . . . . . . . . . . . . . . . . . . . . . . . . . . . . . . . . . . . 999 1,011
Total property, plant, and equipment . . . . . . . . . . . . . . . . . . . . . . . . . . . . . . . . . . . . . 4,510 4,614
Accumulated depreciation and amortization. . . . . . . . . . . . . . . . . . . . . . . . . . . . . . . . . . (2,233) (1,946)
Total . . . . . . . . . . . . . . . . . . . . . . . . . . . . . . . . . . . . . . . . . . . . . . . . . . . . . . . . . . . . $ 2,277 $ 2,668
Accrued and other current liabilities:
Warranty liability . . . . . . . . . . . . . . . . . . . . . . . . . . . . . . . . . . . . . . . . . . . . . . . . . . . . . $ 721 $ 690
Income taxes . . . . . . . . . . . . . . . . . . . . . . . . . . . . . . . . . . . . . . . . . . . . . . . . . . . . . . . . 6 99
Compensation . . . . . . . . . . . . . . . . . . . . . . . . . . . . . . . . . . . . . . . . . . . . . . . . . . . . . . . 817 1,131
Other . . . . . . . . . . . . . . . . . . . . . . . . . . . . . . . . . . . . . . . . . . . . . . . . . . . . . . . . . . . . . . 2,244 2,403
Total . . . . . . . . . . . . . . . . . . . . . . . . . . . . . . . . . . . . . . . . . . . . . . . . . . . . . . . . . . . . $ 3,788 $ 4,323
Other non-current liabilities:
Warranty liability . . . . . . . . . . . . . . . . . . . . . . . . . . . . . . . . . . . . . . . . . . . . . . . . . . . . . $ 314 $ 239
Income taxes . . . . . . . . . . . . . . . . . . . . . . . . . . . . . . . . . . . . . . . . . . . . . . . . . . . . . . . . 1,738 1,463
Other . . . . . . . . . . . . . . . . . . . . . . . . . . . . . . . . . . . . . . . . . . . . . . . . . . . . . . . . . . . . . . 420 368
Total . . . . . . . . . . . . . . . . . . . . . . . . . . . . . . . . . . . . . . . . . . . . . . . . . . . . . . . . . . . . $ 2,472 $ 2,070
(a) Certain prior period amounts have been changed to conform to the current year presentation. There is no impact to the consolidated financial statements as a result ofthis change.
(b) Prepaid expenses are included in other current assets on the Consolidated Statement of Financial Position.
91
DELL INC.
NOTES TO CONSOLIDATED FINANCIAL STATEMENTS (Continued)

The table below provides a detailed presentation of investment and other income, net for Fiscal 2009, Fiscal 2008, and Fiscal 2007:
January 30,2009
February 1,2008
February 2,2007
(in millions)
Fiscal Year Ended
Investment and other income, net:
Investment income, primarily interest . . . . . . . . . . . . . . . . . . . . . . . . . . $ 180 $ 496 $ 368
(Losses) gains on investments, net . . . . . . . . . . . . . . . . . . . . . . . . . . . . (10) 14 (5)
Interest expense . . . . . . . . . . . . . . . . . . . . . . . . . . . . . . . . . . . . . . . . . . (93) (45) (45)
CIT minority interest . . . . . . . . . . . . . . . . . . . . . . . . . . . . . . . . . . . . . . - (29) (23)
Foreign exchange . . . . . . . . . . . . . . . . . . . . . . . . . . . . . . . . . . . . . . . . . 115 (30) (37)
Gain on sale of building . . . . . . . . . . . . . . . . . . . . . . . . . . . . . . . . . . . . - - 36
Other. . . . . . . . . . . . . . . . . . . . . . . . . . . . . . . . . . . . . . . . . . . . . . . . . . (58) (19) (19)
Investment and other income, net . . . . . . . . . . . . . . . . . . . . . . . . . . . . . . . $ 134 $ 387 $ 275
NOTE 13 — UNAUDITED QUARTERLY RESULTS AND STOCK PRICES
Unaudited Quarterly Results — The following tables present selected unaudited Consolidated Statements of Income and stock salesprice data for each quarter of Fiscal 2009 and Fiscal 2008:
FirstQuarter
SecondQuarter
ThirdQuarter
FourthQuarter
Fiscal Year 2009
(in millions, except per share data)
Net revenue . . . . . . . . . . . . . . . . . . . . . . . . . . . . . . . . . . . . . . . . . $ 16,077 $ 16,434 $ 15,162 $ 13,428
Gross margin . . . . . . . . . . . . . . . . . . . . . . . . . . . . . . . . . . . . . . . . $ 2,965 $ 2,827 $ 2,853 $ 2,312Net income . . . . . . . . . . . . . . . . . . . . . . . . . . . . . . . . . . . . . . . . . $ 784 $ 616 $ 727 $ 351
Earnings per common share:
Basic . . . . . . . . . . . . . . . . . . . . . . . . . . . . . . . . . . . . . . . . . . . . $ 0.39 $ 0.31 $ 0.37 $ 0.18
Diluted . . . . . . . . . . . . . . . . . . . . . . . . . . . . . . . . . . . . . . . . . . . $ 0.38 $ 0.31 $ 0.37 $ 0.18
Weighted-average shares outstanding:
Basic . . . . . . . . . . . . . . . . . . . . . . . . . . . . . . . . . . . . . . . . . . . . 2,036 1,991 1,953 1,944
Diluted . . . . . . . . . . . . . . . . . . . . . . . . . . . . . . . . . . . . . . . . . . . 2,040 1,999 1,957 1,948
Stock sales price per share:
High . . . . . . . . . . . . . . . . . . . . . . . . . . . . . . . . . . . . . . . . . . . . $ 21.18 $ 25.26 $ 26.04 $ 13.32
Low . . . . . . . . . . . . . . . . . . . . . . . . . . . . . . . . . . . . . . . . . . . . . $ 18.13 $ 18.66 $ 10.59 $ 8.72
92
DELL INC.
NOTES TO CONSOLIDATED FINANCIAL STATEMENTS (Continued)
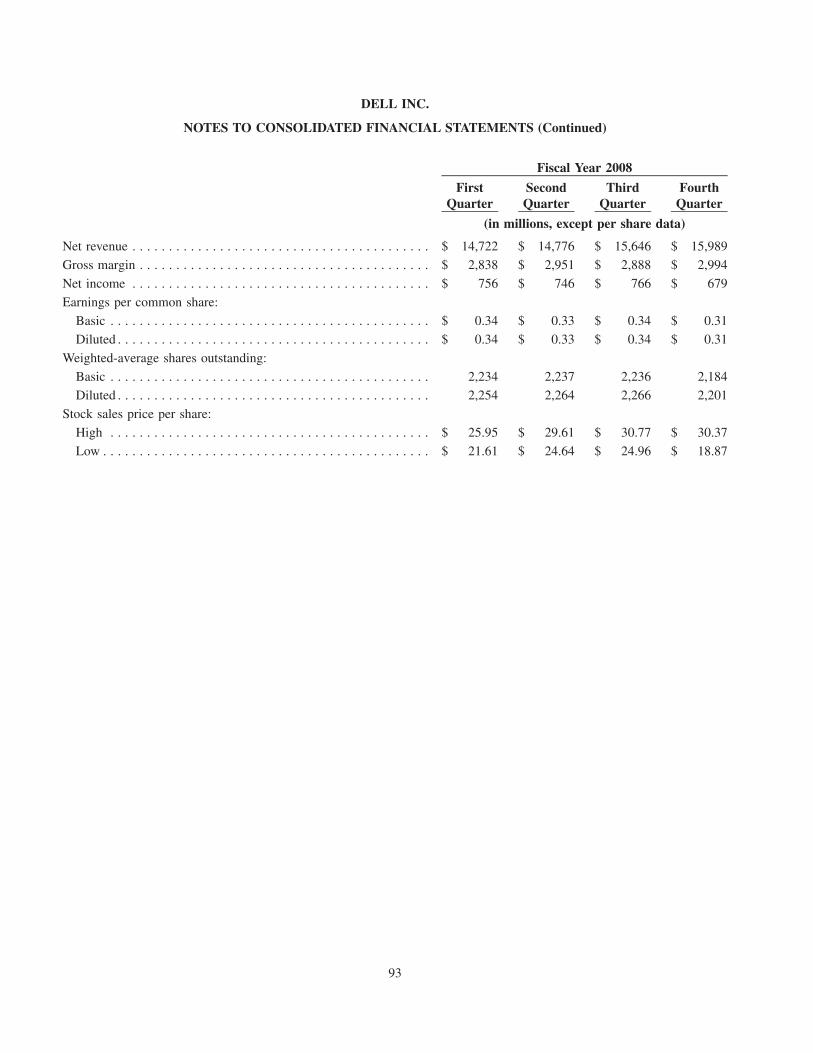
FirstQuarter
SecondQuarter
ThirdQuarter
FourthQuarter
Fiscal Year 2008
(in millions, except per share data)
Net revenue . . . . . . . . . . . . . . . . . . . . . . . . . . . . . . . . . . . . . . . . . $ 14,722 $ 14,776 $ 15,646 $ 15,989
Gross margin . . . . . . . . . . . . . . . . . . . . . . . . . . . . . . . . . . . . . . . . $ 2,838 $ 2,951 $ 2,888 $ 2,994
Net income . . . . . . . . . . . . . . . . . . . . . . . . . . . . . . . . . . . . . . . . . $ 756 $ 746 $ 766 $ 679
Earnings per common share:
Basic . . . . . . . . . . . . . . . . . . . . . . . . . . . . . . . . . . . . . . . . . . . . $ 0.34 $ 0.33 $ 0.34 $ 0.31
Diluted . . . . . . . . . . . . . . . . . . . . . . . . . . . . . . . . . . . . . . . . . . . $ 0.34 $ 0.33 $ 0.34 $ 0.31
Weighted-average shares outstanding:
Basic . . . . . . . . . . . . . . . . . . . . . . . . . . . . . . . . . . . . . . . . . . . . 2,234 2,237 2,236 2,184
Diluted . . . . . . . . . . . . . . . . . . . . . . . . . . . . . . . . . . . . . . . . . . . 2,254 2,264 2,266 2,201
Stock sales price per share:
High . . . . . . . . . . . . . . . . . . . . . . . . . . . . . . . . . . . . . . . . . . . . $ 25.95 $ 29.61 $ 30.77 $ 30.37
Low . . . . . . . . . . . . . . . . . . . . . . . . . . . . . . . . . . . . . . . . . . . . . $ 21.61 $ 24.64 $ 24.96 $ 18.87
93
DELL INC.
NOTES TO CONSOLIDATED FINANCIAL STATEMENTS (Continued)

ITEM 9 — CHANGES IN AND DISAGREEMENTS WITH ACCOUNTANTS ON ACCOUNTING AND FINANCIALDISCLOSURE
Not applicable.
ITEM 9A — CONTROLS AND PROCEDURES
This Report includes the certifications of our Chief Executive Officer and Chief Financial Officer required by Rule 13a-14 of theSecurities Exchange Act of 1934 (the “Exchange Act”). See Exhibits 31.1 and 31.2. This Item 9A includes information concerning thecontrols and control evaluations referred to in those certifications.
Evaluation of Disclosure Controls and Procedures
Disclosure controls and procedures (as defined in Rules 13a-15(e) and 15d-15(e) under the Exchange Act) are designed to ensure thatinformation required to be disclosed in reports filed or submitted under the Exchange Act is recorded, processed, summarized, andreported within the time periods specified in SEC rules and forms and that such information is accumulated and communicated tomanagement, including the Chief Executive Officer and the Chief Financial Officer, to allow timely decisions regarding requireddisclosures.
In connection with the preparation of this Report, our management, under the supervision and with the participation of our ChiefExecutive Officer and Chief Financial Officer, conducted an evaluation of the effectiveness of the design and operation of our disclosurecontrols and procedures as of January 30, 2009. Based on that evaluation, our management has concluded that our disclosure controls andprocedures were effective as of January 30, 2009.
Management’s Report on Internal Control over Financial Reporting
Management, under the supervision of the Chief Executive Officer and the Chief Financial Officer, is responsible for establishing andmaintaining adequate internal control over financial reporting. Internal control over financial reporting (as defined in Rules 13a-15(f) and15d(f) under the Exchange Act) is a process designed to provide reasonable assurance regarding the reliability of financial reporting andthe preparation of financial statements for external purposes in accordance with generally accepted accounting principles in the UnitedStates of America (“GAAP”). Internal control over financial reporting includes those policies and procedures which (a) pertain to themaintenance of records that, in reasonable detail, accurately and fairly reflect the transactions and dispositions of assets, (b) providereasonable assurance that transactions are recorded as necessary to permit preparation of financial statements in accordance with GAAP,(c) provide reasonable assurance that receipts and expenditures are being made only in accordance with appropriate authorization ofmanagement and the board of directors, and (d) provide reasonable assurance regarding prevention or timely detection of unauthorizedacquisition, use, or disposition of assets that could have a material effect on the financial statements.
In connection with the preparation of this Report, our management, under the supervision and with the participation of our ChiefExecutive Officer and Chief Financial Officer, conducted an evaluation of the effectiveness of our internal control over financialreporting as of January 30, 2009 based on the criteria established in Internal Control — Integrated Framework issued by the Committeeof Sponsoring Organizations of the Treadway Commission. As a result of that evaluation, management has concluded that our internalcontrol over financial reporting was effective as of January 30, 2009. The effectiveness of our internal control over financial reporting asof January 30, 2009 has also been audited by PricewaterhouseCoopers LLP, our independent registered public accounting firm, as statedin their report, which is included in “Part II — Item 8 — Financial Statements and Supplementary Data.”
Changes in Internal Control over Financial Reporting
Dell’s management, with the participation of Dell’s Chief Executive Officer and Chief Financial Officer, has evaluated whether anychange in Dell’s internal control over financial reporting occurred during the fourth quarter of Fiscal 2009. Based on that evaluation,management concluded that there has been no change in Dell’s internal control over financial reporting during the fourth quarter of Fiscal2009 that has materially affected, or is reasonably likely to materially affect, Dell’s internal control over financial reporting.
Inherent Limitations over Internal Controls
Our system of controls is designed to provide reasonable, not absolute, assurance regarding the reliability and integrity of accounting andfinancial reporting. Management does not expect that our disclosure controls and procedures or our internal control over financial
94
reporting will prevent or detect all errors and all fraud. A control system, no matter how well designed and operated, can provide onlyreasonable, not absolute, assurance that the objectives of the control system will be met. These inherent limitations include the following:
• Judgments in decision-making can be faulty, and control and process breakdowns can occur because of simple errors or mistakes.
• Controls can be circumvented by individuals, acting alone or in collusion with each other, or by management override.
• The design of any system of controls is based in part on certain assumptions about the likelihood of future events, and there can be noassurance that any design will succeed in achieving its stated goals under all potential future conditions.
• Over time, controls may become inadequate because of changes in conditions or deterioration in the degree of compliance withassociated policies or procedures.
• The design of a control system must reflect the fact that resources are constrained, and the benefits of controls must be consideredrelative to their costs.
Because of the inherent limitations in all control systems, no evaluation of controls can provide absolute assurance that all control issuesand instances of fraud, if any, have been detected.
ITEM 9B — OTHER INFORMATION
None.
95

PART III
The information called for by Part III of Form 10-K (Item 10 — Directors, Executive Officers and Corporate Governance, Item 11 —Executive Compensation, Item 12 — Security Ownership of Certain Beneficial Owners and Management and Related StockholderMatters, Item 13 — Certain Relationships and Related Transactions, and Director Independence, and Item 14 — Principal AccountantFees and Services), to the extent not set forth herein under “Item 1 — Business — Executive Officers of Dell,” is incorporated byreference from Dell’s proxy statement relating to the 2009 annual meeting of stockholders. Such proxy statement will be filed with theSecurities and Exchange Commission within 120 days after the end of the fiscal year to which this report relates.
PART IV
ITEM 15 — EXHIBITS, FINANCIAL STATEMENT SCHEDULES
Financial Statements
The following financial statements are filed as a part of this report under “Part II — Item 8 — Financial Statements and SupplementaryData:”
Page
Financial Statements:
Report of Independent Registered Public Accounting Firm . . . . . . . . . . . . . . . . . . . . . . . . . . . . . . . . . . . . . . . . . 50
Consolidated Statements of Financial Position at January 30, 2009 and February 1, 2008 . . . . . . . . . . . . . . . . . . 51
Consolidated Statements of Income for the fiscal years ended January 30, 2009, February 1, 2008, andFebruary 2, 2007 . . . . . . . . . . . . . . . . . . . . . . . . . . . . . . . . . . . . . . . . . . . . . . . . . . . . . . . . . . . . . . . . . . . . . . 52
Consolidated Statements of Cash Flows for the fiscal years ended January 30, 2009, February 1, 2008, andFebruary 2, 2007 . . . . . . . . . . . . . . . . . . . . . . . . . . . . . . . . . . . . . . . . . . . . . . . . . . . . . . . . . . . . . . . . . . . . . . 53
Consolidated Statements of Stockholders’ Equity for the fiscal years ended January 30, 2009, February 1, 2008,and February 2, 2007 . . . . . . . . . . . . . . . . . . . . . . . . . . . . . . . . . . . . . . . . . . . . . . . . . . . . . . . . . . . . . . . . . . 54
Notes to Consolidated Financial Statements . . . . . . . . . . . . . . . . . . . . . . . . . . . . . . . . . . . . . . . . . . . . . . . . . . . . 55
A list of the exhibits filed or furnished with this report (or incorporated by reference to exhibits previously filed or furnished) is providedin the Exhibit index on page 100 of this report.
96

Financial Statement Schedule
The following financial statement schedule is filed as a part of this report under Schedule II immediately preceding the signature page:Schedule II — Valuation and Qualifying Accounts for the three fiscal years ended January 30, 2009, February 1, 2008, and February 2,2007. All other schedules called for by Form 10-K are omitted because they are inapplicable or the required information is shown in theconsolidated financial statements, or notes thereto, included herein.
SCHEDULE II
DELL INC.
VALUATION AND QUALIFYING ACCOUNTS
FiscalYear Description
Balance atBeginningof Period
Charged toIncome
StatementCharged toAllowance
Balanceat End of
Period
Trade Receivables:
2009 Allowance for doubtful accounts . . . . . . . . . . . . . . . . . . . . . . . $ 103 $ 133 $ 124 $ 112
2008 Allowance for doubtful accounts . . . . . . . . . . . . . . . . . . . . . . . $ 126 $ 82 $ 105 $ 103
2007 Allowance for doubtful accounts . . . . . . . . . . . . . . . . . . . . . . . $ 96 $ 107 $ 77 $ 126
Customer Financing Receivables:(a)
2009 Allowance for financing receivable losses . . . . . . . . . . . . . . . . $ 96 $ 159 $ 106 $ 149
2008 Allowance for financing receivable losses . . . . . . . . . . . . . . . . $ 39 $ 105 $ 48 $ 96
2007 Allowance for financing receivable losses . . . . . . . . . . . . . . . . $ 22 $ 40 $ 23 $ 39
Trade Receivables:
2009 Allowance for customer returns . . . . . . . . . . . . . . . . . . . . . . . . $ 91 $ 401 $ 423 $ 69
2008 Allowance for customer returns . . . . . . . . . . . . . . . . . . . . . . . . $ 53 $ 475 $ 437 $ 91
2007 Allowance for customer returns . . . . . . . . . . . . . . . . . . . . . . . . $ 57 $ 387 $ 391 $ 53
(a) Charge-offs to the allowance for doubtful accounts for customer financing receivables includes principal and interest.
97

SIGNATURES
Pursuant to the requirements of Section 13 or 15(d) of the Securities Exchange Act of 1934, the registrant has duly caused this report to besigned on its behalf by the undersigned, thereunto duly authorized.
DELL INC.
By: /s/ MICHAEL S. DELL
Michael S. DellChairman and Chief Executive Officer
Date: March 26, 2009
98

Pursuant to the requirements of the Securities Exchange Act of 1934, this report has been signed below by the following persons onbehalf of the registrant and in the capacities and on the dates indicated.
Name Title Date
/s/ MICHAEL S. DELLMichael S. Dell
Chairman and Chief Executive Officer (principalexecutive officer)
March 26, 2009
/s/ DONALD J. CARTYDonald J. Carty
Director March 26, 2009
/s/ WILLIAM H. GRAY, IIIWilliam H. Gray, III
Director March 26, 2009
/s/ SALLIE L. KRAWCHECKSallie L. Krawcheck
Director March 26, 2009
/s/ ALAN G. LAFLEYAlan G. Lafley
Director March 26, 2009
/s/ JUDY C. LEWENTJudy C. Lewent
Director March 26, 2009
/s/ THOMAS W. LUCE IIIThomas W. Luce III
Director March 26, 2009
/s/ KLAUS S. LUFTKlaus S. Luft
Director March 26, 2009
/s/ ALEX J. MANDLAlex J. Mandl
Director March 26, 2009
/s/ MICHAEL A. MILESMichael A. Miles
Director March 26, 2009
/s/ SAMUEL A. NUNN, JR.Samuel A. Nunn, Jr.
Director March 26, 2009
/s/ BRIAN T. GLADDENBrian T. Gladden
Senior Vice President and Chief Financial Officer March 26, 2009
/s/ THOMAS W. SWEETThomas W. Sweet
Vice President, Corporate Finance(principal accounting officer)
March 26, 2009
99
Exhibits
ExhibitNo. Description of Exhibit
3.1 — Restated Certificate of Incorporation, filed February 1, 2006 (incorporated by reference to Exhibit 3.3 of Dell’s CurrentReport on Form 8-K filed on February 2, 2006, Commission File No. 0-17017)
3.2 — Restated Bylaws, as amended and effective March 8, 2007 (incorporated by reference to Exhibit 3.1 of Dell’s Current Reporton Form 8-K filed on March 13, 2007, Commission File No. 0-17017)
4.1 — Indenture, dated as of April 27, 1998, between Dell Computer Corporation and Chase Bank of Texas, National Association(incorporated by reference to Exhibit 99.2 of Dell’s Current Report on Form 8-K filed April 28, 1998, Commission FileNo. 0-17017)
4.2 — Officers’ Certificate pursuant to Section 301 of the Indenture establishing the terms of Dell’s 7.10% Senior Debentures Due2028 (incorporated by reference to Exhibit 99.4 of Dell’s Current Report on Form 8-K filed April 28, 1998, Commission FileNo. 0-17017)
4.3 — Form of Dell’s 7.10% Senior Debentures Due 2028 (incorporated by reference to Exhibit 99.6 of Dell’s Current Report onForm 8-K filed April 28, 1998, Commission File No. 0-17017)
4.4 — Indenture, dated as of April 17, 2008, between Dell Inc. and The Bank of New York Trust Company, N.A., as trustee(including the form of notes), (incorporated by reference to Exhibit 4.1 of Dell’s Current Report on Form 8-K filed April 17,2008, Commission file No. 0-17017)
10.1* — Amended and Restated Dell Computer Corporation 1994 Incentive Plan (incorporated by reference to Exhibit 99 of Dell’sRegistration Statement on Form S-8, filed October 31, 2000, Registration No. 333-49014)
10.2* — Amended and Restated Dell Computer Corporation 1998 Broad-Based Stock Option Plan (incorporated by reference toExhibit 99 of Dell’s Registration Statement on Form S-8, filed October 31, 2000, Registration No. 333-49016)
10.3* — Dell Computer Corporation 2002 Long-Term Incentive Plan (incorporated by reference to Exhibit 10.1 of Dell’s QuarterlyReport on Form 10-Q for the fiscal quarter ended August 2, 2002, Commission File No. 0-17017)
10.4* — Dell Inc. Amended and Restated 2002 Long-Term Incentive Plan (incorporated by reference to Appendix A of Dell’s 2007proxy statement filed on October 31, 2007, Commission File No. 0-17017)
10.5* — Amended and Restated Dell Inc. 401(k) Plan, adopted effective as of January 1, 2007 (incorporated by reference toExhibit 10.5 of Dell’s Annual Report on Form 10-K for the fiscal year ended February 1, 2008, Commission FileNo. 0-17017)
10.6*† — Amendment One to the Amended and Restated Dell Inc. 401(k) Plan, effective as of January 1, 2008
10.7*† — Amended and Restated Dell Inc. Deferred Compensation Plan effective as of January 1, 2005
10.8*† — Amended and Restated Dell Inc. Deferred Compensation Plan for Non-Employee Directors effective as of January 1, 2005
10.9* — Executive Incentive Bonus Plan, adopted July 18, 2003 (incorporated by reference to Exhibit 10.1 of Dell’s Quarterly Reporton Form 10-Q for the fiscal quarter ended August 1, 2003, Commission File No. 0-17017)
10.10* — Executive Annual Incentive Bonus Plan (incorporated by reference to Appendix A of Dell’s 2008 proxy statement filed onJune 2, 2008, Commission File No. 0-17017)
10.11* — Form of Indemnification Agreement between Dell and each Non-Employee Director of Dell (incorporated by reference toExhibit 10.11 to Dell’s Annual Report on Form 10-K for the fiscal year ended January 31, 2003, Commission FileNo. 0-17017)
10.12* — Form of Performance Based Stock Unit Agreement for employees under the 2002 Long-Term Incentive Plan (incorporatedby reference to Exhibit 99.2 of Dell’s Current Report on Form 8-K filed March 14, 2006, Commission File No. 0-17017)
10.13* — Form of Restricted Stock Agreement for Non-Employee Directors under the 2002 Long-Term Incentive Plan (incorporatedby reference to Exhibit 99.1 of Dell’s Current Report on Form 8-K filed July 27, 2006, Commission File No. 0-17017)
10.14* — Form of Restricted Stock Unit Agreement for Non-Employee Directors under the 2002 Long-Term Incentive Plan(incorporated by reference to Exhibit 99.2 of Dell’s Current Report on Form 8-K filed July 27, 2006, Commission FileNo. 0-17017)
10.15* — Form of Nonstatutory Stock Option Agreement for Non-Employee Directors under the 2002 Long-Term Incentive Plan(incorporated by reference to Exhibit 99.3 of Dell’s Current Report on Form 8-K filed July 27, 2006, Commission FileNo. 0-17017)
100

ExhibitNo. Description of Exhibit
10.16* — Form of Nonstatutory Stock Option Agreement for grant to Donald J. Carty under the 2002 Long-Term Incentive Plan(incorporated by reference to Exhibit 99.1 of Dell’s Current Report on Form 8-K filed December 20, 2006, Commission FileNo. 0-17017)
10.17* — Form of Stock Unit Agreement for grant to Donald J. Carty under the 2002 Long-Term Incentive Plan (incorporated byreference to Exhibit 99.2 of Dell’s Current Report on Form 8-K filed December 20, 2006, Commission File No. 0-17017)
10.18* — Form of Restricted Stock Unit Agreement for Non-Employee Directors under the Amended and Restated 2002 Long-TermIncentive Plan (incorporated by reference to Exhibit 10.10 of Dell’s Quarterly Report on Form 10-Q filed October 30, 2007,Commission File No. 0-17017)
10.19* — Form of Nonstatutory Stock Option Agreement for Non-Employee Directors under the Amended and Restated 2002 Long-Term Incentive Plan (incorporated by reference to Exhibit 10.11 of Dell’s Quarterly Report on Form 10-Q filed October 30,2007, Commission File No. 0-17017)
10.20* — Form of Performance Based Stock Unit Agreement for Executive Officers under the Amended and Restated 2002 Long-TermIncentive Plan (incorporated by reference to Exhibit 10.17 of Dell’s Annual Report on Form 10-K for the fiscal year endedFebruary 1, 2008, Commission File No. 0-17017)
10.21*† — Form of Performance Based Stock Unit Agreement for Executive Officers under the Amended and Restated 2002 Long-TermIncentive Plan
10.22*† — Form of Nonstatutory Stock Option Agreement for Executive Officers under the Amended and Restated 2002 Long-TermIncentive Plan
10.23*† — Form of Restricted Stock Unit Agreement for Executive Officers under the Amended and Restated 2002 Long-TermIncentive Plan
10.24* — Form of Protection of Sensitive Information, Noncompetition and Nonsolicitation Agreement for Executive Officers(incorporated by reference to Exhibit 10.1 of Dell’s Current Report on Form 8-K filed on July 16, 2007, Commission fileNo. 0-17017)
10.25* — Protection of Sensitive Information, Noncompetition and Nonsolicitation Agreement between Kevin B. Rollins and Dell Inc.(incorporated by reference to Exhibit 99.2 of Dell’s Current Report on Form 8-K filed February 20, 2007, Commission FileNo. 0-17017)
10.26* — Letter Agreement regarding Severance Benefits between Michael R. Cannon and Dell Inc. (incorporated by reference toExhibit 99.1 of Dell’s Current Report on Form 8-K filed February 21, 2007, Commission File No. 0-17017)
10.27* — Letter Agreement regarding Severance Benefits between Ronald G. Garriques and Dell Inc. (incorporated by reference toExhibit 99.2 of Dell’s Current Report on Form 8-K filed February 21, 2007, Commission File No. 0-17017)
10.28* — Form of Protection of Sensitive Information, Noncompetition and Nonsolicitation Agreement (incorporated by reference toExhibit 99.3 of Dell’s Current Report on Form 8-K filed February 21, 2007, Commission File No. 0-17017)
10.29* — Form of Protection of Sensitive Information, Noncompetition and Nonsolicitation Agreement for Executive Officers(incorporated by reference to Exhibit 10.1 of Dell’s Current Report on Form 8-K filed on September 12, 2007, Commissionfile No. 0-17017)
10.30* — Separation Agreement and Release between Kevin B. Rollins and Dell Inc. (incorporated by reference to Exhibit 99.1 ofDell’s Current Report on Form 8-K filed February 20, 2007, Commission File No. 0-17017)
10.31* — Separation Agreement and Release between Michael R. Cannon and Dell Inc. (incorporated by reference to Exhibit 99.1 ofDell’s Current Report on Form 8-K filed January 8, 2009, Commission file No. 0-17017)
10.32* — Consultancy Agreement between Michael R. Cannon and Dell Inc. (incorporated by reference to Exhibit 99.2 of Dell’sCurrent Report on Form 8-K filed January 8, 2009, Commission file No. 0-17017)
10.33* — Separation Agreement and Release between Mark Jarvis and Dell Inc. (incorporated by reference to Exhibit 99.3 of Dell’sCurrent Report on Form 8-K filed January 8, 2009, Commission file No. 0-17017)
10.34* — Retention Bonus, Merger and Modification Agreement between Dell and Mr. Garriques (incorporated by reference toExhibit 99.1 of Dell’s Current Report on Form 8-K filed March 9, 2009, Commission file No. 0-17017)
12.1† — Computation of ratio of earnings to fixed charges
21† — Subsidiaries of Dell
23† — Consent of PricewaterhouseCoopers LLP
101
ExhibitNo. Description of Exhibit
31.1† — Certification of Michael S. Dell, Chairman and Chief Executive Officer, pursuant to Rule 13a-14(a) under the SecuritiesExchange Act of 1934, as adopted pursuant to Section 302 of the Sarbanes-Oxley Act of 2002
31.2† — Certification of Brian T. Gladden, Senior Vice President and Chief Financial Officer, pursuant to Rule 13a-14(a) under theSecurities Exchange Act of 1934, as adopted pursuant to Section 302 of the Sarbanes-Oxley Act of 2002
32.1†† — Certifications of Michael S. Dell, Chairman and Chief Executive Officer, and Brian T. Gladden, Senior Vice President andChief Financial Officer, pursuant to 18 U.S.C. Section 1350, as adopted pursuant to Section 906 of the Sarbanes-Oxley Act of2002
* Identifies Exhibit that consists of or includes a management contract or compensatory plan or arrangement.
† Filed herewith.
†† Furnished herewith.
102