dell inc. prepared by zhanna tulekova mgt 490. period endingjan 28, 2011jan 29, 2010jan 30, 2009...
TRANSCRIPT

DELL Inc.
Prepared by Zhanna TulekovaMGT 490

Period Ending Jan 28, 2011 Jan 29, 2010 Jan 30, 2009Total Revenue 61,494,000 52,902,000 61,101,000
Operating Profit 3,433,000 2,172,000 3,190,000Net Income 2,635,000 1,433,000 2,478,000
Dell Corporation is the direct selling computer company,
with 96,000 employees. Dell was originated in 1984 by Michael
Dell. Beginning with small capital Michael Dell, who is current
Chairman and CEO, made the company profitable after first two
years. The income report for the last three years is presented in
the table below
Organizational Background

Dell focuses on the design, improvement, produce,
advertising, sale, and support of a variety of computer
systems and services worldwide. The key market
segments are Governments and big businesses. The
company’s strategy is “Direct Business”- to understand
consumers’ needs and efficiently provide its products by
eliminating retailers.
Organizational Background

Dell Strategy- Direct Business Model
• Sell directly to customers
• Build products to customer order
• Reduce retail mark-ups and costs
• Reduce risk associated large inventories of finished goods
• Leverage relationship with suppliers and consumers
• Make better relationship with customers
• Use information to improve the Value Chain
Dell Strategy- Direct Business Model

PEST Analysis
Factor Opportunity/threat
Impact(1=Low; 5=High)
Ranking n terms of impact
Political
Foreign Trade Regulations
Government expenditure on IT for businesses
Chinese government’s ignorance on PC piracy
Opportunity
Opportunity
Threat
4
5
2
2
Economic
Economic recession
Emerging market growth
Currency fluctuations and exchange rates
Threat
Opportunity
Threat
4
5
2
3

FactorOpportunity/
threat
Impact(1=Low; 5=High)
Ranking n terms of impact
SocialDesire for constant connection
Opportunity 21
Technological
Constant Technological innovations
Globalization of Internet Technology
In some countries Internet access is costly
Opportunity
Opportunity
Threat
5
5
3
4
PEST Analysis (cont.)

Political Economic Social Technological0
0.51
1.52
2.53
3.54
4.5
2
3
1
4
PEST Analysis (cont.)
X- Ranks of PEST AnalysisY- Rank
X
Y
(4- most important, 3- important, 2- less important, 1- the least important)

Dell Inc.
Major Competitors

Year Total PC Sales($ US mln)
2005 3,809.7
2006 5,046.6
2007 6,341.5
2008 7,344.3
2009 6,796.1
2010 8,034.6
PC Industry Sales
2005 2006 2007 2008 2009 20100
2
4
6
8
10Y
X
X-YearY- Total Industry Sales
The whole computer industry demonstrates increase in sales
over a 4 years (2005 - 2008) and decline in 2009 which was a result
of the economic down turn. All sales figures are in Million Dollars.
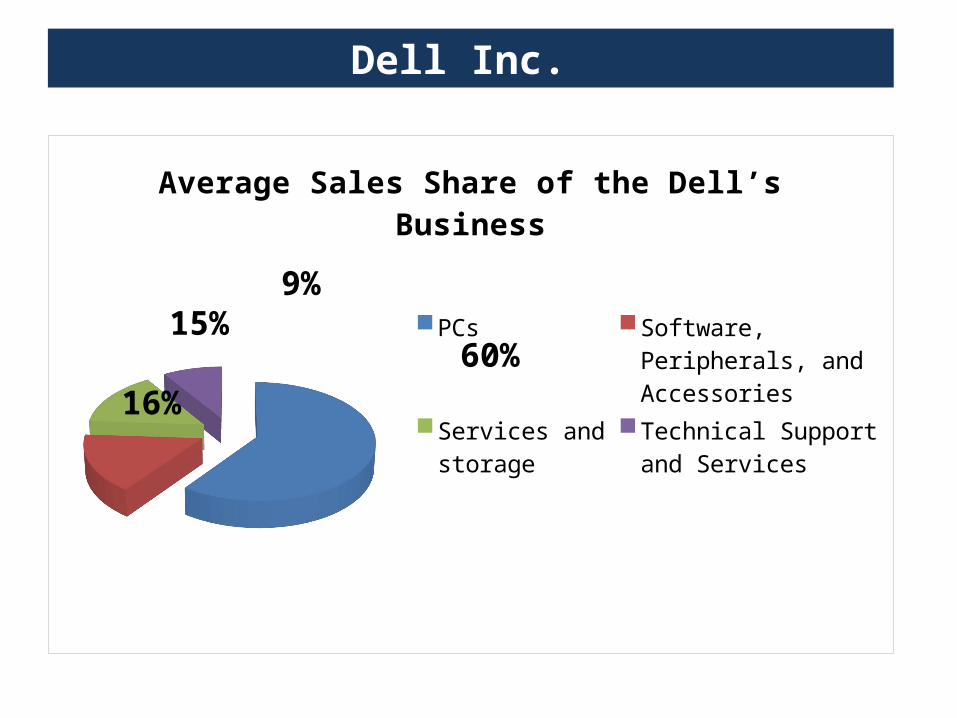
Average Sales Share of the Dell’s Business
PCsSoftware, Peripherals, and Accessories Services and storageTechnical Support and Services
60%16%
15%9%
Dell Inc.

Factor Evaluation
Intensity of Rivalry Strong (several major PC makers)
Buyer Power Strong (customers are attracted by low prices, but they may switch easily)
Supplier Power Moderate (high switching cost; many suppliers; Microsoft monopolization, strong power of processors’ suppliers)
Threat of Substitute Products Strong (Smartphone, tablets, and etc.)
Threat of New Entrants Moderate (easy to entry, but hard to compete)
Porter’s 5 forces

Porter’s 5 forces
New Entry Substitutes Buyers Suppliers Competitive Rivalry
2
3
4
3
4
(4- the highest threat, 3- high threat, 2- moderate threat, 1- the lowest threat)

• Large number of rivals• Relatively low difference in price between �
competitors �• Low differentiation• High exit barriers
• However, Dell differentiates from other competitors by its successful business strategy. Dell should keep with low prices.
Porter’s 5 forces
Intensity of Rivalry(Very High)

• Customer service is important factor
• Highly price sensitive (If the prices are raised high,
customers will buy from competitors)
• Dell should pay big attention to consumers and entry
emerging markets for obtaining new customers.
Porter’s 5 forces
Bargaining Power of Buyer(Very High)

• Large amount of suppliers for different parts: hardware, keyboards, and etc.
• High switching costs
Supplier power is high in PC’s industry, but Dell is a big corporation, and suppliers would like to work with Dell
Porter’s 5 forces
Bargaining Power of Suppliers(High)

• Wide usage of PCs throughout the society (one computer for every three people in the U.S.)
• It is difficult to find alternative to computers, especially for businesses and governments.
Porter’s 5 forces
Threat of Substitutes(Low)
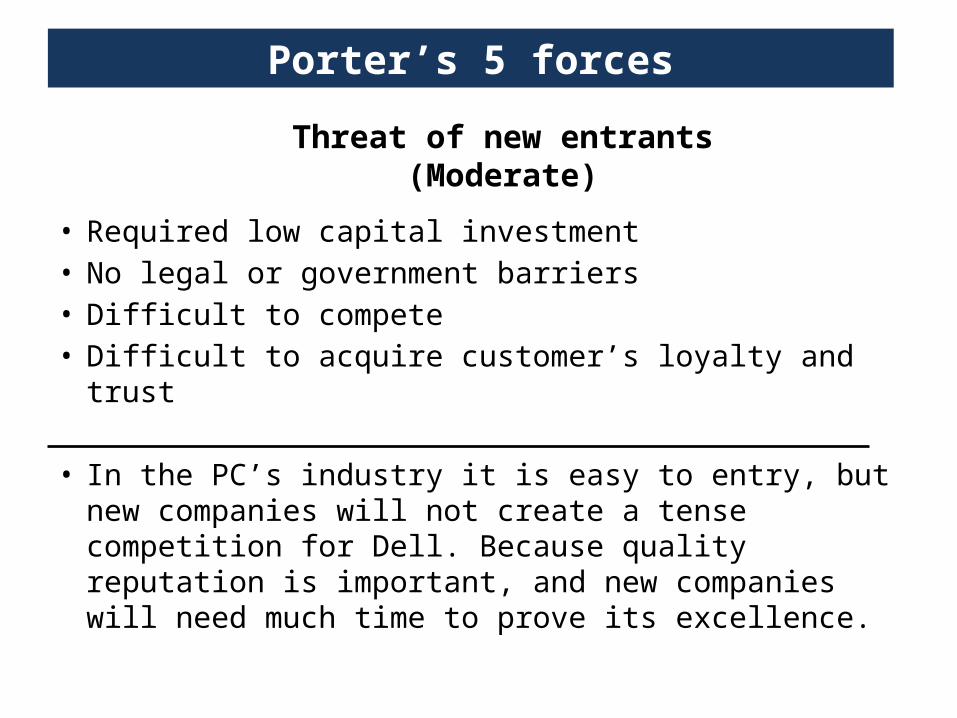
• Required low capital investment• No legal or government barriers• Difficult to compete• Difficult to acquire customer’s loyalty and trust
• In the PC’s industry it is easy to entry, but new companies will not create a tense competition for Dell. Because quality reputation is important, and new companies will need much time to prove its excellence.
Porter’s 5 forces
Threat of new entrants(Moderate)

In conclusion, the external environment is wholesome to the company because the Political, Economical, Social and Technological factors are opportune to the business. The company has come up unique strategy, which have helped to gain competitive advantage in the industry in which it operates.
Conclusion on overview Dell’s strategy and industry analysis

Competitors
Major Competitors
Recently, the computer industry progressed a lot. New products are
coming out all the time, the competition is brutal, and customers are changeable.
The major competitor of Dell Inc. are presented below.

Sales (in millions)
Net Income (in
millions)Generic Strategy Employees City of
Headquarters
Dell Inc. 61,494 2,635 Low cost/Differentiation 100,300 Round Rock,
TXHewlett Packard 126,033 8,761 Differentiation 324,600 Palo Alto, CA
IBM 99,870 14,833 Differentiation 436,085 Armonk, New York
Apple 65,225 14,013 Differentiation 46,600 Cupertino, CA
Cisco 40,040 7,767 Differentiation 70,700 San Jose, CA
Xerox 21,633 606 Differentiation 136,500 Norwalk, CT
Competitors

Competitors
Xerox
Apple
Hewlett Packard
IBM
Cisco
DELL
0 2 4 6 8 10 12 14
Sales 2010
Sales#2
#3
#4
#5
#6
#1

CompetitorsQuality based
rankingPrice based
rankingWeb
Influence*Total Score
(30 is maximum)
Dell Inc. 9 10 8 27
Hewlett Packard 9 8 9 26
IBM 9 8 9 26
Apple 9 7 10 26
Cisco 7 9 9 25
Xerox 7 9 8 24
Competitors
* Web influence describes a company's ability to build brand-name
recognition on the Web. Web influence data can be determined by the number of
hyperlinks to the company’s Web site from external domains.

Competitors
COST
QU
ALIT
Y
Low
High
Low High
DELL HP, IBM APPLE
CISCO
XEROX

Competitors
• Founded in 1939
•HP’s mission: “To invent technologies and services that drive business value, create social benefit and improve the lives of customers—with a focus on affecting the greatest number of people possible.”
• The founders developed a unique management style that came to be known as The HP Way.
1. We have trust and respect for individuals.2. We focus on a high level of achievement and contribution.3. We conduct our business with uncompromising integrity.4. We achieve our common objectives through teamwork.5. We encourage flexibility and innovation.
• HP is listed in Greenpeace’s Guide to Greener Electronics

Competitors
• Founded in 1911
•IBM mission “We translate advanced technologies into value for our customers through our professional solutions, services and consulting businesses worldwide.”
•International Business Machines is a technology and consulting firm. It manufactures and sells computer hardware and software, and it offers infrastructure, hosting and consulting services in areas ranging from mainframe computers to nanotechnology.
• IBM has nine research laboratories worldwide
• IBM’s goal is a reduction of the company's impact on the environment
• Tokyo Ohka Kogyo Co. and IBM are collaborating to establish new, low-cost methods for bringing the next generation of solar energy products to market.

Competitors
• Founded 1976
• Apple’s mission: “Apple will be a leader in providing simple, powerful, high-quality information products and services for people who learn, communicate, and create.”
• Apple is listed in Greenpeace’s Guide to Greener Electronics
•Stylish product innovation
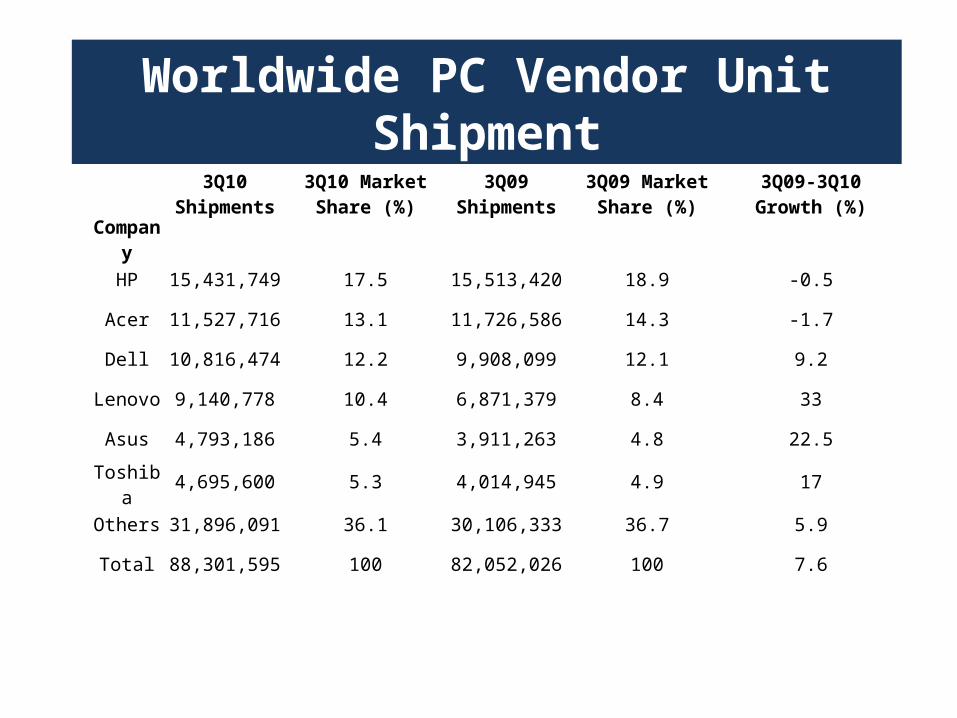
Worldwide PC Vendor Unit Shipment
3Q10 Shipments
3Q10 Market Share (%)
3Q09 Shipments
3Q09 Market Share (%)
3Q09-3Q10 Growth (%)
Company
HP 15,431,749 17.5 15,513,420 18.9 -0.5
Acer 11,527,716 13.1 11,726,586 14.3 -1.7
Dell 10,816,474 12.2 9,908,099 12.1 9.2
Lenovo 9,140,778 10.4 6,871,379 8.4 33
Asus 4,793,186 5.4 3,911,263 4.8 22.5
Toshiba 4,695,600 5.3 4,014,945 4.9 17
Others 31,896,091 36.1 30,106,333 36.7 5.9
Total 88,301,595 100 82,052,026 100 7.6

U.S. PC Vendor Unit Shipment
3Q10 Shipments
3Q10 Market Share (%)
3Q09 Shipments
3Q09 Market Share (%)
3Q09-3Q10 Growth (%)
Company
HP 4,459,473 25.3 4,372,231 25.4 2
Dell 4,188,688 23.8 4,447,478 25.8 -5.8
Acer 1,848,511 10.5 2,338,816 13.6 -21
Apple 1,831,664 10.4 1,611,000 9.3 13.7
Toshiba 1,629,100 9.3 1,427,000 8.3 14.2
Others 3,650,807 20.7 3,036,573 17.6 20.2
Total 17,608,242 100 17,233,099 100 2.2

3Q10 Shipments
3Q10 Market Share (%)
3Q09 Shipments
3Q09 Market Share (%)
3Q09-3Q10 Growth (%)
Company
Acer 6,147 22.5 6,161 24.2 -0.2
HP 5,206 19.1 4,949 19.5 5.2
Dell 2,449 9 2,201 8.7 11.3
Asus 2,370 8.7 1,875 7.4 26.4
Lenovo 1,613 5.9 1,000 3.9 61.3
Others 9,498 34.8 9,235 36.3 2.8
Total 27,284 100 25,420 100 7.3
EMEA PC Vendor Unit Shipment

In Asia/Pacific, PC shipments reached 29.7 million units in the third quarter of 2010, a 10.5 percent increase from the third quarter of 2009.
PC shipments in China in the third quarter of 2010 held steady at 62% of all PCs shipped in Asia/Pacific, growing 11.3% over the same quarter last year.
Latin American PC shipments totaled 8.2 million units in the third quarter of 2010, a 9.9% increase from the third quarter of 2009.
PC shipments in Japan surpassed 3.6 million units in the third quarter of 2010, a 14.1% increase from the same period last year.
PC Vendor Unit Shipment

PC Market Share Worldwide in Q3 2010
HPDELLAPPLEAcerToshibaOthers
24.3%
23.1%
10.6%
Market Analysis
10.3%
8.4%
23.3%

Market Analysis
01020304050607080
HP
Acer
Dell
Lenovo
Asus
Toshiba
HPAcerDellLenovoAsusToshiba
Company%
Growth in 2010
HP 10
Acer 40
Dell 18
Lenovo 43
Asus 72
Toshiba 24

1999 20050
500
1000
1500
2000
Dollars
Market Analysis(Average Selling Price)
PCs
1999 20050
5
10
15
20
$ Thousands
1999 20050
0.5
1
1.5
2
$ MillionsServers Mainframe Servers
Average Price
Decline-6.2% -3.6% -4.4%
Key Reasons causing prices to decline1) Increased price decline due to commoditization2) Industry’s tend to decrease manufacturing costs

2004 2005 2006 2007 2008
USA (million units)
Consumer 21.8 23.6 25.6 29.0 32.6
Commercial 36.5 40.3 41.9 46.0 49.4
Total 58.3 63.9 67.5 75.0 82.0
Worldwide (million units)
Consumer 64.9 78.4 88.4 100.0 111.2
Commercial 114.4 129.4 141.9 157.1 173.3Total 179.3 207.8 230.3 257.1 284.5
Distribution of revenue

• Technologies are improving every year, consequently making the industry fiercer.
• “Ten years from now there will be a small number of computers in home. As an alternative, people will be wearing computers implanted, for example, in eyeglasses, with the retina as the screen” according to IT Specialist, Raymond Kurzweil.
Market Analysis
An important question to ask is how profitable is the industry. And the answer is very profitable. The industry is always redefining itself as well as every other business on the world due to its deep routes within every industry. As for what company ranks the highest in profit at the moment is Apple, but the numbers are skewed due to other hardware Apple provides. The industry is extremely competitive and profitable.
Market Analysis

• In the US computers are found in most homes with access to the Internet. Population is taught to use computers in school at a young age. The target market for PC industry is the whole world (families, children, businesses, governments, and etc.)
• However, there are some countries where people do not hot to use computers. The PC industry has plans to expand into emerging markets.
Market Analysis

Dell uses social media to listen, learn and engage with the customers.
Dell Community- Support Forums-Owners Club- Dell Groups
Facebook- Dell Home/Consumer-Dell Large Enterprise- Dell Small & Medium size Business
Likedln
Twitter- Dell News- Dell Corporate Accounts- Dell Support Accounts
Social Media

• PC industry is very profitable with constant innovations. Almost all companies work globally, they compete with each other by choosing different strategies. The leader in sales for 2010 is HP.
Conclusion on competitor analysis

Earn customers' respect and loyalty by providing high quality, value, and low prices by direct business
To seize opportunities to growth by offering products in retail stores.
Comply with laws and rules Attain profit for finance growth, value for shareholders
investment and corporate objectives To demonstrate the commitment to employees by promoting
and rewarding based on performance and by creating a good work environment.
To lead in the marketplace by developing and delivering useful and innovative products and services
Dell’s Business Model

Year PC Shipments (in mln.) PC Market Share
2005 9.2 16.8%
2006 9.8 17.18%
2007 10.9 14.5%
2008 11.2 15.95%
2009 10.8 12.2%
2010 11.1 12.1%
Sales
2005 2006 2007 2008 2009 201002468
1012

2005 2006 2007 2008 2009 20100
10
20
30
40
50
60
70
Total Revenue (in billion dollars)
5651.9
61 61.1 61.5
Financial Information
42.2

Expanded relationships with retail partners around the world
Created Streak, a 5-inch device designed to provide on-the-go entertainment, social connection and navigation experience
Dell saw its sales in China jump 81% since 2010. Now China generates about $4 billion in annual sales, about 7-8% of Dell's total
In India sales jumped 52%, generating sales around$1 billion annually
Changes in distribution of sales by product/region

Human Resources 100,300 employees including multi cultural employees Superior engineering and IT skills In-depth industry knowledge Staff and distributors trainings
Physical Resources Properties in many countries R&D facilities Production machineries
Financial Resources Internal funds generation (shareholders) Company’s revenue
Intangible Resources Brand image Customer loyalty Patents & Copyrights
Resources

Current assets
Cash Inventories Receivables Office Supplies
Fixed Assets
Properties Land Production machineries
Intangible assets Patents & Copyrights
Assets

BCG MatrixDell in USA Dell in China
Dell in Japan Dell in EMEA

BCG Matrix

Activities Analysis
Inbound logistics
Dell has competitive advantage of lowest in the Industry cost structure. The company receives the exact material every two hours to fulfill actual customer orders. Reliant on sole suppliers for the purchase of materials with short life span. E.g. Intel for processors and Microsoft for different software products.
Operations
Finished products from components and sub assemblies are acquired from a wide range of vendors Dell has 6 production units to carry large quantities of different products to increase their leverage
Outbound logistics
Dell computers are offered in retail stores and can be ordered directly Rail, sea, and air from Asia to Europe, Rail network from China to South Asia. Ocean shipment to Japan, Australia and New Zealand. In the America, Dell relies primarily on air shipment To minimize the delay between purchase and delivery, Dell has a general policy of manufacturing its products close to its customers. Transportation with reduction in fuel consumption and carbon emissions.
Value Chain Analysis

Activities Analysis
Marketing and Sales Products are made available to customers through direct and channel sales Dell markets its products on the television, newspaper, radio, and social media.
Service
Extensive service and support Provides total care after sales service, maintenance and installation Provides service for calls, emails and chats with Dell IT specialists
Value Chain Analysis

Activities Analysis
Firm Infrastructure Infrastructure includes Information Management and Business Intelligence Solutions for archiving, recording management products, data protection and enterprise data and leasing, financing, financial asset management services, etc.
Human resource management
100,300 employees worldwide Large levels of responsibility Serve customers at the highest level
Technology development
Dell is converging the IT Fabric With 10-Gigabit Ethernet Dell invests money in R&D Dell created Streak, a 5-inch device designed to provide on-
the-go entertainment, social connection and navigation experience
Procurement Advanced technologies
Value Chain Support Activities

Dell’s Value Chain

Strengths
Brand name: ranked as the 2nd largest PC maker Strong market position in key segments, wide production portfolio Strong financial situation Human Resource Management Launched newer technology far more before the other companies No inventory build up (JIT approach) It offers performance PCs that are powerful and configured at competitive prices
(customer loyalty)
Weaknesses
The firm having such a large range of components from many vendors in different countries
It is dependant on large suppliers for being an assembler rather than a computer tech manufacturer
Quality issues regarding the suppliers Weak relations with other retailers Weak internal control
SWOT Analysis

Opportunities
Emerging markets, particularly BRIC (Brazil, Russian, India, and China) countries
e-Commerce expansion Cost reduction in latest technology New retail agreements Consumers expenditure
Threats
Strong competitors like Hewlett Packard, Acer, Intel, IBM Changes in the currency rates Political instability, government regulations and tariffs in
developing countries Slowdown in economic conditions in the world
SWOT Analysis
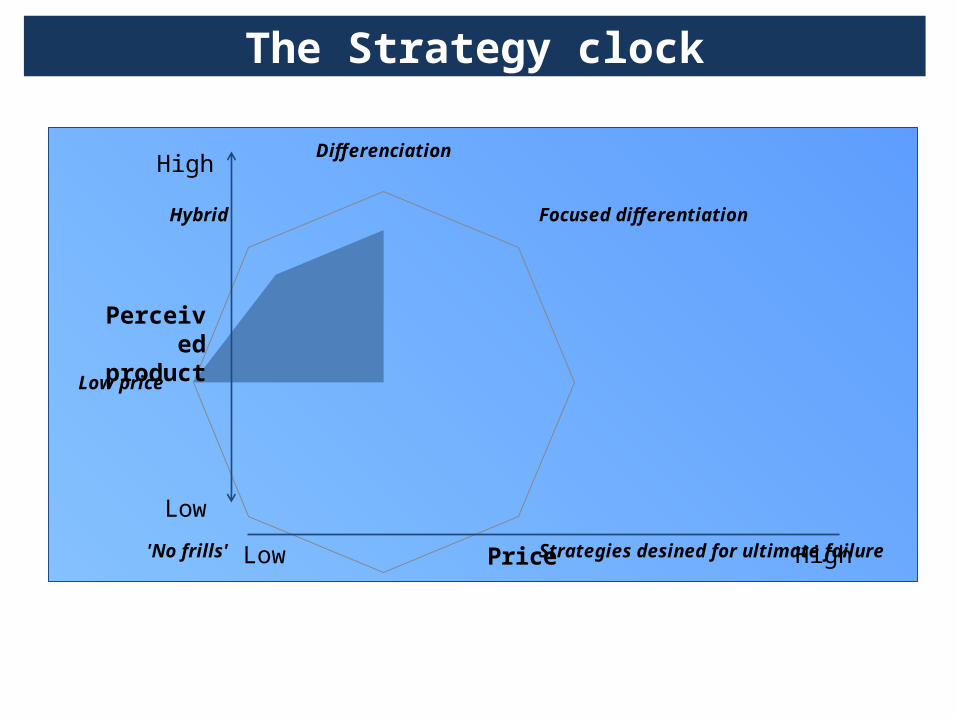
Differenciation
Focused differentiation
Strategies desined for ultimate failure 'No frills'
Low price
Hybrid
Low
Price
The Strategy clock
Perceived product
High
Low High

Generic Strategy
DELL
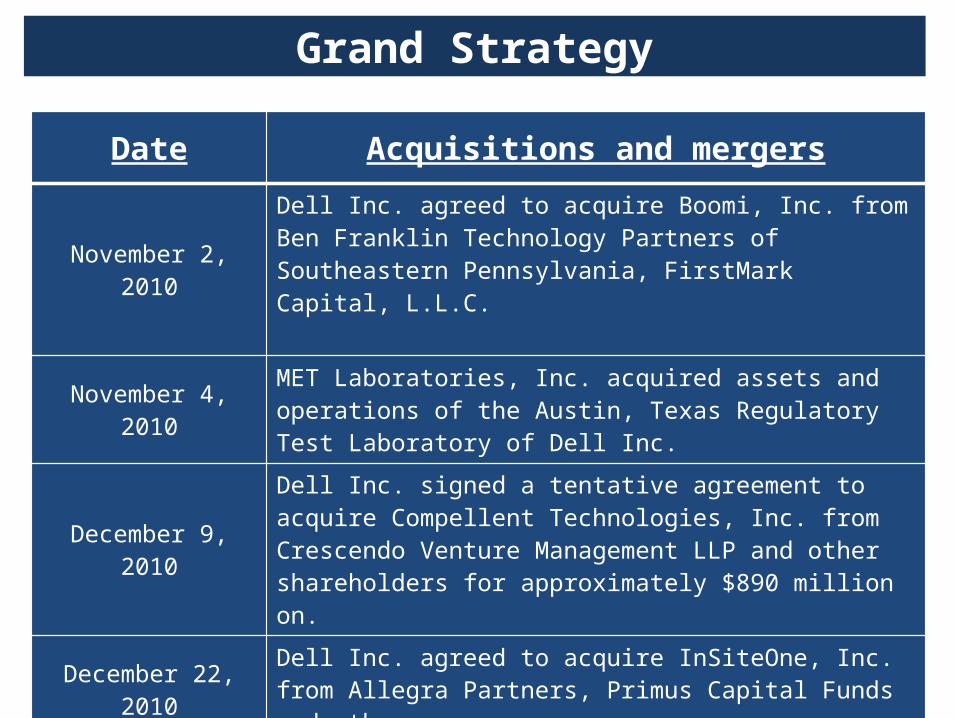
Grand Strategy
Date Acquisitions and mergers
November 2, 2010Dell Inc. agreed to acquire Boomi, Inc. from Ben Franklin Technology Partners of Southeastern Pennsylvania, FirstMark Capital, L.L.C.
November 4, 2010MET Laboratories, Inc. acquired assets and operations of the Austin, Texas Regulatory Test Laboratory of Dell Inc.
December 9, 2010Dell Inc. signed a tentative agreement to acquire Compellent Technologies, Inc. from Crescendo Venture Management LLP and other shareholders for approximately $890 million on.
December 22, 2010Dell Inc. agreed to acquire InSiteOne, Inc. from Allegra Partners, Primus Capital Funds and others
January 4, 2011Dell Inc. signed a definitive agreement to acquire SecureWorks Inc. from Frontier Capital LLC, Great Hill Partners, LLC, Noro-Moseley Partners and other investors. SecureWorks reported revenue of $120 million for 2010.

In 1987 Dell opened its first international subsidiary in the United Kingdom
In 1990 opened a manufacturing center in Limerick, Ireland to better serve customers in Europe, the Middle East, and Africa
In 1993 the first entries into the Asia Pacific region (subsidiaries in Australia and Japan)
The first Asia Pacific customer service is opened in Penang, Malaysia
In 1998 Dell opened manufacturing and support center in Xiamen, China
In 1999 Dell opened manufacturing operations in Brazil to better serve customers in Latin America
In 2003 Dell became the 3rd largest provider of computer systems and services in China
Dell's shipment growth was better than regional averages across most regions. However, the Europe/Middle East/Africa (EMEA) region remained weak
International Markets

• The company heavy relies on its employees, consumers and stockholders, bearing in mind that human resources is the central asset of the company, and customer and stakeholder expectations are very high. The organization has come up with various products and services, which have helped to give it a competitive edge in the industry in which it operates.
Conclusion

Dell’s business model is more oriented to satisfy customers’ needs
Dell saw its sales in China jump 81% since 2010 and In India sales jumped 52%
According to the generic strategy, Dell is cost leadership Dell aggressively expands into international market The main strength in SWOT analysis is JIT approach The main weakness in SWOT analysis is dependence on large
suppliers for being an assembler rather than a computer tech manufacturer
The strongest opportunity for Dell is emerging markets Threats in emerging markets are political instability, government
regulations and tariffs
Conclusion