delta air lines inc. company report · waterfall chart in figure 1 giving a precise breakdown of...
TRANSCRIPT

THIS REPORT WAS PREPARED BY MICHAEL LÜFFE, A MASTERS IN FINANCE STUDENT OF THE NOVA SCHOOL OF BUSINESS AND
ECONOMICS, EXCLUSIVELY FOR ACADEMIC PURPOSES. THIS REPORT WAS SUPERVISED BY ROSÁRIO ANDRÉ WHO REVIEWED THE
VALUATION METHODOLOGY AND THE FINANCIAL MODEL. (SEE DISCLOSURES AND DISCLAIMERS AT END OF DOCUMENT)
See more information at WWW.NOVASBE.PT Page 1/32
MASTERS IN FINANCE
EQUITY RESEARCH
A flight, investors should board
Capacity discipline continues to be key profit driver
For the past two years Delta Air Lines has been
generating benchmark returns that other US legacy carriers were
struggling to keep up with.
Going forward the airline will have to increasingly invest
in the replacement as well as expansion of its aircraft fleet which
is one of the oldest in the industry. Higher capital expenditures
will inevitably come at the expense of shareholder cash returns.
Even against the backdrop of rising crude oil and jet fuel
prices, operating margins are forecasted to remain in a range of
14% to 18% until 2025. This is subject to the condition that the
US airline industry remains disciplined about capacity growth and
that unit revenues in Delta’s international markets continue to
recover.
Valuation: We recommend buying Delta Air Lines given
our price target for year end 2017 of $61.74 per share, offering
investors an upside potential of 24.15% to the current share price
of $49.73.
Company description
Delta Air Lines, Inc., founded in 1924 and headquartered in Atlanta, Georgia, offers air transportation services to passengers and cargo throughout the United States and on international routes. Furthermore, the company runs an oil refinery which provides its north eastern US airline operations with jet fuel. As of today, the company and its global alliance partners offer air travel services to 323 destinations in 57 countries across all six continents.
DELTA AIR LINES, INC. COMPANY REPORT
INDUSTRIALS 6 JANUARY 2017
STUDENT: MICHAEL LÜFFE (#972) [email protected]
Recommendation: BUY
Price Target FY17: 61.74 $
Price (as of 6-Jan-17) 49.73 $
Reuters: DAL.N, Bloomberg: DAL:US
52-week range ($) 33.36-51.78
Market Cap ($m) 37,335.00
Outstanding Shares (m) 736.39
Source: Yahoo Finance
Source: Fidelity, 06.01.2017
(Values in $ millions) 2015 2016F 2017F
Revenues 40,704 40,861 41,329
EBITDA 9,637 10,738 9,094
EBITDA margin 23.68% 26.28% 22.00%
Net Profit 4,526 5,373 4,335
Net profit margin 11.12% 13.08% 10.49%
Basic EPS 5.68 7.26 6.01
ROIC 25.69% 19.34% 18.14%
Capex 2,945 2,809 3,598
Current ratio 0.52 0.60 0.59
Sales per share 51.07 55.49 57.27
Source: Company Data, Analyst’s Estimates

DELTA AIR LINES, INC. COMPANY REPORT
PAGE 2/32
Table of Contents
COMPANY OVERVIEW ........................................................................... 3
COMPANY DESCRIPTION ....................................................................................... 3 SHAREHOLDER STRUCTURE ................................................................................. 4
ANALYSIS OF REGIONS/MARKETS ...................................................... 6
NORTH AMERICA................................................................................................... 6 LATIN AMERICA ................................................................................................... 12 ATLANTIC ............................................................................................................ 13
THE AIRLINE INDUSTRY .......................................................................14
FIVE FORCES ....................................................................................................... 14 Competition ....................................................................................... 14 Industry entry and exit ..................................................................... 15 Substitute and complement products or services ........................ 16 Supplier power .................................................................................. 17 Buyer power ...................................................................................... 18
COMPETITIVE ANALYSIS ......................................................................19
SWOT ANALYSIS ................................................................................................ 19 Strengths ........................................................................................... 19 Weaknesses ...................................................................................... 20 Opportunities ..................................................................................... 21 Threats ............................................................................................... 21
RISKS TO THE INVESTMENT THESIS ..................................................22
EXTERNAL RISKS................................................................................................. 22 INTERNAL RISKS .................................................................................................. 23
FINANCIAL OUTLOOK ...........................................................................24
DIVIDEND POLICY ................................................................................................ 24
VALUATION ............................................................................................24
WACC APPROACH ............................................................................................. 24 MULTIPLES .......................................................................................................... 25
APPENDIX ..............................................................................................26

DELTA AIR LINES, INC. COMPANY REPORT
PAGE 3/32
Company overview
Company description
Founded in 1924 as an aerial crop dusting operation, Delta Air Lines, Inc. (NYSE:
DAL) is nowadays one of the largest US carriers and a globally operating airline,
that employs 84,000 people worldwide, manages a mainline fleet of more than 800
aircraft and offers air travel services to nearly 60 countries all over the world.1 Since
2012 the Atlanta-based company has split its operating activities into two distinct
segments, airline and refinery, whose relative importance as measured by
operating revenues has been very different, a fact that is highlighted by the
waterfall chart in Figure 1 giving a precise breakdown of consolidated revenue in
2015. Delta’s airline segment provides air transportation both for passengers and
cargo throughout the United States as well as to and from international
destinations. With a CAGR2 of 6.52% since 2009 and an 85% share of operating
revenue in 2015, passenger air travel has been an important value driver for Delta
Air Lines, while cargo’s CAGR of 0.52% reflects the massive decay that this
particular business division has been in for more than four years. Figure 2 further
visualizes the evolution of operating revenue. Delta’s extensive route network is
based on a system of domestic hubs, most important of which are Atlanta, Boston,
Detroit, Los Angeles, Minneapolis-St. Paul, New York JFK, New York LaGuardia,
Salt Lake City and Seattle, as well as international gateway airports, such as
Amsterdam, London-Heathrow, Paris-Charles de Gaulle and Tokyo-Narita. Delta’s
operations in these markets include flights, gathering and distributing traffic from
the geographic regions surrounding the hub or gateway to domestic or
international cities or other hubs and gateways. Figure 3 provides an overview of
the percentages of Delta’s total domestic flights and passengers that were
processed through each one of its nine US hubs in 2015. The fact that an
astonishing 60% of inland flights and passengers were apportioned to these hubs
indicates a strong dependency that has persisted for more than five straight years
and suggests a fundamental operational risk.
In addition to air transportation, the airline segment provides other ancillary airline
services, such as maintenance and repair services (MRO) for third parties. Delta’s
air travel services are sold through various distribution channels, including
1 http://news.delta.com/corporate-stats-and-facts 2 The mean annual growth rate over a time period longer than one year is referred to as compound annual growth rate. It is calculated by dividing the value at the end of a period by the value at the beginning, raising it to the power of one divided by the length of the period and subtracting one from the result.
Figure 1: Operating revenues by segment 2015 (in million USD)
Source: Company Data
Figure 2: Operating revenues 2009-2015 (in million USD)
Source: US Bureau of Transportation
Figure 3: Delta’s US hubs’ share of 2015 domestic passengers and flights apportioned to hubs
Source: Company Data

DELTA AIR LINES, INC. COMPANY REPORT
PAGE 4/32
telephone reservations, online travel agencies and digital channels, such as mobile
and delta.com.
Delta’s refinery segment produces gasoline, diesel and jet fuel. Its wholly owned
Monroe Energy subsidiary runs the Trainer refinery located near Philadelphia,
Pennsylvania. The refinery facilities include pipelines and terminal assets allowing
the supply of jet fuel from its own production as well as from third party suppliers
Phillips 66 or BP to the airline segment.3
As of October/November 2016 the flight network of Delta Air Lines encompasses
a total of 2,052 routes. These can be split into 64% domestic routes, connecting
cities in the contiguous and non-contiguous United States or their insular
territories, and 36% international routes. Figure 4 shows that the majority of
international routes cover the trans-Atlantic region, followed by the Latin American
and the Asian/Pacific region. Figure 5 indicates Delta’s strong positioning in its
core market United States, where its trailing twelve months’ market share
amounted to 16.8% as of end of September 2016. Only American Airlines and
Southwest Airlines were able to claim a bigger share of the domestic market.
In 2015 Delta boarded almost 180 million passengers. The airline is a founding
member of the SkyTeam global airline alliance and participates in the industry
leading transatlantic joint venture with Air France-KLM and Alitalia. Counting its
worldwide alliance partners, Delta offers customers more than 15,000 flights per
day. By total revenue and capacity, Delta Air Lines is the second largest US carrier
after American Airlines.
Like the other US network carriers American Airlines and United Airlines, Delta
incurred significant operating losses in the early 2000s. These were not only the
result of a strongly receding travel demand in the aftermath of the 9/11 attacks,
both at home and abroad, but were to a great extent also caused by the effects of
an over-competitive airline industry. In 2005, the new Delta Air Lines emerged from
Chapter 11 bankruptcy proceedings and in the same year merged with Northwest
Airlines.
Shareholder structure
Figure 6 states that the shareholder structure of Delta Air Lines is largely
dominated by institutional owners, which held approximately 83% of the company’s
outstanding shares by the end of the third quarter 2016.4 Such a high ownership
stake of institutional investors may impact the company’s stock price in many
3 http://www.reuters.com/finance/stocks/companyProfile?symbol=DAL.N 4 https://eresearch.fidelity.com/eresearch/evaluate/fundamentals/ownership.jhtml?stockspage=ownership&symbols=DAL
Source: US Bureau of Transportation
Figure 5: Trailing twelve months’ (TTM) domestic market share of US airlines
Figure 4: Division of Delta’s route network into four geographic regions
Source: Company Data
Source: Fidelity, 13.11.2016
Figure 6: Shareholder structure in % of total shares outstanding as of Q3 2016

DELTA AIR LINES, INC. COMPANY REPORT
PAGE 5/32
different ways, good and bad. In general, a high percentage of institutional
ownership signifies a strong shareholder base as investors are usually in for the
long haul and, unless they are momentum investors, endure periods of downturn.5
There has been only a slight change of institutional ownership percentage in 2016.
Financial institutions sold more shares than they purchased, leading to a drop in
ownership of 1.94%. Given the distinct research capacities that investment banks
or fund managers have at their disposal, they are considered to be well informed
and to make reasonable investment decisions. In terms of marketing, Delta
achieves a multiplier effect by getting large institutions to go long its stock. JP
Morgan, for example, advertises its holdings in Delta’s stock in order to create
interest in them and boost the stock price. With regards to their corporate
governance function, institutional investors can positively influence the company
by monitoring management decisions and applying pressure if need be.6
Nonetheless, an institutional investor majority can equally be a burden to the
company and hamper its performance. In view of institutions’ thorough research
on security and industry fundamentals, any position they take is evaluated by the
market as a justified response to a change in the stock’s projected value. However,
institutional buy or sell transactions are often merely motivated by arbitrage or
short-term market inefficiencies and not necessarily supported by underlying
fundamentals.7 This market behavior can easily trigger a sell-off and destroy value,
especially in light of the enormous amount of shares that have to be absorbed by
the market in case several institutional investors act at the same time. The
compensation of fund managers is usually based to a large degree on the profits
they generate and their performance is evaluated against a group of benchmark
indices. This system promotes short-term investing, such as the sale of temporarily
underperforming stocks, which drives up their volatility.8 In the case of Delta this
could have contributed to a higher systematic risk parameter, given through a
levered beta of 1.26, which is slightly above our calculated US airline industry
average of 1.25.
Recent research on the airline industry suggested that common institutional
ownership among major U.S. airlines has a tremendous impact on airfares, which
led the Department of Justice to investigate. Due to the fact that companies such
as Delta, American, United or Southwest are all controlled by a small number of
institutional investors, the price competition is likely to be less intensive. Even
5 https://www.thestreet.com/story/1039002/1/what-short-interest-and-institutional-ownership-tell-you.html 6 http://www.slate.com/articles/news_and_politics/view_from_chicago/2015/04/mutual_funds_make_air_travel_more_expensive_institutional_investors_reduce.html 7 http://www.money-zine.com/investing/investing/understanding-stock-ownership/ 8 http://www.investopedia.com/articles/stocks/07/insitutional-owners.asp

DELTA AIR LINES, INC. COMPANY REPORT
PAGE 6/32
though investors do not actively dictate prices or interfere with an airline’s operating
business, airfares were shown to be three to five percent higher because of cross-
shareholding.9 If for instance Delta and United are the sole competitors on selected
routes, both the fund investing in Delta as well as United and the managers working
at the two carriers benefit from higher prices and higher profits.10 As of September
30, 2016, five of the top ten institutional investors in Delta, American and United
were the same.
Analysis of regions/markets
Delta Air Lines offers air travel services to four different geographical regions,
which are North America, Latin America, Atlantic and Pacific. Each of these regions
has unique economic potential for airlines to grow and a different competitive
situation, which are two crucial factors that impact Delta’s valuation going forward
as they are reflected in the amount of revenue generated. Figure 7 shows the
development of Delta’s passenger revenue by geographical regions from 2009 to
2015. Figure 8 specifies the percentage breakdown of these regions in 2015.
North America
In spite of Delta’s global presence, the North American region is still its most
important market. Key figures even indicate that it will continue to be for the
foreseeable future. Since 2009 the share of passenger revenue generated in this
market has increased from approximately 45% to over 50%. Also it is the North
American region that Delta traditionally achieves its best load factors in. In terms
of Delta’s flight network, roughly two-thirds are domestic routes as of
October/November 2016. And on top of this the domestic market accounted for
61% of Delta’s air travel capacity.
As of year-end 2015 North America was the second largest region based on
capacity with a 25.3% share of the world total, second only to Asia/Oceania with
and slightly ahead of Europe, as Figure 9 proves. However, North America’s
growth in capacity, measured in available seat miles (ASM)11, or other metrics,
9 http://www.nytimes.com/2016/04/13/business/dealbook/rise-of-institutional-investors-raisesquestions-of-collusion.html?_r=0 10 http://www.slate.com/articles/news_and_politics/view_from_chicago/2015/04/mutual_funds_make_air_travel_more_expensive_institutional_investors_reduce.html 11 ASM quantify the amount of capacity offered by an airline. It is the number of seats available for transporting revenue-paying passengers multiplied by the total number of miles flown over the course of a reporting period.
Figure 7: Passenger revenue 2009-2015 by regions (in million USD)
Source: Company Data
Figure 8: Percentage breakdown of passenger revenue 2015 by regions
Source: Company Data
Source: Oliver Wyman
Figure 9: World capacity October 2014-October 2015 by regions

DELTA AIR LINES, INC. COMPANY REPORT
PAGE 7/32
such as departures, average seats per departure or average stage-length, lag
considerably behind those of other world regions. ASM between October 2014 and
October 2015 were only up 4.6% compared to a year earlier. Growth in ASM was
primarily driven by a 3.5% increase in the seat average per departure and a 2.5%
increase of the average stage-length, while the number of scheduled departures
between October 2014 and October 2015 actually declined by 1.1%, as is shown
in Figure 10. Between October 2011 and October 2015, the decline in departures
even amounted to 5%, while seats per departure were up 4.7% and ASM 14%.
This development is in line with a general capacity trend for the North American
region in which smaller gauge regional jets, usually equipped with less than 70
seats, are continuously being replaced by larger and more fuel efficient aircraft
flying longer distances. This development is supported by the fact that as of
October 2015 North American airlines had placed orders for almost 2,000 aircraft
to be delivered until 2020 with half of the deliveries being for large narrow-body
aircraft with more than 160 seats. A look at the ratio between long haul and short
haul flights underlines this development. Of a 58 country sample, the United States
had the fourth largest share of long haul passengers in 2015, with almost 70% of
all domestic passengers travelling on flights that lasted at least three hours. Figure
11 compares the five previously mentioned world regions by their average share
of long haul as well as short haul passengers in 2015. For the whole sample, the
arithmetic average share of long haul passengers amounted to 29%.
Another significant air travel trend regarding the North American region is that
capacity from North America to other regions outgrew capacity within the region
by far, suggesting that US airlines have been expanding massively to Latin
America and the Caribbean. All in all, capacity growth metrics for North America
suggest that the region is the most mature of the five major world regions. There
seems to be overcapacity in the market because passenger load factors have been
declining since 2013. US airlines are reacting to this by trimming their capacity
expansion. Capacity growth within North America was below GDP growth for the
year 2015. Due to only moderately rising jet fuel prices, particularly value carriers
are forecasted to add capacity inside the region but even more so outside due to
their incorporating international flights in the otherwise domestically dominated
route networks.
Capacity and traffic numbers considered separately from each other do not
indicate a lot about the strategic direction Delta has chosen or its profitability in
certain markets. The metric passenger load factor, however, focuses on the ratio
between both numbers, thus allowing to properly evaluate ups and downs in the
utilization of Delta’s capacity. Appendix 1 shows that in terms of load factor, both
Source: Oliver Wyman
Figure 10: North America capacity changes October 2014/2015
Figure 11: Average share of long haul vs short haul passengers in 2015 by regions
Source: Passport

DELTA AIR LINES, INC. COMPANY REPORT
PAGE 8/32
domestic mainline and regional have improved from 2014 to 2015, lifting the
domestic region as a whole from 85.18% to 85.98%, a trend that has been
reversed in 2016. This is because US airlines have aggressively grown their supply
due to lower fuel costs and other facilitating circumstances.
Appendix 1 furthermore highlights that since 2014 the share of domestic mainline
capacity in relation to Delta’s total system capacity has risen by almost three
percentage points to 50.6%. Domestic regional capacity was further reduced, both
in absolute and relative terms, as it dropped to just over 10% of total system
capacity from above 11% back in 2014. This is the result of Delta’s efforts to be
less dependent on regional carriers, conducting flights under Delta Connection.
Table 1 shows that as of October/November 2016 the airline is still very much
reliant on regional carriers, as SkyWest, Endeavor Air or ExpressJet Airlines each
service about a fifth of Delta’s route network. It is also a natural outcome of capacity
relocation measures that airlines conduct on a monthly basis in order to have their
airplanes serve the most profitable or heavily-frequented routes. Delta’s significant
exposure to the US air travel market becomes first and foremost apparent given
that domestic mainline and regional capacity combine for a total of approximately
60% of Delta’s entire capacity.
As one of three major US legacy carriers that went into bankruptcy after 9/11 and
emerged out of it, Delta has maintained a substantial market share on domestic
flights for years. The merger with Northwest Airlines back in 2010 created what
was then the largest commercial airline in the world and solidified Delta’s
competitive position inside the United States as it pushed domestic market share
measured in revenue passenger miles (RPM)12 up by over six percentage points
to 16.6%. Since then Delta’s market share has remained relatively steady.
Measured by the share of all domestic flights in the United States Delta’s market
share in 2015 was 10.85%, a year-on-year increase of about 1% and more than a
doubling of the share registered in 2009. Due to their deteriorating financials and
competitive positioning inside the United States, further domestic carriers were
forced to consolidate, which led to the merger of United Airlines and Continental
Airlines in 2012 and the merger of American Airlines and US Airways in 2015,
raising the market shares of the two newly created companies to just over 16%.
Another major competitor for Delta is Southwest Airlines, one of the top low-cost
carriers in the country, which increased its market share by almost 5% within six
years to become the market leader as measured by RPM. Other important players
in the market are JetBlue Airways, SkyWest Airlines and Alaska Airlines, the latter
12 RPM are the number of revenue-paying passengers per reporting period multiplied by the number of miles they have been transported during the period. A synonym for RPM is traffic.
Operator No. of routes Pct. of total
Delta Air Lines 1,336 65.11%
Westjet 37 1.80%
Westjet Encore 4 0.19%
KLM 31 1.51%
Transavia 0 0.00%
Alitalia 14 0.68%
Air France 34 1.66%
Virgin Atlantic Airways 32 1.56%
Air Europa Lineas Aereas 4 0.19%
Aeromexico 40 1.95%
Aerolineas Argentinas 4 0.19%
Korean Air Lines 12 0.58%
Virgin Australia International 4 0.19%
China Southern Airlines 8 0.39%
China Eastern Airlines 11 0.54%
China Airlines 4 0.19%
Delta Connection
SkyWest 463 22.56%
Endeavor Air 451 21.98%
Expressjet 441 21.49%
Shuttle America 93 4.53%
Compass Airline 146 7.12%
Gojet Airlines 179 8.72%
Aeromexico Connect
Aerolitoral 21 1.02%
Selected Operators
Only Delta Air Lines 889 43.32%
Only Third Party Carriers 716 34.89%
Total Third Party Carriers 1,163 56.68%
Only Delta Connection 522 25.44%
Only Air France-KLM-Alitalia 46 2.24%
Only Equity Investments 65 3.17%
Table 1: In and outsourcing of Delta’s October/November route network
Source: Company Data

DELTA AIR LINES, INC. COMPANY REPORT
PAGE 9/32
of which endeavors to become the fifth largest US airline by the time its merger
with Virgin America has been completed. Not only since 2009 has consolidation
been a major trend for the airline industry. This may be demonstrated by the fact
that on routes within the United States the major 13 domestic carriers combined
for a total market share of 88.41% in 2015 after a mere 64.81% in 2009. Another
metric proving the significant market concentration in the United States is the
Herfindahl-Hirschman-Index (HHI). Considering the 13 biggest carriers’ market
shares on domestic flights, the HHI rose from 641.22 in 2009 to 1,165.05 in 2015.
Above an HHI of 1,000 a marketplace can no longer be characterized as entirely
competitive but moderately concentrated. Less competition has had a lasting
positive impact on US airlines’ capacity utilization and bottom lines.
Further analysis shows that Delta Air Lines operated 75.73% of its 2015 total of
875,000 domestic flights out of 29 major US airports. This share has gradually
decreased since 2009 when it amounted to 79.35%, which suggests that Delta has
been diverting to smaller, less-congested airports in an effort to save on fees for
airport slots and reduce overall costs. Almost 55% of the 875,000 flights were
executed through Delta’s seven major hubs Atlanta, Minneapolis-St. Paul, Detroit,
Salt Lake City, Los Angeles as well as both major New York airports JFK and
LaGuardia. Hartsfield-Jackson alone services around 28% of all domestic flights,
which bears enormous risk in light of the recent power outage at the airport in
August 2016 causing multiple delays and cancellations throughout Delta’s entire
network. Compared to United Airlines and American Airlines, Delta had less
exposure to the 29 major US airports in 2015 and therefore less operational risk
as United operated 85.9% and American 82.82% of its entire domestic flights
through those airports. However, Southwest Airlines only made 53.38% of its
domestic departures from one of the airports in question which is not surprising
given the low-cost business model and the point-to-point transit model Southwest
Airlines is practicing.
As highlighted by the map in Figure 13 below, which shows Delta’s 2015 market
shares on domestic flights at the 29 biggest airports, the airline has substantiated
a strong market position in the southeastern and mid-western United States. Its
top domestic routes, as measured by number of enplaned passengers between
October 2015 and September 2016, are listed in Figure 12. The merger with
Northwest Airlines back in 2010 has helped Delta to almost double the market
share on domestic flights in its southeastern hub Atlanta. Its local market share
rose from 34% in 2009 to 62% in 2015. In the same time span Delta achieved even
steeper market share gains of 30% or more on domestic flights in Salt Lake City
as well as on domestic and international flights in Detroit and Minneapolis-St. Paul.
Source: US Bureau of Transportation
Figure 12: Top domestic origin-destination city pairs based on enplaned passengers October 2015-September 2016 (in millions)

DELTA AIR LINES, INC. COMPANY REPORT
PAGE 10/32
More moderate increases between 5% and 10% were recorded on domestic flights
in Los Angeles, New York JFK, New York LaGuardia, Seattle/Tacoma and Tampa
and on international flights in Boston, Los Angeles and Portland.
Figure 13: Delta’s market share on domestic flights at 29 major US airports. (Source: US Bureau of
Transportation)
Considering domestic as well as international flights, Delta had a total market share
above 15% at five out of the 29 major US airports. These were Atlanta (57.95%),
Minneapolis-St. Paul (33.11%), Detroit (30.57%), Salt Lake City (30.5%) and New
York-JFK (18.77%). Furthermore, Delta was among the top five airlines in terms of
market share at 23 out of the 29 major airports. Only at airports in San Diego
(6.93%), San Francisco (5.14%), Newark (3.16%), Denver (2.8%), Chicago O’Hare
(1.77%) and Houston (1.31%), Delta had insignificantly small operations.
Since 2014 the price environment in the United States has been presenting
domestic airlines with a big challenge. Average round-trip airfares in the United
States have dropped tremendously from 2015 to 2016, as pointed out in Figure 14.
While an average itinerary fare, which corresponds to the ticket price charged by
the airline plus any additional taxes and fees surcharged by outside entities, cost
$392 in 2014, travelers had to pay only $377 in 2015 and $361 in 2016. Intense
price wars throughout the US airline industry have contributed to an overall decline
in revenues per available seat mile (RASM)13, yields and carriers’ load factors. In
2015 Delta Air Lines faced a slight drop in mainline unit revenues of 0.64% after
recording strong growth numbers in this segment between 2009 and 2014.
However, considering that from 2014 to 2015 unit revenues were down 3.01% for
all of its mainline operations and 3.35% for its entire system, the decline in
13 RASM is the revenue generated on each available seat mile. It is also known as unit revenue.
Figure 14: Annual US domestic average itinerary fare in constant 2016 USD
Source: US Bureau of Transportation
Alaska Airlines
American Airlines
Delta Air Lines
Haw aiian Airlines
United Air Lines
Allegiant Air
Envoy Air
ExpressJet Airlines
Frontier Airlines
JetBlue Airw ays
SkyWest Airlines
Southw est Airlines
Spirit Airlines
Virgin America
Netw
ork
Carr
iers
Valu
e C
arr
iers
Source: Analyst’s Composition
Figure 15: Classification of US airlines into network and value carriers

DELTA AIR LINES, INC. COMPANY REPORT
PAGE 11/32
domestic unit revenue does not seem that significant. Unit revenues were down
mainly due to weaker yields. Our analysis includes average domestic itinerary
fares that were paid at around 384 airports throughout the United States between
the third quarter of 2013 and the second quarter of 2016. These data show that
the aforementioned major 29 US airports were particularly affected by the
changing yield environment as ticket prices dropped by 4.43% during the period of
observation while the remaining 355 airports actually experienced an increase of
2.86%. In view of Delta’s strong reliance on the 29 airports it is understandable
that the company’s domestic unit revenues have been under enormous pressure.
Chicago O’Hare, Miami, Dallas, Fort Lauderdale and Houston recorded price drops
of 7% or more, whereas airports such as Baltimore, Boston, New York-JFK, San
Francisco or San Diego incurred only minor drops of up to 2% and were able to
compensate to some degree.
In the United States, Delta faces competition from two groups of carriers. The first
group consists of network carriers such as Hawaiian Airlines, Alaska Airlines,
American Airlines or United Airlines. The latter two, also referred to as legacy
carriers, show the highest resemblance with Delta Air Lines’ revenue and cost
structure or size of operations. On top of that they operate their individual route
networks via the same hub-and-spoke approach as Delta, allowing them to
efficiently serve an extensive network of airports across the country. The second
group comprises value or low-cost carriers (LCCs) such as JetBlue Airways,
Southwest Airlines or SkyWest Airlines or even ultra-low-cost carriers (ULCCs)
such as Spirit Airlines or Allegiant Air. Unlike their hub-and-spoke competitors, the
second group of carriers has chosen a point-to-point transit model through which
they serve a selective network of airports, usually limited to the most profitable
routes. By flying to secondary, less congested airports, by reducing parking time
on the ground, by employing just a few different aircraft types to lower training and
maintenance expenses and through other measures, LCCs and ULCCs are able
to substantially reduce operating expenses and undercut ticket prices of network
carriers. Figure 15 lists the group of network and value carriers that were subject
to our competitive analysis.
Our analysis of unit revenue, cost and profitability metrics reveals a significant
difference between Delta Air Lines and other US network and value carriers. In the
third quarter of 2016 our sample of network carriers averaged costs per available
seat mile (CASM)14 of 11.56 cents (2015 Q3: 11.72 cents). The average CASM for
our sample of value carriers was 9.59 cents (2015 Q3: 9.8 cents). In spite of
14 CASM is the amount of operating expenses that an airline incurred per available seat mile during a certain reporting period.
Figure 16: US airlines’ CASM 2015 Q3 vs 2016 Q3
Source: Company Data
Source: Company Data
Figure 17: US airlines’ unit fuel costs 2015 Q3 vs 2016 Q3
Source: Company Data
Figure 18: US airlines’ unit labor costs 2015 Q3 vs 2016 Q3
DELTA AIR LINES, INC. COMPANY REPORT
PAGE 12/32
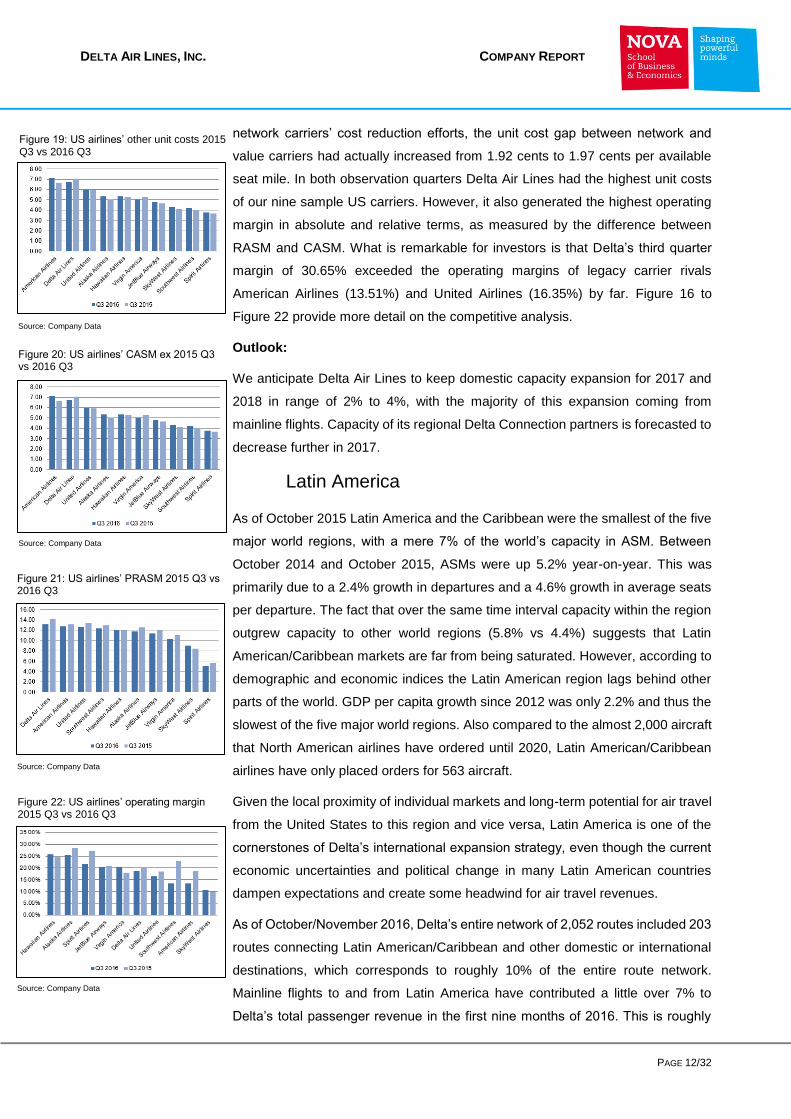
network carriers’ cost reduction efforts, the unit cost gap between network and
value carriers had actually increased from 1.92 cents to 1.97 cents per available
seat mile. In both observation quarters Delta Air Lines had the highest unit costs
of our nine sample US carriers. However, it also generated the highest operating
margin in absolute and relative terms, as measured by the difference between
RASM and CASM. What is remarkable for investors is that Delta’s third quarter
margin of 30.65% exceeded the operating margins of legacy carrier rivals
American Airlines (13.51%) and United Airlines (16.35%) by far. Figure 16 to
Figure 22 provide more detail on the competitive analysis.
Outlook:
We anticipate Delta Air Lines to keep domestic capacity expansion for 2017 and
2018 in range of 2% to 4%, with the majority of this expansion coming from
mainline flights. Capacity of its regional Delta Connection partners is forecasted to
decrease further in 2017.
Latin America
As of October 2015 Latin America and the Caribbean were the smallest of the five
major world regions, with a mere 7% of the world’s capacity in ASM. Between
October 2014 and October 2015, ASMs were up 5.2% year-on-year. This was
primarily due to a 2.4% growth in departures and a 4.6% growth in average seats
per departure. The fact that over the same time interval capacity within the region
outgrew capacity to other world regions (5.8% vs 4.4%) suggests that Latin
American/Caribbean markets are far from being saturated. However, according to
demographic and economic indices the Latin American region lags behind other
parts of the world. GDP per capita growth since 2012 was only 2.2% and thus the
slowest of the five major world regions. Also compared to the almost 2,000 aircraft
that North American airlines have ordered until 2020, Latin American/Caribbean
airlines have only placed orders for 563 aircraft.
Given the local proximity of individual markets and long-term potential for air travel
from the United States to this region and vice versa, Latin America is one of the
cornerstones of Delta’s international expansion strategy, even though the current
economic uncertainties and political change in many Latin American countries
dampen expectations and create some headwind for air travel revenues.
As of October/November 2016, Delta’s entire network of 2,052 routes included 203
routes connecting Latin American/Caribbean and other domestic or international
destinations, which corresponds to roughly 10% of the entire route network.
Mainline flights to and from Latin America have contributed a little over 7% to
Delta’s total passenger revenue in the first nine months of 2016. This is roughly
Source: Company Data
Figure 19: US airlines’ other unit costs 2015 Q3 vs 2016 Q3
Figure 20: US airlines’ CASM ex 2015 Q3 vs 2016 Q3
Source: Company Data
Figure 21: US airlines’ PRASM 2015 Q3 vs 2016 Q3
Source: Company Data
Figure 22: US airlines’ operating margin 2015 Q3 vs 2016 Q3
Source: Company Data

DELTA AIR LINES, INC. COMPANY REPORT
PAGE 13/32
2% more than what had been contributed by the Latin American mainline segment
back in 2009, but slightly less than in 2015.
Since 2013 Delta Air Lines has slightly raised its capacity on mainline routes to
and from Latin American destinations from 7.75% to 9.09% of total system capacity
as recorded after the first three quarters of 2016. Regional capacity to and from
the Latin American region more than doubled since 2013, although by the end of
the third quarter of 2016 it merely represented 0.28% of total system capacity.
Mainline and regional capacity combined the Latin American region has gained
almost 2 percentage points in Delta’s total network capacity since 2013. Capacity
utilization in the mainline and regional segment has improved during the first three
quarters of 2016.
Joint ventures and equity stakes have lined up some promising growth potential
for Delta Air Lines in the Latin American region. Its equity stakes in Aeroméxico
and Gol Linhas Aéreas provide Delta with long-term income and a foothold both in
Mexico and Brazil, which the Atlanta-based carrier regards as particularly
important. Pending antitrust immunity, which was expected to be granted by the
US Department of Transportation by the end of 2016, the airline will invest another
$815 million in Aeroméxico and increase its stake to 49%. This will make Delta the
dominant foreign carrier in Mexico and bring a sizable revenue boost. Open skies
agreements between the United States and Mexico have been ratified in late
August 2016 and Delta’s US Mexico scale is expected to triple through the joint
venture. Moreover, Delta is looking into increasing its current stake of 9% in Gol
Linhas Aéreas or buying the financially struggling airline altogether, provided the
Brazilian government raises its foreign ownership limits on airlines. Despite Brazil’s
recent political and economic woes, the country is still regarded as one of Latin
America’s most vibrant regions, with the Summer Olympics in 2016 having initiated
another surge in travel demand. After 16 consecutive quarters with negative year-
on-year growth, Brazil’s unit revenues increased 30% during the third quarter of
2016. The strengthening Real has raised point-of-sale demand in Brazil.
Outlook:
Capacity in Latin America is expected to remain flat in 2017 and 2018 as Delta
aims at optimizing its unit revenues before adding further capacity to the region.
Atlantic
Between October 2014 and October 2015 European originating flights represented
23.1% of the world’s total capacity. ASMs had grown by 4.8% year-on-year, driven
by a 2.7% rise in departures and a 1.8% growth in average seats per departure
over the previous year.

DELTA AIR LINES, INC. COMPANY REPORT
PAGE 14/32
Air travel service across the Atlantic is regulated through Open Skies agreements
between the United States, Canada and the European Union, which allows airlines
to enter and exit almost every transatlantic market. On the part of the United
States, the only airlines offering transatlantic flights are the three legacy carriers
Delta Air Lines, American Airlines and United Airlines, each of which has its own
revenue sharing joint venture or strategic alliance with a European airline which
helps to efficiently operate this long-haul region. Delta collaborates with its
Skyteam partners Air France/KLM, American Airlines cooperates with its Oneworld
partner British Airways/Iberia and United Airlines has partnered up with its Star
Alliance co-member Lufthansa. Along with Air Canada, which is also part of Star
Alliance, the three US legacy carriers and their European partners offer more than
82% of daily flights across the Atlantic.
For several quarters the transatlantic region has been subject to overcapacity as
well as decreasing yields and unit revenues. In the third quarter of 2016 alone
Delta’s unit revenues declined by 9.7% year-on-year.
Between January 2016 and September 2016 the Atlantic region accounted for
slightly over 20% of Delta’s total system capacity, making the region a strategic
gateway to Europe and Africa.
This was the result of a variety of macroeconomic, sociological and competitive
forces. There has been a lot of economic uncertainty within the European Union,
ultimately depressing economic growth as well as discretionary income available
for travelling. Amongst others this was the result of aggressive capacity expansion
by Middle East carriers, the continuous emergence of new, primarily European
low-cost competitors, economic uncertainties and an overall sluggish demand in
the wake of the Brexit as well as travelers’ growing fear of terrorist attacks.
The airline industry
Five forces
In accordance with Porter’s strategic analysis framework, Delta Air Lines’ domestic
as well as international operations are subject to five forces, each of which has a
unique significance for the strategic alignment of Delta Air Lines. The five forces
are competition, industry entry and exit, availability of substitutes or complements,
supplier power and buyer power.
Competition

DELTA AIR LINES, INC. COMPANY REPORT
PAGE 15/32
Both on domestic and international routes, Delta Air Lines finds itself exposed to
significant competitive pressure, as multiple other carriers compete with a largely
undifferentiated service for the same customer base and on mostly identical
routes. In the US the Airline Deregulation Act of 1978 removed government control
over air fares, routes as well as market entry and exposed US airlines to larger
competitive constraints, which narrowed profit margins considerably.
In international markets, such as Europe, South East Asia or the Middle East, Delta
experiences similar competitive forces, although these are often times the result of
excessive government intervention. In the Gulf region, for example, the amount of
government subsidies received by carriers such as Emirates, Etihad and Qatar
Airways, makes it especially difficult for foreign carriers to compete on prices. This
is regarded as a violation of multilateral open skies agreements, which are
supposed to liberalize the regulation of international aviation, minimize this sort of
government intervention and guarantee a free-market environment.
Furthermore, the competitive landscape for Delta Air Lines is influenced by other
aspects of the airline industry, such as socioeconomic or technological dynamics.
One example is the surge of online travel agencies over the past 20 years, which
capitalized on the fact that customers became less loyal to certain airlines and that
the price elasticity of their demand for air travel increased greatly. The internet
raised transparency for travelers and enabled them to meticulously compare
prices, which needless to say intensified price competition between carriers.
Industry entry and exit
The airline industry has high entry barriers since carriers require an extensive
amount of capital to cover fixed costs from investments in aircraft, ground
equipment and other property, as well as variable costs from purchasing jet fuel,
employing staff or paying airport fees. Economies of scale, from spreading fixed
costs over a greater capacity, optimizing load factors or entering into code-sharing
agreements, provide a significant cost advantage for established carriers such as
Delta Air Lines and further strengthen barriers to enter the airline market. Another
considerable industry entry barrier is the availability of airport slots15, which are
kind of a precious commodity at certain highly congested airports and which may
be locked into long-term contracts and would have to be acquired directly from
other carriers. Hence emergent airlines are often forced to depart from and arrive
at remote airports during off-peak times.
15 A slot is the right to take off or land at a particular time.

DELTA AIR LINES, INC. COMPANY REPORT
PAGE 16/32
Exit from the airline industry is also a complicated endeavor since it requires
carriers to liquidate their tangible and intangible assets in addition to fulfilling
existing passenger reservations. The complexity of a complete industry exit drove
several major US airlines over the course of the past 15 years to enter Chapter 11
bankruptcy protection, reorganize and eventually reemerge.
Substitute and complement products or services
Instead of taking a plane, business and leisure travelers in the US can use one of
several alternative means of travel, such as train, car or bus. Given the sheer size
of the country, however, viable substitutes for long distance air travel are rather
scarce. Although the US has an interstate rail system, it lacks high-speed trains,
which makes long distance journeys via train less economical than by plane as
they take far longer. In spite of a low-fare bus transportation, Delta and other US
airlines still offer a better value for money on long-haul journeys. This is not the
case for short distances of up to 250 miles, for which trains, cars and buses are
usually the preferable means of transport not only cost-wise but also with regards
to travel time. Because of the strict security procedures at airports, people are
typically better off travelling by land for short distances. Those airlines, whose
majority of flights are short haul, are naturally at a higher risk of substitution should
they decide to increase their prices. For Delta this is only a medium threat given
the expansion of its domestic route network.
High net-worth or business customers might even substitute commercial air travel
by chartering jets, which seems more attractive in light of fractional-ownership
programs as well as a more comfortable pre-boarding and flying experience.
The continuous development of telecommunications constitutes another relevant
substitute to air travel, particularly for business travelers. Fiber optic networks and
high-speed internet allow corporations to increasingly conduct business meetings
via video conference and reduce corporate travel expenses. This is especially bad
for legacy carriers, for which first-class seating is a pivotal part of their pricing
strategy, as first-class travelers essentially overpay for the service received and
thereby boost overall passenger yields.
Complements to Delta’s service package may be of unilateral or bilateral nature.
Unilateral complements to air travel can include amenities such as wireless
internet access or duty-free shopping. Delta and other airlines offer these on-board
services in order to generate further revenue and enhance their customers’
experience, thus differentiating themselves from competitors. Unilateral
complements have the potential to affect travelers’ preference of one airline over
another, but they are unlikely to convince them to substitute away from travelling

DELTA AIR LINES, INC. COMPANY REPORT
PAGE 17/32
by land. Bilateral complements are products and services offered outside air travel.
These can be hotel stays, car rentals or other things business and leisure travelers
demand. There is a reciprocal relationship between air travel and bilateral
complements. A reduction in ticket prices is likely to stimulate air travel and
increase the demand for bilateral complements, while a drop in prices of these
travel-related goods and services can have the same effect on the demand for air
travel.
Supplier power
Delta Air Lines requires the supply of jet fuel, labor and aircraft in order to run its
business. In view of the importance of these input factors for the sake of smooth
airline operations and their share of total operating expenses, supplier power is a
significant force inside the Porter framework.
The price of kerosene is closely linked to the changes in global supply and demand
of crude oil. As a result, airlines are sensitive to the volatile price movements of
this commodity. An upwards or downwards change of one cent in the price of a
gallon of jet fuel, has an annualized impact of $40 million for Delta Air Lines. About
half of the global oil production is contributed by the Organization of the Petroleum
Exporting Countries (OPEC), giving it comprehensive power over worldwide oil
markets. In spite of the recent oversupply and the slide of crude oil prices, aircraft
fuel still represents one of the largest cost items for Delta, second only to labor
expenses. Compared to American Airlines or United Air Lines, however, Delta has
more bargaining power in the purchase of kerosene. The Atlanta-based carrier had
not only entered into numerous contracts to hedge against upwards shifts in oil
prices, but also adopted more drastic measures in 2012, when the company
purchased an old ConocoPhillips oil refinery located outside of Trainer,
Pennsylvania. Although analysts and other industry experts feared that efficiently
running a refinery would be impossible for an airline, since its core competencies
clearly lie elsewhere, Delta has managed to redeem its initial capital investment of
$150 million and be more independent from external supply of jet fuel.
The airline industry is highly labor intensive and unionized to a great extent. At the
end of 2015, about 18% of Delta’s workforce was represented by unions. These
have a considerable bargaining power, due to the fact that salaries represent about
a fourth of Delta’s total operating expenses and human capital is often seen as the
single most important key to succeeding in this business. After the company
plunged into bankruptcy in 2005, Delta’s workforce accepted huge pay cuts as a
sacrifice to initiate the turnaround and convince creditors of the viability of the new
Delta Air Lines. The record-breaking profits of the past few years, however, led

DELTA AIR LINES, INC. COMPANY REPORT
PAGE 18/32
unions to increasingly demand a fair compensation, with the Air Line Pilots
Association’s recent request for a 40% pay increase until 2018 leading the way.
Despite the significance of maintaining a sound employee morale as well as the
need to prevent major work stoppages, an excessive increase in labor costs would
constitute a big hit to Delta’s future earnings and subsequently its stock price. With
regards to labor relations, legacy carriers such as Delta Air Lines are at clear
disadvantage relative to LCCs or ULCCs which enjoyed non-unionization for years
and still pay their employees comparatively less.
Delta and its rival carriers are confronted with an even bigger supplier power when
it comes to purchasing aircraft. Boeing and Airbus virtually have a duopoly on large
aircraft. As of December 31, 2015, both manufacturers combined for roughly 78%
of Delta’s fleet, counting 809 aircraft. Boeing alone constituted a 58% share of the
total. In addition to the lack of alternative, high-end aircraft manufacturers, the sole
nature of the product gives Boeing and Airbus a favorable bargaining position.
Aircraft are no mass-produced articles, but are rather manufactured and delivered
on order, which including post-production testing can take up to three months. After
all, these are products that have to meet the latest safety standards in air travel.
The remainder of the air transport supply chain includes airports, which sell take-
off and landing slots, ticketing facilities, boarding gates and operations areas to
airlines. As the annual number of passengers travelling throughout the US and
worldwide increases, airports will continue to become more congested and put a
higher mark-up on their products and services.
Buyer power
Given the lack of differentiation between the service of two different carriers,
consumers have a significant amount of power. On top of that, buyer power is
amplified by the fact that switching costs between carriers are practically not
existent and travelers could potentially substitute away from air travel to other
means of transport. Moreover, has the abovementioned proliferation of online
travel brokers such as Expedia, or search engines, such as Skyscanner, raised
transparency for consumers and made it easier for them to compare prices, travel
duration and number of stops in order to find the best possible deal. By changing
their fee structure, Delta Air Lines and other carriers have responded to the loss of
pricing power. They reduced basic air fares and added ancillary revenues, such as
baggage fees, which was announced to help them cope with rising costs. More
obviously, though, the change in fee structure aims at making it more difficult for
customers to compare prices online and lowering the price sensitivity of discount
customers. Some airlines even advocate excluding taxes from air fares aggregated
DELTA AIR LINES, INC. COMPANY REPORT
PAGE 19/32
online, so as to enhance transparency and aggravate the consumer’s search for
the best deal even further.
Competitive analysis
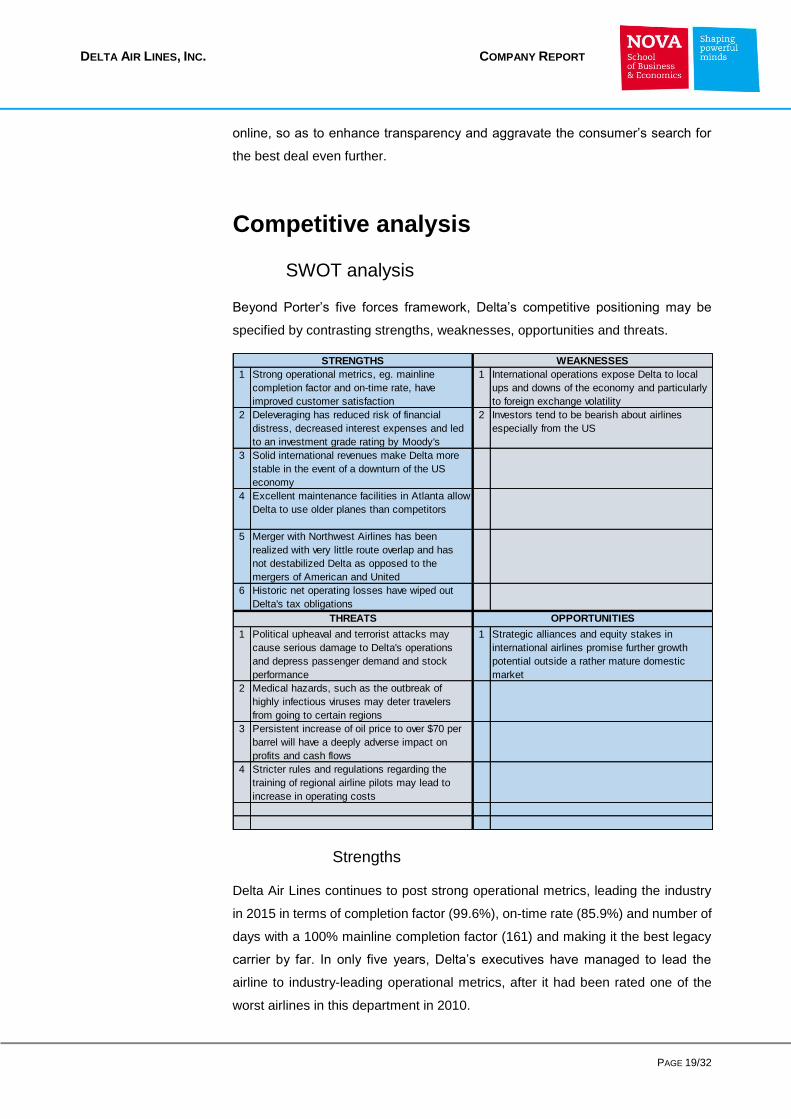
SWOT analysis
Beyond Porter’s five forces framework, Delta’s competitive positioning may be
specified by contrasting strengths, weaknesses, opportunities and threats.
Strengths
Delta Air Lines continues to post strong operational metrics, leading the industry
in 2015 in terms of completion factor (99.6%), on-time rate (85.9%) and number of
days with a 100% mainline completion factor (161) and making it the best legacy
carrier by far. In only five years, Delta’s executives have managed to lead the
airline to industry-leading operational metrics, after it had been rated one of the
worst airlines in this department in 2010.
1 Strong operational metrics, eg. mainline
completion factor and on-time rate, have
improved customer satisfaction
1 International operations expose Delta to local
ups and downs of the economy and particularly
to foreign exchange volatility
2 Deleveraging has reduced risk of financial
distress, decreased interest expenses and led
to an investment grade rating by Moody's
2 Investors tend to be bearish about airlines
especially from the US
3 Solid international revenues make Delta more
stable in the event of a downturn of the US
economy
4 Excellent maintenance facilities in Atlanta allow
Delta to use older planes than competitors
5 Merger with Northwest Airlines has been
realized with very little route overlap and has
not destabilized Delta as opposed to the
mergers of American and United
6 Historic net operating losses have wiped out
Delta's tax obligations
1 Political upheaval and terrorist attacks may
cause serious damage to Delta's operations
and depress passenger demand and stock
performance
1 Strategic alliances and equity stakes in
international airlines promise further growth
potential outside a rather mature domestic
market
2 Medical hazards, such as the outbreak of
highly infectious viruses may deter travelers
from going to certain regions
3 Persistent increase of oil price to over $70 per
barrel will have a deeply adverse impact on
profits and cash flows
4 Stricter rules and regulations regarding the
training of regional airline pilots may lead to
increase in operating costs
STRENGTHS WEAKNESSES
THREATS OPPORTUNITIES

DELTA AIR LINES, INC. COMPANY REPORT
PAGE 20/32
In early February 2016 Moody’s upgraded Delta’s senior unsecured debt securities
to Baa3, rewarding the company with an investment grade rating for its ongoing
efforts to reduce net debt. Since 2009, management has slashed adjusted net debt
by $10.3 billion. At the end of 2015 adjusted net debt amounted to a total of $6.7
billion and the company plans to reduce this number even further to $4 billion by
2020. The true value of reduced leverage and lower interest expenses will start to
reveal itself once industry fundamentals, such as crude oil prices or interest rates,
start to worsen as it puts Delta in more control of an industry downturn.
Another strength is the solid international revenue base of Delta Air Lines, which
makes it less prone to economic downturns of the US market and receding
consumer discretionary spending. In 2015 Delta generated approximately 32% of
its total passenger revenue of $34.78 billion in foreign markets, with the Latin
American region contributing 7%, the transatlantic region contributing 16% and the
Pacific region contributing another 9%.
Delta has a strongly ROIC focused approach in managing its aircraft fleet. While
American Airlines and United Air Lines have greatly modernized their fleets, Delta
Air Lines has learnt from its pre-bankruptcy mistakes and spent considerably less
on new aircraft. Delta’s cost advantage is amplified by the fact that, in spite of its
fleet being on average older than American’s or United’s, it actually has a lower
unit maintenance cost than the two rival legacy carriers. Also its mainline
completion and on-time arrival results are better, which suggests Delta knows how
to utilize its older aircraft efficiently and that its maintenance and repair facilities
are performing well. Although new aircraft, such as the Boeing 787 Dreamliner, are
known to be more fuel efficient than old models, Delta’s choice of older planes has
saved a lot of capital expenditures. It also speaks for Delta’s economic sense that
they purchase older planes which are less expensive.
Compared to its legacy carrier rivals American Airlines and United Air Lines, Delta
has fully realized its cost and revenue synergies from merging with Northwest
Airlines. The 2008 merger has combined Northwest’s presence in Asia with Delta’s
strong performance in Latin America and Europe. While Delta’s merger integration
risk is retired, United is still wrapping up the merger with Continental and lags Delta
in terms of operating margin. American is still highly leveraged after merging with
US Airways in 2013.
Weaknesses
Delta’s revenue diversification is not only a strength but also a weakness, as it
exposes the airline to international economic ups and downs and especially to the
volatility of foreign exchange markets. In 2015, the strong appreciation of the US

DELTA AIR LINES, INC. COMPANY REPORT
PAGE 21/32
dollar against several other currencies, that Delta had economic exposure in,
created major headwinds as it lowered non-US dollar earnings after translating
them back into US dollar. In the fourth quarter of 2015 alone, the headwind
accounted for $160 million in loss of revenue.
In light of the company’s bankruptcy in 2005 as well as the general airline industry’s
longstanding plight, investors are still highly pessimistic on Delta’s stock. That
being said, a lot of issues, such as capacity growth, fuel prices or union demands
make airline stocks in general a lot riskier than other stocks. Like its network carrier
rivals, Delta Air Lines is strongly undervalued compared to average industrials or
transportation stocks and remains haunted by the past industry mistakes.
Opportunities
Joint ventures and equity stakes have lined up some promising international
growth potential for Delta Air Lines. Equity stakes in airlines, such as Aeroméxico,
China Easter, GOL or Virgin Atlantic, provide Delta with long-term income and a
foothold in regions, which the Atlanta-based carrier regards as strategically
important. Furthermore, these investments diversify Delta’s financial exposure to
different regions and currencies. Further joint ventures with China Eastern (3%),
Virgin Atlantic (49%) or Air France/KLM have firmly established Delta Air Lines on
Atlantic and Pacific routes, without incurring the expenses of organic expansion.
Threats
Political upheaval as well as terrorist attacks have the potential to do serious
damage to Delta’s operations as the carrier may temporarily need to cancel flights
to certain affected regions, as experienced in the case of Brussels, or travelers
may switch to other means of transport as they lose confidence in the safety of air
travel. The spreading of ISIS and other extremist groups will continue to pose a big
threat.
The outbreak of highly infectious viruses, such as Ebola or Zika, can negatively
impact Delta’s operations as travelers may deter from going to certain regions.
However, these medical risks may rather shift leisure travel to other regions or
markets than end it completely.
Since reaching its 2016 low of $27.88 on January 20, the price per barrel of Brent
crude oil has increased by almost $20. West Texas Intermediate has gained over
$17 since hitting rock bottom of $26.21 per barrel on February 11. Even though
crude oil prices are still comfortably low, compared to where they were in the
summer of 2014, a persistent price increase reduces Delta’s operating profits and
cash flows. The recent rally in oil prices has been triggered due to the fact that

DELTA AIR LINES, INC. COMPANY REPORT
PAGE 22/32
China increased its crude oil imports, OPEC is negotiating an output freeze and
also the US crude oil production in major shale regions has dropped.
Stricter rules and regulations regarding minimum training hours as well as deeper
labor issues on working hours, compensation and retirement led to massive pilot
dropouts at regional airlines, which adversely affects not only their own operating
costs, but also represents a big threat to larger carriers, such as Delta Air Lines.
Delta depends on mid-sized carriers to serve rural passengers and feed them into
their network.
Risks to the investment thesis
Investing in Delta Air Lines is subject to a variety of company internal risks as well
as external risks linked to the airline industry or other macroeconomic variables.
External risks
A major source of risk for the entire airline sector is the cost of crude oil and thus
the price for aircraft fuel. While fuel prices have remained relatively flat during the
1990s, they experienced a steep rise from the beginning of the new millennium
onwards until they peaked in the first half of 2012. Since then they gradually
declined to lower levels. The volatile nature of oil prices and the fact that aircraft
fuel expenses represent a material cost component for every carrier, put operating
results at substantial risk. Even though most airlines hedge against a future
upwards shift in the oil price, sudden price jumps can still severely impair the
operating business of airlines as they may not be fully able to pass along higher
fuel costs to customers, particularly those that purchased their tickets well in
advance.
Not only since the events of September 11, 2001, have geopolitical conflicts and
potential terrorist attacks posed a significant threat to the demand for air travel
across the globe and reinforced the necessity to implement stricter security
measures at airports and airlines alike. As a consequence, the operating business
of many airlines has been adversely affected by sharp increases in security costs
and selective, yet mostly temporary decreases in revenues. The attacks witnessed
in Paris, Istanbul and Brussels in late 2015 and early 2016 respectively,
demonstrate the still omnipresent threat of terrorist activities to the aviation industry
in general.
The massive outbreak of Ebola across Northern African states or the Zika virus in
South America have cast light on the ways in which contagious illnesses may lower

DELTA AIR LINES, INC. COMPANY REPORT
PAGE 23/32
the willingness to travel to certain regions of the earth and travel restrictions can
adversely impact airlines’ operating results.
Internal risks
Unlike American Airlines, Delta Air Lines has been hedging the upside of oil price
movements. Although these hedging activities aim at reducing the risk of adverse
oil price movements, the mere rebalancing or mark-to-market adjustments of the
hedge portfolio may require Delta to post a significant amount of margin on short
notice and heavily dip into its cash holdings.
The main purposes of Delta’s non-controlling investments in as well as its joint
ventures and strategic alliances with other airlines, are to broaden the global
network, achieve revenue or cost synergies and to make a reasonable return on
investment. However, these commercial relationships expose Delta Air Lines to
potentially improper business behavior or non-compliance with laws and
regulations by their partners and any service disruptions or reputational damages
associated with it.
The solvency of Delta Air Lines relies on the continuous guarantee of credit
facilities which require the company to hold a certain amount of liquidity or post
collateral against the risk of default. A rapid decline in the value of collateral could
adversely affect Delta’s credit rating across global equity and debt markets, lead
to the reevaluation or even cancellation of credit agreements and accelerate a
possible default.
As for any other labor intensive business, labor disputes or even strikes of certain
employee groups may seriously disrupt operations and bring about financial losses
for Delta Air Lines. The fact that approximately 18% of Delta’s staff was unionized
at the end of 2015 underlines the great risk involved in labor relations. Another
labor-related risk is the turnover of senior management or crucial members of staff
without finding adequate replacements which may impact business in the short,
medium and long run.
A key risk in Delta’s operations is also the strong dependence on major domestic
and international airports. These hubs not only guarantee the majority of non-stop
flights but are also vital in the distribution of transit passengers travelling to and
from major cities in the US and abroad. In the case of a service interruption at the
Hartsfield-Jackson airport in Atlanta or one of Delta’s smaller hubs, its business
would be immensely impaired. Any stoppage in services provided by third-party
regional carriers may have a similarly negative effect on Delta’s operating results
as it may represent a sizable loss of capacity and translate into reduced sales and
possibly remediating expenses.

DELTA AIR LINES, INC. COMPANY REPORT
PAGE 24/32
Financial outlook
Dividend policy
As Delta’s management repeatedly said in the past, the company will stick to its
strategy of returning large amounts of cash to shareholders. In May 2015,
management announced to return $6 billion in cash to shareholders until end of
2017. Legacy carriers such as Delta, American or United have had a long history
of not paying any dividends at all, until Delta reinstated its dividend in 2013,
followed suit by American in 2014. Unlike American, however, Delta did not keep
its dividend constant but increased it from a quarterly 3 cents in 2013, to 7.5 cents
in 2014 and 11.25 cents in 2015. In expectation of lower-for-longer oil prices, solid
earnings, decreasing debt levels and strong cash flows, I forecast Delta to further
boost its quarterly dividend, although more conservatively than in the last two
years, and endeavour to portray itself as a dividend growth stock.
Beyond increasing its dividends, the Atlanta-based carrier will continue to buy back
shares on a massive scale. Of the $6 billion in cash, which shareholders were
promised until the end of 2017, Delta plans to buy back equity in the amount of $5
billion. Since introducing dividend payments in 2013, Delta has reduced its
outstanding shares from 856.6 million to 736.4 million at the end of 2016. Share
buybacks have three major advantages over dividends. First of all, by reducing
outstanding shares they raise the dividend per share without actually increasing
total dividend distribution. Second of all, they continue to be a cheap form of
shareholder compensation while the stock trades at such a large discount to
average industrials or transport stocks. Third of all, they leave Delta more room for
manoeuver than committing to a fixed dividend payment.
Valuation
Delta Air Lines is projected to change its debt-to-equity ratio to 22% until 2025.
Since the leverage of Delta, American and United differs greatly from the leverage
of LCCs, it does not make sense to include the latter in the target capital ratio.
Based on this assumption, the WACC approach will value Delta’s free cash flows
until perpetuity.
WACC approach
Figure 23: Daily Yields 30 Year US T-Bonds

DELTA AIR LINES, INC. COMPANY REPORT
PAGE 25/32
The underlying valuation model assumes Delta Air Lines is part of a group of
industry peers, composed of both legacy carriers and LCCs. Although the LCCs in
the peer group16 have a different capital structure, their systematic risk is
comparable to that of legacy carriers. The cost of equity is calculated through
application of the CAPM. I assume the risk free rate to correspond to the yield on
30-year US Treasury bonds, which as of December 30, 2016 was 3.06%. Figure
23 highlights 30-year US T-Bond yields since May 2011. The market risk premium
is set at 5%.
Multiples
We considered several different ratios for a multiples valuation of Delta Air Lines
and found the company to be largely undervalued compared to most of its domestic
as well as international competitors. Figure 24 collates Delta’s enterprise value
multiples with the arithmetic average of sample US network and value carriers
mentioned before. Our analysis suggests that Delta is trading at a 6.83% discount
(EV/EBITDA) respectively a 20.39% discount (EV/Revenue) to its industry peers.
An even more precise valuation is provided in Figure 25 which compares Delta’s
price earnings multiples with the averages of domestic as well as international
airlines. According to forward price earnings ratios, Delta Air Lines is undervalued
by 24.42% against domestic peers and 40.61% against a sample of international
carriers, mostly from Asia.
The systematic undervaluation across different financial metrics substantiates
investors’ generally pessimistic perception of Delta. Effectively the market is
questioning Delta’s capability to continue to post the level of operating margins that
it has for the last two years from 2017 onwards.
16 The LCCs analyzed are Southwest Airlines, JetBlue Airways, SkyWest, Alaska Air Group, Hawaiian Holdings and Spirit Airlines.
Figure 24: Enterprise Value multiples Delta vs competitors
Source: Yahoo Finance
Figure 25: P/E multiples Delta vs competitors
Source: Morningstar
Source: US Department of the Treasury

DELTA AIR LINES, INC. COMPANY REPORT
PAGE 26/32
Appendix
Appendix 1 – Audited (A) and Forecasted (F) traffic, capacity and
passenger load factors by regions
Domestic 2014A 2015A 2016F 2017F 2018F 2019F 2020F 2021F 2022F 2023F 2024F 2025F
Traffic (RPM m)
Domestic 120,211 126,298 130,780 133,428 138,972 143,250 147,660 152,206 155,250 158,355 161,523 164,753
Domestic Mainline 98,844 105,455 109,949 112,716 117,224 120,741 124,363 128,094 130,656 133,269 135,935 138,653
Domestic Regional 21,367 20,843 20,832 20,712 21,748 22,509 23,297 24,112 24,594 25,086 25,588 26,100
Total System 202,925 209,625 213,089 214,639 219,234 223,173 227,769 232,512 236,398 240,357 244,389 248,496
Domestic 59.24% 60.25% 61.37% 62.16% 63.39% 64.19% 64.83% 65.46% 65.67% 65.88% 66.09% 66.30%
Domestic Mainline 48.71% 50.31% 51.60% 52.51% 53.47% 54.10% 54.60% 55.09% 55.27% 55.45% 55.62% 55.80%
Domestic Regional 10.53% 9.94% 9.78% 9.65% 9.92% 10.09% 10.23% 10.37% 10.40% 10.44% 10.47% 10.50%
Total System 100.00% 100.00% 100.00% 100.00% 100.00% 100.00% 100.00% 100.00% 100.00% 100.00% 100.00% 100.00%
Capacity (ASM m)
Domestic 141,128 146,899 153,338 156,394 162,908 167,930 173,108 178,446 182,015 185,656 189,369 193,156
Domestic Mainline 114,180 121,095 127,433 130,619 135,844 139,919 144,117 148,440 151,409 154,437 157,526 160,676
Domestic Regional 26,948 25,804 25,905 25,775 27,064 28,011 28,992 30,006 30,606 31,218 31,843 32,480
Total System 239,676 246,764 251,856 253,756 259,157 263,790 269,176 274,737 279,314 283,976 288,725 293,562
Domestic 58.88% 59.53% 60.88% 61.63% 62.86% 63.66% 64.31% 64.95% 65.17% 65.38% 65.59% 65.80%
Domestic Mainline 47.64% 49.07% 50.60% 51.47% 52.42% 53.04% 53.54% 54.03% 54.21% 54.38% 54.56% 54.73%
Domestic Regional 11.24% 10.46% 10.29% 10.16% 10.44% 10.62% 10.77% 10.92% 10.96% 10.99% 11.03% 11.06%
Total System 100.00% 100.00% 100.00% 100.00% 100.00% 100.00% 100.00% 100.00% 100.00% 100.00% 100.00% 100.00%
Load Factor
Domestic 85.18% 85.98% 85.29% 85.32% 85.31% 85.30% 85.30% 85.30% 85.30% 85.30% 85.30% 85.30%
Domestic Mainline 86.57% 87.08% 86.28% 86.29% 86.29% 86.29% 86.29% 86.29% 86.29% 86.29% 86.29% 86.29%
Domestic Regional 79.29% 80.77% 80.42% 80.36% 80.36% 80.36% 80.36% 80.36% 80.36% 80.36% 80.36% 80.36%
Total System 84.67% 84.95% 84.61% 84.58% 84.60% 84.60% 84.62% 84.63% 84.64% 84.64% 84.64% 84.65%
Latin America 2014A 2015A 2016F 2017F 2018F 2019F 2020F 2021F 2022F 2023F 2024F 2025F
Traffic (RPM m)
Latin America 18,062 19,004 19,778 19,964 20,472 20,742 21,021 21,310 21,459 21,612 21,768 21,927
Latin America Mainline 17,690 18,587 19,232 19,361 19,748 19,945 20,145 20,346 20,448 20,550 20,653 20,756
Latin America Regional 372 417 546 603 724 796 876 963 1,011 1,062 1,115 1,171
Total System 202,925 209,625 213,089 214,639 219,234 223,173 227,769 232,512 236,398 240,357 244,389 248,496
Latin America 8.90% 9.07% 9.28% 9.30% 9.34% 9.29% 9.23% 9.16% 9.08% 8.99% 8.91% 8.82%
Latin America Mainline 8.72% 8.87% 9.03% 9.02% 9.01% 8.94% 8.84% 8.75% 8.65% 8.55% 8.45% 8.35%
Latin America Regional 0.18% 0.20% 0.26% 0.28% 0.33% 0.36% 0.38% 0.41% 0.43% 0.44% 0.46% 0.47%
Total System 100.00% 100.00% 100.00% 100.00% 100.00% 100.00% 100.00% 100.00% 100.00% 100.00% 100.00% 100.00%
Capacity (ASM m)
Latin America 21,725 22,966 23,297 23,547 24,154 24,477 24,812 25,159 25,340 25,524 25,711 25,903
Latin America Mainline 21,230 22,435 22,608 22,789 23,244 23,477 23,712 23,949 24,068 24,189 24,310 24,431
Latin America Regional 496 531 689 758 910 1,001 1,101 1,211 1,271 1,335 1,402 1,472
Total System 239,676 246,764 251,856 253,756 259,157 263,790 269,176 274,737 279,314 283,976 288,725 293,562
Latin America 9.06% 9.31% 9.25% 9.28% 9.32% 9.28% 9.22% 9.16% 9.07% 8.99% 8.91% 8.82%
Latin America Mainline 8.86% 9.09% 8.98% 8.98% 8.97% 8.90% 8.81% 8.72% 8.62% 8.52% 8.42% 8.32%
Latin America Regional 0.21% 0.22% 0.27% 0.30% 0.35% 0.38% 0.41% 0.44% 0.46% 0.47% 0.49% 0.50%
Total System 100.00% 100.00% 100.00% 100.00% 100.00% 100.00% 100.00% 100.00% 100.00% 100.00% 100.00% 100.00%
Load Factor
Latin America 83.14% 82.75% 84.89% 84.78% 84.75% 84.74% 84.72% 84.70% 84.69% 84.68% 84.66% 84.65%
Latin America Mainline 83.33% 82.85% 85.07% 84.96% 84.96% 84.96% 84.96% 84.96% 84.96% 84.96% 84.96% 84.96%
Latin America Regional 74.98% 78.55% 79.23% 79.56% 79.56% 79.56% 79.56% 79.56% 79.56% 79.56% 79.56% 79.56%
Total System 84.67% 84.95% 84.61% 84.58% 84.60% 84.60% 84.62% 84.63% 84.64% 84.64% 84.64% 84.65%
Atlantic 2014A 2015A 2016F 2017F 2018F 2019F 2020F 2021F 2022F 2023F 2024F 2025F
Traffic (RPM m)
Atlantic 40,205 40,437 39,748 39,735 39,139 38,943 38,749 38,555 38,940 39,330 39,723 40,120
Total System 202,925 209,625 213,089 214,639 219,234 223,173 227,769 232,512 236,398 240,357 244,389 248,496
Atlantic 19.81% 19.29% 18.65% 18.51% 17.85% 17.45% 17.01% 16.58% 16.47% 16.36% 16.25% 16.15%
Total System 100.00% 100.00% 100.00% 100.00% 100.00% 100.00% 100.00% 100.00% 100.00% 100.00% 100.00% 100.00%
Capacity (ASM m)
Atlantic 47,566 49,096 49,249 49,298 48,559 48,316 48,074 47,834 48,312 48,796 49,284 49,776
Total System 239,676 246,764 251,856 253,756 259,157 263,790 269,176 274,737 279,314 283,976 288,725 293,562
Atlantic 19.85% 19.90% 19.55% 19.43% 18.74% 18.32% 17.86% 17.41% 17.30% 17.18% 17.07% 16.96%
Total System 100.00% 100.00% 100.00% 100.00% 100.00% 100.00% 100.00% 100.00% 100.00% 100.00% 100.00% 100.00%
Load Factor
Atlantic 84.52% 82.36% 80.71% 80.60% 80.60% 80.60% 80.60% 80.60% 80.60% 80.60% 80.60% 80.60%
Total System 84.67% 84.95% 84.61% 84.58% 84.60% 84.60% 84.62% 84.63% 84.64% 84.64% 84.64% 84.65%

DELTA AIR LINES, INC. COMPANY REPORT
PAGE 27/32
Appendix 2 – WACC Delta Air Lines
Pacific 2014A 2015A 2016F 2017F 2018F 2019F 2020F 2021F 2022F 2023F 2024F 2025F
Traffic (RPM m)
Pacific 24,448 23,886 22,782 21,512 20,652 20,239 20,340 20,442 20,748 21,059 21,375 21,696
Total System 202,925 209,625 213,089 214,639 219,234 223,173 227,769 232,512 236,398 240,357 244,389 248,496
Pacific 12.05% 11.39% 10.69% 10.02% 9.42% 9.07% 8.93% 8.79% 8.78% 8.76% 8.75% 8.73%
Total System 100.00% 100.00% 100.00% 100.00% 100.00% 100.00% 100.00% 100.00% 100.00% 100.00% 100.00% 100.00%
Capacity (ASM m)
Pacific 29,257 27,803 25,972 24,517 23,537 23,066 23,181 23,297 23,647 24,001 24,361 24,727
Total System 239,676 246,764 251,856 253,756 259,157 263,790 269,176 274,737 279,314 283,976 288,725 293,562
Pacific 12.21% 11.27% 10.31% 9.66% 9.08% 8.74% 8.61% 8.48% 8.47% 8.45% 8.44% 8.42%
Total System 100.00% 100.00% 100.00% 100.00% 100.00% 100.00% 100.00% 100.00% 100.00% 100.00% 100.00% 100.00%
Load Factor
Pacific 83.56% 85.91% 87.72% 87.74% 87.74% 87.74% 87.74% 87.74% 87.74% 87.74% 87.74% 87.74%
Total System 84.67% 84.95% 84.61% 84.58% 84.60% 84.60% 84.62% 84.63% 84.64% 84.64% 84.64% 84.65%
Unlevered beta - Delta Air Lines 1.17
Unlevered beta - Industry 1.12
US corporate income tax rate 35.00%
Equity 36.10
Debt 7.57
Current equity ratio 82.67%
Current debt ratio 17.33%
Target D/E 75.00%
Levered beta - Industry 1.66
Cost of equity
US risk free rate 3.06%
Market risk premium 5.00%
Cost of equity 11.37%
Cost of debt
Alternative 1
Moody's credit rating Baa1
US risk free rate 3.06%
Debt Beta 0.10
Market risk premium 5.00%
Cost of debt - Alternative 1 3.56%
Alternative 2
Yield to Maturity 6.06%
Probability of Default 0.00%
Loss Given Default 46.59%
Cost of debt - Alternative 2 6.06%
Weighted Average Cost of Capital
Alternative 1
Target equity ratio 57.14%
Target debt ratio 42.86%
WACC - Alternative 1 7.49%
Alternative 2
Target equity ratio 57.14%
Target debt ratio 42.86%
WACC - Alternative 2 8.19%
Terminal value
Nominal constant growth of FCF 2.00%
Adjusted WACC 6.06%
WACC Delta Air Lines

DELTA AIR LINES, INC. COMPANY REPORT
PAGE 28/32
Appendix 3 – Income Statement 2015-2025 (in million USD)
INCOME STATEMENT
in USD mn (if not stated differently) 2015A 2016F 2017F 2018F 2019F 2020F 2021F 2022F 2023F 2024F 2025F
Mainline 28,898 28,912 29,015 29,397 29,927 30,530 31,147 32,073 33,027 34,010 35,022
Regional carriers 5,884 5,793 5,751 6,033 6,288 6,555 6,834 7,153 7,487 7,837 8,204
Total passenger revenue 34,782 34,705 34,767 35,430 36,215 37,085 37,981 39,226 40,514 41,847 43,226
Cargo 813 740 714 689 686 682 679 685 692 699 706
Other 5,109 5,416 5,849 6,317 6,948 7,643 8,408 9,416 10,546 11,812 13,229
Total operating revenue 40,704 40,861 41,329 42,436 43,849 45,410 47,067 49,328 51,753 54,358 57,162
Aircraft fuel and related taxes -6,544 -5,054 -6,536 -6,873 -7,458 -8,088 -8,575 -9,052 -9,552 -9,699 -9,861
Salaries and related costs -8,776 -9,154 -9,293 -9,728 -9,937 -10,343 -10,768 -10,935 -11,284 -11,645 -12,018
Regional carrier expense -4,241 -4,229 -4,371 -4,585 -4,968 -5,178 -5,399 -5,723 -5,990 -6,270 -6,563
Aircraft maintenance materials and outside repairs -1,848 -1,922 -1,989 -2,059 -2,110 -2,163 -2,217 -2,261 -2,307 -2,353 -2,400
Depreciation and amortization -1,835 -1,769 -1,880 -2,020 -2,076 -2,189 -2,335 -2,423 -2,611 -2,815 -3,037
Contracted services -1,848 -1,924 -1,955 -2,042 -2,121 -2,214 -2,312 -2,399 -2,489 -2,582 -2,680
Passenger commissions and other selling expenses -1,672 -1,727 -1,755 -1,838 -1,920 -2,019 -2,124 -2,220 -2,320 -2,425 -2,535
Landing fees and other rents -1,493 -1,536 -1,554 -1,603 -1,652 -1,709 -1,769 -1,828 -1,889 -1,952 -2,018
Profit sharing -1,490 -1,042 -1,176 -994 -946 -777 -757 -755 -830 -892 -1,002
Passenger service -872 -924 -971 -1,019 -1,060 -1,102 -1,146 -1,186 -1,228 -1,271 -1,315
Aircraft rent -250 -253 -256 -260 -265 -271 -276 -283 -290 -297 -305
Restructuring and other items -35 -300 -250 -250 -230 -230 -230 -200 -200 -200 -200
Other -1,998 -2,058 -2,130 -2,205 -2,293 -2,384 -2,480 -2,591 -2,708 -2,830 -2,957
Total operating expense -32,902 -31,892 -34,115 -35,476 -37,035 -38,668 -40,388 -41,856 -43,698 -45,232 -46,891
Operating income 7,802 8,969 7,214 6,960 6,813 6,742 6,679 7,472 8,056 9,126 10,271
Interest expense, net -481 -484 -315 -277 -173 -135 -71 -82 -112 -152 -211
Amortization of debt discount, net 0 0 0 0 0 0 0 0 0 0 0
Loss on extinguishment of debt 0 0 0 0 0 0 0 0 0 0 0
Miscellaneous, net -164 -30 -40 -40 -45 -45 -45 -50 -50 -50 -50
Total non-operating expense, net -645 -514 -355 -317 -218 -180 -116 -132 -162 -202 -261
Income before income taxes 7,157 8,455 6,859 6,643 6,595 6,562 6,564 7,340 7,894 8,924 10,009
Income tax (provision) benefit -2,631 -3,111 -2,524 -2,444 -2,427 -2,415 -2,415 -2,701 -2,905 -3,284 -3,683
Net income 4,526 5,343 4,335 4,198 4,168 4,147 4,148 4,639 4,989 5,640 6,326
Basic earnings per share 5.68 7.26 6.01 5.91 5.92 5.92 5.95 6.66 7.16 8.10 9.08
Diluted earnings per share 5.63 7.19 5.95 5.85 5.86 5.86 5.89 6.59 7.09 8.01 8.99
Cash dividends declared per share 0.45 1.09 1.20 1.18 1.78 2.07 2.38 2.66 2.86 4.05 4.54

DELTA AIR LINES, INC. COMPANY REPORT
PAGE 29/32
Appendix 4 – Balance Sheet 2015-2025 (in million USD)
BALANCE SHEET
in USD mn (if not stated differently) 2015A 2016F 2017F 2018F 2019F 2020F 2021F 2022F 2023F 2024F 2025F
Assets
Cash and cash equivalents 1,972 3,751 3,658 4,494 4,994 5,947 5,895 5,615 5,204 4,498 4,009
Short-term investments 1,465 1,516 1,585 1,656 1,739 1,826 1,917 2,022 2,133 2,251 2,375
Restricted cash, cash equivalents and short-term investments 0 0 0 0 0 0 0 0 0 0 0
Accounts receivable, net of an allowance for uncollectible accounts 2,020 2,127 2,208 2,267 2,403 2,488 2,579 2,770 2,907 3,053 3,210
Hedge margin receivable 119 60 33 18 13 9 6 5 4 3 3
Fuel inventory 379 261 316 332 356 386 409 423 446 453 461
Expendable parts and supplies inventory, net of an allowance for obsolescence318 289 295 306 303 316 330 332 346 356 368
Hedge derivatives asset 1,987 1,391 1,043 782 626 501 401 340 289 246 209
Deferred income taxes, net 0 0 0 0 0 0 0 0 0 0 0
Prepaid expenses and other current assets 796 812 824 836 847 858 870 878 887 896 905
Total current assets 9,056 10,206 9,962 10,692 11,280 12,331 12,406 12,386 12,217 11,756 11,539
Property and equipment 33,910 36,405 39,671 42,631 44,954 47,418 50,563 53,895 58,079 62,620 67,548
less: accumulated depreciation and amortization -10,871 -12,327 -13,874 -15,537 -17,245 -19,047 -20,969 -22,963 -25,112 -27,428 -29,928
Property and equipment, net of accumulated depreciation and amortization23,039 24,078 25,796 27,094 27,709 28,371 29,594 30,932 32,967 35,191 37,621
Goodwill 9,794 9,794 9,794 9,794 9,794 9,794 9,794 9,794 9,794 9,794 9,794
Identifiable intangibles, net of accumulated amortization 4,861 4,873 4,883 4,893 4,900 4,907 4,915 4,920 4,925 4,929 4,934
Deferred income taxes, net 4,956 4,900 4,900 4,500 4,500 4,000 4,000 4,000 4,000 4,000 4,000
Other noncurrent assets 1,428 1,499 1,559 1,622 1,670 1,721 1,772 1,808 1,844 1,881 1,918
Total noncurrent assets 21,039 21,067 21,136 20,808 20,864 20,422 20,481 20,521 20,562 20,604 20,647
Total assets 53,134 55,350 56,895 58,594 59,854 61,124 62,481 63,840 65,746 67,552 69,806
Liabilities and stockholders' equity
Current maturities of long-term debt and capital leases 1,563 1,751 1,961 2,157 2,372 2,610 2,818 3,044 3,287 3,550 3,834
Air traffic liability 4,503 4,548 4,582 4,617 4,640 4,663 4,686 4,703 4,719 4,735 4,752
Accounts payable 2,743 2,621 2,710 2,819 2,841 2,966 3,098 2,982 3,113 3,222 3,340
Accrued salaries and related benefits 3,195 3,035 2,914 2,797 2,713 2,632 2,553 2,502 2,452 2,403 2,355
Hedge derivatives liability 2,581 1,936 1,549 1,239 1,053 895 761 685 616 555 499
Frequent flyer deferred revenue 1,635 1,651 1,664 1,676 1,686 1,696 1,707 1,715 1,724 1,732 1,741
Taxes payable 0 0 0 0 0 0 0 0 0 0 0
Fuel card obligation 0 0 0 0 0 0 0 0 0 0 0
Other accrued liabilities 1,306 1,371 1,426 1,483 1,528 1,574 1,621 1,653 1,686 1,720 1,754
Total current liabilities 17,526 16,913 16,806 16,787 16,833 17,036 17,244 17,283 17,597 17,918 18,276
Long-term debt and capital leases 6,766 5,751 4,888 4,155 3,823 3,517 3,447 3,378 3,310 3,244 3,179
Pension, postretirement and related benefits 13,855 12,960 11,839 10,759 9,248 7,785 6,372 4,871 3,431 2,054 742
Frequent flyer deferred revenue 2,246 2,358 2,453 2,551 2,627 2,706 2,787 2,843 2,900 2,958 3,017
Deferred income taxes, net 0 128 171 202 237 280 331 392 467 556 662
Other noncurrent liabilities 1,891 1,929 1,958 1,987 2,007 2,027 2,047 2,058 2,068 2,078 2,089
Total noncurrent liabilities 24,758 23,126 21,308 19,654 17,943 16,315 14,985 13,542 12,175 10,889 9,689
Total liabilities 42,284 40,039 38,114 36,441 34,776 33,351 32,228 30,825 29,772 28,807 27,965
Common stock, at $0.0001 par value 0 0 0 0 0 0 0 0 0 0 0
Additional paid-in capital 10,875 10,857 10,927 11,014 11,102 11,191 11,279 11,368 11,456 11,544 11,632
Retained earnings (accumulated deficit) 7,623 12,165 15,633 18,991 21,909 24,604 27,093 29,877 32,870 35,690 38,853
Accumulated other comprehensive loss -7,275 -7,275 -7,275 -7,275 -7,275 -7,275 -7,275 -7,275 -7,275 -7,275 -7,275
Treasury stock, at cost -373 -436 -504 -578 -658 -747 -845 -955 -1,077 -1,215 -1,369
Total stockholders' equity 10,850 15,311 18,781 22,153 25,078 27,773 30,253 33,015 35,974 38,745 41,841
Total liabilities and stockholders' equity 53,134 55,350 56,895 58,594 59,854 61,124 62,481 63,840 65,746 67,552 69,806

DELTA AIR LINES, INC. COMPANY REPORT
PAGE 30/32
Appendix 5 – DCF Valuation Model
2016F 2017F 2018F 2019F 2020F 2021F 2022F 2023F 2024F 2025F
NOPLAT 5,016 4,905 4,504 4,640 4,307 4,571 5,063 5,445 6,135 6,873
+ Depreciation and amortization 1,769 1,880 2,020 2,076 2,189 2,335 2,423 2,611 2,815 3,037
= Gross cash flow 6,785 6,785 6,524 6,715 6,497 6,906 7,486 8,056 8,950 9,910
+ Investments in invested capital -2,875 -3,640 -3,288 -2,830 -2,858 -3,553 -4,107 -4,712 -5,118 -5,551
= Operating free cash flow 3,910 3,145 3,236 3,886 3,639 3,353 3,379 3,344 3,832 4,358
Net change in equity -882 -865 -827 -1,243 -1,452 -1,668 -1,877 -2,030 -2,869 -3,229
Income tax rate 35.00% 35.00% 35.00% 35.00% 35.00% 35.00% 35.00% 35.00% 35.00% 35.00%
Debt / Enterprise Value (@ market) 43% 43% 43% 43% 43% 43% 43% 43% 43% 43%
Equity / Enterprise Value (@ market) 57% 57% 57% 57% 57% 57% 57% 57% 57% 57%
Cost of Debt 6.06% 6.06% 6.06% 6.06% 6.06% 6.06% 6.06% 6.06% 6.06% 6.06%
Cost of Equity 11.37% 11.37% 11.37% 11.37% 11.37% 11.37% 11.37% 11.37% 11.37% 11.37%
WACC 8.19% 8.19% 8.19% 8.19% 8.19% 8.19% 8.19% 8.19% 8.19% 8.19%
FCF growth rate -14.97% -19.57% 2.91% 20.06% -6.35% -7.86% 0.79% -1.04% 14.59% 13.74%
FCF growth rate in perpetuity 2.00%
Enterprise Value 57,284 58,828 60,407 61,466 62,859 64,651 66,564 68,669 70,458 71,867
+ Excess cash 2,934 2,832 3,645 4,117 5,039 4,954 4,628 4,169 3,411 2,866
+ Short-term investments 1,516 1,585 1,656 1,739 1,826 1,917 2,022 2,133 2,251 2,375
+ Restricted cash, cash equivalents and short-term investments0 0 0 0 0 0 0 0 0 0
- Current maturities of long-term debt and capital leases1,751 1,961 2,157 2,372 2,610 2,818 3,044 3,287 3,550 3,834
- Long-term debt and capital leases 5,751 4,888 4,155 3,823 3,517 3,447 3,378 3,310 3,244 3,179
- Pension, postretirement and related benefits 12,960 11,839 10,759 9,248 7,785 6,372 4,871 3,431 2,054 742
= Equity Value 41,272 44,556 48,637 51,878 55,811 58,885 61,922 64,943 67,272 69,352
Outstanding shares 736 722 711 704 700 697 697 697 697 697
Current share price (Dec 30, 2016) 49.19
Expected share price 56.05 61.74 68.42 73.72 79.71 84.52 88.88 93.21 96.56 99.54
Expected capital gain 25.52% 39.10% 49.87% 62.04% 71.82% 80.68% 89.50% 96.30% 102.36%
Shareholders' cash in / cash out (per share) -1.20 -1.20 -1.16 -1.77 -2.07 -2.39 -2.69 -2.91 -4.12 -4.63
Expected cash gain -2.44% -2.36% -3.59% -4.21% -4.87% -5.48% -5.92% -8.37% -9.42%
Total shareholders' expected return 23.08% 36.74% 46.28% 57.82% 66.95% 75.21% 83.58% 87.92% 92.94%
True Recommendation BUY BUY BUY BUY BUY BUY BUY BUY BUY
Recommendation (research notes) BUY BUY BUY BUY BUY BUY BUY BUY BUY

DELTA AIR LINES, INC. COMPANY REPORT
PAGE 31/32
Appendix 6 – Sensitivity Analyses
1.41 1.46 1.51 1.56 1.61 1.66 1.71 1.76 1.81 1.86 1.91
1.81% 87.06 83.86 80.84 77.99 75.30 72.74 70.31 68.01 65.82 63.73 61.74
2.06% 83.86 80.84 77.99 75.30 72.74 70.31 68.01 65.82 63.73 61.74 59.84
2.31% 80.84 77.99 75.30 72.74 70.31 68.01 65.82 63.73 61.74 59.84 58.03
2.56% 77.99 75.30 72.74 70.31 68.01 65.82 63.73 61.74 59.84 58.03 56.29
2.81% 75.30 72.74 70.31 68.01 65.82 63.73 61.74 59.84 58.03 56.29 54.63
3.06% 72.74 70.31 68.01 65.82 63.73 61.74 59.84 58.03 56.29 54.63 53.04
3.31% 70.31 68.01 65.82 63.73 61.74 59.84 58.03 56.29 54.63 53.04 51.51
3.56% 68.01 65.82 63.73 61.74 59.84 58.03 56.29 54.63 53.04 51.51 50.05
3.81% 65.82 63.73 61.74 59.84 58.03 56.29 54.63 53.04 51.51 50.05 48.64
4.06% 63.73 61.74 59.84 58.03 56.29 54.63 53.04 51.51 50.05 48.64 47.28
4.31% 61.74 59.84 58.03 56.29 54.63 53.04 51.51 50.05 48.64 47.28 45.98
US
ris
k fre
e r
ate
Levered industry betaRun
3.75% 4.00% 4.25% 4.50% 4.75% 5.00% 5.25% 5.50% 5.75% 6.00% 6.25%
0.75% 60.56 58.66 56.90 55.25 53.72 52.28 50.93 49.66 48.47 47.34 46.28
1.00% 62.86 60.80 58.89 57.11 55.45 53.91 52.46 51.10 49.83 48.63 47.50
1.25% 65.36 63.11 61.03 59.11 57.32 55.66 54.10 52.64 51.28 50.00 48.79
1.50% 68.08 65.62 63.36 61.27 59.33 57.53 55.86 54.29 52.83 51.46 50.17
1.75% 71.06 68.36 65.89 63.61 61.50 59.56 57.75 56.06 54.49 53.01 51.63
2.00% 74.34 71.37 68.65 66.15 63.86 61.74 59.78 57.96 56.26 54.68 53.20
2.25% 77.97 74.67 71.67 68.93 66.42 64.11 61.98 60.01 58.17 56.47 54.87
2.50% 82.00 78.32 75.00 71.98 69.22 66.69 64.37 62.22 60.23 58.39 56.67
2.75% 86.50 82.39 78.68 75.33 72.29 69.51 66.96 64.62 62.46 60.46 58.60
3.00% 91.57 86.93 82.77 79.04 75.66 72.60 69.80 67.23 64.88 62.70 60.69
3.25% 97.32 92.04 87.35 83.16 79.40 76.00 72.91 70.09 67.51 65.13 62.94
Market risk premium
TV
gro
wth
Run
3.75% 4.00% 4.25% 4.50% 4.75% 5.00% 5.25% 5.50% 5.75% 6.00% 6.25%
1.81% 85.29 81.27 77.65 74.37 71.39 68.67 66.17 63.88 61.76 59.80 57.97
2.06% 82.82 79.05 75.64 72.55 69.72 67.14 64.77 62.58 60.56 58.68 56.94
2.31% 80.50 76.96 73.74 70.82 68.14 65.69 63.43 61.35 59.41 57.62 55.95
2.56% 78.33 74.98 71.95 69.18 66.64 64.31 62.16 60.17 58.32 56.60 54.99
2.81% 76.28 73.12 70.25 67.63 65.22 63.00 60.94 59.04 57.27 55.62 54.08
3.06% 74.34 71.37 68.65 66.15 63.86 61.74 59.78 57.96 56.26 54.68 53.20
3.31% 72.52 69.70 67.12 64.75 62.57 60.54 58.67 56.92 55.30 53.78 52.35
3.56% 70.79 68.12 65.67 63.42 61.33 59.40 57.60 55.93 54.37 52.91 51.54
3.81% 69.16 66.62 64.29 62.14 60.15 58.30 56.58 54.98 53.48 52.07 50.75
4.06% 67.61 65.20 62.98 60.93 59.02 57.25 55.60 54.06 52.62 51.27 49.99
4.31% 66.13 63.84 61.72 59.76 57.94 56.25 54.67 53.19 51.80 50.49 49.26
US
ris
k fre
e r
ate
Market risk premiumRun
5.06% 5.26% 5.46% 5.66% 5.86% 6.06% 6.26% 6.46% 6.66% 6.86% 7.06%
10.12% 71.89 71.22 70.56 69.92 69.29 68.67 68.07 67.47 66.89 66.32 65.76
10.37% 70.20 69.56 68.94 68.33 67.73 67.14 66.57 66.01 65.45 64.91 64.38
10.62% 68.59 67.99 67.40 66.82 66.25 65.69 65.15 64.61 64.08 63.57 63.06
10.87% 67.07 66.50 65.93 65.38 64.84 64.31 63.79 63.28 62.78 62.29 61.80
11.12% 65.62 65.08 64.54 64.02 63.50 63.00 62.50 62.01 61.53 61.06 60.60
11.37% 64.24 63.73 63.22 62.72 62.22 61.74 61.27 60.80 60.35 59.90 59.45
11.62% 62.93 62.44 61.95 61.47 61.00 60.54 60.09 59.65 59.21 58.78 58.36
11.87% 61.68 61.21 60.74 60.29 59.84 59.40 58.97 58.54 58.12 57.71 57.31
12.12% 60.49 60.03 59.59 59.15 58.72 58.30 57.89 57.48 57.08 56.69 56.30
12.37% 59.34 58.91 58.49 58.07 57.66 57.25 56.86 56.47 56.08 55.70 55.33
12.62% 58.25 57.84 57.43 57.03 56.64 56.25 55.87 55.49 55.12 54.76 54.40
Pre-tax cost of debt
Co
st o
f e
qu
ity
Run

DELTA AIR LINES, INC. COMPANY REPORT
PAGE 32/32
Disclosures and Disclaimer
Research Recommendations
Buy Expected total return (including dividends) of more than 15% over a 12-month period.
Hold Expected total return (including dividends) between 0% and 15% over a 12-month period.
Sell Expected negative total return (including dividends) over a 12-month period.
This report was prepared by Michael Lüffe, a student of the NOVA School of Business and Economics, following the Masters in Finance Equity Research – Field Lab Work Project, exclusively for academic purposes. Thus, the author, which is a Masters in Finance student, is the sole responsible for the information and estimates contained herein and for the opinions expressed, which reflect exclusively his/her own personal judgement. This report was supervised by professor Rosário André (registered with Comissão do Mercado de Valores Mobiliários as financial analyst) who revised the valuation methodology and the financial model. All opinions and estimates are subject to change without notice. NOVA SBE or its faculty accepts no responsibility whatsoever for the content of this report nor for any consequences of its use. The information contained herein has been compiled by students from public sources believed to be reliable, but NOVA SBE or the students make no representation that it is accurate or complete, and accept no liability whatsoever for any direct or indirect loss resulting from the use of this report or its content. The author hereby certifies that the views expressed in this report accurately reflect his/her personal opinion about the subject company and its securities. He/she has not received or been promised any direct or indirect compensation for expressing the opinions or recommendation included in this report. The author of this report may have a position, or otherwise be interested, in transactions in securities which are directly or indirectly the subject of this report. NOVA SBE may have received compensation from the subject company during the last 12 months related to its fund raising program. Nevertheless, no compensation eventually received by NOVA SBE is in any way related to or dependent on the opinions expressed in this report. The Nova School of Business and Economics, though registered with Comissão do Mercado de Valores Mobiliários, does not deal for or otherwise offers any investment or intermediation services to market counterparties, private or intermediate customers. This report may not be reproduced, distributed or published without the explicit previous consent of its author, unless when used by NOVA SBE for academic purposes only. At any time, NOVA SBE may decide to suspend this report reproduction or distribution without further notice.