delta air lines, inc. (nyse: dal) - tippie college of business · delta air lines, inc. (nyse:dal)...
TRANSCRIPT

1 Important disclosures appear on the last page of this report.
Consumer Discretionary
Krause Fund Research Spring 2016 Recommendation: Hold
Analysts Eric Hale [email protected]
Nick Steingreaber [email protected]
Company Overview Delta Air Lines, Inc. (NYSE:DAL) has proven to be a global leader within the airline industry. Primarily, Delta provides value through domestic flights, but also offers international flights. Internationally, Delta segments revenue through Pacific, Atlantic and Latin American flights. If there is capacity on the plane, Delta will also ship cargo as an additional source of revenue. For the fiscal year ended 12/31/15, Delta’s total passenger revenues totaled just over $34BB and total operating revenue rose 0.85% to $40.7BB. Investment Thesis Delta is known for providing reliable air travel, exceptional customer service and convenience for consumers. The company has solidified itself as a top player in the airline industry by surviving various airline bankruptcies and economic downturns. Recently, oil prices have dropped to prices that have not been seen in over a dozen years. Though Delta’s management has been working to renegotiate hedging contracts to have access to cheaper fuel, Delta still has one of the worst hedging positions in the industry. Delta will struggle to lower ticket prices and spur demand because margins are already low, but the company will rely on expansion efforts, customer service and infrastructural reliability to continue to drive revenue growth into the future. One Year Stock Performance
Delta Air Lines, Inc. (NYSE: DAL)
April 19, 2016
Current Price 46.55 Target Price $50 - $56
DAL Exhibits Consistent Results
• Delta cannot lower ticket prices as drastically as competitors who have better hedging positions. Therefore, Delta will struggle to reap the full benefits of the low oil prices before prices will likely rise again in the near future. We expect Delta to experience temporarily decreased margins before the industry’s cost of goods sold playing field is leveled again. • Heavy expansion into the Latin American market as well as optimization efforts in the Atlantic segment will drive revenue and earnings. The increased earnings per share may allow Delta to increase dividends, but we expect EPS to stabilize at a level that does not generate an outstanding competitive advantage. • The demand for airline tickets will always be present because of the convenience that air travel provides. So, we believe that the airline industry will eventually rebound from low margins. While the company will inevitably last, the lack of capitalization on current economic trends speaks to a hold rating. Financial Ratios Current Ratio 0.52 Debt to Equity 0.77% Stock Performance Highlights 52 week High $52.77 52 week Low $34.61 Beta Value 1.31 Average Daily Volume 9.83 MM Share Highlights Market Capitalization $36.24 BB Shares Outstanding $797 MM Book Value per share $13.61 EPS (FY ‘15) $5.68 P/E Ratio 8.27 Dividend Yield 1.09% Dividend Payout Ratio 7.92% Company Performance Highlights ROA 8.44% ROE 46.04% Sales $40.7 BB

2 Important disclosures appear on the last page of this report.
Executive Summary We recommend a HOLD rating on Delta Air Lines, Inc. (NYSE:DAL) as of April 19th, 2016. Evaluating Delta’s discounted cash flows and placing heavy emphasis on the price to equity ratios of Delta’s peers, we have concluded that Delta’s target price is $51 - $56. The domestic flight will continue to be the major driver of revenue, but there will be a saturation of the domestic market which will lead to expansion into other markets. Delta also is able to maintain relevancy by relying on subsidiaries and joint ventures that span over 57 countries and six continents. (21) Further, Delta will continue to turnover the current fleet of airplanes to provide the utmost level of efficiency and customer satisfaction. Additionally, Delta will need to address the rise of low cost carriers and try to maintain their favorable market share. Delta has sustained major industry consolidation and has maintained industry leading on-time rates. So, we have deduced that Delta will continue to be a top presence within the airline industry. However, we believe that the current low oil prices will incentivize Delta to lower ticket prices, slashing margins when oil prices inevitably rise. Expansion into underutilized markets will allow the company to hedge against the margin losses as a result of rising oil price but will not be significant enough to justify a BUY rating.
Macroeconomic Outlook Gross Domestic Product The real gross domestic product (GDP) is a measure of the goods and services produced in a country during a given period of time, after adjusting for inflation. GDP is an important statistic to look at because it reflects the state of the economy fairly accurately. This is important because consumers are more likely to spend money on “discretionary” items such as automobiles, vacations, and other luxury goods when the economy is doing well and they have excess money to spend. (1) Since the financial crisis of 2009, parts of the economy have been recovering rapidly, but GDP growth has been stagnant between 1.5% and 2.5% over the last six years. Our team believes that while Real GDP is usually a good indicator for discretionary sales, other indicators such as consumer confidence, interest rates, oil prices, and employment statistics are currently better indicators because they are measurements and indicators that are more closely related to consumers. Going forward, our estimate for 2016 GDP growth is 1.8% because of headwinds from rising interest rates and the economic uncertainty that has led the S&P 500 index into a near 14% decline from its 2,100 level in October, 2015 before rebounding in March 2016 to 2,094 as of April 18, 2016. In addition, a global downturn has strengthened the U.S. Dollar and hurt exports.
Source: Fred Economic Data (2) Consumer Confidence Consumer confidence, a gauge of consumer’s feelings on the economy, political stabilization, and future outlook for their financial health is one of the most important indicators to look at when forecasting the future of airline ticket sales. When consumer confidence is high, the average consumer feels that their future financial health is stable or rising and is therefore more likely to spend money on discretionary items. The specific value of the consumer confidence index is not as important as the general trend of the index. Looking at the trends of the index, the U.S. consumer, over the last year, is near its most confident level since Q4 2006.
Source: U of Michigan, FRED Economic Data (3) Looking at the consumer confidence levels, it should not be a surprise that 2015 was a strong year for the airlines. When consumers are confident that they are in a financially stable environment they are more likely to take on risk (debt) than if they were unsure about their job security, political instability or future inflation rates. We believe that the slight downtick in the consumer confidence index in January and February were reflections of the poor equity market performance and expect that consumer confidence will rise to its 2015 highs in 2016. This is important to our model because we expect North American air transportation to remain steady.

3 Important disclosures appear on the last page of this report.
Interest Rates The US and global economies are in a peculiar time for monetary policies. Never before has the world seen such intervention by central banks to influence interest rates around the world. The US Fed raised its Fed Funds rate by 0.25%, from 0.25% to 0.5%, in December 2015. Originally, the Fed stated that it intended to raise its rates by 0.25% four times in 2016. However, with the early volatility in the markets the Fed has backed away from that stance and failed to raise rates in March. Fed Chairwoman, Janet Yellen, has also seemed to take a more dovish stance on raising rates and signaled that the Fed now plans to do so only twice during 2016. As the graph shows, a 10-year treasury note yielded about 5% before the recession but now yields only 1.8%. This marked decrease in interest rates have propelled the recovering economy forward, but if the Fed waits too long, inflation could get out of control and put the U.S. right back into a recession.
Source: FRED Economic Data (4) Interest rates are a very important factor in the financing decisions a company makes. Delta has new planes ordered for the future, and lower interest rates will help keep debt levels down for in the near future. We expect the Fed to continue to influence interest rates upward over the next several years, but we think that they will be much less inclined to do so during 2016. We also take the expectation of higher interest rates into consideration when forecasting capital expenditures. Delta has future aircraft ordered and interest rates will affect borrowing rates. We believe that the expectation of rising interest rates may lead Delta to borrow and invest more now, so that they can avoid the higher rates several years from now. Global Oil Prices Oil prices were in freefall from the summer of 2014 to mid-February 2016. This sharp price decline erased $80 from a barrel of oil when it hit its low of $26. Since mid-February oil has rallied to as high as $40 a barrel and now sits around $42. Lower oil has many effects on our outlook for Delta, but it mainly affects these indicators through its production and purchase of in gasoline and jet fuel.
Gasoline may be one of the largest expenses a household has and is definitely one of the most visible and volatile. We believe that lower gasoline prices are one of the reasons that consumer confidence has been so high over the last year. The lower gas prices put more money into consumer’s pockets and make them better off financially. This, in turn, raises the consumer confidence index. With the US personal savings rate at only 5.5%, it leads us to believe that 94.5% of the money saved at the pump is being spent in the economy. (5) Since this is excess money that a consumer probably did not budget for, it is more likely that they will spend it on discretionary items such as vacations and airline tickets. We believe that the combination of a high consumer confidence index and low jet fuel prices is a major indication that airfare ticket sales will continue to increase over the next year. Oil will continue to be volatile throughout 2016, but will not begin to make significant price movements upward until Q2 2017. We believe this because of our analysis of oil production and demand. The below EIA graph shows this imbalance between supply and demand. In addition to the EIA forecast, we believe that Iranian oil coming to market will keep oil prices around the mid-$30s to low-$40s during 2016.
Source: EIA Data (6) In the long-run, we believe that oil will not get much higher than $55 per barrel throughout our forecast horizon, to FY ‘20E. This will still translate into relatively cheap gasoline prices when compared to the $4-5 per gallon we saw when oil was more than $100 per barrel. We forecast that oil will remain below $60 per barrel because that is the typical break-even price for most American fracking companies from exploration to extraction. The slowdown in supply that people were expecting from lower prices is not occurring because existing fracking-wells have a break-even price of around $28 per barrel. We expect for oil prices to remain between $30 and $60 for the foreseeable future. Near the lower end of this price corridor, we estimate that airline fuel costs will be at record lows in the years to come. As oil approaches the upper-end of the corridor, airlines will still have more breathing room and less costs than it did in the recent past. Current Employment Statistics As previously discussed, discretionary spending is highly-linked to the strength of the spending environment. There are three

4 Important disclosures appear on the last page of this report.
main requirements, which apply to the average consumer, for spending money on discretionary items.
1. Employed 2. Making a fair wage 3. Confidence in their future employment status
We believe that these are the three main items that lead consumers to spend more freely. (7) Employed Currently, the official unemployment rate sits at 5.0%, which is still slightly higher than the unemployment rate before the financial crisis, 4.6%. With interest rates remaining low for the near future, we see the trend in unemployment continuing downward to about 4.6% within the next two to three years.
Source: FRED Economic Data (8) As the unemployment rate continues to near 4.5%, which we believe to be the full-employment rate, the pressure on wage growth will begin to increase America’s wages. Making a Fair Wage Much of this political season has revolved around families and workers who believe that they are not being paid a fair wage. This unfair wage could be due to a national lack of wage growth or because the minimum wage is too low. Either way, we believe that both will be increasing in the near future. The national stagnation of wages has mostly occurred because there are many people still searching for jobs, post-recession. When there is a supply of qualified labor there is no incentive for businesses to raise wages to attract the most-qualified. However, now that the US is approaching full employment, businesses are running out of qualified labor and will have to begin to raise wages to attract qualified talent to their businesses. We also believe that the minimum wage rising is likely to happen. There are already cities and states that are raising the minimum wage above the $7.25 national minimum, and we expect this trend to continue as it becomes an even bigger issue as the U.S. approaches the 2016 presidential elections. California has recently raised its minimum wage to $15, and we suspect that economists and politicians will be looking at the outcome of this “experiment” to determine if it would be beneficial for the entire nation. Both Democratic candidates have raising the
minimum wage as a key issue in their platforms and we suspect that this will be on of their first priorities if they become President of the United States. A rise in wages, whether from market-forces or political interaction, will have positive effects on discretionary spending. Effects from a higher national minimum wage could have a substantial effect because these employees will have a higher percentage increase in income (some up to 100%), which they could spend on a nice vacation. Confidence for the Future The third item that is a large influencer of discretionary spending is the consumer’s confidence in their future financial stability. With wages rising and unemployment falling or remaining flat, we expect that consumers will remain as confident, if not more confident, than compared to today. Certain issues could negatively affect confidence for the future such as political instability, rising inflation rates, and stock market turmoil. However, within the next two years, we believe that the only possibility of a marked decrease in confidence is in the event of stock market volatility. Overall, the employment statistics and outlook are very good for the discretionary sector and airlines. We expect that a falling unemployment rate, higher wages, and a flat to rising confidence in the future will positively impact Delta. Market Outlook This year began with high market volatility and a 10.7% drop in the S&P 500 from January 1st to February 11th. Since then, however, stocks have rallied to post gains, up 1.96% YTD, with the S&P 500 around 2,080. With the Fed signaling a more dovish position on interest rate hikes we forecast that the S&P 500 will trade in the 2,000 to 2,125 range for the year as the markets worry about interest rate hikes later in the year. We believe that the movements of the overall market will have a negligible effect on Delta during 2016 unless another unexpected downturn occurs, in which Delta will be negatively impacted due to the perceived correlation between stock market health and economic health.
Industry Analysis Overview The airline industry provides air transportation for paying passengers. Current product lines are regional, mainline and cargo. Fee structures vary per product line with regional and mainline carriers offering coach, first, and business class seating choices. There are significant differences in passenger buying habits between leisure and business travelers. Leisure travelers plan out their trips and related flights far in advance, and are extremely price sensitive. They will check daily to find the lowest price. On the other hand, business travelers are less price sensitive, with more precise dates and times, shorter notice, and a larger budget, so they usually will not spend significant time checking for lower fares. The number of leisure travelers has

5 Important disclosures appear on the last page of this report.
been growing since the end of the financial recession. The graph below illustrates this growth and we believe this will be a continued benefit for the entire industry.
Source: Statista, Leisure Travel (9) Revenue streams result from ticket prices, baggage and other customer fees, beverage and inflight entertainment and cargo services. Lower cost carriers keep ticket prices down but tack on higher seating, baggage, and beverage costs. The airline industry is in the mature stage due to segmented and stable services, fewer increases in technology, and significant consolidation. Any new initiatives are by way of low cost fee structures or access to new cities. Industry Trends Consolidation The airline industry offers a similar service regardless of what airline you choose to fly you are still traveling from point A to point B. Each airline essentially provides the same function, thus the industry is very price competitive. Major consolidation in the past ten years has paved the way for rapid revenue growth, high demand and less competition. Delta acquired Northwest in 2008, United bought out Continental in 2010, and American merged with US Airways in 2013 to form the largest airline in the world. Less competition, with fewer global carriers, has helped to keep prices relatively high. We believe that this will continue to benefit Delta, as they look to remain a major player in global aviation.
Source: Company 10-K’s
Falling Oil Prices Airlines are looking forward to more ideal margins due to falling oil prices. Prices have fallen from over $100 a barrel to currently in the $40 range. This price transition has propelled administrative expenses over fuel costs to be the highest cost category. Fuel costed airlines 32% less in 4Q 2015 compared to a year ago. (10) Unfortunately, the airline industry hedges their contracts with oil companies to lock in a stable price for a couple years into the future. This has kept profits from soaring this year; however, airlines will be reaping the benefits as the years progress. Delta has one of the worst hedging positions in the industry, and we believe this might keep the stock price from moving as much as it would have otherwise. With low oil prices comes low gas prices at the pump for travelers. Families will have to make a decision whether or not it is worth it to drive to their destination and benefit from $2 per gallon gas prices. Leisure travelers may believe fares are unreasonably high considering low jet fuel costs. This pressure from leisure travels might end up forcing some airlines in the industry to make price changes to reflect the low jet fuel costs to help keep passengers flying to their destinations.
Source: Macrotrends: Five year oil price Fewer Empty Seats Industrywide passenger load factor, which is the percentage of seats filled, has increased over the years and currently sits at 83.4%. (11) Higher safety records have played a crucial role in increasing demand for airline tickets. Air incidents are at an all-time low, and recent issues have been the fault of the pilot or training rather than complications of the aircraft. Passengers trust the newer airplanes and more advanced technology. (12) The rise of internet booking sites has helped airlines fill their perishable seats with last second cheap rates. S&P Capital IQ expects the supply-demand equation to continue to shift in favor of the airlines. Domestic consumers are likely to face similar or even higher industrywide airfares over the next couple of years. (11)

6 Important disclosures appear on the last page of this report.
Bureau of Transportation Statistics – Load Factor (13) Price Sensitivity Corporations have become more price sensitive than in the past with cuts in corporate travel budgets and fewer employees traveling. They also plan out and make ticket purchases further in advance. E-commerce has increased rapidly in the recent past. Internet airfare booking websites have helped both businesses and leisure travelers save on ticket prices. This will continue to be a negative for airlines as they are unable to squeeze the same amount of profit out of their passengers. To counter this movement in price sensitivity, airlines have updated their business class sections to appeal to these travelers with more leg room, comfortable seats, and in-flight services. (11) Airlines charge more for their business section, and these prices tend to fluctuate less than economy class ticket prices. Below is a graph illustrating the rise in e-commerce in the United States.
Source: Statista Travel (14)
We believe online ticketing will eventually take over the entire booking market, and that will hurt the airlines ability to charge higher fares. Passengers will continue to search sites like Orbitz, Travelocity and Expedia to pull up flights from every single carrier in one simple search, locking in the lowest price. Pilot Unions It has not always been smooth sailing for the airline industry. For many years, airlines were failing to turn a profit and were forced to keep pilot wages extremely low. Pilots, flight attendants and grounds crews suffered with low pay while the
industry was transitioning back into a profitable business. Now that oil prices are at record lows, and ticket prices have remained stable, pilots and other unions are demanding higher wages. Airlines will be forced to react, and this will cut into their bottom line. Delta struggles more in comparison to their competition because they pay their pilots some of the lowest salaries in the industry. (15) We believe this will be a major issue that they will need to correct if they want to continue to attract new pilots to fly for them. Many baby boomer generation pilots are reaching 65 years of age, and therefore a surge of retirements are right around the corner. Delta might just find itself with a pilot shortage if they do not increase their salaries and compensation. Young pilots come fresh out of a four year university saddled with large student loans to pay in addition to the cost of aviation schooling. They will be looking to take the largest starting salary they can find in an already initially low paying industry for co-pilots of regional carriers. Highly skilled pilots help pave the way for important industry metrics such as on time arrivals and safety records. Delta could potentially slip in these categories that they are currently excelling in if they are unable to corporate with the pilot union. Competition Domestically, the U.S. market share war, and even more so, low cost carriers, is causing airfares to remain steady, even as inflation is driving other prices upwards. The domestic market has the highest yields globally after years of capacity constraint, making it prime for expansion. Lower cost carriers are leading the expansion charge and starting to change the market share landscape. (16) Currently there are four major carriers in the United States: Delta, United Continental, American, and Southwest. The big four carriers account for 68.8% of the market share. Low cost and regional carriers are beginning to model themselves after Southwest and are drawing customers away from the big four. Allegiant, Spirit Airlines, Alaskan Airlines, Virgin America, JetBlue and Frontier are growing and expanding their fleet and destinations. Airlines are fighting for customers over the exact same routes as other airlines. Internationally, the Open Skies Policy from 2008 allowed U.S. carriers to enter into European Union Skies via flights departing from the United States. (11) This has helped the industry recently, however, the international outlook overseas looks weak in the near future. Global economic growth is slowing, especially in China and there are monetary and safety concerns in much of Europe. Additional carriers in Asia and the Middle East have made additions to their fleets and routes and have a loyal customer following. Look for Delta to streamline their international routes, optimizing their cost structure. Comparable Companies We gathered the data in the table below to analyze the comparable domestic airlines. These airlines operate fairly similarly across the board. We did not include low cost carriers because we believe their company structures are not similar enough, and therefore the related statistics would not be useful. One concern that Delta is addressing is their current aging fleet, and so the company has orders in place for new models.

7 Important disclosures appear on the last page of this report.
Company DAL AAL UAL LUV P/E 8.3 3.71 2.96 14.37 Op. Margin 19.2% 15.1% 13.6% 20.8% WACC 9.7% 8.5% 8% 9.5% Rev p/ASM 13.2 12.1 12.3 13.0 Domestic Market Share
16.9% 14.9% 14.7% 18%
EPS 5.63 11.07 19.47 3.27 Load Factor % 86.8% 85.6% 85.6% 85.4% Fleet Age 16.9 12 13.4 13.8 Price 46.55 41.12 57.59 46.94 Mainland Fleet 926 946 715 704 Dom. RPMs (m) 25,972 31,576 23,406 29,728 Source: Bloomberg Data Porter’s Five Forces Threat of New Entrants: Weak The likelihood of new entrants has decreased after the consolidation time period with smaller and more modern carriers struggling to be profitable. (11) Small airlines that are becoming more profitable however are looking into potential mergers. Alaskan Airlines is in the process of buying out Virgin America. This trend of low-cost mergers is more likely for the airline industry rather than start-up airlines. We believe low cost carriers will continue to put pressure on larger carriers. Delta and other mainland carriers may have to slightly alter their models to keep up with new trends in customer preferences. In addition to consolidation, the world is mainly covered and airlines now stretch across continents, leaving nearly no new available markets for growth opportunities. Threat of Substitution: Moderate Major cities and routes that offer multiple flights per day have a strong threat of substitution. Customers can simply choose the cheapest fare. They are also able to drive a few hours to airports that offer different carriers or potentially low cost direct flight options to save money. Major mergers have hurt the threat of substitution recently. Many regional carriers went out of business or were bought out during and after the financial recession. Power of Suppliers: Moderate Aircraft manufacturers are the main area of the supply chain and are limited in number. Boeing and Airbus almost sweep up the entire market for new jet airplanes. This results in poor bargaining power for the airlines. However, with airlines placing bulk orders for future airplanes, they have the power to bargain with both Boeing and Airbus, and potentially Embraer, to try to cut the best deal. Airlines also are forced to play by the airports’ rules if they want to land and operate there. Fees can be hefty and negotiating power is small. (17)
Power of Buyers: Weak The rise of e-ticketing has helped shift some of the purchasing power onto the buyers, allowing customers to search out the lowest fares possible. However, currently, there is high demand for tickets, and this has kept ticket prices relatively high. Airlines also do not offer an entirely uniform service. Customers have specific needs in regards to destination and timing preferences. There is potential for only one flight that works for that customer, and thus they are stuck with whatever price the airline has set for that day. Competitive Rivalry: High The level of concentration is not expected to increase significantly in the near future. Any further mergers between these major airlines will likely be denied. (11) The shrinking number of competitors will likely allow for continued capacity restraint and potential fare increases once oil prices stabilize. Consolidation allowed airlines to redeploy and correctly size their capacity to a set-up that is most profitable. Redundant and unprofitable routes are likely to be streamlined. This capacity reduction should lead to customers chasing fewer seats. With fewer airlines out there, capacity additions during future up-cycles could be more muted than in the past. (11) Airlines will continue to fight for the same passengers, but with fewer options out there to choose from, they are not struggling to fill their seats. Catalysts for Growth & Change High Traffic & Competitive Pricing Though increased traffic does not always indicate a direct correlation with profitability, increased traffic does aide in boosting revenue. With additional revenue, an airline can then focus on minimizing cost to boost profitability. However, when increasing traffic to spur growth, an airline must be considerate of the yield from increased traffic to avoid spending money to gain market share. An airline's pricing model can be a double-edged sword. On one hand, high prices almost always generate high yields. On the other hand, being price competitive with the rest of the industry will likely generate more ticket sales. Finding the balance between high-yield pricing while maintaining high traffic is the crucial factor in growth within the airline industry. (11)
Low Costs Recently, labor has surpassed fuel as the largest cost for airlines. Additionally airlines are beginning to re-hedge their contracts with oil companies while oil trades at such a low price. Guaranteeing access to such low oil prices into the future will likely cut one of the industry's largest cost line item in half, swelling the bottom line. Minimizing costs in all aspects allows the industry to compensate for any potential loss in revenue or air traffic. With more fuel efficient, reliable planes entering the market, cutting costs will become easier and more accessible. So, taking all measures to cut costs is necessary for an airline attempting to emerge as the forerunner in the industry. (18)

8 Important disclosures appear on the last page of this report.
Industrywide there has been an increase in jet orders, with airlines racing to fill their fleet with the latest safety technology and fuel efficient planes. Long term, airlines with state of the art aircraft will save on fuel costs. An increase in safety reports will also boost air travel and increase demand. Below is a graph showing the general rise in jet orders per year from the two larger aircraft manufacturers.
Source: WSJ (19)
Managerial Strength Having top management who can recognize and act on the opportunities in the market can make a company successful. For example, failure to recognize the long term profitability of an investment on a newer, safer, more reliable, more efficient plane would be detrimental to a company's bottom line. Managers who are not driven towards profitability will likely hinder the growth of the company. Effective management boosts employee morale by creating efficient pilot scheduling and compensation packages. As a company builds a reputation as the best group to work for in the industry, the company can reasonably count on quality employees to apply for jobs as well as great customer service. Industry leading customer service is arguably the most important intangible in regards to boosting a company’s revenue and growth. (20)
Company Analysis Company Overview Delta Air Lines, Inc. (NYSE:DAL) has always been a global leader within the airline industry. Primarily, Delta provides value through domestic flights, but also offers international flights and will ship cargo as well. Internationally, Delta segments revenue through Pacific, Atlantic and Latin American flights. If there is capacity on the plane, Delta will also ship cargo as an additional source of revenue. For the fiscal year ended 12/31/15, Delta’s total passenger revenues totaled just over $34BB and total operating revenue rose 0.85% to $40.7BB. With large hubs in Atlanta, Cincinnati, Detroit, Memphis, Minneapolis, New York, Salt Lake City, Amsterdam and Tokyo-Narita, Delta provides over 13,000 daily flights to 341 locations in 61 countries. The majority of Delta’s service is sourced domestically as displayed by the North American flight map below.
Source: Delta Air Lines, Inc. Corporate Strategy Delta Air Lines, Inc. places strong emphasis on having global reach to every major market. The company utilizes international joint ventures with Air France-KLM, Alitalia and Virgin Atlantic as well as alliances with AeroMexico, GOL and China Eastern and regional carriers like SkyWest, Inc., Shuttle America, Compass, GoJet and Endeavor Air in order to have access to gateway hubs that provide an entry point for global marketing. Monroe Energy, LLC is Delta’s wholly-owned oil subsidiary which significantly helps to mitigate the cost of the refining margin. As northeastern refineries face the risk of closing their doors, Monroe is solidified as a crucial component of Delta’s strategy to guarantee adequate fuel supply to major New York hubs at JFK and LaGuardia. The plant is capable of refining 195,000 barrels of crude oil for jet fuel as well as a variety of non-jet fuel products. While Monroe is wholly owned by Delta, the refinery still operates as a distinct entity under different management teams then Delta. (21) Delta seeks to gain a competitive advantage through customer loyalty. The main driver of Delta’s customer loyalty success is the Frequent Flyer Program, SkyMiles. Passengers can earn credit through flying on any Delta flight, including subsidiaries and participating airlines. Further, passengers may earn mileage credit through Delta’s credit card as well as car rentals, hotel bookings or by purchasing the mileage credit. Currently 7.2% of revenue miles come as a result of award travel. This program differentiates itself greatly from other airlines because the miles never expire. In 2015 alone, Delta customers redeemed over 312 BB miles. (21) Operational reliability is also a major component of Delta’s corporate strategy. Among major U.S. carriers, Delta consistently is a top-ranked company in terms of completion factor and on-time rate. Improving 69% from 2014, Delta operated 161 days with zero mainline flight cancellations while posting an on-time rate of 85.9%. A large product of Delta’s maturity as a company is significant market share. Second behind American Airlines Group, Inc., Delta holds 18.4% of the market share. In part, this large market

9 Important disclosures appear on the last page of this report.
share came as a result of Delta’s 2008 acquisition of rival Northwest Airlines.
Source: IBISWorld Financial Summary Share Highlights Market Capitalization $36.24 BB Shares Outstanding $797 MM Book Value per share $13.61 EPS (‘15) $5.68 P/E Ratio 8.27 Dividend Yield 1.09% Dividend Payout Ratio 7.92% Company Performance Highlights ROA 8.44% ROE 46.04% Sales $40.7 BB Financial Highlights for Fiscal Year ‘15 • Total operating revenue grew just 0.85% to $40.7 BB. Many
of Delta’s revenue segments reported significant decreases for the year, but a strong 5.38% increase in domestic operations to just over $18 BB was able to provide a hedge against the struggling segments.
• Despite a very modest revenue increase, Delta experienced a
very commendable year for earnings reporting a net income of $4.5 BB, a 587% increase from FY ’14.
• Delta has been taking large steps towards repaying much of
the long term debt that has been on the balance sheet as a result of the 2008 acquisition. Delta’s total debt decreased nearly $2 BB over FY ’15 and will continue to be paid off into the future.
• The dividend paid to shareholder’s increased by $0.15 per
share to $0.45. Excitingly for shareholder’s, at the beginning of FY ’16, Delta announced that the firm will raise the annual dividend yet again to $0.54 per share. As earnings will likely increase, look for the dividend to increase proportionally.
Revenue Decomposition Delta’s main source of revenue is overwhelmingly dominated by passenger travel. In FY ’15, passenger revenue decreased 0.49% and accounted for 85.45% of total operating revenue. The strongest growth (14.19%) was seen in the “Other” segment of revenue which includes SkyMiles sales, transatlantic joint venture settlements and Monroe’s sales of non-jet fuel products to various third parties.
Products Delta segments their revenue into seven primary sections: Domestic, Atlantic International, Pacific International, Latin American International, Regional Carriers, Cargo and Other. The following pie chart displays the total revenue breakdown for Delta’s main products.
Domestic, 44.06%
Atlantic, 13.63%
Pacific, 7.38%
Latin American,
5.93%
Regional Carriers, 14.46%
Cargo, 2.00%
Other, 12.55%
DAL FY '15 REVENUE
Source: Delta Air Lines, Inc. 2015 10-K Domestic Domestic flights have always been the backbone of Delta’s operations. This segment describes all flights that take off and land within the United States. The airline experienced extremely strong performance in Atlanta, New York, Seattle and Los Angeles, but in an effort to expand into underutilized markets while avoiding being wasteful, we expect the domestic flight to experience modest growth and remain between 45% - 47% of total operating revenue. The growth in this segment will slow in relationship with the saturation of the United States market. Atlantic International The Atlantic International segment includes all international flights that take passengers over the Atlantic Ocean. The segment’s revenue fell 4.11% due to poor performance by the African, Middle East and Russian regions. Though European markets were strong, political turmoil in the Middle East, Russia and now even Europe will discourage travel to these regions. We expect revenues to fall sharply until unrest in the Atlantic International segment settles within the coming years. Pacific International The Pacific International segment includes all international flights that transport passengers over the Pacific Ocean. This segment performed the worst of any revenue segment, with revenues decreasing 12.25%. Delta is seeking to optimize the Pacific region through seasonal route cancellations, seasonal high-capacity aircraft retirements and investing in a relationship with underrepresented China Eastern. So, while revenues will still be decreased into the near future, the optimization strategy will allow for higher margins coming from the Pacific region in the near future. Another pressing reason for the decrease in revenue is the strength of the US Dollar to the Japanese Yen (USDJPY=X). At the end of FY ’14 and throughout FY ’15, the USD grew in

10 Important disclosures appear on the last page of this report.
strength significantly which discouraged travel from Japan to the US. We believe the outlook for FY ’16E is more optimistic because the JPY has since rebounded which will ideally spur demand for Pacific travel, as displayed by the following chart.
Source: Yahoo Finance Latin American International The Latin American International segment describes all international flights that transport passengers to anywhere to and from Latin America. Latin American travel revenues decreased $9 MM during FY ‘15, but more importantly, capacity grew 5.7%. We expect the most growth over our forecast horizon to come in this segment as Delta optimizes their flight patterns to divest resources away from the struggling Brazilian economy and invest resources into more profitable and popular vacation destination markets such as Mexico and the Caribbean. Regional Carriers Delta’s growth in revenue from regional carriers experienced a decrease of 6.1% due to an initiative to restructure the domestic fleet. This initiative removed 30 50-seat aircraft and thereby decreased the regional carriers’ capacity by 4.0%. The capacity decrease will likely continue to have an impact on revenue into FY ’16E, but once the restructure is complete, revenues should steady once again. Cargo Cargo revenue is generated from filling the designated cargo area of the plane on regularly scheduled domestic and international flights. Delta does not place heavy emphasis on this section, but in order to generate strong revenue, the company relies on a fuel surcharge. However, during FY ’15, fuel surcharges for cargo transport on all domestic and international flights fell to $0.00. (22) Fuel surcharges will increase again in the future, allowing for Delta to earn more in this segment, but discounting this segment entirely will undeniably keep revenue growth low.
Other The Other segment primarily includes SkyMiles sales, transatlantic joint venture settlements and Monroe’s sales of non-jet fuel products to various third parties. Strong emphasis by management to market the never-expiring aspect of the SkyMiles boosted revenues in this section, but high revenue growth in this segment is relatively uncharacteristic. Customer loyalty programs will stimulate revenue growth, but at a reasonable level. Significant Customers The two segments of customers that utilize Delta’s services are business and leisure travelers. The former is characterized by an emphasis on being able to fly into a convenient location at a convenient time in order to make a meeting or presentation. They prefer to be connected at all times and expect to receive all available amenities on flights due to their high loyalty. Leisure travelers, on the other hand, are significantly more price sensitive and follow the recommendations of friends and families, rather than abiding by the schedule of colleagues. They are enticed by travel packages or specials and prefer to have more entertainment opportunities outside of the core function of the airline. (23) So, if ticket prices fall with the renegotiation of oil contracts, decreasing airline costs, demand should rise in the leisure travelers while business travelers will remain constant. The graph on page 5 illustrates this trend in leisure traveler growth. S.W.O.T. Analysis Strengths Since the merger with Northwest, Delta has nearly perfected its Maintenance, Repair and Overhaul (MRO) division, referred to as TechOps. Without allocating any additional resources, Delta was able to turn TechOps from a cost center to a profitable business which is being contracted out to other airlines. TechOps is the largest MRO group in the world and has helped Delta keep aircraft in world-class shape. (16) We believe that the remarkable overhaul in Delta’s MRO division has led, and will continue to lead, to higher customer satisfaction because aircraft will always be ready to fly. This means that even fewer flights will be cancelled and safety ratings will continue to grow. Among traditional carriers, Delta ranks second in terms of customer satisfaction. The metric was based on seven factors that encompass the entirety of the flight experience from reservations to baggage claim. (11) We believe that Delta’s addition of the Comfort+ seating option, exceptional in-flight amenities and reliability are generating revenue through attracting customers who seek a comfortable and convenient travel experience. The following graphic shows that Delta is nearly 20 points above the segment average and has the highest rating among the big four players in the airline industry.

11 Important disclosures appear on the last page of this report.
Source: J.D. Power (29)
Weaknesses In an initial effort to save money on fuel costs, many airlines, including Delta, were burned when oil prices fell in late 2015. Though Delta was able to exit many of the oil contracts, the airline estimates that they could continue to lose $200 MM per quarter while trying to lock in current low oil prices. We believe that Delta’s operating expenses will fall but because Delta’s oil hedges were so high to begin with, the firm will struggle to compete with groups like American Airlines who decided not to hedge any oil contracts and are now paying no more than $1.53 per gallon. (24)
Delta’s pilot union is seeking a 40% increase in salary, which is said to be returning wages to 2004 levels. As displayed by the chart below, Delta’s pilot union does have a convincing argument for why wages need to be raised – they have a far lower base salary than leading competitor, American. (15)
Source: CNN If this salary hike is to go through, we believe that the increased costs will be offset by a decrease in profit sharing bonus checks to employees because Delta’s net income will be significantly lower. However, we view this as a major weakness because Delta’s management will not concede easily to such a drastic increase in wages, so employee-management synergy will be hindered.
Opportunities In Q4 of FY ’15, Delta acquired six slot pairs at London-Heathrow airport for $276 MM. (21) In a struggling Atlantic International segment, Delta has a viable opportunity to expand travel to Europe. Further, those who currently travel to Europe will be provided a higher degree of convenience as a result of the acquisition. We believe the stability and flexibility that the acquisition brings to Delta as well as Delta’s customers present a crucial opportunity to expand into a market that was previously dominated by only one partnership. Though Alaska Air ultimately secured the acquisition of Virgin America, Delta was initially mentioned as a potential buyer. As low-cost carriers are beginning to gain market share in the airline industry, we believe that expanding Delta’s operations to include a low-cost subsidiary like Virgin America could allow the company to capture the benefits of both traditional and low-cost air travel. Further, acquiring a low-cost carrier could help Delta expand its geographic reach as well as eliminate another competitor in the market. Though Delta is not known to be actively seeking a company to acquire, the opportunity could prove to be quite lucrative. Threats Delta is in danger of being pushed out of a large portion of market share by the rise of low cost carriers. A worldwide representation of the growing frequency of travelers choosing low cost carriers is displayed below.
Source: OAG So, unless Delta can combat the competitive pricing advantage that these carriers have, they will likely struggle to maintain market share. While business travelers will still travel on major airlines for the convenience and amenities, the younger generations will be drawn to low cost carriers because they can plan spontaneous trips for a remarkably low price. We believe that these younger consumers are not nearly as concerned with the in-flight amenities, rather they seek the opportunity to get from point A to point B as cheaply as possible. With political unrest at an all-time high in the Middle East, Delta has already seen the negative impacts of terrorism. After terrorist attacks in Belgium, Delta’s stock price fell. Additionally, Delta acknowledged the potential that their jet fuel supply could be cut off due to terrorist attacks on Monroe or other oil refineries. The

12 Important disclosures appear on the last page of this report.
potential of the disruption in Delta’s fuel supply could create a “material adverse effect” on Delta’s operations. (21) If terrorism were to continue into airports or onto aircraft, both leisure and business travelers would be strongly discouraged from choosing to travel on Delta’s airlines as well as their competitors. Key Investment Considerations Positives The primary investment positive is the continued strong demand for Delta’s services. On an earnings call in mid-January of 2016, Chief Executive Officer Richard Anderson stated that Delta was booked through early summer in terms of their load factor. (28) We believe that if demand is remaining high before ticket prices have even begun to drop, margins will soar. The stock price should benefit from the strong earnings that will be released in late April. The consolidation of airlines protects the current big four players in the industry from being pushed out by a new competitor. The current market shares of the big four players are such that their customer bases are unlikely to become disloyal to the brand. Delta proves itself as a mature member of the airline industry that has survived major consolidations and never declared bankruptcy. We see this reliability as an indicator of strength in potential economic turmoil indefinitely past our forecast horizon. Airline safety is at an all-time high – per every 2.38 million flights, there is only one fatal accident. (25) So, the segment of the population who would rather drive as a means of travel rather than fly due to fear or anxiety are more likely to engage in air travel. We believe that once these customers are comfortable with flying, Delta’s superior on-time rating and lack of cancellations will convince those consumers to become repeat, loyal customers. So, even if oil prices eventually drive ticket prices up in the long haul, Delta will be able to rely on a vast customer base. Negatives Low oil prices do benefit the Delta by increasing margins, but low oil prices also benefit a consumer who wishes to travel by car. Gasoline prices are at lows that have not been seen in years and ticket prices have yet to drop, so traveling by car is remarkably cost efficient. We believe the cost efficiency of low gas prices could drive demand away from air travel if ticket prices remain unchanged for much longer. Consumer spending had slowed down during the Q4 2015 which could be attributed to relatively poor economic growth. (26) With consumers being left strapped for disposable income because the economy is slow-growing and leisure travelers making up the majority of Delta’s customers, we believe that Delta will struggle to be able to convince even loyal leisure travelers to take spontaneous vacations rather than saving money for necessary expenses. With the decrease in oil costs, a bidding war could occur, slashing Delta’s margins. Because airlines have room to give if
operating expenses are significantly lower, we believe the first airline to drastically decrease ticket prices will claim a large portion of the market share for that time period. Over the past three quarters, Delta has had hedging losses of nearly $2 BB, over three times the amount of hedging losses of the next closest loser, United. (27) Because Delta’s oil contracts keep their operating expenses so much higher than that of their peers, we believe that Delta will not be the first to lower prices because they do not have as much room to give in terms of their profit margin.
Valuation Analysis Valuation Summary Primarily, we utilized the Discounted Cash Flow and Economic Profit (DCF and EP) and Relative Valuation models because Delta has reasonably predictable future cash flows. We gave little credence to the Dividend Discount Model (DDM) because Delta’s dividend yield is so low that the model does little to give an accurate representation of the intrinsic value of the stock. We assigned a 50% weight to our DCF and EP models’ average intrinsic value of $51.54, a 30% weight to the Relative PE model’s intrinsic value of $57.99 and just a 20% weight to the DDM’s intrinsic value of $33.77 to reach an indicated intrinsic stock price of $50.06. This is just under five dollars higher than close on 4/18/2016. The following analysis describes in detail the key assumptions that drive our model. Income Statement Assumptions Revenue Decomposition We decomposed our revenue as per the breakdown found in Delta’s 10-K. Revenue was broken into the following seven categories: Domestic, Atlantic, Pacific, Latin America, Regional, Cargo and Other. The following analysis describes how we reached our forecast conclusions regarding these segments. The model is consistent with Delta’s reliance on passenger revenue as the primary driver of total operating revenues. Passenger revenue includes revenues sourced from all Domestic, Atlantic, Pacific, Latin American and Regional Carrier flights. Taking into consideration the guidance provided in a recent Delta earnings report, we are forecasting total passenger revenues to decrease by 1.78% in FY ‘16E. While the industry is experiencing increased demand for airline travel, Delta will likely not reap the full benefits of the increased demand because of their projected lack of ability to decrease prices and remain competitive. Further, we believe that even if Delta can drop ticket prices, other airlines will be able to do so as well which means Delta is not expected to increase the number of tickets sold, rather revenues will decline due to the same number of tickets being sold at a discounted price. We do not expect the drop in revenue to be made up for by non-passenger revenues, Cargo and Other, creating a forecasted 0.94% decrease in total operating revenues for FY ‘16E.

13 Important disclosures appear on the last page of this report.
Regardless, we believe that Delta will regain revenue performance as other airlines will have to raise ticket prices when oil prices increase. So, operating revenues are projected to grow positively in FY ‘17E and reach terminal value at a growth rate of 2.91% in FY ‘20E. Non-passenger revenue is expected to increase as a result of revenues stemming from the Other segment. Because oil is trading at such low levels, the demand for non-jet fuel products is also high. So, we forecasted the 5.00% growth for FY ‘16E and 2.00% terminal value growth in the production and sales of non-jet fuel products by Monroe, Delta’s wholly-owned oil refining subsidiary. We anticipate another negative performance from the Cargo segment in FY ‘16E because of non-existent fuel surcharges. However, due to the cyclical nature of such surcharges, we analyzed historical performance to determine that cargo revenues will increase at a terminal value of 2.00% as well. Cost of Goods Sold (COGS) Over the past eight years, Delta’s COGS averaged just under 78% of total revenues. However, in FY ‘15, COGS fell to 65.72% largely as a result of the falling oil prices which decreased Delta’s fuel expense by nearly 44%. Overall, we expect fuel expenses to continue to be volatile in FY ‘16E, but the rising costs in nearly all other areas of operation will overwhelm the potential savings, thus eventually increasing COGS again. So, we forecasted COGS to remain at 66% for FY ’16E and grow to 70% in FY ’17E before rising back to terminal value of 77% in FY ’18E. Aircraft Fuel and Related Taxes While Delta has been able to renegotiate many of the hedging contracts, there are still many concrete contracts that cause Delta to be unable to take full advantage of current low oil prices. Regardless, Delta’s fuel expense is still expected to decrease into FY ‘16E due to renegotiated hedging contracts. The major savings as a result of these renegotiated contracts is the primary justification for the stagnation in COGS for FY ‘16E. Moving forward, we do not expect oil prices to return to levels that caused Delta’s COGS to be over 78% of revenues. However, we do expect oil prices to gradually rise and thus drive a gradual increase in COGS over the forecast period to eventually reach a constant 77%. Salaries and Related Costs Further, for the first time in Delta’s history, FY ‘15 salaries and related costs surpassed fuel expense. The ongoing negotiations over increasing pilots’ salaries will likely reach resolution and full implementation within the next fiscal year, which will lead to rising salary expenses. Independent of the current negotiations, effective as of December 1, 2015, base pay rates increased 14.5% for eligible employees excluding pilots. So, the full effect of the base pay increase will be reflected in the FY ’16E financial statements. The rising cost of salaries is expected to be the largest factor that mitigates the cost-savings coming from fuel expense.
Regional Carriers Expense Regional carriers expense is the third largest component of COGS and moves in relation to the cost of fuel. So, as fuel expenses decreased over the past year, regional carriers expense decreased 19% as well. We utilized the relationship between fuel expense and regional carriers expense to identify an additional barrier from other rising operating expenses, allowing us to forecast COGS at a slowly increasing percentage of total revenues. Landing Fees and Other Rents Next, Delta recently acquired additional terminal space at London-Heathrow. This has a few important implications on Delta’s landing fees and other rents that also mitigate the decreased fuel expense. First, the additional spaces will result in additional rental expenses for the airline. Further, having increased terminal space indicates an increase in traffic, and so as landing fees become more expensive, the accrual more landing fees will mitigate fuel savings. Depreciation and Amortization Depreciation expense was determined by using an eight year historical average of depreciation expense as a percentage of gross Plants, Property & Equipment (PPE). Depreciation expense was forecasted as 5% of gross PPE, and depreciation expense is forecasted to continue to rise throughout the forecast period as Delta continues to make additional capital expenditures. As per Delta’s annual report, we forecasted amortization of intangible assets to be consistent with the company’s expectation of $17 MM per year through our terminal value year of FY ‘20E. Selling, General & Administrative Expense (SG&A) Delta’s primary SG&A expenses include passenger commissions and advertising expense. We forecasted the account as 4.3% of sales based on historical levels over the past eight years. Delta’s annual report indicates that these expenses increase in relation to sales, and the market will become increasingly competitive with decreasing ticket prices, so advertising expenses will likely increase in order to allow Delta to maintain market share. Balance Sheet Assumptions Cash Cash was forecasted as a plug account using the forecasted cash flow sheet to identify the forecasted change in cash over each year. Utilizing the account as a plug allowed our forecasted assets to equal our forecasted shareholders’ equity and liability. The largest change in cash is expected to come in FY ‘16E as a result of Delta’s aggressive share repurchasing plan that will be highlighted later in the report.

14 Important disclosures appear on the last page of this report.
Capital Expenditures Capital expenditures were fundamental in determining our target price range because of the extremely high value of Delta’s aircraft. Delta’s guidance regarding purchases of new aircraft for FY ‘16E indicated that the company is planning to purchase 57 new aircraft. This level of buying is consistent with an average of close to 55 new aircraft each year. So, we assume maintaining the consistent 5% growth rate in PPE to continue throughout the forecast period. Pension, Postretirement and Related Benefits During FY ’15, Delta decreased the underfunded pension, postretirement and related benefits liability by 8.5%. This contribution was identified as making more than the minimum payment of less than $500 MM. Delta’s management provided insight that contributions towards the underfunded pensions would total at least $1 BB. Our model is consistent with this guidance but moving forward into FY ‘17E, we do not expect Delta to be able to make payments as far in excess of the minimum requirement because of decreasing profit margins as COGS rise again. So, we forecasted the funding payments to be 8% per year. Delta has until FY ’31 to fully fund the pensions. Debt Over the past six years, Delta has reduced their principal amount of debt by $9.8 BB. This alludes to the aggressive policy to repay outstanding debt that lingers from the acquisition of Northwest in order to drastically reduce the high interest expense that is negatively impacting the bottom line. We forecasted Delta to repay 10% of their debt annually in order to compensate for the additional debt being issued in order to finance the continual capital expenditures for updating the airline’s fleet. We expect Delta to continue repaying the debt at a high rate so we kept the debt repayment forecast constant over the forecast period. Treasury Stock A large increase in treasury stock is seen in FY ‘16E as the result of management’s announcement in May of FY ’15 to repurchase $5 BB worth of stock by the end of FY ’17E. We identified the value of the shares yet to be repurchased is $1.975 BB worth of shares per year over FY ’16E and FY ‘17E. Using the current stock price as a proxy for FY ‘16E, we determined that roughly 42.4 MM shares will be purchased in FY ‘16E. Growing the stock price by the cost of equity, we determined that 39.2 MM shares will be repurchased in FY ‘17E, leaving 716.5 BB shares outstanding at year end. Though we cannot forecast future stock repurchase plans, we continued to forecast the growth in shares outstanding by dividing the options outstanding (5.3 MM shares) by the average time to maturity (ten years). The repurchase plan also aided in mitigating a rapid fluctuation in the model’s cash plug. Further, Delta’s forecasted retained earnings account is also kept in a reasonable level due to the large cash outflows in order to return capital to investors.
Weighted Average Cost of Capital (WACC) In order to account for the changing capital structure as a result of large debt repayments, our model utilizes a variable WACC calculation to determine the implied constant WACC for each year of our forecast. In order to find beginning values for each component of our variable WACC calculation, we computed the constant WACC for FY ’15. Delta did not provide any guidance regarding the direction of the capital structure. Our forecast is based on the strong initiative to continue repaying short term debt, long term debt and leases. For the variable WACC calculation, we forecasted a decrease in the market value of Delta’s debt of 1% per year. Through FY ‘20E, we forecast market value of debt to decrease 5% as a part of the capital structure from 35% to 29%. Likewise, market value equity increased 5% from 66% to 71%. Cost of Equity (Re) Our model uses the Capital Asset Pricing Model (CAPM) to determine the appropriate cost of equity. So, we forecasted the risk-free rate, market risk premium and beta for each year of the variable WACC calculation. We determined the risk-free rate by using the 2.73% yield-to-maturity on the 30-Year Treasury Bond as a proxy for an investment with the no risk. Because we are not able to determine an absolute value to forecast the market risk premium, we used the approximation constructed by Aswath Damodaran, a professor at New York University. We believe that this is the most effective market risk premium because the 4.57% serves as a reasonable compromise near The Street’s consensus. Finally, we calculated the initial beta value of 1.2152 by taking the five year average of Delta’s raw, unadjusted weekly betas from Bloomberg. We believe that as Delta pays off outstanding debt, their operational risks will decline, so we forecasted beta to decrease by 0.01 each year in the variable WACC calculation. We believe that in FY ‘20E, a beta of 1.18 is consistent with the risks of a company with a 71%/29% D/E capital structure. Cost of Debt (Rd) To determine the most accurate pretax cost of debt, we used the yield-to-maturity on the longest outstanding debt available. Thus, we used the 3.47% yield-to-maturity on Delta’s 22-year corporate bond as the pretax cost of debt for each year of the variable WACC calculation. WACC Combining the aforementioned assumptions, we determined our WACC to range from 6.24% in FY’ 16E to 6.31% in FY ‘20E. The implied constant WACC increased by an average of 0.014% per year. We used these costs of capital as discount factors throughout the model.

15 Important disclosures appear on the last page of this report.
Discounted Cash Flows (DCF) and Economic Profit (EP) The DCF and EP models generated slightly different intrinsic stock prices as a result of utilizing the variable WACC. So, we determined the intrinsic value to be $51.81, the average of the two models’ outputs, adjusted for the price on 4/19/2016. In comparison to Delta’s closing price on 4/18/2016 of $46.55, the models indicate just an 11.3% upside potential for capital gains. We believe that the moderate upside potential is due to the following three reasons. First, the likelihood for a future spike in COGS puts Delta in a tough position generate high free cash flows. Second, Delta reinvests a significant portion of revenues into turning over aircraft inventory, limiting free cash flows. Finally, Delta struggles to maintain high ROIC as a result of low profit margins while maintaining consistent capital expenditures. Dividend Discount Model (DDM) The DDM provides an intrinsic stock value of $33.77, adjusted for 4/19/2016. Clearly, this intrinsic value is an anomaly – not only in comparison to the other models, but industry competitors as well. Valuing Delta based on the DDM is inherently problematic because Delta’s dividend payout ratio is so low. As of 4/19/2016, Delta’s dividend payout ratio was only 0.967%. We are not in a position to forecast any dramatic increases in Delta’s dividend, so the DDM will likely continue to be a poor indicator of Delta’s stock value. Relative P/E The Relative P/E ratio generates an intrinsic stock value of $57.99. After removing the clear outliers in Allegiant Travel Company and JetBlue Airways Corporation, we compared the P/E ratios for American Airlines Group Inc., United Continental Holdings, Inc., Southwest Airlines Co. and Spirit Airlines. For FY ‘16E and FY ‘17E, the average P/E ratio among competitors as determined by their respective earnings per share (EPS) was 9.1 and 8.4, respectively. We applied the P/E multiple of 9.1 to our forecasted EPS for FY ‘16E of $6.40 which generated the intrinsic value of $57.99. We believe that this model is credible representation of the stock value because all airlines operate in very similar spaces. There is little room for differentiation within the airline industry, so the P/E multiples that other major airlines are trading at serve as a reasonable proxy for Delta’s stock value.
Sensitivity Analysis Constructing the complex model that we have, there are multiple key assumptions that have been mentioned. In order to understand the impact that these assumptions have on our intrinsic stock value as produced by our DCF and EP models, the following analysis regarding our sensitivity tables will display the monumental influence that seemingly miniscule changes in various assumptions can have on the intrinsic stock value.
Beta vs Market Risk Premium % The assumption of the market risk premium can be widely controversial depending on the type of analyst. Bullish analysts will have a greater risk premium and thus a higher cost of equity. A more bearish outlook lowers the cost of equity and therefore the discount rate, raising the share price in our model. Changes in Delta’s beta will also have a substantial effect on the discount rate in each of our valuation models. The risker the company becomes, the lower the intrinsic value of the firm. COGS CV (as a percentage of sales) vs SG&A CV (as a percentage of sales) The sensitivity comparison between two key cost assumptions will show the major valuation differences in various cost percentages. Fuel prices have historically been the highest cost for airlines. Forecasting cost of goods sold represents our beliefs on where oil prices are heading. Even a slight 2% increase in COGS will decrease the stock price by about $20. Changes in selling, general and administrative costs as a percentage of sales will have less of a dramatic impact on the valuation. PPE (as a percentage of sales) vs Marginal Tax Rate Forecasting property plant and equipment factors in future aircraft orders and terminal slots. Delta has a consistent number of planes being delivered in the next five years. Pressure from other airlines who are completely renovating their fleet causes Delta to do the same and look towards newer, more fuel efficient aircraft. Future government regulations could change our forecasted marginal tax rate, but we do not look for this to have a significant effect on our valuation models. Revenue Growth Rate CV vs Risk Free Rate Our most important assumption in the model is the continuing value revenue growth rate. It is also the variable that has the highest chance of changing in five years and is the most difficult to forecast. Recent growth for Delta has been tremendous for the company, but difficult to maintain. The global growth outlook for air travel may change if terrorist threats, such as ISIS, continue to grow. This would hurt all competitors in the aviation industry. The long term risk free also fluctuates greatly. Decisions the FED will make in the coming years about whether or not to raise the Federal Funds rate will have an immense impact on the risk free rate. 2016 Dividend vs Cost of Debt Our dividend discount valuation model mistakenly indicates Delta’s current stock price is severely overvalued. This is due to the extremely low dividend yield. Delta has been paying more back to their shareholders in recent years by increasing their dividend. If low jet fuel costs allow the aviation industry to reap favorable margins, look for dividends to increase across the board. The cost of debt will likely not waiver considerably, so the primary driver of this sensitivity analysis is Delta’s executives’ decisions to manipulate dividends in 2016 and beyond.

16 Important disclosures appear on the last page of this report.
References 1. "S&P Capital IQ NetAdvantage." S&P Capital IQ
NetAdvantage. N.p., 2015. Web. 02 Feb. 2016. 2. US. Bureau of Economic Analysis, Real Gross
Domestic Product [A191RL1A225NBEA], retrieved from FRED, Federal Reserve Bank of St. Louis, April 2, 2016.
3. University of Michigan, University of Michigan: Consumer Sentiment© [UMCSENT], retrieved from FRED, Federal Reserve Bank of St. Louis, April 2, 2016.
4. Board of Governors of the Federal Reserve System (US), 10-Year Treasury Constant Maturity Rate [DGS10], retrieved from FRED, Federal Reserve Bank of St. Louis, April 2, 2016.
5. (WSJ Guide to the 50 Economic Indicators That Really Matter, Simon Constable)
6. (https://www.eia.gov/forecasts/steo/report/global_oil.cfm)
7. Fisher Investments, Consumer Discretionary 8. US. Bureau of Labor Statistics, Civilian Unemployment
Rate [UNRATE], retrieved from FRED, Federal Reserve Bank of St. Louis, April 5, 2016.
9. Hepher, Tim. "Air Accidents at All-Time Low, Despite MH17, Germanwings Crashes." Insurance Journal News. Reuters, 14 Oct. 2015. Web. 17 Apr. 2016. <http://www.insurancejournal.com/news/international/2015/10/14/384791.htm>.
10. Ferguson, George. "Market Share War Goes Hot as Domestic Fares Fall | Bloomberg Intelligence | Bloomberg Professional." Bloomberg.com. Bloomberg, 30 Dec. 2015. Web. 17 Apr. 2016.
11. "S&P Capital IQ NetAdvantage." Airlines Industry Survey S&P Capital IQ NetAdvantage. N.p., 2015. Web. 02 Feb. 2016.
12. "January 2015 U.S. Airline Traffic Data | Bureau of Transportation Statistics." United States Department of Transportation. Office of the Assistant Secretary for Research and Technology, 16 Apr. 2015. Web. 03 Apr. 2016.
13. Cederholm, Teresa. "Bargaining Power of the Airline Industry's Customers and Suppliers." Yahoo Finance. Yahoo!, 30 Dec. 2014. Web. 18 Apr. 2016. <http://finance.yahoo.com/news/bargaining-power-airline-industry-customers-141114991.html>.
14. ComScore. "U.S. Travel E-commerce Revenue 2014 | Statistic." Statista. Statista 2016, 15 Mar. 2015. Web. 18 Apr. 2016. <http://www.statista.com/statistics/191145/travel-e-commerce-sales-in-the-united-states-since-2002/>.
15. Isidore, Chris. "Delta Pilots Seeking 40% Pay Hikes." CNNMoney. Cable News Network, 29 Mar. 2016. Web. <http://money.cnn.com/2016/03/29/news/companies/delta-pilots-pay-hike/>.
16. "Delta TechOps Wins." Delta News Hub. Delta Air Lines, Inc., 18 June 2008. Web. <http://news.delta.com/delta-techops-wins-%E2%80%9Ctop-shop%E2%80%9D-robert-e-fox-awards>.
17. Haider, Zeeshan. "Domestic Airlines in the US." IBISWorld. IBISWorld, Mar. 2016. Web. 17 Apr. 2016. <http://clients1.ibisworld.com/reports/us/industry/default.aspx?entid=1125>.
18. Levin, Matt. "What the World Was like the Last Time Oil Cost so Little." Houston Chronicle. Chron, 14 Jan. 2016. Web. <http://www.chron.com/business/article/The-last-time-oil-dropped-to-30-a-barrel-6757395.php>.
19. Wall, Robert. "Airbus Racks Up More 2014 Jet Orders Than Boeing." WSJ. The Wall Street Journal, 13 Jan. 2015. Web. 18 Apr. 2016. <http://www.wsj.com/articles/airbus-racks-up-more-2014-jet-orders-than-boeing-1421142005>.
20. "S&P Capital IQ NetAdvantage." Airlines Industry Survey S&P Capital IQ NetAdvantage. N.p., 2015. Web. 02 Feb. 2016.
21. Delta Air Lines, Inc. 2015 10-K 22. "Current Surcharges | Air Cargo Surcharges & Misc
Fees." Delta Cargo. Delta Air Lines, Inc., 5 Apr. 2016. Web. 5 Apr. 2016. <https://www.deltacargo.com/ProductsRates/Rates,SurchargesMiscellaneousFees/Surcharges.aspx>.
23. Hoang, Aileen. "The Differences Between Business vs. Leisure Travelers."E-Marketing Associates. N.p., 06 Oct. 2014. Web. <http://www.e-marketingassociates.com/understanding-differences-business-vs-leisure-travelers/>.
24. Dastin, Jeffrey. "US Airlines Tried to save Money on Fuel, and Now They're Regretting It." Business Insider. Business Insider, Inc, 22 Jan. 2016. Web. <http://www.businessinsider.com/r-us-airlines-rethink-hedges-as-oil-plunges-2016-1>.
25. Westcott, Richard. "Despite the Headlines Air Travel Is Safer than Ever." BBC News. N.p., 4 Feb. 2015. Web. <http://www.bbc.com/news/business-31133246>.
26. Stilwell, Victoria. "Consumer Spending Cooled in December as Americans Padded Savings." Bloomberg, 1 Feb. 2016. Web. <http://www.bloomberg.com/news/articles/2016-02-01/consumer-spending-cooled-in-december-as-american-padded-savings>.
27. "United, Delta Bet on Long Oil Slump." Crain's Chicago Business. N.p., 25 Nov. 2015. Web. <http://www.chicagobusiness.com/article/20151125/NEWS10/151129896/united-delta-bet-on-long-oil-slump>.
28. 2015 Q4 Delta Air Lines, Inc. Earnings Call. 29. "2015 North America Airline Satisfaction Study." J.D.
Power. McGraw Hill Financial, 13 May 2015. Web. <http://www.jdpower.com/press-releases/2015-north-america-airline-satisfaction-study>.
17 Important disclosures appear on the last page of this report.
Important Disclaimer This report was created by students enrolled in the Applied Equity Valuation (FIN:4250) class at the University of Iowa. The report was originally created to offer an internal investment recommendation for the University of Iowa Krause Fund and its advisory board. The report also provides potential employers and other interested parties an example of the students’ skills, knowledge and abilities. Members of the Krause Fund are not registered investment advisors, brokers or officially licensed financial professionals. The investment advice contained in this report does not represent an offer or solicitation to buy or sell any of the securities mentioned. Unless otherwise noted, facts and figures included in this report are from publicly available sources. This report is not a complete compilation of data, and its accuracy is not guaranteed. From time to time, the University of Iowa, its faculty, staff, students, or the Krause Fund may hold a financial interest in the companies mentioned in this report.

Delta Air Lines, Inc.Revenue Decomposition
Fiscal Years Ending Dec. 31 2013 2014 2015 2016E 2017E 2018E 2019E CV 2020E 2021E 2022EPassenger Revenue (MM)By GeographyDomestic $ 15,204 $ 17,017 $ 17,933 $ 18,125 $ 18,533 $ 19,154 $ 19,805 $ 20,488 $ 21,195 $ 21,926
% of Total Operating Revenue 40.25% 42.16% 44.06% 44.95% 45.43% 45.63% 45.86% 46.10% 46.34% 46.57%% Growth 7.57% 11.92% 5.38% 1.07% 2.25% 3.35% 3.40% 3.45% 3.45% 3.45%
Atlantic $ 5,657 $ 5,826 $ 5,548 $ 5,079 $ 4,903 $ 5,017 $ 5,125 $ 5,235 $ 5,348 $ 5,463 % of Total Operating Revenue 14.98% 14.43% 13.63% 12.60% 12.02% 11.95% 11.87% 11.78% 11.69% 11.60%% Growth 2.59% 2.99% -4.77% -8.46% -3.46% 2.33% 2.15% 2.15% 2.15% 2.15%
Pacific $ 3,561 $ 3,421 $ 3,002 $ 2,718 $ 2,660 $ 2,733 $ 2,811 $ 2,896 $ 2,983 $ 3,073 % of Total Operating Revenue 9.43% 8.48% 7.38% 6.74% 6.52% 6.51% 6.51% 6.52% 6.52% 6.53%% Growth -1.60% -3.93% -12.25% -9.47% -2.14% 2.75% 2.88% 3.01% 3.01% 3.01%
Latin America $ 2,112 $ 2,424 $ 2,415 $ 2,475 $ 2,596 $ 2,725 $ 2,848 $ 2,976 $ 3,110 $ 3,250 % of Total Operating Revenue 5.59% 6.01% 5.93% 6.14% 6.36% 6.49% 6.60% 6.70% 6.80% 6.90%% Growth 10.81% 14.77% -0.37% 2.49% 4.87% 5.00% 4.50% 4.50% 4.50% 4.50%
Total Mainline 26,534$ 28,688$ 28,898$ 28,396$ 28,691$ 29,629$ 30,589$ 31,596$ 32,636$ 33,712$ % of Total Operating Revenue 70.25% 71.08% 71.00% 70.43% 70.33% 70.58% 70.84% 71.09% 71.35% 71.61%% Growth 5.41% 8.12% 0.73% 1.23% 1.04% 3.27% 3.24% 3.29% 3.29% 3.30%
Regional Carriers 6,408$ 6,266$ 5,884$ 5,766$ 5,823$ 5,940$ 6,059$ 6,180$ 6,303$ 6,429$ % of Total Operating Revenue 16.96% 15.52% 14.46% 14.30% 14.27% 14.15% 14.03% 13.91% 13.78% 13.66%% Growth -2.63% -2.22% -6.10% -2.01% 1.00% 2.00% 2.00% 2.00% 2.00% 2.00%
Total Passenger Revenue 32,942$ 34,954$ 34,782$ 34,162$ 34,514$ 35,569$ 36,648$ 37,775$ 38,939$ 40,141$ % of Total Operating Revenue 87.21% 86.60% 85.45% 84.73% 84.60% 84.74% 84.87% 85.00% 85.13% 85.27%% Growth 3.74% 6.11% -0.49% -1.78% 1.03% 3.06% 3.03% 3.08% 3.08% 3.09%
Other Operating RevenueCargo 937$ 934$ 813$ 794$ 810$ 826$ 843$ 860$ 877$ 894$
% of Total Operating Revenue 2.48% 2.31% 2.00% 1.97% 1.99% 1.97% 1.95% 1.93% 1.92% 1.90%% Growth -5.35% -0.32% -12.96% -2.31% 2.00% 2.00% 2.00% 2.00% 2.00% 2.00%
Other 3,894$ 4,474$ 5,109$ 5,364$ 5,472$ 5,581$ 5,693$ 5,807$ 5,923$ 6,041$ % of Total Operating Revenue 10.31% 11.08% 12.55% 13.30% 13.41% 13.30% 13.18% 13.07% 12.95% 12.83%% Growth -0.82% 14.89% 14.19% 5.00% 2.00% 2.00% 2.00% 2.00% 2.00% 2.00%
Total Operating Revenue 37,773$ 40,362$ 40,704$ 40,321$ 40,796$ 41,976$ 43,184$ 44,442$ 45,739$ 47,077$ % of Total Operating Revenue 100.00% 100.00% 100.00% 100.00% 100.00% 100.00% 100.00% 100.00% 100.00% 100.00%% Growth 3.01% 6.85% 0.85% -0.94% 1.18% 2.89% 2.88% 2.91% 2.92% 2.93%
Other Financial/Statistical DataAvailable Seat Miles (MM) 232,740 239,676 246,764 254,062 261,683 269,534 277,620 285,949 294,527 303,363
% Growth 1.01% 2.98% 2.96% 3.00% 3.00% 3.00% 3.00% 3.00% 3.00% 3.00%Load Factor 83.8% 84.7% 84.9% 85.15% 85.41% 85.67% 85.92% 86.18% 86.44% 86.70%
% Growth 0.00% 1.07% 0.24% 0.30% 0.30% 0.30% 0.30% 0.30% 0.30% 0.30%Revenue Passenger Miles (MM) 194,988 202,925 209,625 213,818 218,094 222,456 226,905 231,443 236,072 240,793
% Growth 1.04% 4.07% 3.30% 2.00% 2.00% 2.00% 2.00% 2.00% 2.00% 2.00%Passgr Rev per Avail Seat Mile (Cents) 14.15 14.58 14.10 14.24 14.38 14.67 14.96 15.26 15.57 15.88
% Growth 2.69% 3.04% -3.29% 1.00% 1.00% 2.00% 2.00% 2.00% 2.00% 2.00%

Delta Air Lines, Inc.Income Statement
Fiscal Years Ending Dec. 31 2013 2014 2015 2016E 2017E 2018E 2019E 2020E 2021E 2022ESales 37,638 40,204 40,506 40,321 40,796 41,976 43,184 44,442 45,739 47,077 COGS 29,177 30,172 26,621 26,612 28,557 32,322 33,251 34,220 35,219 36,249 Gross Profit 8,461 10,032 13,885 13,709 12,239 9,655 9,932 10,222 10,520 10,828 Depreciation 1,588 1,716 1,817 1,382 1,420 1,458 1,496 1,536 1,577 1,620 Amortization of Intangibles 70 55 18 17 17 17 17 17 16 16 Gross Income 6,803 8,261 12,050 12,310 10,801 8,180 8,419 8,669 8,927 9,192 SG&A Expense 1,603 1,700 1,672 1,734 1,754 1,805 1,857 1,911 1,967 2,024 Other Operating Expense 2,026 1,797 1,998 1,814 1,836 1,889 1,943 2,000 2,058 2,118 EBIT (Operating Income) 3,174 4,764 8,380 8,761 7,211 4,486 4,619 4,758 4,902 5,049 Nonoperating Interest Income 0 0 0 - - - - - - - Other Income (Expense) 114 45 8 - - - - - - - Interest Expense 852 619 481 289 260 234 210 189 170 153 Unusual Expense - Net (91) 3,118 750 806 816 840 864 889 915 942 Pretax Income 2,527 1,072 7,157 7,666 6,136 3,413 3,545 3,680 3,817 3,954 Income Tax Expense (8,013) 413 2,631 2,837 2,270 1,263 1,312 1,362 1,412 1,463 Net Income 10,540 659 4,526 4,830 3,866 2,150 2,233 2,318 2,405 2,491
Earnings Per ShareBasic 12.41 0.79 5.68 6.40 5.40 3.00 3.11 3.23 3.35 3.46 Dividends per share 0.12 0.30 0.45 0.54 0.59 0.60 0.61 0.61 0.62 0.62
Weighted Average Shares OutstandingBasic 849 836 797 755 716 717 718 718 719 719

Delta Air Lines, Inc.Cash Flow Statement
Fiscal Years Ending Dec. 31 2008 2009 2010 2011 2012 2013 2014 2015
Net Income / Starting Line (8,922) (1,237) 593 854 1,009 10,540 659 4,526 Depreciation, Depletion & Amortization 1,266 1,536 1,511 1,523 1,565 1,658 1,771 1,835 Deferred Taxes & Investment Tax Credit (119) (329) 9 (2) 17 (7,991) 414 2,581 Other Funds 7,910 720 441 302 (263) (447) 2,654 (2,357) Funds from Operations 135 690 2,554 2,677 2,328 3,760 5,498 6,585 Changes in Working Capital (1,842) 689 278 157 148 513 (613) 1,335 Receivables (416) 147 (141) (100) (116) 90 (1,224) 750 Inventories -- -- -- -- (451) (87) 172 155 Accounts Payable (1,073) 143 516 303 899 213 228 (201) Other Assets/Liabilities (353) 399 (97) (46) (184) 297 211 631 Net Operating Cash Flow (1,707) 1,379 2,832 2,834 2,476 4,273 4,885 7,920
Capital Expenditures (1,522) (1,202) (1,342) (1,254) (1,968) (2,568) (2,249) (2,945) Net Assets from Acquisitions -- -- - - -- - - (276) Sale of Fixed Assets & Businesses 154 100 36 - -- -- -- --Purchase of Investments 92 -- 730 1,078 958 1,319 1,795 1,498 Sale/Maturity of Investments -- 157 - 844 1,019 1,117 1,533 739 Other Funds 3,058 (63) 10 (10) (55) 14 48 25 Net Investing Cash Flow 1,598 (1,008) (2,026) (1,498) (1,962) (2,756) (2,463) (3,955)
Cash Dividends Paid - - - - - (102) (251) (359) Repurchase of Common & Preferred Stk. - - - - - (250) (1,100) (2,200) Sale of Common & Preferred Stock 192 - - - - - - - Issuance/Reduction of Debt, Net 536 75 (2,592) (1,777) (940) (1,193) (1,908) (1,520) Change in Current Debt (300) - - - - - -- --Change in Long-Term Debt 836 75 (2,592) (1,777) (940) (1,193) (1,908) (1,520) Issuance of Long-Term Debt 2,132 2,966 1,130 2,395 1,924 268 1,020 1,038 Reduction in Long-Term Debt (1,296) (2,891) (3,722) (4,172) (2,864) (1,461) (2,928) (2,558) Other Funds 988 (94) 71 206 185 225 19 (9) Net Financing Cash Flow 1,716 (19) (2,521) (1,571) (755) (1,320) (3,240) (4,088) Net Change in Cash 1,607 352 (1,715) (235) (241) 197 (818) (123)
Operating Activities
Investing Activities
Financing Activities

Delta Air Lines, Inc.Balance Sheet
Fiscal Years Ending Dec. 31 2013 2014 2015 2016E 2017E 2018E 2019E 2020E 2021E 2022E
Cash 2,966 2,088 1,972 809 645 1,039 1,582 2,275 3,108 4,076 Total Short Term Investments 959 2,295 3,452 3,474 3,496 3,518 3,540 3,562 3,585 3,607 Short-Term Receivables 1,609 3,222 2,139 2,016 2,040 2,099 2,159 2,222 2,287 2,354 Inventories 1,063 852 697 806 816 840 864 889 915 942 Other Current Assets 3,054 4,008 796 2,016 2,040 2,099 2,159 2,222 2,287 2,354 Total Current Assets 9,651 12,465 9,056 9,121 9,037 9,594 10,303 11,170 12,181 13,332 Property, Plant & Equipment 29,646 31,269 33,910 35,926 37,966 40,065 42,224 44,446 46,733 49,087 (Accumulated Depreciation) 7,792 9,340 10,871 12,253 13,674 15,131 16,627 18,163 19,740 21,360 PPE, net 21,854 21,929 23,039 23,673 24,292 24,933 25,597 26,283 26,993 27,727 Total Investments and Advances - 118 155 121 122 126 130 133 137 141 Net Goodwill 9,794 9,794 9,794 9,794 9,794 9,794 9,794 9,794 9,794 9,794 Net Other Intangibles 4,658 4,603 4,861 4,844 4,827 4,810 4,793 4,776 4,760 4,744 Deferred Tax Assets 12,134 4,320 4,956 5,006 5,056 5,106 5,157 5,209 5,261 5,314 Other Assets 1,303 892 1,273 1,210 1,224 1,259 1,296 1,333 1,372 1,412 Total Assets 59,394 54,121 53,134 53,768 54,352 55,622 57,069 58,698 60,498 62,465
ST Debt & Curr. Portion LT Debt 1,547 1,216 1,563 1,401 1,261 1,134 1,021 919 827 744 Accounts Payable 2,300 2,622 2,743 2,621 2,652 2,728 2,807 2,889 2,973 3,060 Income Tax Payable 673 - - - - - - - - - Accrued Salaries & Benefits 1,926 2,266 3,195 2,167 2,193 2,256 2,321 2,389 2,458 2,530 Air Traffic Liability 4,122 4,296 4,503 4,435 4,488 4,617 4,750 4,889 5,031 5,178 Frequent Flyer Deferred Revenue 1,861 1,580 1,635 1,814 1,836 1,889 1,943 2,000 2,058 2,118 Other Accrued Liabilities 1,121 2,127 1,306 1,411 1,428 1,469 1,511 1,555 1,601 1,648 Fuel Card Obligations 602 - - - - - - - - - Hedge Derivatives Liability - 2,772 2,581 1,814 1,836 1,889 1,943 2,000 2,058 2,118 Total Current Liabilities 14,152 16,879 17,526 15,664 15,692 15,984 16,297 16,640 17,007 17,398 Long-Term Debt 9,795 8,561 6,766 6,089 5,480 4,932 4,439 3,995 3,596 3,236 Pension, Postretirement and Related Benefits 12,392 15,138 13,855 12,747 11,727 10,789 9,926 9,132 8,401 7,729 Deferred Tax Liabilities 7,142 - - - - - - - - - Other Liabilities 1,711 2,128 1,891 2,822 2,856 2,938 3,023 3,111 3,202 3,295 Frequent Flyer Deferred Revenue 2,559 2,602 2,246 2,419 2,448 2,519 2,591 2,667 2,744 2,825 Total Liabilities 47,751 45,308 42,284 39,742 38,203 37,162 36,276 35,544 34,950 34,483
Common Equity and Additional Paid-In Capital 13,982 12,981 10,875 10,883 10,891 10,899 10,907 10,915 10,923 10,931 Retained Earnings 3,049 3,456 7,623 12,045 15,485 17,205 19,004 20,882 22,843 24,885 Accumulated Other Comprehensive Income - (16) (61) (61) (61) (61) (61) (61) (61) (61) Other Appropriated Reserves (Pension) (5,130) (7,295) (7,214) (6,493) (5,843) (5,259) (4,733) (4,260) (3,834) (3,450)Treasury Stock (258) (313) (373) (2,348) (4,323) (4,323) (4,323) (4,323) (4,323) (4,323)Total Shareholders' Equity 11,643 8,813 10,850 14,026 16,149 18,461 20,793 23,153 25,548 27,982 Total Liabilities & Shareholders' Equity 59,394 54,121 53,134 53,768 54,352 55,622 57,069 58,698 60,498 62,465
Assets
Liabilities & Shareholders' Equity
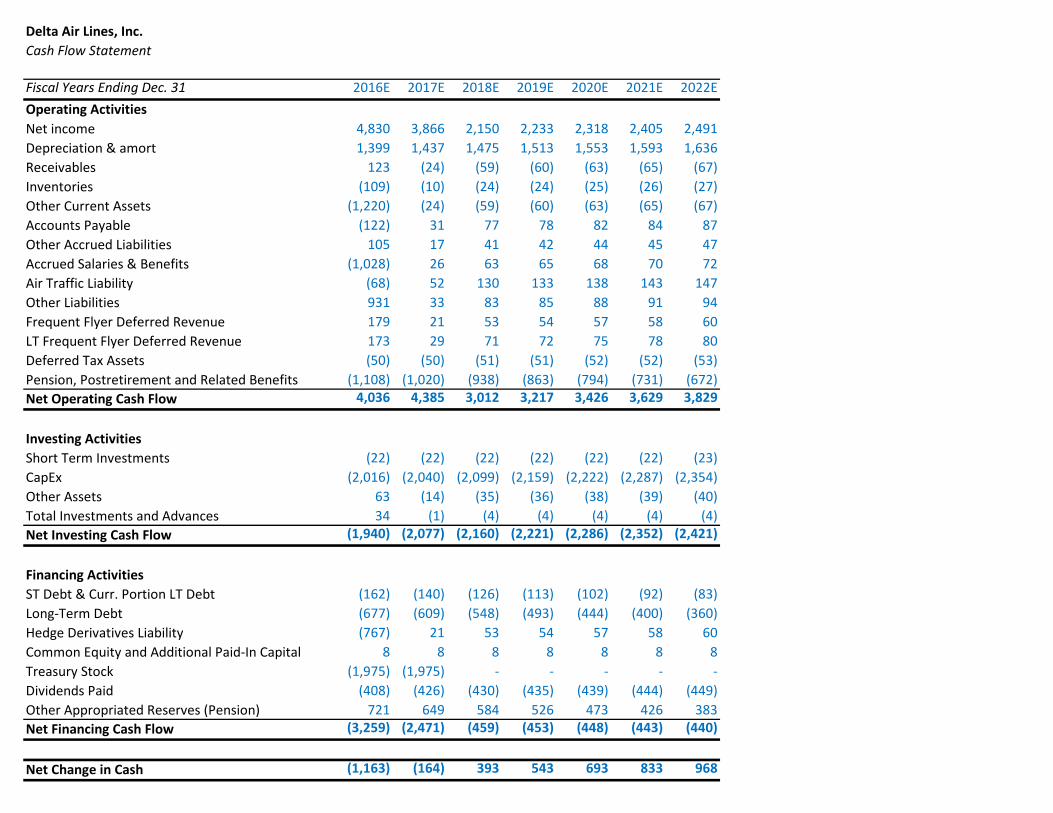
Delta Air Lines, Inc.Cash Flow Statement
Fiscal Years Ending Dec. 31 2016E 2017E 2018E 2019E 2020E 2021E 2022EOperating ActivitiesNet income 4,830 3,866 2,150 2,233 2,318 2,405 2,491 Depreciation & amort 1,399 1,437 1,475 1,513 1,553 1,593 1,636 Receivables 123 (24) (59) (60) (63) (65) (67)Inventories (109) (10) (24) (24) (25) (26) (27)Other Current Assets (1,220) (24) (59) (60) (63) (65) (67)Accounts Payable (122) 31 77 78 82 84 87 Other Accrued Liabilities 105 17 41 42 44 45 47 Accrued Salaries & Benefits (1,028) 26 63 65 68 70 72 Air Traffic Liability (68) 52 130 133 138 143 147 Other Liabilities 931 33 83 85 88 91 94 Frequent Flyer Deferred Revenue 179 21 53 54 57 58 60 LT Frequent Flyer Deferred Revenue 173 29 71 72 75 78 80 Deferred Tax Assets (50) (50) (51) (51) (52) (52) (53)Pension, Postretirement and Related Benefits (1,108) (1,020) (938) (863) (794) (731) (672)Net Operating Cash Flow 4,036 4,385 3,012 3,217 3,426 3,629 3,829
Investing ActivitiesShort Term Investments (22) (22) (22) (22) (22) (22) (23)CapEx (2,016) (2,040) (2,099) (2,159) (2,222) (2,287) (2,354)Other Assets 63 (14) (35) (36) (38) (39) (40)Total Investments and Advances 34 (1) (4) (4) (4) (4) (4)Net Investing Cash Flow (1,940) (2,077) (2,160) (2,221) (2,286) (2,352) (2,421)
Financing ActivitiesST Debt & Curr. Portion LT Debt (162) (140) (126) (113) (102) (92) (83)Long-Term Debt (677) (609) (548) (493) (444) (400) (360)Hedge Derivatives Liability (767) 21 53 54 57 58 60 Common Equity and Additional Paid-In Capital 8 8 8 8 8 8 8 Treasury Stock (1,975) (1,975) - - - - - Dividends Paid (408) (426) (430) (435) (439) (444) (449)Other Appropriated Reserves (Pension) 721 649 584 526 473 426 383 Net Financing Cash Flow (3,259) (2,471) (459) (453) (448) (443) (440)
Net Change in Cash (1,163) (164) 393 543 693 833 968

Delta Air Lines, Inc.Common Size Income Statement
Fiscal Years Ending Dec. 31 2013 2014 2015 2016E 2017E 2018E 2019E 2020E 2021E 2022ESales 100.00% 100.00% 100.00% 100.00% 100.00% 100.00% 100.00% 100.00% 100.00% 100.00%COGS 77.52% 75.05% 65.72% 66.00% 70.00% 77.00% 77.00% 77.00% 77.00% 77.00%Gross Profit 22.48% 24.95% 34.28% 34.00% 30.00% 23.00% 23.00% 23.00% 23.00% 23.00%Depreciation 4.22% 4.27% 4.49% 3.43% 3.48% 3.47% 3.46% 3.46% 3.45% 3.44%Amortization of Intangibles 0.19% 0.14% 0.04% 0.04% 0.04% 0.04% 0.04% 0.04% 0.03% 0.03%Gross Income 18.07% 20.55% 29.75% 30.53% 26.48% 19.49% 19.50% 19.51% 19.52% 19.53%SG&A Expense 4.26% 4.23% 4.13% 4.30% 4.30% 4.30% 4.30% 4.30% 4.30% 4.30%Other Operating Expense 5.38% 4.47% 4.93% 4.50% 4.50% 4.50% 4.50% 4.50% 4.50% 4.50%EBIT (Operating Income) 8.43% 11.85% 20.69% 21.73% 17.68% 10.69% 10.70% 10.71% 10.72% 10.73%Nonoperating Interest Income 0.00% 0.00% 0.00% 0.00% 0.00% 0.00% 0.00% 0.00% 0.00% 0.00%Other Income (Expense) 0.30% 0.11% 0.02% 0.00% 0.00% 0.00% 0.00% 0.00% 0.00% 0.00%Interest Expense 2.26% 1.54% 1.19% 0.72% 0.64% 0.56% 0.49% 0.43% 0.37% 0.33%Unusual Expense - Net -0.24% 7.76% 1.85% 2.00% 2.00% 2.00% 2.00% 2.00% 2.00% 2.00%Pretax Income 6.71% 2.67% 17.67% 19.01% 15.04% 8.13% 8.21% 8.28% 8.34% 8.40%Income Taxes -21.29% 1.03% 6.50% 7.03% 5.56% 3.01% 3.04% 3.06% 3.09% 3.11%Net Income 28.00% 1.64% 11.17% 11.98% 9.48% 5.12% 5.17% 5.22% 5.26% 5.29%

Delta Air Lines, Inc.Common Size Balance Sheet
Fiscal Years Ending Dec. 31 2013 2014 2015 2016E 2017E 2018E 2019E 2020E 2021E 2022E
Cash 7.88% 5.19% 4.87% 2.01% 1.58% 2.47% 3.66% 5.12% 6.79% 8.66%Total Short Term Investments 2.55% 5.71% 8.52% 8.62% 8.57% 8.38% 8.20% 8.02% 7.84% 7.66%Short-Term Receivables 4.27% 8.01% 5.28% 5.00% 5.00% 5.00% 5.00% 5.00% 5.00% 5.00%Inventories 2.82% 2.12% 1.72% 2.00% 2.00% 2.00% 2.00% 2.00% 2.00% 2.00%Other Current Assets 8.11% 9.97% 1.97% 5.00% 5.00% 5.00% 5.00% 5.00% 5.00% 5.00%Total Current Assets 25.64% 31.00% 22.36% 22.62% 22.15% 22.85% 23.86% 25.13% 26.63% 28.32%Property, Plant & Equipment 78.77% 77.78% 83.72% 89.10% 93.06% 95.45% 97.78% 100.01% 102.17% 104.27%(Accumulated Depreciation) 20.70% 23.23% 26.84% 30.39% 33.52% 36.05% 38.50% 40.87% 43.16% 45.37%PPE, net 58.26% 57.31% 58.44% 58.71% 59.55% 59.40% 59.27% 59.14% 59.01% 58.90%Total Investments and Advances 0.00% 0.29% 0.38% 0.30% 0.30% 0.30% 0.30% 0.30% 0.30% 0.30%Net Goodwill 26.02% 24.36% 24.18% 24.29% 24.01% 23.33% 22.68% 22.04% 21.41% 20.80%Net Other Intangibles 12.38% 11.45% 12.00% 12.01% 11.83% 11.46% 11.10% 10.75% 10.41% 10.08%Deferred Tax Assets 32.24% 10.75% 12.24% 12.41% 12.39% 12.16% 11.94% 11.72% 11.50% 11.29%Other Assets 3.46% 2.22% 3.14% 3.00% 3.00% 3.00% 3.00% 3.00% 3.00% 3.00%Total Assets 157.80% 134.62% 131.18% 133.35% 133.23% 132.51% 132.15% 132.08% 132.27% 132.69%
ST Debt & Curr. Portion LT Debt 4.11% 3.02% 3.86% 3.47% 3.09% 2.70% 2.36% 2.07% 1.81% 1.58%Accounts Payable 6.11% 6.52% 6.77% 6.50% 6.50% 6.50% 6.50% 6.50% 6.50% 6.50%Income Tax Payable 1.79% 0.00% 0.00% 0.00% 0.00% 0.00% 0.00% 0.00% 0.00% 0.00%Accrued Salaries & Benefits 5.12% 5.64% 7.89% 5.38% 5.38% 5.38% 5.38% 5.38% 5.38% 5.38%Air Traffic Liability 10.95% 10.69% 11.12% 11.00% 11.00% 11.00% 11.00% 11.00% 11.00% 11.00%Frequent Flyer Deferred Revenue 4.94% 3.93% 4.04% 4.50% 4.50% 4.50% 4.50% 4.50% 4.50% 4.50%Other Accrued Liabilities 2.98% 5.29% 3.22% 3.50% 3.50% 3.50% 3.50% 3.50% 3.50% 3.50%Fuel Card Obligations 1.60% 0.00% 0.00% 0.00% 0.00% 0.00% 0.00% 0.00% 0.00% 0.00%Hedge Derivatives Liability 0.00% 6.89% 6.37% 4.50% 4.50% 4.50% 4.50% 4.50% 4.50% 4.50%Total Current Liabilities 37.60% 41.98% 43.27% 38.85% 38.46% 38.08% 37.74% 37.44% 37.18% 36.96%Long-Term Debt 26.02% 21.29% 16.70% 15.10% 13.43% 11.75% 10.28% 8.99% 7.86% 6.87%Pension, Postretirement and Related Benefits 32.92% 37.65% 34.20% 31.61% 28.75% 25.70% 22.98% 20.55% 18.37% 16.42%Deferred Tax Liabilities 18.98% 0.00% 0.00% 0.00% 0.00% 0.00% 0.00% 0.00% 0.00% 0.00%Other Liabilities 4.55% 5.29% 4.67% 7.00% 7.00% 7.00% 7.00% 7.00% 7.00% 7.00%Frequent Flyer Deferred Revenue 6.80% 6.47% 5.54% 6.00% 6.00% 6.00% 6.00% 6.00% 6.00% 6.00%Total Liabilities 126.87% 112.70% 104.39% 98.56% 93.64% 88.53% 84.00% 79.98% 76.41% 73.25%
Common Equity and Additional Paid-In Capital 37.15% 32.29% 26.85% 26.99% 26.70% 25.96% 25.26% 24.56% 23.88% 23.22%Retained Earnings 8.10% 8.60% 18.82% 29.87% 37.96% 40.99% 44.01% 46.99% 49.94% 52.86%Accumulated Other Comprehensive Income 0.00% -0.04% -0.15% -0.15% -0.15% -0.15% -0.14% -0.14% -0.13% -0.13%Other Appropriated Reserves -13.63% -18.14% -17.81% -16.10% -14.32% -12.53% -10.96% -9.59% -8.38% -7.33%Treasury Stock -0.69% -0.78% -0.92% -5.82% -10.60% -10.30% -10.01% -9.73% -9.45% -9.18%Total Shareholders' Equity 30.93% 21.92% 26.79% 34.79% 39.58% 43.98% 48.15% 52.10% 55.86% 59.44%Total Liabilities & Shareholders' Equity 157.80% 134.62% 131.18% 133.35% 133.23% 132.51% 132.15% 132.08% 132.27% 132.69%
Assets
Liabilities & Shareholders' Equity

Delta Air Lines, Inc.Weighted Average Cost of Capital (WACC) Estimation
WACC = Re * (E/V) + Rd * (1-t) * (D/V) + Rpfd * (PFD/V)
Cost of Equity Beta (Bloomberg)Re = Rf + B * (E[Rm] - Rf) WeeklyRf 2.73% 1 Year 1.148E[Rm] - Rf 4.57% 2 Years 1.26Beta 1.2152 3 Years 1.292Re 8.28% 4 Years 1.234
5 Years 1.142
Cost of Debt Average 1.2152Rd (22 yr. DAL Corporate Bond) 3.47%
Cost of Preferred StockRpfd 0.00%
Market Value of EquityShares Outstanding 778.51Share Price $46.55E $36,240
Market Value of DebtShort-Term Debt 1,563$ Long-Term Debt 6,766$ Operating Leases 10,624$ D 18,953$
Market Value of Preferred StockPfd -$
DAL Market ValueV = E + D + Pfd $55,193
Weight of Equity (E/V) 65.66%Weight of Debt (D/V) 34.34%Weight of Pref. Stock (Pfd/V) 0Marginal Tax Rate 37.00%
WACC 6.19%

Delta Air Lines, Inc.Variable Weighted Average Cost of Capital (WACC) Estimation
Fiscal Year Ended Dec. 31 2015 2016E 2017E 2018E 2019E 2020ERisk Free 2.73% 2.73% 2.73% 2.73% 2.73% 2.73%Risk Premium 4.57% 4.57% 4.57% 4.57% 4.57% 4.57%Beta 1.22 1.21 1.20 1.19 1.18 1.18Cost of Equity 8.28% 8.24% 8.19% 8.15% 8.10% 8.12%
Debt Rating AA AA AA AA AA AAPre-Tax Cost of Debt 3.47% 3.47% 3.47% 3.47% 3.47% 3.47%Tax Rate 37% 37% 37% 37% 37% 37%After-Tax Cost of Debt 2.18% 2.18% 2.18% 2.18% 2.18% 2.18%
MV Weight of Equity 65.66% 67.00% 68.00% 69.00% 70.00% 71.00%MV Weight of Debt 34.34% 33.00% 32.00% 31.00% 30.00% 29.00%MV Weight of Pfd 0% 0% 0% 0% 0% 0%
Forward WACC 6.19% 6.24% 6.27% 6.30% 6.33% 6.40%
Discount Factor 1.0624 1.129008676 1.20011473 1.27603072 1.357702644
Implied Constant WACC 6.24% 6.25% 6.27% 6.28% 6.31%Discount Period 1 2 3 4 5

Delta Air Lines, Inc.Value Driver Estimation
Fiscal Years Ending Dec. 31 2013 2014 2015 2016E 2017E 2018E 2019E 2020E 2021E 2022EAssumptions:Marginal Tax Rate 37.60% 40.90% 37.00% 37% 37% 37% 37% 37% 37% 37%WACC 6.24% 6.24% 6.24% 6.24% 6.25% 6.27% 6.28% 6.31% 6.31% 6.31%Normal Cash 5.00% 5.00% 5.00% 5.00% 5.00% 5.00% 5.00% 5.00% 5.00% 5.00%Cost of Debt 3.47% 3.47% 3.47% 3.47% 3.47% 3.47% 3.47% 3.47% 3.47% 3.47%
NOPLAT ComputationEBITANet Sales 37,638$ 40,204$ 40,506$ 40,321$ 40,796$ 41,976$ 43,184$ 44,442$ 45,739$ 47,077$ -COGS (29,177)$ (30,172)$ (26,621)$ (26,612)$ (28,557)$ (32,322)$ (33,251)$ (34,220)$ (35,219)$ (36,249)$ -SG&A (1,603)$ (1,700)$ (1,672)$ (1,734)$ (1,754)$ (1,805)$ (1,857)$ (1,911)$ (1,967)$ (2,024)$ -Depreciation (1,588)$ (1,716)$ (1,817)$ (1,382)$ (1,420)$ (1,458)$ (1,496)$ (1,536)$ (1,577)$ (1,620)$ -Amortization (70)$ (55)$ (18)$ (17)$ (17)$ (17)$ (17)$ (17)$ (16)$ (16)$ -Other Op. Expenses (2,026)$ (1,797)$ (1,998)$ (1,814)$ (1,836)$ (1,889)$ (1,943)$ (2,000)$ (2,058)$ (2,118)$ +Implied Interest on Op Leases 392$ 330$ 367$ 378$ 388$ 399$ 409$ 420$ 432$ 443$ EBITA 3,566$ 5,094$ 8,747$ 9,140$ 7,600$ 4,885$ 5,028$ 5,178$ 5,334$ 5,493$
-Adjusted Taxes:Total Tax Provision (8,013)$ 413$ 2,631$ 2,837$ 2,270$ 1,263$ 1,312$ 1,362$ 1,412$ 1,463$ +Tax Shield on Interest Expense 320$ 253$ 178$ 107$ 96$ 86$ 78$ 70$ 63$ 57$ +Tax Shied on Implied Lease Interest 147$ 135$ 136$ 140$ 144$ 147$ 151$ 155$ 160$ 164$ +Tax Shield on Unusual Expense (34)$ 1,275$ 278$ 298$ 302$ 311$ 320$ 329$ 338$ 348$ -Tax Other Income (Expense) 43$ 18$ 3$ -$ -$ -$ -$ -$ -$ -$ -Tax on Non-Operating Interest Income -$ -$ -$ -$ -$ -$ -$ -$ -$ -$ Total Adjusted Taxes (7,623)$ 2,058$ 3,219$ 3,382$ 2,812$ 1,807$ 1,860$ 1,916$ 1,973$ 2,032$
+Change in Deferred TaxesDeferred Tax Assets 12,134$ 4,320$ 4,956$ 5,006$ 5,056$ 5,106$ 5,157$ 5,209$ 5,261$ 5,314$ Deferred Tax Liabilities 7,142$ -$ -$ -$ -$ -$ -$ -$ -$ -$ Deferred Tax, net (4,992)$ (4,320)$ (4,956)$ (5,006)$ (5,056)$ (5,106)$ (5,157)$ (5,209)$ (5,261)$ (5,314)$ Net Change in Deferred Taxes (7,039)$ 672$ (636)$ (50)$ (50)$ (51)$ (51)$ (52)$ (52)$ (53)$
NOPLAT 4,149$ 3,708$ 4,892$ 5,709$ 4,738$ 3,027$ 3,117$ 3,211$ 3,308$ 3,408$
Invested Capital ComputationOperating Current Assets:Normal Cash 148$ 104$ 99$ 40$ 32$ 52$ 79$ 114$ 155$ 204$ Accounts Receivable, net 1,609$ 3,222$ 2,139$ 2,016$ 2,040$ 2,099$ 2,159$ 2,222$ 2,287$ 2,354$ Inventory $ 1,063 $ 852 $ 697 $ 806 $ 816 $ 840 $ 864 $ 889 $ 915 $ 942 Other Current Assets $ 3,054 $ 4,008 $ 796 $ 2,016 $ 2,040 $ 2,099 $ 2,159 $ 2,222 $ 2,287 $ 2,354 Total Operating Current Assests $ 5,874 $ 8,186 $ 3,731 $ 4,879 $ 4,928 $ 5,089 $ 5,261 $ 5,447 $ 5,644 $ 5,853
Operating Current LiabilitiesLess: Accounts Payable 2,300$ 2,622$ 2,743$ 2,621$ 2,652$ 2,728$ 2,807$ 2,889$ 2,973$ 3,060$ Income Taxes Payable 673$ -$ -$ -$ -$ -$ -$ -$ -$ -$ Accrued Salaries & Benefits 1,926$ 2,266$ 3,195$ 3,195$ 3,195$ 3,195$ 3,195$ 3,195$ 3,195$ 3,195$ Air Traffic Liability 4,122$ 4,296$ 4,503$ 4,503$ 4,503$ 4,503$ 4,503$ 4,503$ 4,503$ 4,503$ Frequent Flyer Deferred Revenue 1,861$ 1,580$ 1,635$ 1,635$ 1,635$ 1,635$ 1,635$ 1,635$ 1,635$ 1,635$ Other Accrued Liabilities 1,723$ 2,127$ 1,306$ 1,306$ 1,306$ 1,306$ 1,306$ 1,306$ 1,306$ 1,306$ Fuel Card Obligations 602$ -$ -$ -$ -$ -$ -$ -$ -$ -$ Total Operating Current Liabilities 13,207$ 12,891$ 13,382$ 13,260$ 13,291$ 13,367$ 13,446$ 13,528$ 13,612$ 13,699$
Net Operating Working Capital (7,333)$ (4,705)$ (9,651)$ (8,381)$ (8,363)$ (8,278)$ (8,185)$ (8,081)$ (7,968)$ (7,846)$
+PPE, net 21,854$ 21,929$ 23,039$ 23,673$ 24,292$ 24,933$ 25,597$ 26,283$ 26,993$ 27,727$ +PV of Operating Lease Obligations 9,506$ 10,576$ 10,624$ 10,916$ 11,202$ 11,498$ 11,803$ 12,120$ 12,447$ 12,786$ +Net Other Intangibles 4,658$ 4,603$ 4,861$ 4,861$ 4,861$ 4,861$ 4,861$ 4,861$ 4,861$ 4,861$ +Other Assets 1,303$ 892$ 1,273$ 1,273$ 1,273$ 1,273$ 1,273$ 1,273$ 1,273$ 1,273$ -Frequent Flyer Deferred Revenue 2,559$ 2,602$ 2,246$ 2,419$ 2,448$ 2,519$ 2,591$ 2,667$ 2,744$ 2,825$ -Other Liabilities 1,711$ 2,128$ 1,891$ 2,822$ 2,856$ 2,938$ 3,023$ 3,111$ 3,202$ 3,295$ Invested Capital 25,718$ 28,566$ 26,009$ 27,100$ 27,962$ 28,830$ 29,735$ 30,678$ 31,660$ 32,681$
ROIC ComputationNOPLAT 4,149$ 3,708$ 4,892$ 5,709$ 4,738$ 3,027$ 3,117$ 3,211$ 3,308$ 3,408$ /Beginning Invested Capital 26,061$ 25,718$ 28,566$ 26,009$ 27,100$ 27,962$ 28,830$ 29,735$ 30,678$ 31,660$ ROIC 15.92% 14.42% 17.12% 21.95% 17.48% 10.82% 10.81% 10.80% 10.78% 10.76%
Economic Profit ComputationBeginning Invested Capital 26,061$ 25,718$ 28,566$ 26,009$ 27,100$ 27,962$ 28,830$ 29,735$ 30,678$ 31,660$ * (ROIC - WACC) 9.7% 8.2% 10.9% 15.7% 11.2% 4.6% 4.5% 4.5% 4.5% 4.5%Economic Profit 2,523$ 2,103$ 3,109$ 4,086$ 3,043$ 1,274$ 1,305$ 1,335$ 1,373$ 1,411$
Free Cash Flow ComputationNOPLAT 4,149$ 3,708$ 4,892$ 5,709$ 4,738$ 3,027$ 3,117$ 3,211$ 3,308$ 3,408$ - Change in Invested Capital (342)$ 2,848$ (2,557)$ 1,092$ 861$ 868$ 906$ 943$ 982$ 1,021$ Free Cash Flow 4,492$ 860$ 7,449$ 4,617$ 3,877$ 2,159$ 2,211$ 2,268$ 2,326$ 2,387$

Delta Air Lines, Inc.Discounted Cash Flow (DCF) and Economic Profit (EP) Valuation Models
Key Inputs: CV Growth 2.91% CV ROIC 10.80% WACC 6.19% Cost of Equity 8.28%
Fiscal Years Ending Dec. 31 2016E 2017E 2018E 2019E 2020E
DCF ModelNOPLAT 5,709 4,738 3,027 3,117 3,211 Beginning Invested Capital 26,009 27,100 27,962 28,830 29,735 Ending Invested Capital 27,100 27,962 28,830 29,735 30,678 CapEx 1,092 861 868 906 943 Free Cash Flow 4,617 3,877 2,159 2,211 2,268 ROIC 21.95% 17.48% 10.82% 10.81% 10.80%
FCF 4,617 3,877 2,159 2,211 2,268 Continuing Value 71,526 PV of FCF 4,346 3,434 1,799 1,733 56,054
Value of Operating Assets 67,365 +ST Investments 3,452 +Excess Cash 1,873 -Total Debt (8,329) -PV of Operating Leases (10,624) -PV of ESOP (173) -Underfunded Pension (13,855) Value of Equity 39,709 Shares Outstanding 778.51Intrinsic Value 12/31/2015 51.01$ Price Today (4/19/2016) 52.09$
EP ModelNOPLAT 5,709 4,738 3,027 3,117 3,211 Beginning Invested Capital 26,009 27,100 27,962 28,830 29,735 Ending Invested Capital 27,100 27,962 28,830 29,735 30,678 ROIC 21.95% 17.48% 10.82% 10.81% 10.80%Economic Profit 4,086 3,043 1,274 1,305 1,335 Continuting Value 41,225 PV of EP Discounted by WACC 3,846 2,695 1,061 1,023 32,307
PV of EP 40,932 +Beginning Invested Capital 26,009 Value of Operating Assets 66,941 +ST Investments 3,452 +Excess Cash 1,873 -Total Debt (8,329) -PV of Operating Leases (10,624) -PV of ESOP (173) -Underfunded Pension (13,855) Value of Equity 39,286 Shares Outstanding 778.51Intrinsic Value 12/31/2015 50.46$ Price Today (Date) 51.54$

Delta Air Lines, Inc.Dividend Discount Model (DDM)
Fiscal Years Ending Dec. 31 2016E 2017E 2018E 2019E 2020E
EPS 6.40$ 5.40$ 3.00$ 3.11$ 3.23$
Key Assumptions CV growth 2.91% CV ROE 10.55% Cost of Equity 8.28%
Future Cash Flows P/E Multiple (CV Year) 13.48 EPS (CV Year) 3.23$ Future Stock Price 43.51$ Dividends Per Share 0.54 0.59 0.60 0.61 0.61 Future Cash Flows
Discounted Cash Flows 0.50$ 0.51$ 0.47$ 0.44$ 31.65$
Intrinsic Value 33.07$ Price Adjustment for 4/19/16 33.77$

Delta Air Lines, Inc.Relative Valuation ModelsIndustry Competitors
EPS EPSTicker Company Price 2016E 2017E P/E 16 P/E 17AAL American Airlines Group Inc. $40.92 $6.07 $6.42 6.7 6.4 UAL United Continental Holdings, Inc. $56.98 $8.70 $9.04 6.5 6.3 LUV Southwest Airlines Co. $47.10 $4.27 $4.67 11.0 10.1 SAVE Spirit Airlines $50.05 $4.19 $4.54 11.9 11.0
Average 9.1 8.4
DAL Delta Air Lines, Inc. $46.55 $ 6.40 $ 5.40 7.3 8.6
Implied Value: Relative P/E (EPS16) $ 57.99 Relative P/E (EPS17) 45.57$

Delta Air Lines, Inc.Key Management Ratios
Fiscal Years Ending Dec. 31 2013 2014 2015 2016E 2017E 2018E 2019E 2020E 2021E 2022E
Liquidity RatiosCurrent Ratio Current Assets/Current Liabilities 0.68 0.74 0.52 0.58 0.58 0.60 0.63 0.67 0.72 0.77Quick Ratio (CA-Inventories)/CL 0.61 0.69 0.48 0.53 0.52 0.55 0.58 0.62 0.66 0.71Cash Ratio (Cash + Marketable Sec)/CL 0.28 0.26 0.31 0.27 0.26 0.29 0.31 0.35 0.39 0.44
Activity or Asset-Management RatiosAir Line Inventory Turnover Passenger CoGS/Avg. Inventory 27.97 31.51 34.37 35.40 35.21 39.05 39.05 39.05 39.05 39.06Receivables Turnover Sales/Avg. A/R 22.80 16.64 15.11 19.41 20.12 20.29 20.28 20.29 20.29 20.29Total Asset Turnover Sales/Avg. Total Assets 0.72 0.71 0.76 0.75 0.75 0.76 0.77 0.77 0.77 0.77
Financial Leverage RatiosDebt to Equity Ratio Total Debt/Shareholder's Equity 0.97 1.11 0.77 0.53 0.42 0.33 0.26 0.21 0.17 0.14Debt Ratio Total Liabilities/Total Assets 0.80 0.84 0.80 0.74 0.70 0.67 0.64 0.61 0.58 0.55Interest Coverage Ratio Operating Income/Interest Expense 3.73 7.70 17.42 30.34 27.77 19.20 21.96 25.13 28.77 32.93
Profitability RatiosReturn on Equity Ratio Net Income/Avg.Shareholders Equity 221.61% 6.44% 46.04% 38.83% 25.62% 12.42% 11.38% 10.55% 9.87% 9.31%Return on Assets Net Income/Avg. Total Assets 20.28% 1.16% 8.44% 9.04% 7.15% 3.91% 3.96% 4.01% 4.03% 4.05%Cash Flow Margin Net Op. Cash Flow/Passenger Revenue 12.97% 13.98% 22.77% 11.82% 12.70% 8.47% 8.78% 9.07% 9.32% 9.54%
Payout Policy RatiosPayout Ratio Dividends Per Share/EPS 0.97% 37.97% 7.92% 8.44% 11.01% 20.01% 19.47% 18.96% 18.47% 18.02%Dividend Coverage Ratio EPS/Dividends Per Share 103.4 2.6 12.6 11.8 9.1 5.0 5.1 5.3 5.4 5.5

Beta CV Revenue Growth$52.09 1.0152 1.1152 1.2152 1.3152 1.4152 $52.09 1.91% 2.41% 2.91% 3.41% 3.91%
4.47% 70.97 61.72 54.16 47.87 42.55 2.53% 44.04 48.82 55.13 63.82 76.554.52% 69.66 60.56 53.11 46.92 41.67 2.63% 43.03 47.59 53.58 61.77 73.66
Risk Prem 4.57% 68.39 59.42 52.09 45.98 40.82 Rf rate 2.73% 42.05 46.41 52.09 59.82 70.944.62% 67.15 58.32 51.09 45.07 39.98 2.83% 41.10 45.26 50.66 57.96 68.374.67% 65.94 57.24 50.12 44.19 39.17 2.93% 40.18 44.15 49.29 56.18 65.94
COGS CV Dividend 2016$52.09 72% 75% 77% 79% 81% 33.77$ 0.34 0.44 0.54 0.64 0.74
3.90% 102.52 74.64 56.05 37.47 18.88 2.467% 33.39 33.86 34.32 34.79 35.264.10% 100.54 72.66 54.07 35.49 16.90 2.967% 33.11 33.58 34.05 34.51 34.98
SGA CV 4.30% 98.56 70.68 52.09 33.50 14.92 Rd rate 3.467% 32.84 33.30 33.77 34.24 34.714.50% 96.58 68.70 50.11 31.52 12.93 3.967% 32.56 33.03 33.50 33.96 34.434.70% 94.60 66.71 48.13 29.54 10.95 4.467% 32.28 32.75 33.22 33.69 34.15
PPE % of Sales$52.09 0.03 0.04 0.05 0.06 0.0735.00% 66.25 60.54 54.83 49.13 43.4236.00% 64.82 59.14 53.46 47.79 42.11
Tax Rate 37.00% 63.38 57.74 52.09 46.44 40.8038.00% 61.95 56.34 50.72 45.10 39.4939.00% 60.52 54.93 49.35 43.76 38.17

Present Value of Operating Lease Obligations (2015) Present Value of Operating Lease Obligations (2014) Present Value of Operating Lease Obligations (2013)
Operating Operating OperatingFiscal Years Ending Dec. 31 Leases Fiscal Years Ending Dec. 31 Leases Fiscal Years Ending 60.5561510448647 Leases2016 1583 2015 1707 2014 14292017 1440 2016 1493 2015 13562018 1307 2017 1323 2016 11862019 1158 2018 1120 2017 10262020 1053 2019 929 2018 831Thereafter 6220 Thereafter 6169 Thereafter 5666Total Minimum Payments 12761 Total Minimum Payments 12741 Total Minimum Payments 11494Less: Interest 2137 Less: Interest 2165 Less: Interest 1988PV of Minimum Payments 10624 PV of Minimum Payments 10576 PV of Minimum Payments 9506

Effects of ESOP Exercise and Share Repurchases on Common Stock Balance Sheet Account and Number of Shares Outstanding
Number of Options Outstanding (shares): 5,300,000Average Time to Maturity (years): 10.00Expected Annual Number of Options Exercised: 530,000
Current Average Strike Price: 15.05$ Cost of Equity: 8.28%Current Stock Price: $46.55
2016E 2017E 2018E 2019E 2020E 2021E 2022EIncrease in Shares Outstanding: 530,000 530,000 530,000 530,000 530,000 530,000 530,000Average Strike Price: 15.05$ 15.05$ 15.05$ 15.05$ 15.05$ 15.05$ 15.05$ Increase in Common Stock Account: 7,976,500 7,976,500 7,976,500 7,976,500 7,976,500 7,976,500 7,976,500
Change in Treasury Stock 1,975,000,000 1,975,000,000 0 0 0 0 0Expected Price of Repurchased Shares: 46.55$ 50.41$ 54.58$ 59.10$ 64.00$ 69.30$ 75.04$ Number of Shares Repurchased: 42,427,497 39,181,880 - - - - -
Shares Outstanding (beginning of the year) 797,000,000 755,102,503 716,450,622 716,980,622 717,510,622 718,040,622 718,570,622Plus: Shares Issued Through ESOP 530,000 530,000 530,000 530,000 530,000 530,000 530,000Less: Shares Repurchased in Treasury 42,427,497 39,181,880 - - - - - Shares Outstanding (end of the year) 755,102,503 716,450,622 716,980,622 717,510,622 718,040,622 718,570,622 719,100,622

VALUATION OF OPTIONS GRANTED IN ESOP
Ticker Symbol DALCurrent Stock Price $46.55Risk Free Rate 2.73%Current Dividend Yield 0.97%Annualized St. Dev. of Stock Returns 38.80%
Average Average B-S ValueRange of Number Exercise Remaining Option of OptionsOutstanding Options of Shares Price Life (yrs) Price GrantedRange 1 5,300,000 15.05 10.00 32.57$ 172,608,833$ Total 5,300,000 15.05$ 10.00 36.66$ 172,608,833$