delta electronics (thailand) public company limited and
TRANSCRIPT

Delta Electronics (Thailand) Public Company Limited and its subsidiaries Report and consolidated financial statements 31 December 2020

Independent Auditor's Report To the Shareholders of Delta Electronics (Thailand) Public Company Limited
Opinion
I have audited the accompanying consolidated financial statements of Delta Electronics
(Thailand) Public Company Limited and its subsidiaries (the Group), which comprise the
consolidated statement of financial position as at 31 December 2020, and the related consolidated
statements of comprehensive income, changes in shareholders’ equity and cash flows for the
year then ended, and notes to the consolidated financial statements, including a summary of
significant accounting policies, and have also audited the separate financial statements of Delta
Electronics (Thailand) Public Company Limited for the same period.
In my opinion, the financial statements referred to above present fairly, in all material respects,
the financial position of Delta Electronics (Thailand) Public Company Limited and its subsidiaries
and of Delta Electronics (Thailand) Public Company Limited as at 31 December 2020, their
financial performance and cash flows for the year then ended in accordance with Thai Financial
Reporting Standards.
Basis for Opinion
I conducted my audit in accordance with Thai Standards on Auditing. My responsibilities under
those standards are further described in the Auditor’s Responsibilities for the Audit of the
Financial Statements section of my report. I am independent of the Group in accordance with the
Code of Ethics for Professional Accountants as issued by the Federation of Accounting
Professions as relevant to my audit of the financial statements, and I have fulfilled my other
ethical responsibilities in accordance with the Code. I believe that the audit evidence I have
obtained is sufficient and appropriate to provide a basis for my opinion.

2
Key Audit Matters
Key audit matters are those matters that, in my professional judgement, were of most significance
in my audit of the financial statements of the current period. These matters were addressed in the
context of my audit of the financial statements as a whole, and in forming my opinion thereon,
and I do not provide a separate opinion on these matters.
I have fulfilled the responsibilities described in the Auditor’s Responsibilities for the Audit of the
Financial Statements section of my report, including in relation to these matters. Accordingly, my
audit included the performance of procedures designed to respond to my assessment of the risks
of material misstatement of the financial statements. The results of my audit procedures,
including the procedures performed to address the matters below, provide the basis for my audit
opinion on the accompanying financial statements as a whole.
Key audit matters and how audit procedures respond to each matter are described below.
Revenue recognition
Revenue from sales of goods is one of the Company’s significant accounts because the amounts
of revenue recorded would directly affect the Company’s profit or loss for the year. Moreover,
the Company has a large number of customers with a variety of different commercial terms.
There are therefore risks with respect to the amount and timing of revenue recognition. For this
reason, I have paid particular attention to the Company’s recognition of revenue from sales of
goods in order to ensure that the revenue is recorded correctly and in accordance with the
relevant accounting standards.
I have examined the Company’s revenue recognition by gaining an understanding and evaluating
the effectiveness of the Company’s internal controls with respect to revenue cycle. On a sampling
basis, I also examined supporting documents for sales transactions occurring during the year and
near the end of the accounting period. In addition, I reviewed credit notes issued by the Company
to its customers after the period-end and performed analytical review procedures on the sales
account to identify possible irregularities in sales transactions throughout the period.

3
Provision for diminution in value of inventory
Estimating the net realisable value of inventory, as disclosed in the Note 10 to the financial
statements, is an area of significant management judgement, and the inventories of the Company
are high technology products, which become obsolete faster than some other products. There is
a risk with respect to the amount of provision set aside for diminution in the value of inventory.
I assessed and tested the Company’s internal controls relevant to the determination of provision
for diminution in the value of inventory by making enquiry of responsible executives, gaining an
understanding of the controls and selecting representative samples to test the operation of the
designed controls and I also assessed the method and the assumption applied by management
in determining such provision by gaining an understanding of the basis applied in determining the
provision for diminution in value of inventory, and reviewing the consistency of the application of
that basis. In addition, I compared the data on inventory aging and inventory movement to
identify product lines with indicators of lower than normal inventory turnover. I also compared
details of net amount that an entity expects to realise from the sale of inventory after the date of
the financial statements with the cost of inventory for each product line.
Impairment of goodwill and patents
As at 31 December 2020, the Group had goodwill and patents amounting to Baht 437 million and
Baht 256 million, respectively. I have focused on the consideration of the impairment of the
goodwill and patents because the assessment of impairment of goodwill and patents is a
significant accounting estimate requiring the management to exercise a high degree of
judgement in identifying the cash generating units, estimating the cash inflows that are expected
to be generated from that group of assets in the future, and setting an appropriate discount rate.
There is thus a risks with respect to the amounts of goodwill and patents.
In auditing the impairment of goodwill and patents, I assessed the identified cash generating units
by gaining an understanding of and testing the key assumptions applied by the management in
preparing estimates of the cash flows expected to be realised from the group of assets and the
discount rate applied, making enquiry of responsible executives and comparing details with
sources of information about the Group and the industry.

4
Other Information
Management is responsible for the other information. The other information comprise the information included in annual report of the Group, but does not include the financial statements and my auditor’s report thereon. The annual report of the Group is expected to be made available to me after the date of this auditor’s report.
My opinion on the financial statements does not cover the other information and I do not express any form of assurance conclusion thereon.
In connection with my audit of the financial statements, my responsibility is to read the other information and, in doing so, consider whether the other information is materially inconsistent with the financial statements or my knowledge obtained in the audit or otherwise appears to be materially misstated.
When I read the annual report of the Group, if I conclude that there is a material misstatement therein, I am required to communicate the matter to those charged with governance for correction of the misstatement.
Responsibilities of Management and Those Charged with Governance for the Financial Statements
Management is responsible for the preparation and fair presentation of the financial statements in accordance with Thai Financial Reporting Standards, and for such internal control as management determines is necessary to enable the preparation of financial statements that are free from material misstatement, whether due to fraud or error.
In preparing the financial statements, management is responsible for assessing the Group’s ability to continue as a going concern, disclosing, as applicable, matters related to going concern and using the going concern basis of accounting unless management either intends to liquidate the Group or to cease operations, or has no realistic alternative but to do so.
Those charged with governance are responsible for overseeing the Group’s financial reporting process.
Auditor’s Responsibilities for the Audit of the Financial Statements
My objectives are to obtain reasonable assurance about whether the financial statements as a whole are free from material misstatement, whether due to fraud or error, and to issue an auditor’s report that includes my opinion. Reasonable assurance is a high level of assurance, but is not a guarantee that an audit conducted in accordance with Thai Standards on Auditing will always detect a material misstatement when it exists. Misstatements can arise from fraud or error and are considered material if, individually or in the aggregate, they could reasonably be expected to influence the economic decisions of users taken on the basis of these financial statements.
5
As part of an audit in accordance with Thai Standards on Auditing, I exercise professional
judgement and maintain professional skepticism throughout the audit. I also:
• Identify and assess the risks of material misstatement of the financial statements, whether
due to fraud or error, design and perform audit procedures responsive to those risks, and
obtain audit evidence that is sufficient and appropriate to provide a basis for my opinion.
The risk of not detecting a material misstatement resulting from fraud is higher than for
one resulting from error, as fraud may involve collusion, forgery, intentional omissions,
misrepresentations, or the override of internal control.
• Obtain an understanding of internal control relevant to the audit in order to design audit
procedures that are appropriate in the circumstances, but not for the purpose of
expressing an opinion on the effectiveness of the Group’s internal control.
• Evaluate the appropriateness of accounting policies used and the reasonableness of
accounting estimates and related disclosures made by management.
• Conclude on the appropriateness of management’s use of the going concern basis of
accounting and, based on the audit evidence obtained, whether a material uncertainty
exists related to events or conditions that may cast significant doubt on the Group’s ability
to continue as a going concern. If I conclude that a material uncertainty exists, I am
required to draw attention in my auditor’s report to the related disclosures in the financial
statements or, if such disclosures are inadequate, to modify my opinion. My conclusions
are based on the audit evidence obtained up to the date of my auditor’s report. However,
future events or conditions may cause the Group to cease to continue as a going concern.
• Evaluate the overall presentation, structure and content of the financial statements,
including the disclosures, and whether the financial statements represent the underlying
transactions and events in a manner that achieves fair presentation.
• Obtain sufficient appropriate audit evidence regarding the financial information of the
entities or business activities within the Group to express an opinion on the consolidated
financial statements. I am responsible for the direction, supervision and performance of
the group audit. I remain solely responsible for my audit opinion.
6
I communicate with those charged with governance regarding, among other matters, the planned
scope and timing of the audit and significant audit findings, including any significant deficiencies
in internal control that I identify during my audit.
I also provide those charged with governance with a statement that I have complied with relevant
ethical requirements regarding independence, and to communicate with them all relationships
and other matters that may reasonably be thought to bear on my independence, and where
applicable, related safeguards.
From the matters communicated with those charged with governance, I determine those matters
that were of most significance in the audit of the financial statements of the current period and are
therefore the key audit matters. I describe these matters in my auditor’s report unless law or
regulation precludes public disclosure about the matter or when, in extremely rare circumstances,
I determine that a matter should not be communicated in my report because the adverse
consequences of doing so would reasonably be expected to outweigh the public interest benefits
of such communication.
I am responsible for the audit resulting in this independent auditor’s report.
Preecha Arunnara
Certified Public Accountant (Thailand) No. 5800
EY Office Limited
Bangkok: 19 February 2021

Delta Electronics (Thailand) Public Company Limited and its subsidiaries
Statement of financial position
As at 31 December 2020
(Unit: Baht)
Note 31 December 2020 31 December 2019 1 January 2019 31 December 2020 31 December 2019
(Restated)
Assets
Current assets
Cash and cash equivalents 8 13,881,848,304 12,503,550,506 15,672,384,510 8,405,730,877 6,233,096,752
Current investments - 1,698,291 222,745,162 - -
Trade and other receivables 9 13,997,068,882 9,844,557,547 12,055,561,936 14,147,453,559 9,467,964,951
Inventories 10 12,655,361,505 9,003,852,766 9,603,867,537 8,536,087,510 5,745,784,778
Other current financial assets 11, 34.1 354,397,180 - - 148,964,927 -
Other current assets 12 1,563,053,284 1,292,479,456 1,164,774,243 403,684,552 307,190,209
Total current assets 42,451,729,155 32,646,138,566 38,719,333,388 31,641,921,425 21,754,036,690
Non-current assets
Deposits at bank with restrictions 51,051,970 49,713,553 55,047,683 - -
Investments in associated companies 13 - 464,294,219 536,334,270 - -
Investments in subsidiary companies 14 - - - 14,088,146,222 14,085,115,632
Investment properties 15 233,116,145 218,445,219 236,735,082 - -
Property, plant and equipment 16 12,724,465,674 11,408,273,772 7,962,183,623 6,895,756,473 6,647,546,003
Land-use rights - 197,730,522 220,027,996 - -
Right-of-use assets 21 376,638,347 - - - -
Goodwill 17 436,913,946 417,964,026 438,413,314 - -
Other intangible assets 18 495,955,145 413,753,297 476,225,161 61,711,479 633,148
Deferred tax assets 27 289,012,579 282,950,925 264,879,085 - -
Other non-current assets 160,044,829 156,090,282 135,505,166 3,279,842 3,417,111
Total non-current assets 14,767,198,635 13,609,215,815 10,325,351,380 21,048,894,016 20,736,711,894
Total assets 57,218,927,790 46,255,354,381 49,044,684,768 52,690,815,441 42,490,748,584
The accompanying notes are an integral part of the financial statements.
Separate financial statementsConsolidated financial statements

Delta Electronics (Thailand) Public Company Limited and its subsidiaries
Statement of financial position (continued)
As at 31 December 2020
(Unit: Baht)
Note 31 December 2020 31 December 2019 1 January 2019 31 December 2020 31 December 2019
(Restated)
Liabilities and shareholders' equity
Current liabilities
Trade and other payables 19 16,181,006,985 10,254,597,886 12,431,825,100 13,744,597,031 8,473,884,409
Income tax payable 188,697,947 50,621,512 89,618,118 49,174,299 -
Current portion of lease liabilities 21 72,788,807 - - - -
Short-term provisions 23 76,372,926 92,157,542 13,391,589 - -
Liabilities and provision from tax assessments 32.5.1 258,172,754 239,367,866 239,367,866 258,172,754 239,367,866
Derivative liabilities 33 674,961 - - - -
Other current liabilities 20 392,650,219 315,421,642 247,144,817 168,819,218 110,487,997
Total current liabilities 17,170,364,599 10,952,166,448 13,021,347,490 14,220,763,302 8,823,740,272
Non-current liabilities
Lease liabilities, net of current portion 21 107,791,790 - - - -
Deferred tax liabilities 27 114,184,020 114,013,746 144,452,338 - -
Provision for long-term employee benefits 22 1,542,246,168 1,427,499,000 1,234,247,093 465,244,322 444,707,410
Long-term provisions 23 420,587,558 388,761,256 512,118,709 302,036,053 288,553,746
Other non-current liabilities 256,325,004 190,752,886 24,246,916 1,356,203 1,085,000
Total non-current liabilities 2,441,134,540 2,121,026,888 1,915,065,056 768,636,578 734,346,156
Total liabilities 19,611,499,139 13,073,193,336 14,936,412,546 14,989,399,880 9,558,086,428
The accompanying notes are an integral part of the financial statements.
Consolidated financial statements Separate financial statements

Delta Electronics (Thailand) Public Company Limited and its subsidiaries
Statement of financial position (continued)
As at 31 December 2020
(Unit: Baht)
Note 31 December 2020 31 December 2019 1 January 2019 31 December 2020 31 December 2019
(Restated)
Shareholders' equity
Share capital
Registered
1,259,000,000 ordinary shares of Baht 1 each 1,259,000,000 1,259,000,000 1,259,000,000 1,259,000,000 1,259,000,000
Issued and fully paid
1,247,381,614 ordinary shares of Baht 1 each 1,247,381,614 1,247,381,614 1,247,381,614 1,247,381,614 1,247,381,614
Share premium 1,491,912,500 1,491,912,500 1,491,912,500 1,491,912,500 1,491,912,500
Difference from business combination under
common control 14 (1,339,694,088) (1,004,027,399) (1,004,027,399) - -
Retained earnings
Appropriated - Statutory reserve 24 125,900,000 125,900,000 125,900,000 125,900,000 125,900,000
Unappropriated 39,216,330,187 34,359,240,011 34,432,010,815 34,836,221,447 30,067,468,042
Other components of shareholders' equity (3,130,090,313) (3,210,182,797) (2,356,674,090) - -
Equity attributable to owners of the Company 37,611,739,900 33,010,223,929 33,936,503,440 37,701,415,561 32,932,662,156
Non-controlling interests of the subsidiary (4,311,249) (3,881,845) 4,416,522 - -
Equity attributable to shareholders of subsidiary before
business combination under common control 14 - 175,818,961 167,352,260 - -
Total shareholders' equity 37,607,428,651 33,182,161,045 34,108,272,222 37,701,415,561 32,932,662,156
Total liabilities and shareholders' equity 57,218,927,790 46,255,354,381 49,044,684,768 52,690,815,441 42,490,748,584
- - - - -
The accompanying notes are an integral part of the financial statements.
Directors
Separate financial statementsConsolidated financial statements

Delta Electronics (Thailand) Public Company Limited and its subsidiaries
Statement of comprehensive income
For the year ended 31 December 2020
(Unit: Baht)
Consolidated financial statements Separate financial statements
Note 2020 2019 2020 2019
(Restated)
Profit or loss:
Revenues
Sales 62,341,159,107 51,150,868,814 53,700,304,852 40,083,739,037
Service income 866,851,060 895,832,599 61,451,065 38,164,553
Other income
Gain on exchange 387,979,698 31,864,073 367,520,440 92,429,033
Others 507,435,992 429,059,272 229,066,406 333,583,660
Total revenues 64,103,425,857 52,507,624,758 54,358,342,763 40,547,916,283
Expenses
Cost of sales 47,244,199,937 40,833,458,598 39,680,428,319 31,581,614,290
Cost of services 844,937,682 577,496,840 50,640,046 22,554,782
Selling and distribution expenses 32.3.1 4,281,288,560 3,811,647,888 3,494,046,696 2,698,062,090
Administrative expenses 1,860,600,002 1,757,122,274 1,248,709,043 989,297,471
Research and development expenses 32.3.2 2,620,546,923 2,745,251,778 2,784,848,226 2,800,489,702
Loss on sales of investments in associated companies 13 95,125,078 - - -
Other expenses 68,405,643 46,819,035 56,721,720 132,303,253
Total expenses 57,015,103,825 49,771,796,413 47,315,394,050 38,224,321,588
Operating profit 7,088,322,032 2,735,828,345 7,042,948,713 2,323,594,695
Share of profit from investments in associated companies 13 60,845,793 24,849,891 - -
Finance income 111,437,887 237,971,248 39,084,114 95,527,873
Finance cost (1,167,766) (1,974,468) (13,330) -
Profit before income tax expenses 7,259,437,946 2,996,675,016 7,082,019,497 2,419,122,568
Income tax expenses 27 (188,809,535) (22,936,073) (49,174,299) -
Income tax expenses resulting from tax assessments 32.5.1 (18,804,888) - (18,804,888) -
Profit for the year 7,051,823,523 2,973,738,943 7,014,040,310 2,419,122,568
The accompanying notes are an integral part of the financial statements.

Delta Electronics (Thailand) Public Company Limited and its subsidiaries
Statement of comprehensive income (continued)
For the year ended 31 December 2020
(Unit: Baht)
Consolidated financial statements Separate financial statements
Note 2020 2019 2020 2019
(Restated)
Other comprehensive income:
Other comprehensive income to be reclassified
to profit or loss in subsequent periods:
Exchange differences on translation of
financial statements in foreign currency 111,515,519 (807,098,774) - -
Share of other comprehensive income from investments
in associated companies 13 (4,120,121) (25,024,541) - -
Other comprehensive income to be reclassified
to profit or loss in subsequent periods 107,395,398 (832,123,315) - -
Other comprehensive income not to be reclassified
to profit or loss in subsequent periods:
Actuarial losses - net of income tax (19,467,721) (163,750,063) - (40,687,554)
Share of other comprehensive income from investments
in associated companies 13 (6,358,191) (34,995,630) - -
Other comprehensive income not to be reclassified
to profit or loss in subsequent periods - net of income tax (25,825,912) (198,745,693) - (40,687,554)
Other comprehensive income for the year 81,569,486 (1,030,869,008) - (40,687,554)
Total comprehensive income for the year 7,133,393,009 1,942,869,935 7,014,040,310 2,378,435,014
Profit attributable to:
Equity holders of the Company 7,101,638,109 2,959,960,371 7,014,040,310 2,419,122,568
Non-controlling interests of the subsidiary (429,404) (8,298,367)
Shareholders of subsidiary before business combination
under common control (49,385,182) 22,076,939
7,051,823,523 2,973,738,943
Total comprehensive income attributable to:
Equity holders of the Company 7,182,469,565 1,942,701,601 7,014,040,310 2,378,435,014
Non-controlling interests of the subsidiary (429,404) (8,298,367)
Shareholders of subsidiary before business combination
under common control (48,647,152) 8,466,701
7,133,393,009 1,942,869,935
Earnings per share 29
Basic earnings per share
Profit attributable to equity holders of the Company 5.69 2.37 5.62 1.94
The accompanying notes are an integral part of the financial statements.

For the year ended 31 December 2020
(Unit: Baht)
Equity attributable
Share of other to shareholders of
Exchange differences comprehensive Total equity Equity attributable subsidiary before
Issued and Difference from business on translation of income from Total other attributable to to non-controlling business Total
fully paid combination under financial statements investments in components of owners of interests combination under shareholders'
share capital Share premium common control Appropriated Unappropriated in foreign currency associated companies shareholders' equity the Company of the subsidiary common control equity
Balance as at 1 January 2019 1,247,381,614 1,491,912,500 (1,004,027,399) 125,900,000 34,432,010,815 (2,447,379,266) 90,705,176 (2,356,674,090) 33,936,503,440 4,416,522 - 33,940,919,962
Cumulative effect of
business combination under
common control (Note 14) - - - - - - - - - - 167,352,260 167,352,260
Balance as at 1 January 2019
- as restated 1,247,381,614 1,491,912,500 (1,004,027,399) 125,900,000 34,432,010,815 (2,447,379,266) 90,705,176 (2,356,674,090) 33,936,503,440 4,416,522 167,352,260 34,108,272,222
Profit for the year - restated - - - - 2,959,960,371 - - - 2,959,960,371 (8,298,367) 22,076,939 2,973,738,943
Other comprehensive income for the year
- restated - - - - (163,750,063) (793,488,536) (60,020,171) (853,508,707) (1,017,258,770) - (13,610,238) (1,030,869,008)
Total comprehensive income for the year
- restated - - - - 2,796,210,308 (793,488,536) (60,020,171) (853,508,707) 1,942,701,601 (8,298,367) 8,466,701 1,942,869,935
Dividend paid (Note 25) - - - - (2,868,981,112) - - - (2,868,981,112) - - (2,868,981,112)
Balance as at 31 December 2019
- as restated 1,247,381,614 1,491,912,500 (1,004,027,399) 125,900,000 34,359,240,011 (3,240,867,802) 30,685,005 (3,210,182,797) 33,010,223,929 (3,881,845) 175,818,961 33,182,161,045
-
The accompanying notes are an integral part of the financial statements.
Other comprehensive income
Retained earnings
Delta Electronics (Thailand) Public Company Limited and its subsidiaries
Statement of changes in shareholders' equity
Consolidated financial statements
Equity attributable to shareholders of the Company
Other components of shareholders' equity

For the year ended 31 December 2020
(Unit: Baht)
Equity attributable
Share of other to shareholders of
Exchange differences comprehensive Total equity Equity attributable subsidiary before
Issued and Difference from business on translation of income from Total other attributable to to non-controlling business Total
fully paid combination under financial statements investments in components of owners of interests combination under shareholders'
share capital Share premium common control Appropriated Unappropriated in foreign currency associated companies shareholders' equity the Company of the subsidiary common control equity
Balance as at 1 January 2020 1,247,381,614 1,491,912,500 (1,004,027,399) 125,900,000 34,359,240,011 (3,240,867,802) 30,685,005 (3,210,182,797) 33,010,223,929 (3,881,845) - 33,006,342,084
Cumulative effect of
business combination under
common control (Note 14) - - - - - - - - - - 175,818,961 175,818,961
Balance as at 1 January 2020
- as restated 1,247,381,614 1,491,912,500 (1,004,027,399) 125,900,000 34,359,240,011 (3,240,867,802) 30,685,005 (3,210,182,797) 33,010,223,929 (3,881,845) 175,818,961 33,182,161,045
Profit for the year - - - - 7,101,638,109 - - - 7,101,638,109 (429,404) (49,385,182) 7,051,823,523
Other comprehensive income for the year - - - - (19,467,721) 110,777,489 (10,478,312) 100,299,177 80,831,456 - 738,030 81,569,486
Total comprehensive income for the year - - - - 7,082,170,388 110,777,489 (10,478,312) 100,299,177 7,182,469,565 (429,404) (48,647,152) 7,133,393,009
Acquisition cost of business combination
under common control (Note 14) - - (462,838,498) - - - - - (462,838,498) - - (462,838,498)
Attributable net book value from business
combination under common control
(Note 14) - - 127,171,809 - - - - - 127,171,809 - (127,171,809) -
Effect of change from sales of investment
in associated companies - - - - 20,206,693 - (20,206,693) (20,206,693) - - - -
Dividend paid (Note 25) - - - - (2,245,286,905) - - - (2,245,286,905) - - (2,245,286,905)
Balance as at 31 December 2020 1,247,381,614 1,491,912,500 (1,339,694,088) 125,900,000 39,216,330,187 (3,130,090,313) - (3,130,090,313) 37,611,739,900 (4,311,249) - 37,607,428,651
-
The accompanying notes are an integral part of the financial statements.
Retained earnings
Delta Electronics (Thailand) Public Company Limited and its subsidiaries
Statement of changes in shareholders' equity (continued)
Consolidated financial statements
Equity attributable to shareholders of the Company
Other components of shareholders' equity
Other comprehensive income

Delta Electronics (Thailand) Public Company Limited and its subsidiaries
Statement of changes in shareholders' equity (continued)
For the year ended 31 December 2020
(Unit: Baht)
Issued and Total
fully paid shareholders'
share capital Share premium Appropriated Unappropriated equity
Balance as at 1 January 2019 1,247,381,614 1,491,912,500 125,900,000 30,558,014,140 33,423,208,254
Profit for the year - - - 2,419,122,568 2,419,122,568
Other comprehensive income for the year - - - (40,687,554) (40,687,554)
Total comprehensive income for the year - - - 2,378,435,014 2,378,435,014
Dividend paid (Note 25) - - - (2,868,981,112) (2,868,981,112)
Balance as at 31 December 2019 1,247,381,614 1,491,912,500 125,900,000 30,067,468,042 32,932,662,156
-
Balance as at 1 January 2020 1,247,381,614 1,491,912,500 125,900,000 30,067,468,042 32,932,662,156
Profit for the year - - - 7,014,040,310 7,014,040,310
Other comprehensive income for the year - - - - -
Total comprehensive income for the year - - - 7,014,040,310 7,014,040,310
Dividend paid (Note 25) - - - (2,245,286,905) (2,245,286,905)
Balance as at 31 December 2020 1,247,381,614 1,491,912,500 125,900,000 34,836,221,447 37,701,415,561
-
The accompanying notes are an integral part of the financial statements.
Separate financial statements
Retained earnings

Delta Electronics (Thailand) Public Company Limited and its subsidiaries
Cash flow statement
For the year ended 31 December 2020
(Unit: Baht)
Consolidated financial statements Separate financial statements
2020 2019 2020 2019
(Restated)
Cash flows from operating activities:
Profit before tax 7,259,437,946 2,996,675,016 7,082,019,497 2,419,122,568
Adjustments to reconcile profit before tax to
net cash provided by (paid from) operating activities:
Depreciation 2,074,517,773 1,629,946,708 1,598,359,426 1,332,987,656
Amortisation 131,801,134 104,980,164 1,662,867 881,978
Recording of allowance for expected credit losses (reversal) (64,762,351) 61,747,356 27,702,114 (25,194,400)
Reduction of inventory to net realisable value (reversal) 15,615,521 470,064,134 (121,606,571) 328,152,744
Reversal of the reduction to net realisable value
of the obsolete and damaged inventories (185,762,757) (263,311,297) (148,543,957) (122,736,270)
Increase in provision for long-term employee benefits 84,131,368 185,130,052 53,539,033 144,174,989
Recording of the increase in provisions 38,316,878 144,233,924 34,869,958 44,726,852
Share of profit from investments in associated companies (60,845,793) (24,849,891) - -
Loss on sales of invesments in associated companies 95,125,078 - - -
(Gain) loss from disposal/writte-off of property, plant and equipment (2,232,111) 7,639,441 (2,529,852) 14,158,219
Loss from write-off of other intangible assets 272,305 1,854,733 - -
Impairment loss on property, plant and equipment (reversal) 388,091 (85,951,413) - (85,951,413)
Unrealised gain on exchange (35,744,272) (31,070,333) (95,955,115) (25,001,622)
Interest income (111,437,887) (237,971,248) (39,084,114) (95,527,873)
Interest expenses 1,167,766 1,974,468 13,330 -
Profit from operating activities before changes in
operating assets and liabilities 9,239,988,689 4,961,091,814 8,390,446,616 3,929,793,428
Decrease (increase) in operating assets:
Trade and other receivables (4,343,980,196) 2,025,057,655 (4,958,900,207) 1,644,310,304
Inventories (3,481,361,503) 393,261,934 (2,520,152,204) (143,581,786)
Other current assets (293,524,835) (168,665,992) (127,703,710) (21,394,531)
Other non-current assets 15,105,222 (11,983,179) 137,269 (842,506)
Increase (decrease) in operating liabilities:
Trade and other payables 6,056,588,355 (2,197,407,955) 5,389,054,400 (821,099,626)
Other current liabilities 82,355,659 79,473,462 60,437,065 4,623,313
Provision for long-term employee benefits (87,543,418) (69,816,748) (33,002,121) (21,818,144)
Provisions (27,317,914) (38,968,979) (22,447,248) (23,012,474)
Other non-current liabilities 65,572,118 166,505,970 271,203 (155,400)
Cash flows from operating activities 7,225,882,177 5,138,547,982 6,178,141,063 4,546,822,578
Cash received from interest income 99,608,269 232,549,198 39,084,114 96,729,623
Cash paid for interest expenses (1,489,555) (1,837,119) (13,330) -
Cash paid for corporate income tax (90,909,440) (133,038,970) (1,123,617) (593,192)
Net cash flows from operating activities 7,233,091,451 5,236,221,091 6,216,088,230 4,642,959,009
The accompanying notes are an integral part of the financial statements.
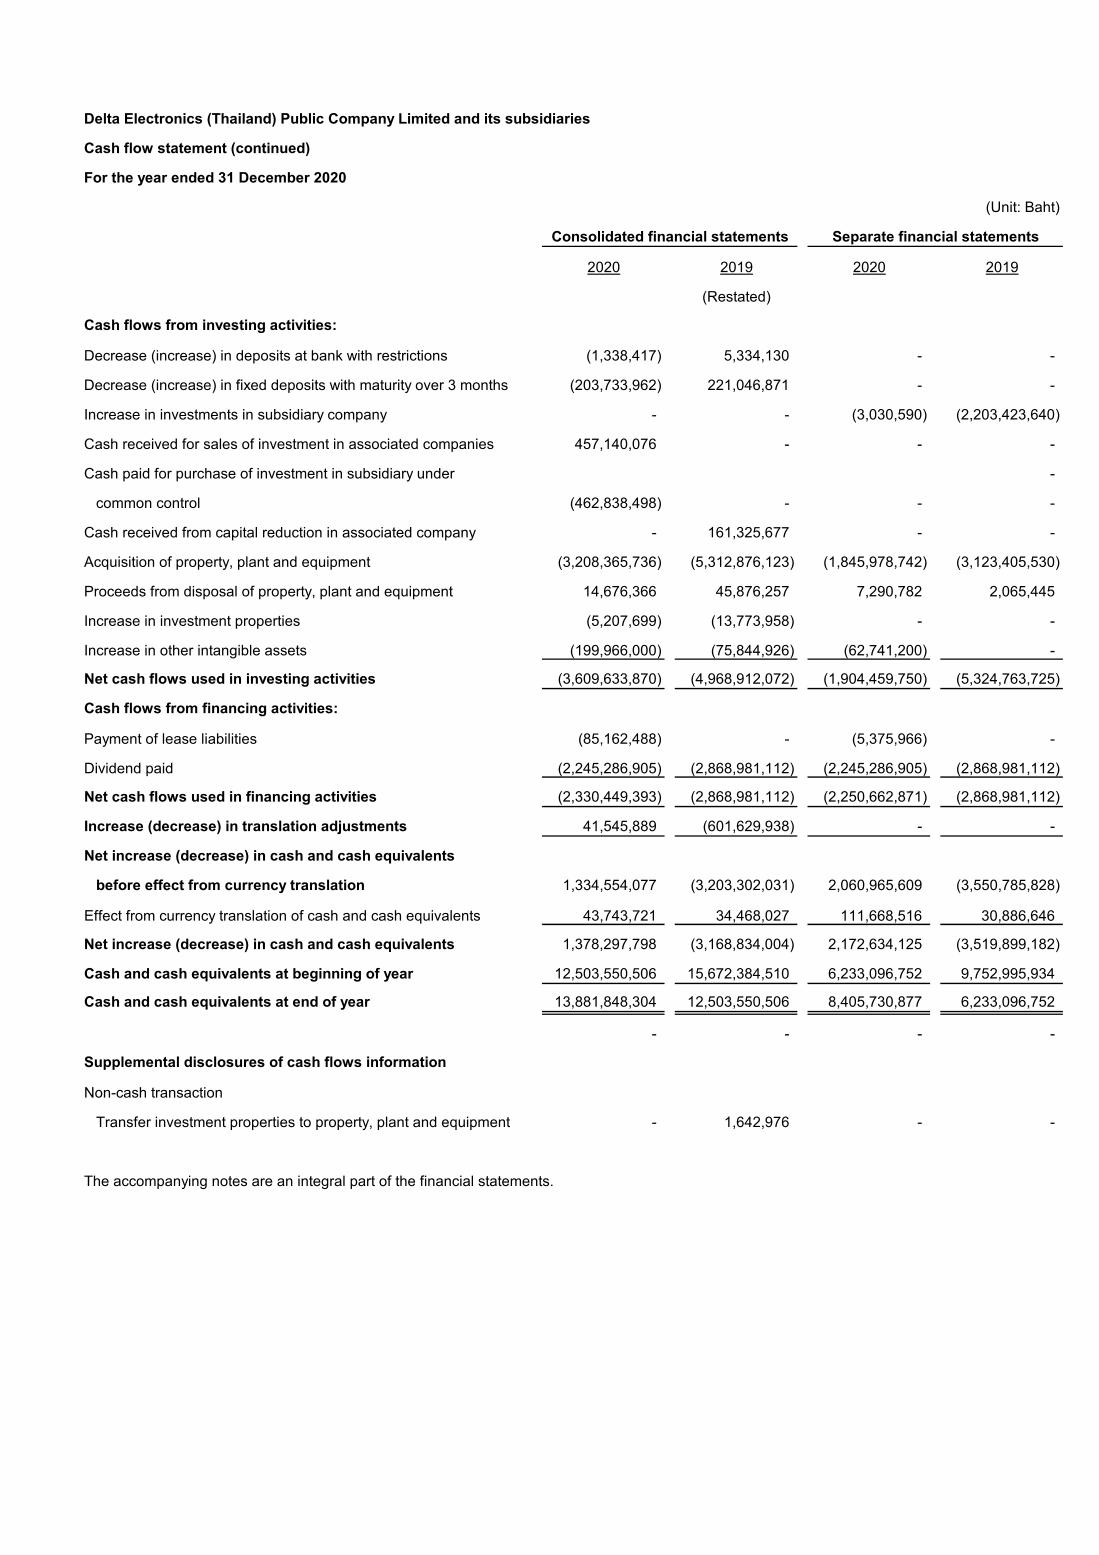
Delta Electronics (Thailand) Public Company Limited and its subsidiaries
Cash flow statement (continued)
For the year ended 31 December 2020
(Unit: Baht)
Consolidated financial statements Separate financial statements
2020 2019 2020 2019
(Restated)
Cash flows from investing activities:
Decrease (increase) in deposits at bank with restrictions (1,338,417) 5,334,130 - -
Decrease (increase) in fixed deposits with maturity over 3 months (203,733,962) 221,046,871 - -
Increase in investments in subsidiary company - - (3,030,590) (2,203,423,640)
Cash received for sales of investment in associated companies 457,140,076 - - -
Cash paid for purchase of investment in subsidiary under -
common control (462,838,498) - - -
Cash received from capital reduction in associated company - 161,325,677 - -
Acquisition of property, plant and equipment (3,208,365,736) (5,312,876,123) (1,845,978,742) (3,123,405,530)
Proceeds from disposal of property, plant and equipment 14,676,366 45,876,257 7,290,782 2,065,445
Increase in investment properties (5,207,699) (13,773,958) - -
Increase in other intangible assets (199,966,000) (75,844,926) (62,741,200) -
Net cash flows used in investing activities (3,609,633,870) (4,968,912,072) (1,904,459,750) (5,324,763,725)
Cash flows from financing activities:
Payment of lease liabilities (85,162,488) - (5,375,966) -
Dividend paid (2,245,286,905) (2,868,981,112) (2,245,286,905) (2,868,981,112)
Net cash flows used in financing activities (2,330,449,393) (2,868,981,112) (2,250,662,871) (2,868,981,112)
Increase (decrease) in translation adjustments 41,545,889 (601,629,938) - -
Net increase (decrease) in cash and cash equivalents
before effect from currency translation 1,334,554,077 (3,203,302,031) 2,060,965,609 (3,550,785,828)
Effect from currency translation of cash and cash equivalents 43,743,721 34,468,027 111,668,516 30,886,646
Net increase (decrease) in cash and cash equivalents 1,378,297,798 (3,168,834,004) 2,172,634,125 (3,519,899,182)
Cash and cash equivalents at beginning of year 12,503,550,506 15,672,384,510 6,233,096,752 9,752,995,934
Cash and cash equivalents at end of year 13,881,848,304 12,503,550,506 8,405,730,877 6,233,096,752
- - - -
Supplemental disclosures of cash flows information
Non-cash transaction
Transfer investment properties to property, plant and equipment - 1,642,976 - -
The accompanying notes are an integral part of the financial statements.

1
Delta Electronics (Thailand) Public Company Limited and its subsidiaries Notes to consolidated financial statements For the year ended 31 December 2020
1. General information
1.1 Corporate information
Delta Electronics (Thailand) Public Company Limited (“the Company”) is a public company
incorporated and domiciled in Thailand. Its parent company is Delta Electronics Inc., which
is incorporated in Taiwan. The registered office of the Company is at 714 Moo 4, Tambon
Prakasa, Amphur Muangsamutprakarn, Samutprakarn.
The Group is principally engaged in the manufacture and distribution of electronic products,
together with related research and development.
1.2 Coronavirus disease 2019 Pandemic
The Coronavirus disease 2019 pandemic is adversely impacting most businesses and
industries. This situation may bring uncertainties and have an impact on the environment in
which the group operates. The Group’s management has continuously monitored ongoing
developments and assessed the financial impact in respect of the valuation of assets,
provisions and contingent liabilities, and has used estimates and judgement in respect of
various issues as the situation has evolved.
2. Basis of preparation
2.1 The financial statements have been prepared in accordance with Thai Financial Reporting
Standards enunciated under the Accounting Professions Act B.E. 2547 and their
presentation has been made in compliance with the stipulations of the Notification of the
Department of Business Development, issued under the Accounting Act B.E. 2543.
The financial statements in Thai language are the official statutory financial statements of
the Company. The financial statements in English language have been translated from the
Thai language financial statements.
The financial statements have been prepared on a historical cost basis except where
otherwise disclosed in the accounting policies.

2
2.2 Basis of consolidation
2.2.1 The consolidated financial statements include the financial statements of Delta
Electronics (Thailand) Public Company Limited (“the Company”) and the following
subsidiary companies (“the subsidiaries”) (collectively as “the Group”):
Country of Percentage of
Company’s name Nature of business incorporation shareholding
2020 2019
Percent Percent
DET International Holding Limited Holding business The Cayman Islands 100 100
Delta Green Industrial (Thailand)
Company Limited
Manufacture and trading of electronic products Thailand 100 100
Delta Energy Systems (Singapore)
Pte. Ltd.
Holding business and trading of electronic
products
Singapore 100 100
Delta Electronics (Vietnam)
Company Limited
Trading of electronic products Vietnam 100 -
The subsidiaries which the Company owns through DET International Holding Limited are
as follows:
Country of Percentage of indirect
Company’s name Nature of business incorporation shareholding
2020 2019
Percent Percent
DET Logistics (USA) Corporation Trading of electronic products USA 100 100
Delta Electronics (Slovakia) s.r.o. Manufacture and trading of
electronic products
Slovakia 100 100
Delta Energy Systems (Germany) GmbH Research, development,
marketing and trading of
electronic products
Germany 100 100
Delta Energy Systems Property (Germany) GmbH
(owned by Delta Energy Systems (Germany) GmbH)
Property rental Germany 100 100
Delta Energy Systems (India) Pvt. Ltd. Manufacture and trading of
electronic products
India 100 100
Delta Energy Systems (Romania) S.R.L. Research and development of
electronic products
Romania 100 100

3
The subsidiaries which the Company owns through Delta Energy Systems (Singapore) Pte. Ltd.
are as follows:
Country of Percentage of indirect
Company’s name Nature of business incorporation shareholding
2020 2019
Percent Percent
Delta Electronics (Australia) Pty. Ltd. Marketing and after sales services Australia 100 100
Eltek Australia Pty Ltd. Trading of electronic products Australia 100 -
Delta Greentech (Netherlands) Cooperaties UA Holding business The Netherlands 100 100
Delta Greentech (Netherlands) B.V.
(owned by Delta Greentech (Netherlands)
Cooperaties UA)
Holding business The Netherlands 100 100
Delta Energy Systems LLC
(owned by Delta Greentech (Netherlands) B.V.)
Trading of electronic products Russia 100 100
Eltek s.r.o.
(owned by Delta Greentech (Netherlands) B.V.)
Manufacture and trading of
electronic products
Slovakia 100 100
Delta Electronics (Automotive) Americas Inc.
(owned by Delta Greentech (Netherlands) B.V.)
Research and development of
electronic products
USA 100 100
Delta Electronics India Pvt. Ltd. Manufacture, research and
development and trading of
electronic products
India 100 100
Delta Electronics (Myanmar) Co., Ltd. Manufacture and trading of
electronic products
Myanmar 100 100
Delta PBA Engineering Solutions Co., Ltd. Manufacture, assembly and
provision of automation
Thailand 51 51
Delta Energy Systems (UK) Limited Research and development of
electronic products
Scotland 100 100
2.2.2 The Company is deemed to have control over an investee or subsidiaries if it has rights,
or is exposed, to variable returns from its involvement with the investee, and it has the
ability to direct the activities that affect the amount of its returns.
2.2.3 Subsidiaries are fully consolidated, being the date on which the Company obtains
control, and continue to be consolidated until the date when such control ceases.
2.2.4 The financial statements of the subsidiaries are prepared using the same significant
accounting policies as the Company.

4
2.2.5 The assets and liabilities in the financial statements of overseas subsidiary companies
are translated to Baht using the exchange rates prevailing on the end of reporting
period, and revenues and expenses translated using monthly average exchange rates.
The resulting differences are shown under the caption of “Exchange differences on
translation of financial statements in foreign currency” in the statements of changes
in shareholders’ equity.
2.2.6 Material balances and transactions between the Group have been eliminated from
the consolidated financial statements.
2.2.7 Non-controlling interests represent the portion of profit or loss and net assets of the
subsidiaries that are not held by the Company and are presented separately in the
consolidated profit or loss and within equity in the consolidated statement of financial
position.
2.3 The separate financial statements present investments in subsidiaries under the cost method.
3. New financial reporting standards
(a) Financial reporting standards that became effective in the current year
During the year, the Group has adopted the revised (revised 2019) and new financial
reporting standards and interpretations which are effective for fiscal years beginning on
or after 1 January 2020. These financial reporting standards were aimed at alignment
with the corresponding International Financial Reporting Standards with most of the
changes directed towards clarifying accounting treatment and providing accounting
guidance for users of the standards. The adoption of these financial reporting standards
does not have any significant impact on the Group’s financial statements. However, the
new standard involves changes to key principles, which are summarised below:
Financial reporting standards related to financial instruments
The set of TFRSs related to financial instruments consists of five accounting standards
and interpretations, as follows:
Financial reporting standards:
TFRS 7 Financial Instruments: Disclosures
TFRS 9 Financial Instruments
Accounting standard:
TAS 32 Financial Instruments: Presentation
Financial Reporting Standard Interpretations:
TFRIC 16 Hedges of a Net Investment in a Foreign Operation
TFRIC 19 Extinguishing Financial Liabilities with Equity Instruments

5
These TFRSs related to financial instruments make stipulations relating to the classification of financial instruments and their measurement at fair value or amortised cost (taking into account the type of instrument, the characteristics of the contractual cash flows and the Company’s business model), calculation of impairment using the expected credit loss method, and hedge accounting. They also include stipulations regarding the presentation and disclosure of financial instruments.
These standards do not have any significant impact on the Group’s financial statements.
TFRS 16 Leases
TFRS 16 supersedes TAS 17, Leases, together with related Interpretations. The standard sets out the principles for the recognition, measurement, presentation and disclosure of leases, and requires a lessee to recognise assets and liabilities for all leases with a term of more than 12 months, unless the underlying asset is low value.
Accounting by lessors under TFRS 16 is substantially unchanged from TAS 17. Lessors will continue to classify leases as either operating or finance leases.
The Group recognised the cumulative effect of the adoption of this financial reporting standard as an adjustment to retained earnings as at 1 January 2020, and the comparative information was not restated.
The cumulative effect of the change is described in Note 4.
(b) Financial reporting standards that will become effective for fiscal years beginning on or after 1 January 2021
The Federation of Accounting Professions issued a number of revised financial reporting standards and interpretations, which are effective for fiscal years beginning on or after 1 January 2021. These financial reporting standards were aimed at alignment with the corresponding International Financial Reporting Standards with most of the changes directed towards clarifying accounting treatment and providing accounting guidance for users of the standards.
The management of the Group is currently evaluating the impact of these standards on the financial statements in the year when they are adopted.
4. Cumulative effects of changes in accounting policies due to the adoption of new financial reporting standards
As described in Note 3 to the financial statements, during the current year, the Group has adopted the set of financial reporting standards related to financial instruments and TFRS 16. The cumulative effect of initially applying these standards was recognised as an adjustment as at 1 January 2020. Therefore, the comparative information was not restated.
The impacts of changes in accounting policies on the statements of financial position at the beginning of 2020 due to the adoption of these standards are presented as follows:

6
(Unit: Million Baht)
Consolidated financial statements
The effect of
31 December
2019
Financial reporting
standards related to
financial instruments TFRS 16
1 January
2020
(Restated)
Statement of financial position
Assets
Current assets
Current investments 2 (2) - -
Other current financial assets - 36 - 36
Other current assets 1,292 (34) - 1,258
Non-current assets
Land-use rights 198 - (198) -
Right-of-use assets (Note 21) - - 314 314
Liabilities and shareholders’ equity
Current liabilities
Current portion of lease liabilities - - 61 61
Derivative liabilities - 1 - 1
Other current liabilities 315 (1) - 314
Non-current liabilities
Lease liabilities, net of current portion - - 55 55
(Unit: Million Baht)
Separate financial statements
The effect of
31 December
2019
Financial reporting
standards related to
financial instruments TFRS 16
1 January
2020
Statement of financial position
Assets
Current assets
Other current financial assets - 33 - 33
Other current assets 307 (33) - 274
Non-current assets
Right-of-use assets (Note 21) - - 5 5
Liabilities and shareholders’ equity
Current liabilities
Current portion of lease liabilities - - 5 5

7
4.1 Financial instruments
As at 1 January 2020, classification and measurement of financial assets required by TFRS 9,
in comparison with classification and the former carrying amount, are as follows:
(Unit: Million Baht)
Consolidated financial statements
The former
carrying amounts
Classification and measurement in accordance
with TFRS 9
Fair value through
profit or loss
Amortised
cost Total
Financial assets as at 1 January 2020
- restated
Cash and cash equivalents 12,504 - 12,504 12,504
Trade and other receivables 9,845 - 9,845 9,845
Other current financial assets 36 34 2 36
Other current assets 1,258 - 1,258 1,258
Deposits at bank with restrictions 50 - 50 50
Other non-current assets 156 - 156 156
Total financial assets 23,849 34 23,815 23,849
(Unit: Million Baht)
Separate financial statements
The former
carrying amounts
Classification and measurement in accordance
with TFRS 9
Fair value through
profit or loss
Amortised
cost Total
Financial assets as at 1 January 2020
Cash and cash equivalents 6,233 - 6,233 6,233
Trade and other receivables 9,468 - 9,468 9,468
Other current financial assets 33 33 - 33
Other current assets 274 - 274 274
Other non-current assets 3 - 3 3
Total financial assets 16,011 33 15,978 16,011
As at 1January 2020 , the Group has not designated any financial liabilities at fair value
through profit or loss except derivative liabilities of which fair value is Baht 1 million (Separate
financial statements: Nil).

8
4.2 Leases
On adoption of TFRS 16, the Group recognised lease liabilities in relation to leases that
previously classified as operating leases measured at the present value of the remaining
lease payments, discounted using the Group’s incremental borrowing rate at 1 January
2020. For leases that previously classified as finance leases, the Group recognised the
carrying amount of the lease assets and lease liabilities before transition as right-of-use
assets and lease liabilities, respectively at the date of initial application.
(Unit: Million Baht)
Consolidated
financial statements
Separate
financial statements
Operating lease commitments as at 31 December 2019
- restated 210 6
Less: Short-term leases and leases of low-value assets (92) (1)
Less: Deferred interest expenses (2) -
Lease liabilities as at 1 January 2020 116 5
Weighted average incremental borrowing rate
(percent per annum) 1.19 1.19
Comprise of:
Current lease liabilities 61 5
Non-current lease liabilities 55 -
116 5
The adjustments of right-of-use assets due to TFRS 16 adoption as at 1 January 2020 - restated
are summarised below:
(Unit: Million Baht)
Consolidated
financial statements
Separate
financial statements
Buildings 90 5
Machinery and equipment 1 -
Motor vehicles 25 -
Total adjustment of right-of-use assets 116 5
Classification of land-use rights to right-of-use assets 198 -
Total right-of-use assets 314 5

9
5. Significant accounting policies
5.1 Revenue and expense recognition
Sales of goods
Revenue from sale of goods is recognised at the point in time when control of the asset is
transferred to the customer, generally upon delivery of the goods. Revenue is measured at
the amount of the consideration received or receivable, excluding value added tax, of goods
supplied after deducting returns, discounts, allowances and price promotions to customers.
Rendering of services
Revenue from installation, repair and other services are recognised at a point in time upon
completion of the service.
Interest income
Interest income is calculated using the effective interest method and recognised on an
accrual basis. The effective interest rate is applied to the gross carrying amount of a financial
asset, unless the financial assets subsequently become credit-impaired when it is applied to
the net carrying amount of the financial asset (net of the expected credit loss allowance).
Finance cost
Interest expense from financial liabilities at amortised cost is calculated using the effective
interest method and recognised on an accrual basis.
Dividends
Dividends are recognised when the right to receive the dividends is established.
5.2 Cash and cash equivalents
Cash and cash equivalents consist of cash in hand and at banks, and all highly liquid
investments with an original maturity of three months or less and not subject to withdrawal
restrictions.
5.3 Inventories
Finished goods and work in process are valued at the lower of cost (under the first-in, first-
out method) and net realisable value. The cost of inventories is measured using the standard
cost method, which approximates actual cost and includes all production costs and
attributable factory overheads.
Raw materials are valued at the lower of cost (under the first-in, first-out method) and net
realisable value and are charged to production costs whenever consumed. The cost of
inventories is measured using the standard cost method, which approximates actual cost.

10
5.4 Investments in subsidiaries and associates
a) Investments in associated companies are accounted for in the consolidated financial statements using the equity method.
b) Investments in subsidiary companies are accounted for in the separate financial statements using the cost method net of allowance for impairment loss (if any).
On disposal of an investment, the difference between net disposal proceeds and the carrying amount of the investment is recognised in profit or loss.
5.5 Investment properties
Investment properties are measured initially at cost, including transaction costs. Subsequent to initial recognition, investment properties are stated at cost less accumulated depreciation and allowance for loss on impairment (if any).
Depreciation of investment properties is calculated by reference to their costs on the straight-line basis over estimated useful lives of 2-32 years. Depreciation of the investment properties is included in determining income.
On disposal of investment properties, the difference between the net disposal proceeds and the carrying amount of the asset is recognised in profit or loss in the period when the asset is derecognised.
5.6 Property, plant and equipment/Depreciation
Land is stated at cost. Buildings and equipment are stated at cost less accumulated depreciation and allowance for loss on impairment of assets (if any). Depreciation of plant and equipment is calculated by reference to their costs on a straight-line basis over the following estimated useful lives:
Buildings 10 - 50 years Land improvement 5 - 10 years Machinery and equipment 3 - 7 years Molds 2 - 5 years Installation 5 - 15 years Furniture, fixtures and office equipment 5 - 7 years Computer 3 - 5 years Motor vehicles 5 years
Depreciation is included in determining income.
No depreciation is provided for land and asset under installation and under construction.
An item of property, plant and equipment is derecognised upon disposal or when no future economic benefits are expected from its use or disposal. Any gain or loss arising on disposal of an asset is included in profit or loss when the asset is derecognised.

11
5.7 Intangible assets
Intangible assets acquired through business combination are initially recognised at their fair
value on the date of business acquisition while intangible assets acquired in other cases are
recognised at cost. Following the initial recognition, the intangible assets are carried at cost
less any accumulated amortisation and any accumulated impairment losses (if any).
Intangible assets with finite lives are amortised on a systematic basis over the economic
useful life and tested for impairment whenever there is an indication that they may be
impaired. The amortisation period and the amortisation method of such intangible assets are
reviewed at least at each financial year end. The amortisation expense is charged to profit
or loss.
A summary of the intangible assets with finite useful lives is as follow:
Useful lives
Patents 10 and 20 years
Computer software 3 years
Customer relationship 10 years
5.8 Goodwill
Goodwill is initially recorded at cost, which equals to the excess of cost of business
combination over the fair value of the net assets acquired. If the fair value of the net assets
acquired exceeds the cost of business combination, the excess is immediately recognised
as gain in profit or loss.
Goodwill is carried at cost less any accumulated impairment losses (if any). Goodwill is tested
for impairment annually and when circumstances indicate that the carrying value may be
impaired.
For the purpose of impairment testing, goodwill acquired in a business combination is
allocated to each of the Group’s cash-generating units (or group of cash-generating units)
that are expected to benefit from the synergies of the combination. The Group estimates the
recoverable amount of each cash-generating unit (or group of cash-generating units) to
which the goodwill relates. Where the recoverable amount of the cash-generating unit is less
than the carrying amount, an impairment loss is recognised in profit or loss. Impairment
losses relating to goodwill cannot be reversed in future periods.

12
5.9 Leases
At inception of contract, the Group assesses whether a contract is, or contains, a lease. A contract is, or contains, a lease if the contract conveys the right to control the use of an identified asset for a period of time in exchange for consideration.
The Group as a lessee
Accounting policies adopted since 1 January 2020
The Group applied a single recognition and measurement approach for all leases, except for short-term leases and leases of low-value assets. At the commencement date of the lease, the Group recognises right-of-use assets representing the right to use underlying assets and lease liabilities based on lease payments.
Right-of-use assets
Right-of-use assets are measured at cost, less accumulated depreciation, any accumulated impairment losses, and adjusted for any remeasurement of lease liabilities. The cost of right-of-use assets includes the amount of lease liabilities initially recognised, initial direct costs incurred, and lease payments made at or before the commencement date of the lease less any lease incentives received.
Depreciation of right-of-use assets are calculated by reference to their costs, on the straight-line basis over the shorter of their estimated useful lives and the lease term.
Land 99 years Buildings 1 - 6 years Machinery and equipment 1 - 5 years Motor vehicles 1 - 3 years
If ownership of the leased asset is transferred to the Group at the end of the lease term or the cost reflects the exercise of a purchase option, depreciation is calculated using the estimated useful life of the asset.
Lease liabilities
Lease liabilities are measured at the present value of the lease payments to be made over the lease term. The lease payments include fixed payments less any lease incentives receivable, variable lease payments that depend on an index or a rate, and amounts expected to be payable under residual value guarantees. Moreover, the lease payments include the exercise price of a purchase option reasonably certain to be exercised by the Group and payments of penalties for terminating the lease, if the lease term reflects the Group exercising an option to terminate. Variable lease payments that do not depend on an index or a rate are recognised as expenses in the period in which the event or condition that triggers the payment occurs.
13
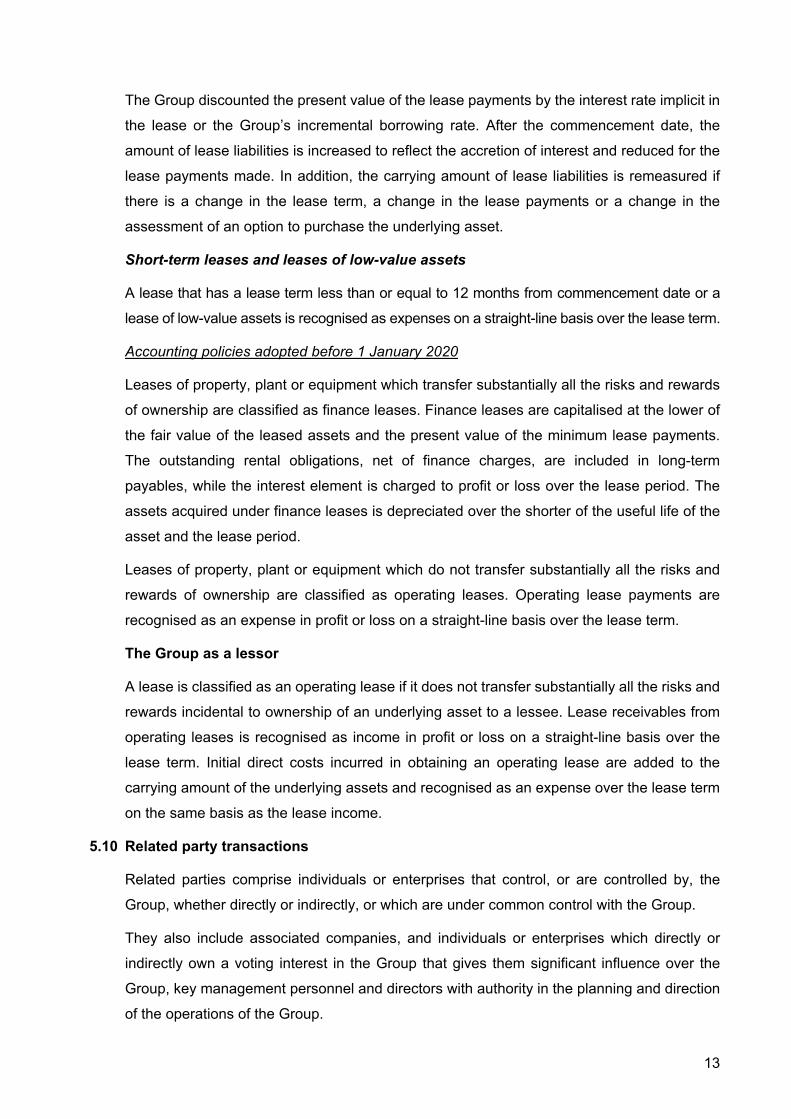
The Group discounted the present value of the lease payments by the interest rate implicit in
the lease or the Group’s incremental borrowing rate. After the commencement date, the
amount of lease liabilities is increased to reflect the accretion of interest and reduced for the
lease payments made. In addition, the carrying amount of lease liabilities is remeasured if
there is a change in the lease term, a change in the lease payments or a change in the
assessment of an option to purchase the underlying asset.
Short-term leases and leases of low-value assets
A lease that has a lease term less than or equal to 12 months from commencement date or a
lease of low-value assets is recognised as expenses on a straight-line basis over the lease term.
Accounting policies adopted before 1 January 2020
Leases of property, plant or equipment which transfer substantially all the risks and rewards
of ownership are classified as finance leases. Finance leases are capitalised at the lower of
the fair value of the leased assets and the present value of the minimum lease payments.
The outstanding rental obligations, net of finance charges, are included in long-term
payables, while the interest element is charged to profit or loss over the lease period. The
assets acquired under finance leases is depreciated over the shorter of the useful life of the
asset and the lease period.
Leases of property, plant or equipment which do not transfer substantially all the risks and
rewards of ownership are classified as operating leases. Operating lease payments are
recognised as an expense in profit or loss on a straight-line basis over the lease term.
The Group as a lessor
A lease is classified as an operating lease if it does not transfer substantially all the risks and
rewards incidental to ownership of an underlying asset to a lessee. Lease receivables from
operating leases is recognised as income in profit or loss on a straight-line basis over the
lease term. Initial direct costs incurred in obtaining an operating lease are added to the
carrying amount of the underlying assets and recognised as an expense over the lease term
on the same basis as the lease income.
5.10 Related party transactions
Related parties comprise individuals or enterprises that control, or are controlled by, the
Group, whether directly or indirectly, or which are under common control with the Group.
They also include associated companies, and individuals or enterprises which directly or
indirectly own a voting interest in the Group that gives them significant influence over the
Group, key management personnel and directors with authority in the planning and direction
of the operations of the Group.

14
5.11 Foreign currencies
The consolidated and separate financial statements are presented in Baht, which is also the
Company’s functional currency. Items of each entity included in the consolidated financial
statements are measured using the functional currency of that entity.
Transactions in foreign currencies are translated into Baht at the exchange rate ruling at the
date of the transaction. Monetary assets and liabilities denominated in foreign currencies are
translated into Baht at the exchange rate ruling at the end of reporting period.
Gains and losses on exchange are included in determining income.
5.12 Impairment of non-financial assets
At the end of each reporting period, the Group performs impairment reviews in respect of the
property, plant and equipment, right-of-use asset, investment properties and other intangible
assets whenever events or changes in circumstances indicate that an asset may be
impaired. The Group also carries out annual impairment reviews in respect of goodwill. An
impairment loss is recognised when the recoverable amount of an asset, which is the higher
of the asset’s fair value less costs to sell and its value in use, is less than the carrying amount.
In determining value in use, the estimated future cash flows are discounted to their present
value using a pre-tax discount rate that reflects current market assessments of the time value
of money and the risks specific to the asset. In determining fair value less costs to sell, an
appropriate valuation model is used. These calculations are corroborated by a valuation
model that, based on information available, reflects the amount that the Group could obtain
from the disposal of the asset in an arm’s length transaction between knowledgeable, willing
parties, after deducting the costs of disposal.
An impairment loss is recognised in profit or loss.
In the assessment of asset impairment (except for goodwill), if there is any indication that
previously recognised impairment losses may no longer exist or may have decreased, the
Group estimates the asset’s recoverable amount. A previously recognised impairment loss
is reversed only if there has been a change in the assumptions used to determine the asset’s
recoverable amount since the last impairment loss was recognised. The increased carrying
amount of the asset attributable to a reversal of an impairment loss shall not exceed the
carrying amount that would have been determined had no impairment loss been recognised
for the asset in prior years. Such reversal is recognised in profit or loss.

15
5.13 Employee benefits
Short-term employee benefits
Salaries, wages, bonuses and contributions to the social security fund are recognised as
expenses when incurred.
Post-employment benefits
Defined contribution plans
The Group and its employees have jointly established the provident fund. The fund is monthly
contributed by employees and by the Group. The fund’s assets are held in a separate trust
fund and the contributions of the Group are recognised as expenses when incurred.
Defined benefit plans
The Group has obligations in respect of the severance payments, it must make to employees
upon retirement under labor law. The Group treats these severance payment obligations as
a defined benefit plan.
The obligation under the defined benefit plan is determined by a professionally qualified
independent actuary based on actuarial techniques, using the projected unit credit method.
The liabilities under the defined benefit plan consist of the present value of the defined benefit
obligation less fair value of plan assets.
Net interest recognised in profit or loss consists of the interest cost on the defined benefit
obligation net with the interest income on plan assets which calculated using the same rate
as the discount rate applying for the post-employment benefit obligation.
Actuarial gains and losses from defined benefit plans and return of plan assets net from
interest income on plan assets are recognised immediately in other comprehensive income.
Past service costs are recognised in profit or loss on the earlier of the date of the plan
amendment or curtailment and the date that the Group recognised restructuring-related
costs.
5.14 Provisions
Provisions are recognised when the Group has a present obligation as a result of a past
event, it is probable that an outflow of resources embodying economic benefits will be required
to settle the obligation, and a reliable estimate can be made of the amount of the obligation.
5.15 Research and development expenses
The Group records research and development costs as expenses when incurred.

16
5.16 Income tax
Income tax expense represents the sum of corporate income tax currently payable and
deferred tax.
Current tax
Current income tax is provided in the accounts at the amount expected to be paid to the
taxation authorities, based on taxable profits determined in accordance with tax legislation.
Deferred tax
Deferred income tax is provided on temporary differences between the tax bases of assets
and liabilities and their carrying amounts at the end of each reporting period, using the tax
rates enacted at the end of the reporting period.
The Group recognises deferred tax liabilities for all taxable temporary differences while it
recognises deferred tax assets for all deductible temporary differences and tax losses carried
forward to the extent that it is probable that future taxable profit will be available against
which such deductible temporary differences and tax losses carried forward can be utilised.
At each reporting date, the Group reviews and reduces the carrying amount of deferred tax
assets to the extent that it is no longer probable that sufficient taxable profit will be available
to allow all or part of the deferred tax asset to be utilised.
The Group records deferred tax directly to shareholders' equity if the tax relates to items that
are recorded directly to shareholders' equity.
5.17 Financial instruments
Accounting policies adopted since 1 January 2020
The Group initially measures financial assets at its fair value plus, in the case of financial
assets that are not measured at fair value through profit or loss, transaction costs. However,
trade receivables, that do not contain a significant financing component, are measured at the
transaction price as disclosed in the accounting policy relating to revenue recognition.
Classification and measurement of financial assets
Financial assets are classified, at initial recognition, as to be subsequently measured at
amortised cost, fair value through other comprehensive income (“FVOCI”), or fair value
through profit or loss (“FVTPL”). The classification of financial assets at initial recognition is
driven by the Group’s business model for managing the financial assets and the contractual
cash flows characteristics of the financial assets.

17
Financial assets at amortised cost
The Group measures financial assets at amortised cost if the financial asset is held in order
to collect contractual cash flows and the contractual terms of the financial asset give rise on
specified dates to cash flows that are solely payments of principal and interest on the principal
amount outstanding.
Financial assets at amortised cost are subsequently measured using the effective interest
rate (“EIR”) method and are subject to impairment. Gains and losses are recognised in profit
or loss when the asset is derecognised, modified or impaired.
Financial assets at FVTPL
Financial assets measured at FVTPL are carried in the statement of financial position at fair
value with net changes in fair value recognised in profit or loss.
These financial assets include derivatives, security investments held for trading, equity
investments which the Group has not irrevocably elected to classify at FVOCI and financial
assets with cash flows that are not solely payments of principal and interest.
Classification and measurement of financial liabilities
Except for derivative liabilities, at initial recognition the Group’s financial liabilities are
recognised at fair value net of transaction costs and classified as liabilities to be subsequently
measured at amortised cost using the EIR method. Gains and losses are recognised in profit
or loss when the liabilities are derecognised as well as through the EIR amortisation process.
In determining amortised cost, the Group takes into account any fees or costs that are an
integral part of the EIR. The EIR amortisation is included in finance costs in profit or loss.
Derecognition of financial instruments
A financial asset is primarily derecognised when the rights to receive cash flows from the
asset have expired or have been transferred and either the Group has transferred
substantially all the risks and rewards of the asset, or the Group has neither transferred nor
retained substantially all the risks and rewards of the asset but has transferred control of the
asset.
A financial liability is derecognised when the obligation under the liability is discharged or
cancelled or expires. When an existing financial liability is replaced by another from the same
lender on substantially different terms, or the terms of an existing liability are substantially
modified, such an exchange or modification is treated as the derecognition of the original
liability and the recognition of a new liability. The difference in the respective carrying amounts
is recognised in profit or loss.

18
Impairment of financial assets
The Group recognises an allowance for expected credit losses (“ECLs”) for all debt
instruments not held at FVTPL. ECLs are based on the difference between the contractual
cash flows due in accordance with the contract and all the cash flows that the Group expects
to receive, discounted at an approximation of the original effective interest rate.
For credit exposures for which there has not been a significant increase in credit risk since
initial recognition, ECLs are provided for credit losses that result from default events that are
possible within the next 12-months (a 12-month ECL). For those credit exposures for which
there has been a significant increase in credit risk since initial recognition, a loss allowance
is required for credit losses expected over the remaining life of the exposure (a lifetime ECL).
However, in certain cases, the Group may also consider a financial asset to have a significant
increase in credit risk and to be in default using other internal or external information, such
as credit rating of issuers.
For trade receivables, the Group applies a simplified approach in calculating ECLs.
Therefore, the Group does not track changes in credit risk, but instead recognises a loss
allowance based on lifetime ECLs at each reporting date. It is based on its historical credit
loss experience and adjusted for forward-looking factors specific to the debtors and the
economic environment.
A financial asset is written off when there is no reasonable expectation of recovering the
contractual cash flows.
Offsetting of financial instruments
Financial assets and financial liabilities are offset, and the net amount is reported in the
statement of financial position if there is a currently enforceable legal right to offset the
recognised amounts and there is an intention to settle on a net basis, to realise the assets
and settle the liabilities simultaneously.
Accounting policies adopted before 1 January 2020
Trade accounts receivable
Trade accounts receivable are stated at the net realisable value. Allowance for doubtful
accounts is provided for the estimated losses that may be incurred in collection of receivables.
The allowance is generally based on collection experience and analysis of debt aging.
5.18 Derivatives
The Group uses derivatives, such as forward currency contracts to hedge its foreign currency
risks.

19
Derivatives are initially recognised at fair value on the date on which a derivative contract is entered into and are subsequently remeasured at fair value. The subsequent changes are recognised in profit or loss. Derivatives are carried as financial assets when the fair value is positive and as financial liabilities when the fair value is negative.
Derivatives are presented as non-current assets or non-current liabilities if the remaining maturity of the instrument is more than 12 months and it is not due to be realised or settled within 12 months. Other derivatives are presented as current assets or current liabilities.
5.19 Fair value measurement
Fair value is the price that would be received to sell an asset or paid to transfer a liability in
an orderly transaction between buyer and seller (market participants) at the measurement
date. The Group applies a quoted market price in an active market to measure their assets
and liabilities that are required to be measured at fair value by relevant financial reporting
standards. Except in case of no active market of an identical asset or liability or when a
quoted market price is not available, the Group measures fair value using valuation
technique that are appropriate in the circumstances and maximises the use of relevant
observable inputs related to assets and liabilities that are required to be measured at fair
value.
All assets and liabilities for which fair value is measured or disclosed in the financial
statements are categorised within the fair value hierarchy into three levels based on
categorise of input to be used in fair value measurement as follows:
Level 1 - Use of quoted market prices in an active market for such assets or liabilities
Level 2 - Use of other observable inputs for such assets or liabilities, whether directly or
indirectly
Level 3 - Use of unobservable inputs such as estimates of future cash flows
At the end of each reporting period, the Group determines whether transfers have occurred
between levels within the fair value hierarchy for assets and liabilities held at the end of the
reporting period that are measured at fair value on a recurring basis.
6. Significant accounting judgements and estimates
The preparation of financial statements in conformity with financial reporting standards at
times requires management to make subjective judgements and estimates regarding matters
that are inherently uncertain. These judgements and estimates affect reported amounts and
disclosures; and actual results could differ from these estimates. Significant judgements and
estimates are as follows:

20
Allowance for expected credit losses of trade receivables
In determining an allowance for expected credit losses of trade receivables, the management needs to make judgement and estimates based upon, among other things, past collection history, aging profile of outstanding debts and the forecast economic condition for groupings of various customer segments with similar credit risks. The Group’s historical credit loss experience and forecast economic conditions may also not be representative of whether a customer will actually default in the future.
Allowance for diminution in value of inventory
The determination of allowances for diminution in the value of inventory, requires management to make judgements and estimates. The allowance for reduce cost to net realisable value is estimated based on the selling price expected in the ordinary course of business less the estimated costs to complete the sales; and provision for obsolete, slow-moving and deteriorated inventories that is estimated based on the approximate aging of each type of inventory.
Allowance for impairment loss of investments
The Company treats investment in subsidiaries in the sperate financial statements as impaired when there has been a significant or prolonged decline in the fair value below their cost or where other objective evidence of impairment exists. The determination of what is “significant” or “prolonged” requires judgment of the management.
Property plant and equipment/Depreciation
In determining depreciation of plant and equipment, the management is required to make estimates of the useful lives and residual values of the plant and equipment and to review estimate useful lives and residual values when there are any changes.
In addition, the management is required to review property, plant and equipment for impairment on a periodical basis and record impairment losses when it is determined that their recoverable amount is lower than the carrying amount. This requires judgements regarding forecast of future revenues and expenses relating to the assets subject to the review.
Goodwill and intangible assets
The initial recognition and measurement of goodwill and intangible assets, and subsequent impairment testing, require management to make estimates of cash flows to be generated by the asset or the cash generating units and to choose a suitable discount rate in order to calculate the present value of those cash flows.
Deferred tax assets
Deferred tax assets are recognised only to the extent that it is probable that taxable profit will be available against which these deferred tax assets can be utilised. Significant management judgement is required to determine the amount of deferred tax assets that can be recognised, based upon the likely timing and level of estimate future taxable profits.

21
Post-employment benefits under defined benefit plans
The obligation under the defined benefit plan is determined based on actuarial techniques.
Such determination is made based on various assumptions, including discount rate, future
salary increase rate, mortality rate and staff turnover rate.
Tax assessments
The Group has contingent liabilities as the result of tax assessments. The management was
required to exercise judgement to assess the results of the tax assessments and estimate
the liabilities that might be incurred as at the end of the reporting period.
7. Related party transactions
During the years, the Group had significant business transactions with related parties. Such
transactions, which are summarised below, arose in the ordinary course of business and
were concluded on commercial terms and bases agreed upon between the Group and those
related parties.
(Unit: Million Baht)
Consolidated
financial statements
Separate
financial statements Transfer pricing policy
2020 2019 2020 2019
(Restated)
Transactions with the parent company*
Sales of goods and raw materials 98 120 94 112 With reference to market price
Purchase of goods and raw materials 358 438 65 22 With reference to market price
Royalty paid (Note 32.3.1) 1,698 1,215 1,698 1,215 Contract price
Services paid 122 93 122 93 Contract price
Transactions with subsidiary companies
(eliminated from the consolidated financial statements)
Sales of goods and raw materials - - 20,539 15,689 With reference to market price
Purchase of goods and raw materials - - 1,282 677 With reference to market price
Commission paid - - 220 220 Contract price
Design and engineering fee paid (Note 32.3.2) - - 1,934 1,924 Contract price
Distribution fee paid - - 43 103 Contract price
Administrative expenses - - 88 87 Contract price
Transactions with associated companies**
Sales of goods and raw materials 43 15 39 11 With reference to market price
Commission paid 53 46 43 33 Contract price

22
(Unit: Million Baht)
Consolidated
financial statements
Separate
financial statements Transfer pricing policy
2020 2019 2020 2019
(Restated)
Transactions with related companies
Sales of goods and raw materials 8,347 6,027 4,113 1,942 With reference to market price
Purchase of goods and raw materials 3,419 3,716 1,387 697 With reference to market price
Commission paid 746 524 737 521 Contract price
Commission received 107 77 - - Contract price
Services income 208 130 - - Contract price
Other income 14 12 9 11 Contract price
* Delta Electronics Inc. has changed its status to the Company’s parent company on 2 April 2019. ** The Group sold investments in associated companies on 1 October 2020.
The balances of the accounts as at 31 December 2020 and 2019 between the Group and those related
companies are as follows:
(Unit: Million Baht)
Consolidated
financial statements
Separate
financial statements
2020 2019 2020 2019
(Restated)
Trade receivables, related parties (Note 9)
Parent company* 26 36 21 31
Subsidiary companies - - 6,407 4,827
Associated companies** - 10 - 4
Other related companies (under common control) 1,660 1,198 777 428
Total trade receivables, related parties 1,686 1,244 7,205 5,290
Other receivables, related parties (Note 9)
Parent company* - 1 - 1
Subsidiary companies - - 49 29
Other related companies (under common control) 3 24 3 24
Total other receivables, related parties 3 25 52 54

23
(Unit: Million Baht)
Consolidated
financial statements
Separate
financial statements
2020 2019 2020 2019
(Restated)
Amounts due from related parties (Note 9)
Subsidiary companies - - 1 3
Total amounts due from related parties - - 1 3
Trade payables, related parties (Note 19)
Parent company* 74 88 41 2
Subsidiary companies - - 370 342
Associated companies** - 1 - -
Other related companies (under common control) 1,298 793 328 192
Total trade payables, related parties 1,372 882 739 536
Other payables, related parties (Note 19)
Parent company* 210 158 208 157
Subsidiary companies - - 214 361
Associated companies** - 12 - 10
Other related companies (under common control) 367 126 366 126
Total other payables, related parties 577 296 788 654
Accrued expenses, related parties (Note 19)
Parent company* 166 90 166 90
Subsidiary companies - - 1 -
Other related companies (under common control) 118 107 118 107
Total accrued expenses, related parties 284 197 285 197
* Delta Electronics Inc. has changed its status to the Company’s parent company on 2 April 2019.
** The Group sold investments in associated companies on 1 October 2020.

24
Directors and management’s benefits
During the year ended 31 December 2020 and 2019, the Group had employee benefit
expenses payable to their directors and management as below.
(Unit: Million Baht)
Consolidated
financial statements
Separate
financial statements
2020 2019 2020 2019
Short-term employee benefits 86 104 39 54
Post-employment benefits 9 27 8 25
Total 95 131 47 79
8. Cash and cash equivalents
(Unit: Million Baht)
Consolidated
financial statements
Separate
financial statements
2020 2019 2020 2019
(Restated)
Cash in hand 1 - - -
Bank deposits in current accounts 1,544 1,160 2 2
Bank deposits in saving accounts 9,415 8,413 8,404 6,231
Fixed deposits with maturity
not over 3 months 2,922 2,931 - -
Total 13,882 12,504 8,406 6,233
As at 31 December 2020, the above bank deposits in saving accounts and fixed deposits
carried interests between 0.00 and 8.00 percent per annum (2019: between 0.00 and 8.25
percent per annum) (The Company only: between 0.00 and 0.55 percent per annum, 2019:
between 0.00 and 1.20 percent per annum).

25
9. Trade and other receivables
(Unit: Million Baht)
Consolidated
financial statements
Separate
financial statements
2020 2019 2020 2019
(Restated)
Trade receivables, related parties (Note 7)
Aged on the basis of due dates
Not yet due 1,669 1,233 6,964 4,134
Past due
Up to 3 months 17 10 230 1,148
3 - 6 months - 1 - 3
6 - 12 months - - - 5
Over 12 months - - 11 -
Total 1,686 1,244 7,205 5,290
Trade receivables, unrelated parties
Aged on the basis of due dates
Not yet due 10,546 7,000 5,593 3,326
Past due
Up to 3 months 872 996 475 388
3 - 6 months 57 105 39 2
6 - 12 months 29 153 - 1
Over 12 months 70 48 8 -
Total 11,574 8,302 6,115 3,717
Total trade receivables 13,260 9,546 13,320 9,007
Less: Allowance for expected credit losses
(2019: Allowance for doubtful
accounts) (129) (194) (32) (4)
Total trade receivables - net 13,131 9,352 13,288 9,003
Other receivables
Amounts due from related parties (Note 7) - - 1 3
Other receivables - related parties (Note 7) 3 25 52 54
Other receivables - unrelated parties 863 468 806 408
Total other receivables 866 493 859 465
Trade and other receivables - net 13,997 9,845 14,147 9,468

26
Set out below is the movement in the allowance for expected credit losses of trade and other
receivables.
(Unit: Million Baht)
Consolidated
financial statements
Separate
financial statements
As at 1 January 2020 (194) (4)
Provision for expected credit losses (33) (28)
Reversal during the year 98 -
As at 31 December 2020 (129) (32)
10. Inventories
(Unit: Million Baht)
Consolidated financial statements
Cost
Reduce cost to net
realisable value Inventories-net
2020 2019 2020 2019 2020 2019
(Restated) (Restated) (Restated)
Finished goods 5,581 4,603 (471) (487) 5,110 4,116
Work in process 1,834 997 - - 1,834 997
Raw materials 5,570 3,738 (776) (930) 4,794 2,808
Goods in transit 917 1,083 - - 917 1,083
Total 13,902 10,421 (1,247) (1,417) 12,655 9,004
(Unit: Million Baht)
Separate financial statements
Cost
Reduce cost to net
realisable value Inventories-net
2020 2019 2020 2019 2020 2019
Finished goods 2,756 2,989 (83) (176) 2,673 2,813
Work in process 1,417 778 - - 1,417 778
Raw materials 4,145 2,492 (400) (578) 3,745 1,914
Goods in transit 701 241 - - 701 241
Total 9,019 6,500 (483) (754) 8,536 5,746

27
Details movement of the reduction of inventories to net realisable value are as follows: (Unit: Million Baht)
Consolidated
financial statements
Separate
financial statements
2020 2019 2020 2019
(Restated)
Balance at beginning of year (1,417) (1,210) (754) (549)
Increase during the year (146) (529) - (328)
Reversal of the reduction to net realisable value of
the obsolete and damaged inventories written off
during the year 186 263 149 123
Reversal during the year 130 59 122 -
Balance at end of year (1,247) (1,417) (483) (754)
The Group reduced cost of inventories to reflect the net realisable value. This was included in cost of sales. In addition, the Group reversed the write-down of cost of inventories and reduced the amount of inventories recognised as expenses during the year.
11. Other current financial assets (Unit: Million Baht)
31 December 2020
Consolidated
financial statements
Separate
financial statements
Debt instruments at amortised cost
Fixed deposits with maturity over 3 months 205 -
Total debt instruments at amortised cost 205 -
Financial assets at FVTPL
Derivative assets (Note 33) 149 149
Total financial assets at FVTPL 149 149
Total other current financial assets 354 149
12. Other current assets (Unit: Million Baht)
Consolidated
financial statements
Separate
financial statements
2020 2019 2020 2019
(Restated)
Input tax refundable 358 306 205 91
Advance payments 846 666 163 141
Prepaid expenses 271 204 28 32
Prepaid tax 26 57 - -
Forward contracts receivable (Note 33) - 34 - 33
Others 62 25 8 10
Total other current assets 1,563 1,292 404 307

28
13. Investments in associated companies
13.1 Details of associates (Unit: Million Baht)
Consolidated financial statements
Company’s name Nature of business Country of
incorporation Shareholding percentage Cost Carrying amounts based on
equity method
2020 (%)
2019 (%)
2020 2019 2020 2019
Delta Electronics (Switzerland) AG (owned by Delta Greentech (Netherlands) B.V.)
Holding business, trading, research and development of electronic products
Switzerland - 49 - 287 - 432
Delta Greentech Electronics Industry LLC (owned by Delta Greentech (Netherlands) B.V.)
Marketing and distribution of electronic products
Turkey - 49 - 117 - 99
Translation adjustment - (60) - (67) Total - 344 - 464
13.2 Share of comprehensive income and dividend received
During the year, the Company has recognised its share of profit (loss) and share of other comprehensive income from investments in associated companies in the consolidated financial statements as follows:
(Unit: Million Baht)
Consolidated financial statements
For the year ended 31 December
Associates
Share of profit (loss) from investments in
associated companies
Share of other comprehensive income from
investments in associated companies
2020 2019 2020 2019
Delta Electronics (Switzerland) AG 89 44 (10) (60)
Delta Greentech Electronics Industry LLC (28) (19) - -
Total 61 25 (10) (60)

29
No dividend was received from the above associated companies during the year ended
31 December 2020 and 2019.
13.3 Summarised financial information about material associates
Summarised information about financial position
(Unit: Million Baht)
Delta Electronics
(Switzerland) AG
Delta Greentech
Electronics Industry LLC
2020 2019 2020 2019
Current assets - 1,628 - 291
Non-current assets - 95 - 25
Current liabilities - (974) - (196)
Non-current liabilities - (193) - (12)
Net assets - 556 - 108
Shareholding percentage (%) - 49 - 49
Share of net assets - 272 - 53
Goodwill - 92 - -
Translation adjustment - 16 - 31
Carrying amounts of associates based
on equity method - 380 - 84
Summarised information about comprehensive income
(Unit: Million Baht)
For the year ended 31 December
Delta Electronics
(Switzerland) AG
Delta Greentech Electronics
Industry LLC
2020 2019 2020 2019
Revenue - 3,712 - 540
Profit (loss) - 91 - (39)
Other comprehensive income - (122) - -
Total comprehensive income - (31) - (39)

30
13.4 Significant events during the current year
Sales of investments in associated companies
On 24 July 2020, a meeting of the Company’s Board of Directors passed a resolution
approving a subsidiary of the Company, Delta Greentech (Netherlands) B.V., entering into an
agreement to sell 49 percent interests in Delta Electronics (Switzerland) AG and Delta
Greentech Electronics Industry LLC to related companies. On 28 September 2020, the
subsidiary received payment for the sale of these investments in associated companies,
amounting to approximately USD 14.44 million or approximately Baht 457 million, and agreed
to transfer those shares to the buyers on 1 October 2020. A loss on the sale of these
investments under the equity method, amounting to approximately USD 3 million or
approximately Baht 95 million, was recorded in the consolidated statement of comprehensive
income.
14. Investments in subsidiary companies
14.1 Details of investments in subsidiaries as presented in separate financial statements
(Unit: Million Baht)
Company’s name Paid-up capital Cost
Foreign
currency 2020 2019 2020 2019
(Million) (Million)
DET International Holding Limited USD 264 264 9,450 9,450
Delta Green Industrial (Thailand) Company Limited THB 206 206 206 206
Delta Energy Systems (Singapore) Pte. Ltd. USD 173 173 5,573 5,573
Delta Electronics (Vietnam) Company Limited USD 0.1 - 3 -
Subtotal 15,232 15,229
Less: Allowance for impairment loss of investments
in subsidiary companies
(1,144) (1,144)
Investments in subsidiary companies - net 14,088 14,085

31
14.2 Significant events during the current year
14.2.1 Subsidiaries directly owned by the Company
a) Establishment of new subsidiaries
On 31 March 2020, a meeting of the Board of Directors of the Company passed
the following significant resolutions:
- Proceed with the incorporation of a subsidiary, Delta Electronics (Vietnam) Company
Limited, to engage in the trading of electronics products. The subsidiary was
incorporated in Vietnam with a registered capital of USD 100,000, and the Company
having a 100% shareholding.
In the fourth quarter of the current year, Delta Electronics (Vietnam) Company Limited
called up 100 percent of the par value of the shares and already received payment of
share capital of USD 100,000, or approximately Baht 3 million, on 23 December 2020.
- Proceed with the incorporation of a subsidiary, Delta Electronics India Manufacturing
Private Limited, to engage in the manufacturing and trading of electronics products.
The subsidiary was incorporated in India with a registered capital of INR 1.1 million and
the Company having a 100% shareholding.
During January 2021, Delta Electronics India Manufacturing Private Limited called
up 100 percent of the par value of the shares and already received payment of share
capital of INR 1.1 million, or approximately Baht 0.5 million, on 15 January 2021.
b) Dividend received during the year
No dividend was received from the above subsidiary companies during the year ended
31 December 2020 and 2019.
14.2.2 Subsidiaries indirectly owned by the Company
a) Purchase of investment in the subsidiary
On 24 July 2020, a meeting of the Company’s Board of Directors passed a resolution
approving the acquisition by a subsidiary of the Company, Delta Energy Systems
(Singapore) Pte. Ltd., of all ordinary shares of Eltek Australia Pty Ltd. at a price of
approximately USD 14.62 million, or approximately Baht 463 million, from Eltek AS,
which is a subsidiary of the parent company. On 30 September 2020, the subsidiary
made payment for these ordinary shares and it received the shares on 1 October 2020.

32
The above purchase of investment in the subsidiary was considered to be a business
combination under common control, and the difference between the cost of this business
combination under common control and the net book value of the equity of Eltek Australia
Pty Ltd., amounting to approximately USD 10.6 million, or approximately Baht 336
million, was therefore recorded as “Difference from business combination under common
control” and separately presented in the consolidated statements of changes in
shareholders’ equity.
The net book values of assets and liabilities as at 1 October 2020 (acquisition date) and
the cash payment made to purchase the investment in Eltek Australia Pty Ltd. are as
follows:
(Unit: Million Baht)
Consolidated
financial statements
Net book values of assets and liabilities as at the acquisition date
Cash and cash equivalents 97
Trade and other receivables 54
Inventories 104
Other current assets 14
Property, plant and equipment 2
Deferred tax assets 23
Trade and other payables (142)
Other current liabilities (13)
Long-term provisions (12)
Total net assets 127
Plus: Difference from business combination under common control 336
Cash payment for purchase of investment in subsidiary 463
Because this acquisition was a business combination under common control, the Company
has treated Eltek Australia Pty Ltd. as if it had been a subsidiary of the Company since
it was established. Therefore, the consolidated statements of comprehensive income for
the year ended 31 December 2020 included the operating results of Eltek Australia Pty
Ltd. as from 1 January 2020, ignoring the actual date of the business combination under
common control (the date the shares of the subsidiary were acquired).

33
The Company has restated the consolidated statement of financial position as at
31 December 2019, and the related consolidated statements of comprehensive income,
changes in shareholders’ equity and cash flows for the year then ended, which are
presented herein for comparative purposes, as if Eltek Australia Pty Ltd. had always
been the Company’s subsidiary. The Company has also presented the consolidated
statement of financial position as at 1 January 2019 for comparative purposes.
The amounts of adjustments affecting the consolidated statement of financial position as
at 31 December 2019 were summarised below.
(Unit: Million Baht)
Increase in consolidated statements of financial position
Assets
Cash and cash equivalents 110
Trade and other receivables 105
Inventories 40
Other current assets 12
Property, plant and equipment 6
Deferred tax assets 23
Other non-current assets 1
Liabilities
Trade and other payables 104
Other current liabilities 10
Long-term provisions 7
Shareholders' equity
Equity attributable to shareholders of subsidiary before
business combination under common control 176
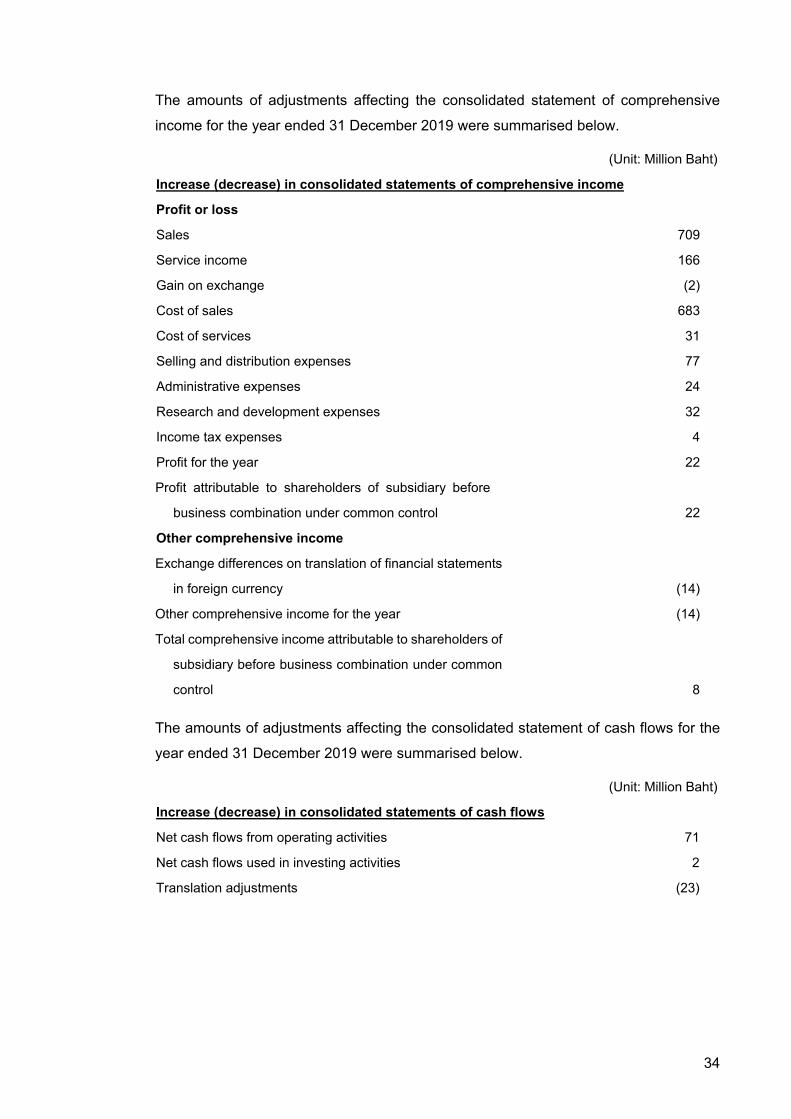
34
The amounts of adjustments affecting the consolidated statement of comprehensive
income for the year ended 31 December 2019 were summarised below.
(Unit: Million Baht)
Increase (decrease) in consolidated statements of comprehensive income
Profit or loss
Sales 709
Service income 166
Gain on exchange (2)
Cost of sales 683
Cost of services 31
Selling and distribution expenses 77
Administrative expenses 24
Research and development expenses 32
Income tax expenses 4
Profit for the year 22
Profit attributable to shareholders of subsidiary before
business combination under common control 22
Other comprehensive income
Exchange differences on translation of financial statements
in foreign currency (14)
Other comprehensive income for the year (14)
Total comprehensive income attributable to shareholders of
subsidiary before business combination under common
control 8
The amounts of adjustments affecting the consolidated statement of cash flows for the
year ended 31 December 2019 were summarised below.
(Unit: Million Baht)
Increase (decrease) in consolidated statements of cash flows
Net cash flows from operating activities 71
Net cash flows used in investing activities 2
Translation adjustments (23)
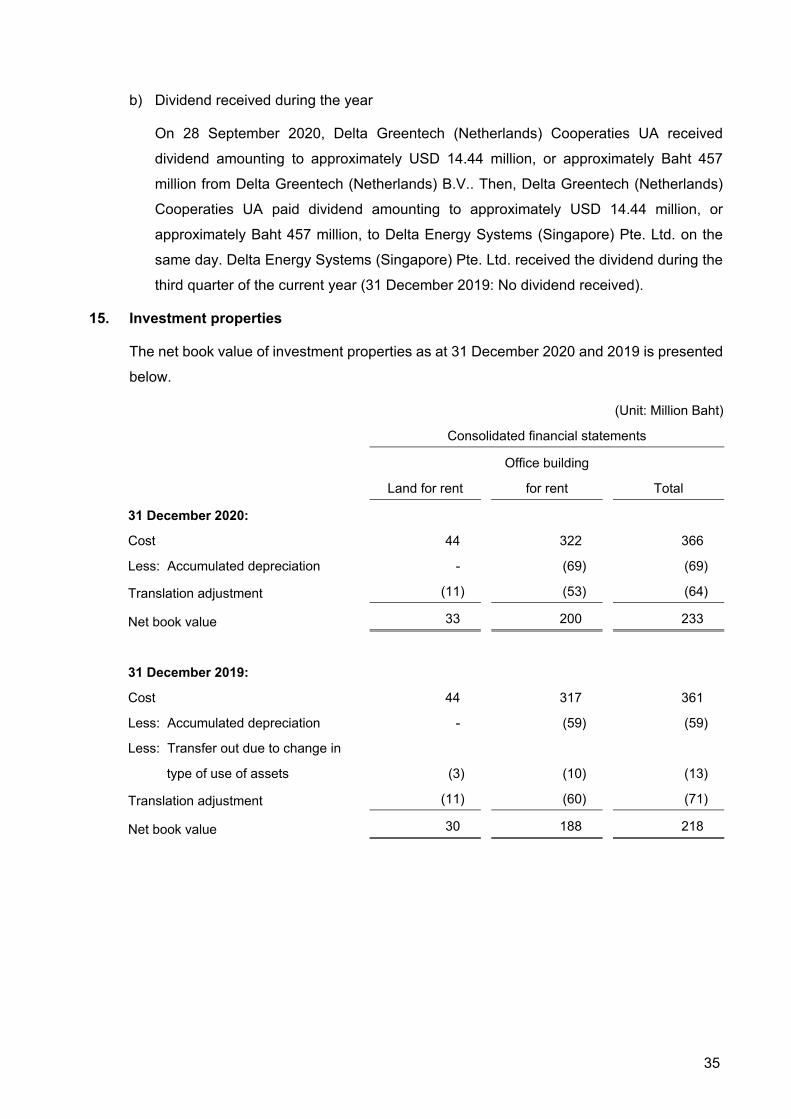
35
b) Dividend received during the year
On 28 September 2020, Delta Greentech (Netherlands) Cooperaties UA received
dividend amounting to approximately USD 14.44 million, or approximately Baht 457
million from Delta Greentech (Netherlands) B.V.. Then, Delta Greentech (Netherlands)
Cooperaties UA paid dividend amounting to approximately USD 14.44 million, or
approximately Baht 457 million, to Delta Energy Systems (Singapore) Pte. Ltd. on the
same day. Delta Energy Systems (Singapore) Pte. Ltd. received the dividend during the
third quarter of the current year (31 December 2019: No dividend received).
15. Investment properties
The net book value of investment properties as at 31 December 2020 and 2019 is presented
below.
(Unit: Million Baht)
Consolidated financial statements
Land for rent
Office building
for rent Total
31 December 2020:
Cost 44 322 366
Less: Accumulated depreciation - (69) (69)
Translation adjustment (11) (53) (64)
Net book value 33 200 233
31 December 2019:
Cost 44 317 361
Less: Accumulated depreciation - (59) (59)
Less: Transfer out due to change in
type of use of assets (3) (10) (13)
Translation adjustment (11) (60) (71)
Net book value 30 188 218

36
A reconciliation of the net book value of investment properties for the years 2020 and 2019
is presented below.
(Unit: Million Baht)
Consolidated
financial statements
2020 2019
Net book value at beginning of year 218 237
Acquisition of assets 5 14
Depreciation charged (10) (9)
Transfer out due to change in type of use of assets (Note 16) - (2)
Translation adjustment 20 (22)
Net book value at end of year 233 218
The additional information of the investment properties as at 31 December 2020 and 2019
stated below:
(Unit: Million Baht)
Consolidated
financial statements
2020 2019
The fair value of land and office building for rent 261 228
The fair value of the land and office building held for rent has been determined using the
income approach. Key assumptions used in the valuation include yield rate, long-term
vacancy rate and long-term growth in real rental rates.
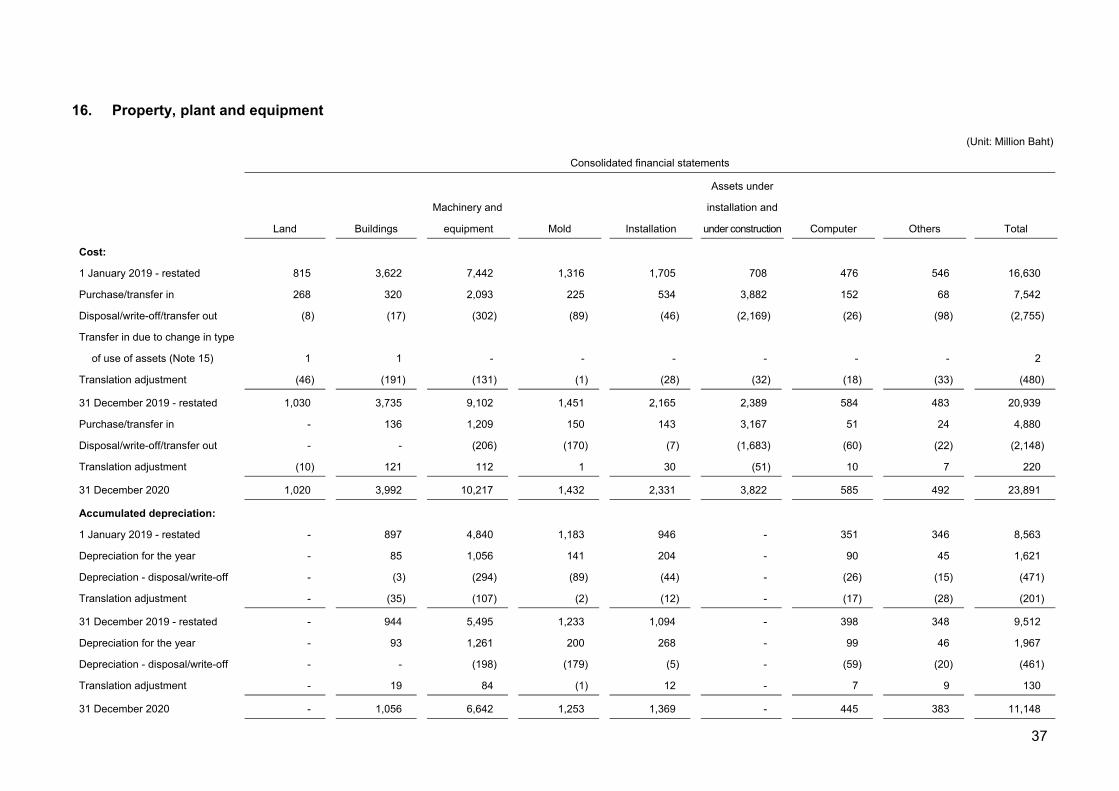
37
16. Property, plant and equipment
(Unit: Million Baht)
Consolidated financial statements
Machinery and
Assets under
installation and
Land Buildings equipment Mold Installation under construction Computer Others Total
Cost:
1 January 2019 - restated 815 3,622 7,442 1,316 1,705 708 476 546 16,630
Purchase/transfer in 268 320 2,093 225 534 3,882 152 68 7,542
Disposal/write-off/transfer out (8) (17) (302) (89) (46) (2,169) (26) (98) (2,755)
Transfer in due to change in type
of use of assets (Note 15) 1 1 - - - - - - 2
Translation adjustment (46) (191) (131) (1) (28) (32) (18) (33) (480)
31 December 2019 - restated 1,030 3,735 9,102 1,451 2,165 2,389 584 483 20,939
Purchase/transfer in - 136 1,209 150 143 3,167 51 24 4,880
Disposal/write-off/transfer out - - (206) (170) (7) (1,683) (60) (22) (2,148)
Translation adjustment (10) 121 112 1 30 (51) 10 7 220
31 December 2020 1,020 3,992 10,217 1,432 2,331 3,822 585 492 23,891
Accumulated depreciation:
1 January 2019 - restated - 897 4,840 1,183 946 - 351 346 8,563
Depreciation for the year - 85 1,056 141 204 - 90 45 1,621
Depreciation - disposal/write-off - (3) (294) (89) (44) - (26) (15) (471)
Translation adjustment - (35) (107) (2) (12) - (17) (28) (201)
31 December 2019 - restated - 944 5,495 1,233 1,094 - 398 348 9,512
Depreciation for the year - 93 1,261 200 268 - 99 46 1,967
Depreciation - disposal/write-off - - (198) (179) (5) - (59) (20) (461)
Translation adjustment - 19 84 (1) 12 - 7 9 130
31 December 2020 - 1,056 6,642 1,253 1,369 - 445 383 11,148

38
16. Property, plant and equipment (continued)
(Unit: Million Baht)
Consolidated financial statements
Machinery and
Assets under
installation and
Land Buildings equipment Mold Installation under construction Computer Others Total
Allowance for impairment loss:
1 January 2019 - 100 1 - 3 - - 1 105
Reversal allowance for impairment
during the year - (83) (1) - (1) - - (1) (86)
31 December 2019 - 17 - - 2 - - - 19
31 December 2020 - 17 - - 2 - - - 19
Net book value:
As at 31 December 2019 - restated 1,030 2,774 3,607 218 1,069 2,389 186 135 11,408
As at 31 December 2020 1,020 2,919 3,575 179 960 3,822 140 109 12,724
Depreciation for the year
Year 2019 (Baht 1,296 million include in manufacturing cost, and the balance in selling, administrative and research and development expenses) 1,621
Year 2020 (Baht 1,570 million include in manufacturing cost, and the balance in selling, administrative and research and development expenses) 1,967

39
16. Property, plant and equipment (continued)
(Unit: Million Baht)
Separate financial statements
Machinery and
Assets under
installation and
Land Buildings equipment Mold Installation under construction Computer Others Total
Cost:
1 January 2019 313 1,526 5,979 1,307 1,397 359 277 186 11,344
Purchase/transfer in 101 296 1,727 226 458 2,288 90 16 5,202
Disposal/write-off/transfer out - (16) (276) (89) (44) (1,988) (7) (92) (2,512)
31 December 2019 414 1,806 7,430 1,444 1,811 659 360 110 14,034
Purchase/transfer in - 18 785 149 121 2,271 32 1 3,377
Disposal/write-off/transfer out - - (182) (170) (3) (1,541) (40) (2) (1,938)
31 December 2020 414 1,824 8,033 1,423 1,929 1,389 352 109 15,473
Accumulated depreciation:
1 January 2019 - 514 3,699 1,175 805 - 181 78 6,452
Depreciation for the year - 33 912 140 181 - 61 6 1,333
Depreciation - disposal/write-off - (6) (268) (89) (42) - (8) (5) (418)
31 December 2019 - 541 4,343 1,226 944 - 234 79 7,367
Depreciation for the year - 37 1,055 199 230 - 66 6 1,593
Depreciation - disposal/write-off - - (178) (180) (3) - (40) (1) (402)
31 December 2020 - 578 5,220 1,245 1,171 - 260 84 8,558

40
16. Property, plant and equipment (continued)
(Unit: Million Baht)
Separate financial statements
Land Buildings
Machinery and
equipment Mold Installation
Assets under
installation and
under construction Computer Others Total
Allowance for impairment loss:
1 January 2019 - 100 1 - 3 - - 1 105
Reversal allowance for impairment
during the year - (83) (1) - (1) - - (1) (86)
31 December 2019 - 17 - - 2 - - - 19
31 December 2020 - 17 - - 2 - - - 19
Net book value:
As at 31 December 2019 414 1,248 3,087 218 865 659 126 31 6,648
As at 31 December 2020 414 1,229 2,813 178 756 1,389 92 25 6,896
Depreciation for the year
Year 2019 (Baht 1,145 million include in manufacturing cost, and the balance in selling, administrative and research and development expenses) 1,333
Year 2020 (Baht 1,389 million include in manufacturing cost, and the balance in selling, administrative and research and development expenses) 1,593

41
As at 31 December 2020, certain items of building, machinery and equipment of the Group were fully depreciated but are still in use. The gross carrying amount before deducting accumulated depreciation of those assets amounted to approximately of Baht 6,413 million (2019 - restated: Baht 5,607 million) (The Company only: Baht 4,719 million, 2019: Baht 4,151 million).
17. Goodwill
The net book value of goodwill as at 31 December 2020 and 2019 is presented below. (Unit: Million Baht)
Consolidated financial statements
Net book value as at 1 January 2019 438
Translation adjustment (20)
Net book value as at 31 December 2019 418
Translation adjustment 19
Net book value as at 31 December 2020 437
As at 31 December 2020, the net book value of the goodwill as above included the goodwill of approximately Baht 215 million from Power electronics segment related to DES products and the goodwill of approximately Baht 222 million from Delta Greentech (Netherland) B.V.’s acquisition of Eltek s.r.o. (“Eltek SK”) in 2017.
The Group determined the recoverable amount of the cash generating units based on value in use, with the cash flow projections derived from financial budgets approved by management. The projections cover a five-year period.
Key assumptions used in the value in use calculation of each group of the cash generating units are summarised below:
(Unit: Percent per annum)
Power electronics segment related to
DES products Eltek s.r.o.
Terminal growth rates 2% 2% Pre-tax discount rates 12% 12%
The management of the Group determined growth rates based on factors including historical operating results, expected market growth and economic growth. The discount rate is a pre-tax rate that reflects the risks specific to each cash generating units.
The Group performed impairment tested on goodwill by comparing the recoverable amount of the cash generating units (calculated by independent appraiser) with their carrying value and found that the recoverable amount of the cash generating units was higher than the carrying value. The management of the Group thus believes that goodwill is not impaired.
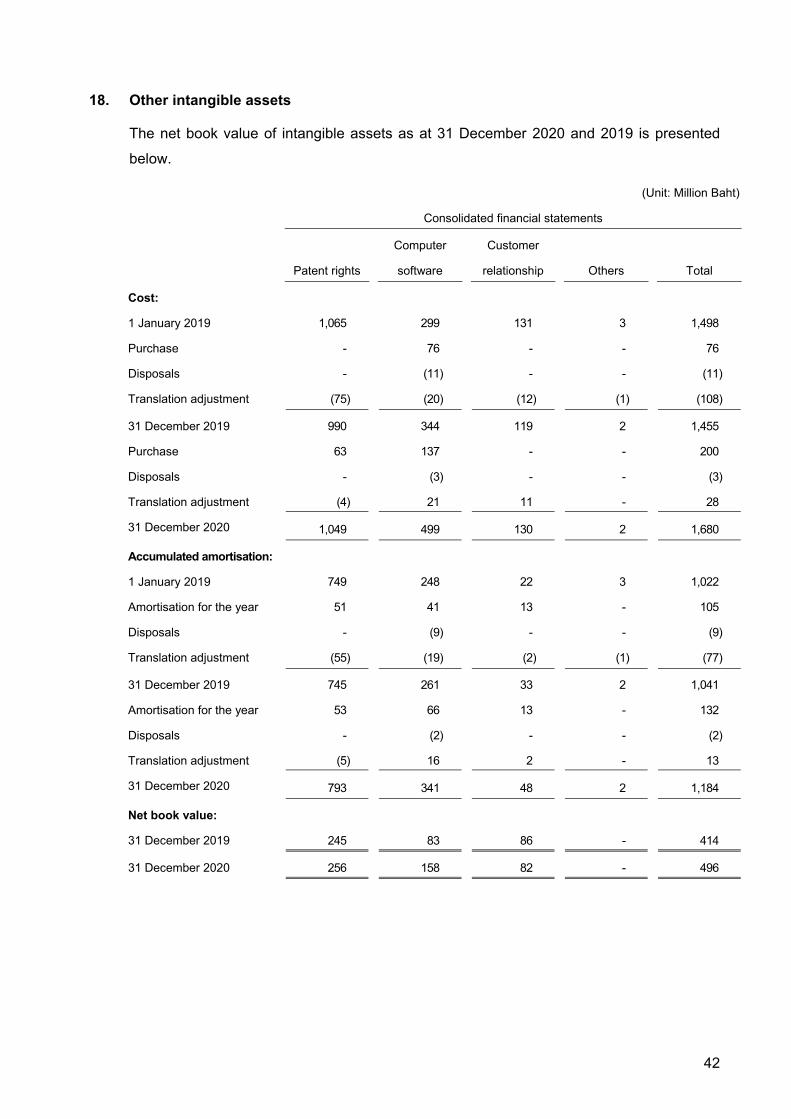
42
18. Other intangible assets
The net book value of intangible assets as at 31 December 2020 and 2019 is presented
below.
(Unit: Million Baht)
Consolidated financial statements
Patent rights
Computer
software
Customer
relationship Others Total
Cost:
1 January 2019 1,065 299 131 3 1,498
Purchase - 76 - - 76
Disposals - (11) - - (11)
Translation adjustment (75) (20) (12) (1) (108)
31 December 2019 990 344 119 2 1,455
Purchase 63 137 - - 200
Disposals - (3) - - (3)
Translation adjustment (4) 21 11 - 28
31 December 2020 1,049 499 130 2 1,680
Accumulated amortisation:
1 January 2019 749 248 22 3 1,022
Amortisation for the year 51 41 13 - 105
Disposals - (9) - - (9)
Translation adjustment (55) (19) (2) (1) (77)
31 December 2019 745 261 33 2 1,041
Amortisation for the year 53 66 13 - 132
Disposals - (2) - - (2)
Translation adjustment (5) 16 2 - 13
31 December 2020 793 341 48 2 1,184
Net book value:
31 December 2019 245 83 86 - 414
31 December 2020 256 158 82 - 496
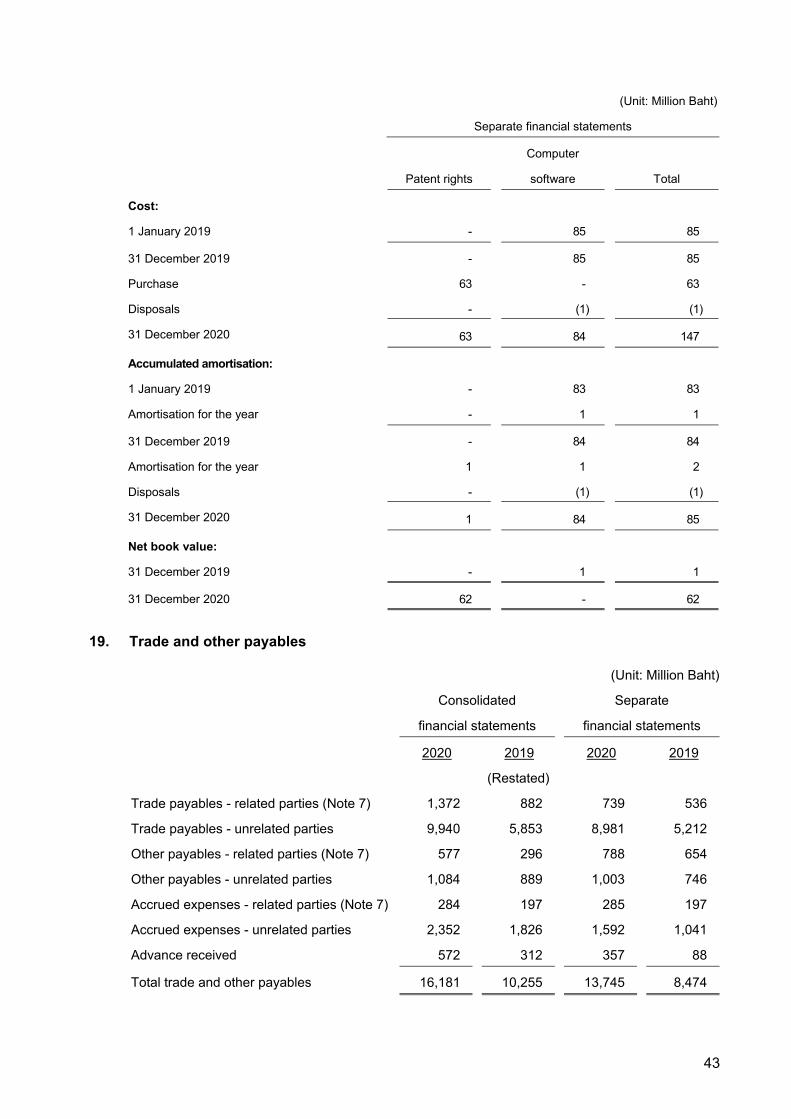
43
(Unit: Million Baht)
Separate financial statements
Patent rights
Computer
software Total
Cost:
1 January 2019 - 85 85
31 December 2019 - 85 85
Purchase 63 - 63
Disposals - (1) (1)
31 December 2020 63 84 147
Accumulated amortisation:
1 January 2019 - 83 83
Amortisation for the year - 1 1
31 December 2019 - 84 84
Amortisation for the year 1 1 2
Disposals - (1) (1)
31 December 2020 1 84 85
Net book value:
31 December 2019 - 1 1
31 December 2020 62 - 62
19. Trade and other payables
(Unit: Million Baht)
Consolidated
financial statements
Separate
financial statements
2020 2019 2020 2019
(Restated)
Trade payables - related parties (Note 7) 1,372 882 739 536
Trade payables - unrelated parties 9,940 5,853 8,981 5,212
Other payables - related parties (Note 7) 577 296 788 654
Other payables - unrelated parties 1,084 889 1,003 746
Accrued expenses - related parties (Note 7) 284 197 285 197
Accrued expenses - unrelated parties 2,352 1,826 1,592 1,041
Advance received 572 312 357 88
Total trade and other payables 16,181 10,255 13,745 8,474

44
20. Other current liabilities (Unit: Million Baht)
Consolidated financial statements
Separate financial statements
2020 2019 2020 2019 (Restated) Forward contracts payable (Note 33) - 1 - - Withholding tax payable 189 136 133 89 Value added tax payable 103 97 8 5 Others 101 81 28 16
Total other current liabilities 393 315 169 110
21. Leases
The Group as a lessee
The Group has lease contracts for assets used in its operations. Leases have lease terms between 1 - 99 years.
a) Right-of-use assets
Movement of right-of-use assets for the year ended 31 December 2020 are summarised below: (Unit: Million Baht)
Consolidated
financial statements
Separate
financial statements
Land Buildings
Machinery
and
equipment
Motor
Vehicles Total Buildings
1 January 2020 (Note 4) 198 90 1 25 314 5
Additions - 134 9 5 148 -
Depreciation for the year (2) (78) (3) (15) (98) (5)
Translation adjustment (6) 18 2 (1) 13 -
31 December 2020 190 164 9 14 377 -
b) Lease liabilities (Unit: Million Baht) Consolidated
financial statements Separate
financial statements
2020 2020 Lease payments 184 - Less: Deferred interest expenses (3) -
Total 181 - Less: Portion due within one year (73) -
Lease liabilities - net of current portion 108 -
A maturity analysis of lease payments is disclosed in Note 34.2 under the liquidity risk.

45
c) Expenses relating to leases that are recognised in profit or loss (Unit: Million Baht)
For the year ended 31 December 2020
Consolidated financial statements
Separate financial statements
Depreciation expense of right-of-use assets 98 5 Interest expense on lease liabilities 2 - Expense relating to short-term leases and
leases of low-value assets 69 14
d) Other
The Group had total cash outflows for leases for the year ended 31 December 2020 of Baht 150 million, including the cash outflow related to short-term lease and leases of low-value assets.
22. Provision for long-term employee benefits
Provision for long-term employee benefits, which represents compensation payable to employees after they retire, was as follows:
(Unit: Million Baht) Consolidated
financial statements Separate
financial statements
2020 2019 2020 2019 Defined benefit obligation (1,602) (1,474) (465) (445) Fair value of plan assets 60 47 - -
Provisions for long-term employee benefits as at 31 December (1,542) (1,427) (465) (445)
The change in the defined benefit obligation is as follows: (Unit: Million Baht)
Consolidated financial statements
Separate financial statements
2020 2019 2020 2019 Defined benefit obligation at beginning of year (1,474) (1,273) (445) (282) Included in profit or loss:
Current service cost (64) (50) (42) (33) Interest cost (23) (28) (11) (9) Past service costs and gains or losses on
settlement - (110) - (102) Included in other comprehensive income:
Actuarial loss arising from Demographic assumptions changes (17) (142) - (22) Financial assumptions changes - (11) - (11) Experience adjustments (2) (11) - (8)
Benefits paid during the year 77 61 33 22 Translation adjustments (99) 90 - -
Defined benefit obligation at end of year (1,602) (1,474) (465) (445)

46
The change in the fair value of plan assets is as follows:
(Unit: Million Baht)
Consolidated
financial statements
Separate
financial statements
2020 2019 2020 2019
Fair value of plan assets at beginning of year 47 39 - -
Included in profit or loss:
Interest income on plan assets 3 3 - -
Contributions by employer 14 11 - -
Benefits paid during the year (3) (2) - -
Translation adjustments (1) (4) - -
Fair value of plan assets at end of year 60 47 - -
The amount of each major category constitutes of the fair value of the total plan assets are
as follows:
(Unit: Million Baht)
Consolidated
financial statements
Separate
financial statements
2020 2019 2020 2019
Government bonds 35 28 - -
Debentures 20 16 - -
Others 5 3 - -
The Group expects to pay Baht 92 million of long-term employee benefits during the next
year (The Company only: Baht 24 million) (2019: Baht 72 million, the Company only: Baht 10
million).
As at 31 December 2020, the weighted average duration of the liabilities for long-term
employee benefit of the Group is 9 - 21 years (The Company only: 14 years) (2019: 9 - 22 years,
the Company only: 14 years).

47
Significant actuarial assumptions are summarised below:
(Unit: percent per annum)
Consolidated
financial statements
Separate
financial statements
2020 2019 2020 2019
Discount rate 0.7 - 6.7 0.8 - 7.7 2.5 2.5
Future salary increase rates (depending on age) 2.3 - 9.0 2.3 - 9.0 2.3 - 9.0 2.3 - 9.0
Pension increase rate 1.5 1.5 - -
Turnover rate 0.8 - 15.0 0.8 - 15.0 3.5 - 15.0 3.5 - 15.0
The result of sensitivity analysis for significant assumptions that affect the present value of
the long-term employee benefit obligation as at 31 December 2020 and 2019 are summarised
below:
(Unit: Million Baht)
As at 31 December 2020
Consolidated
financial statements
Separate
financial statements
Increase
0.5%-10%
Decrease
0.5%-10%
Increase
1%-10%
Decrease
1%-10%
Discount rate Decrease 122 Increase 138 Decrease 46 Increase 54
Future salary increase rates (depending on age) Increase 61 Decrease 54 Increase 56 Decrease 50
Pension increase rate Increase 67 Decrease 61 - -
Turnover rate Decrease 24 Increase 27 Decrease 20 Increase 21
(Unit: Million Baht)
As at 31 December 2019
Consolidated
financial statements
Separate
financial statements
Increase
0.5%-10%
Decrease
0.5%-10%
Increase
1%-10%
Decrease
1%-10%
Discount rate Decrease 92 Increase 147 Decrease 23 Increase 71
Future salary increase rates (depending on age) Increase 73 Decrease 24 Increase 69 Decrease 22
Pension increase rate Increase 61 Decrease 56 - -
Turnover rate Decrease 1 Increase 44 Increase 2 Increase 40

48
23. Provisions
(Unit: Million Baht)
Consolidated financial statements Separate financial statements
Other Other
Warranty provisions Total Warranty provisions Total
Balance as at 1 January 2019
- restated 485 40 525 271 8 279
Recognition during year 251 88 339 102 7 109
Decrease during year (34) (5) (39) (23) - (23)
Reversal during year (117) (78) (195) (64) - (64)
Translation adjustment/unrealised
gain on exchange rate (146) (3) (149) (12) - (12)
Balance as at 31 December 2019
- restated 439 42 481 274 15 289
Recognition during year 209 75 284 103 - 103
Decrease during year (8) (19) (27) (8) (15) (23)
Reversal during year (168) (78) (246) (68) - (68)
Translation adjustment/unrealised
loss on exchange rate 3 2 5 1 - 1
Balance as at 31 December 2020 475 22 497 302 - 302
Short-term provisions 67 25 92 - - -
Long-term provisions 372 17 389 274 15 289
Balance as at 31 December 2019
- restated 439 42 481 274
15 289
Short-term provisions 57 19 76 - - -
Long-term provisions 418 3 421 302 - 302
Balance as at 31 December 2020 475 22 497 302 - 302
Warranty
The Group recognised a provision for the expected warranty claims on products based on
past experience of the level of repairs and returns with current sales for each type of products
under current warranty.

49
24. Statutory reserve
Pursuant to Section 116 of the Public Limited Companies Act B.E. 2535, the Company is
required to set aside to a statutory reserve at least 5 percent of its net profit after deducting
accumulated deficit brought forward (if any) until the reserve reaches 10 percent of the
registered capital. The statutory reserve is not available for dividend distribution. At present,
the statutory reserve has fully been set aside.
25. Dividends
Dividends declared in 2020 and 2019 consisted of the followings:
Dividends Approved by Total dividends Dividend per share
(Million Baht) (Baht)
Final dividend for year 2019 Annual General Meeting of the
shareholders on 31 March 2020 2,245 1.80
Final dividend for year 2018 Annual General Meeting of the
shareholders on 2 April 2019 2,869 2.30
26. Expenses by nature
Significant expenses classified by nature are as follows:
(Unit: Million Baht)
Consolidated
financial statements
Separate
financial statements
2020 2019 2020 2019
(Restated)
Salaries, wages and other employee benefits 9,343 8,610 5,983 5,375
Raw materials used and purchase of
finished goods 40,230 33,087 32,918 25,242
Changes in finished goods and work in
progress (1,815) (733) (406) (674)
Depreciation 2,075 1,630 1,598 1,333
Amortisation 132 105 2 1
Commission expenses 843 667 1,058 836
Marketing fee 48 12 125 97
Design and engineering fee 6 51 1,943 1,924
Services paid 122 96 122 96
Royalty paid 1,698 1,215 1,698 1,215

50
27. Income tax
Income tax expenses for the years ended 31 December 2020 and 2019 are made up as
follows:
(Unit: Million Baht)
Consolidated
financial statements
Separate
financial statements
2020 2019 2020 2019
(Restated)
Current income tax:
Current income tax charge (230) (86) (49) -
Adjustment in respect of income tax of previous year 26 2 - -
Deferred tax:
Relating to origination and reversal of temporary
differences 6 49 - -
Translation adjustment 9 12 - -
Income tax expenses reported in profit or loss (189) (23) (49) -
The reconciliation between accounting profit and income tax expenses is shown below.
(Unit: Million Baht)
Consolidated financial statements Separate financial statements
2020 2019 2020 2019
(Restated)
Accounting profit before tax 7,259 2,997 7,082 2,419
Income tax at Thai corporate income tax rate of 20% (1,452) (599) (1,416) (483)
Adjust in respect of income tax of previous years 26 2 - -
Effect of elimination entries on the consolidated financial
statements (161) 24 - -
Tax effect of:
Difference in tax rates of overseas subsidiaries (35) (26) - -
Tax savings from the tax privileges granted by the
government
1,336
506
1,335
498
Loss for the current year (17) (11) - (7)
Non-deductible expenses (4) (14) - (1)
Unrecognised deferred tax assets on temporary differences (48) 46 (7) (7)
Utilisation of previously unrecognised deferred tax
asset on tax losses
80
45
38
-
Exemption of income 75 - - -
Others 11 4 1 -
Total 1,398 550 1,367 483
Income tax expenses reported in profit or loss (189) (23) (49) -

51
The tax rates enacted at the end of the reporting period of the subsidiaries in overseas
countries are 0% to 35%.
As at 31 December 2020 and 2019, the components of deferred tax assets and deferred tax
liabilities are as follows:
(Unit: Million Baht)
Consolidated
financial statements
Separate
financial statements
2020 2019 2020 2019
(Restated)
Deferred tax assets
Allowance for expected credit losses
(2019: Allowance for doubtful
accounts) 24 54 - -
Allowance for diminution in value of
inventories 190 168
- -
Bonus payable - 11 - -
Provision for warranty 10 8 - -
Tax loss brought forward 2 3 - -
Others 63 39 - -
Total 289 283 - -
Deferred tax liabilities
Difference depreciation for tax purpose 114 114 - -
Total 114 114 - -
As at 31 December 2020 the Group has deductible temporary differences and unused tax
losses totaling Baht 3,628 million, INR 276 million or approximately Baht 112 million and
EUR 38 million or approximately Baht 1,404 million (2019: Baht 4,382 million, INR 316 million
or approximately Baht 133 million, EUR 43 million or approximately Baht 1,458 million, RUB
49 million or approximately Baht 24 million and MMK 74 million or approximately Baht 1
million). No deferred tax assets have been recognised on these amounts as the Company
has been granted tax privileges by the Board of Investment and the subsidiaries have
determined that they may not be able to utilise the deductible temporary difference and
unused tax losses because they do not yet have any taxable profits and they are unable to
estimate the benefit they would generate from utilisation of such deductible temporary
difference and unused tax losses.

52
Detail of expiry date of unused tax losses are summarised as below:
(Unit: Million Baht)
Consolidated
financial statements
Separate
financial statements
2020 2019 2020 2019
The five-year limitation period
31 December 2020 - 1 - -
31 December 2021 5 5 - -
31 December 2022 193 539 177 523
31 December 2023 22 46 - -
31 December 2024 24 - 14 -
The eight-year limitation period
31 March 2020 - 17 - -
31 March 2021 33 34 - -
31 March 2022 21 22 - -
31 March 2023 13 13 - -
31 March 2024 15 15 - -
No expiry date 1,435 1,490 - -
Total 1,761 2,182 191 523
As at 31 December 2020, the total amount of temporary differences associated with
investments in subsidiaries and associates for which deferred tax liability has not been
recognised, is Baht 309 million (2019: Baht 230 million).

53
28. Promotional privileges
The Company was granted promotional privileges by the Board of Investment subject to certain significant conditions. Significant privileges of the
Company are as follows: Details The Company 1. Certificate No. 1494(2)/2552 2061(1)/2553 1732(2)/2557 1158(2)/2558 1688(2)/2558 61-1505-1-00-1-0 62-0076-1-00-0-0 63-0114-1-00-1-0 63-0340-1-00-1-0 2. Promotional privileges for Manufacturing of
DC FAN Manufacturing of
telecommunication equipment and
electronics products for vehicle
Manufacturing of electro - magnetic
products
Manufacturing of electro - magnetic
products
Manufacturing of DC FAN
Manufacturing of electro - magnetic
products
Manufacturing of Ventilation Fan.
Manufacturing of
telecommunication
equipment
Manufacturing of electric vehicle
equipment
3. The significant privileges are 3.1 Exemption from corporate income tax for net income
from the promoted operations and exemption from income tax on dividends paid from the income of the operations throughout the period in which the corporate income tax is exempted.
8 years (Maximum amount Baht 298,170,000)
8 years 7 years (Maximum amount Baht 124,000,000)
7 years (Maximum amount Baht 155,000,000)
7 years (Maximum amount Baht 538,898,005)
4 years (Maximum amount
Baht 1,572,170,000)
Non-granted 6 years
(Maximum amount
Baht 397,000,000)
8 years (Maximum amount
Baht 1,547,250,000)
3.2 Exemption from import duty on machinery as approved by the board.
Granted Granted Granted Granted Granted Granted Granted Granted Granted
3.3 Exemption from import duty on raw materials and significant supplies used in export production.
Granted Non - granted Granted Granted Granted Granted Granted Granted Granted
3.4 A fifty percent reduction of the normal rate of corporate income tax on net earnings derived from the promoted activity for a period of five years after the expiration of the above corporate income tax exemption period.
Non - granted Granted Non - granted Non - granted Non - granted Non - granted Non - granted Non - granted Non - granted
3.5 Two times deduction of transportation, electricity and water supply for corporate income tax purpose for a period of ten years commencing as from the date of earning operating income.
Non - granted Granted Non - granted Non - granted Non - granted Non - granted Non - granted Non - granted Non - granted
3.6 Permission to deduct cost of public utilities at the rate of twenty-five percent in addition to normal depreciation charges.
Non - granted Granted Non - granted Non - granted Non - granted Non - granted Non - granted Non - granted Non - granted
4. Date of first earning operating income 15 March 2013 10 January 2015 5 January 2018 5 January 2017 1 December 2017 Not yet commenced operation
27 July 2019 8 January 2020 Not yet commenced operation
5. Additional right and benefit Granted the additional tax incentive under
the Skill, Technology and Innovation
- Granted the additional tax incentive under
the Skill, Technology and Innovation
Granted the additional tax incentive under
the Skill, Technology and Innovation
- - - - -

54
The Company’s operating revenues for the years ended 31 December 2020 and 2019,
divided between promoted and non-promoted operations, are summarised below.
(Unit: Million Baht)
Promoted operations Non-promoted operations Total
2020 2019 2020 2019 2020 2019
Separate financial statements
Sales and service income
Domestic sales 337 365 337 73 674 438
Export sales 51,085 36,222 1,942 3,424 53,027 39,646
Service income - - 61 38 61 38
Total Sales and service income 51,422 36,587 2,340 3,535 53,762 40,122
Significant tax privileges which were granted to other subsidiaries of the Company are as
follows:
- Delta Green Industrial (Thailand) Company Limited was granted promotional privileges
by the Board of Investment for the manufacture of Inverters, pursuant to the promotion
certificate No. 1813(2)/2554 issued on 10 May 2011, and the manufacture of electric
light bulbs and display monitors, pursuant to the promotion certificate No. 1814(2)/2554
issued on 24 May 2011. Subject to certain imposed conditions, the privileges include
the followings:-
1) An exemption from corporate income tax on all profit from the promoted
operations for a period of seven years from the date those operations
commence generating revenues, with the exemption capped at 100 percent of
investment, excluding land costs and working capital, or maximum amounts of
Baht 182 million for the promotion certificate No. 1813(2)/2554 and Baht 202
million for the promotion certificate No. 1814(2)/2554.
2) An exemption from import duty on machinery as approved by the Board of
Investment.
3) An exemption from import duty on raw materials and significant supplies used
in export production.
Delta Green Industrial (Thailand) Company Limited has not yet commenced the operations
under promotional privileges.

55
- On 20 March 2019, Delta Electronics India Pvt. Ltd. was granted tax privileges by
the Government of India for operations in a special economic zone at Krishnagiri.
Subject to certain imposed conditions, the privileges include an exemption from
corporate income tax for a period of 15 years from the year in which the promoted
operations commenced, ending on 31 March 2034.
29. Earnings per share
Basic earnings per share is calculated by dividing profit for the year attributable to equity
holders of the Company (excluding other comprehensive income) by the weighted average
number of ordinary shares in issue during the year.
30. Segment information
Operating segment information is reported in a manner consistent with the internal reports
that are regularly reviewed by the chief operating decision maker in order to make decisions
about the allocation of resources to the segment and assess its performance. The chief operating
decision maker has been identified as president of the Group.
The basis of accounting for any transactions between reportable segments is consistent with
that for third party transactions.

56
The following tables present revenue and profit information regarding the Group’s operating segments for the year ended 31 December 2020 and 2019, respectively.
(Unit: Million Baht)
Power
electronics
segment 1)
Infrastructure
segment 2)
Automation
segment 3) Others
Consolidated
financial
statements 2020 2019 2020 2019 2020 2019 2020 2019 2020 2019
(Restated) (Restated) (Restated) (Restated) (Restated)
Revenue
Sales from external
customers 44,912 32,228 15,660 16,896 1,718 1,901 51 126 62,341 51,151
Service income from
external customers 108 68 592 567 93 219 74 42 867 896
Total revenue 45,020 32,296 16,252 17,463 1,811 2,120 125 168 63,208 52,047
Segment profit (loss) 5,776 2,544 1,710 552 (11) 216 (1,118) (990) 6,357 2,322
Unallocated income (expenses):
Gain on exchange rate 388 32
Other income 507 429
Loss on sales of investments in associated companies (95) -
Other expenses (68) (47)
Share of profit from investments in associated companies 61 25
Finance income 111 238
Finance cost (1) (2)
Profit before income tax expenses 7,260 2,997
Income tax expenses for the year (189) (23)
Income tax expenses resulting from tax assessments (19) -
Profit for the year 7,052 2,974
1) The power electronics segment is a business segment which designs, manufactures, and sales of power supplies
applied to computer, server, office automation equipment, household electric appliances and automotive electronic
products. The main products are DC-DC Converter, Power supply for Computer & Server, DES product, Automotive
electronic product, Fan and thermal product, Adaptor product for industrial and private consumer, Solenoid and EMI
filters etc.
2) Infrastructure segment is a business segment which designs, manufactures, and installations of information and
communication technology infrastructure and energy system infrastructure. The main products are Telecommunication
system, Renewable energy, Energy storage and High power etc.
3) Automation segment is a business segment which designs, manufactures, and installations of industrial and building
automation. The main products are Machine automation, Industrial motion system, Smart sensor system and Lighting
automation for building etc.

57
Geographic information:
Revenue from external customers is based on locations of the customers
(Unit: Million Baht)
2020 2019
(Restated)
United States 22,041 13,032
China 8,722 7,833
Germany 5,705 5,274
India 4,641 6,274
Ireland 3,947 2,464
Singapore 3,640 2,958
Norway 1,952 1,962
Taiwan 1,850 1,254
Netherlands 1,367 1,250
Others 9,343 9,746
Total 63,208 52,047
Non-current assets (Other than financial instruments, deferred tax assets and net defined
benefit assets)
(Unit: Million Baht)
2020 2019
(Restated)
Thailand 6,958 6,651
Slovakia 1,559 1,460
India 3,986 3,090
Germany 989 743
Others 338 294
Total 13,830 12,238
Major customer
For the year 2020 and 2019, the Group has no major customer with revenue of 10 percent
or more of an entity’s revenues.

58
31. Provident fund
The Company and its employees have jointly established a provident fund in accordance
with the Provident Fund Act B.E. 2530. Both employees and the Company contribute to the
fund monthly, at rates of 7 percent of basic salary (2019: 7 percent of basic salary). The fund,
which is managed by TMB Bank Public Company Limited, will be paid to employees upon
termination or when employees are promoted to a manager post, in accordance with the
fund rules. The contributions for the year 2020 amounting to approximately Baht 121 million
(2019: Baht 111 million) were recognised as expenses.
The provident funds of the subsidiaries and their employees have been established in
accordance with each subsidiary’s policies and the law of its country of domicile.
32. Commitments and contingent liabilities
32.1 Capital commitments
As at 31 December 2020, the Group had significant capital commitments amounting to Baht
113 million, EUR 2 million or approximately Baht 78 million, USD 0.3 million or approximately
Baht 10 million and INR 5,679 million or approximately Baht 2,314 million in respect of the
building construction, purchase of machinery and equipment (2019: Baht 723 million, EUR 1
million or approximately Baht 35 million, USD 1 million or approximately Baht 42 million and
INR 7,931 million or approximately Baht 3,334 million) (The Company only: Baht 113 million,
2019: Baht 723 million).
32.2 Lease commitments
As at 31 December 2020 and 2019, future minimum lease payments required under these
operating lease commitments were as follows.
As at 31 December 2020
Payable
Foreign currency Amount
In up to
1 year
In over 1 and
up to 5 years
In over
5 years
(Million in foreign
currency)
(Million Baht) (Million Baht) (Million Baht)
Euro 2 21 37 29
Total 21 37 29

59
As at 31 December 2019
Payable
Foreign currency Amount
In up to
1 year
In over 1 and
up to 5 years
In over
5 years
(Million in foreign
currency)
(Million Baht) (Million Baht) (Million Baht)
Indian rupee 202 44 41 -
Euro 2 39 37 7
US dollar 1 8 9 -
Australian dollar 1 7 9 -
Total 98 96 7
32.3 Long-term service commitments
32.3.1 Intellectual Property & Technology License commitments
The Company entered into the Intellectual Property & Technology License Agreement with Delta Electronics Inc. (“Licensor”), whereby the Licensor granted the Company the right to manufacture and sell products that apply the Licensor’s patents and technology, including improvements thereof. In consideration for the rights, the Company agrees to pay a royalty to the Licensor at a percentage of revenue from sales of products manufactured under the licenses, with that percentage determined on an arm’s length basis. The percentage is to be amicably reviewed by the parties annually before each anniversary of the effective date, which was 1 January 2018. The agreement matures annually and renews continuously for further periods of one year until terminated by either party. The Company has recorded the related expense as “Royalty expenses”, which are presented under the caption of “Selling and distribution expenses” in the statements of comprehensive income. For the year 2020, the Company has recorded royalty expenses of approximately Baht 1,698 million (2019: Baht 1,215 million) under this agreement.
32.3.2 Research and development service commitments
The Company entered into a research and development service agreement with the subsidiary companies. Under this agreement, the subsidiary companies provides research and development services (design and engineering) to the Company and charges fees equal to the local operational costs incurred on product research and development plus a margin, on an arm’s length basis. This agreement matures annually.
The Company has recorded the design and engineering fees as “Research and development expenses” in the statements of comprehensive income. For the year 2020, the Company has recorded design and engineering expenses of approximately Baht 1,934 million (2019: Baht 1,924 million) under this agreement.
60
32.4 Guarantee obligations
As at 31 December 2020, the Group had the following significant outstanding letters of
guarantee required in the ordinary course of their businesses:
32.4.1 Outstanding letters of guarantee totaling approximately Baht 373 million (2019: Baht
369 million) have been issued by banks to meet requirements of the Company
(including a letter of guarantee for approximately Baht 335 million (2019: Baht 335
million) issued by banks to meet obligations of the Company to the Revenue
Department in relation to the tax assessment mentioned in Note 32.5.1 to the
financial statements).
32.4.2 Outstanding letters of guarantee for totals of approximately INR 1,249 million or
approximately Baht 509 million, EUR 0.4 million or approximately Baht 13 million, AUD
2 million or approximately Baht 38 million have been issued by banks to meet
requirements of the subsidiaries (2019: INR 1,156 million or approximately Baht 486
million, EUR 0.3 million or approximately Baht 12 million).
32.5 Tax assessment
32.5.1 a. In 2015, the Company received tax assessment notices for the year 2005 from
the Revenue Department, assessing corporate income tax amounting to
approximately Baht 1.96 million (including penalties and surcharges) and specific
business tax amounting to approximately Baht 0.06 million (including penalties
and surcharges). The Company has submitted letter appealing the assessments
to the Tax Appeal Committee of the Revenue Department and the appeal is
currently under consideration by the Committee. In addition, the Company
received tax assessment notices for the year 2006 from the Revenue Department
in 2016, assessing corporate income tax amounting to approximately Baht 168
million (including penalties and surcharges) and specific business tax amounting
to approximately Baht 2 million (including penalties and surcharges). The
Company has submitted letter appealing the assessments to the Tax Appeal
Committee of the Revenue Department and the appeal is currently under
consideration by the Committee.
b. On 23 August 2017, the Company received tax assessment notices for the year
2007 from the Revenue Department, assessing corporate income tax amounting
to approximately Baht 79 million (including penalties and surcharges) and
specific business tax amounting to approximately Baht 3 million (including
penalties and surcharges). The Company has submitted letter appealing the
assessments to the Tax Appeal Committee of the Revenue Department and the
appeal is currently under consideration by the Committee.

61
c. On 21 August 2018, the Company received tax assessment notices for the year
2008 from the Revenue Department, assessing corporate income tax amounting
to approximately Baht 49 million (including penalties and surcharges) and
specific business tax amounting to approximately Baht 4 million (including
penalties and surcharges). The Company has submitted letter appealing the
assessments to the Tax Appeal Committee of the Revenue Department and the
appeal is currently under consideration by the Committee.
d. On 20 August 2019, the Company received tax assessment notices for the year
2009 from the Revenue Department, assessing corporate income tax amounting
to approximately Baht 23 million (including penalties and surcharges) and
specific business tax amounting to approximately Baht 5 million (including
penalties and surcharges). The Company has submitted letter appealing the
assessments to the Tax Appeal Committee of the Revenue Department and the
appeal is currently under consideration by the Committee.
During the current year, the Company has recorded provisions for tax assessments
totaling approximately Baht 19 million under the caption of “Income tax expenses
resulting from tax assessments” in the statement of comprehensive income.
As a result, the Company has recorded provisions totaling approximately Baht 258
million (including penalties and surcharges) for the tax assessments mentioned in
a., b., c., and d., under the caption of “Liabilities and provision from tax assessments”
in the statement of financial position.
32.5.2 The Indian tax authorities assessed corporate income tax of approximately INR 232
million or approximately Baht 94 million, covering the years 2003 - 2016, and sales
tax and excise duties of approximately INR 256 million or approximately Baht 104
million, covering the years 2005 - 2018, against the subsidiaries in India. The
subsidiaries have appealed the assessments. The management of the subsidiaries
believe that the outcome of the cases will be favorable to the companies and
therefore no provision for these contingent liabilities have been made in the
accounts.

62
33. Fair value hierarchy
As at 31 December 2020 and 2019, the Group had certain assets and liabilities that were
measured at fair value or for which fair value were disclosed using different levels of inputs
(as mentioned in Note 5.19 to the financial statements) as follows:
(Unit: Million Baht)
Consolidated financial statements
As at 31 December 2020
Level 1 Level 2 Level 3 Total
Assets measured at fair value
Foreign currency forward contracts (Note 11) - 149 - 149
Liabilities measured at fair value
Foreign currency forward contracts - 1 - 1
Assets for which fair value are disclosed
Investment properties (Note 15) - - 261 261
(Unit: Million Baht)
Consolidated financial statements
As at 31 December 2019
Level 1 Level 2 Level 3 Total
Assets measured at fair value
Foreign currency forward contracts (Note 12) - 34 - 34
Liabilities measured at fair value
Foreign currency forward contracts (Note 20) - 1 - 1
Assets for which fair value are disclosed
Investment properties (Note 15) - - 228 228
(Unit: Million Baht)
Separate financial statements
As at 31 December 2020
Level 1 Level 2 Level 3 Total
Assets measured at fair value
Foreign currency forward contracts (Note 11) - 149 - 149
(Unit: Million Baht)
Separate financial statements
As at 31 December 2019
Level 1 Level 2 Level 3 Total
Assets measured at fair value
Foreign currency forward contracts (Note 12) - 33 - 33

63
34. Financial instruments
34.1 Derivatives
(Unit: Million Baht)
Consolidated
financial statements
Separate
financial statements
2020 2019 2020 2019
Derivative assets
Derivative assets not designated as hedging
instruments
- Foreign currency forward contracts 149 34 149 33
Total derivative assets 149 34 149 33
Derivative liabilities
Derivatives liabilities not designated as
hedging instruments
- Foreign currency forward contracts 1 1 - -
Total derivative liabilities 1 1 - -
Derivatives not designated as hedging instruments
The Group uses foreign currency forward contracts to manage some of its transaction
exposures. The contracts are entered into for periods consistent with foreign currency
exposure of the underlying transactions, generally from 1 - 4 months.
34.2 Financial risk management objectives and policies
The Group’s financial instruments principally comprise cash and cash equivalents, trade
accounts receivable, other accounts receivable, and investments. The financial risks associated
with these financial instruments and how they are managed is described below.
Credit Risk
The Group is exposed to credit risk primarily with respect to trade accounts receivable, other
accounts receivable, deposits with banks and financial institutions and other financial
instruments. Except for derivatives, the maximum exposure to credit risk is limited to the
carrying amounts as stated in the statement of financial position. The Group’s maximum
exposure relating to derivatives is noted in the liquidity risk topic.

64
Trade receivables
The Group manages the risk by adopting appropriate credit control policies and procedures
and therefore does not expect to incur material financial losses. Outstanding trade receivables
are regularly monitored and any shipments to major customers are generally covered by
letters of credit or other forms of credit insurance obtained from reputable banks and other
financial institutions. In addition, the Group does not have high concentrations of credit risk
since it has a large customer base in various industries.
An impairment analysis is performed at each reporting date to measure expected credit
losses. The provision rates are based on days past due for groupings of various customer
segments with similar credit risks. The Group classifies customer segments by geography,
product type, customer type and rating, and coverage by letters of credit and other forms of
credit insurance.
Financial instruments and cash deposits
The Group manages the credit risk from balances with banks and financial institutions by
making investments only with approved counterparties.
The credit risk is limited because the counterparties are banks with high credit-ratings
assigned by international credit-rating agencies.
Market risk
There are two types of market risk comprising currency risk and interest rate risk. The Group
enters into derivatives, in the form of foreign currency forward contracts, in order to hedge the
foreign currency risk arising on the export or import of goods.
Foreign currency risk
The Group’s exposure to the foreign currency risk relates primarily to its trading transactions
that are denominated in foreign currencies. The Group seeks to reduce this risk by entering
into foreign currency forward contracts when it considers appropriate. Generally, the forward
contracts mature within one year.

65
As at 31 December 2020 and 2019, the balances of the financial assets and financial liabilities
denominated in foreign currencies are summarised below:
(Unit: Million foreign currency unit)
As at 31 December
Foreign Consolidated financial statements Separate financial statements
currency Financial assets Financial liabilities Financial assets Financial liabilities
2020 2019 2020 2019 2020 2019 2020 2019
US dollar 263 165 106 189 466 320 326 189
Euro 6 6 2 2 6 5 11 16
Japanese yen 177 201 124 246 177 201 367 244
(Unit: Baht per 1 foreign currency unit)
Foreign currency Average exchange rate as at 31 December
2020 2019
US dollar 30.0371 30.1540
Euro 36.8764 33.7311
Japanese yen 0.2907 0.2759
Foreign currency sensitivity
The following tables demonstrate the sensitivity of the Group’s profit before tax to a reasonably
possible change in US dollar, Euro and Japanese yen exchange rates, with all other variables
held constant. The impact on the Group’s profit before tax is due to changes in the fair value of
monetary assets and liabilities including non-designated foreign currency derivatives as at
31 December 2020. The Group’s exposure to foreign currency changes for all other currencies
is not material.
Currency Change in FX rate Effect on profit before tax
(%) (Million Baht)
US dollar +3 141
- 3 (141)
Euro +4 6
-4 (6)
Japanese yen +2 0.3
-2 (0.3)
This information is not a forecast or prediction of future market conditions and should be used
with care.

66
As at 31 December 2020 and 2019, the outstanding forward contracts are summarised below.
Consolidated financial statements
As at 31 December 2020
Amount Forward rate Maturity date
Forward contracts to “Sell”
USD/THB USD 170 million 29.9800 - 31.6900 THB/USD January - April 2021
Forward contracts to “Buy”
USD/INR USD 6 million 73.7350 - 73.8625 INR/USD January 2021
JPY/THB JPY 90 million 0.2892 - 0.2916 THB/JPY January - March 2021
Consolidated financial statements
As at 31 December 2019
Amount Forward rate Maturity date
Forward contracts to “Sell”
USD/THB USD 122 million 30.0900 - 30.5300 THB/USD January - April 2020
Forward contracts to “Buy”
USD/INR USD 17 million 70.9694 - 71.9917 INR/USD January 2020
Separate financial statements
As at 31 December 2020
Amount Forward rate Maturity date
Forward contracts to “Sell”
USD/THB USD 170 million 29.9800 - 31.6900 THB/USD January - April 2021
Forward contracts to “Buy”
JPY/THB JPY 90 million 0.2892 - 0.2916 THB/JPY January - March 2021
Separate financial statements
As at 31 December 2019
Amount Forward rate Maturity date
Forward contracts to “Sell”
USD/THB USD 122 million 30.0900 - 30.5300 THB/USD January - April 2020

67
Interest rate risk
The Group’s exposure to interest rate risk relates primarily to its cash at banks. Most of the Group’s financial assets and financial liabilities bear floating interest rates or fixed interest rates which are close to the market rate.
As at 31 December 2020 and 2019, significant financial assets and financial liabilities classified by type of interest rates are summarised in the table below, with those financial assets and liabilities that carry fixed interest rates further classified based on the maturity date, or the repricing date if this occurs before the maturity date. (Unit: Million Baht)
Consolidated financial statements
As at 31 December 2020
Fixed interest rates Floating
Within Over interest Non-interest
1 year 1 - 5 years 5 years rate bearing Total Interest rate
(% p.a.)
Financial assets
Cash and cash equivalents 2,922 - - 9,415 1,545 13,882 0.00 - 8.00
Trade and other receivables - - - - 13,997 13,997 -
Other financial assets 205 - - - 149 354 3.50 - 4.00
Deposits at bank with
restrictions - - - 1 50 51 3.00 - 5.00
Total 3,127 - - 9,416 15,741 28,284
Financial liabilities
Trade and other payables - - - - 16,181 16,181 -
Total - - - - 16,181 16,181
(Unit: Million Baht)
Consolidated financial statements
As at 31 December 2019 - restated
Fixed interest rates Floating
Within Over interest Non-interest
1 year 1 - 5 years 5 years rate bearing Total Interest rate
(% p.a.)
Financial assets
Cash and cash equivalents 2,931 - - 8,377 1,196 12,504 0.00 - 8.25
Current investments 2 - - - - 2 4.00
Trade and other receivables - - - - 9,845 9,845 -
Deposits at bank with
restrictions 1 47 - - 2 50 5.25 - 8.17
Total 2,934 47 - 8,377 11,043 22,401
Financial liabilities
Trade and other payables - - - - 10,255 10,255 -
Total - - - - 10,255 10,255

68
(Unit: Million Baht)
Separate financial statements
As at 31 December 2020
Fixed interest rates Floating
Within Over interest Non-interest
1 year 1 - 5 years 5 years rate bearing Total Interest rate
(% p.a.)
Financial assets
Cash and cash equivalents - - - 8,404 2 8,406 0.00 - 0.55
Trade and other receivables - - - - 14,147 14,147 -
Total - - - 8,404 14,149 22,553
Financial liabilities
Trade and other payables - - - - 13,745 13,745 -
Total - - - - 13,745 13,745
(Unit: Million Baht)
Separate financial statements
As at 31 December 2019
Fixed interest rates Floating
Within Over interest Non-interest
1 year 1 - 5 years 5 years rate bearing Total Interest rate
(% p.a.)
Financial assets
Cash and cash equivalents - - - 6,195 38 6,233 0.00 - 1.20
Trade and other receivables - - - - 9,468 9,468 -
Total - - - 6,195 9,506 15,701
Financial liabilities
Trade and other payables - - - - 8,474 8,474 -
Total - - - - 8,474 8,474
The Group only exposure to interest rate risk related to cash at bank. Since the interest rates
on savings accounts are considered low and fluctuate only slightly, the management believes
that the impact of interest rate risk is immaterial.
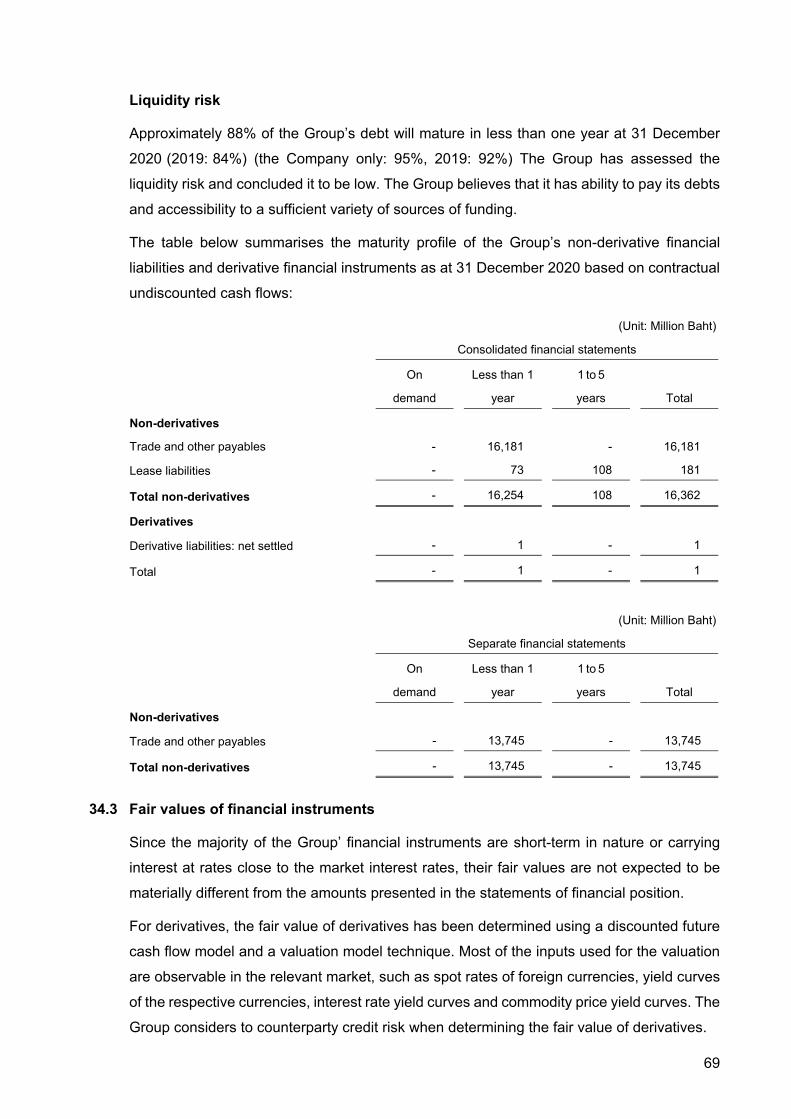
69
Liquidity risk
Approximately 88% of the Group’s debt will mature in less than one year at 31 December
2020 (2019: 84%) (the Company only: 95%, 2019: 92%) The Group has assessed the
liquidity risk and concluded it to be low. The Group believes that it has ability to pay its debts
and accessibility to a sufficient variety of sources of funding.
The table below summarises the maturity profile of the Group’s non-derivative financial
liabilities and derivative financial instruments as at 31 December 2020 based on contractual
undiscounted cash flows: (Unit: Million Baht) Consolidated financial statements
On
demand
Less than 1
year
1 to 5
years Total
Non-derivatives
Trade and other payables - 16,181 - 16,181
Lease liabilities - 73 108 181
Total non-derivatives - 16,254 108 16,362
Derivatives
Derivative liabilities: net settled - 1 - 1
Total - 1 - 1
(Unit: Million Baht) Separate financial statements
On
demand
Less than 1
year
1 to 5
years Total
Non-derivatives
Trade and other payables - 13,745 - 13,745
Total non-derivatives - 13,745 - 13,745
34.3 Fair values of financial instruments
Since the majority of the Group’ financial instruments are short-term in nature or carrying
interest at rates close to the market interest rates, their fair values are not expected to be
materially different from the amounts presented in the statements of financial position.
For derivatives, the fair value of derivatives has been determined using a discounted future
cash flow model and a valuation model technique. Most of the inputs used for the valuation
are observable in the relevant market, such as spot rates of foreign currencies, yield curves
of the respective currencies, interest rate yield curves and commodity price yield curves. The
Group considers to counterparty credit risk when determining the fair value of derivatives.

70
35. Capital management
The primary objective of the Group’s capital management is to ensure that it has appropriate
capital structure in order to support its business and maximise shareholder value. As at
31 December 2020, the Group's debt-to-equity ratio was 0.52:1 (2019 - restated: 0.39:1) and
the Company's was 0.40:1(2019: 0.29:1).
36. Events after the reporting period
On 19 February 2021, the Company’s Board of Directors’ meeting passed the resolution to
propose the Annual General Meeting of shareholders approve a dividend payment of Baht
3.3 per share, a total of Baht 4,116 million. The dividend will be paid from the Company’s
operating results for the year 2020.
37. Approval of financial statements
These financial statements were authorised for issue by the Company’s Board of Directors on
19 February 2021.