delta region community health system development (drchsd
TRANSCRIPT
Delta Region Community Health System Development (DRCHSD) Program
1
This project is supported by the Health Resources and Services Administration (HRSA) of the U.S. Department of Health and Human Services (HHS) as part of a financial assistance award totaling $10,000,000 with 100% funded by HRSA/HHS and $0 amount and 0% funded by non-government sources. The contents are those of the author(s) and do not necessarily represent the official views of, nor an endorsement by HRSA/HHS, or the U.S. Government.

Delta Region Community Health System Development (DRCHSD) Program
2
Upcoming- Providing an Excellent Patient Experience Webinar Series
• April 8th
• April 15th
• April 22nd
Noon-1:00pm CT
This project is supported by the Health Resources and Services Administration (HRSA) of the U.S. Department of Health and Human Services (HHS) as part of a financial assistance award totaling $10,000,000 with 100% funded by HRSA/HHS and $0 amount and 0% funded by non-government sources. The contents are those of the author(s) and do not necessarily represent the official views of, nor an endorsement by HRSA/HHS, or the U.S. Government.

© 2021 Huron Consulting Group Inc. and affiliates.
H U R O N I 3
huronconsultinggroup.comMA R C H 2 5 , 2 0 2 1
DRCHSD Telehealth Series Part 6
Telehealth Analytics

H U R O N I 4
© 2021 Huron Consulting Group Inc. and affiliates.
Facilitators
Kim MayoNational Rural Health Resource CenterSr. Program Specialist
Donna McHale Huron Consulting GroupSenior DirectorHealth Care Practice
Jessica DukeHuron Consulting GroupManagerHealth Care Practice
Kari GaliHuron Consulting GroupDirectorHealth Care Practice
© 2021 Huron Consulting Group Inc. and affiliates.
H U R O N I 5H U R O N I 5
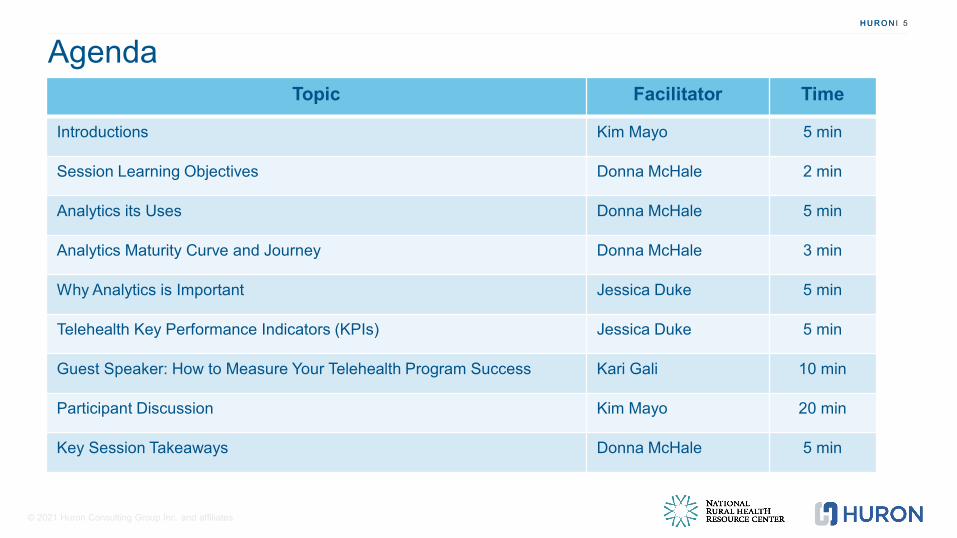
AgendaTopic Facilitator Time
Introductions Kim Mayo 5 min
Session Learning Objectives Donna McHale 2 min
Analytics its Uses Donna McHale 5 min
Analytics Maturity Curve and Journey Donna McHale 3 min
Why Analytics is Important Jessica Duke 5 min
Telehealth Key Performance Indicators (KPIs) Jessica Duke 5 min
Guest Speaker: How to Measure Your Telehealth Program Success Kari Gali 10 min
Participant Discussion Kim Mayo 20 min
Key Session Takeaways Donna McHale 5 min

© 2021 Huron Consulting Group Inc. and affiliates.
H U R O N I 6H U R O N I 6
Session Learning Objectives
• Understand the importance of data analytics and how to use them with your telehealth program
• Discuss the analytic maturity curve and the journey from descriptive to prescriptive analytics
• Explore the benefits of measuring and monitoring telehealth key performance indicators
• Hear how one industry leader used analytics to drive her telehealth program’s success
• Network, make new connections and have fun!

© 2021 Huron Consulting Group Inc. and affiliates.
H U R O N I 7
Asking Questions Just Got Easy!
Ask your questions and/or raise your hand via the Chat Box
H U R O N I 8
© 2021 Huron Consulting Group Inc. and affiliates.
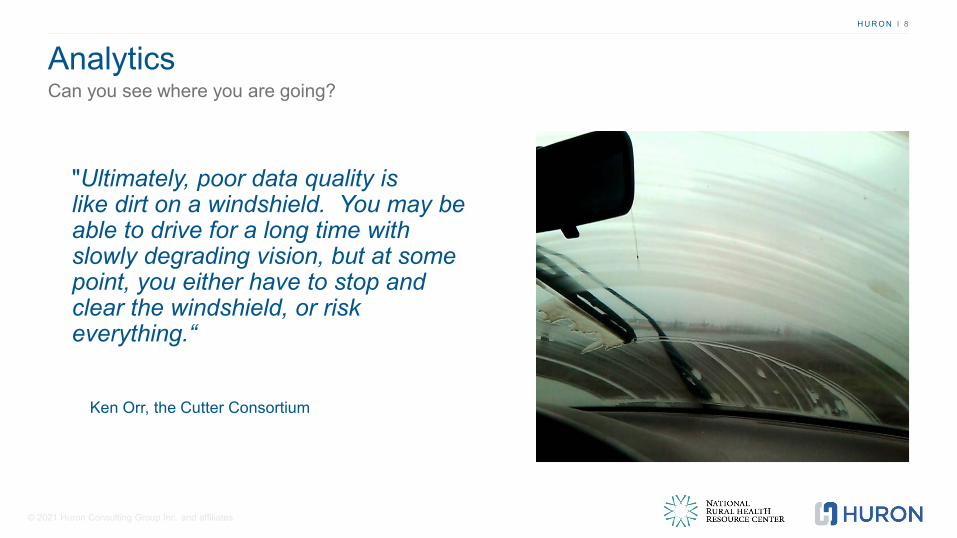
AnalyticsCan you see where you are going?
"Ultimately, poor data quality is like dirt on a windshield. You may be able to drive for a long time with slowly degrading vision, but at some point, you either have to stop and clear the windshield, or risk everything.“
Ken Orr, the Cutter Consortium

H U R O N I 9
© 2021 Huron Consulting Group Inc. and affiliates.
HIMSS Survey of Senior Healthcare Leaders
Lack of Standardization
4 is the average number of different analytic tools used by a health system
Lack of Consistency
25% of healthcareorganizations can utilize analytics throughout their entire system
Lack of Execution 93% of health systems claim to
have an analytic strategy but only a third of those have implemented their strategy
Lack of Clinical Acceptance
Clinicians are the least likely stakeholders within healthcare organizations to utilize analytics for decision-making

H U R O N I 1 0
© 2021 Huron Consulting Group Inc. and affiliates.
How to Engage CliniciansImpactful data for decision making
• Get the right amount of data at the right time in the right way• Real-time• View of the entire data picture
• Provide data they trust to be accurate
• Avoid alert fatigue• Frequent and excessive amounts of information
preventing their productivity• Optimize the EHR decision support functionality
• Visualize data that is easy to read, understand and use
H U R O N I 1 1
© 2021 Huron Consulting Group Inc. and affiliates.
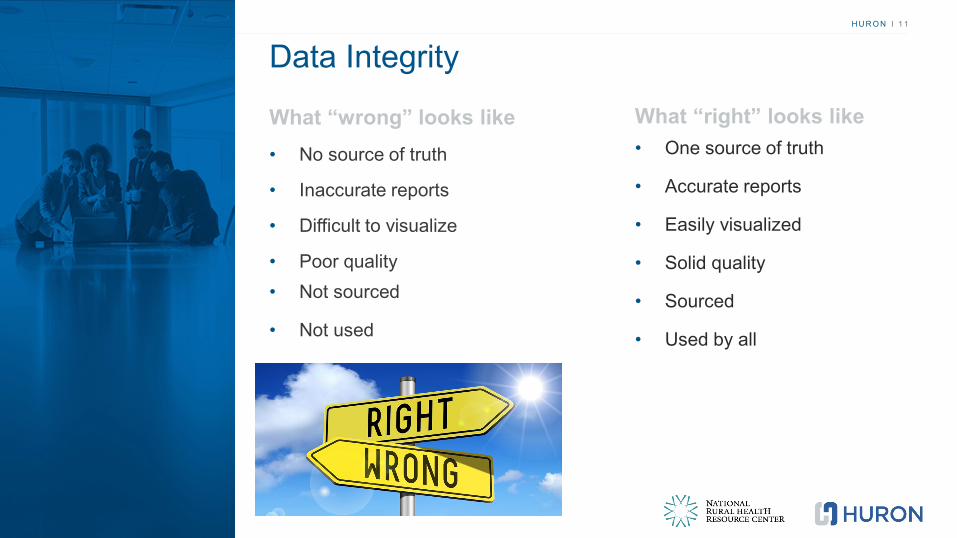
Data Integrity
What “wrong” looks like• No source of truth
• Inaccurate reports
• Difficult to visualize
• Poor quality• Not sourced
• Not used
What “right” looks like• One source of truth
• Accurate reports
• Easily visualized
• Solid quality
• Sourced
• Used by all

H U R O N I 1 2
© 2021 Huron Consulting Group Inc. and affiliates.©2019 Huron Consulting Group Inc. and affiliates. All rights reserved.
What “wrong” looks like

H U R O N I 1 3
© 2021 Huron Consulting Group Inc. and affiliates.
Applicable Uses of AnalyticsCare ManagementMonitoring patient status
SchedulingPredicting appointment no-shows
Patient SafetyPreventing and identifying patient adverse events
ComplianceEnsuring strong data security
Operational EffectivenessManaging Supply Chain
Staffing and UtilizationPredicting patient utilization patterns
Reimbursement ManagementAvoiding hospital readmission
Population HealthRisk scoring for chronic diseases
© 2021 Huron Consulting Group Inc. and affiliates.
H U R O N I 1 4
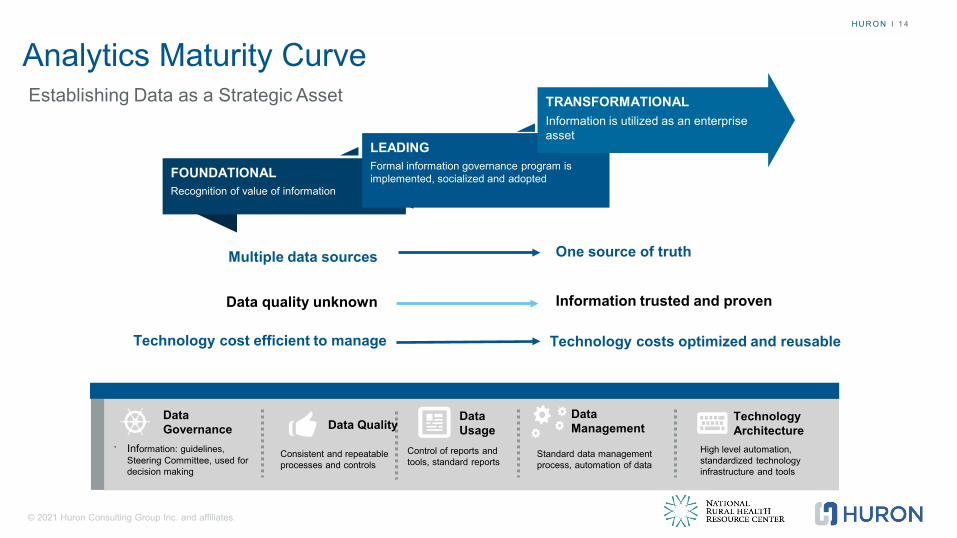
Analytics Maturity CurveEstablishing Data as a Strategic Asset
FOUNDATIONALRecognition of value of information
LEADINGFormal information governance program is implemented, socialized and adopted
TRANSFORMATIONAL Information is utilized as an enterprise asset
Multiple data sources One source of truth
Data quality unknown Information trusted and proven
Technology cost efficient to manage Technology costs optimized and reusable
Data Governance
, Information: guidelines,Steering Committee, used for decision making
Data Quality
Consistent and repeatable processes and controls
Data Usage
Control of reports and tools, standard reports
Data Management
Standard data management process, automation of data
Technology Architecture
High level automation, standardized technology infrastructure and tools

© 2021 Huron Consulting Group Inc. and affiliates.
H U R O N I 1 5
Analytics JourneyExamples of Moving Seamlessly from Descriptive to Prescriptive
1Descriptive(Oversight)
What Happened?
2
Diagnostic (Hindsight)
Why did it happen?
3
Predictive (Foresight) What will happen?
4Prescriptive
(Insight) What should be
done?Examples
Population Health
Quality
Patient Safety
Certain procedure costs very
significantly
High variability driven by surgeon
preference
Model optimal tray configurations
Artificially intelligent tray
recommendations
Rate of diabetic occurrences in rural
populations
Contributory factors (weight, family
history, age, etc.)
Machine learning models use data to predict 3-year risk
Prescribe protocol for at-risk patients
Patients close to ESRD go into acute
renal failure
Risk ARF leading to ESRD not identified
and managed
Machine learning models identify patients at risk
Prescribe protocol for at-risk patients
Patient falls too frequent
Patients with fall risk not identified and/or staff not available
Machine learning recommends
staffing patterns
Models predict specific actions
Cost
H U R O N I 1 6
© 2021 Huron Consulting Group Inc. and affiliates.
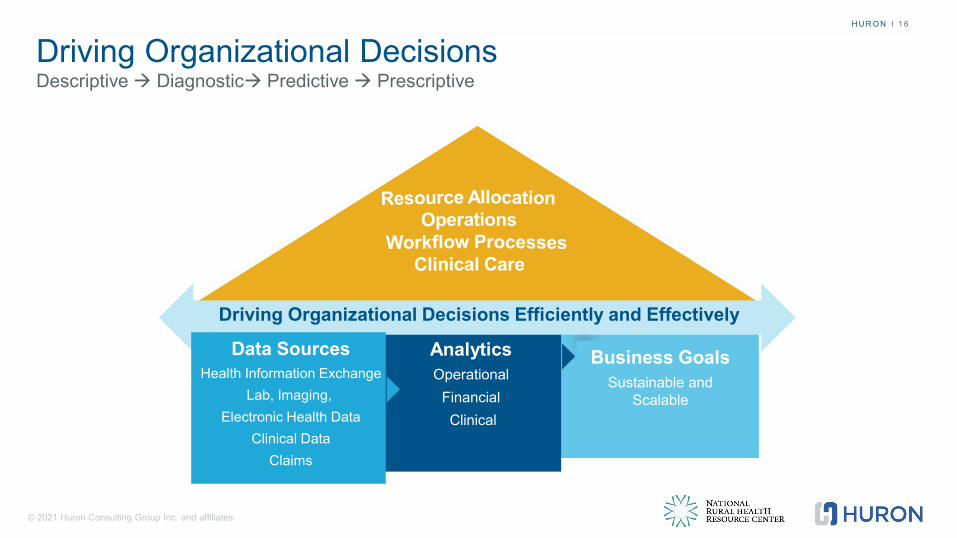
Driving Organizational Decisions Descriptive Diagnostic Predictive Prescriptive
AnalyticsOperational
Financial Clinical
Driving Organizational Decisions Efficiently and Effectively
Data SourcesHealth Information Exchange
Lab, Imaging, Electronic Health Data
Clinical DataClaims
Business GoalsSustainable and
Scalable

© 2021 Huron Consulting Group Inc. and affiliates.
H U R O N I 1 7
Why is Analytics Important?
• Allows you to comply with the organizations measuring the quality of care delivered by telehealth
• Provides you the information you need to measure the success of your telehealth program
• Enables you to achieve your Quadruple Aim objectives
H U R O N I 1 8
© 2021 Huron Consulting Group Inc. and affiliates.
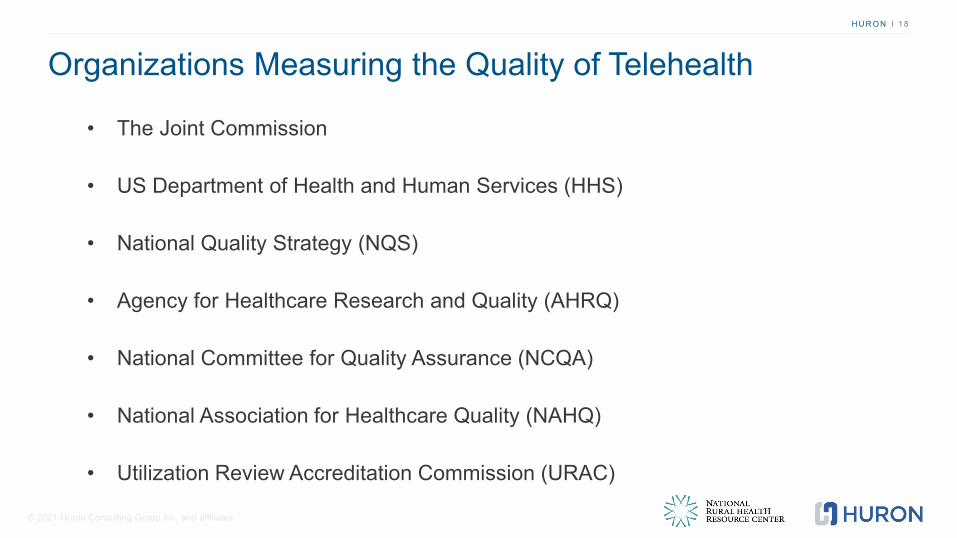
Organizations Measuring the Quality of Telehealth
• The Joint Commission
• US Department of Health and Human Services (HHS)
• National Quality Strategy (NQS)
• Agency for Healthcare Research and Quality (AHRQ)
• National Committee for Quality Assurance (NCQA)
• National Association for Healthcare Quality (NAHQ)
• Utilization Review Accreditation Commission (URAC)

© 2021 Huron Consulting Group Inc. and affiliates.
Drivers to Measure Telehealth Program SuccessH U R O N I 1 9
Telehealth Value
Quality of Care• Improve patient
access to care• Reduce readmissions• Improve patient
medical compliance
Provider & Patient Engagement• Increase provider and
patient engagement in managing health
• Improve patient and provider education
Consumer Experience & Access• Respond to consumer preference
providing convenient, timely, affordable healthcare
• Support improved quality of life enabling care delivery in patients’ homes
• Support needs of an aging population
Cost Containment• Reduce cost associated with
underutilized space and resources
• Recognize staffing efficiencies due to lower percentage of in-person visits
• Lower overall cost of care/ structure
Volume & Revenue Growth• Support volume growth across the
enterprise• Reduce system leakage• Leverage changing regulations to
seek appropriate reimbursement

H U R O N I 2 0
© 2021 Huron Consulting Group Inc. and affiliates.
Achieving the Quadruple Aim
Improving Population Health
Preventing and managing prevalent, costly, and chronic disease
Enhancing The Patient Experience
Motivating and engaging patients to play active role in their care to improve outcomes and safety
Improving Provider Experience
Providing access to tools and resources to address provider burden and burnout
Reducing Cost of Care
Reducing resource utilization and readmissions while assuming greater risk
Quadruple Aim
H U R O N I 2 1
© 2021 Huron Consulting Group Inc. and affiliates.
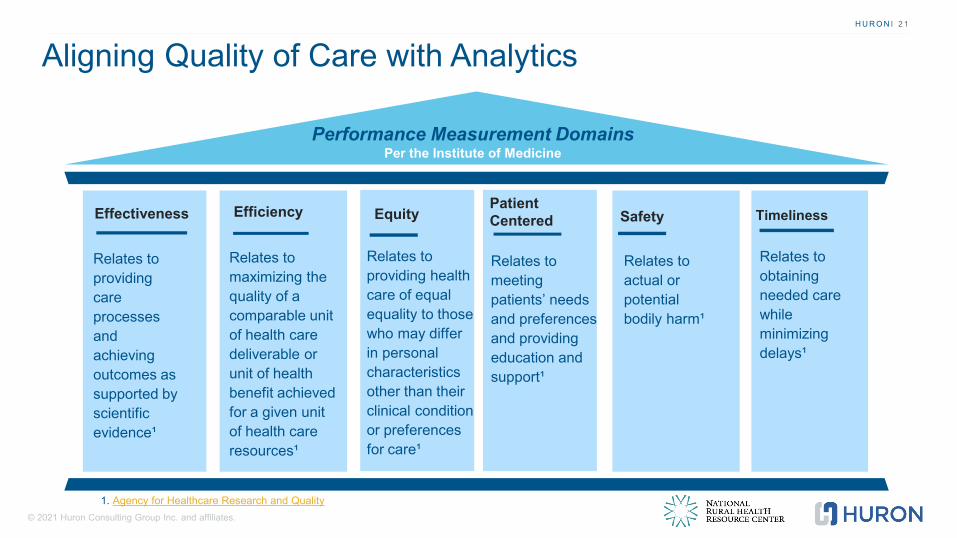
Aligning Quality of Care with Analytics
Performance Measurement DomainsPer the Institute of Medicine
Effectiveness
Relates to providing care processes and achieving outcomes as supported by scientific evidence¹
Efficiency
Relates to maximizing the quality of a comparable unit of health care deliverable or unit of health benefit achieved for a given unit of health care resources¹
Equity
Relates to providing health care of equal equality to those who may differ in personal characteristics other than their clinical condition or preferences for care¹
Patient Centered
Relates to meeting patients’ needs and preferences and providing education and support¹
Safety
Relates to actual or potential bodily harm¹
Timeliness
Relates to obtaining needed care while minimizing delays¹
1. Agency for Healthcare Research and Quality

H U R O N I 2 2
© 2021 Huron Consulting Group Inc. and affiliates.
Telehealth Key Performance Indicators (KPIs)
Key Performance Indicators (KPI) are specific business metrics used to evaluate specific factors and goals that are crucial to the success of the telehealth implementation.
KPIs will provide:• An overview of how business goals are met using telehealth
• A measurable and realistic performance measure• Assistance in evaluating services
• A basis for expanding service lines
• Enhanced relationships within specialty networks• Extensions of the organization’s brand

H U R O N I 2 3
© 2021 Huron Consulting Group Inc. and affiliates.
Telehealth Measured Across the Care Continuum
AMBULATORY CARE• Number of :
• new and existing patients• telehealth visits• requested telehealth visits by
patient• referrals for telehealth visits
• Patient satisfaction with experience
ACUTE CARE• Number of:
• chronic illness readmissions• chronic illness hospitalizations• patients followed by telehealth for next appointment POST-ACUTE CARE
• Number of:• visits not appropriate for telehealth• calls to IT for connectivity or device
issues• calls to vendor for software issues
• Travel time or distance patient or provider saved with telehealth visit
© 2021 Huron Consulting Group Inc. and affiliates.
H U R O N I 2 4
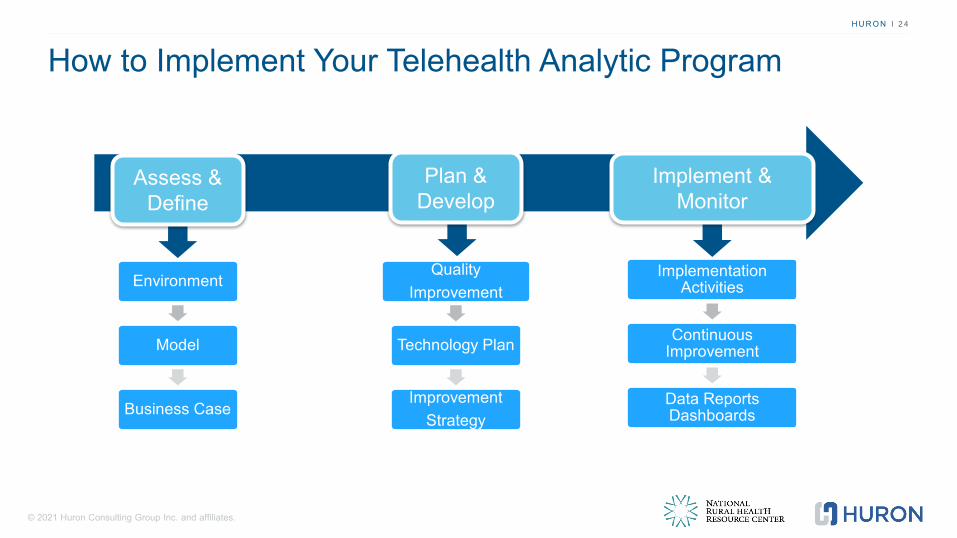
How to Implement Your Telehealth Analytic Program
Assess & Define
Environment
Model
Business Case
Plan & Develop
Quality Improvement
Technology Plan
Improvement Strategy
Implement & Monitor
Implementation Activities
Continuous Improvement
Data Reports Dashboards

H U R O N I 2 5
© 2021 Huron Consulting Group Inc. and affiliates.
H U R O N I 2 5
Guest SpeakerHow to Measure Your Telehealth Program Success
Kari Gali, Director
Huron Healthcare Practice
© 2021 Huron Consulting Group Inc. and affiliates.
H U R O N I 2 6
© 2021 Huron Consulting Group Inc. and affiliates.
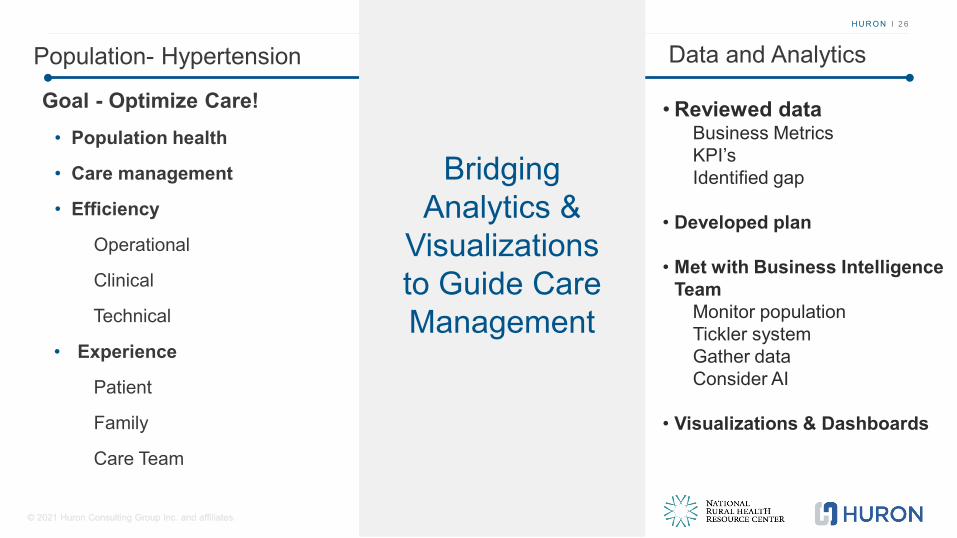
Population- Hypertension
Goal - Optimize Care!• Population health
• Care management
• Efficiency
Operational
Clinical
Technical
• Experience
Patient
Family
Care Team
Bridging Analytics &
Visualizations to Guide Care Management
Data and Analytics
• Reviewed dataBusiness MetricsKPI’sIdentified gap
• Developed plan
• Met with Business Intelligence Team
Monitor populationTickler systemGather data Consider AI
• Visualizations & Dashboards

H U R O N I 2 7
© 2021 Huron Consulting Group Inc. and affiliates.
Hypertension Data
Data Collection (devices/ sensors)• blood pressure cuff• glucometer• scales• pulse-oximetry
Data Storage• cloud storage
Data Transmission• computer• smartphone• tablet
Population & Care Management• data management• data visualizations• data analytics (alert)• automated intelligence

© 2021 Huron Consulting Group Inc. and affiliates.
H U R O N I 2 8
SuccessesData Driven Improvement
• Achieved 62.5% control of patient’s systolic blood pressure (SBP) by the end of the program
• Developed standardized workflows
• Heightened awareness of blood pressures and how to manage them better
• Enhanced accountability for self-management of care
• Increased patient engagement in their care
• Increased patient/ family & Care Team satisfaction
• Developed plug & play framework for chronic disease management

H U R O N I 2 9
© 2021 Huron Consulting Group Inc. and affiliates.
Participant Discussion
Kim MayoNational Rural Health Resource CenterModerator
Donna McHale Huron Consulting GroupSenior DirectorHealth Care Practice
Jessica DukeHuron Consulting GroupManagerHealth Care Practice
Kari GaliHuron Consulting GroupDirectorHealth Care Practice

H U R O N I 3 0
© 2021 Huron Consulting Group Inc. and affiliates.
Participant DiscussionKey Components for a Successful Analytics
Data Analytics
• What successes have you had with analytics?
• Have you utilized data to drive organizational decisions?
• Where are you in your analytics journey?
Telehealth
• What is your biggest challenge with monitoring telehealth data?
• What KPIs would you like to monitor?
Technology
• Does you telehealth application provide data analytics?
• Where do you see the biggest challenge with technology in monitoring data?
Dashboards
• Have you utilized dashboards for live data monitoring / reporting?
• How do you plan to measure your telehealth program?
H U R O N I 3 1
© 2021 Huron Consulting Group Inc. and affiliates.©2019 Huron Consulting Group Inc. and affiliates. All rights reserved.
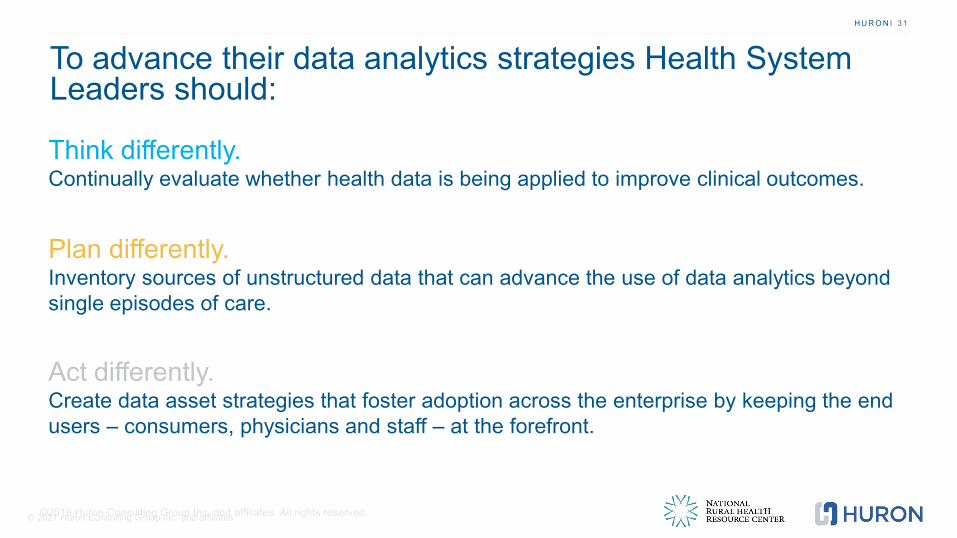
To advance their data analytics strategies Health System Leaders should:
Think differently.Continually evaluate whether health data is being applied to improve clinical outcomes.
Plan differently.Inventory sources of unstructured data that can advance the use of data analytics beyond single episodes of care.
Act differently.Create data asset strategies that foster adoption across the enterprise by keeping the end users – consumers, physicians and staff – at the forefront.

© 2021 Huron Consulting Group Inc. and affiliates.
H U R O N I 3 2H U R O N I 3 2
Key Session Takeaways• For data analytics to be successful it must be standardized, executed, consistent and
clinically accepted by the organization
• Data can be used as a strategic asset of the organization
• Continue your analytics journey from descriptive to prescriptive
• Analytics can enable you to meet your quadruple Aim objectives
• Measure telehealth across the care continuum
• Telehealth program successes include:• Begin with the end in mind• Clinical and IT stakeholders are key to the program• Communicate and collaborate for a shared mental model• Strive for real-time data and user-friendly visualizations that can be integrated with the EHR• Capture lessons learned• Embrace data-driven continuous quality improvement
H U R O N I 3 3
© 2021 Huron Consulting Group Inc. and affiliates.
Contact InformationKim MayoMobile [email protected]
Donna McHaleMobile [email protected]
Jessica DukeMobile [email protected]
Kari GaliMobile [email protected]
© 2021 Huron Consulting Group Inc. and affiliates.

© 2021 Huron Consulting Group Inc. and affiliates.
Thank you