demand and utility. diminishing marginal utility: the more you have of a good, the less an...
TRANSCRIPT

Demand and Utility
Diminishing Marginal Utility:
The more you have of a good, the less an additional unit of the good is worth to you.

Utility Maximization Condition:
The additional satisfaction obtained from purchasing another dollar’s worth of a good should be equal for all goods.
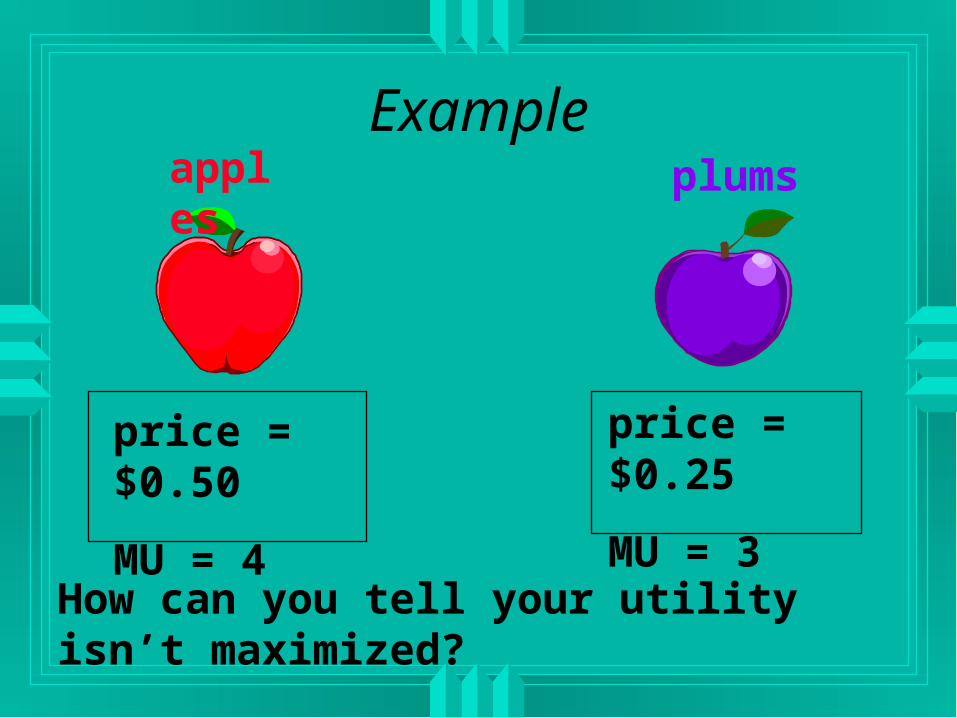
Exampleapples
price = $0.50
MU = 4
plums
price = $0.25
MU = 3
How can you tell your utility isn’t maximized?
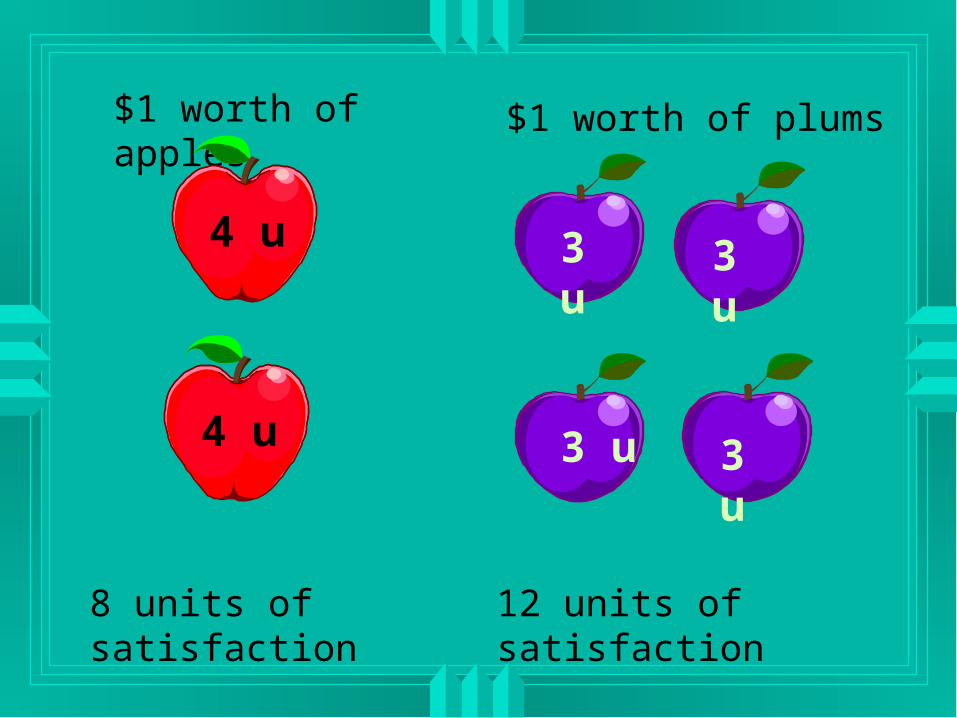
$1 worth of plums$1 worth of apples
8 units of satisfaction 12 units of satisfaction
3 u
3 u
4 u 3 u
3 u4 u

If you spend $1 less on apples, you would lose 2 apples.
That would reduce your satisfaction by 8 units.
4 u 4 u
8

If you spend $1 more on plums, you would gain 4 plums.
That would increase your satisfaction by 12 units.
3 u 3 u3 u 3 u
12

If before making the adjustment, your total utility was 20 units, your total utility after the adjustment would be 20 + 4 = 24.
8 12+increase of 4 units of satisfaction.
=
So,

In other words: The marginal utility per dollar should be equal for all goods.
MUa / Pa = MUb / Pb
Once again: In order to maximize utility, the additional satisfaction from another dollar’s worth of a good should be equal for all goods.
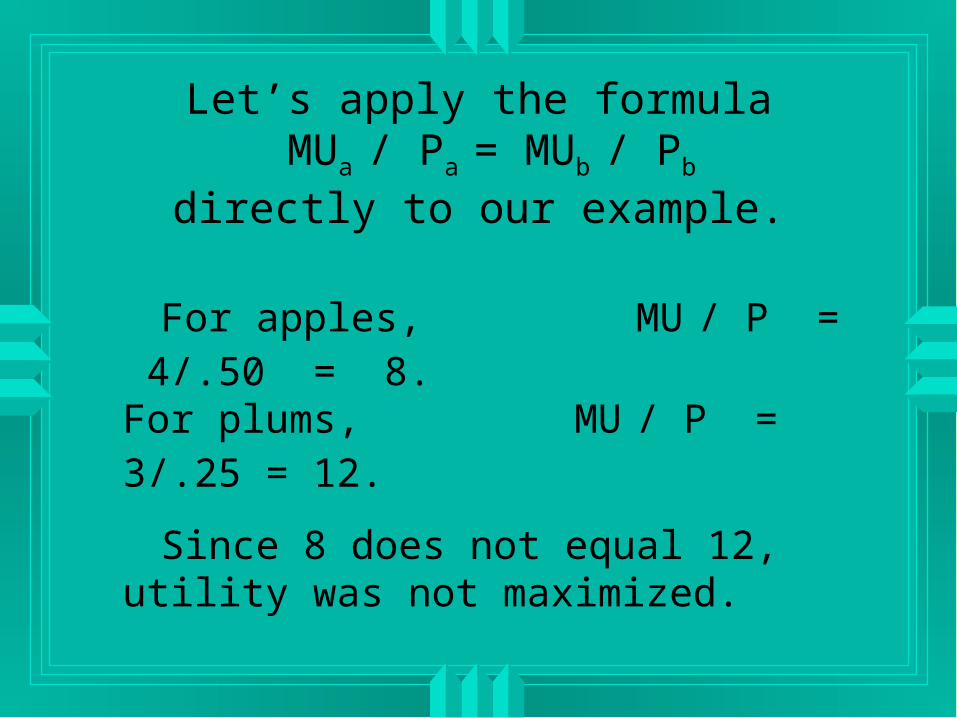
For apples, MU / P = 4/.50 = 8.For plums, MU / P = 3/.25 = 12.
Since 8 does not equal 12, utility was not maximized.
Let’s apply the formula MUa / Pa = MUb / Pb
directly to our example.
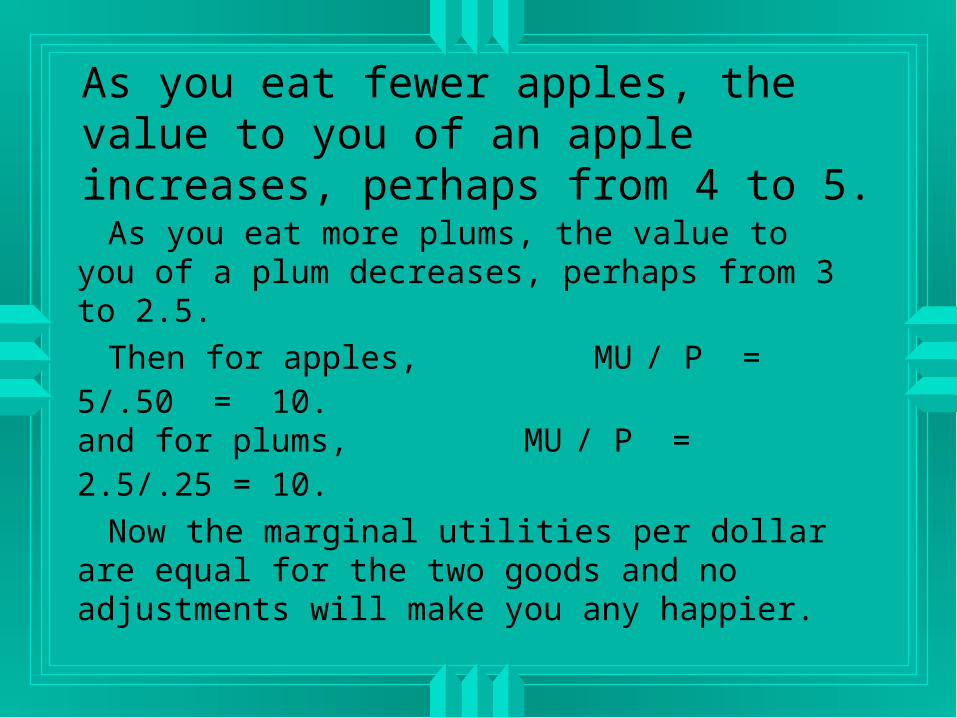
As you eat fewer apples, the value to you of an apple increases, perhaps from 4 to 5.
As you eat more plums, the value to you of a plum decreases, perhaps from 3 to 2.5.
Then for apples, MU / P = 5/.50 = 10.and for plums, MU / P = 2.5/.25 = 10.
Now the marginal utilities per dollar are equal for the two goods and no adjustments will make you any happier.

The Connection between Demand and Utility
Instead of thinking in terms of utils, let’s think in terms of dollars.
Suppose the purchase of one unit of a good gives you $10 worth of satisfaction.
In other words, the marginal utility of that first unit of the good is $10.
Then you would be willing to pay up to $10 for it.
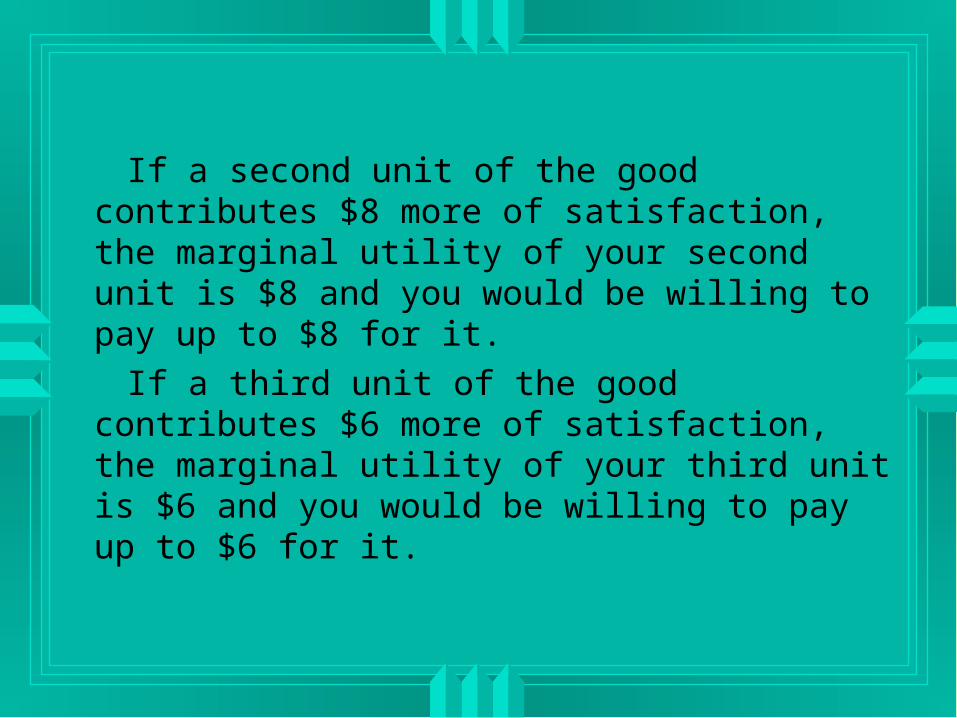
If a second unit of the good contributes $8 more of satisfaction, the marginal utility of your second unit is $8 and you would be willing to pay up to $8 for it.
If a third unit of the good contributes $6 more of satisfaction, the marginal utility of your third unit is $6 and you would be willing to pay up to $6 for it.

Remember that the demand curve tells you what people are willing to pay for various amounts of a good or, equivalently, how many units of a good they are willing to purchase at various prices.
So, since we just found that the marginal utility tells us what we are willing to pay for a good, the marginal utility provides us with information that we can use to determine our demand curve.

In our example, we had the following:
Number of units purchased (Q)
Price you are willing to pay (P)
Marginal Utility
0 - -
1 10 10
2 8 8
3 6 6
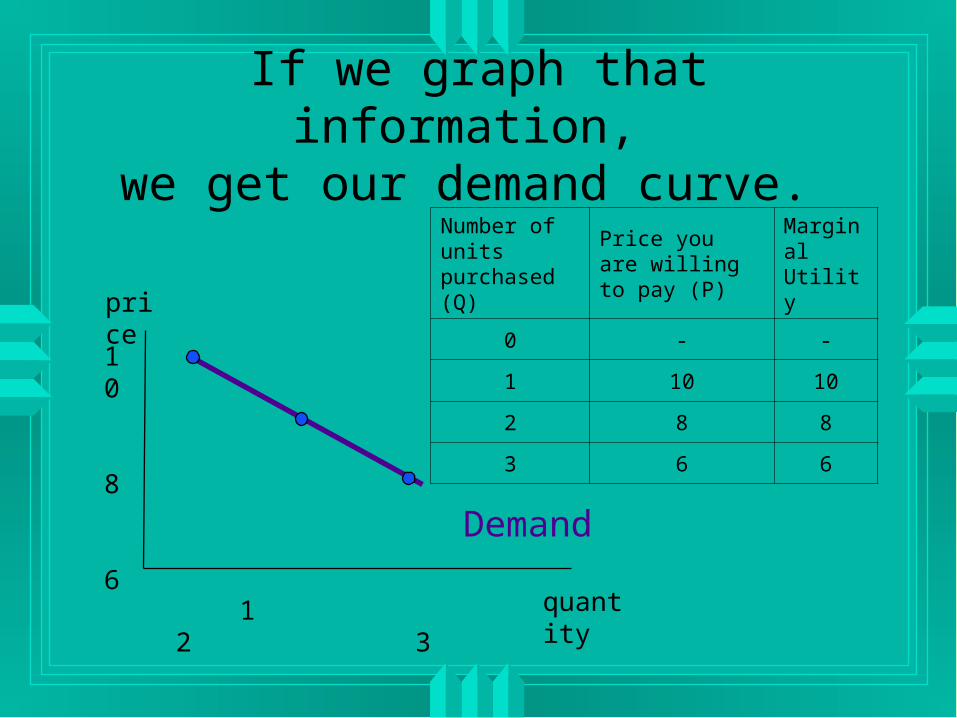
If we graph that information, we get our demand curve.
Number of units purchased (Q)
Price you are willing to pay (P)
Marginal Utility
0 - -
1 10 10
2 8 8
3 6 6
price
quantity
10 8
6
1 2 3
Demand

Notice that by adding our MU values we can determine our total utility at different consumption levels.
Number of units purchased (Q)
Price you are willing to pay (P)
Marginal Utility
Total Utility
0 - - 0
1 10 10 10
2 8 8 18
3 6 6 24

Let’s combine our new information with the ideas we had earlier.
Recall that we maximize our utility where the marginal utility per dollar is equal for all goods.
.b
b
a
a
P
MU
P
MU

In addition, we concluded that we increase our purchases of a good as long as our marginal utility is greater than the good’s price.
Recall marginal utility drops as we consume more and more of a good.
So we would consume a good until we get to the point where our marginal utility is equal to its price.
That is, MU = P
or MU/P = 1.

So, we purchase up to the point where MU/P is equal for all goods and MU/P=1 for each good.
So to maximize our utility, we consume such that our marginal utility per dollar is equal for all goods, and we do that up to the point where we either run out of money or
.1b
b
a
a
P
MU
P
MU

Consumer Surplus
the difference between what you have to pay for a good and what you would have been willing to pay.

Example Suppose that you would have been willing to pay $25 for
a pair of jeans. When you get to the store, you find them selling for $20. What is your consumer surplus?
consumer surplus = 25 - 20 = 5

In terms of a supply and demand graph, the consumer surplus is the area under the demand curve and above the price.

Graphing Consumer Surplus
price
quantity
supply
demand

Graphing Consumer Surplus
price
quantity
supply
demand
P*
Q*

Graphing Consumer Surplus
price
quantity
supply
demand
P*
Q*

Example: Using the graph below, determine the consumer surplus.
Price 10
quantity
supply
demand
P* = 6
0 Q* = 8
consumer surplus = (1/2)(base)(height)
= (1/2) (8)(4) = 16

We can also calculate consumer surplus using the information in our earlier utility table.
Number of units purchased (Q)
Price you are willing to pay (P)
Marginal Utility
Total Utility
0 - - 0
1 10 10 10
2 8 8 18
3 6 6 24
Remember that consumer surplus is the difference between what you are willing to pay for a good (or what it’s worth to you) and what you have to pay for it.

Number of units purchased (Q)
Price you are willing to pay (P)
Marginal Utility
Total Utility
0 - - 0
1 10 10 10
2 8 8 18
3 6 6 24
What the good is worth to you is its TU, which is the sum of the MUs, or equivalently the sum of the prices that you would be willing to pay for each unit of a good.
Suppose the price is $6. You purchase three units of the good, and their total worth to you is TU=$24. But since you only have to pay 6x3=$18, your consumer surplus would be 24-18=$6.