demand attributes and market segmentation: an … · demand attributes and market segmentation: an...
TRANSCRIPT

Demand Attributes and Market Segmentation: An Evaluation of Refrigerator
Purchase Behavior in Rural China
Baoku Li Liaoning University of Engineering and Technology
Lijuan Wang
Liaoning University of Engineering and Technology
Bingru Li Liaoning University of Engineering and Technology
Conjoint analysis is the most widely used method of analysis of consumer’s demand preference in marketing research. In this paper, we use the conjoint analysis model to study peasant’ cognitive attributes to refrigerator products, through a detailed analysis of 5872 effective questionnaires collected from 14 provinces. The questionnaire and the analysis model are constructed from the peasant consumption psychology point of view. The results demonstrate that the Chinese peasant’ demands of refrigerators vary along with the differences in price, brand, quality, and region. There is a “threshold value” of income for peasants. Based on consumer demand attribute evaluations, we argue that there are three market characteristic segments in the Chinese rural market; “the type of comprehensive benefit”, “the type of brand-orientation”, and “the type of price advantage”. INTRODUCTION Durable goods usually consist of several attributes. The different combinations of attributes form different specific products. Consumers make decisions by integrating values of different product attributes. Conjoint analysis is the best method to research the product attributes. The basic idea of conjoint analysis is to value the relative importance and utility of each attribute by measuring the consumers’ whole preference to products of multiple attributes. Conjoint analysis can help us to understand the intrinsic value system of the consumer psychology, and to know why consumers choose a certain product rather than other products.
Conjoint analysis is the most widely used method of consumers’ preferences research in the field of western marketing. Luce and Turkey first introduced this method in 1964; Green used it to do marketing research in 1971. Since then, the technology of conjoint analysis has been developed rapidly, and has been more and more widely applied in academic research, as well as
International Journal of China Marketing vol. 1(2) 2011 13

in business research (Carroll, Green, 1995; Green, Krieger, Wind, 2001; Wittink, Vriens, and Burhenne, 1994). From the mid 1990s, some scholars in China began to use conjoint analysis in fields such as marketing (e.g. Huixin Ke et al., 1994; Xiaoqun He etc., 2000; Kaocong Tian et al., 2003;Zhe Xu etc., 2004). Some consulting companies also began to use this technology at that time.
Although many scholars and experts use conjoint analysis to research product attributes, there is a lack of systematic first hand research on Chinese peasants’ cognition of the attributes to durable appliances. The peasant consumer behaviors are significantly different in dissimilar cognition of product attributes. For peasants, the products can be observed; the differences in cognition of the product attributes come from the differences of consumer psychology. In the process of the rural market development, enterprises should have a better understanding of the product attributes as well as the combination of consumer behavior and psychologies. The examination of peasant cognition of the attributes for popular refrigerators in rural electronic appliance markets is accomplished by using the random coefficient model of conjoint analysis. The perspective of peasants’ consumption psychology is used to construct the research models. The hope is that the outcome of the research will be useful for the enterprises to develop new products and market segmentation in rural markets. RESEARCH MODEL
Conjoint analysis is a statistical method used to study the importance of product attributes to consumers, as well as the consumer utility from the same attribute levels. A product is usually composed of several attributes. The different combinations and specific levels of each attribute makes products different. For different consumers, the importance of product attributes and the utility values on different levels of the same attribute are not the same; this is the core difference of consumer demand. The evaluation of the product attributes and the utility values of the specific attribute level are appropriate standards in market segmentation.
There are various methods of collecting data of conjoint analysis. In addition, the methods of the model estimation are different. For example: (1) whole outline method (WOM); (2) mixed method, MM (Conjoint analysis and individual mixed Conjoint Analysis); (3) self-interpretation method (SIM); and (4) discrete-selection method (DSM). However, the degrees of difficulties for different methods to collect data are not the same. There is no conclusion on which method is the best fitting for the consumer’s inside value system. Nonetheless, the WOM is a traditional conjoint analysis method, which is still widely used nowadays, especially, in China.
Usually, the WOM includes the following steps: (1) to determine the important product attributes and the specific levels of each attribute; (2) to determine the product mix using orthogonal designing method; (3) to score each product mix by the possibility or the preference of purchase; and (4) to estimate the utility coefficients of the model by using the least squares method (OLS) linear regression (Marhotala, 2002).
In conjoint analysis, we often need to estimate two levels of utility coefficients, the individual level and the whole level. In WOM, the individual level utility coefficient is estimated by the regression of all individual data points. There are usually two ways to get the whole level utility coefficient: the first is the arithmetic mean values of the individual levels utility coefficients; the second is OLS linear regression of all respondents’ data. The main problems of the above approach are (1) when we estimate the individual level utility coefficient using alone regression, the number of data is limited and the number of independent variables is too large
14 International Journal of China Marketing vol. 1(2) 2011

(there are more coefficients that need to be estimated), and therefore, the model freedom of motion is very low. The consequence is that the model will fit into the data excessively, and the estimation of the individual level utility coefficient is not stable; (2) the whole level utility coefficient is not stable by using an arithmetic mean value of an individual level utility coefficient; (3) if we get the whole level coefficients by the regression of all the data points, we could ignore the differences of the coefficients between different individual levels.
The random coefficients model can be used to solve the problems above with advantages as follows: (1) it can be used to estimate the coefficients of the individual level and the whole level at the same time through same model.; 2 it can be used to do a statistic test of the differences of the individual levels coefficients; and (3) it can be used to make the shrinkage estimation for each individual level coefficient, it makes the individual level shrink towards a statistical population, which reduces the possibility of extreme values in individual coefficients, and it makes the individual coefficient more reliable. Basic Conjoint Analysis Models The whole outline method (WOM) can be expressed by the following utility function.
m
i
k
jijij
i
XaXU1 1
)( (1
Formula (1): there are 1...i m product attributes. Attribute i has 1... ij k levels. ( )U x is the total utility of a product mix. ija is the partial utility value of attribute i of level j .
ijX is a dummy variable ( 1ijX when X (attribute i and level j ) is exists, otherwise 0ijX ).This is a common basic utility model which only has main effects, no cross effects. The importance iI of attribute i can be expressed as the utility range which is the biggest difference in the partial values.
)}min(){max( ijiji aaI for all the levels of attribute i ) (2) The relative importance iW of attribute i is got from the standardized calculation of. iI
m
iiii IIW
1
(3)
The purpose of conjoint analysis is estimating the utility coefficient of each attribute’s level through a score of each attribute’s level for each specific product from the respondents. The utility coefficients of the WOM are usually estimated by way of the dummy variable regression (Marhotala, 2002). The Regression Model of Individual Level Before the random coefficient model, we need to define the model at the individual level. For the conjoint analysis which includes m attributes and attribute i levels, we need to estimate
mkm
ii
1 coefficients in addition to distance. For the ik level of each attribute i , we need to define one reference level. The reference level coefficient is 0, and then we could estimate the other 1ik coefficients. The attribute’s level coefficient estimate represents the difference from the reference’s level. If the coefficient >0, it means the utility of this attribute’s level is higher than the reference level. If the coefficient <0, it means the utility of the attribute’s level is lower than
International Journal of China Marketing vol. 1(2) 2011 15

the reference’s level. For convenience, we assumemkt
m
ii
1 , this is based on some experimental design methods, such as orthogonal design. Every respondent needs to score at least s product mixes, so everyone has s data points. For respondent h and product s, 1...S s , the linear regression equation can be expressed as:
hcthsthhshhshhhs eXXXY 221100 (4)
Formula (4): hsY is the score of product s by consumer h . 1
t
iihsX
is dummy variable of
different attribute’s levels of product s. ih are model coefficients of the respondent h . 0h is the
model distance, 1
t
iih
is utility coefficient of different attribute’s levels of the consumer h . hse is the model residual error of product s for consumer h . We assume
2~ (0, )hse N . We assume that the model residual error of products s and respondents h obey this distribution. Random Coefficient Model From Formula (4), we know that each consumer has his own model coefficient. For the model coefficients of consumer h , the coefficients can be expressed as equations. Every equation is about the average model coefficient of all the consumers and the random residual error of consumer h . It is as follows:
hh 000 hh 111
hh 222 …
thtth (5)
Formula (5): 0 is distance, 1
t
ii
is the population mean of the model coefficients of each
attribute’s level. 0
t
iih
is the coefficient random residual error for consumer h . We assume that
residual error obeys the law of normal distribution, average is 0, and variance is 0
t
ii
.It is as formula (6).
h~ N(0 0) h~ N(0 1) h~ N(0 2)
… h~ N(0 t) (6)
If we put formula (5) into formula (4), we will get the random coefficient model by whole
16 International Journal of China Marketing vol. 1(2) 2011

outline method (WOM): hsthsthhshhshhthsthshshs eXXXXXXY 2211022110 (7)
Through this model, we can estimate the population means coefficients, 0 1 2, , ,... ,t and the random coefficients of consumers h , 0 1 2, , ,... ,h h h th . In statistics, the population mean coefficient is also called the Fixed Effect, and the individual’s random residual error is also called the Random Effect. The fixed effect is the value of Best Linear Unbiased estimation (BLUE); the random effect is the value of Best Unbiased prediction (BLUP). The model coefficient of each respondent h is the sum of the fixed effect and the random effect. The random effects can be obtained by shrinkage estimation. This method not only considers the internal differences in each person, but also considers the differences between different people. The biggest advantage of this method is that the coefficient of the individual level draws close to the overall average coefficient, it reduce the possibility of the extreme value on the individual
level (Littell etc, 1996). In addition, we can test the random effect variance 0
t
ii
, if 0
0t
ii
, it assumes the difference in this coefficient for the different consumers is significant. Otherwise, the coefficients of the different consumers are more convergent (Bryk etc, 1992; Littell etc, 1996; Greene, 2000). Some scholars recently proposed other methods to estimate the utility coefficients of individual levels and whole levels. The two main methods are hierarchical Bayes (HB) and finite mixture (FM). The HB is carried out through fitting the Monte Carlo Markov Chain (MCMC); the FM is carried out through the maximum likelihood method or Expectation-Maximization (EM) method. The HB is better than FM fitting the random coefficient model logic (We can also take the random coefficient method as a kind of empirical Bayes), because we make the hypothesis to be coefficient distribution of individual level. However, there are no significant differences between the coefficients of individual estimates with the method of the Bayes and the FM. (Allenby etc, 1995; Lenk etc, 1996; Andrews etc, 2002). RESEARCH DESIGN AND DATA COLLECTION
This research subject is refrigerators, which is a popular electrical appliance for peasants in China. The refrigerator is the key product subsidized by the government in accordance with the national significant policy “home electric appliances to the countryside policy”. It is also the key product that peasants like more and more. This research has practical significance and value to research no matter the nation or home electric appliance enterprises. The research samples are peasant consumers from 14 provinces, the method of multi-income steps (high, medium, low) cluster was adopted. The first step, we randomly choose 14 provinces in order of different income level proportion. The second step, we randomly choose cities and towns in every province in order of some distribution. The third step, we randomly choose peasants in the cities or towns. Finally, we received 5872 valid questionnaires. The sample regional distribution and sample sizes can be seen as in Table 1 below.
International Journal of China Marketing vol. 1(2) 2011 17

TABLE 1 THE DISTRIBUTION AND CAPACITY OF SAMPLE
Province Number of cities or towns Sample Capacity
Anhui 29 503 Fujian 57 392 Hebei 45 449 Heilongjiang 29 400 Hunan 61 463 Jiangsu 76 499 Jiangxi 33 252 Neimeng 12 478 Shandong 46 501 Shanxi 65 450 Shanxi 35 496 Yunnan 56 297 Zhejiang 33 194 Sichuan 79 498 Total 656 5872
We designed the conjoint analysis through the following three steps. The first step is the
determination of product attributes. Through fieldwork, we understand the product attributes which sales clerks and appliance buyers considered. We identified the related attributes of refrigerators through qualitative research. Then, we got 300 questionnaires scoring these attributes from qualitative research, the questionnaires came from the Heilongjiang and the Shanxi provinces randomly, According to the score sorting, we selected 7 important attributes of the refrigerator to research, shown in Table 2. The second step is the determination of the levels of every attribute. After the fieldwork in Guomei super market, we determined the levels of each attribute. According to the prophase-survey, we found that the peasants think many factors are important for brand (is it domestic famous or just-so-so), and there are many different brands. So, according to the peasant’s opinion, we merge the brands to four brand categories (the Euramerican brands, the Japan or Korea brands, the domestic 1 brands and the domestic 2 brands). The domestic 1 brands include Haier, New-fly and Rhombohedrons. The Domestic 2 brands include Little-swan, Hisense, Principle, Kelon, Rongsheng, TCL, Oakes curled, Konka and AoKeMa. The Euramerican brands include Electrolux and Siemens. The Japan and Korea brands include Samsung, Toshiba, Panasonic and LG. The ridge has 22 attribute levels in total (Table 2).
The third step is the determination of product mixes. According to the refrigerator’s attributes and the number of their levels, the refrigerator has 4 x 4 x 3 x 2 x 3 by 3 x 3 = 2592 possible product mixes. They are too many obviously. So we determined 32 kinds of product mixes for the refrigerator using orthogonal design method.
Finally, we designed the questionnaire for these 32 product mixes and we let the peasants score these product mixes between 0 100 according to the purchase possibility.
18 International Journal of China Marketing vol. 1(2) 2011

TABLE 2 THE ATTRIBUTES AND LEVELS OF REFRIGERATORS
Brand Price(RMB,yuan) Color Structure Power Consumption(KW/hr) Volume Cooling
Capacity
Euramerica Japan-Korea
1500 1500-1800
white grey
wide door short vertical door
0.6 0.6-0.8
170L 170-200L
3kilos 3-5kilos
Domestic 1 1800-2000 others 0.8 200L 5kilos Domestic 2 2000 DATA ANALYSIS AND RESULTS
The refrigerator has 7 attributes, every attribute has 22 levels. We need to estimate some model coefficients including the distance using the dummy variable regression method. And we estimated the fixed effects and random effects of the refrigerator coefficients using of Proc Mixed (SAS), limits maximum likelihood method (REML) and between–within degrees of freedom (DOF) calculation method. Because the random coefficients are too many, we assumed that the random coefficients inside covariance=0, and we just need to estimate their variances
0 1 2, , ,... ,t . This assumption is as follows:
tt
Var
000
000000000
3
1
0
2
1
0
(8)
The Utility Coefficient Analysis of Whole Level From the whole average model coefficients table (Table 3) we know the attribute levels significantly (p<0.01) influence the possibility (utility function) for peasants to buy refrigerators besides some attributes (volume, domestic 1 brand, wide door structure, color and power consumption of 0.6-0.8 kilowatt hour). Based on the model coefficients in Table 3, we will analyze the relative importance of the refrigerator attributes and the partial utility values of each attribute level.
International Journal of China Marketing vol. 1(2) 2011 19

TABLE 3 THE COEFFICIENTS OF THE WHOLE AVERAGE MODEL OF THE CONJOINT
ANALYSIS OF REFRIGERATORS N=5752
Variable Coefficient Standard Deviation Degree of Freedom T p Distance 53.484 0.335 5751 159.790 <.0001Branda Japan-Korea -6.376 0.224 180000 -28.490 <.0001 Euramerica -5.610 0.207 180000 -27.120 <.0001 Domestic 1 -0.084 0.155 180000 -0.540 0.588 Priceb 1500-1800yuan -1.417 0.148 180000 -9.570 <.0001 1800-2000yun -2.693 0.155 180000 -17.430 <.0001 2000yuan -5.018 0.193 180000 -26.050 <.0001Colorc White 0.188 0.123 180000 1.530 0.127 Grey 0.058 0.142 180000 0.410 0.684 Strucured Wide Door -0.382 0.100 180000 -3.810 0.000 Power Consumption Kilowatt hour 0.6-0.8 -0.882 0.123 180000 -7.190 <.0001 0.8 -3.313 0.143 180000 -23.180 <.0001Volumef 170L-200L 0.829 0.129 180000 6.440 <.0001 200L 0.285 0.127 180000 2.240 0.025 Cooling Capacityg 3-5kg 2.333 0.135 180000 17.280 <.0001 5kg 4.854 0.170 180000 28.500 <.0001Note a: The reference group of brand is domestic 2; b: The reference group of price is below 1500 yuan RMB; c: The reference group of color is other colors; d: The reference group of structure is short vertical door; e: The reference group of power consumption <0.6 kilowatt hour; f: The reference group of volume <170L;g: The reference group of cooling capacity <3 kg. These coefficients =0.
According to formulas (2) and (3), we separately calculate the biggest utility range and relative importance of the refrigerator’s 7 attributes (Table 4). The brand is the most important product attribute in all attributes, importance score is 30.4%. The second is price (importance score =23.9%) and cooling capacity (importance score =23.2%). The power consumption importance score= 15.8%. Volume importance score =4.0%. The structure importance score = 1.8% and color importance score= 0.9 %. So for Chinese peasants, they pay more attention to not only the brand but also the price because their income is still low. This result can be explained. On one hand the peasants are showing consumption psychology (the importance of brand > performance), on the other hand they also demonstrate practical consumption psychology (the price is the second important attribute).
20 International Journal of China Marketing vol. 1(2) 2011
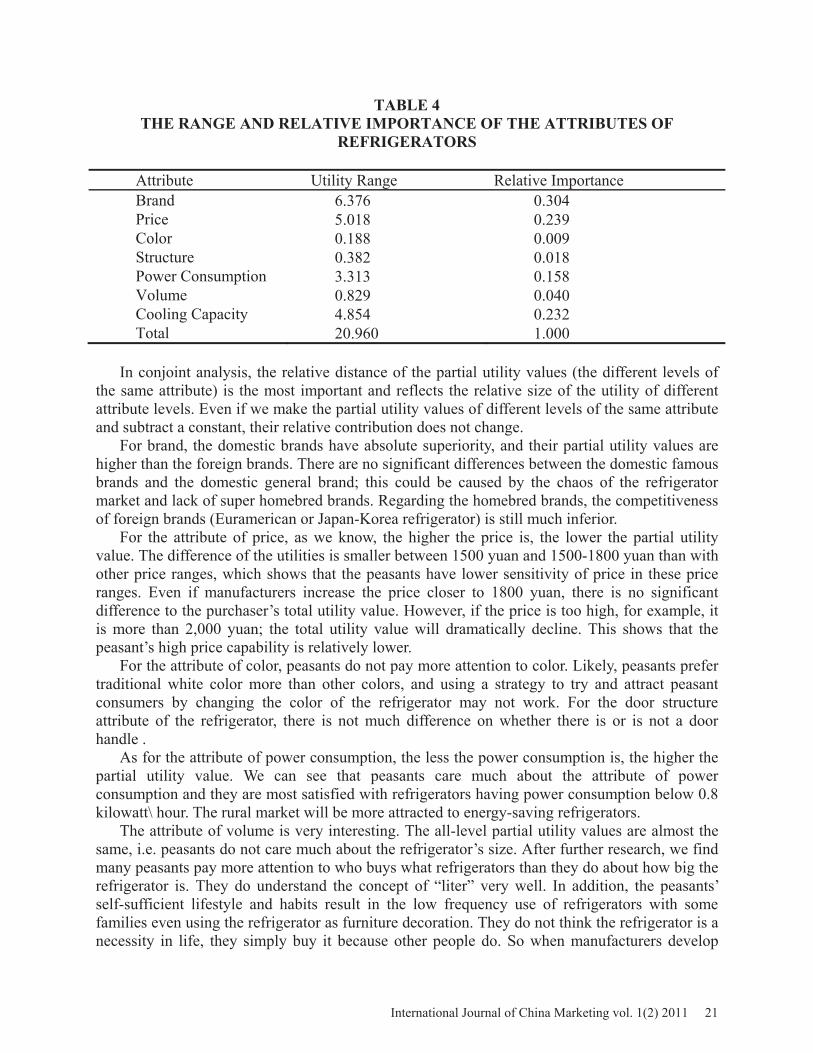
TABLE 4 THE RANGE AND RELATIVE IMPORTANCE OF THE ATTRIBUTES OF
REFRIGERATORS
Attribute Utility Range Relative Importance Brand 6.376 0.304 Price 5.018 0.239 Color 0.188 0.009 Structure 0.382 0.018 Power Consumption 3.313 0.158 Volume 0.829 0.040 Cooling Capacity 4.854 0.232 Total 20.960 1.000
In conjoint analysis, the relative distance of the partial utility values (the different levels of
the same attribute) is the most important and reflects the relative size of the utility of different attribute levels. Even if we make the partial utility values of different levels of the same attribute and subtract a constant, their relative contribution does not change.
For brand, the domestic brands have absolute superiority, and their partial utility values are higher than the foreign brands. There are no significant differences between the domestic famous brands and the domestic general brand; this could be caused by the chaos of the refrigerator market and lack of super homebred brands. Regarding the homebred brands, the competitiveness of foreign brands (Euramerican or Japan-Korea refrigerator) is still much inferior.
For the attribute of price, as we know, the higher the price is, the lower the partial utility value. The difference of the utilities is smaller between 1500 yuan and 1500-1800 yuan than with other price ranges, which shows that the peasants have lower sensitivity of price in these price ranges. Even if manufacturers increase the price closer to 1800 yuan, there is no significant difference to the purchaser’s total utility value. However, if the price is too high, for example, it is more than 2,000 yuan; the total utility value will dramatically decline. This shows that the peasant’s high price capability is relatively lower.
For the attribute of color, peasants do not pay more attention to color. Likely, peasants prefer traditional white color more than other colors, and using a strategy to try and attract peasant consumers by changing the color of the refrigerator may not work. For the door structure attribute of the refrigerator, there is not much difference on whether there is or is not a door handle .
As for the attribute of power consumption, the less the power consumption is, the higher the partial utility value. We can see that peasants care much about the attribute of power consumption and they are most satisfied with refrigerators having power consumption below 0.8 kilowatt\ hour. The rural market will be more attracted to energy-saving refrigerators.
The attribute of volume is very interesting. The all-level partial utility values are almost the same, i.e. peasants do not care much about the refrigerator’s size. After further research, we find many peasants pay more attention to who buys what refrigerators than they do about how big the refrigerator is. They do understand the concept of “liter” very well. In addition, the peasants’ self-sufficient lifestyle and habits result in the low frequency use of refrigerators with some families even using the refrigerator as furniture decoration. They do not think the refrigerator is a necessity in life, they simply buy it because other people do. So when manufacturers develop
International Journal of China Marketing vol. 1(2) 2011 21

product for rural markets, they should communicate to the peasants about the use of refrigerators and quality of life at same time.
The attribute of cooling capacity is also an interesting factor. The bigger cooling capacity, the more peasants like it. Influenced by the traditional consumption idea, peasants think capacity is a sign of quality, forgetting that the bigger cooling capacity requires more power consumption. Peasant’s decision-making by cooling capacity and power consumption are very contradictory, which confirms that the peasant is not rational when they evaluate durable goods and making decisions. The Difference Analysis of the Utility Coefficient on Individual Level
The model’s random effect coefficients and residual error variances are given in Table 5.
TABLE 5 THE RANDOM EFFECT COEFFICIENT VARIANCE AND MODEL RESIDUAL
VARIANCES OF REFRIGERATOR
Variable Estimated Value Standard Deviation Z p Intercept 442.450 8.946 49.460 <.0001 Branda Japan- Korea 172.670 4.809 35.900 <.0001 Euramerica 130.620 4.042 32.320 <.0001 Domestic 1 21.889 2.155 10.160 <.0001 Priceb 1500-1800yuan 10.832 1.800 6.020 <.0001 1800-2000yuan 21.924 1.980 11.070 <.0001 2000yuan 97.961 3.320 29.510 <.0001 Colorc White 0.864 1.085 0.800 0.213 Grey 0.000 — — — Structured Wide Door 0.000 — — — Power Consumptione 0.6-0.8 kilowatt hour 0.000 — — — 0.8 kilowatt hour 30.929 2.022 15.300 <.0001 Volumef 170L-200L 8.636 1.624 5.320 <.0001 200L 6.076 1.581 3.840 <.0001 Cooling Capacityg 3-5kg 18.333 1.869 9.810 <.0001 5kg 80.312 2.964 27.090 <.0001 Residual 461.620 1.919 240.520 <.0001
Note a: The reference group of brand is domestic 2; b: The reference group of price is below 1500 Yuan RMB; c: The reference group of color is other colors; d: The reference group of structure is short vertical door; e: The reference group of power consumption <0.6 kilowatt hour; f: The reference group of volume <170L;g: The reference group of cooling capacity <3 kg. These coefficients =0.
22 International Journal of China Marketing vol. 1(2) 2011

Through testing the variances of random effects, we know the partial utility values of some
attribute levels are significantly different, and others are not. Because we cannot test reference groups attribute levels directly, we make them equal to 0. The 0 does not mean that reference groups attribute levels’ partial utility values are the same for all the consumers. If there are significant differences between the other levels of the same attribute, the partial utility values of the reference groups attribute levels should have differences too. This is because it is a simple linear relationship with partial utility values of other attributes (the reference group model coefficients are equal to the values when all other attribute levels of the same attribute are equal to 0).
After the difference test at every level of each attribute, specifically, we get the following results: 1. the random effect coefficient variances of Euramerican and Japan-Korean brands are significantly different, meaning the attractions between Euramerican and Japan-Korean are different for different peasants. For the same reason, there are different between domestic 1 and 2 brands for peasants. 2. The partial utility values in whole price ranges are significantly different, meaning that peasants have significantly different price sensitivity and sensitivity to high or low price is much different. 3. White color is always the main color in refrigerator markets. The attractions or identities of white color have significant difference, grey color does not. 4. The appearances of the refrigerator are basically the same. Peasants do not care if the refrigerator has door handles or not. 5. Peasants have same agreement on low-power-consuming refrigerators, but they have significant difference for power consumptions more than 0.8 kilowatt hour. 6. Peasants are significantly different in their evaluation of volume. 7. Lastly, they show significant difference in the evaluation of cooling capacity.
To sum up, the refrigerator structure, 0.6-08 kilowatt-hour power consumption and gray color have no difference for the peasants. Brand, price, volume and cooling capacity are four attributes whose differences for peasants are bigger. For attribute combination, there are two difference combinations, high prices combination and high capacities combination. This means that some classes of refrigerators, especially the high-grade class, there are very different in a peasant’s value judgment. Therefore, manufacturers should develop different products according to the difference in peasant value judgment.
Utility Coefficient Analysis on the Individual Level The utility coefficient of the individual level is the sum of the whole utility coefficients (fixed effects) and the individual random errors (random effects). From Figure 1, we gave the distributions of an individual’s utility coefficients level whose attributes are significantly different. Some differences of partial utility values for some attribute levels, for peasants, are very big.
International Journal of China Marketing vol. 1(2) 2011 23

FIGURE 1 DISTRIBUTION OF INDIVIDUAL PARTIAL UTILITY VALUES
Volume of 170-200L. Volume above 200L
Cooling Capacity of 3-5Kilos.
Euiamerican Brand Japan-Korean Brand
Domestic 1 Brand Consumption Above 0.8 degree
Cooling Capacity of above 5 Kilos.
24 International Journal of China Marketing vol. 1(2) 2011

For example, average utility values of the Japanese and Korean brands are higher than
domestic 1 brands’, but some extreme utility values in Japanese and Korean brands are very low(-63) far less than the lowest utility value of domestic 1 brands (-12.6), meaning for these peasants, Japanese-Korean brands are completely unnecessary. So it will make their preference low for providing them the Japanese and Korean brand refrigerators. In figure 1, we know the partial utility values of some attribute levels (such as the attributes of “0.8 power consumption”, “5 kg cooling capacity or above” and “2000 Yuan or above”) have big differences for peasants. The differences of utility values on the individual level indicate the refrigerators-market in rural is multi-segmented. Different peasant consumers prefer a different refrigerator mix. Enterprise should analyze peasant consumers’ difference value system. Market segmentation should be carried out according to the peasant preference. They should provide attractive products in view of different segments of the market, even one-to-one marketing. THE CLUSTER ANALYSIS AND MARKET SEGMENTATION OF REFRIGERATORS
Using SAS software, we get cluster analysis results of the partial utility values at the individual level. The cluster process is shown in Figure 2. Based on Figure 2, it is appropriate to choose three segments of the refrigerator market in rural areas. We can calculate the importance of each attribute of the market segment as well as the overall market (Table 7), through the
Price Below 1800 yuan.Price between 1800yuan and 2000yuan
Price above 2000 yuan.
International Journal of China Marketing vol. 1(2) 2011 25

partial utility value of each market’s segment attribute levels (Table 6). From the results of Table 6 and Table 7, the refrigerator attribute preferences are significantly different for the research sample. It is unclear as to this difference while only using the whole market model, if enterprises do not subdivide the attribute preference differences, their products’ attraction will decline. These are the peasant consumers’ characteristics in the market segment in Table 6 and Table 7.
FIGURE 2 THE CLUSTER ANALYSIS OF PARTIAL UTILITY VALUES ON INDIVIDUAL
ATTRIBUTE LEVEL
TABLE 6 THE CLUSTER ANALYSIS OF PARTIAL UTILITY VALUES ON INDIVIDUAL
ATTRIBUTE LEVEL
Attribute Level Market Segment the Whole Market1 2 3 Market Scope 3944 308 1500 5788 Market Share 68.57% 5.35% 26.08% 100.0% Brand Japan-Korea -1.289 -21.395 -5.097 -3.359 Euramerica -1.003 -12.353 -4.768 -2.592 Domestic 1 0.898 18.720 5.045 2.934 Domestic 2 1.394 15.028 4.821 3.017 Price 1500yuan 1.710 2.079 3.828 2.282 1500-1800yuan 0.217 0.710 2.601 0.865 1800-2000yuan -0.954 -0.081 0.947 -0.411
26 International Journal of China Marketing vol. 1(2) 2011

2000yuan -0.973 -2.708 -7.375 -2.736 White 0.110 0.104 0.098 0.106 Color Grey -0.026 -0.023 -0.020 -0.024 Other Colors -0.084 -0.081 -0.078 -0.082 Structure Wide Door -0.191 -0.191 -0.191 -0.191 Short Vertical Door 0.191 0.191 0.191 0.191 Power Consumption <0.6degree 1.340 1.381 1.555 1.398 0.6-0.8degree 0.458 0.499 0.673 0.516 0.8degree -1.799 -1.880 -2.227 -1.915 Volume <170L -0.365 -0.396 -0.383 -0.371 170L-200L 0.418 0.479 0.557 0.458 200L -0.053 -0.084 -0.175 -0.087 Cooling Capacity <3 kilos -2.369 -2.006 -2.545 -2.396 3-5 kilos 0.040 0.142 -0.375 -0.063
5 kilos 2.329 1.864 2.920 2.458
TABLE 7 THE IMPORTANCE OF ATTRIBUTES ON INDIVIDUAL LEVELS OF
REFRIGERATOR MARKET SEGMENTS
Attribute Market Segments the Whole Market 1 2 3
Market Share 68.57% 5.35% 26.08% 100% Brand 0.184 0.769 0.316 0.563 Price 0.184 0.092 0.349 0.131 Color 0.013 0.004 0.01 0.007 Structure 0.026 0.007 0.01 0.014 Power
Consumption 0.216 0.063 0.12 0.114 Volume 0.054 0.017 0.03 0.029 Cooling
Capacity 0.323 0.049 0.170 0.142
We can get three types of market segments. “The type of comprehensive benefits” segment Namely segment 1, it is 68.57% in the
whole market. They are the biggest consumption group of the market, and these consumers pay the most attention to the cooling capacity whose importance is 32.3% for them. The second important attribute is power consumption whose importance is 21.6%. The brand and price attributes importance are the same at 18.4%. These attributes are attractive for peasants and are relatively the same. They like the refrigerators which have “5 kg refrigeration ability” and “power consumption of 0.6 kilowatt hour or below”, they do not care for international high brands, but the domestic brand is ok. They like low prices, fewer than 1500 Yuan. So the refrigerator with a low price, domestic brand, electricity-saving and big power is most attractive
International Journal of China Marketing vol. 1(2) 2011 27

for a third of rural consumers. “The type of brand-oriented” segment: namely market segment 2, it is 5.35% the whole
market. These consumers pay most attention to brands whose importance is 76.9%. And they like domestic brands more than foreign brands. For some consumers, the difference of domestic brands is the most attractive decision –making factor.
“The type of price-brand” market segment: namely segment market 3, it is 26.08% in the whole market. They generally pay attention to price and brand. The price importance is 34.9% and the brand importance is 31.6%. The degrees of importance for the two attributes are not significantly different. Meanwhile, the price attribute importance of segment 3 is higher than segment 1 and 2. The difference for peasant partial utility values of the two levels of price “below 1500 Yuan” and “price between 1500 Yuan and 1800 Yuan” is relatively small (from 3.8 to 2.6). The utility value will become negative if the price passes 2000 Yuan, with consumers being more likely to refuse this kind of high pricing of refrigerators. STATISTICAL VARIABLES’ INFLUENCE ON THE SEGMENT MARKET To research the relationship of peasants’ consumer behavior characteristics and their market segment, we now discuss family income and family population. The Analysis of the Influence of Family Income on Segment Market From Table 8, consumers mainly belong to “the type of comprehensive benefits” market. The income type is an important factor, for example, the consumer groups with high sideline income
TABLE 8 THE TABLE OF FAMILY INCOME AND MARKET SEGMENTS
Variable Segment Markets the Whole
Market comprehensive benefits type
Brand-oriented Type
Price-brand Type
Market Share 68.57% 5.35% 26.08% 100.00% Agricultural Income
Yuan 9570.70 8918.23 8539.70 9267.30 Part-time Income
Yuan 14228.35 10799.17 13420.42 13843.17 Sideline Income Yuan 6730.87 7101.02 6145.35 6599.30 Other Income Yuan 4159.16 5624.23 4081.74 4212.26 Overall Income Yuan 28856.27 25416.99 26295.07 28004.20 population person 4.12 4.02 4.15 4.12 Average Individual Income Yuan 7565.66 6985.06 6805.76 7335.12 or other incomes; they value brand importance higher. Most of the families buy refrigerators with 4-5 members. The family income amount has no significant relationship with the segment. The Analysis of Variance of Market Segment and Income Amount From Table 9 to Table 14, at every p > 0.05, there are no significant differences between
28 International Journal of China Marketing vol. 1(2) 2011

income amount and segment for refrigerators; suggesting peasant incomes are not a valid constraint in refrigerator purchases. There are two possible reasons. The first reason is that refrigerators are so popular in the peasant family. Without a refrigerator in the home, homeowners would fear neighbors may look down on them. The psychology of vanity and showing off make peasants less concerned with income constraints when making decisions. The second reason is “income threshold”. Some previous macroscopic studies showed the family income had a significant and important relationship with consumers’ consumption of durables. But our research results are contrary. Because the “income threshold” for peasants, i.e. before real income < “income threshold”, does not activate their purchase intention and the behavior, income amount constraint is apparent. But with real income> “income threshold”, the consumer’s behavior is affected more by psychological variables and marketing variables than income, so income amount constraint does not hold.
TABLE 9
THE DIFFERENCE BETWEEN AGRICULTURAL INCOMES IN REFRIGERATOR MARKET SEGMENTS
Variable Resource Quadratic Sum Degree of Freedom Mean Square Deviation F p
Between the Group 1.10E+09 2 5.50E+08 1.43 0.24 in the Group 2.04E+12 5291 3.85E+08 Total 2.04E+12 5293
TABLE 10 THE DIFFERENCE BETWEEN WORK INCOMES IN REFRIGERATOR MARKET
SEGMENTS
Variable Resource Quadratic Sum Degree of Freedom Mean Square Deviation F p
Between the Group 3.22E+09 2 1.61E+09 0.61 0.54 in the Group 1.35E+13 5113 2.64E+09 Total 1.35E+13 5115
TABLE 11
THE DIFFERENCE BETWEEN SIDELINE INCOMES IN REFRIGERATOR MARKET SEGMENTS
Variable Resource Quadratic Sum Degree of Freedom Mean Square Deviation F p
Between the Group 3.35E+08 2 1.67E+08 0.65 0.52 in the Group 1.10E+12 4261 2.59E+08 Total 1.10E+12 4263
International Journal of China Marketing vol. 1(2) 2011 29

TABLE 12 THE DIFFERENCES BETWEEN THE OTHER INCOMES IN REFRIGERATOR
MARKET SEGMENTS
Variable Resource Quadratic Sum Degree of Freedom Mean Square Deviation F p
Between the Group 3.29E+08 2 1.64E+08 0.39 0.67 in the Group 1.29E+12 3097 4.18E+08 Total 1.29E+12 3099
TABLE 13 THE DIFFERENCE OVERALL INCOME OF EACH SEGMENT OF REFRIGERATOR
MARKET
Variable Resource Quadratic Sum Degree of Freedom Mean Square Deviation F p
Between the Group 9.31E+09 2 4.65E+09 1.22 0.29 in the Group 2.19E+13 5749 3.81E+09 Total 2.19E+13 5751
TABLE 14 THE DIFFERENCE AVERAGE INDIVIDUAL INCOME OF EACH SEGMENT
OF REFRIGERATOR MARKET
Variable Resource Quadratic Sum Degree of Freedom Mean Square Deviation F p
Between the Group 6.52E+08 2 3.26E+08 1.05 0.35 in the Group 1.73E+12 5593 3.10E+08 Total 1.74E+12 5595 Market Segmentation and Regional Market Classification
This section attempts to classify the sample area according to the characteristics of the market segmentation (Table 15). The characteristics of the peasant consumers in Heilongjiang are relatively outstanding. The Brand-oriented consumers here are the first as the proportion is more than the in other provinces. Although the southeast coast provinces’ economies are more advanced, the consumer’s Brand-oriented consuming habit is not necessarily formed yet. Shanxi and Yunnan provinces’ economies are developing, and consumers pay more attention to the comprehensive benefits of a purchase. What this means for them is that the traditional cost performance psychology is a dominant factor. They have limited brand awareness, mostly in cognitive stage, without any brand-oriented motivation, behavior or emotion.
30 International Journal of China Marketing vol. 1(2) 2011

TABLE 15 THE GEOGRAPHICAL DISTRIBUTION OF THE MARKET SEGMENTS OF
REFRIGERATORS
Province comprehensive benefits type % Brand-oriented Type% Price-brand Type%Anhui 72.84 2.21 24.95 Fujian 66.67 3.31 30.02 Hebei 63.92 4.90 31.18 Heilongjian 51.24 23.02 25.74 Hunan 76.99 5.53 17.48 Jiangsu 72.82 3.57 23.61 Jiangxi 76.96 0.87 22.17 Neimeng 53.28 5.29 41.43 Shandong 68.10 3.91 27.99 Shanxi 71.13 8.69 20.18 Shanxi 78.99 2.33 18.68 Sichuan 63.73 4.40 31.87 Yunnan 77.74 1.71 20.55 Zhejiang 70.00 3.68 26.32
To analyze the different characteristics of peasants’ consumer behavior in the regional area,
we re-classify the market share according to the three consumer behavior patterns and the three consumption types (Table 16). Aggregately, peasants underline cost-performance and pay more attention to the capacity and the using cost. These are the cooling capacity and power consumption attributes. The consumer demand on durable goods varies in the regional segments where the characteristics of product attributes also vary.
TABLE 16 THE DISTRIBUTION OF CONSUMPTION BEHAVIOR PATTERN OF EACH
SEGMENT
comprehensive benefits type %
Brand-oriented Type%
Price-brand Type%
ENM 70.10 3.50 26.40 CNM 68.09 6.85 25.06 FNM 68.38 4.58 27.04
Note ENM, Extensive Needs Mode FNM, Functional Needs Mode; CNM, Core Needs Mode. CONCLUSION
According to our research on refrigerators, we have come to the following conclusions: (1) there are differences on cognition of product attributes for peasant consumers in different consumer behavior patterns and in different market segments. (2) Peasants are especially practical and the comprehensive benefits type products have the biggest share of the market. The peasants like the function and performance of refrigerators. (3) Sometimes, peasants have the same cognition to different product attributes. This means that the purposes of peasants’ intrinsic
International Journal of China Marketing vol. 1(2) 2011 31

buying psychology are different. (4) Peasants’ decision of electrical appliances is not rational yet. They like products with lower prices, but they also like the large ones at the same time. The decision-making process is contradictory. (5) Through variance analysis of income amount and the income type, there are differences that influence peasant purchasing of refrigerators. In the research review, we mentioned that some scholars did not consider wealth constraints when they researched American purchasing of durable goods. The reasons were: 1) the aim of the consumer behavior research is the general principle whatever individuals or groups decision-making process; 2) the theoretical foundation of the consumer behavior research is considers less the family finances; 3), the consumer behavior research borrowed more from psychology and sociology than from a finance perspective. This explains the empirical results. Where income amounts are not significantly important in peasant decision-making is reasonable.
In general, the most important finding is that peasant consumer evaluations of product attributes in different regions and markets are different. Therefore, in the keen competitive refrigerator market, segmentation is very important. When enterprises develop marketing policy, they must base it on their understanding of peasant evaluations of product attributes as well as the simple demand characteristics of different segments. REFERENCES Guoqun Fu, Xueying Tong.(2003). How Do Brand Price and Place of Origin Influence Consumers’ Choices to Purchase. Journal of Management Sciences in China, 06, (06), 79-84. Xiaoqun He, Shaojie Chen.(2000). the Application of Conjoint Analysis in the Inquiry of Apartments. Statistical Research, 10, (12), 10-14. Huixin Ke, Paul. Frostier. (1994).the Conjoint Analysis in Marketing Research. The Mathematical Statistics and Management, 04, (6), 23-25. Kaocong Tian, Jixue Wei, Yanrong Zhou. (2003). the Application of Conjoint Analysis in the Management of Hospitals. Chinese Journal of Hospital Statistics, 08, (03), 98-103. Zhe Xu, Tingting Fang, Wenping Su. (2004). the Application of the Method of Combination Analysis in the Research on Consumers’ Preference of Product Attributes. Quantifiably Economic and Technologically Economic Research, 12, (11), 138-149. Gao Wang. (2005). the Model Estimation of the Random Coefficients of Conjoint Analysis. Quantitative &Technical Economics, 32, (07), 96-107. Luce, Turkey. (1964). Simultaneous Conjoint Measurement: A New Type of Fundamental measurement. Journal of Mathematical Psychology, 1, (09), 1 27. Green P, Rao V. (1971). Conjoint Measurement for Quantifying Judgmental Data. Journal of Marketing Research, 08, (03), 355 363. Green P, Srinivasan V. (1978). Conjoint Analysis in Consumer Research: Issues and Outlook. Journal of Consumer Research, 5, (2), 103 123.
32 International Journal of China Marketing vol. 1(2) 2011

Green P, Srinivasan V. (1990) Conjoint Analysis in Marketing: New Developments with Implications for Research and Practice. Journal of Marketing, 54, (04), 3 19. Green P, Wind Y. (1975). New Way to Measure Consumers’ Judgments. Harvard Business Review, 53, (04), 107 120. Wittink D.R., Vriens M, Burhenne W. (1994). Commercial use of conjoint analysis in Europe: Results and critical reflections. International Journal of Research in Marketing, 11, (01), 41 52.
International Journal of China Marketing vol. 1(2) 2011 33