demand for local produce in interior alaska - uaa.alaska.edu · demand for local produce in...
TRANSCRIPT

Demand for Local Produce in Interior Alaska
2014 Market Study
Photo Courtesy of Nancy Tarnai and Christine Nguyen
Prepared For: Fairbanks Economic Development Corporation and the Interior Vegetable Farmers Prepared By: Christine Nguyen, Research Assistant
Alaska Cooperative Development Program A Program of the University of Alaska Center for Economic Development

Demand for Local Produce in the Interior | 2014 Market Study
2 | P a g e
Contents
Executive Summary ..................................................................................................................................................... 3
Background of the Study ........................................................................................................................................... 3 Key Points ................................................................................................................................................................. 3
Introduction ................................................................................................................................................................. 3
Definitions ................................................................................................................................................................. 4 Market Study Methodology ...................................................................................................................................... 5
Part I. Produce Market Overview in Fairbanks ....................................................................................................... 6
The Local and Non-Local Produce Market ............................................................................................................... 6 Where Do Buyers Purchase Produce in the Growing Season? .................................................................................. 7 Price Premiums for Local Produce ............................................................................................................................ 7 The Local Produce Market ........................................................................................................................................ 7 Challenges for Buyers Seeking Local Produce ......................................................................................................... 9 Cost-Competitive Local Produce ............................................................................................................................ 10 Producer and Buyer Price Comparison of Local Produce ....................................................................................... 11 Vegetables with the Largest Volume of Monthly Sales .......................................................................................... 12 Summary Chart of Local Produce Demand ............................................................................................................. 12 Additional Processing Requirements ...................................................................................................................... 14
What Kind of Processing is Required? ............................................................................................................... 15
Part II: Buyer Characteristics & Preferences ......................................................................................................... 16
Buyer Characteristics .............................................................................................................................................. 16 Buyer Enrollment in the Alaska Grown Restaurant Rewards Program .............................................................. 17 How Often Do Restaurant and Café Buyers Change Their Menu?..................................................................... 17
What Would Make it Easier for Buyers to Purchase Local Produce? ..................................................................... 18 How Do Buyers Feel About a Centralized Farmer-Owned Business? .................................................................... 18 Certification Requirements ..................................................................................................................................... 19
Food Safety Audits ............................................................................................................................................. 19 Organic Certification Preferences ....................................................................................................................... 19
Additional Preferences ............................................................................................................................................ 20
Conclusion .................................................................................................................................................................. 21
References .................................................................................................................................................................. 22
Appendices ................................................................................................................................................................. 23
Appendix A. Producer Survey Results .................................................................................................................... 23 Appendix B. Buyer Interview Outline and Question Template............................................................................... 25 Appendix C. Buyer Price Averages for Local and Non-Local Produce .................................................................. 30 Appendix D. Locally Grown Produce Price Comparison ....................................................................................... 31 Appendix E. Total Quantity Fairbanks Buyers Are Purchasing Monthly on Average ............................................ 32

Demand for Local Produce in the Interior | 2014 Market Study
3 | P a g e
Executive Summary The Demand for Local Produce in the Interior – 2014 Market Study is a market analysis conducted by the Alaska Cooperative Development Program (ACDP), in partnership with the Fairbanks Economic Development Corporation (FEDC), and farmers in Interior Alaska. This study summarizes data from forty one-on-one interviews conducted with large and small produce buyers around Fairbanks, including retailers, restaurants, cafés, and institutions. It also relates this data to information gleaned from seven surveys completed by vegetable farmers looking to expand their production and who had expressed interest in using some form of cooperative enterprise to facilitate this. The market study aims to bridge the information gap between producers and buyers and to inform Interior-based vegetable farmers where opportunities exist to expand produce sales and production.
Background of the Study For the last several years, the Fairbanks Economic Development Corporation (FEDC) has been working with farmers in the Tanana Valley to find more ways to increase the supply of locally grown food — this work expanded a greater dialogue which has been occurring for over the last decade between the farmers and food purchasers. Based on strong interest from Interior farmers last winter, FEDC applied for the Specialty Crop Block Grant through the Division of Agriculture and was awarded the funding for a market analysis in the fall of 2013. FEDC contracted ACDP to conduct the market analysis. The work was coordinated with a market study steering committee to ensure the project included the farmers’ interests and insights. The committee members including: Jen Becker from Pioneer Produce, Susan Kerndt from Wild Rose Farm, Brad St. Pierre from Goose Foot Farm, and Avril Wiers from Effie Kokrine Charter School.
Key Points • Potential Market Size: The potential annual market for locally grown produce in the Fairbanks area is
$4,802,649. This is for the types of produce that can be grown in Alaska and available for the four-month growing season.1 The current market for all types of produce in Fairbanks year-round is $24,013,245.
• Price Premiums: Buyers are willing to pay more for local produce than for non local produce. Thirteen percent of buyers are willing to pay an additional 26% or more for locally grown produce. Fifty percent of buyers are willing to pay an additional 10-25%.
• Most Marketable Vegetables: Local broccoli, cabbage, cauliflower, and cucumbers are the most marketable vegetables. There is high quantity demand for these vegetables in the price range that would attract buyers. Local carrots, onions, and potatoes are somewhat marketable as they have high quantity demand, but local prices are higher the than estimated price ranges that the majority of buyers interviewed are willing to pay. Local kale and summer squash/zucchini are promising niche market vegetables as local prices are lower than prices for non-locally grown, but the quantity demand is relatively low compared to other vegetables.
• Promising Sales Avenues: Demand for local produce from institutions is very high and some institutions can utilize government programs to pay more for local produce. At the same time there are numerous restaurants seeking local produce and have the capacity to scale up local purchases. The State’s Restaurants Rewards Program provides an additional incentive for restaurants to by local. But, many restaurants do not know about this program and many restaurants which do not currently by local have misconceptions about local prices and are concerned about limited supply. All high-volume buyers require centralized coordination and consistent produce availability and quality. Pre-planning among farmers could address concerns about supply and hiring a representative to conduct outreach and marketing for local products and incentive programs could have large impact on sales.
1 Four months is an estimate of the growing season per year on average.

Demand for Local Produce in the Interior | 2014 Market Study
4 | P a g e
Introduction In relation to the whole state of Alaska, the Interior region has a sizeable agricultural sector with over 212 farms (USDA, 2007). Of that total however, 33 are vegetable producers farming on 1-3 acres, making locally grown vegetables a very niche commodity (FEDC, 2013). Direct sales, the most popular form of selling produce, takes place through Community Supported Agriculture (CSA), U-Pick, farm stands, selling to restaurants, or through one of the four farmers markets: the Fairbanks Downtown Market, Ester Community Market, Tanana Valley Farmers Market, and Highway’s End Farmers Market. Although direct sales to the public has its benefits, including selling quality produce at premium price and low barriers to entry, some farmers want to look at opportunities to diversify and expand production by expanding their sales in the wholesale market. While farmers might be rightfully concerned of “the reality of wholesale pricing” (FEDC, 2013), this study found that the majority of wholesale buyers are willing to pay higher prices for quality, local products. Buyers are interested in sourcing more local produce. 70% of buyers we interviewed (28 respondents) said they currently buy local produce to some capacity and 100% of those buyers (40 respondents) have the capacity to scale up local purchases. Locally grown produce attributed to expenditures of a total of $278,857 in 2013, or $69,714 total per month in the growing season. Although this is just a sliver of the market, it shows the enthusiasm and openness buyers have for purchasing local produce and the opportunities for farmers in this market.
Definitions Buyers: Commercial purchasers of produce, including: educational, medical, and assisted living institutions, chain and independently-owned retailers, year-round and seasonal restaurants, cafés, and other entities providing food services. For more information on the characteristics of the types of buyers, please refer to Part II. Buyer Characteristics on page 16.
Producers: Interior-based farmers from Fairbanks to Delta Junction focusing of vegetable production. Producers are the main audience whom this report is intended to inform, with over 33 vegetable farms in operation according to the Alaska Grown Source Book 2012-2013 and USDA Ag Census (Division of Agriculture, 2012).
Local: Using the term “local” in this report refers to farms located within the Interior, mostly concentrated around the Fairbanks North Star Borough with some farms located in Delta Junction. Produce grown from South-Central Alaska, though still considered local by the Alaska Grown definition, is not the focus of this report and will be referred to as non-Interior Alaska Grown products.
Above: Inside the produce department of one of Fairbanks’ large retailers

Demand for Local Produce in the Interior | 2014 Market Study
5 | P a g e
Market Study Methodology The information in this study is derived mainly from surveys and interviews with producers and commercial produce buyers who expressed interest and who were willing to participate.
Producer Surveys Paper surveys were created to determine what types of vegetables the farmers wanted to grow if marketing cooperatively and to indicate what a fair price would be for farmers should their vegetables be sold in the current market. These surveys were digitally and physically distributed from November-December 2013 and had results from a total of 7 respondents out of the 22 that expressed support for this initiative last winter. Please refer to Appendix A. for producer survey results. Buyer Interviews Buyer data was gathered in structured interviews, sitting one-on-one with the principal investigator and research assistant, Christine Nguyen. We sent requests for interviews to 73 food purchasing entities that represented the greater Fairbanks produce market. In the end, 40 buyers were able to participate in the study. Please refer to Appendix B. for the buyer interview outline and question template. Potential bias may exist in the results because all interviews were conducted on a voluntary basis. It is likely that those buyers who were interested and available to participate were also the buyers most enthusiastic about incorporating local produce into their business. The breakdown of the type of buyers that participated in the study and their representation in the estimated total Fairbanks market are described below in Table 1.
Table 1: Buyers That Participated in the Market Study and Representation in Estimated Produce Market
2All numbers are approximations based on various business directories and word-of-mouth in Fairbanks. We estimate that the original 73 buyers targeted to participate in the market study represent the total market for produce in Fairbanks, with the exception of the nine Bed & Breakfasts in Fairbanks that were not originally contacted. 3The buyer type “other” refers to businesses that do not fall under the category of institutions, retailers, restaurants, or cafes. In this study, the two buyers in category included a Bed & Breakfast and brewery.
Buyer Type # Buyers
Interviewed for Market Study
# Total Buyers in Estimated
Produce Market2
% Buyer Type Represented in Market Study
Institutions 5 7 71%
Retailers 4 10 40%
Year-Round Restaurants 15 31 48%
Seasonal Restaurants 5 13 38%
Cafés 9 10 90%
Other3 2 11 18%
Total 40 83 48%

Demand for Local Produce in the Interior | 2014 Market Study
6 | P a g e
Chain Retailers 94%
Institutions 3%
Year-round Restaurants
1%
Independent Retailers 1%
Seasonal Restaurants 0%
Cafés 1% Other
0% Chain Retailers
Institutions
Year-round Restaurants
Independent Retailers
Seasonal Restaurants
Cafés
Other
Part I. Produce Market Overview in Fairbanks
The Local and Non-Local Produce Market The 32 buyers interviewed for this study estimated that their annual expenditures for produce represent a market worth at least $24,013,245 annually (Table 2). This sum only includes the estimated purchases of the businesses interviewed, or approximately 48% of the total produce market; the actual size of the market is probably two to three times larger, considering that this figure does not include sales from the six other chain retailer stores and a group of restaurants that double those that were interviewed. Figure 1 shows that chain retailers make up 94% of the total market for fresh produce expenditures in Fairbanks— nearly five times the amount all other buyers purchase combined. Based on these amounts the potential market for locally grown produce in Fairbanks4 (Cook, 2011) is probably worth $4,802,649. Table 2: Local and Non-Local Produce Expenditures
Figure 1: Average Expenditures for Local and Non-Local Produce
4 Approximately 40% of the produce that buyers purchase includes fruits and vegetables not grown in Alaska and typically imported—based on buyer invoices and U.S. Fruit and Vegetable Consumption Patterns. 5 The growing season is estimated at four months per year on average.
Buyer Type Local and Non-Local Produce Expenditures
Average Expenditures
Chain Retailers (2) $ 20,000,000 $ 10,000,000 Institutions (5) $ 1,400,000 $ 280,000 Year-round Restaurants (12) $ 1,904,450 $ 158,704 Independent Retailers (2) $ 271,80 $ 135,900 Seasonal Restaurants (3) $ 76,195 $ 25,398 Cafés (6) $ 354,700 $ 59,117 Other (2) $ 6,100 $ 3,050
Total Produce Year-round (32 Buyers) $ 24,013,245 $750,414 Adjusted for Produce Varieties Grown in Alaska $ 14,407,947 $ 450,248
Adjusted for Produce Varieties and the Growing Season5 $4,802,649 $150,083

Demand for Local Produce in the Interior | 2014 Market Study
7 | P a g e
Where Do Buyers Purchase Produce in the Growing Season? Thirty out of the forty buyers interviewed indicated that they purchase produce from at least one national or regional food service distributor such as Food Services of America, Charlie’s Produce, Di Tomaso’s, Quality Sales, and Sysco.6 This is unsurprising, since most of those food service distributors have all-inclusive services that buyers favor, such as online ordering and tracking, customer support, next-day delivery, and quality assurance guarantees. But using food service distributors has not precluded buyers from purchasing locally grown produce. There are 26 buyers purchasing from local farms. The percentage of local produce bought by these farms range from a minimum of .5% of total purchases to 90% of a buyer’s total expenditures on produce. 50% of buyers (20 respondents) currently purchase from both food service companies and local farms. This suggests that there is flexibility where buyers purchase produce, and buying from a large food service distributor does not seem to inhibit local produce purchases.
Table 3: Local and Non-Local Suppliers of Produce
Price Premiums for Local Produce
The interview results show that the majority of buyers are willing to pay more for locally grown produce than they are for non-local produce. Over fifty percent of buyers indicated they are willing to pay 10-25% more for locally grown produce than for non-local, and thirty-six percent of buyers indicated that they would pay 20% or more for local produce.
While these figures are significant, it should be noted that buyers were describing the premium they would pay relative to non-locally grown produce, most which are supplied from food service distributors and retailers. Buyers currently purchasing local indicated that they are not inclined to pay more than what they already pay for local produce.
6 At this current time, no interior farms are supplying to food service distributors or large chain retailers as of yet— but that may very well change in the future.
Where Do Buyers Purchase Local and Non-Local Produce in the Growing Season?
Buyer Type
Non-Commercial Garden or
Greenhouse
Local Farms Farmers Market
Retailer (Including
Sam's Club)
Food Service
Distributor
Other: Purchasing decisions made
from external entity
Institutions (5) 1 4 0 0 4 1 Retailers (4) 0 2 0 0 2 2 Restaurants (20) 0 15 1 7 18 0 Cafés (9) 1 4 0 9 6 0 Other (2) 1 1 1 1 0 0 Total (40) 3 26 2 17 30 3
*There are 20 buyers purchasing from both local farms and food service distributors, and 2 buyers purchasing only from local farms and retailers.
How Much More are Buyers Willing to Pay for Local Produce?
Price Premium Over Non-Locally Grown
Produce
# Buyer Respondents
% Buyers Willing to Pay More
26% or more 4 13% 21-25% 7 23% 16-20% 5 16% 11-15% 4 13% 6-10% 5 16% 1-5% 1 3% None 1 3%
Yes, would pay more but cannot measure in numbers
4 13%
Total: 31 100%
Table 4: Price Premiums Buyers are Willing to Pay

Demand for Local Produce in the Interior | 2014 Market Study
8 | P a g e
The Local Produce Market
Table 5: Buyers that Currently Buy Locally Grown Produce Table 5 shows that 70% of the buyers (28 respondents) are currently buying local produce to some degree. At the peak of the summer buyers are purchasing on average 29% of their produce locally from a total of 15 different farms in the Tanana Valley. Table 6 illustrates the degree to which commercial buyers dominate the purchases of local produce. Last year institutions bought more than half the local produce that was sold. What is more surprising is that seasonal restaurants, though only operating from May to September, have more average local produce purchases than year-round restaurants. Some of the seasonal restaurants are quite large. One manager stated that her restaurant can serve anywhere from 300-800 people a night during the June through August peak tourism season. Table 6: Local Produce Expenditures
Currently Buying Locally Grown Produce from the Interior?
# of Buyers
% of Buyers
Yes 28 70%
No - but buys Non-Interior Alaska Grown produce 5 13%
No 7 18%
Total 40 100%
Buyer Type Local Produce Expenditures Average Expenditures Institutions (4) $ 169,626 $ 42,407
Year-round Restaurants (8) $ 41,689 $ 5,211
Independent Retailers (2) $ 37,920 $18,960
Seasonal Restaurants (3) $ 26,205 $ 8,735
Cafés (2) $ 3,217 $ 1,608
Other (2) $ 200 $ 100
Total per Growing Season (21 Buyers) $ 278,857 $8,714
Total per Month $ 69,714 $2,179
Chain retailers
0%
Institutions 55%
Year-round Restaurants
7%
Independent Retailers
25%
Seasonal Restaurants
11%
Cafés 2%
Other 0%
Institutions
Year-round Restaurants
Independent Retailers
Seasonal Restaurants
Cafés
Other
Figure 2: Average Expenditures for Local Produce

Demand for Local Produce in the Interior | 2014 Market Study
9 | P a g e
43%
36%
32%
29%
25%
18%
11%
11%
7%
14%
25%
33%
33%
42%
42%
17%
25%
33%
8%
Seasonality
Inconsistent Ordering and Availability
Lack of Convenience
Limited Volume
Price
Delivery
Consistent Quality
Unfamilarity with Farmers or Where to Buy Local
Produce Washing & Packing
Lack of Vegetable Variety
% Buyers Who Currently Do Not Buy Local
% Buyers Who Currently Buy Local
Challenges for Buyers Seeking Local Produce Buyers were asked to list their major challenges related to seeking local produce. The following table (Table 7) includes responses from all the buyers interviewed, including those who currently buy local and those who do not.7 Note that 11% of buyers that currently buy local (3 respondents) stated that they have no challenges. Table 7: Most Common Challenges for Buyers Seeking Local Produce
Most Common Challenges Description # of Buyers (40 total)
% of Buyers
Seasonality The shortness and unpredictable nature of the growing season 15 38%
Inconsistent Ordering and Availability
Inconsistent supply or not knowing when produce will be available 14 35%
Lack of Convenience Buyers have limited time to coordinate local purchases with multiple farms 13 33%
Limited Volume Limited ability to supply high-volume orders 13 33%
Price Local produce becomes cost-prohibitive for some buyers 12 30%
Figure 3 below compares the different challenges listed, separating those who currently buy local (28 buyers) and those who do not (12 buyers). The disparities in some responses such as price, volume, and unfamiliarity with farmers indicate areas where food purchasers that are not buying local have poor information about the conditions of the local market and are areas where efforts to inform the buyers could yield more sales. Figure 3: Challenges Between Buyers Who Currently Buy Local and Buyers Who Do Not
7 Buyers that are not currently buying local produce refer to challenges from previous experiences buying local or circumstances which may have prevented them from buying local.

Demand for Local Produce in the Interior | 2014 Market Study
10 | P a g e
Cost-Competitive Local Produce Table 8 compares the prices of vegetables whose locally grown price is equal or less than the price for non-locally grown. This comparison demonstrates which vegetables are the most cost-competitive in the current market. The last two columns in this table show how many of the farmers who answered the producer survey were interested in growing the vegetable, and how many buyers indicated interest in that vegetable in their interviews. Vegetables with high percentages in both of these columns have strong mutual interest from growers and buyers. Taking the price difference and level of mutual interest into consideration, the most marketable vegetables are: broccoli, cauliflower, herbs such as basil, dill, mint, and parsley, and kale. For the complete price comparison table of local and non-local products, please refer to Appendix C.
Table 8: Types of Produce Where Buyer Prices for Locally Grown Produce are Equal to or Less than Prices for Non-Locally Grown Produce
*Note: Highlighted vegetables indicate that over 50% of buyers and producers would buy or sell that vegetable Figures in bold indicate that buyer prices for locally grown produce are less than prices for non-locally grown produce by 10% or more. All prices are rounded to the nearest tenth.
Vegetable Buyer Price for Locally Grown
Buyer Price for Non-Locally
Grown
Price Difference
% Producers
Would Grow This
Vegetable
% Buyers Would Buy
This Vegetable
*All vegetables are whole
Prices per lb unless otherwise noted From Non-Locally Grown to Locally
Grown
% %
Beans, Green
$ 2.30 $ 2.30 0% 29% 57%
Broccoli $ 2.30 $ 2.90 -21% 71% 76%
Cabbage $1.10 $ 1.20 -8% 100% 84%
Cauliflower $ 2.40 $ 2.70 -11% 57% 51%
Celery $1.20 $ 1.40 -14% 29% 78%
Herbs8 $ 8.40 $ 11.20 -25%
43%
73%
Basil $ 11.80 $ 14.50 -19% 46%
Cilantro $ 7.10 $ 7.40 -4% 38%
Dill $ 7.80 $ 15.40 -49% 30%
Mint $ 9.80 $ 15.40 -36% 27%
Parsley $ 5.30 $ 6.00 -12% 46%
Kale $ 2.70 ea. $ 3.40 ea. -21% 100% 41%
Peas9 $ 4.50 $ 4.00 13%10
14%
57% Snow Peas
$ 5.40 $ 5.70 -5% 14%
Sugar Snap $ 4.70 $ 5.20 -10% 14%
Peppers $ 2.00 $ 2.00 0% 0% 78%
Summer Squash/Zucchini $ 2.30 $ 2.50 -8% 86% 73%
Winter Squash $ 1.40 $ 1.60 -13% 29% 57%
8 This is the average of all eleven herbs: Basil, chives, cilantro, dill, mint, oregano, parsley, rosemary, sage, and thyme. 9 This is the average for garden peas, snow peas, and sugar snap peas. 10 While the average buyer prices for local peas are not less than the average prices for non-local (mainly because it includes garden peas), snow peas and sugar snap peas specifically are less.
Demand for Local Produce in the Interior | 2014 Market Study
11 | P a g e
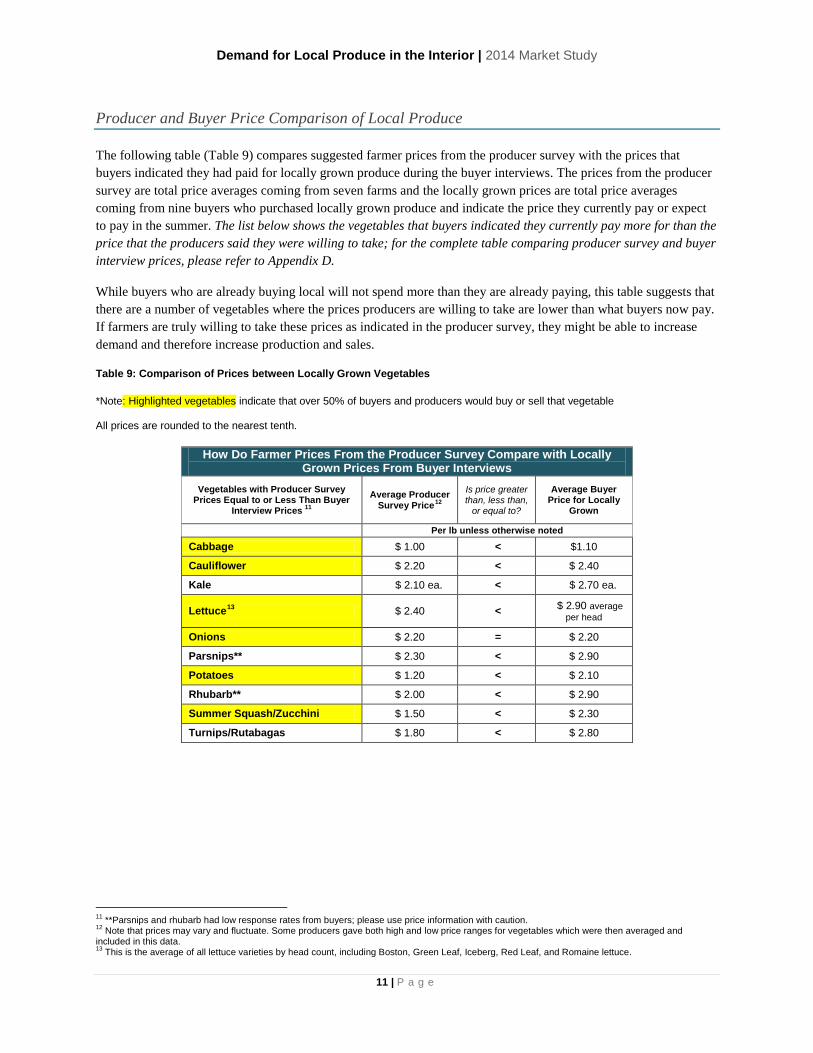
Producer and Buyer Price Comparison of Local Produce The following table (Table 9) compares suggested farmer prices from the producer survey with the prices that buyers indicated they had paid for locally grown produce during the buyer interviews. The prices from the producer survey are total price averages coming from seven farms and the locally grown prices are total price averages coming from nine buyers who purchased locally grown produce and indicate the price they currently pay or expect to pay in the summer. The list below shows the vegetables that buyers indicated they currently pay more for than the price that the producers said they were willing to take; for the complete table comparing producer survey and buyer interview prices, please refer to Appendix D.
While buyers who are already buying local will not spend more than they are already paying, this table suggests that there are a number of vegetables where the prices producers are willing to take are lower than what buyers now pay. If farmers are truly willing to take these prices as indicated in the producer survey, they might be able to increase demand and therefore increase production and sales.
Table 9: Comparison of Prices between Locally Grown Vegetables
*Note: Highlighted vegetables indicate that over 50% of buyers and producers would buy or sell that vegetable All prices are rounded to the nearest tenth.
How Do Farmer Prices From the Producer Survey Compare with Locally Grown Prices From Buyer Interviews
Vegetables with Producer Survey Prices Equal to or Less Than Buyer
Interview Prices 11 Average Producer
Survey Price12 Is price greater than, less than,
or equal to?
Average Buyer Price for Locally
Grown
Per lb unless otherwise noted
Cabbage $ 1.00 < $1.10
Cauliflower $ 2.20 < $ 2.40
Kale $ 2.10 ea. < $ 2.70 ea.
Lettuce13 $ 2.40 < $ 2.90 average per head
Onions $ 2.20 = $ 2.20
Parsnips** $ 2.30 < $ 2.90
Potatoes $ 1.20 < $ 2.10
Rhubarb** $ 2.00 < $ 2.90
Summer Squash/Zucchini $ 1.50 < $ 2.30
Turnips/Rutabagas $ 1.80 < $ 2.80
11 **Parsnips and rhubarb had low response rates from buyers; please use price information with caution. 12 Note that prices may vary and fluctuate. Some producers gave both high and low price ranges for vegetables which were then averaged and included in this data. 13 This is the average of all lettuce varieties by head count, including Boston, Green Leaf, Iceberg, Red Leaf, and Romaine lettuce.
Demand for Local Produce in the Interior | 2014 Market Study
12 | P a g e
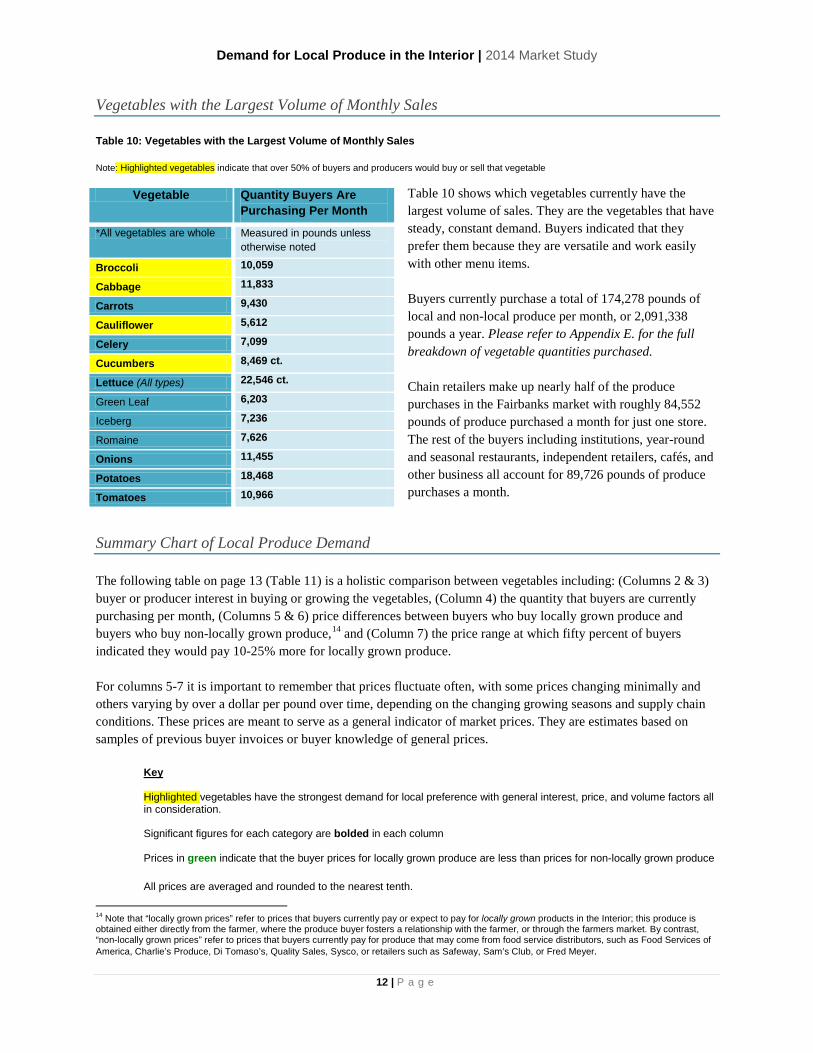
Vegetables with the Largest Volume of Monthly Sales Table 10: Vegetables with the Largest Volume of Monthly Sales
Note: Highlighted vegetables indicate that over 50% of buyers and producers would buy or sell that vegetable
Table 10 shows which vegetables currently have the largest volume of sales. They are the vegetables that have steady, constant demand. Buyers indicated that they prefer them because they are versatile and work easily with other menu items. Buyers currently purchase a total of 174,278 pounds of local and non-local produce per month, or 2,091,338 pounds a year. Please refer to Appendix E. for the full breakdown of vegetable quantities purchased. Chain retailers make up nearly half of the produce purchases in the Fairbanks market with roughly 84,552 pounds of produce purchased a month for just one store. The rest of the buyers including institutions, year-round and seasonal restaurants, independent retailers, cafés, and other business all account for 89,726 pounds of produce purchases a month.
Summary Chart of Local Produce Demand The following table on page 13 (Table 11) is a holistic comparison between vegetables including: (Columns 2 & 3) buyer or producer interest in buying or growing the vegetables, (Column 4) the quantity that buyers are currently purchasing per month, (Columns 5 & 6) price differences between buyers who buy locally grown produce and buyers who buy non-locally grown produce,14 and (Column 7) the price range at which fifty percent of buyers indicated they would pay 10-25% more for locally grown produce. For columns 5-7 it is important to remember that prices fluctuate often, with some prices changing minimally and others varying by over a dollar per pound over time, depending on the changing growing seasons and supply chain conditions. These prices are meant to serve as a general indicator of market prices. They are estimates based on samples of previous buyer invoices or buyer knowledge of general prices.
Key Highlighted vegetables have the strongest demand for local preference with general interest, price, and volume factors all in consideration. Significant figures for each category are bolded in each column Prices in green indicate that the buyer prices for locally grown produce are less than prices for non-locally grown produce All prices are averaged and rounded to the nearest tenth.
14 Note that “locally grown prices” refer to prices that buyers currently pay or expect to pay for locally grown products in the Interior; this produce is obtained either directly from the farmer, where the produce buyer fosters a relationship with the farmer, or through the farmers market. By contrast, “non-locally grown prices” refer to prices that buyers currently pay for produce that may come from food service distributors, such as Food Services of America, Charlie’s Produce, Di Tomaso’s, Quality Sales, Sysco, or retailers such as Safeway, Sam’s Club, or Fred Meyer.
Vegetable Quantity Buyers Are Purchasing Per Month
*All vegetables are whole Measured in pounds unless otherwise noted
Broccoli 10,059
Cabbage 11,833
Carrots 9,430
Cauliflower 5,612
Celery 7,099
Cucumbers 8,469 ct.
Lettuce (All types) 22,546 ct.
Green Leaf 6,203
Iceberg 7,236
Romaine 7,626
Onions 11,455
Potatoes 18,468
Tomatoes 10,966

Demand for Local Produce in the Interior | 2014 Market Study
13 | P a g e
Table 11: Summary Chart of Local Produce Demand
Vegetable Type15
% Producers
Would Grow This Vegetable
% Buyers Would
Buy This Vegetable
Quantity Buyers
Purchasing Per Month16
Buyer Price Average for
Locally Grown Produce17
Buyer Price Average for Non-
Locally Grown Produce18
Price 50% of the Buyers are Willing to Pay
*All vegetables are whole % %
Pounds unless
otherwise noted
Per lb unless otherwise noted 10% More 25% More
Beans - Green 29% 57% 1,530 $ 2.30 = $ 2.30 $ 2.50 - $ 2.80
Beets 71% 38% 1,241 $ 2.10 - - - -
Broccoli 71% 76% 10,059 $ 2.30 < $ 2.90 $ 3.20 - $ 3.60
Brussels Sprouts 14% 19% 470 - - - - -
Cabbage 100% 84% 11,833 $1.10 < $ 1.20 $ 1.30 - $ 1.50
Carrots 43% 84% 9,430 $1.70 > $ 1.10 $ 1.20 - $ 1.40
Cauliflower 57% 51% 5,612 $ 2.40 < $ 2.70 $ 2.90 - $ 3.30
Celery 29% 78% 7,099 $1.20 < $ 1.40 $ 1.50 - $ 1.80
Chard 43% 30% 668 ct. $ 2.40 ea. - - - -
Cucumbers 57% 89% 8,469 ct. $ 1.50 ea. > $ 1.30 ea. $ 1.40 - $ 1.60 ea.
Garlic 0% 54% 5,624 - $ 2.60 $ 2.90 - $ 3.30
Green Onions 29% 65% 1,111 $ 5.00 > $ 3.60 $ 3.90 - $ 4.50
Greens - Spinach 43% 57% 1,845 $ 5.30 > $ 3.50 $ 3.90 - $ 4.40
Herbs 43% 73% 339 $ 8.40 < $ 11.20 $12.30 - $14.00
Kale 100% 41% 1,148 ct. $ 2.70 ea. < $ 3.40 ea. $ 3.70 - $ 4.20
Kohlrabi 71% 22% 161 ct. $ 1.80 ea. - - - -
Leeks 14% 41% 635 $ 1.60 > $ 0.80 $ 0.90 - $ 1.00
Lettuce 57% 89% 22,546 ct. $ 2.90 ea. > $ 1.90 ea. $ 2.10 - $ 2.40 ea.
Onions 57% 89% 11,455 $ 2.20 > $ 1.40 $ 1.60 - $ 1.80
Parsnips 29% 27% 389 $ 2.90 - - - -
Peas 14% 57% 1,341 $ 4.50 > $ 3.90 $ 4.30 - $ 4.90
Peppers 0% 78% 2,745 ct. $ 2.00 ea. = $ 2.00 ea. $ 2.20 - $ 2.50 ea.
Potatoes 86% 81% 18,468 $ 2.10 > $ 1.00 $ 1.20 - $ 1.30
Radishes 29% 38% 150 $ 2.10 > $ 1.90 $ 2.00 - $ 2.30
Rhubarb 0% 30% 291 $ 2.90 - - - -
Shallots 14% 35% 70 $ 3.30 - - - -
Summer Squash 86% 73% 1,826 $ 2.30 < $ 2.50 $ 2.80 - $ 3.10
Sweet Corn 0% 27% 240 ct. $ .84 ea. - - - -
Tomatoes 43% 89% 10,966 $ 2.90 > $ 1.80 $ 2.00 - $ 2.30
Turnips/Rutabagas 29% 35% 720 $ 2.80 - - - -
Winter Squash 29% 57% 1,099 $ 1.40 < $ 1.60 $ 1.70 - $2.00
15 Vegetables with popular varieties, for example, lettuce, bell peppers, or potatoes, or vegetables that need further processing are included in Appendix B. 16 Volume information on herbs, assorted loose lettuce, peas, peppers, radishes, shallots, sweet corn, and winter squash were not included in the retailer interview response. We have reason to believe total produce purchases would be higher than noted. 17 Locally grown prices in this column are the total price averages coming from 9 buyers providing locally grown produce at which currently pay or expect to pay in the summer. 18 In this case, the prices for non-locally grown produce derive from produce supplied from food service distributors or retailers.

Demand for Local Produce in the Interior | 2014 Market Study
14 | P a g e
14%
21%
11%
14%
13%
19%
10%
9%
20%
5%
13%
13%
9%
12%
14%
3%
10%
14%
9%
4%
15%
5%
Beans
Beets
Broccoli
Brussels Sprouts
Cabbage
Carrots
Celery
Chard
Garlic
Greens
Kale
Kohlrabi
Lettuce
Onions
Peas
Peppers
Potatoes
Radishes
Rhubarb
Summer Squash
Turnips/ Rutabagas
Winter Squash
Percent of Buyers
Additional Processing Requirements Only a handful of buyers in the Fairbanks market demand processed produce— produce altered in some form and not sold whole. But, most of these buyers are high-volume restaurants or institutions and together they purchase over 7,298 pounds of processed produce per month. Although most restaurants that currently buy processed produce said they would accept vegetables from local producers whole, the institutions said they were less flexible since the sheer scale of their operations precludes them from buying certain products whole. For example, the Fairbanks North Star Borough School District prepares and serves approximately 5,000 meals a day; they, like many other school districts, specifically request vegetables in pre-chopped or shredded form.
Figure 4 gives the percentage of the total demand for a given vegetable that requires processing.19 A large percentage of the beets, garlic, carrots, turnips and rutabagas purchased in Fairbanks are purchased by buyers who require some form of processing.
These are, of course, percentages. While there are some vegetables like turnips for which a relatively high percentage of buyers require processing, in actuality the absolute demand20 for processed turnips is low because the total sales of turnips are low. The vegetables with the highest absolute demand in a processed form include carrots, cabbage, garlic, and onions. Table 12 shows the number of interested buyers and total quantity purchased of these vegetables per month.
Table 12: Largest Quantities Buyers are Purchasing of Processed Produce
Vegetables #
Interested Buyers
Quantity Purchased Monthly (lb)
Carrots 6 555 Cabbage 4 1,084 Garlic 4 168 Onions 4 952
The vegetables that do not require any type of processing include cauliflower, cucumbers, green onions, herbs, leeks, parsnips, shallots, sweet corn, tomatoes, and strawberries.
19 This value is measured by the number of buyers requiring that type of vegetable processed divided by the total number of interested buyers. 20 This value is measured by the most buyers requiring that type of vegetable processed out of the total number of interested buyers.
Figure 4: Demand of Vegetables that Require Processing

Demand for Local Produce in the Interior | 2014 Market Study
15 | P a g e
2
1
2 2
1
2 2 2
1
2
1 1 1 1 1 1 1 1 1
0
0.5
1
1.5
2
2.5
Num
ber o
f Buy
ers
Institution
Restaurant
Café
What Kind of Processing is Required? Figure 5 depicts the different types of processing buyers require from trimming, to peeling, to cutting and shredding. The vegetables that need to be trimmed or clipped the most include carrots, radishes (with tops removed), and kale.
Figure 5: Demand for Trimmed or Clipped Vegetables
The vegetables that need to be peeled the most include garlic, onions, and peas (here, the buyers are referring to garden peas that they prefer to be shelled).
Figure 6: Demand for Peeled Vegetables
Figure 7 shows how many buyers require other type of processing: pre-cutting, dicing, shredding, or slicing. Institutions clearly have the most demand for processed vegetables, with 5 buyers requiring additional processing from 13 different vegetables.
Figure 7: Demand for Processed Vegetables— Cut, Diced, Shredded, Etc.
1 1 1
2
1 1 1
2
1 1
2
1 1 0
0.5 1
1.5 2
2.5
Num
ber o
f Buy
ers
Institution
Restaurant
1
2 2 2
1
2
1
0
0.5
1
1.5
2
2.5
Beets Carrots Garlic Kohlrabi Onions Peas
Num
ber o
f Buy
ers
Institution Restaurant

Demand for Local Produce in the Interior | 2014 Market Study
16 | P a g e
Part II: Buyer Characteristics & Preferences
Buyer Characteristics21 Retailers Retailers include independent markets, and chain grocery stores and supercenters. They require consistent, high-volume suppliers. Retailer produce purchases in Fairbanks make up 95% of the produce market (1% independent retailer, 94% chain retailer). Smaller independent retailers are more flexible. Large retailers often have their purchasing decisions made from corporate offices out-of-state. In order to pursue sales with these large chain retailers, producers must speak with field representatives. Their set-up process takes a minimum of 2-3 months and will include food safety certifications. Nevertheless, if producers are able to meet the retailers’ requirements and successfully negotiate prices, it opens up completely new markets for farmers and holds the most promise for farmers that want to scale up production while focusing on just a few vegetable varieties. Institutions Institutions include the Fairbanks North Star Borough School District, Fairbanks Memorial Hospital, University of Alaska Fairbanks, and assisted living facilities in Fairbanks. While the high volume and high demand for processed produce make institutions a generally difficult market for small farms to enter, Fairbanks institutions have expressed interest and willingness to work with local farmers. They already make up nearly 60% of the local produce purchases in the market. The Farm-to-School Program promotes local produce in schools through mini-grants and support services. In addition, the district currently has over $207,975 in financial funding from the Nutritional Alaskan Foods in Schools Grant in 2014 to incorporate more Alaska Grown produce in their meals (Department of Education & Early Development, 2013). This financial support suggests that the school district is the low-hanging fruit for expanding local produce sales in the current market. Restaurants Restaurants include year-round restaurants and seasonal restaurants that cater to tourists from May-September. Compared to the other buyers, year-round and seasonal restaurants are the most enthusiastic about fostering producer-buyer relationships.22 They are also the most willing to pay premium prices and are more flexible than institutional buyers. Some restaurants are able to create menu specials to highlight local produce and price is not usually a challenge for them if they are able to increase the prices of the specials to offset costs.23 Still, there are restaurants that do not currently buy local produce and are reluctant to do so because prices appear cost-prohibitive. This is where utilizing state reimbursement programs could help. The State’s Alaska Grown Restaurant Rewards Program, a Division of Agriculture initiative that assists in promoting local produce by reimbursing dining establishments up to 17% for buying Alaska Grown produce (Department of Natural Resources, 2013),24 could help counterbalance the perceived high prices and attract new restaurant buyers.
21 The fifth major category separating buyers are “Other Buyers.” The two buyers interviewed in this category include a brewing company and a bed & breakfast. Due to the small representation of buyers in this category, no notable patterns have been concluded. 22 Many restaurants have established connections with farms and strongly value the relationship with the farmer. Note that three buyers said they would still go to the farmer they currently buy from even if a producer cooperative were created. 23 Please refer to the next section on page 17 for more information on how restaurant buyers plan and change their menus. 24 Please refer to the next section on page 17 for more information on the Alaska Grown Restaurant Rewards Program.
Below: Outside of Raven Landing, a retirement community that uses local produce in its menus during the summertime

Demand for Local Produce in the Interior | 2014 Market Study
17 | P a g e
Cafés Cafés are similar to restaurants25 but notably smaller in produce purchases. Some cafés are so small that they only purchase from retailers and local farms and do not use food service distributors. Those cafés that do buy from food service distributors are able to buy produce 1-3 times a week. This is far less frequent than most high-volume restaurants and dining services that receive deliveries daily. Some café buyers noted that they are more sensitive to paying higher prices, which makes their purchasing decisions less flexible for food items that typically have slim margins— like, for instance a deli sandwich. As with restaurants, the Restaurant Rewards Program could ameliorate this problem and could help increase sales of local produce to new cafés.
Buyer Enrollment in the Alaska Grown Restaurant Rewards Program The Alaska Grown Restaurant Rewards Program, described above, is currently operated by the Division of Agriculture at the Alaska Department of Natural Resources. It reimburses restaurants that buy Alaska grown produce up to 17% of their purchases. When asked if they knew of the program and were enrolled, 60% of eligible buyers26 (18 respondents) stated they were not enrolled and were not aware the program existed. Focusing more attention on this program might help convince more restaurants to by local produce, especially since it directly addresses a challenge raised by 30% of buyers (12 respondents) – that prices for local produce have become cost-prohibitive.
How Often Do Restaurant and Café Buyers Change Their Menu?
One benefit of working with restaurant and café buyers is that they tend to be more flexible with their menu planning than institutions. Menu specials are a good way to highlight premium local produce. Currently 9 out of 22 buyers said they have the ability to create and change menu specials on a weekly or biweekly basis. As for changing the main menu, 9 out of 21 buyers responded that they have a standard main menu that does not change. Restaurants with chefs and management staff that have relationships with local producers are more likely to highlight Alaska Grown produce in their main menus and to
also incorporate the vegetables that are less consistently available on a flexible weekly or daily basis. As seen in Table 14, there are currently four buyers with this degree of flexibility.
25 By definition cafés are small restaurants; for the purpose of organizing buyers by operation size, cafés were placed in a separate category. 26 Eligibility for the program is based on food service type, including restaurants, caterers, and food vendors, but excluding schools, institutions, and universities
Table 13: Buyer Enrollment in the Alaska Grown Restaurant Rewards Program
Buyer Responses Number of Buyers
Percent of Buyers
Yes - Enrolled 8 27% No - Not enrolled but aware of program 4 13% No - Not enrolled and not aware of program 18 60%
Total Respondents: 30 100%
Table 14: Menu Planning
Buyer Responses # of Buyers
% of Buyers
Menu Does Not Change 9 43% 1–2 Times Yearly 3 14% 3–4 Times Yearly 5 24% Weekly 2 10% Daily 2 10%
Total Respondents: 21 100%
Above: Logo for the State program that aims to strengthen the relationship between restaurant buyers and producers by promoting Alaska Grown purchases. Photo courtesy of the Division of Agriculture
Demand for Local Produce in the Interior | 2014 Market Study
18 | P a g e
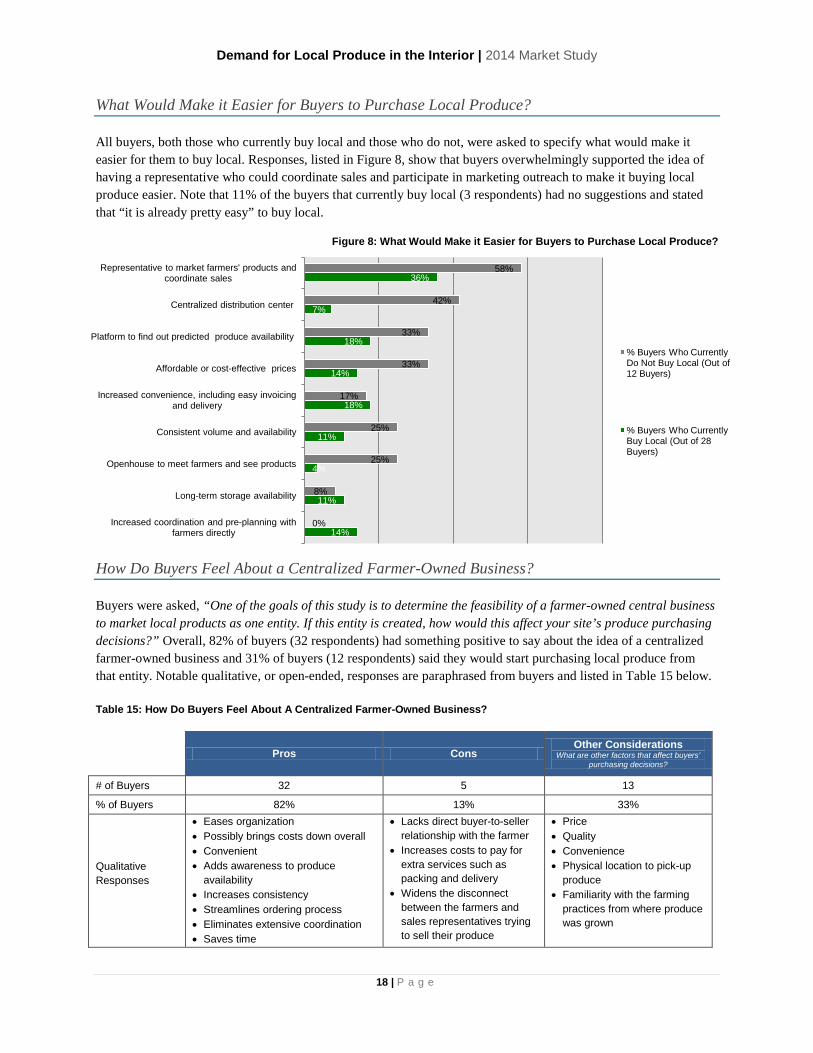
What Would Make it Easier for Buyers to Purchase Local Produce? All buyers, both those who currently buy local and those who do not, were asked to specify what would make it easier for them to buy local. Responses, listed in Figure 8, show that buyers overwhelmingly supported the idea of having a representative who could coordinate sales and participate in marketing outreach to make it buying local produce easier. Note that 11% of the buyers that currently buy local (3 respondents) had no suggestions and stated that “it is already pretty easy” to buy local.
Figure 8: What Would Make it Easier for Buyers to Purchase Local Produce?
How Do Buyers Feel About a Centralized Farmer-Owned Business? Buyers were asked, “One of the goals of this study is to determine the feasibility of a farmer-owned central business to market local products as one entity. If this entity is created, how would this affect your site’s produce purchasing decisions?” Overall, 82% of buyers (32 respondents) had something positive to say about the idea of a centralized farmer-owned business and 31% of buyers (12 respondents) said they would start purchasing local produce from that entity. Notable qualitative, or open-ended, responses are paraphrased from buyers and listed in Table 15 below. Table 15: How Do Buyers Feel About A Centralized Farmer-Owned Business?
Pros Cons
Other Considerations What are other factors that affect buyers’
purchasing decisions?
# of Buyers 32 5 13
% of Buyers 82% 13% 33%
Qualitative Responses
• Eases organization • Possibly brings costs down overall • Convenient • Adds awareness to produce
availability • Increases consistency • Streamlines ordering process • Eliminates extensive coordination • Saves time
• Lacks direct buyer-to-seller relationship with the farmer
• Increases costs to pay for extra services such as packing and delivery
• Widens the disconnect between the farmers and sales representatives trying to sell their produce
• Price • Quality • Convenience • Physical location to pick-up
produce • Familiarity with the farming
practices from where produce was grown
14%
11%
4%
11%
18%
14%
18%
7%
36%
0%
8%
25%
25%
17%
33%
33%
42%
58%
Increased coordination and pre-planning with farmers directly
Long-term storage availability
Openhouse to meet farmers and see products
Consistent volume and availability
Increased convenience, including easy invoicing and delivery
Affordable or cost-effective prices
Platform to find out predicted produce availability
Centralized distribution center
Representative to market farmers' products and coordinate sales
% Buyers Who Currently Do Not Buy Local (Out of 12 Buyers)
% Buyers Who Currently Buy Local (Out of 28 Buyers)

Demand for Local Produce in the Interior | 2014 Market Study
19 | P a g e
Yes – Certified Organic
Preferred, 5, 12%
Yes – Certified Organic
Preferred but Non-Essential,
9, 22%
No – Non-Organic
Preferred, 1, 3%
No Certified Organic
Preference – Strong Local Preference,
14, 35%
No Preference, 11, 28%
Figure 9: Organic Certification Preferences
(40 Respondents Total)
Certification Requirements Interview results indicate that there are not many required standards preventing farmers from further entering the market. Of the forty buyers interviewed, five require the farms to pre-register with the buyers’ planning or development offices before any purchasing can begin. These are high-volume buyers such as restaurants, retailers or educational institutions that purchase anywhere from $20,000 to $10,000,000 of produce annually. Food Safety Audits Large chain retailers, such as Fred Meyer, Safeway, Sam’s Club and Wal-Mart require food safety audits and a minimum of $2 million in liability insurance (Safeway, 2012). Likewise, national food service distributors like Sysco, Food Service of America, and Quality Sales, and even regional distributors like Charlie’s Produce and Di Tomaso’s require some form of an audit. These audits, like the USDA GAP (Good Agricultural Practices), USDA GAP/GHP (Good Agricultural Practices/Good Handling Practices), the Produce GAPs Harmonized Food Safety Standard Audit, and the Global Food Safety Initiative (GFSI) Audit Program, are national and international standards that signify food is being safety handled at the farms, packing houses, and through the supply chain (USDA, 2011). Farmers who are interested in selling to large chain retailers or restaurants should contact the buyer directly to see exactly what type of audit is needed to meet minimum requirements.27 Here in Alaska, USDA GAP audits can be conducted through the Division of Agriculture Palmer office by agricultural inspector, Barbara Hanson. When buyers were asked about food safety audits and necessary certifications during the interview, only 16% of buyers (5 out of 31 respondents) said they actually require them. Another five buyers said they do not require the full safety audit or certification, however, do expect the buyers to understand and follow standard safety practices; this includes, at a minimum, having water tested. Surprisingly, over half of the buyers said that they either do not have any safety certifications, or they failed to state any that came to mind. Organic Certification Preferences While certified organic produce is critical to a few buyers, the overwhelming consensus is that buyers prefer local produce regardless of having a preference for certified organic produce. Figure 9 illustrates the different types of certified organic preference, with 35% of the buyers responding “No certified organic preference— Strong local preference.”
27 As an example of how much food safety audit requirements can vary, regional food service distributor DiTomaso’s requires the USDA’s GAP/GHP Audit Program (Good Agricultural Practices/Good Handling Practices) Audit, which is an audit in compliance with the Food and Drug Administration. On the other hand, large retailers like Wal-Mart and Sam’s Club only accept Global Food Safety Initiative (GFSI) Audit in an effort to streamline regulation requirements with their partners around the world.

Demand for Local Produce in the Interior | 2014 Market Study
20 | P a g e
Additional Preferences Delivery Regarding delivery services, 94% of buyers (29 respondents) indicated that they either prefer or require delivery directly to their location. For restaurants out of city limits, the restaurant or farmer hires an expeditor to get produce delivered; in both cases, the buyers cover expenses for delivery. Four respondents stated they would prefer if quality control measures were in place before deliveries were set up such as quality assurance guarantees; otherwise, they requested that they be able to hand-pick or hand-check produce upon delivery. Other Types of Local Food Buyers indicated interest in purchasing other types of locally grown food other than produce, expressed in Table 16. Honey was the most popular of these products with18 respondents expressing interest. Honey was followed by eggs with 16 respondents, and then beef with 11 respondents. Note that most buyers require the eggs and meat to be processed in a certified plant and meet federal food safety laws. Buyers stated they would be more likely to purchase local meat if they were cut and wrapped in smaller packaging.
Table 16: Other Local Products Buyers Would Be Interested in Purchasing
Type of Local Food
# of Buyers
(Out of 40) % of
Buyers
Beef 11 28% Bison 4 10%
Chicken 10 25% Elk 6 15%
Lamb 2 5% Pork 7 18%
Reindeer 7 18% Turkey 3 8%
Eggs 16 40% Flour 8 20%
Honey 18 45%

Demand for Local Produce in the Interior | 2014 Market Study
21 | P a g e
Conclusion Our results make clear that local produce is currently just a sliver of the market with $278,857 spent per growing season out of a potential market of $4,802,649. It is evident is that chain retailers dominate the total produce market with 94% of produce expenditures and they currently do not buy local produce. One way to increase local produce’s share of this market is to focus on the factors that affect the buyers’ abilities to purchase more and to find ways to meeting buyers’ industry-specific needs. In our interviews, buyers identified the factors that affect their ability to purchase more: having a representative to market farmers’ products and coordinate sales (17 respondents), a platform to find out produce availability (9 respondents), a centralized distribution center (7 respondents), affordable or cost-effective prices (8 respondents), and increased convenience including easy invoicing and delivery (7 respondents).
It is important to note that buyers who do not currently buy local produce face different challenges. These buyers share a number of misconceptions about local produce: that it is expensive, and that supply could never meet the buyers’ high-volume needs. Regarding price, this study demonstrates that there are in fact a number of locally grown vegetables that can be sold at competitive market price— broccoli, cabbage, cauliflower, kale, and summer squash or zucchini just to name a few. Many of the cost sensitive buyers who are reluctant to buy local produce do not know about the Alaska Grown Restaurant Rewards Program that could subsidize their purchases. Farmers could address the concerns regarding supply of high volumes through pre-planning and coordination.
Institutions and large restaurants offer a good opportunity for farmers to expand their sales. These buyers want local produce and they buy large quantities. After chain retailers they are the largest producer purchasers in this market. Institutions like the Fairbanks North Star Borough School District can also use the Nutritional Alaskan Foods in Schools Grant that subsidizes local food purchases. In order to access these buyers, farmers will need to coordinate and plan together to ensure they have the large quantities institutions and large restaurants need. They will also need to pool resources and obtain equipment for minimal processing which institutions and large restaurants require; trimming, peeling, and cutting produce.
It is clear that farmers and advocates for the local food system continue the education and marketing initiatives that promote understanding on produce availability, seasonality, prices, and varieties. Increasing cooperation among farmers in production or marketing in some form will help expand local produce purchases in the greater Fairbanks area. This study shows that there is certainly the demand to support more local produce under the current price structure. Under current conditions, producers could easily increase their market and profits by coordinating what they are growing, and by growing the vegetables that have the most cost-competitive advantage, and which are popular and versatile to use in menu items, and most importantly, valuable enough to the community.

Demand for Local Produce in the Interior | 2014 Market Study
22 | P a g e
References Cook, R. (2011, October). Tracking Demographics and U.S. Fruit and Vegetable Consumption Patterns. Department
of Agricultural and Resource Economics at University of California, Davis. Retrieved from http://agecon.ucdavis.edu/people/faculty/roberta-cook/docs/Articles/BlueprintsEoEConsumptionCookFinalJan2012Figures.pdf
Department of Education & Early Development. (2013). Food Grant for Nutritious Alaskan Food in Schools - FY14 PROJECTION. School Finance. Retrieved from http://commerce.alaska.gov/dnn/Portals/4/pub/NAFS%20-%20school%20districts%20and%20allocation%20amount.pdf
Department of Natural Resources. (2013, September 4). Alaska Grown Restaurant Rewards Program. Division of Agriculture. Department of Natural Resources. Retrieved from <http://dnr.alaska.gov/ag/RR/PG3.pdf>.
Division of Agriculture. (2012). Alaska Grown Source Book: Business Listings. Retrieved from Department of Natural Resources: http://dnr.alaska.gov/ag/sourcebook/regionB.htm
FEDC. (2013). Follow-up Survey Results: Concerns About A Cooperative. Fairbanks Growers Cooperative.
FEDC. (2013). How Many Acres Do You Farm? Fairbanks Growers Cooperative Survey Results.
Safeway. (2012). Safeway General Safety Specifications. Retrieved from http://suppliers.safeway.com/usa/pdf/safeway_general_specifications.pdf
USDA. (2007). 2007 Census of Agriculture Area Data. USDA National Agricultural Statistics Service. Retrieved from <http://www.agcensus.usda.gov/Publications/2007/Full_Report/Volume_1,_Chapter_2_County_Level/Alaska/st02_2_001_001.pdf>.
USDA. (2011, April). Audit User's Guide for GAP & GHP. Agricultural Marketing Service. Retrieved from <http://www.ams.usda.gov/AMSv1.0/getfile?dDocName=stelprdc5097151>.

Demand for Local Produce in the Interior | 2014 Market Study
23 | P a g e
Appendices Appendix A. Producer Survey Results
(Chart 1 of 2 in Appendix A.)
29% 71% 71%
14% 100%
43% 57%
29% 43%
57% 0%
43% 29%
43% 43%
100% 71%
57% 57%
29% 0% 0%
86% 29%
0% 14%
86% 0%
43% 29% 29%
0% 20% 40% 60% 80% 100% 120%
Beans Beets
Broccoli Brussels Sprouts
Cabbage Carrots
Cauliflower Celery Chard
Cucumbers Garlic
Greens Green Onions Head Lettuce
Herbs Kale
Kohlrabi Leaf Lettuce
Onions Parsnips
Peas Peppers
Potatoes Radishes
Rhubarb Shallots Summer …
Sweet Corn Tomatoes
Turnips/Rutabagas Winter Squash
% Producer Respondents Indicating Interest Level 3-5 (Out of 5)
Types of Vegetables Producers are Interested in Marketing (As of March 2014 - 7 Respondents)

Demand for Local Produce in the Interior | 2014 Market Study
24 | P a g e
(Chart 2 of 2 in Appendix A.)
14%
43% 0%
43% 43% 29% 71% 14% 57%
14% 0% 14% 29% 14% 71% 57% 71%
43% 43% 57%
86% 43% 43% 57%
71% 14% 29%
43%
57% 43%
29% 14%
14% 29%
43% 14%
57% 43%
14% 14% 29%
43% 29%
14% 29%
57% 29%
14% 14%
14% 29% 14%
0% 20% 40% 60% 80% 100% 120%
Beans Beets
Broccoli Brussels Sprouts
Cabbage Carrots
Cauliflower Celery Chard
Cucumbers Garlic
Greens Green Onions Head Lettuce
Herbs Kale
Kohlrabi Leaf Lettuce
Onions Parsnips
Peas Peppers
Potatoes Radishes
Rhubarb Shallots
Summer Squash/Zucchini Sweet Corn
Tomatoes Turnips/Rutabagas
Winter Squash
Types of Vegetables Producers are Not Interested in Marketing (As of March 2014 - 7 Respondents)
% Producers Indicating N/a or Not Growing % Producers Indicating Interest Level 0-2 (Out of 5)

Demand for Local Produce in the Interior | 2014 Market Study
25 | P a g e
Appendix B. Buyer Interview Outline and Question Template *Please format pages 4-5 of Appendix B. to landscape page orientation to view table.
(Page 1 of 5 in Appendix B.)
Demand for Local Produce in the Interior – 2014 Market Study
Summary: Over the last couple of years, there has been expressed interest on behalf of the growers in the Fairbanks area to form a central business to store, process, and market locally grown products. The creation of this business would streamline the process of selling produce to restaurants, retailers, and institutional buyers, therefore having more of an impact putting locally grown produce in the community. The purpose of this structured interview is to measure just how large this market demand might be in the Fairbanks region and what the purchasing specifications are for buying local produce.
We appreciate you taking the time to participate. Feel free to contact Christine Nguyen at [email protected] if you ever have any questions.
Contact Information
Name of Selected Site: Name and Title: Address: Email: Phone:
Which of the following best represents your selected site: (X)
Grocery Retailer Independent Chain Other (Please specify)
Institution
K-12 School Hospital Government Agency Residential Care University Other (Please specify)
Restaurant
Café Casual Dining Fine Dining Food Truck Seasonal Other (Please specify)

Demand for Local Produce in the Interior | 2014 Market Study
26 | P a g e
(Page 2 of 5 in Appendix B.)
Introductory Questions: Does your site currently buy locally grown produce?
If so, what percentage of your produce is local? Which distributors or farms supply your local purchases? Are you currently enrolled in the Alaska Grown Restaurant Rewards Program? (Y/N)
What are your biggest challenges to buying local? What would make it easier for you to secure local food purchases? Are there any industry requirements or certifications your site must require from producers before purchasing local products?
E.g. Safety certifications, liability insurance, etc. On a scale of 1-10, how much do you value fresh produce and produce durability when making your purchasing decisions? (1= Not at all important and 10= Extremely important)
Would you be more inclined to buy locally grown produce if you knew it was harvested that day?
Do you have any additional considerations when it comes to making local purchasing decisions?
E.g. Knowledge of point of origin, uniformity of vegetables, packaging consistency, etc...
How often and far in advance do you plan your food purchases?
I.e. How much time do you need for purchasing, product delivery, and determining floor space and staff to prepare and stock items?
What is your buying schedule? Do local food purchases affect this? If a local producer is interested in selling to your site, when is the best time for you to be approached?

Demand for Local Produce in the Interior | 2014 Market Study
27 | P a g e
(Page 3 of 5 in Appendix B.)
Do you have the capacity to scale up your local purchases?
In percentages, how much of your produce supply would you like to see being sourced locally in the future? Would you be willing to pay more for locally grown produce? If so, how much?
□ 5-10% □ 10-15% □ 15-20% □ 20-25% □ 25% or more □ N/a
Would any loyalty agreements with existing partnerships affect your capacity to scale up locally grown purchases?
One of the goals of this study is to determine the feasibility of a farmer-owned central business to market local products as one entity. If this entity is created, how would this affect your site’s produce purchasing decisions?
In addition to produce, are you interested in purchasing other locally grown products such as meat, poultry, eggs, flour or honey?
Meat & Poultry:
Beef □ Bison □ Chicken □ Elk □ Lamb □ Pork □ Reindeer □ Turkey □
Eggs □ Flour □ Honey □
Estimated total value of food-related products purchased annually: $
What percentage of that includes fruit or vegetable-related products?
Do you have any questions or additional comments?

(Page 4 of 5 in Appendix B.) Please indicate the unit, price range per unit, and estimated quantity per month for which you would be interested or willing to purchase the vegetables listed below. If you are a food service provider that requests vegetables that are processed, please indicate so in the product form.
Vegetables General Availability Organic Preferred
Unit Current Price Range per Unit
Total Quantity Product Form
(Please mark all months that you might be interested in purchasing)
□ All Organic Preferred
E.g. Case, 50 ct./ Case, 10 bags
Approximate price per unit you currently pay
Approximate total quantity per month (E.g. 20 cases)
E.g. Diced, peeled, shredded, sliced, whole,
etc…
Beans July□ / Aug.□ / Sept.□ □
Beets July□ / Aug.□ / Sept.□ / Oct.□ / Nov.□ □
Broccoli June□ / July□ / Aug.□ / Sept.□ □
Brussels Sprouts Aug.□ / Sept.□ / Oct.□ □
Cabbage July□ / Aug.□ / Sept.□ / Oct.□ / Nov.□ / Dec.□ □ Carrots Jan.□ / Feb.□ / Mar.□ / Apr.□ / Aug.□ / Sept.□
/ Oct.□ Nov.□ / Dec.□ □
Cauliflower Aug.□ / Sept.□ □
Celery Aug.□ / Sept.□ □
Chard June□ / July□ / Aug.□ / Sept.□ □
Cucumbers June□ / July□ / Aug.□ / Sept.□ / Oct.□ □
Garlic July□ / Aug.□ / Sept.□ / Oct.□ □
Greens May□ / June□ / Aug.□ / Sept.□ □
Green Onions June□ / July□ / Aug.□ /Sept.□ □ Herbs Basil□ / Chives□ / Cilantro□ / Dill□ / Mint□ / Oregano□ Parsley□ / Rosemary□ / Sage□ / Savory□ / Thyme□
Jan.□ / Feb.□ / Mar.□ / Apr.□ / May□ / June□ / July□ Aug.□ / Sept.□ / Oct.□ / Nov.□ / Dec.□ (Year-round □)
□
Kale May□ / June□ / July□ / Aug.□ / Sept.□ / Oct.□ □
Kohlrabi July□ / Aug.□ / Sept.□ □
Leeks July□ / Aug.□ / Sept.□ □

(Page 5 of 5 in Appendix B.) Vegetables General Availability Organic
Preferred Unit Current Price Range
per Unit Total Quantity Product Form
Lettuce
Butter□ / Green Leaf□ / Iceberg□ / Red Leaf□ / Romaine□
June□ / July□ / Aug.□ / Sept.□
□
Onions Aug.□ / Sept.□ / Oct.□ / Nov.□ / Dec.□ □
Parsnips Aug.□ / Sept.□ / Oct.□ □ Peas
Garden Peas□ / Snow Peas□ / Sugar Snap□
July□ / Aug.□ / Sept.□ / Oct.□
□
Peppers July□ / Aug.□ / Sept.□ □ Potatoes Fingerling□ / Purple □ / Red□ / Russet□ / Seed Potatoes / White□ / Yellow (Yukon Gold) □
Jan.□ / Feb.□ / Mar.□ / Apr.□ / May□ / June□ / July□ Aug.□ / Sept.□ / Oct.□ / Nov.□ / Dec.□ (Year-round □)
□
Radishes June□ / July□ / Aug.□ / Sept.□ / Oct.□ □
Rhubarb June□ / July□ / Aug.□ □
Shallots July□ / Aug.□ / Sept.□ / Oct.□ □ Summer Squash
Patty Pan□ / Yellow Cookneck□ / Yellow Straight-neck□ / Zucchini□
June□ / July□ / Aug. □ / Sept.□
□
Sweet Corn Aug. □ □
Tomatoes May□ / June□ / July□ / Aug.□ / Sept.□ / Oct.□ □
Turnips/Rutabagas July□ / Aug.□ / Sept.□ □ Winter Squash
Acorn□ / Buttercup□ / Blue Hubbard□ / Butternut□ / Delicata□ / Kabocha□ / Pink Banana□ / Pumpkins□ / Spaghetti□
Aug.□ /Sept.□ / Oct.□
□
Fruit: Strawberries July□ / Aug.□ / Sept.□ □

Appendix C. Buyer Price Averages for Local and Non-Local Produce All prices are averaged and rounded to the nearest tenth.
Type of Vegetable Buyer Price for Locally Grown
Buyer Price for Non-Locally Grown
Price Range 50% of the Buyers are Willing to Pay (Between 10% - 25% more)
10% More 25% More
Beans (round green) $ 2.30 $ 2.30 $ 2.50 - $ 2.90
Canned Green Beans $ - $ 0.80 $ 0.90 - $ 1.00
Beets $ 2.10 $ - $ - - $ -
Broccoli $ 2.30 $ 2.90 $ 3.20 - $ 3.60
Brussels Sprouts $ - $ - $ - - $ -
Cabbage $ 1.10 $ 1.20 $ 1.30 - $ 1.50
Cabbage (Processed - Shredded) - $ 2.40 $ 2.70 - $ 3.00
Carrots (Whole) $ 1.70 $ 1.10 $ 1.20 - $ 1.40
Carrots (Processed) - $ 2.00 $ 2.20 - $ 2.50
Cauliflower $ 2.40 $ 2.70 $ 2.90 - $ 3.30
Celery $ 1.20 $ 1.40 $ 1.50 - $ 1.80
Celery (Processed, sticks) - $ 2.90 $ 3.20 - $ 3.70
Cucumbers $ 2.40 $ 1.30 $ 1.40 - $ 1.60
Garlic $ 1.50 $ 2.60 $ 2.90 - $ 3.30
Green Onions $ 2.40 $ 3.60 $ 3.90 - $ 4.50
Greens - Spinach $ 5.00 $ 3.50 $ 3.90 - $ 4.40
Herbs $ 5.30 $ 11.20 $ 12.30 - $ 14.00
Kale $ 8.40 $ 3.40 $ 3.70 - $ 4.20
Clean, cut, trimmed $ 11.80 $ 5.10 $ 5.60 - $ 6.40
Leeks $ 7.10 $ 0.80 $ 0.90 - $ 1.00
Lettuce $ 7.80 $ 1.90 $ 2.10 - $ 2.40
Green Leaf $ 9.80 $ 2.10 $ 2.30 - $ 2.60
Assorted Mix $ 5.30 $ 2.80 $ 3.10 - $ 3.50
Iceberg $ 2.70 $ 1.90 $ 2.10 - $ 2.40
Iceberg, Chopped or shredded $ - $ 1.60 $ 1.80 - $ 2.00
Romaine $ 1.80 $ 1.80 $ 1.90 - $ 2.20
Onions $ 1.60 $ 1.40 $ 1.60 - $ 1.80
Onions, Pre-cut $ 2.90 $ 3.10 $ 3.40 - $ 3.90
Peas $ 3.10 $ 4.00 $ 4.30 - $ 4.90
Peppers $ 6.00 $ 2.00 $ 2.20 - $ 2.50
Potatoes $ 2.10 $ 1.00 $ 1.20 - $ 1.30
Radishes - $ 1.90 $ 2.00 - $ 2.30
Shallots $ 3.40 $ - $ - - $ -
Summer Squash $ 2.20 $ 2.50 $ 2.80 - $ 3.10
Sweet Corn - $ - $ - - $ -
Tomatoes $ 2.90 $ 1.80 $ 2.00 - $ 2.30
Turnips/Rutabagas $ - $ - $ - - $ -
Winter Squash $ 3.40 $ 1.60 $ 1.70 - $ 2.00
Demand for Local Produce in the Interior | 2014 Market Study
31 | P a g e
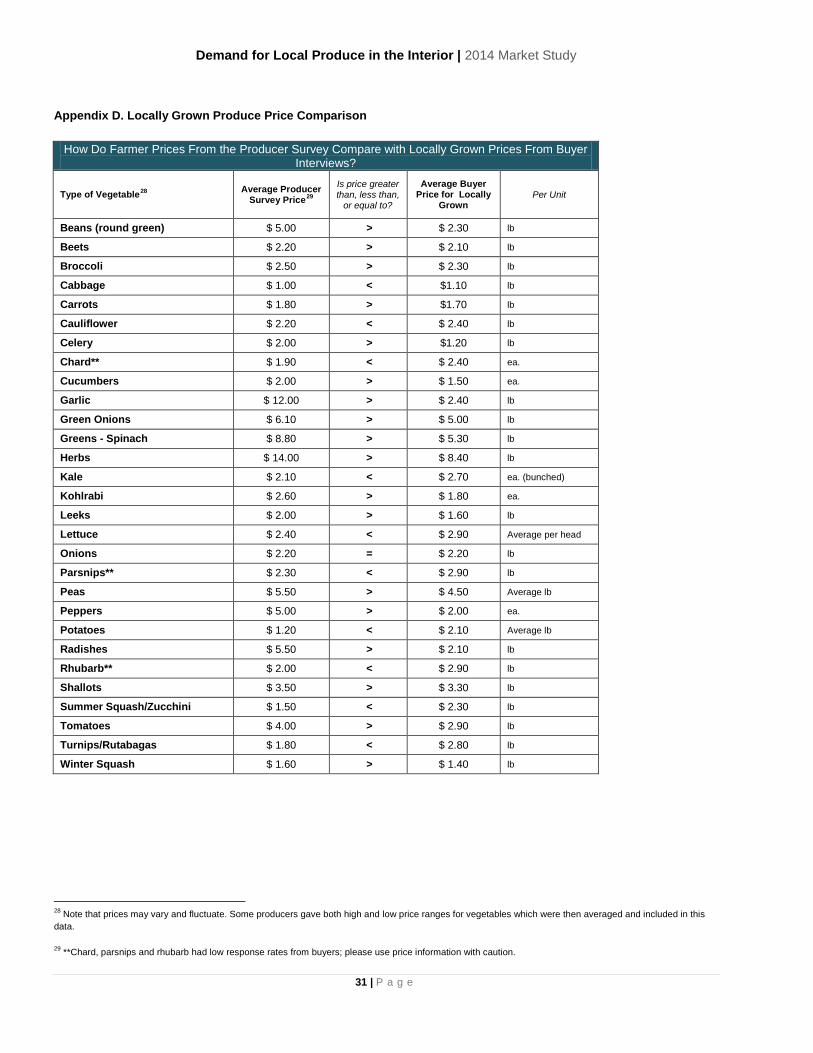
Appendix D. Locally Grown Produce Price Comparison
How Do Farmer Prices From the Producer Survey Compare with Locally Grown Prices From Buyer Interviews?
Type of Vegetable28 Average Producer Survey Price29
Is price greater than, less than,
or equal to?
Average Buyer Price for Locally
Grown Per Unit
Beans (round green) $ 5.00 > $ 2.30 lb
Beets $ 2.20 > $ 2.10 lb
Broccoli $ 2.50 > $ 2.30 lb
Cabbage $ 1.00 < $1.10 lb
Carrots $ 1.80 > $1.70 lb
Cauliflower $ 2.20 < $ 2.40 lb
Celery $ 2.00 > $1.20 lb
Chard** $ 1.90 < $ 2.40 ea.
Cucumbers $ 2.00 > $ 1.50 ea.
Garlic $ 12.00 > $ 2.40 lb
Green Onions $ 6.10 > $ 5.00 lb
Greens - Spinach $ 8.80 > $ 5.30 lb
Herbs $ 14.00 > $ 8.40 lb
Kale $ 2.10 < $ 2.70 ea. (bunched)
Kohlrabi $ 2.60 > $ 1.80 ea.
Leeks $ 2.00 > $ 1.60 lb
Lettuce $ 2.40 < $ 2.90 Average per head
Onions $ 2.20 = $ 2.20 lb
Parsnips** $ 2.30 < $ 2.90 lb
Peas $ 5.50 > $ 4.50 Average lb
Peppers $ 5.00 > $ 2.00 ea.
Potatoes $ 1.20 < $ 2.10 Average lb
Radishes $ 5.50 > $ 2.10 lb
Rhubarb** $ 2.00 < $ 2.90 lb
Shallots $ 3.50 > $ 3.30 lb
Summer Squash/Zucchini $ 1.50 < $ 2.30 lb
Tomatoes $ 4.00 > $ 2.90 lb
Turnips/Rutabagas $ 1.80 < $ 2.80 lb
Winter Squash $ 1.60 > $ 1.40 lb
28 Note that prices may vary and fluctuate. Some producers gave both high and low price ranges for vegetables which were then averaged and included in this data.
29 **Chard, parsnips and rhubarb had low response rates from buyers; please use price information with caution.
Demand for Local Produce in the Interior | 2014 Market Study
32 | P a g e
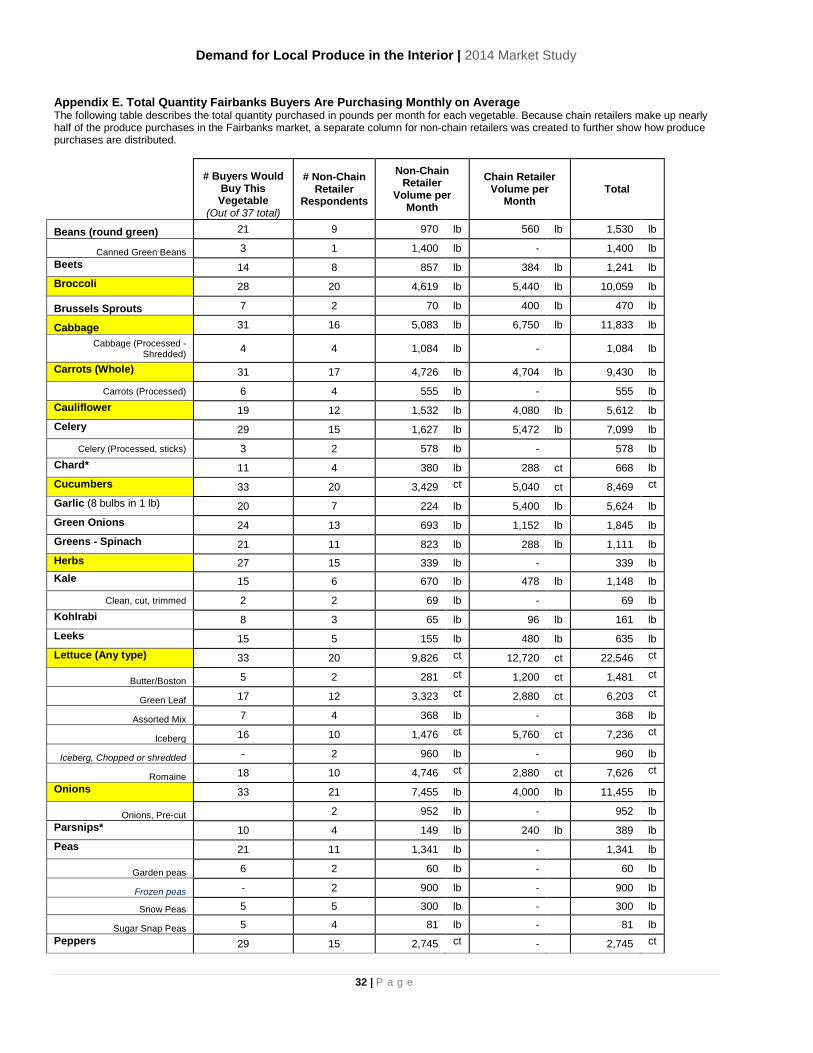
Appendix E. Total Quantity Fairbanks Buyers Are Purchasing Monthly on Average The following table describes the total quantity purchased in pounds per month for each vegetable. Because chain retailers make up nearly half of the produce purchases in the Fairbanks market, a separate column for non-chain retailers was created to further show how produce purchases are distributed.
# Buyers Would Buy This Vegetable
(Out of 37 total)
# Non-Chain Retailer
Respondents
Non-Chain Retailer
Volume per Month
Chain Retailer Volume per
Month Total
Beans (round green) 21 9 970 lb 560 lb 1,530 lb
Canned Green Beans 3 1 1,400 lb - 1,400 lb Beets 14 8 857 lb 384 lb 1,241 lb Broccoli 28 20 4,619 lb 5,440 lb 10,059 lb
Brussels Sprouts 7 2 70 lb 400 lb 470 lb
Cabbage 31 16 5,083 lb 6,750 lb 11,833 lb
Cabbage (Processed - Shredded) 4 4 1,084 lb - 1,084 lb
Carrots (Whole) 31 17 4,726 lb 4,704 lb 9,430 lb
Carrots (Processed) 6 4 555 lb - 555 lb Cauliflower 19 12 1,532 lb 4,080 lb 5,612 lb Celery 29 15 1,627 lb 5,472 lb 7,099 lb
Celery (Processed, sticks) 3 2 578 lb - 578 lb Chard* 11 4 380 lb 288 ct 668 lb Cucumbers 33 20 3,429 ct
5,040 ct 8,469 ct
Garlic (8 bulbs in 1 lb) 20 7 224 lb 5,400 lb 5,624 lb Green Onions 24 13 693 lb 1,152 lb 1,845 lb Greens - Spinach 21 11 823 lb 288 lb 1,111 lb Herbs 27 15 339 lb - 339 lb Kale 15 6 670 lb 478 lb 1,148 lb
Clean, cut, trimmed 2 2 69 lb - 69 lb Kohlrabi 8 3 65 lb 96 lb 161 lb Leeks 15 5 155 lb 480 lb 635 lb Lettuce (Any type) 33 20 9,826 ct
12,720 ct 22,546 ct
Butter/Boston 5 2 281 ct
1,200 ct 1,481 ct
Green Leaf 17 12 3,323 ct
2,880 ct 6,203 ct
Assorted Mix 7 4 368 lb - 368 lb
Iceberg 16 10 1,476 ct
5,760 ct 7,236 ct
Iceberg, Chopped or shredded - 2 960 lb - 960 lb
Romaine 18 10 4,746 ct
2,880 ct 7,626 ct Onions 33 21 7,455 lb 4,000 lb 11,455 lb
Onions, Pre-cut 2 952 lb - 952 lb Parsnips* 10 4 149 lb 240 lb 389 lb Peas 21 11 1,341 lb - 1,341 lb
Garden peas 6 2 60 lb - 60 lb
Frozen peas - 2 900 lb - 900 lb
Snow Peas 5 5 300 lb - 300 lb
Sugar Snap Peas 5 4 81 lb - 81 lb Peppers 29 15 2,745 ct
- 2,745 ct

Demand for Local Produce in the Interior | 2014 Market Study
33 | P a g e
Green 8 14 1,751 ct
- 1,751 ct
Green, Sliced - 1 800 ct
- 800 ct
Multi-pack (Yellow, orange, or red)
7 3 194 ct. - 194 ct
.
Potatoes 30 19 10,468 lb 8,000 lb 18,468 lb Radishes 14 4 150 lb - 150 lb
Rhubarb 11 5 131 lb 160 lb 291 lb
Shallots 13 4 70 lb - 70 lb Summer Squash 27 16 1,226 lb 600 lb 1,826 lb Sweet Corn 10 1 240 lb - 240 lb Tomatoes 33 23 6,166 lb 4,800 10,966 lb
Cherry - 1 1,670 lb - 1,670 lb Turnips/Rutabagas 13 7 420 lb 300 lb 720 lb Winter Squash 21 9 1,099 lb - 1,099 lb Fruit: Strawberries 9 5 435 lb - 435 lb
Total Produce per Month
89,726 lb 75,752 lb 165,478 lb
Total Produce per Year
1,076,714 lb 909,024 lb 1,985,738 lb
Vegetable Conversion Estimations: Cabbage ~1 head local cabbage=3 lb, ~1 head non-local=2 lb
Cauliflower ~1 head=2 lb
Celery ~1 head=1.5 lb
Cucumbers ~1 each=1 lb
Green Onions ~4 bunches=1 lb
Herbs ~1 bunch=2 oz, 8 bunches=16 oz or 1 lb
Kale ~1 bunch=.83 lb
Kohlrabi ~2 medium-large bulbs=1 lb
Peppers, Bell ~1.5 peppers=1 lb
Radishes ~1 bunch=.42 lb
Summer Squash ~2.5 zucchini=1 lb
Tomatoes ~2 tomatoes=1 lb

Demand for Local Produce in the Interior | 2014 Market Study
34 | P a g e
For More Information Contact:
Andrew Crow, Director Alaska Cooperative Development Program
3211 Providence Drive, DPL 202 Anchorage, Alaska 99508
Phone: (907) 786-5447 Fax: (907) 786-5446