demand2side barriers to girls’ secondary … · what are the primary demand-side barriers to...
TRANSCRIPT

DEMAND-SIDE BARRIERS TO GIRLS’ SECONDARY EDUCATION IN MADHYA PRADESH, INDIA
JUNE 2013


DEMAND-SIDE BARRIERS TOGIRLS’ SECONDARY EDUCATION IN
MADHYA PRADESH, INDIA
JUNE 2013


3DEMAND-SIDE BARRIERS TO GIRLS’ SECONDARY EDUCATION IN MADHYA PRADESH, INDIA
Acronyms ..................................................................................................................................................................................................6Acknowledgements ....................................................................... ......................................................................................................7Contributors........................................................................................ ................................................................................................... 8Limitations of the study and areas for further research........ ....................................................................................... 9Executive Summary.................................................................................... .........................................................................................10Guide to reading the report.................................................................... .......................................................................................12
1 BACKGROUND .............................................................................................................................................................................. 12 Purpose of the Study ............................................................................................................................................................ 12 Overview ...................................................................................................................................................................................12 Social and Economic Disparities within Education ................................................................................................. 12 Secondary Education Scenario in India ........................................................................................................................13 Secondary Education Scenario in Madhya Pradesh ...............................................................................................14 Overall literacy rate ...................................................................................................................................................... 15 Enrollment ........................................................................................................................................................................ 15 Dropout and completion ............................................................................................................................................ 15 Cost of education ..........................................................................................................................................................18 Scholarship programs anad other incentives by the Government of Madhya Pradesh (GOMP) that aim to improve secondary education .............................................18
Desk Review ............................................................................................................................................................................ 20 Purpose ............................................................................................................................................................................ 20 Methodology .................................................................................................................................................................. 20 Conclusions from the desk review ...................................................................................................................... 20
Study Objectives .....................................................................................................................................................................21 Study Outcomes ....................................................................................................................................................................22 Research Questions .............................................................................................................................................................22 Barriers ..............................................................................................................................................................................22 Existing incentives and optimal package ...........................................................................................................22 Others ................................................................................................................................................................................23
Scope of the Study ...............................................................................................................................................................23 Research Methods ................................................................................................................................................................ 24 Study responsibility ..................................................................................................................................................... 24 Study design ................................................................................................................................................................... 24 Study setting .................................................................................................................................................................. 25 Selection of study districts .................................................................................................................................................25 Inclusion criteria .......................................................................................................................................................................25 Exclusion criteria ...................................................................................................................................................26
TABLE OF CONTENTS
CONTINUED

4 DEMAND-SIDE BARRIERS TO GIRLS’ SECONDARY EDUCATION IN MADHYA PRADESH, INDIA
Sampling Method ...................................................................................................................................................................26
Quantitative .....................................................................................................................................................................26 Rural sample .......................................................................................................................................................................26 Urban sample ......................................................................................................................................................................26 Household Selection ....................................................................................................................................................26 Existing House List ................................................................................................................................................26 Circular Systematic Random Selection............................................................................................................26 Qualitative.........................................................................................................................................................................27 School selection ....................................................................................................................................................27 Sample .....................................................................................................................................................................27
Tool Development and Pre-Testing .............................................................................................................................. 30 Quantitative tools......................................................................................................................................................... 30 Qualitative tools ............................................................................................................................................................ 30 FDG tools ................................................................................................................................................................ 30 Changes in methodology ..................................................................................................................................... 31
Training of the Field Team for Data Collection .........................................................................................................31 Data Collection ........................................................................................................................................................................31 Pre-study assessment ................................................................................................................................................. 31 Quantitative data-collection-Household Survey ............................................................................................ 31 Qualitative data collection ........................................................................................................................................32 Focus group discussions ......................................................................................................................................32 FGD with parents...................................................................................................................................................32 FGD with girls .........................................................................................................................................................33 FGD with boys ........................................................................................................................................................33 In-depth interviews (IDIs) ....................................................................................................................................33 Secondary data collection .........................................................................................................................................34 Current data entry and processing .......................................................................................................................34
Research Quality Assurance .............................................................................................................................................34 Monitoring quality of data collection ...................................................................................................................34 Data management and analysis ..............................................................................................................................35 Quantitative ............................................................................................................................................................35 Qualitative ...............................................................................................................................................................35 Study monitoring ...........................................................................................................................................................36 Ethical considerations .................................................................................................................................................36
TABLE OF CONTENTS CONTINUED
CONTINUED

5DEMAND-SIDE BARRIERS TO GIRLS’ SECONDARY EDUCATION IN MADHYA PRADESH, INDIA
2 DATA ANALYSIS .........................................................................................................................................................................38 What are the Primary Demand-Side Barriers to Girls’ Secondary Education in Madhya Pradesh? ..............................................................................................................................................................38 The Urban/Rural Analysis ..................................................................................................................................................38 Social Group Analysis ...........................................................................................................................................................39 Factors Leading to Drop Out........................................................................................................................................... 40 Prioritized List of the Main Demand-Side Barriers to Enrollment and Retention....................................41 School far/safety ........................................................................................................................................................... 41 Financial constraint ...................................................................................................................................................... 41 Failed in exam ..................................................................................................................................................................42 Not interested in studies ............................................................................................................................................43
Aspirations ................................................................................................................................................................................44 Optimum Study ......................................................................................................................................................................44 What can We Learn When Comparing the Profiles of In-School and Out-of-School Households? .............................................................................................................................................50 Is the Opportunity Cost of Getting an Education an Important Factor Behind the Dropout Rates? ...............................................................................................................................................50 Are the Barriers to Accessing Current Cash Scholarships? ................................................................................51
3 CONCLUSIONS AND RECOMMENDATIONS….. ........................................................................................................ 53 Conclusions .............................................................................................................................................................................. 53 Primary barriers for dropping out of school .....................................................................................................53 What about the boys? .................................................................................................................................................54 Optimal Incentive/subsidy that would motivate parents to start sending their girls to school ......................................................................................................................... 54 Recommendations ................................................................................................................................................................54 Recommendation #1 – Short term .......................................................................................................................53 Recommendation #2 – Medium term .................................................................................................................55 Recommendation #3 – Long term........................................................................................................................55
ANNEXES Annex 1: Household Survey Tool ..................................................................................................................................... 57 Annex 2: Focus Group Discussion Tool ........................................................................................................................62 Annex 3: In-despth Interview Tool ................................................................................................................................68 Annex 4: Methodology for Calculating Optimum Subsidy ................................................................................. 78
TABLE OF CONTENTS CONTINUED

ACRONYMS
AWW AnganWadi workers
CCT Conditional cash transfer
CERP Center for Education Research and Partnerships
ERU Educational Resource Unit
FGD Focus group discussions
GER Gross Enrollment Rate
GOI Government of India
GoMP Government of Madhya Pradesh
IDI In-depth interviews
IRB Institutional Review Board
MC Municipal Corporation
MHRD Ministry of Human Resource Development
MP Madhya Pradesh
NGO Nongovernmental organization
NSSO National Sample Survey Office
PHSC Protection of Human Subjects Committee
SSA Sarva Shiksha Abhiyan
SC Scheduled Caste
ST Scheduled Tribe
UP Uttar Pradesh
6 DEMAND-SIDE BARRIERS TO GIRLS’ SECONDARY EDUCATION IN MADHYA PRADESH, INDIA

7DEMAND-SIDE BARRIERS TO GIRLS’ SECONDARY EDUCATION IN MADHYA PRADESH, INDIA
ACKNOWLEDGEMENTS
This study has been accomplished with the support from the Department for International Development (DFID), UK, whom we would like to thank for entrusting FHI 360 with the crucial task of generating evidence on girls’ secondary education through this research.
We would like to begin by extending our gratitude to the Department of Education, Government of Madhya Pradesh (GoMP), and the Departments of Scheduled Caste (SC) and Schedule Tribes (ST) for their cooperation and readiness to provide information and data on secondary schooling and government schemes operational in the state of Madhya Pradesh and for providing us an opportunity to discuss the study findings for prioritizing corrective action.
We would like to thank the DFID India team for supporting FHI 360 at every stage of the study and guiding the research team through the process.
This study was undertaken in partnership with local education research agencies namely - Educational Research Unit (ERU), New Delhi and Center for Education Research and Practice (CERP), Rajasthan. FHI 360 would like to express its appreciation for all the members of these agencies who were engaged in the data collection and who contributed to the analysis. Leaders and team members of local NGOs in Madhya Pradesh namely Eklavya, Samavesh, Muskaan, Sampark, Jan Sahas, Parhit, Yuva Samvad and CARD provided deep insights that contributed to enriching the study findings.
The study would not have been possible without the cooperation of the school principals and teachers who willingly participated in discussions that further enriched the findings especially around incentive distribution at the school level. They also helped in mobilizing students for the Focus Group Discussions.
Last but not the least, the study team would like to thank all the study participants including girls and boys who eagerly participated in the discussions and shared their aspirations, hopes and concerns about their education and future. The study team is grateful to their families and the community members who lent their precious time during a busy harvest season and provided valuable information around secondary education of their daughters that meaningfully contributed to the existing evidence base and ongoing researches in the education sector.

8 DEMAND-SIDE BARRIERS TO GIRLS’ SECONDARY EDUCATION IN MADHYA PRADESH, INDIA
CONTRIBUTORS
The study team at FHI 360 would like to acknowledge the following individuals for their contribution to the study:
Government of Madhya Pradesh: Sanjay Singh (I.A.S.), Principal Secretary, Department of Education, GoMP Rashmi Arun Shami (I.A.S.), Secretary, School Education and Commissioner, Rajya Siksha Kendra and Mission Director, Sarva Siksha Abhiyan (SSA)Arun Kochar (I.A.S.), Commissioner, Public Instruction, Department of Education, GoMP
DFID India: Arundhati Roy Choudhury, Social Development Advisor Nupur Barua, Research Advisor, South Asia Research Hub Jaya Singh Verma, Program ManagerSanjay Sharma, State Representative, Madhya Pradesh
Researchers and Research Agencies: Nishi Mehrotra, Senior Researcher, Educational Research Unit (ERU), New Delhi Niti Saxena, Senior Researcher, Educational Research Unit (ERU), New Delhi Ratna Sudarshan, Economist, Educational Research Unit (ERU), New Delhi Nagendra Nagpal, Senior Researcher, Center for Education Research and Practice (CERP), JaipurCERP data collection team - Prabhat and Sucheta (Supervisors) and Manoj, Dharamraj, Bhagchand, Rajaram, Sanjay, OmPrakash, Giriraj and Deepak (Field Assistants)
FHI 360 Study Team: Sharmistha Basu, Senior Technical Specialist (Research), FHI 360/India and Principal Investigator Uzma Anzar, FHI 360/Washington DC, Co-Principal InvestigatorBitra George, Country Director, FHI 360/IndiaSumita Taneja, Director, Programs, FHI 360/IndiaDivya Kumar, Consultant, Research, FHI 360/IndiaRick Homan, Scientist, Health Economics of Service Delivery, Operations Research, FHI 360/North CarolinaAndrea Bertone, Director, Gender Department, FHI 360/Washington DC Jumana Salem, Consultant, FHI 360/Washington DC

9DEMAND-SIDE BARRIERS TO GIRLS’ SECONDARY EDUCATION IN MADHYA PRADESH, INDIA
LIMITATIONS OF THE STUDY AND AREAS FOR FURTHER RESEARCH
While the research study was rigorous and well-planned, we would like to acknowledge some limitations to the study outside of the control of FHI 360.
Sample SizeQualitative data collection was scheduled during the monsoon season. Some minor delays hampered the start-up of the In-Depth Interviews (IDIs); therefore, the total time allotted to data collection was shortened. Due to the short turn around time to complete the qualitative surveys the number of districts in MP was kept at five and the number of households had to be reduced to 750 from 1,200. However, we feel confident that this was a representative sample to speak to the barriers girls face to attend and stay in secondary school among the three populations studied.
School RecordsEnrollment, attendance and retention data may not have been well-collected or kept by the schools. Therefore, the quantitative data collected from the schools regarding enrolment and drop-outs of girls from schools in the study districts may not be fully accurate. For example, two schools did not have data before 2011. Due to time and scope limitations, FHI 360 could not delve deeper into this concern.
Access to ParentsAs the study involved sampling for conducting FGDs with parents of in-school and out-of-school girls, locating and accessing them in the slums (bastis) and villages was an intensive exercise. Due to the harvest season, parents were not able to give time during the day. Even when they scheduled a time, sometimes they would not be present. In one village, for example, the data collection team had to visit three times to finally have the FGD with the selected group of fathers, despite the fact they had scheduled the discussions previously.
Areas for Further ResearchSeveral areas emerged in the course of the study that invite additional inquiry. For example, it is evident that many of the demand side barriers that prevent girls from continuing secondary school are closely linked with supply side barriers such as safe transportation options to school and quality of teaching instruction. Another area that emerged needing closer attention is the barriers to boys’ attendance, retention and completion of secondary school, particularly Muslim boys. Finally, although cash transfers have emerged in India and globally as preferred methods of encouraging school attendance, especially for girls in secondary school, more research is needed to ensure that the cash transfer scheme in MP is actually leading to higher rates of enrollment, attendance and completion.

10 DEMAND-SIDE BARRIERS TO GIRLS’ SECONDARY EDUCATION IN MADHYA PRADESH, INDIA
EXECUTIVE SUMMARY
The initial objective of this study was to determine the most significant demand-side barriers to girls’ secondary school enrollment in Madhya Pradesh (MP), India among three minority populations – Scheduled Cast (SC), Scheduled Tribe (ST), and Muslims. Based on this information, an effort would be made to determine the amount of subsidy needed to incentivize girls’ enrollment in secondary school. The high dropout rate at the secondary level for girls in disadvantaged communities was the main motivator behind commissioning the study. The foundational hypothesis was that an optimal cash transfer program to households would increase girls’ enrollment. FHI 360 developed an inception report that detailed the main research questions of the study as well as the data collection methodology and sampling plan that would yield the necessary information that would address the main objective of the study. The following five categories were identified as the main research items that would need to be explored in the data collection in order to arrive at a clear understanding of the research objective:
•Assess the barriers faced by girls belonging to disadvantaged communities in accessing secondary school.
•Rank these barriers in order of their importance and pervasiveness.
•Calculate the optimum amount of subsidy for girls that will act as the tipping point in determining whether parents decide to send girls or not.
•Assess the key challenges that households from disadvantaged communities face in accessing the existing cash scholarships.
•Make recommendations on how cash scholarship programs could be better designed to respond to the needs of the disadvantaged girls.
The study relied on qualitative data collection from (in-depth interviews and focus group discussions) as well as household surveys in these communities. The qualitative data transcripts were coded and the data were analyzed to identify any emerging themes. The quantitative data collection tools were constructed in alignment with the indicators that were rooted in the study’s main objective questions.
The FHI 360 research team collected the qualitative data, which in turn informed the refinement of the quantitative data collection tools, namely the household surveys (see Annex 1).

11DEMAND-SIDE BARRIERS TO GIRLS’ SECONDARY EDUCATION IN MADHYA PRADESH, INDIA
GUIDE TO READING THE REPORT
Section I contains the background information for this study and displays the foundational documentation on the study’s objectives, methodology, as well as background data on the study’s population, and cash scholarship programs.
Section II displays the findings of the report. The qualitative and quantitative findings are presented under headings that correspond to the main objectives of the study. Under each heading, the relevant qualitative and quantitative data collected during the field work are grouped and analyzed. Following each header in the section, the reader can expect to find a narrative description of the data as well as an analysis of the results and what they mean as well as what implications they might have on current or future studies and programming.
Section III contains the conclusions, or top-level findings, where the reader can find the main results of the study. This section also contains FHI 360’s recommendations.

12 DEMAND-SIDE BARRIERS TO GIRLS’ SECONDARY EDUCATION IN MADHYA PRADESH, INDIA
Background
PURPOSE OF THE STUDY
The overall goal of the study was to assess the demand- and supply-side factors that impede access to secondary education for socially disadvantaged girls from rural and urban areas in MP. In addition, the study aimed to evaluate the appropriate level of incentives that will enhance their access to secondary schools (government schools) and prevent them from dropping out. Finally, the study proposes recommendations for the Government of Madhya Pradesh (GoMP) to address demand- and supply-side barriers for girls’ retention in secondary school.
OVERVIEW
One of the fundamental rights according to the Indian constitution is right to education. Yet, there seem to be substantive educational disparities primarily impacting girls and women. Educating girls and women is critical to stimulating the economy of a country and breaking the vicious cycle of poverty. Therefore, this issue, rather than simply being addressed as a concern arising from gender differences, must be addressed as a financial and development issue and be included to design holistic and well-grounded policies around a country’s economic and social growth and development.
A quick glance at the world’s regional aggregate data reveals impressive gains made by several countries in enrolling more children overall and girls in general into schools in the last two decades. For example, Latin America and the Caribbean now boast of universal primary education and elevated primary completion rates. A majority of the countries in the Middle East and
North Africa have more than 91 percent of children enrolling in and completing primary education. In South Asia as a whole, 80 percent of the children are now completing primary school. Sub-Saharan Africa, with primary completion rates of 60 percent, is behind the other regions; however, it is performing better than in 1991 when primary completion rates were only 51 percent.1
On one hand, there is obvious regional progress representing a promise of educational growth. On the other hand, many poor countries within these regions are still struggling to narrow the gender gap as well as to reduce inequities that render the education scenario somewhat bleak.
SOCIAL AND ECONOMIC DISPARITIES WITHIN EDUCATION
The regional education growth rates mask the inequalities across and within countries. For example, while India and Bangladesh have shown impressive results in providing educational opportunities to many children, the progress in Afghanistan and Pakistan remains dismal. The progress in India and Bangladesh is marred by regional inequalities and uneven achievement results for children belonging to poor and minority groups.
In a study by Deon Filmer on Equity in Education: What is Holding Countries Back?, the author summarizes four major findings from the study of 220 data sets from 88 countries.2
1) Within-country gaps associated with economic status can be truly enormous—as large as, if not larger than, differences across countries.
1
1. Filmer, D. 2008. Equity in Education: What is Holding Countries Back? In Mercy Tembon and Lucia Fort (Ed.) Girls’ Education in the 21st Century: Gender Equality, Empowerment, and Economic Growth (pp. 95). The World Bank, Washington, DC.
2. Ibid.

13DEMAND-SIDE BARRIERS TO GIRLS’ SECONDARY EDUCATION IN MADHYA PRADESH, INDIA
2) The schooling attainment patterns that give rise to these inequalities vary substantially across countries suggesting that country-specific policies will be the key to addressing shortfalls.
3) Inequalities associated with economic status are typically larger than those associated with other commonly cited sources of education gaps—in particular gaps associated with gender and orphan hood.
4) Disability, though affecting only a small share of the population, is associated with very large education deficits.
Filmer’s data also showed that the gap in primary completion rates between the rich and poor in South Asia can be very large, “… in Bangladesh, Nepal, and Pakistan, fewer than 40 percent of children in the poorest quintile complete grade 6, while between 70 and 80 percent of children in the richest quintile do. In India the gap is extremely large: virtually all children from the richest quintile complete grade 6, whereas only about 40 percent of those in the poorest quintile do.”3
The consequences of education and social exclusion are especially stark for girls. The issues related to gender are exacerbated in the context of poverty and general social exclusion of the marginalized. Lockheed succinctly summed this up by stating that “… socially excluded groups are often less likely to send their daughters to school and more likely to allow them to drop out
early, compared with their sons. Such household behavior can arise for both economic and cultural reasons.”4
Although India has emerged as an economic force in Asia,5 the economic benefits have yet to be equalized in all sections of the Indian society, especially in terms of the provision of equal and good quality education for all. Social exclusion is still prevalent in many parts of India. Several studies and papers6 7 8 describe the discrepancies in the delivery of equal and quality education in India.
SECONDARY EDUCATION SCENARIO IN INDIA
The status of secondary education in India is illustrated through the Gross Enrollment Rate (GER) for classes 9 and 10 for the country, which is currently at around 659 (Table 1). The GER10 at different levels of education reveals large dropouts at different stages, for example:
•The GER for classes 1–8 is 104.3; this dips to 65 at the secondary level and 39.3 at the higher secondary level as reported by the Ministry of Human Resource Development (MHRD), Government of India (2010–2011).
•GER for girls at both secondary and higher secondary level is around 5 percentile points lower than for boys; the gap is >6–7 percentile points for disadvantaged populations.11
3. See also Filmer, D. 2001. “Estimating Wealth Effects without Expenditure Data—or Tears: With an Application to Educational Enrollments in States of India”, page 97. Demography 38 (1): 115–132; and Filmer, D. 2006b. “Gender and Wealth Disparities in Schooling: Evidence from 44 Countries.” International Journal of Educational Research 43 (6): 351–369; and Filmer, D, and L. Pritchett. 1999. “The Effect of Household Wealth on Educational Attainment: Evidence from 35 Countries.” Population and Development Review 25 (1): 85–120.
4. Lockheed, M. (2008). “The Double Disadvantage of Gender and Social Exclusion”, In Mercy Tembon and Lucia Fort (Ed.) Girls’ Education in the 21st Century: Gender Equality, Empowerment, and Economic Growth (pp. 116). The World Bank, Washington, D.C.
5. Rothermund, 2008.
6. Juneja, N. 2010. “Access to what? Access, Diversity and Participation in India’s Schools,” Creative Pathways to Access: Research Monograph No. 32; National University of Educational Planning and Administration, India.
7. Ramachandran, V. 2003. “Backward and Forward Linkages that Strengthen Elementary Education,” Economic and Political Weekly: 959–968
8. National University of Educational Planning and Administration, 2009. Access to Elementary Education in Madhya Pradesh and Chhattisgarh. Seminar report.
9. Government of India, Ministry of Human Resource Development, Bureau of Planning, Monitoring & Statistics New Delhi. 2012. Statistics of School Education 2010–2011. (Provisional Report) (As of 30 September 2010).
10. Jhandyala, K. and V. Ramachandran. 2011. Secondary Education for Girls in India.
11. Government of India. 2011. Secondary Education Study.

14 DEMAND-SIDE BARRIERS TO GIRLS’ SECONDARY EDUCATION IN MADHYA PRADESH, INDIA
•As presented in the GOI’s approach paper for the 12th Five Year Plan (2011), the mean years of schooling of the working age population (over 15 years) in India is only 5.12 years in 2010; this was 4.2 years in 2000.
•At the national level, the average number of secondary/higher secondary schools per 100,000 of population is as low as 14 and it is lower than the national average in Bihar (4), Uttar Pradesh (7), West Bengal (10), Jharkhand (4), and Chhattisgarh (12). The national average number of secondary and higher secondary schools per 100 sq. km is only four, and Bihar, UP, Rajasthan, MP, Chhattisgarh, and Jharkhand fall below this national average. Consequently, the secondary level GER in these states is lower than the national average of 65.
The 2009 World Bank Report on Secondary Education in India drew attention to the ways in which inequity plays out at every stage, be it enrollment, attendance, or completion. For instance the attendance rate of the general population is nearly 80 percent higher than the average attendance rates for ST, SC, and Muslims. Dropout rates reveal the gap between different
social groups—SC, ST, and general population—is much higher than the gender gap either between the general categories and the disadvantaged groups or even within the disadvantaged groups themselves. Even among Muslims, migrant populations, nomadic communities and primitive tribes the educational participation rates at secondary level are low.12
SECONDARY EDUCATION SCENARIO IN MADHYA PRADESH
Madhya Pradesh has the largest SC and ST concentration in India. Close to 35 percent of the population in MP is categorized as SC and ST. The tribal community constitutes 20.27 percent and the SC community constitutes 15.17 percent of the total population of MP.13 Highest proportion of tribal population of India (over 14 percent) lives in MP—46 tribes and three Primitive Tribal Groups (PTGs), namely Sahariya, Baiga, and Bhariya. From among the remaining population a large percentage of people belong to the category of Other Backward Classes. The literacy rate among tribal is 41.2 percent as against state’s literacy rate of 64.1 percent.14
CLASS 1-8 (6-13 YEARS)
Scheduled Caste (SC)
Scheduled Tribe (ST) All Communities
ALL 117.1 119.7 104.3
GIRLS 116.9 118.7 103.7
CLASS 9 AND 10 (14-15 YEARS)
ALL 70.9 53.3 65
GIRLS 67.5 49.1 60.8
CLASS 11 AND 12(16-17 YEARS)
ALL 38.3 28.8 39.3
GIRLS 36.1 24.8 36.1
TABLE 1. Gross Enrollment Rate by Community, India (2010-2011)
SOURCE: Statistics of School Education 2010–2011 (as on 30 September 2010); Government of India, Ministry of Human Resource Development, Bureau of Planning, Monitoring & Statistics New Delhi 2012 (Provisional Report).
12. World Bank, (2009), Secondary Education in India: Universalizing Opportunity.
13. Government of India. 2001. Census
14. Ibid.

15DEMAND-SIDE BARRIERS TO GIRLS’ SECONDARY EDUCATION IN MADHYA PRADESH, INDIA
The Muslim population in is only 6.4 percent of the total population. The literacy percent among Muslims (both men and women) was 70.3 and this was achieved only by the active participation of women in the state.15 According to the MP Muslim Education Society (MPMES), Madhya Pradesh has topped the figure with 60.1 percent literacy among the Muslim women which was much better than other states, including Assam, West Bengal, Uttar Pradesh, Bihar, Jammu and Kashmir, Jharkhand, and Rajasthan as per the census of population in 2001.
Overall Literacy Rate According to the 2011 national census, the average female/male ratio in the state is 930 females per 1,000 males compared to the national average of
940.16 Traditional practices combined with poverty tend to put women and girls at a disadvantage in many areas in MP. Though men in Madhya Pradesh fare better than females on literacy levels, Table 2 below shows that boys are also vulnerable when it comes to enrollment and retention at the secondary level.17
Enrollment In the more recent years (2007–2008 to 2010–2011), the total GER at secondary level in Madhya Pradesh (Table 3) has shown a rather gradual increment of 7.39 (from 59.61 to 67). However, for different social groups the trend has been more promising. The GER has increased by 17.75 percent for SC (from 75.95 to 93.7) whereas GER for ST has risen by 13.68 percent (from 34.82 to 48.5).18
YEAR LITERACYINDIA
LITERACYMADHYA PRADESH
Male Female Gap Male Female Gap
1981 56.4 29.8 26.6 38.9 -- --
1991 64.1 36.3 24.8 58.5 29.4 29.2
2001 75.3 53.7 21.6 76.1 50.3 25.8
2011 82.1 65.5 16.680.5 60
20.5R -76.6 U - 90.2 R - 53.2 U - 77.4
TABLE 2. Literacy Rates Men and Women in Madhya Pradesh as Compared with India (1981-2011)
SOURCE: India Census Data 2011.
15. Source: National Confederation of Human Rights Organizations, India
16. http://censusindia.gov.in/2011-prov-results/data_files/india/Final_PPT_2011_chapter5.pdf
17. http://censusindia.gov.in/2011-prov-results/data_files/india/Final_PPT_2011_chapter6.pdf
18. Government of India, Ministry of Human Resource Development, Bureau of Planning, Monitoring & Statistics. Statistics of School Education. 2010–2011 (Provisional), 2009–2010 (Provisional), 2007–2008 (Final). New Delhi
CATEGORY GER 2007-8 GER 2009-10 (P) GER 2010-11 (P)
SC 75.95 89.89 93.7
ST 34.82 45.62 48.5
ALL 59.61 63.72 67
TABLE 3. Comparative GER at Secondary Level for Different Social Categories in Madhya Pradesh State
P = ProvisionalSOURCE: Statistics of School Education 2010–2011 (Provisional), 2009–2010 (Provisional), 2007–2008 (Final); Government of India, Ministry of Human Resource Development, Bureau of Planning, Monitoring & Statistics, New Delhi.

16 DEMAND-SIDE BARRIERS TO GIRLS’ SECONDARY EDUCATION IN MADHYA PRADESH, INDIA
Gender differentials continue to be evident. Table 4 below shows the gap in school participation between boys and girls at secondary level.
One of the reasons for increased enrollment at the secondary level in the state over the last decade could be the Sarva Shiksha Abhiyan (SSA), a Government of India’s flagship program, which has enabled children to complete upper primary education through adding more schools to improve access and by providing quality teaching at elementary levels along with life skills education.19 In addition, as captured by several studies, parents are increasingly becoming aware of the social value of education, especially for the girls.20 This has also boosted the overall
enrollment percentages at the secondary and senior secondary levels.
In the recent years, besides government/state managed schools, private schools have supplemented the increase in enrollment at secondary schools. Figure 1 below compares enrollment ratio of government and private un-aided schools at secondary and senior secondary level. From 2001/02 to 2007/08, enrollment in rural areas in private un-aided secondary schools has escalated from 40.79 percent to 54.72 percent a while at the senior secondary level, the enrollment increased from 41.96 percent to 46.76 percent.
CATEGORY GER 2007-8 GER 2009-10 (P) GER 2010-11 (P)
Boys Girls Boys Girls Boys Girls
SC 89.07 60.01 105.99 70.81 110.3 74.4
ST 43.07 26.03 56.83 33.94 60 36.6
ALL 70.57 47.51 75.94 50.58 80.4 52.8
TABLE 4. GER by Gender and Social Categories in Madhya Pradesh State
P = Provisional SOURCE: Statistics of School Education 2010–2011 (Provisional), 2009–2010 (Provisional), 2007–2008 (Final); Government of India, Ministry of Human Resource Development, Bureau of Planning, Monitoring & Statistics, New Delhi.
FIGURE 3. Management-wise Enrolment in M.P.
0
10
20
30
40
50
60
70
Government Private
SECONDARY
Government Private
SR. SECONDARY
2001-02
2002-03
2003-04
2004-05
2005-06
2006-072007-08
19. http://ssa.nic.in/
20. Narula, M. 2012. NUEPA – Emerging issues at Secondary level: Focus on Private School in MP, Occasional Paper 42.

17DEMAND-SIDE BARRIERS TO GIRLS’ SECONDARY EDUCATION IN MADHYA PRADESH, INDIA
Dropout and Completion Although there has been increase in the enrollment of children at secondary level, dropping out of school at the secondary and senior secondary levels of education remains a problem. As presented in a provisional report (2010–2011) by the MHRD, dropout at the secondary level i.e. from 1 to 10, is 51.1 percent. Out of the total students, more girls (about 59.3 percent) than
boys (44.3 percent) drop out at the secondary level. As reflected in Table 5, the problem is graver for children belonging to SC and ST communities.
Notably children, particularly girls, from marginalized communities continue to drop out despite various scholarships and incentives being provided by the central and state governments.
CLASSES ALL (%) SC (%) ST (%)
Boys Girls Total Boys Girls Total Boys Girls Total
1 to 5 33.5 25 29.5 32.9 24.5 28.9 40.6 33.3 37.1
1 to 8 34 27 30.7 19.5 14.6 17.1 38.6 33.4 36.1
1 to 10 44.3 59.3 51.1 32.1 57.2 43.2 58.7 71.9 64.6
TABLE 5. Gender and Social Group-wise Dropout Rates at Secondary and Senior Secondary Level in Madhya Pradesh (2010–11)
SOURCE: Statistics of School Education 2010-2011 (as of 30 September 2010) Government of India Ministry of Human Resource Development Bureau of Planning, Monitoring & Statistics New Delhi 2012 (Provisional Report).
Reasons for Dropout by Rural and Urban Population
MAJOR REASONS FOR DROPOUT % OF REPORTING (TOTAL)
RURAL URBAN
Unable to cope/failure in studies 25 28 16
Child not interested in studies 17 17 15
Financial constraints 16 13 22
Completed desired level 12 14 8
Participation in other economic activities 7 6 9
TABLE 6.
SOURCE: NSSO 64th Round MP data analysis.
National Sample Survey Office (NSSO) of India 64th Round21 MP data analysis highlights the key reasons for dropout from school for children as per the rural and urban populations, as presented in Table 6, below. Studies feature among the topmost reasons the inability to cope with increasing difficulty levels or failure in studies and the child’s lack of interest. These reasons are also somewhat reflective of the quality of teaching at
school, which is a supply-side issue and warrants in-depth investigation. These were followed by financial constraints (rated highly by the urban population), attainment of the desired level of education, and participation in non-economic activities. The last two do not seem to be having much impact on a household’s decision to continue a girl’s secondary education.
21. Bhog, D., S. Ghosh, D. Mullick. 2011. Secondary Education in the Context of Rashtriya Madhyamik Shiksha Abhiyan (RMSA), a Desk Review. Nirantar Centre for Gender and Education
18 DEMAND-SIDE BARRIERS TO GIRLS’ SECONDARY EDUCATION IN MADHYA PRADESH, INDIA
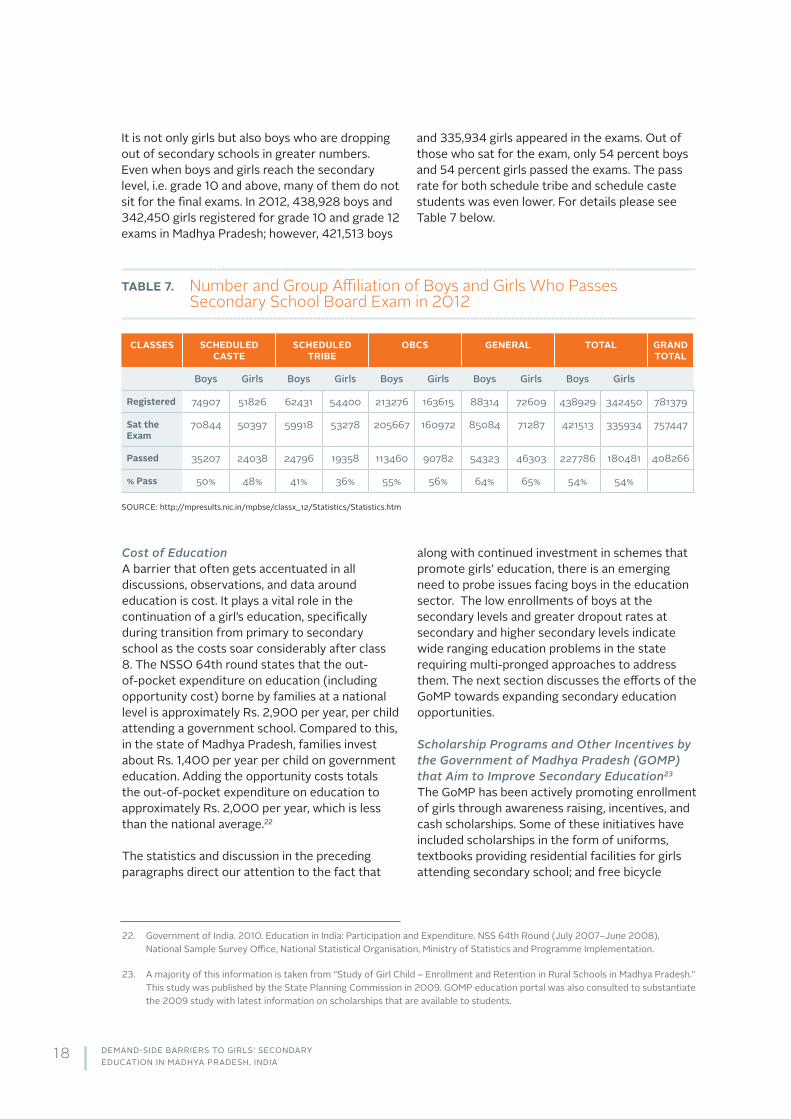
It is not only girls but also boys who are dropping out of secondary schools in greater numbers. Even when boys and girls reach the secondary level, i.e. grade 10 and above, many of them do not sit for the final exams. In 2012, 438,928 boys and 342,450 girls registered for grade 10 and grade 12 exams in Madhya Pradesh; however, 421,513 boys
and 335,934 girls appeared in the exams. Out of those who sat for the exam, only 54 percent boys and 54 percent girls passed the exams. The pass rate for both schedule tribe and schedule caste students was even lower. For details please see Table 7 below.
CLASSES SCHEDULED CASTE
SCHEDULED TRIBE
OBCS GENERAL TOTAL GRAND TOTAL
Boys Girls Boys Girls Boys Girls Boys Girls Boys Girls
Registered 74907 51826 62431 54400 213276 163615 88314 72609 438929 342450 781379
Sat the Exam
70844 50397 59918 53278 205667 160972 85084 71287 421513 335934 757447
Passed 35207 24038 24796 19358 113460 90782 54323 46303 227786 180481 408266
% Pass 50% 48% 41% 36% 55% 56% 64% 65% 54% 54%
TABLE 7. Number and Group Affiliation of Boys and Girls Who Passes Secondary School Board Exam in 2012
SOURCE: http://mpresults.nic.in/mpbse/classx_12/Statistics/Statistics.htm
Cost of EducationA barrier that often gets accentuated in all discussions, observations, and data around education is cost. It plays a vital role in the continuation of a girl’s education, specifically during transition from primary to secondary school as the costs soar considerably after class 8. The NSSO 64th round states that the out-of-pocket expenditure on education (including opportunity cost) borne by families at a national level is approximately Rs. 2,900 per year, per child attending a government school. Compared to this, in the state of Madhya Pradesh, families invest about Rs. 1,400 per year per child on government education. Adding the opportunity costs totals the out-of-pocket expenditure on education to approximately Rs. 2,000 per year, which is less than the national average.22
The statistics and discussion in the preceding paragraphs direct our attention to the fact that
along with continued investment in schemes that promote girls’ education, there is an emerging need to probe issues facing boys in the education sector. The low enrollments of boys at the secondary levels and greater dropout rates at secondary and higher secondary levels indicate wide ranging education problems in the state requiring multi-pronged approaches to address them. The next section discusses the efforts of the GoMP towards expanding secondary education opportunities.
Scholarship Programs and Other Incentives by the Government of Madhya Pradesh (GOMP) that Aim to Improve Secondary Education23 The GoMP has been actively promoting enrollment of girls through awareness raising, incentives, and cash scholarships. Some of these initiatives have included scholarships in the form of uniforms, textbooks providing residential facilities for girls attending secondary school; and free bicycle
22. Government of India. 2010. Education in India: Participation and Expenditure. NSS 64th Round (July 2007–June 2008), National Sample Survey Office, National Statistical Organisation, Ministry of Statistics and Programme Implementation.
23. A majority of this information is taken from “Study of Girl Child – Enrollment and Retention in Rural Schools in Madhya Pradesh.” This study was published by the State Planning Commission in 2009. GOMP education portal was also consulted to substantiate the 2009 study with latest information on scholarships that are available to students.
19DEMAND-SIDE BARRIERS TO GIRLS’ SECONDARY EDUCATION IN MADHYA PRADESH, INDIA
distribution. According to the GoMP education portal,24 during the 2009–2010 school session 21,014 poor girls and 14,728 poor boys studying in classes 6–8 received some sort of scholarship.
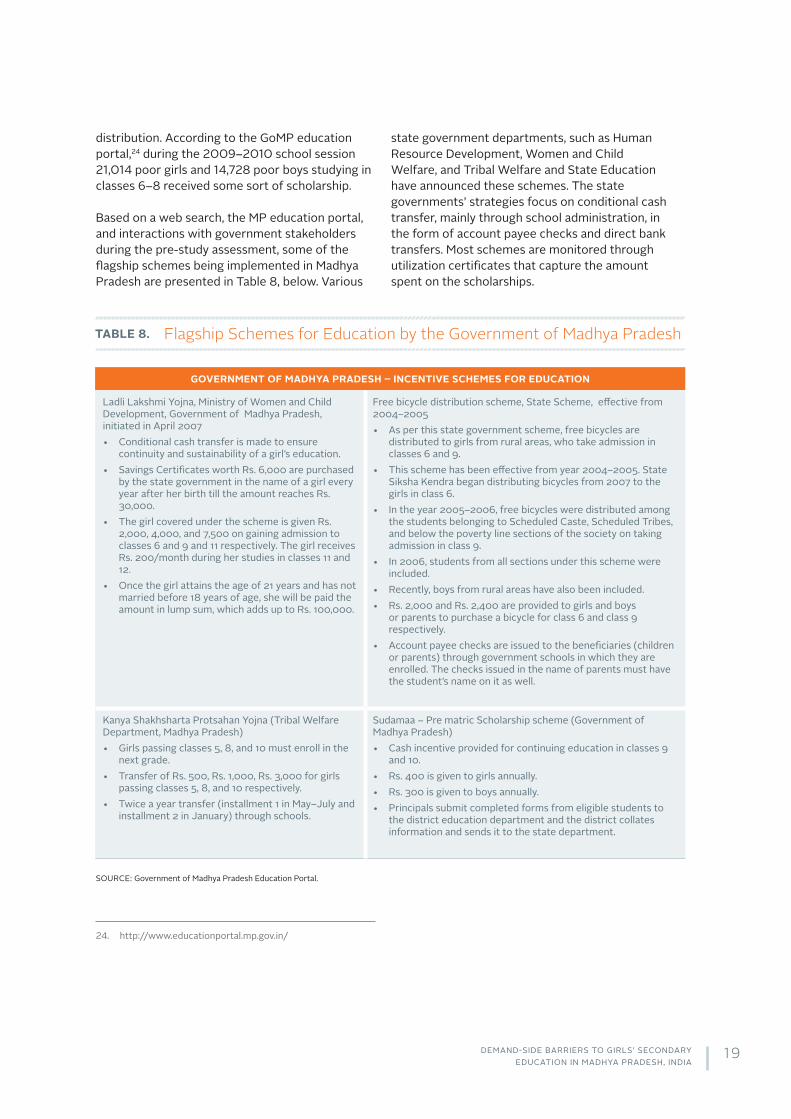
Based on a web search, the MP education portal, and interactions with government stakeholders during the pre-study assessment, some of the flagship schemes being implemented in Madhya Pradesh are presented in Table 8, below. Various
state government departments, such as Human Resource Development, Women and Child Welfare, and Tribal Welfare and State Education have announced these schemes. The state governments’ strategies focus on conditional cash transfer, mainly through school administration, in the form of account payee checks and direct bank transfers. Most schemes are monitored through utilization certificates that capture the amount spent on the scholarships.
GOVERNMENT OF MADHYA PRADESH – INCENTIVE SCHEMES FOR EDUCATION
Ladli Lakshmi Yojna, Ministry of Women and Child Development, Government of Madhya Pradesh, initiated in April 2007• Conditional cash transfer is made to ensure
continuity and sustainability of a girl’s education.• Savings Certificates worth Rs. 6,000 are purchased
by the state government in the name of a girl every year after her birth till the amount reaches Rs. 30,000.
• The girl covered under the scheme is given Rs. 2,000, 4,000, and 7,500 on gaining admission to classes 6 and 9 and 11 respectively. The girl receives Rs. 200/month during her studies in classes 11 and 12.
• Once the girl attains the age of 21 years and has not married before 18 years of age, she will be paid the amount in lump sum, which adds up to Rs. 100,000.
Free bicycle distribution scheme, State Scheme, effective from 2004–2005• As per this state government scheme, free bicycles are
distributed to girls from rural areas, who take admission in classes 6 and 9.
• This scheme has been effective from year 2004–2005. State Siksha Kendra began distributing bicycles from 2007 to the girls in class 6.
• In the year 2005–2006, free bicycles were distributed among the students belonging to Scheduled Caste, Scheduled Tribes, and below the poverty line sections of the society on taking admission in class 9.
• In 2006, students from all sections under this scheme were included.
• Recently, boys from rural areas have also been included.• Rs. 2,000 and Rs. 2,400 are provided to girls and boys
or parents to purchase a bicycle for class 6 and class 9 respectively.
• Account payee checks are issued to the beneficiaries (children or parents) through government schools in which they are enrolled. The checks issued in the name of parents must have the student’s name on it as well.
Kanya Shakhsharta Protsahan Yojna (Tribal Welfare Department, Madhya Pradesh)• Girls passing classes 5, 8, and 10 must enroll in the
next grade.• Transfer of Rs. 500, Rs. 1,000, Rs. 3,000 for girls
passing classes 5, 8, and 10 respectively.• Twice a year transfer (installment 1 in May–July and
installment 2 in January) through schools.
Sudamaa – Pre matric Scholarship scheme (Government of Madhya Pradesh)• Cash incentive provided for continuing education in classes 9
and 10.• Rs. 400 is given to girls annually. • Rs. 300 is given to boys annually.• Principals submit completed forms from eligible students to
the district education department and the district collates information and sends it to the state department.
TABLE 8.
SOURCE: Government of Madhya Pradesh Education Portal.
Flagship Schemes for Education by the Government of Madhya Pradesh
24. http://www.educationportal.mp.gov.in/

20 DEMAND-SIDE BARRIERS TO GIRLS’ SECONDARY EDUCATION IN MADHYA PRADESH, INDIA
DESK REVIEW
PurposeThe purpose of the desk review was to examine and document global and regional evidence of good practices and learning from cash transfer programs aimed at promoting secondary education. With the view to informing primary data collection under the study, the desk review further aimed at studying India and Madhya Pradesh state-specific data on education trends and ongoing incentive schemes (state and centrally sponsored) to promote secondary education specifically targeting SC, ST, and Muslim populations.
MethodologyFHI 360 reviewed a combination of academic and international literature, as well as government reports and research. The state-specific desk review studied the following:
•Literacy data for the state and district, including male-female literacy gaps in rural areas of the districts in the state, district status of enrollment, attendance and retention of girls by urban, rural, and SC, ST, and Muslim population differentials
•SC, ST, and Muslim child population (14–18 years) of all the districts in the state
•Social and economic factors that impact girls’ access to education in Madhya Pradesh
•Existing scholarship schemes and compensation available for girls and boys for secondary schooling in the state, including the pros and cons of such schemes and benefits
Data sources included GoMP education portal, NSSO 64th Round reports, MHRD statistics on school education, and RMSA websites. Using web-based searches and materials from various online libraries, key conditional cash transfer (CCT) programs in the region and the world were identified. Since the World Bank has served as the lead agency on the concept of CCTs in recent years, cross-referencing World Bank documents was greatly utilized. The collection of global and regional evidence focused on innovations, lessons, and best practices on girls’ secondary education from other developing countries, with particular attention to examining experiences from the Asia region and from countries such as
Nepal, Bangladesh, and Pakistan. The desk study approached the global evidence in the context of demand-side incentives for girls to understand the mechanisms of cash deliveries, success stories, lessons learned, and impact.
To study the regional and global scenarios, the design and impact information around scholarship programs from five countries were examined—Female Secondary Scholarship Assistance Program in Bangladesh, Bolsa Escola/Familia Conditional Cash Transfer Program in Brazil, Cambodia’s scholarships program under Japan Fund for Poverty Reduction, Mexico’s Conditional Cash Transfers program, and Baluchistan Urban Fellowship Program in Pakistan.
Conclusions from the Desk ReviewA view of the school enrollments during the last 10 years showed that various schemes implemented by the GoMP have had a positive impact on girls’ access to schools in Madhya Pradesh. The 10 percent increase in women’s literacy between 2001 and 2011 is indicative of these positive changes.
After a comprehensive and thorough review of the various scholarship and cash transfer examples, it became clear that such initiatives have led to increased enrollment of girls (and boys) in schools. These programs are especially effective when implemented with intensive community awareness campaigns (Cambodia, Bangladesh, and Pakistan). Although the programs in Mexico and Brazil covered millions of households as a general support for poverty alleviation with educational access as an important factor, programs in Bangladesh and Pakistan focused more narrowly on enhancing girls’ access to education. More recently, such programs are being implemented in countries in Africa.
The cash transfer programs of Mexico and Brazil were generous and provided a steady stream of income for poor households. They were structured and well-targeted to allow the households to continue to benefit from them rather than take other actions to reduce poverty (such as send children to work rather than school). CCT beneficiaries in Mexico and Brazil also were more likely to visit health services and complete children’s immunizations since access to health services was part of the CCT package.

21DEMAND-SIDE BARRIERS TO GIRLS’ SECONDARY EDUCATION IN MADHYA PRADESH, INDIA
The scholarship programs in Cambodia, Bangladesh, and Pakistan focused exclusively on education and showed good results in terms of school attendance and retention of girls in schools. Although girls in the three countries continued to progress to higher classes under the scholarship programs, whether these programs led to improved learning outcomes for the target children could not be ascertained fully.
In reviewing several cash transfer programs Fiszbien et al.25 wrote, “Findings suggest that to maximize their potential effects on the accumulation of human capital, CCTs should be combined with other programs to improve the quality of the supply of health and education services, and should provide other supporting services.” They also suggest “the need to experiment with conditions that focus on outcomes rather than on the use of services alone.” 26
PROGRESA in Mexico increased the transition from class 6, the last class in primary school, to class 7, the first year of secondary school, by 11.1 percentage points. Because enrollment rates in low-income countries like Cambodia tend to be much lower than those in middle-income countries like Mexico, the scope for improvements, and for potential program impact, may be larger in the poorest countries.
The current Ladli Lakshmi Yojna program of the State of Madhya Pradesh is a step in this direction. It not only provides scholarships to the girls and cash incentives, it also requires that girls born in a family are provided regular health and nutritional services. In addition, families are provided money only when girls pass classes and reach a certain educational level.
There are no hard and fast rules of determining the “most optimal” cash or scholarship amounts for the recipients. With the average GDP of $300 per household, the Cambodia scholarship program
granted $45 per child for education, which is 15 percent of the total household income. In Mexico the Oportunidas program gave close to $52 per girl for secondary education. Female Secondary Scholarship Assistance Program in Bangladesh gave only $30 to secondary school enrollees. Although these amounts may appear adequate, there is a possibility that the recipients wanted more and had to cover the additional costs of education through their own resources.
STUDY OBJECTIVES
The objectives of the study as defined in the terms of reference shared by DFID are as below:
1. To assess the demand-side barriers (individual, household, and community levels) that prevent disadvantaged girls (SC, ST, and Muslims) from accessing secondary school
2. To document the stories of role model girls in the community who have completed secondary education, their motivation and responses from community
3. To calculate the optimum amount of subsidy (financial and non-financial) for girls that act as a tipping point27 at which girls tend not to drop out from secondary schools
4. To study the key challenges that households from disadvantaged communities face in accessing the existing scholarships/stipends
5. To assess the supply-side barriers faced by girls that impede girls’ access to secondary school; and
6. To provide a set of recommendations that would improve poor and Schedule Caste girls’ access to secondary education
25. Fisbien, Ariel and Norbert Schady et al. 2009. Conditional Cash Transfers: Reducing Present and Future Poverty. World Bank.
26. Ibid, 3.
27. The tipping point is the incentive type and amount that would make it easy for parents to send their daughters to secondary school.

22 DEMAND-SIDE BARRIERS TO GIRLS’ SECONDARY EDUCATION IN MADHYA PRADESH, INDIA
STUDY OUTCOMES
The following outcomes were expected by the end of the study:
1. Prioritized listing of demand-side barriers faced by the girls to access secondary schools
• Individual-level factors (age, number of years of schooling, self-efficacy, schooling outcomes for girls)
• Household-level factors (expenditure on girls schooling, education of parents, occupation of parents, aspiration for girls)
• Community-level barriers (gender norms, mobility)
2. Understanding of the behavior of positive deviants’ motivation to defy the norms and their coping mechanism for positive response from community
3. Optimum incentive package/subsidy (financial and non-financial) to retain girls from dropping out
4. Household-level challenges to access existing scholarships
• Household’s awareness level on existing schemes
• Acceptability of the schemes among community
• Challenges in accessing existing scholarships
• Utilization of scholarships
5. Prioritized listing of supply-side barriers to access secondary schooling
• Existing infrastructure• Location of schools• Challenges faced by government staff in
implementing scholarship schemes
RESEARCH QUESTIONS
The key research questions that will be answered to achieve the above outcomes will include:
Barriers
•What are the key demand (and some supply) barriers that prevent girls from attending secondary school?
» Ranking of key barriers as perceived by parents and girls
» Differential exposure and vulnerabilities of different caste and religious groups, i.e., SC, ST, and Muslims
» Differential effects of key barriers upon secondary schooling for girls within different caste and religious groups, i.e., SC, ST, and Muslims
•What motivates fathers and mothers to send their girls to secondary school?
•Who is the decision maker in matters related to secondary schooling for girls?
•What are the gender nuances (from parents, girls and boys perspective) vis-à-vis higher education for girls?
•Are there any success stories or role model case studies of girls’ secondary and higher education?
Existing Incentives and Optimal Package
•What are the direct and opportunity costs incurred by households to send girls to secondary school?
•How informed are disadvantaged populations about the existing government incentive schemes for promoting girls secondary education?
•What are the operational challenges in rolling-out/accessing the existing incentive schemes for girls’ education in the state?

23DEMAND-SIDE BARRIERS TO GIRLS’ SECONDARY EDUCATION IN MADHYA PRADESH, INDIA
•How does the government monitor the roll-out and access to the existing schemes?
•What is the optimum demand-side incentive package (financial and non-financial) that will prevent girls from dropping out of secondary school?
•What should be the periodicity of the incentive or stipend?
•Who should receive the incentive or stipend and what should be the mechanism of transfer of the incentive or stipend?
•What are the existing scholarships/stipends for girls and are girls receiving them?
•How are the subsidies being utilized by the girl(s), family, or household?
Others
•What is the seasonal family income of the households? Does seasonality of income affect girls’ enrollment, attendance, and retention at secondary school level?
•What is the average enrollment, attendance, and retention rate among girls at the secondary school level in Madhya Pradesh?
•What are the child populations of SC, ST, and Muslims between 14 and 18 years in the State of Madhya Pradesh?
•What would be the estimated budgetary outflow of the GoMP if the optimal package of incentives was to be rolled out for the estimated disadvantaged population of girls?
•What are the global or regional evidence, best practices, and learning with respect to incentive-based programs to promote girls secondary education?
SCOPE OF THE STUDY
The study set out to cover the following aspects:
1. What are the key impediments that disadvantaged girls face in participation in secondary school?
» SC, ST, and Muslim populations
» both rural and urban poor (2:1 ratio)
» public schools (government run and government aided)
» identification and ranking of key barriers (primarily from the demand side)
2. What will be the most appropriate amount of financial subsidy/incentive?
» calculate the direct and opportunity cost that households incur to send their girls to schools
» assess the financially lean periods of poor households and correlate the same with school attendance/dropout
» understand the most appropriate periodicity of payment (e.g., small regular payments and/or lump sum payment on completion)
» appropriate scholarship amount for girls
3. What are the key challenges that households face in accessing the existing scholarships/stipends?
» Are girls receiving the existing subsidy?
» Are the scholarship amounts adequate?
» Is it easy for girls to open bank accounts?
» Does the frequency of disbursement of subsidy align with the family needs?
» What are the current monitoring mechanisms to assess effective delivery and how can that be strengthened?
4. What are the possible options and combinations of options for developing a robust incentive program to overcome demand-side barriers for disadvantaged girls?
The study’s scope did not include understanding factors affecting dropout of boys from school and further exploration of the reasons for that percentage of the population (not anticipated to be high) that was unwilling to send their girls to school irrespective of incentives.

24 DEMAND-SIDE BARRIERS TO GIRLS’ SECONDARY EDUCATION IN MADHYA PRADESH, INDIA
RESEARCH METHODS
The following section details the proposed methodology and approach for conducting the study.
Study ResponsibilityThe MP Girl’s Education Study was coordinated by a team of expert researchers and the Program Management Unit at FHI 360/India. They were supported by research and education experts from FHI 360 headquarters in North Carolina and Washington, DC. Data collection and analysis were conducted by Educational Resource Unit (ERU) consultants, with technical assistance from FHI 360.
Study DesignThis was a mixed method study design using both quantitative and qualitative methods and
included secondary and primary data collection. For secondary data collection, state- and district-level secondary data were gathered on the current schemes/incentives for girls education in general and secondary education in particular, statistics on school enrollment, attendance and retention of girls and boys, expenditure on education for girls and boys, and the child population of SC, ST, and Muslims between 14 and 18 years to estimate the budgetary implications of the estimated optimal package to be calculated through this study. This was supported by the desk review conducted by FHI 360 (mentioned in preceding sections). The primary data collection included semi-structured interviews with key informants, cross-sectional quantitative surveys at the household level, in-depth interviews (IDI), and focus group discussions (FGD) with different target subpopulations.
FIGURE 2. Female Literacy in Madhya Pradesh, 2011

25DEMAND-SIDE BARRIERS TO GIRLS’ SECONDARY EDUCATION IN MADHYA PRADESH, INDIA
Study Setting
SELECTION OF STUDY DISTRICTS The study was undertaken in five districts of Madhya Pradesh: Bhopal, Ujjain Datia, Dindori and Jhabua. The five districts (Table 9) were selected from each of the five revenue divisions—Bhopal, Ujjain, Gwalior, Shahdol, Indore—and represented
different socio-economic and historic regions of the state—Central region, North region, Sagar division, Naxal violence-affected region, and West Tribal region. These districts have been selected based on the indicators of objective criteria such as proportion of SC, ST, and Muslim population; female literacy rate; male–female literacy gap; and physical location of the districts.
DIVISION STUDY DISTRICT SELECTION CRITERION 1 SELECTION CRITERION 2
Bhopal Bhopal Highest Muslim population percentage (26%)
“Educationally backward” Muslim communities as per SACHAR committee report
Gwalior Datia Second highest SC population percentage (27%)
High male–female literacy gap (25%)
Shahdol Dindori Second highest ST population percentage (67%)
High male–female literacy gap (24%)
Ujjain Ujjain Highest SC population percentage (30%)
High male–female literacy gap (29%)
Indore Jhabua Highest ST population percentage (98%)
Second lowest female literacy rate (34%)
TABLE 9. Selection Criteria for Study Districts
Study PopulationThe study population comprised mainly two groups—(1) girls and (2) parents. Following eligibility criteria were used for both the groups:
INCLUSION CRITERIA1. Caste – A married couple28 belonging to SC,
ST, Muslim, or general category, depending on the proposed percentage of sample for each caste subgroup were recruited for the household survey and FGDs.
2. A married couple with a separate hearth/chullah with girls aged 13–16 years attending school in classes 8, 9, or 10 was considered for the household survey and FGDs. (This comprised 50 percent of the survey sample).
3. A married couple with a separate hearth/chullah with girls aged 13–16 years who have dropped out of school in classes 8, 9, or 10 in the last three years (2009–2012), and who had their girls staying with them in the village
were recruited for the household survey and FGDs. (This formed other 50 percent of the survey sample).
4. Girls attending school who were in classes 9 or 10 and were aged 13–16 years were recruited for FGDs.
5. Girls out of school, who had dropped out in classes 8, 9, or 10 in the last three years (2009–2012) and were aged 13–16 years were considered for FGDs.
Another subset of the population for this study included:
1. Boys attending school in classes 8, 9, or 10, aged 13–16 years were considered for FGDS.
2. Boys out of school, who had dropped out in classes 8, 9, or 10 in the last three years (2009 – 2012) and were aged 13–16 years, were considered for FGDs.
28. Only mother or father of the girl was interviewed in household. No other family member was included in the interview.

26 DEMAND-SIDE BARRIERS TO GIRLS’ SECONDARY EDUCATION IN MADHYA PRADESH, INDIA
3. Secondary school teachers and principals, half from rural and half from urban areas were recruited for IDIs.
4. Role model girls, either attending secondary school or involved in higher studies despite of various challenges to education, who have continued studying by defying social and cultural norms, and belonging to the SC, ST, or Muslim community were considered for IDIs.
EXCLUSION CRITERIA1. Households with girls in school or dropped out
of school in classes 8, 9, or 10 in the last three years (2009–2012), but are married and not staying with their parents were excluded from the study.
2. Households with girls in school or dropped out of school in classes 8, 9, or 10 before 2009 were excluded from the study.
3. Households that were excluded in the survey were not considered for FGDs.
SAMPLING METHOD
QuantitativeCross-sectional quantitative surveys at the household level were designed by FHI 360. One block per district was selected based on the criteria of maximum percentage of population of a particular caste.
Rural SampleFor the rural sample, villages were selected in the identified blocks with the assistance of block officials, wards (or Panchayats), and revenue officers (or tehsildars). Six villages divided across two sets of three revenue villages per set (one large sized, one medium, and one small based on the population size of the villages) were selected randomly in each district. The second set was kept as a backup in case the desired number of households was not achieved from the first set. Within a village, clusters of desired social groups were identified and the households were selected randomly from within that cluster.
Urban SampleFor the urban sample, the slums (bastis) were selected from within the urban wards or municipalities with assistance from various
sources, such as the Municipal Corporation (MC), nongovernmental organizations (NGOs), and local key informants. From the list of wards obtained from the MC District Magistrate office or town planning office, two wards with the highest slum population (where about two-thirds of the population were living in slums, as notified and defined by the MC) were randomly selected per district. Within the slums, similar procedures for household selection were followed as in the rural areas. Once the two wards were complete, the process was terminated for that particular district irrespective of whether the sample was achieved or not.
Household SelectionThe household selection was done in two steps. An existing house list was collected followed by the process of circular systematic random selection to select a household for the survey.
Existing House ListThe list of households constituting a village was collected from the Sarpanch/Pradhan of the selected villages. This helped to identify the total number of households within a village. In cases where the lists were not available, a household marking was done by two members of the team for all the households in that particular village.
A proportion of 50:50 households belonging to girls satisfying all the inclusion criteria were covered. A rural-to-urban ratio of 2:1 was followed while selecting households.
Circular Systematic Random SelectionUsing the details from the existing house list taken from the Panchayat, and based on the required sample to be covered per village, a selection interval was calculated. For example, if a village had 800 households and 100 households needed to be covered in that village (which had to include 50 in-school and 50 out-of-school), then every eighth household was visited to check whether a girl who fulfilled the inclusion criteria resided there or not. For selecting the household from which the team began the sampling, household groupings (or chits) were prepared with numbers 1 to 8 and depending upon the numbered chit picked up. For example, if the household survey commenced from household number 4, then every eighth house was followed in the sequence—12, 20, 28, 36.

27DEMAND-SIDE BARRIERS TO GIRLS’ SECONDARY EDUCATION IN MADHYA PRADESH, INDIA
If the desired proportion of households was not achieved in the first round of visiting all the randomly selected households, then a second round of sampling was carried out within the same village. The circular random sampling was not repeated after the second round for a particular village and the household survey team moved on to the next village. In case the desired sample (see Table 10) was not achieved from the first set of three villages, the same procedure was followed in the second set of three villages. It was decided to discontinue after the data collection was complete for the two sets of villages irrespective of whether the proposed sample size was achieved or not.
QualitativeIn both the rural and urban areas, the qualitative sample was selected purposively from either the same village or another village within the same block. For the same village, the qualitative team ensured that the FGD respondents did not belong to the same household already included in the household survey, especially for parent groups. The participants for FGDs were selected from the community with the help of local Panchayat functionaries, AnganWadi Workers (AWWs), school teachers, and local key informants. For girls, a list of names for those attending secondary school was taken from the school itself. Information regarding dropout girls was also sought from the school, if available. Once the team had the list, they went into the community (village or basti) and visited each listed household. In situations where the lists were not obtained from the school, the team identified clusters of the target group and selected participants with the help of community members and AWWs.
Focus group discussions were held with target populations involving mothers and fathers of
in-school girls and out-of-school girls as well as with (a) in-school and out-of-school girls and (b) in-school and out-of-school boys who satisfied the inclusion criteria.
School SelectionTo gather information about school enrollment and list of girls in classes 8 and 9 who had dropped out in the last three years (2009–2012), one urban and one rural government secondary school were identified in each district. These schools were in the same catchment area where the household survey was conducted. The schools were selected from the Panchayats where the community was located and a large section of girls was accessing the school. A total of 10 schools were covered in the five districts—five urban and five rural. IDIs were conducted with principals and teachers to gather in-depth information on enrollment and value of education, and their views and suggestions on incentives and girls’ participation in secondary schooling.
SAMPLE For the quantitative data collection, a total sample size of 840 households (750 households plus 10 percent oversampling) was to be visited for the household survey. This sample (Table 10) was further categorized into:
•Four caste groups—SC, ST, and Muslims and other/general population
•Parents of in-school and out-of-school girls divided according to 50:50 proportion
•Rural and urban households divided according to 2:1 ratio

28 DEMAND-SIDE BARRIERS TO GIRLS’ SECONDARY EDUCATION IN MADHYA PRADESH, INDIA
RURAL(LARGE, MEDIUM, SMALL)
URBAN(2/3 SLUMS)
Bhopal 144 (Muslims) + 22 (Others) 78 (Muslims) +12 (others)
Out of school
In school Out of school
In school Out of school
In school Out of school
In school
72 72 11 11 39 39 6 6
Datia 72 (SC) + 22 (Other) 40 (SC) + 12 (others)
Out of school
In school Out of school
In school Out of school
In school Out of school
In school
36 36 11 11 20 20 6 6
Ujjain 72 (SC) + 22 (Other) 40 (SC) + 12 (others)
Out of school
In school Out of school
In school Out of school
In school Out of school
In school
36 36 11 11 20 20 6 6
Dindori 72 (ST) + 22 (Other) 40 (ST) + 12 (others)
Out of school
In school Out of school
In school Out of school
In school Out of school
In school
36 36 11 11 20 20 6 6
Jhabua 72 (ST) + 22 (Other) 40 (ST) + 12 (others)
Out of school
In school Out of school
In school Out of school
In school Out of school
In school
36 36 11 11 20 20 6 6
Total 432 + 110 = 542 238 + 60 = 298
Sum Total
TABLE 10. Proposed Household Survey Sample with 10 Percent Oversampling and Further Categorization
The household sample size numbers incorporated the many sub-groups in the study in a manner that retained the rich and diverse characteristics of each group, without compromising the representativeness of the sample, thereby achieving maximum variability. In retrospect, the sample size could be justified through the margin of error concept. For a sample size of 750, the margin of error came to approximately 3.8 percent, which is an acceptable margin for this kind of research.29 This means that the results could reflect the population average.
For qualitative data collection, it was decided to conduct 24 FGDs (with each group comprising seven to nine participants) to cover the widely classified subgroups within each caste group, 10 IDIs with teachers and/or principal, and 6 IDIs with role models. The FGD sample (Table 12) was further categorized into:
• In-school girls and out-of-school girls (refer to eligibility criteria), addressed separately, with heterogeneous caste composition
29. Bartlett J.E., J.W. Kotrlik, C.C Higgins. 2001. Organizational Research: Determining Appropriate Sample Size. Information Technology, Learning, and Performance Journal. Vol. 19, No. 1, Spring.

29DEMAND-SIDE BARRIERS TO GIRLS’ SECONDARY EDUCATION IN MADHYA PRADESH, INDIA
•Parents of in-school girls and out-of-school girls (refer to eligibility criteria), addressed separately, with homogeneous caste composition—SC, ST, Muslim, and other
•Rural and urban population
• In-school boys and out-of-school boys (refer to eligibility criteria), addressed separately in heterogeneous group composition
FGDS DATIA JHABUA BHOPAL
RURAL In School Out of School
In School Out of School
In School Out of School
Mothers (SC/ST/Muslim) 1 1 1
Fathers (SC/ST/Muslim) 1 1 1
Girls 1 1 1 1
Boys 1
Parents (others) 1
URBAN In School Out of School
In School Out of School
In School Out of School
Mothers (SC/ST/Muslim)* 1 1 1
Fathers (SC/ST/Muslim) 1 1 1
Girls 1 1 1 1
Boys 1
Parents (others) 1
TOTAL 8 6 10
IN SCHOOL OUT OF SCHOOL GRAND TOTAL
Rural Urban Total Rural Urban Total
Parents 6 5 11 1 2 3 14
Girls 2 2 4 2 2 4 8
Boys 1 1 1 1 2
TOTAL 16 8 24
IDIS
Role model Girls (2 each – SC, ST, and Muslim)
Rural Urban Total
4 2 6
TEACHER’S IDI
Teachers (2 in each of 5 districts)
Rural Urban Total
5 5 10
TABLE 11. Proposed Qualitative Sample
(* 3 FGDs with mothers of non-secondary school-going girls in rural/peri-urban areas will be done—1 in each district out of the 6 FGDs with mothers.)

30 DEMAND-SIDE BARRIERS TO GIRLS’ SECONDARY EDUCATION IN MADHYA PRADESH, INDIA
TOOL DEVELOPMENT AND PRE-TESTING
Quantitative Tools The household survey tool was translated into Hindi and pretested on 10 households in a village in Jaipur, Rajasthan, by two supervisors and two field investigators who were part of the data collection team along with a senior researcher. Post survey, the team screened problem questions and refined the tool in terms of language, sequencing, and administration of the ranking and rating matrices. The suggested changes were in:
•Sampling methodology from school line listing to household selection from community
•Sections in the questionnaire that were split for households with girls “dropped-out” and households with girls “in-school” at the secondary level
•Question on Optimal Incentive Package that underwent substantial revision
» Comparison between what is already being provided through government incentives and what is desirable proved to be a problem since families were not able to co-relate the cash incentives to educational expenditures.
» Financial reasons were not found to be drivers for “dropout.” As a result the question on tipping point was proving to be irrelevant (however many other questions were added since preference towards the incentive was a key area of enquiry).
» Attributes of the optimal package were revised (to include coaching, stationary, and schools bags was combined with uniform and shoes).
•The teachers’ FGDs were to be replaced by IDIs because of the difficulty of gathering all teachers together at one time and the possible biased or minimal responses because authority figures, such as the school principal, were present.
Qualitative ToolsThe pre-testing of qualitative tools (particularly with mothers and girls) were held in two rounds—
one in Uttar Pradesh (UP) and the second round was during the pre-assessment visit to Bhopal. This was done by senior consultants. The FGDs for teachers were pretested during a Jaipur visit mentioned above.
In UP, the pre-testing was carried out in Rae Bareli (urban area, with mothers and daughters from the Muslim community) and Barabanki district with mothers from the SC community. The second round of pre-testing of FGD tools with parents and girls was planned in the urban slums of old Bhopal city. Visits to these areas were facilitated and supported by the Samavesh30 team. Besides minor changes in language and sequencing of questions, critical issues emerged during the “pre-pretesting” phase. Based on this, the tools were further modified in the following manner.
FGD Tools
•Separated for parents of in-school and out-of school children
•Revisited the optimal incentive package question since it was not working
•Questions on opportunity cost and tipping point were difficult to assess (however questions on both areas were retained since these were primary areas of inquiry)
It was considered equally important to both the parents of in-school girls to understand the cost of education, aspirations, and supply-side barriers and parents of out-of-school girls separately to assess the demand side barriers, opportunity cost, and the tipping point. Therefore a decision was made to conduct 50 percent (3 out of 6) FGDs with parents of out-of-school girls.
Further, during the pre-testing it was agreed upon to change the methodology for identifying FGD respondents to be able to meet the specific inclusion criteria and purposive selection of groups for FGDs. In addition, six in-depth interviews were to be conducted with the aim of capturing perspectives and nuances around role model girls (two from each community—Muslim, urban, rural).
30. Samavesh is an organization working among the Muslim communities on education issues in Bhopal and is also working for quality improvement in government schools for over a decade and a half.

31DEMAND-SIDE BARRIERS TO GIRLS’ SECONDARY EDUCATION IN MADHYA PRADESH, INDIA
CHANGES IN METHODOLOGY
•FGDs were not to be conducted in those households where the household survey would be conducted.
•Considering the low possibility of locating dropout girls, the parent/girl respondents were identified from the community rather than from school lists.
•FGDs for teachers were to be replaced by the IDI format because of the difficulty in gathering all the teachers in a common place at one time and the possibility of biased/socially desirable responses because authority figures, such as the school principal, were present and because of peer pressure
TRAINING OF THE FIELD TEAM FOR DATA COLLECTION
Orientation of the field team and pretesting of the data collection tools took place simultaneously in a two day workshop in September 2012. The training schedule incorporated the introduction and objectives of the study, ethical principles of research to be followed in administering the tools, the purpose of the household survey, sampling methodology, and data collection procedures with inputs from FHI 360, ERU, and the Center for Education Research and Partnerships (CERP).
The details of the sample numbers of households, schools, and teachers/principals to be covered were discussed during the training. It was suggested that some additional households belonging to the “others” community be covered as well to observe variations, if any.
Following this, the tools were discussed with the team in detail to explain each question and how it needs to be asked from the respondents. The ranking of barriers and rating of expenditure matrices in the tools were thoroughly explained for everybody to grasp their purpose and methodology completely.
DATA COLLECTION
A team of 10 data collectors was appointed to conduct the household survey and collect secondary data from schools. Each district was covered by five of these data collectors. Two senior researchers were responsible for collecting qualitative data through FGDs and IDIs with parents and girls. Below is a detail of the data collection methods by order of administration.
Pre-study Assessment Prior to collecting primary data, a pre-study assessment visit was conducted in Bhopal to capture key stakeholders’ views on barriers to girls’ secondary education among disadvantaged communities as well as information about existing schemes/incentives to promote girls’ education in MP.
The key stakeholders who were met included:
•Senior and mid-level government officials from the education and allied departments, e.g., Tribal Welfare, Social Welfare Minorities Community, and others
•Field-based NGO leaders working on girls’ education
•School teachers and principals drawn from one rural and one urban government school located in peri-urban and rural municipal limits
Quantitative Data Collection – Household Survey A household survey was conducted by the trained data collectors to obtain quantitative data. The data collectors were from a research agency appointed by ERU. A structured interview was conducted with the study participants, mainly parents who were selected as per the eligibility criteria. The structured interview comprised mostly multiple-response questions in addition to a few open-ended questions. The questions were pre-coded to facilitate the generation of output tables. The household surveys aimed at developing deeper understanding of the key issues and challenges that prevent girls from accessing secondary education. Please see the household survey tool attached in Annex 1.

32 DEMAND-SIDE BARRIERS TO GIRLS’ SECONDARY EDUCATION IN MADHYA PRADESH, INDIA
HOUSEHOLDSURVEY SAMPLE
RURAL URBAN GRAND TOTAL
In School Out of School
Total In School Out of School
Total
Scheduled Caste (SC) 72 51 123 41 33 74 197
Scheduled Tribe (ST) 72 28 100 40 32 72 172
Muslims 40 27 67 39 39 78 145
Others 59 65 124 29 32 61 185
Total 243 171 414 149 136 285 699
Total In School 243+149 = 392
Total Out of School 171+136 = 307
TABLE 12. Quantitative Sample Achieved
Qualitative Data CollectionThe qualitative data were complemented the quantitative findings. The aim was to gather deeper insights on some of the supply-side barriers and to get a broad understanding of the barriers faced by the disadvantaged communities (SC, ST, and Muslim) as well as views of the community on the attributes of an ideal incentive package vis-à-vis the existing schemes in the state.
Focus group discussions and in-depth interviews were used to collect qualitative data. Qualitative data collection for the three districts was mostly done after the household survey had been initiated. This helped connect with the participants because of previous orientation of the community to the study and introduction to the key informants through the quantitative data collection team.
FOCUS GROUP DISCUSSIONSA total of 24 FGDs were proposed to be conducted in three of the five study districts. Keeping caste groups and rural/urban coverage in mind, FGDs were performed with select groups of parents (fathers and mothers), in-school and out-of-school girls, and in-school and out-of-school boys. Each FGD included 7–9 participants. To ensure ease in mobilization and access, the FGDs were held at a central or common location in the village or slums, e.g., inside a school premises, the Sarpanch’s/Pradhan’s house, or the house of one of the respondents. Focus groups were convened by a facilitator who was supported by a
note-taker. If granted permission, the focus groups were digitally recorded to allow staff to review discussions after additional data collection and to record representative quotes.
FGD questions were prepared by the research team with assistance from FHI 360 and tailored to each stakeholder group. FGD guidelines, transcription, and translation protocols were developed by FHI 360 and shared with the research agency. These tools are attached as part of Annex 2.
FGD with ParentsFocus groups with parents were conducted separately for mothers and fathers to capture finer nuances in terms of the decision-making processes at the household level vis-à-vis sending daughters to secondary school. The parents’ groups were homogeneous in terms of the different castes. Broadly, the
FGDs with parents focused on
•their views on the importance of education and aspirations for girls and boys
•primary decision maker at the household level
•factors perceived as facilitating as well as barring education for girls at the secondary level
•knowledge about existing schemes and available educational facilities in the vicinity

33DEMAND-SIDE BARRIERS TO GIRLS’ SECONDARY EDUCATION IN MADHYA PRADESH, INDIA
•demand- and supply-side challenges in accessing the existing schemes
•estimated cost of sending boys and girls to school and family income
•perception of the optimal package of incentives and roll-out details
FGD with GirlsFGDs with girls focused on
•their views on the importance of education and aspirations for girls and boys
•factors perceived as facilitating as well as barring education at secondary level
•knowledge about existing schemes and available educational facilities in the vicinity
•demand- and supply-side challenges in accessing the existing schemes
•estimated cost of sending boys and girls to school, family income
•perception of the optimal package of incentives and roll-out details
FGD with Boys The aim behind conducting FGDs with boys was to gain insights around the boys’ perspectives on education. In addition to aspects covered in the girls FGD, the following were the focus areas for boys:
•their views on the importance of educating girls in general and for marriage, child rearing, vocational engagement, and others
•their aspirations in life for themselves and for their sisters
IN-DEPTH INTERVIEWSRole model girls were administered an IDI to document case studies of positive deviance amongst girls who are currently enrolled in school or those who have completed secondary school. Young girls who satisfied the inclusion criteria were engaged for the IDIs in three of the five districts. An in-depth interview guide, drawing from the objectives of the research, was prepared before each field visit and tailored to each stakeholder group. IDIs were held in secluded places with minimal interruption. The interviews were recorded with the permission of the respondents. The IDIs focused on:
•aspirations of girls who are in secondary school or passed out of secondary school
•coping with challenges, including mechanisms and strategies adopted
•facilitating factors, including access to existing government/other schemes
•parents and community perception to higher education for girls
The tools for IDIs are attached as part of Annex 3.
FOCUS GROUP DISCUSSIONS
Qualitative Sample Rural Urban Grand Total
In School Out of School
In School Out of School
Girls 2 2 2 2 8
Parents (SC/ST/Muslims/ others) 5 1 4 1 11
Boys 1 1 2
Total FGDs conducted
TABLE 13. Qualitative Sample Achieved

34 DEMAND-SIDE BARRIERS TO GIRLS’ SECONDARY EDUCATION IN MADHYA PRADESH, INDIA
IN-DEPTH INTERVIEWS
Rural Urban Total
Role model Girls (2 each – SC, ST and Muslims) 4 2 6
TEACHER IN-DEPTH INTERVIEWS
Rural Urban Total
Teachers (2 in each of 5 districts) 5 5 10
Secondary Data CollectionSecondary data sources, like NSSO 64th Round were analyzed to document relevant information on household expenditure on education for girls and boys and reasons for dropouts. Child population data were collected among SC, ST, and Muslims aged 14–18 years from Census 2001 to estimate budgetary implications of the estimated optimal package to be calculated through this study. Secondary data were collected on enrollment, attendance, and retention from the attendance registers obtained from the sampled government secondary schools to develop seasonal retention calendars. Secondary attendance data were also gathered from teachers who had records of all the girls attending classes for an academic session. The aim was to help in development of a school enrollment, attendance, and retention calendar for girls. This was possible only in two or three schools and the team doubted the authenticity of the data presented in the school records. Further, state- and district-level secondary data were gathered on the current incentive schemes for girls’ education in general and secondary education in particular, enrollment and retention statistics, and educational expenditure.
Concurrent Data Entry and Processing The FGDs and IDIs were transcribed and translated into English when they were completed by the research agency to fast-track the qualitative data analysis and to help the research team to track and realize when the saturation point for qualitative data collection was reached. The research team met at the end of each day to discuss themes and reflections emerging from the FGDs and IDIs. The FHI 360 staff was present in the initial couple of debriefing meetings to oversee the quality of the qualitative data collected and to ensure adherence to the protocol. These debriefing meetings further assisted the team in processing data as it was collected, minimizing biases by soliciting
different views, and helping to identify outstanding questions or issues that could be addressed in the next FGD and IDI. The team recorded field notes from these meetings for use in data analyses.
RESEARCH QUALITY ASSURANCE
Monitoring Quality of Data CollectionThe FHI 360 research team assigned for this study worked closely with ERU and monitored the selection and training of interviewers, instrument translation and pre-testing, field movement plans, data collection, and data entry. ERU further contracted experienced researchers from CERP. The qualitative data were collected and analyzed by senior researchers from ERU. Training of the core research team was conducted by FHI 360 staff on the study and data collection procedures, all the tools, sampling methodology, research ethics, and different protocols (debriefing, preparing FGD field notes, transcription and translation of FGDs and IDIs). FHI 360 staff was present to provide support and supervision during the initial household interviews and to ensure that the survey data collectors clearly understood the purpose of each question in the interview and the household survey forms. FHI 360 staff also performed random spot checks and reviewed one or two completed survey instruments to ensure accurate recording of responses.
FHI 360’s sequence of questions considered the motivation of the respondent, linkage of topics, and memory facilitation. There was no scope for the data collectors to suggest answers or ask leading questions. FHI 360 staff ensured that all questions in the survey form were administered to minimize non-responses. This was achieved through providing a space for comments within the survey tool in case the question seemed irrelevant to a particular respondent.

35DEMAND-SIDE BARRIERS TO GIRLS’ SECONDARY EDUCATION IN MADHYA PRADESH, INDIA
Data Management and Analysis
QUANTITATIVEThe quantitative data from the survey instruments was entered in Excel spreadsheets, and this database was transferred to SPSS 18 for analysis. The data entry screens were created and included appropriate range checks and skip patterns. The screens were pretested to make sure that the error checks functioned properly. In addition, to minimize the possibility of data entry errors, a random subset (10 percent) was entered a second time to check for data entry accuracy. If a high number of entry errors were found in the 10 percent subset, or were concentrated among specific data entry staff, additional subsets were entered for a second time and checked to ensure high data quality. The graphs and tables were generated from SPSS 18 software.
The objectives of the study were used to develop indicators. The analysis included:
•percent of households willing to send their girls to secondary school if X condition(s) are met
•background characteristics such as Standard of Living Index, main occupation of the community, average household income range, and percent distribution of caste
•top reasons for discontinuing secondary education
•percent knowing of and percent using GoMP incentives schemes for girls
•percent unwilling to send girls to school irrespective of incentives provided
•percent currently not sending their girls to schools
•percent wanting incentives and percent reporting need for additional incentives for girls’ education
•percent reporting difficulty in accessing existing scholarships
•optimum amount of subsidy (financial and non-financial) for girls that acts as a tipping point at which girls tend not to drop out of secondary schools
•sensitivity value of certain variables that may or may not facilitate the enrollment of a girl in secondary school (such as household work and sibling care taking precedence over other concerns)
•average cost households incur to send their girls to school
•critical elements required for continuation of girls’ education at the secondary level
NSSO 64th Round data were also analyzed using SPSS 18. Interestingly, no data on school safety/distance were found in these reports.
QUALITATIVEThe qualitative data were translated, transcribed and typed in MS Word. Out of the six IDIs, only three were permitted to be digitally recorded. Verbatim responses to each question were translated into English and transcribed by local researchers, using a standardized transcription protocol and translation protocol developed by FHI 360. Daily debriefing meetings were held by the supervisors with qualitative researchers for overseeing any field problems.
Transcripts were reviewed by the local principal investigator (PI) for translation accuracy and quality of interviewing. All transcripts were cleaned of any potentially identifying information. All hard copies of transcripts are stored in locked file cabinets in the FHI 360 office, and digital copies are stored on a password-protected hard drive and external disk. Digital transcripts were password protected and sent to FHI 360 via email once they were proofed locally. All the transcripts were coded, using a code book developed by FHI 360 and the study team, and the data were analyzed inductively to explore emerging themes. The approach to analysis was based in grounded theory, wherein theory generation evolved out of the phenomena that were captured during the coding process.

36 DEMAND-SIDE BARRIERS TO GIRLS’ SECONDARY EDUCATION IN MADHYA PRADESH, INDIA
Qualitative analysis focused on the answers from the respondents.
•perceptions about girls’ education at the secondary level
•perceptions about educational quality in schools (supply side barrier) and its effects on enrollment and retention
•exact financial needs that would facilitate girls’ enrollment in schools
•perceptions about benefits or disadvantages for girls with higher levels of education
•perceptions about the benefits of sending girls to school versus sending boys to school
•perceptions about aspirations for girls versus aspirations for boys
•gender norms around girls’ schooling in the community
•barriers in accessing school by girls
•facilitating factors for girls continuing to attend secondary school
Data triangulation was done from qualitative, quantitative, and NSSO 64th Round to include diverse viewpoints or standpoints that cast light upon the research questions and helped in validating the findings that emerged from this study.
Study MonitoringData collection was monitored by the FHI 360 staff (PI and field monitor) for the study. The study team in India was responsible for ensuring high-quality data collection and utmost adherence to data collection procedures, sampling procedures, and research ethics, such as proper administration of informed consent, according to the protocol approved by the Protection of Human Subjects Committee (PHSC) at FHI 360 and GoMP. Protocol violations (if any) were to be reported back immediately to the technical reviewers of the PHSC and local Institutional Review Board (IRB). Any deviations considered to be a serious protocol violation (e.g., prompting a respondent to provide a particular answer or not obtaining informed consent) were also to be reported to PHSC and the local IRB. Data collected from
participants whose study rights were violated would be excluded from the study. Interviewers who deviated from study procedures would be replaced.
Ethical ConsiderationsThis research involved minimal risk to human subjects. Since the research involved minors, prior to the data collection, trained data collectors obtained informed consent from all the respondent’s parents and ascent from minors. Ethical considerations related to respondents’ identity, views and information, privacy settings, and confidentiality were taken into account. For all other respondents, informed consent was obtained directly and ethical considerations related to respondents’ identity, views and information, privacy settings, and confidentiality were taken into account.
FHI 360’s PHSC and a local IRB reviewed the proposed protocol, informed consent, and ascent process, and addressed ethical and human subjects concerns. All substantial changes to the protocol and all data collection instruments were also submitted to these committees before proceeding with training and data collection. All study staff, including those of the data collection agency that came into contact with respondents, completed FHI 360’s ethics curriculum.
Participation in the research was completely voluntary and information collected was kept strictly confidential. Any identifying information did not appear on any of the principal data collection instruments, with each tool having a unique ID number. Digital voice files used to audio record the IDIs/FGDs did not have names or other identifying information. Analysis was aggregated and presented for all target respondents, eliminating the possibility of identification of any location or individual responses. The FHI 360 research team refrained from using participants’ names or location in this report and will continue to do so in any further publications.
All study tools were secured, with access only by research project staff for data management and analysis. Data collectors were trained to protect the confidentiality of participants, including preventing passing on any data obtained with others in the community or with schools. The data collection agency included confidentiality clauses in their trainings of data collectors.

37DEMAND-SIDE BARRIERS TO GIRLS’ SECONDARY EDUCATION IN MADHYA PRADESH, INDIA
Each data collection instrument had an informed consent form for the data collector to read to the participant. All participants were informed of their right to refuse to participate at any point during the study process without threat or fear of retribution. The participant could provide oral consent or refuse to participate in the study. The data collector signed at the specified place indicating that the respondent gave her or his consent for the interview.
The study did not involve any experimental products or procedures; however, it may have posed an element of social risk. Girls and/or parents may have felt discomfort over not being able to answer questions. There was no direct benefit to those participating in the study; however, the results are expected to benefit communities across India by helping to improve access to secondary education of girls from disadvantaged communities in India.

38 DEMAND-SIDE BARRIERS TO GIRLS’ SECONDARY EDUCATION IN MADHYA PRADESH, INDIA
Data Analysis
WHAT ARE THE PRIMARY DEMAND-SIDE BARRIERS TO GIRLS’ SECONDARY EDUCATION IN MADHYA PRADESH?
Demand-side barriers in this context are defined as the variables that limit girls’ ability and/or willingness to attend school. Identifying and understanding demand-side barriers to girls’ secondary education is important to informing the strategy and program design needed to remove or weaken these barriers. In this study, the demand-side barriers that emerged do tell a complex story and show that several factors are driving dropout rates. These barriers were found to be of relatively equal statistical importance, and programs that focus on mitigating one factor, without addressing the others, will not yield desirable enrollment and retention rates. Although the study set out to determine the demand-side barriers to girls’ enrollment and retention, what emerged from the data collection was a better understanding of the mixture of demand- and supply-side barriers to girls’ secondary education in Madhya Pradesh. The primary demand-side barriers were found to be: school distance and school safety, financial, failing in the class 9
examination, and not being interested in studies. This last barrier is referred to in the report as “quality of education” and would more accurately be considered a supply-side barrier. On the surface, “failing” and/or “not interested in studies” seem to point to a barrier that is created by the girls themselves, i.e., they are failing because they are not good students or because they are not interested or do not care about studying. Most of the children are 1st generation literates with no academic reinforcement from home. However, this barrier is a strong proxy for quality of education, which is mostly a supply-side issue and should be considered when designing any future programming. The discussion that follows delves into each of these three barriers, their magnitude for the different segments and social groups, and their relationship to each other.
THE URBAN/RURAL ANALYSIS
Figure 3 below shows that the issue of financial constraints was selected with the highest frequency when urban households (n=31) were asked to choose among multiple options that
2
FIGURE 3. Reasons for Drop-outs Total, Rural and UrbanStudy data: Multiple response, Base N=328 total dropouts, Rural N=197, Urban N=131
Fina
ncia
lco
nstr
aint
s
Scho
ol fa
r o�/
safe
ty
Faile
d in
exam
inat
ion
Not
inte
rest
edin
stu
dy
0
10
20
30
40
50
60
Pare
nts
not
inte
rest
ed
Dom
istic
chor
es
Wor
k fo
rw
ages
Mar
riage
Econ
omic
activ
ity
Med
ical
Poor
qua
lity
educ
atio
n
Take
car
eof
sib
lings
RURAL
TOTAL
URBAN
PERC
ENTA
GE

39DEMAND-SIDE BARRIERS TO GIRLS’ SECONDARY EDUCATION IN MADHYA PRADESH, INDIA
MAJOR REASONS FOR DROPOUT % OF REPORTING (TOTAL)
RURAL URBAN
Unable to cope/failure in studies 25 28 16
Child not interested in studies 17 17 15
Financial constraints 16 13 22
Completed desired level 12 14 8
Participation in other economic activities 7 6 9
TABLE 14. Reasons for Dropping Out of Secondary SchoolSource: NSSO-64th round MP data analysis
lead girls to drop out of school, while for rural households (n=197) school distance/safety was seen as the major reason for dropping out.
The NSSO data (Table 14) supports the finding for the urban population, and shows that the main reason for dropping out for rural households is related to what the study identifies as the quality of education barrier. It also shows that for rural households financial constraints are secondary to the quality of education indicators. It is important to note that for both urban and rural participation in other economic activities comes in last; this is explored further in the report’s discussion on opportunity cost but it challenges the widespread assumption that dropout rates are strongly driven by the burden placed on girls to generate income for the household.
Taking a closer look at the data reveals a complicated picture of how households decide to continue or end a girl’s education. The variables used in the study “failed in examination” and “not interested in study” are highly correlated to each other. They point to a weakness in the education system rather than an inherent lack of interest in school among the study’s populations. Although they are phrased in a way that may on the surface indicate a purely demand side constraint, the variables are indicating a weakness in the education system since it is failing to provide the necessary support for girls to pass the examination and it is failing to keep girls engaged in learning. When taken together, these two variables come in first place at 70 percent before financial constraints for urban populations, and they come in first before school safety for rural
populations at 53 percent. Therefore, the quality of education is a very strong factor in determining enrollment and retention rates.
Another important finding is that “school distance/safety” is rated as the highest constraint for rural populations, while it comes in fourth for urban populations. This correlates very closely with the qualitative data where the distance that a girl needs to travel to a school poses a significant concern for the rural populations as well as a burden on the family members who need to pay for transportation or send a male relative to accompany the girl to school. The study found that girls in the rural populations travel almost eight times the distance than girls in the urban populations. This variable also captures safety concerns about getting to school. These are the average distances to schools for the different segments surveyed.
The three most important factors for dropout as identified by the household data and supported by the qualitative data are financial constraint, school distance/safety, and the supply-side variables of failed in exams and not interested in studies.
SOCIAL GROUP ANALYSIS
Taking a closer look at the data gives an even clearer picture of how the top three factors are prioritized within each social group. Figure 4 shows that for the SC population school distance/safety is the strongest barrier, followed by financial constraint and the supply-side variables. For the Muslim group the financial barrier is the

40 DEMAND-SIDE BARRIERS TO GIRLS’ SECONDARY EDUCATION IN MADHYA PRADESH, INDIA
FIGURE 4. Reasons for Drop-outs by Social GroupsNSSO-64th round MP data analysis
Fina
ncia
lco
nstr
aint
s
Scho
ol fa
r o�/
safe
ty
Faile
d in
exam
inat
ion
Not
inte
rest
edin
stu
dy
0
10
20
30
40
50
60
Pare
nts
not
inte
rest
ed
Dom
istic
chor
es
Wor
k fo
rw
ages
Mar
riage
Econ
omic
activ
ity
Med
ical
Poor
qua
lity
educ
atio
n
Take
car
eof
sib
lings
ST
SC
MUSLIMS
OTHERS
PERC
ENTA
GE
strongest, and for the ST group fail in exam and not interested in study are the strongest barriers.
The qualitative data, along with other household data collected, helped to explain these findings. The ST group is the most migratory of the social groups studied. As a result, their education gets interrupted more frequently and they are less likely to be able to pass exams or establish an engaged attitude about their studies.
The Muslim group does have the lowest mean income level; therefore, the finding that financial barriers received the highest frequency of responses is expected. The SC populations are the furthest away from the school, much more so than the ST and Muslim populations.
When all populations were asked to choose on a scale the degree to which each of the barriers is critical, the results were that school distance/safety outranks any others, while financial constraint and failing the exam come in close seconds. Therefore, although direct cash incentives to families would address the issue of financial barriers, the above findings demonstrate that school safety and supply side barriers are equally or more significant barriers affecting household decisions to keep girls enrolled in schools.
FACTORS LEADING TO DROP OUT
The data revealed an important point regarding the time at which girls drop out. Although the above discussion highlighted failing examination as a major barrier, in looking at the exact examination it becomes clear that the national exam administered at the end of class 9 causes more than half of enrolled girls to drop out. The qualitative data supported this finding and described that this high-stakes examination determines whether a student proceeds to class 10 or remains in class 9. As a result, more than half of the enrolled girls who fail abandon their studies.
There are other factors that lead to the drop in enrollment in secondary school that do not significantly emerge in the quantitative data but that do emerge strongly in the qualitative data such as early marriage or the onset of puberty, at which point, it was widely reported, a girl’s mobility is restricted.
The class 9 examination appeared in the focus group discussion. 1. “Class 9 curriculum is difficult so students fail
and eventually dropout.” Teacher (Urban)2. “My sister dropped out because she failed in
class 9.” FGD—GOS, U, SC, Datia

41DEMAND-SIDE BARRIERS TO GIRLS’ SECONDARY EDUCATION IN MADHYA PRADESH, INDIA
PRIORITIZED LIST OF THE MAIN DEMAND-SIDE BARRIERS TO ENROLLMENT AND RETENTION
The following subsection looks in more depth at each of the top three critical factors that were revealed by the data as most affecting dropout rates. As can be seen in Figure 5, below, the three were rated very closely to each other in the degree to which they are perceived as critical. Although it is important to study these three factors independently, the relationships between the factors and how in some cases one of the factors can augment the impact of the other factor(s) is also very relevant to understanding the household’s decision-making process and considerations surrounding girls’ education. These relationships are also discussed and underlined below.
School far/SafetyDistance to school was often cited as a proxy for “safety.” As Figure 5 shows, 39 percent of all respondents selected school safety as a very critical reason for dropping out of school, slightly behind financial constraint, which was reported by 39.9 percent. Figure 5 shows that of those reporting that school safety was a major barrier, over half (52 percent) were of the SC group. When asked to rank the degree to which school safety was a critical factor in determining whether a girl remains in or drops out of school, 40 percent of all dropout households reported it as very critical. It was reported as “at least
critical” (critical + very critical) by almost 60 percent. School distance was grouped with safety because the qualitative data clearly pointed to traveling to and from school as a major safety concern for parents; the farther the school, the higher the chances that a girl would be exposed to different threats or risks. Furthermore, school safety captures safety within and around the school. To mitigate these risks, the qualitative data show that families would assign a male relative to accompany the girls to school. This creates an added logistical and financial burden on the family. Therefore, school distance encompasses safety issues as well as financial (directly or in lost time) burdens on families. A conclusion related to this constraint is that it is important to focus on overall safety, including safe travel to and from school.
Financial ConstraintIn this context, financial constraint refers to the tangible fiscal burden (or direct financial cost) incurred by parents when they enroll a girl in school. In the study sample of urban households that do not send girls to school, financial constraint was the leading reason they cited at 43.5 percent. In this same population, the financial constraint was closely followed with failed in exam, which was selected by 42 percent as a major barrier. Nearly 38 percent of rural households chose financial constraint as a major barrier, making it the second most frequently selected barrier in that segment behind school distance/safety. The financial constraint was chosen at the highest rate by urban households,
Fina
ncia
lco
nstr
aint
s
Scho
ol fa
r o�/
safe
ty
Faile
d in
exam
inat
ion
Not
inte
rest
edin
stu
dy
Pare
nts
not
inte
rest
ed
Dom
istic
chor
es
Wor
k fo
rw
ages
Mar
riage
Oth
er e
cono
mic
activ
ity
Med
ical
Disc
rimin
atio
n
Qua
lity
ofed
ucat
ion
Take
car
eof
sib
lings
LESS CRITICAL
NOT CRITICAL
CRITICAL
VERY CRITICAL
FIGURE 5. Ranking of Reasons for Drop-out: TotalStudy data: Base 307

42 DEMAND-SIDE BARRIERS TO GIRLS’ SECONDARY EDUCATION IN MADHYA PRADESH, INDIA
A strong trend in the qualitative data was related to the safety constraint:1. “If the area of the school is not safe, then parents make restrictions.” (FGD, GIS, U, Muslim, Bhopal)2. “We also take them to school and bring them back. One person has to be assigned with this responsibility all
the time.” (FGD, FIS, U, SC, Datia).3. “These grown-up girls come here to study Urdu. They are not afraid to come here. But they are afraid to go far
away.”(MIS, R, Muslim, Bhopal)4. “Now she is 14 years old. It is very troublesome if she goes so far all alone. All our girls stop going to school
because of the distance.” (FGD, M-GIS, R, Muslim, Bhopal)5. “Many people make their daughters leave studies after class 10. They don’t even allow them to go outside.”
(FGD , M-GIS, R, Others, Jhabua)6. “’Eve-teasing’ is common here. Though the school is not far, way to school is through the market…...that’s why
brother doesn’t let us go.” (GOS, U, Mixed, Datia)7. “After a certain age, especially when they grow up, we don’t know where they go on the pretext of school, and
therefore we take them out.” (FGD, F-GIS, R, Muslim, Bhopal)
but it was also found to be a major barrier in households with an average of four children or more and was reported as the most important constraint in the lowest and seasonal income households.
The most dramatic dropout rate happens at the end of class 9 due to failing the national exam. Fifty-one percent of girls leave school following that year. The qualitative data show that coaching (tutoring) a girl to pass the exam poses a significant financial burden to parents; therefore, girls do not get coaching, they go into the exam ill-prepared, and end up failing. As one participant expressed, “When there is no teaching in a [government] school, out-of-school tuition [to pay for coaching] becomes essential.” (FGD—F-GIS, U, SC). Failing the exam amplifies the financial constraint because if a girl fails she loses her cash scholarship. It is important to note that the quality and availability of coaching specific to this exam was not explored in this study.
The qualitative data revealed that another financial burden that causes girls to drop out after class 9 is that tuition costs increase with the upper grades, and so do the costs of other materials such as uniforms and books.
The financial burden is therefore by itself a serious constraint but it is enhanced by other factors that have financial implications: the distance of schools requires additional money for transportation, the quality of education is so poor it necessitates
girls to seek costly coaching in order to pass the exam, and cash scholarships end upon failing the exam. These other factors may be amplifying the magnitude of the financial constraint, which was selected as a critical or very critical barrier to girls’ education by 71.3 percent of the population (Figure 5). The availability of a cash scholarship in its current form addresses some of the direct costs of education (such as tuition, uniforms, stationery, etc.) but it does not address the financial impact caused by the other factors. Any program looking to increase enrollment should account for the direct costs of education as well as the financial cost incurred by families due to other barriers. The data clearly show that adding up the cost of uniform, tuition, and other direct costs will not cover the out-of-pocket expenses on safety measures, coaching, as well as the policy issue of the scholarship ending if a girl fails the class 9 exam.
Failed in Exam Forty-two percent of urban households reported failed in exam as a major reason for dropping out. It trails their most frequent selection (financial constraint) by only 1.5 percent. In the case of rural households that selected school distance and school safety as the major constraint, failed in exam was chosen in third place at a 3.6 percent less frequency than financial constraint. Figure 5 demonstrates the magnitude of the failed-in-exam barrier to both of these segments. This constraint and the financial constraints are the only two that were selected by more than 30 percent of

43DEMAND-SIDE BARRIERS TO GIRLS’ SECONDARY EDUCATION IN MADHYA PRADESH, INDIA
every social group surveyed. Figure 5 shows that 46.7 percent of all ST households selected this as the main constraint, followed by financial burden and lack of interest in studying. As discussed in a previous subsection, the ST population has the highest migration rates, which affects their ability to have a continuous course of study. The failure in exams is perceived as critical or very critical barrier by 44 percent of the population surveyed. There are several reasons why girls in these populations fail this exam at such high rates, most notably: the quality of teaching is weak and many girls reach class 9 without being academically equipped to cope with the demands of secondary school. There are specific features to class 9 that make it a turning point in education: for the first time students have to choose between scientific and literary streams; their curriculum becomes more complex and demanding; and there is a national high stakes exam that students have to take and if they do not pass it they must repeat the class. The “no detention policy,” which requires schools to pass students to the next class regardless of their grades ends at class 9, and for the first time students are faced with having to repeat an academic year or dropping out.
This is the first time they sit for such a high stakes exam and many find themselves ill-prepared. As previously discussed, an important policy factor at play here is that the cash scholarship ends if a girl fails the exam.
Not Interested in Studies While the above factors were rated the highest, “not interested in studies” followed closely and deserves attention in the listing of prioritized barriers to education. The lack of interest in education was rated as a major factor by 28.8 percent of urban households and by 19.2 percent of rural households. This raises questions about the quality of instruction and about the school environment. There is more room for research here on how teachers and schools can be more engaging in order to mitigate this constraint. The qualitative data revealed other supply-side barriers including shortage of staff, absent teachers and teachers uninterested in teaching, overcrowding and unsanitary conditions, and teachers discriminating against certain social groups.
The qualitative data yielded further insight into this barrier:1. “Situation of schools in the village is not good;
Children are passed till class 8 and when they reach in class 9, they are unable to match the level of studies.” (FGD—FGIS, R, Muslim, Bhopal)
2. “The schools are far away (5 kms) so they go for a day and then don’t go. This slowly leads to complete cut-off from the school.” (FGD—M-GIS, R, Bhopal)
3. “Till class 8 they pass but in class 9 there is inter-school exam so they fail and discontinue.” (Teacher, U)
4. “In class 9, the curriculum is difficult so students fail and eventually drop out.” (Teacher, U)
What are the main factors affecting boys’ dropout rates? Although the focus of the study was on girls, some important insights into the factors affecting boys’ dropout rates in these populations were gleaned. The qualitative data showed that the expressed burden on boys to contribute to household income was greater than on girls. It is expected, therefore, that the opportunity cost calculation for boys will be different than for girls. An interesting comparison is that almost half of parents with school-going children said they want to educate boys to the level desired by the boy, whereas only 27 percent of the same sample responded that way about girls. Further studies on the opportunity cost and barriers to boys’ education are needed in order to design a program that is founded in a holistic understanding of the gender dynamics within the household and community. The experience of boys should not be treated in isolation from that of girls because the dynamic between the two often sheds light on important but more hidden barriers that may exist.

44 DEMAND-SIDE BARRIERS TO GIRLS’ SECONDARY EDUCATION IN MADHYA PRADESH, INDIA
ASPIRATIONS
The quantitative data shows that parents with enrolled girls have modest aspirations with 39 percent wanting to educate girls up to grade 12 and 27 percent wanting to educate girls up to the level desired by the girls themselves. This relatively low level of aspiration was found to be true across all social groups.
Generally, the vision for what girls can achieve was limited to their roles as wives and mothers and not as active participants in the household’s income generation. Very few parents reported that they expected girls to earn outside the confines of their immediate community or village. There was very little evidence to show that education was seen by the parents as a conduit for improving a girl’s or a family’s economic prospects. In fact, professional achievement was frowned upon by some respondents and was labeled negatively. Among girls, self-aspiration was also low, but there seemed to be some belief (relative to the parent group) in education leading to more independence, the ability to contribute to family income, and gaining respect in the community. However, very few girls expressed aspirations for wanting to take on teaching or nursing or other similar professionals. Some reported that education would not change their realities with one girl saying, “People believe that girls are very good in studies and that they are achieving higher grades than boys. But because of the social system, when faced with financial problems parents will withdraw the girls from school because they feel that girls will eventually end up only at home and doing domestic chores” (IDI—R, SC).
Generally there was no positive relationship observed and/or expressed between education and future achievement and this may be due to a lack of belief in the quality of education and
thereby its ability to affect change in a girl’s future. Alternatively, it may stem from other factors that were touched upon in the discussion such as discrimination (reported mostly among Muslim and SC social groups) as well as economic and social immobility.
•“They used to ask us to wash the utensils in which they used to make tea” (FGD—GOS, U, Mixed, Datia). (A girl describing experiencing a lack of respect from her teachers)
•“Some girls leave the school because teachers ask them to remove their Burqas or Hijaabs. My friend left school because the principal asked her to wear half sleeves dress instead of full sleeves dress” (FGD—GOS, U, Muslims, Bhopal).
•There were some positive outliers to this pattern with one parent quoted to say
•“We think that if we let her study this way she will learn something. Her life will improve. She will open an Anganwadi centre. She will be able to earn because here the harvesting is also reducing day by day” (FGD—M-GOS, R, ST, Jhabua).
OPTIMUM SUBSIDY
One of the original goals of the study was to find out if there is an incentive package that could be extended to families to motivate them to keep girls in school, and if so, to identify the components of such a package. When asked the general question on preference, 80.5 percent of households reported that they prefer a cash-only scholarship program with only 17.8 percent preferring a mix of cash and in-kind31 scholarship program (Figure 6 shows the majority of households prefer a cash-only scholarship).
31. “In-kind” refers to academic materials such as books, uniforms, etc.

45DEMAND-SIDE BARRIERS TO GIRLS’ SECONDARY EDUCATION IN MADHYA PRADESH, INDIA
FIGURE 6. Preference for scholarship typeStudy data: N=169
80.5
1.8
17.8
CASH AND KIND
KIND
CASH
STUDY DATA: N=169The finding that households prefer cash-only scholarships aligns well with the finding that financial constraint is a major demand-side obstacle preventing households from keeping girls in school. However, this finding is also problematic because a cash scholarship does not address the other two major constraints: school distance and school safety and the education supply-side issues. A cash scholarship does not mitigate these other two constraints, which, as discussed in above sections, outweigh the financial constraint.
A possible explanation as to why respondents prefer a cash scholarship and not, for example, a guaranteed and reliable bus that transports girls to school or school guards, or free coaching, is because cash is fungible and can, therefore, help to ease overall financial constraints facing a household. Another possible explanation is that households consider the other constraints to be outside of their control, factors that they are
unable to affect. Although this study revealed that the lack of safety and quality results in increased dropout rates, further studies should probe the question of whether, and the extent to which, the improvement of safety and quality would result in direct gains in enrollment. Subsidized or free coaching as well as safe transportation options may be solutions to the other constraints and should be proposed to stakeholders in future studies to determine whether these types of in-kind contributions may alter the results to the question on scholarship preference. The methodology for arriving at the optimum subsidy can be found in Annex 4.
The expected cash only subsidy was found to be at Rs. 626/month, where 72 percent of families with out-of-school girls report that they would accept to keep girls in school if they receive that amount per school year (10 months). Figure 7, on next page, shows this.

46 DEMAND-SIDE BARRIERS TO GIRLS’ SECONDARY EDUCATION IN MADHYA PRADESH, INDIA
FIGURE 7. Average Cash Scholarship Expected from Government (Monthly)Study data: N=134
Less thanRs250
Rs251-Rs500 Rs501-Rs750 Rs751-Rs1000 Rs1001 andabove
PERC
ENTA
GE
OF
RESP
ON
DEN
TS
0
10
20
30
40
50
POPULATION OPTIMAL SUBSIDY BY EACH SOCIAL GROUP
SC 554
ST 700
Muslims 670
TABLE 15. Optimal Subsidy by PopulationStudy data: N=134, SC=29, ST=30, Muslims=32
There is some variation among the three different communities as to the optimal subsidy, as shown in Table 15, below. The mean is Rs. 626/month.
Figure 8 shows that when asked to choose the minimum acceptable cash amount, 59 percent of households chose Rs. 550 per month. As the subsidy level increases the percentage of acceptance increases at a steady rate until it reaches Rs. 650/month, at which point there is a large gain in the percentage of households that would accept the subsidy, at 72 percent. After that
point the gains in enrollment become very small relative to the cash amount. Therefore, the Rs. 650/month stands out as the optimum amount, where the highest marginal gain in enrollment is reached.
These same households reported that they would be willing to pay an average of 4 percent (or Rs. 199/month) of their monthly income to cover the critical costs of education not covered by the cash scholarship, shown in Figure 9.

47DEMAND-SIDE BARRIERS TO GIRLS’ SECONDARY EDUCATION IN MADHYA PRADESH, INDIA
FIGURE 8. Optimum Subsidy Calculations
0% 10% 20% 30% 40% 50% 60% 70% 80% 90% 100%0
500
1000
1500
2000
2500
59 percent acceptance at Rs. 550 per month. After that, the next big gain is at Rs. 650 per month taking us to 72 percent acceptance. From then on, the subsequent gains become very costly (steeper slope)
Suggested optimum subsidy Rs. 650/ month for ten months of attending school
FIGURE 9. Monthly Amount that Respondents are Willing to Pay from Own Pocket to Cover Educational ExpenditureStudy data: N=134, SC=29, ST=30, Muslims=32
Less thanRs100
Rs101-200 Rs201-300 Rs301-400 Rs401 and above
PERC
ENTA
GE
0
10
20
30
40
50
60

48 DEMAND-SIDE BARRIERS TO GIRLS’ SECONDARY EDUCATION IN MADHYA PRADESH, INDIA
Table 16 shows the average amount per month that families are willing to pay by different social group. The mean is Rs. 199/month.
Figure 10 shows which materials dropout households believe are critical or very critical to have in order to send girls to school. These data provide insight into the types of materials that may be included in an in-kind scholarship program. The out of pocket cost of sending girls to school (taking the data from households with enrolled girls) is 8 percent of monthly income, which is the sum of the four most reported critical and very critical items (stationery, uniform, transportation, and tuition or exam fee). The data show that most households with dropout
girls are willing or able to pay 4 percent (Rs. 199/month approximately) of their monthly income on education costs. The optimum subsidy of Rs. 650/month comes to about 13 percent of the monthly incomes and would cover the estimated monthly cost calculated from the actual costs incurred by school going HHs on the critical elements, that is, approximately Rs. 240/month. In such a scenario, some amount of cash will be available to cover other important expenses (on a case to case basis).
The data show that the average amount of scholarships disbursed for an academic year is Rs. 561 for girls whereas the calculated optimum subsidy is at R. 650 monthly.
Most households (55 percent) reported that if they were provided a scholarship they would send their girls to school, however the remaining 45 percent reported that they will not enroll their daughters even if they were provided with a cash scholarship. This indicates that the two other reported barriers besides the financial barrier are playing a major role in a household’s decision. In fact, the data strongly support this claim. Figure 11 shows that of those households the top three reasons for not enrolling girls in school are failed in exam, school distance/safety, and not interested in studies.
POPULATION SUBSIDY FAMILIES ARE WILLING TO PAY (RS.)
SC 214
ST 218
Muslims 164
TABLE 16. Subsidy Families are Willing to PayStudy data: N=134, SC=29, ST=30, Muslims=32
FIGURE 10. Critical Items for Those Who are Willing to Send girls to School if Provided ScholarshipDropout HH sample; Study data: N=168
LESS CRITICAL
NOT CRITICAL
CRITICAL
VERY CRITICAL
0
20
40
60
80
100
Coaching Dev feeTransportExam feeTuitionUniformStationery

49DEMAND-SIDE BARRIERS TO GIRLS’ SECONDARY EDUCATION IN MADHYA PRADESH, INDIA
FIGURE 11. Reasons for dropout for the 45% sample unwilling to send their girls to school even if provided scholarshipStudy data: Multiple Response, N=138
Fina
ncia
lco
nstr
aint
s
Scho
ol fa
r o�/
safe
ty
Faile
d in
exam
inat
ion
Not
inte
rest
edin
studies
Pare
nts
not
inte
rest
ed
Dom
istic
chor
es
Wor
k fo
rw
ages
Mar
riage
Oth
er e
cono
mic
activ
ity
Med
ical
Poor
qua
lity
of e
duca
tion
Take
car
eof
sib
lings
0
5
10
15
20
25
PERC
ENTA
GE
For this 45 percent segment these constraints outweigh any financial incentive. In terms of the social groups, the rural/urban profile, the occupation, and the monthly household incomes of this 45 percent segment are not very different at all from the school-going households. This indicates that these two constraints, while emphasized to different degrees by different population segments, are widespread throughout the populations. This also leads to the important finding that mitigating the financial incentive alone will not remove these other constraints and, therefore, programs must take into account the importance of these other barriers.
Although the current average cash scholarship is lower than the optimum subsidy, it is unclear whether adjusting it will impact households with no girls enrolled. It would be important, however, if adjusting the cash scholarship would impact retention. Meaning, enrolled households may at some point be unable to cope with the financial burden if the subsidy is not adjusted and in turn ends a girl’s education.
In July 2012, a new GoI scholarship scheme rolled out whereby all girls are given Rs. 2250 per year. However, this scholarship had not yet rolled out in MP at the time the data was collected for this study. This additional amount, combined with the Rs. 561 per year being provided by GoMP will be sufficient to cover the cost of the four most critical out of pocket expenses for secondary education i.e. stationery, uniform, tuition and examination fees (the total expenses for which is estimated at Rs. 2,529 per year based on actual expenses reported on the four most critical items of expenditure namely stationery, uniform, tuition fee and examination fee). Parents of out of school girls said that if given a scholarship of Rs. 650 per month they would send their children to school. Parents also said that they would be willing to spend Rs. 199 per month out of pocket, which is enough to cover the out of pocket expenses on the critical items of expenditure linked to education. Therefore it is clear that reasons for drop out are not purely financial, and to ensure enrolment and retention, the optimal cash subsidy needs to be attractive enough to counter the other underlying barriers linked to safety.

50 DEMAND-SIDE BARRIERS TO GIRLS’ SECONDARY EDUCATION IN MADHYA PRADESH, INDIA
WHAT CAN WE LEARN WHEN COMPARING THE PROFILES OF IN-SCHOOL AND OUT-OF-SCHOOL HOUSEHOLDS?
In comparing the statistical profiles of households with dropouts to households with enrolled girls, the study found that there are no obvious differences between them. Therefore, the answer as to why some households send girls to school while others don’t is not simply a function of household income, social group, or location. It is a more nuanced answer that is driven by the list of prioritized barriers and their combined impact (actual and perceived) on a given household. However, one important finding emerges that may have some implication on program design: households with enrolled girls cite quality of education as the third most critical factor in determining whether a girl is able to stay in school. Figure 12, below, demonstrates these findings.
Education quality, a supply-side factor, was already found to be a leading contributor to increasing
dropout rates but it appears to also have a strong connection in determining whether households decide to keep girls in school, hence affecting retention rates.
IS THE OPPORTUNITY COST OF GETTING AN EDUCATION AN IMPORTANT FACTOR BEHIND THE DROPOUT RATES?
To study opportunity costs, the income or economic productivity that is forgone because a girl is enrolled in school was calculated using several variables. Income generating labor or activities were used to calculate the opportunity cost but it was found that only 10 percent of dropout girls engage in income generating work, and that 83 percent of dropout girls perform unpaid household work. Table 17 shows the breakdown of labor categories for dropout girls.
FIGURE 12. Ranking of items for enabling girls to continue/complete secondary education School going HH; Study data: N=392
LESS CRITICAL
CRITICAL
VERY CRITICAL
0
20
40
60
80
100
Coac
hing fe
e
Disc
rimin
atio
n
Tran
spor
t
Exam
fee
Tuiti
on fe
e
Uni
form
Stat
ione
ry
Qua
lity
of te
achi
ng
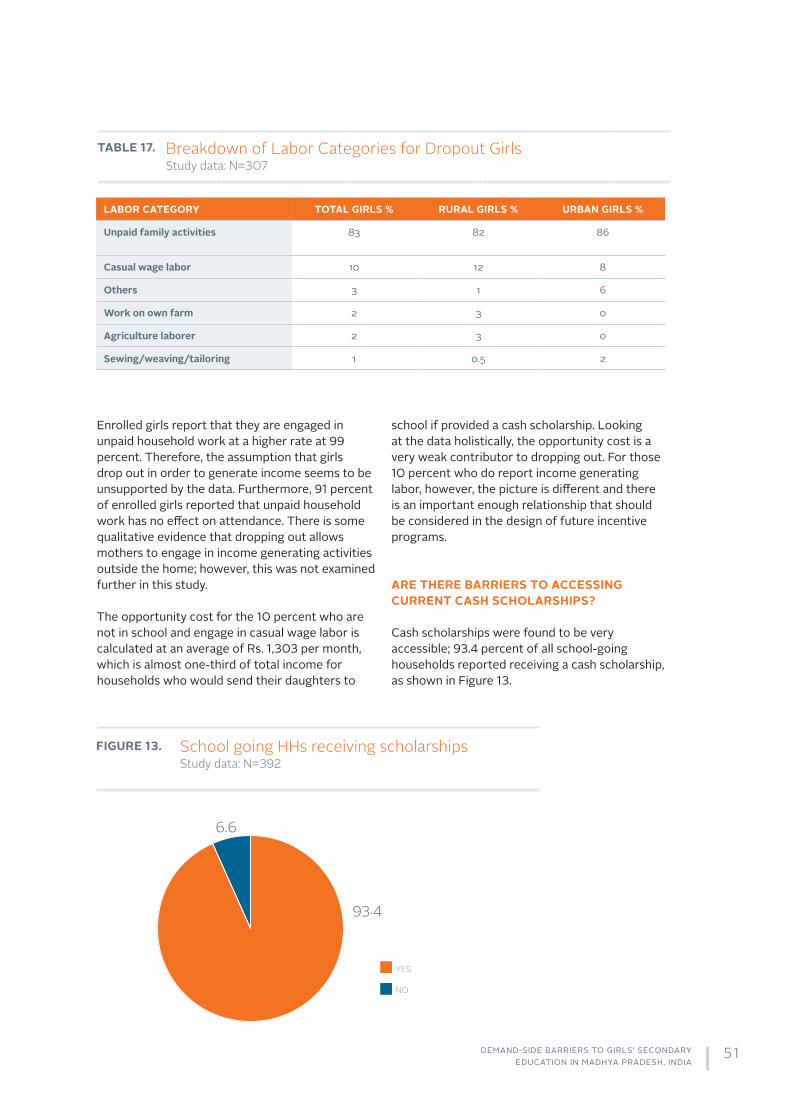
51DEMAND-SIDE BARRIERS TO GIRLS’ SECONDARY EDUCATION IN MADHYA PRADESH, INDIA
LABOR CATEGORY TOTAL GIRLS % RURAL GIRLS % URBAN GIRLS %
Unpaid family activities 83 82 86
Casual wage labor 10 12 8
Others 3 1 6
Work on own farm 2 3 0
Agriculture laborer 2 3 0
Sewing/weaving/tailoring 1 0.5 2
TABLE 17. Breakdown of Labor Categories for Dropout GirlsStudy data: N=307
Enrolled girls report that they are engaged in unpaid household work at a higher rate at 99 percent. Therefore, the assumption that girls drop out in order to generate income seems to be unsupported by the data. Furthermore, 91 percent of enrolled girls reported that unpaid household work has no effect on attendance. There is some qualitative evidence that dropping out allows mothers to engage in income generating activities outside the home; however, this was not examined further in this study.
The opportunity cost for the 10 percent who are not in school and engage in casual wage labor is calculated at an average of Rs. 1,303 per month, which is almost one-third of total income for households who would send their daughters to
school if provided a cash scholarship. Looking at the data holistically, the opportunity cost is a very weak contributor to dropping out. For those 10 percent who do report income generating labor, however, the picture is different and there is an important enough relationship that should be considered in the design of future incentive programs.
ARE THERE BARRIERS TO ACCESSING CURRENT CASH SCHOLARSHIPS?
Cash scholarships were found to be very accessible; 93.4 percent of all school-going households reported receiving a cash scholarship, as shown in Figure 13.
FIGURE 13. School going HHs receiving scholarshipsStudy data: N=392
93.4
6.6
NO
YES

52 DEMAND-SIDE BARRIERS TO GIRLS’ SECONDARY EDUCATION IN MADHYA PRADESH, INDIA
The most frequently cited barriers to access in the focus groups include:
•Keeping a bank account active for the scholarship to be deposited can be costly and burdensome.
•The documents and certificates needed to receive a scholarship can be hard to secure.
•The timing of the disbursement does not always align to the academic year or when the time for buying books and uniform begins.
• Information on the administrative requirements of the scholarship is difficult to obtain.
There are no quantitative data on whether easing access to the cash scholarships will increase enrollment rates, but qualitative data do suggest that the hurdles of accessing scholarships do exist. These are some of the relevant quotes. 1. “We particularly spend the money on uniform shoes, socks for our children but don’t know for what that money
is.” (FGD—M-GIS, U, SC, Datia)2. “Complete information should be provided about scholarship. In between, camps should also be set for
providing knowledge.” (FGD—F-GIS, R, Muslim, Bhopal)3. “Child’s name is in ration card but bank officers demand a driver’s license or voter ID card. Generating
documents is troublesome and expensive. We get Rs. 600 but have to spend Rs. 1,000 to open an account.” (FGD—F-GIS, R, SC, Datia)
4. “There are many formalities for this scholarship, we have to submit various documents, and it takes money and time. Usually we have to spend Rs. 400–500 for getting these and we also have to bear loss of our daily wages as the formalities cannot be completed in a day or two. We have to go repeatedly.” (FGD—F-GIS, U, ST, Jahbua)
5. “It costs too much. They charge Rs. 50 for the registration of name only. If you have source there, you can save money otherwise you have to pay and go again and again.” (FGD—M-GIS, U, SC, Datia)

53DEMAND-SIDE BARRIERS TO GIRLS’ SECONDARY EDUCATION IN MADHYA PRADESH, INDIA
Conclusions and Recommendations
CONCLUSIONS
Primary Barriers for Dropping Out of School 1. There are three main barriers that lead girls to
drop out, and these barriers were rated very closely to each other in the degree to which they are perceived as critical factors.
a. Concern over school distance/safety was cited as the most critical barrier for rural households and fourth most criticalbarrier for urban households. The inter-quartile range of distance from secondary schools was found to be 4.5 kilometres (within the range as per the national guidelines of 5 kilometres). With 86 percent of girls travelling to school by foot, parents cited distance from school as proxy for “safety issues.” However, deep rooted gender norms around “restricting girls mobility” and “protecting her chastity” once girls hit puberty were very important considerations for households when deciding on whether to send girls to school.
b. Financial constraint was a leading barrier for urban households surveyed, and is the second most prominent barrier behind safety concerns for rural households. The difference could be due to the higher cost of living in urban areas as compared to rural areas. The financial constraints are seen as critical or very critical by 70 percent of the overall population.
c. Failing the class 9 exam received almost as many votes for being a major constraint as financial constraints for urban households, and while it was selected less frequently by rural households, it was still emphasized as the third major reason. The dropout rate is highest after class 9, which is the time that the examination is administered.
2. Among in-school households, quality of education is rated as the third most critical factor determining whether a girl is able to stay in school. This is an important finding as it highlights the relationship between retention and quality of education.
3. The concern over financial constraints is interlinked with supply-side constraints and with the concern over girls’ safety. The financial burden is, by itself, a serious constraint but it seems to be amplified by the other two barriers because of their financial implications. Ensuring girls’ safety is costly (time to drop them off or to secure their transportation) and so is coaching needed to pass the exam and succeed in school.
4. Though this study did not explicitly examine the supply-side barriers of education, they are significant in influencing a household’s decision, -making process of whether to keep a girl enrolled or not. For example, the variables failed in exam and not interested in study are highly correlated because they both indicate a supply-side barrier of low quality of education, and when taken together these two variables come in first place before financial constraints for urban population and before school safety for rural populations.
5. Overall, parents’ aspirations for girls as well as self-aspiration among girls were found to be low. When given the opportunity to discuss aspirations in interviews parents revealed that dropouts have very few aspirations for girls to earn outside the limits of the village or immediate community, and that the link between education and future earning or potential was not apparent. The pervasive expectation was for girls to become better mothers and wives, and to some extent to generate small incomes within the confines of the home and immediate community.
3

54 DEMAND-SIDE BARRIERS TO GIRLS’ SECONDARY EDUCATION IN MADHYA PRADESH, INDIA
6. Eighty-three percent of dropout girls engage in non-economic household chores that are not monetized and are not considered economic activities in Standard National Accounts. The opportunity cost could not be calculated. However, it was evident that the girls’ presence at home enables the mother to step outside the home and to generate income for the household, which may be a motivating factor leading to an increase in dropout rates.
7. Although opportunity cost is found to be weak contributor to dropping out, the 10 percent of dropouts who do report income generating labor make a significant contribution to family income (about one-third). Therefore, their opportunity cost calculation may be very different than the overall opportunity cost calculation that was performed.
8. There is a dramatic drop in girls’ enrolment following class 9..The data show that this is due to failing the examination that would qualify them to continue their schooling. Once a girl fails the exam she is no longer eligible for the cash scholarship schemes offered by the government.
What about the Boys? 9. Boys drop out at a higher rate than girls do
in classes 5–8. This is more evident in urban areas and among the Muslim social group.
10. The perceived opportunity cost for boys in urban areas was found to be a major factor behind dropout of boys, followed by lack of interest in studies, failure in exam, and inability to cope with studies.
Optimal Incentive/Subsidy that Would Motivate Parents to Start Sending Their Girls to School 11. Ninety-three percent of the school going
households were accessing some form of cash scholarship from the government; and 92 percent responded that they do not face any difficulties in accessing these cash scholarships.
12. The amount of cash scholarship being received by households at the secondary level is much lower (annual average scholarship is Rs. 369 for boys and Rs. 561 for girls) than the out-of pocket expenditure on secondary
education which is estimated at Rs. 2,647 per child, per year.
13. Fifty-five percent of dropout households said they would be willing to send their girls to secondary school if provided a scholarship, of which 80 percent said they would prefer the form of the scholarship to be cash only. Rs. 650 per month is the optimal cash transfer to households per girl according to the results. At this amount, 72 percent of dropout households would be willing to send their girls to school.
14. Forty-five percent of dropout households said they are NOT ready to send their girls to secondary school even if provided a scholarship. Even though the socio-economic profile of these households was similar to the others who are willing to send their daughters to school, the top three reasons stated by these households for dropout were NOT financial and included failed in exam, School distance/safety, and not Interested in studies—again pointing to supply-side issues around quality of education.
RECOMMENDATIONS
Recommendation #1 – Short term
IMPROVE SAFETY FOR GIRLS TRAVELING TO AND FROM SCHOOL. Because concern for safety has been identified by parents as one of the primary reasons parents take their daughters out of school, addressing this barrier is one of the most effective ways of preventing drop out. One short-term measure that can be implemented is to improve uptake of the bicycle scheme for girls in Madhya Pradesh. Despite the cultural reasons why parents do not support their daughters staying in school, addressing the safety issue will likely reduce parents’ ability to use these concerns as a justification to keep girls out of school. It is in the interest of the MP government to ensure that girls are accessing safe means of transport to school. Although the GoMP has introduced a bicycle scheme, there has been slow uptake of this service. Given that the Bihar government has had much greater success with the uptake of its bicycle program, we recommend probing more deeply as to why bicycles are not being taken up

55DEMAND-SIDE BARRIERS TO GIRLS’ SECONDARY EDUCATION IN MADHYA PRADESH, INDIA
in Madhya Pradesh and address those issues. FHI 360 has found that one of the reasons for the slow uptake is in part due to the many norms of eligibility that make it difficult for girls to access the program. An example of one of the norms that make it difficult for girls to access the bikes is that eligibility is linked to the location of the school instead of the distance to the school. We also recommend considering other pilot projects to support safe transport – i.e. subsidized shared transport, chaperones, and “walking buses.”
Recommendation #2 – Medium term
ENSURE THAT CASH INCENTIVE SCHEMES ARE EFFICIENTLY RUN, AND SUFFICIENT FOR PARENTS TO COVER THE COSTS OF SECONDARY SCHOOL.Cash incentives are important factors for parents’ decision to send their daughters to secondary school. As long as parents receive a combined amount of what is offered by the GoMP and the GoI scheme, parents will prioritize enrollment and retention and will have enough money to cover the costs of uniforms, tuition, and other out of pocket expenses. However, beyond the amount of money that parents receive, there are three other issues related to the cash incentive scheme that must be addressed for the process to be effective. First, the GoMP should address the logistical issues of transferring money efficiently and systematically to eligible families, and move to an electronic bank transfer method. Second, the cash transfers should be sent to families on a monthly or quarterly basis during the school year to coincide with when parents must cover recurring school expenses such as stationery, uniforms and tuition fees, the top three items of expenditure as reported by parents. Currently, the once per year timing of cash transfers from GoMP does not match when parents need to make out-of-pocket expenses, and it is feared that parents will not prioritize the use of the money for girls’ education. Parents reported their preference to receive the money throughout the school year. Orissa state, for example, has adopted a monthly electronic bank transfer method which has been working well. Finally, it is recommended that the GoMP takes the opportunity as it re-organizes its cash incentive scheme to establish a baseline in order to test over time whether cash transfers lead to higher retention and completion rates for girls and/or boys in secondary school. Currently, there is little concrete evidence in MP to show
that the current cash incentive scheme leads to higher retention rates and completion of girls in secondary school.
Recommendation #3 – Long term
PAY MORE ATTENTION TO SUPPLY-SIDE BARRIERS IN ORDER TO ADDRESS THE DEMAND-SIDE BARRIERS.The top three factors leading girls to dropout are statistically equally important. When all populations were asked to choose on a scale the degree to which each of the barriers is critical in their decision to drop out, school distance and school safety, financial constraints, and failing the exam emerged as the three most significant barriers. Even though the study set out to determine demand side barriers to girls’ secondary education, overall the findings reveal that demand-side barriers are closely linked to supply-side barriers. For example, demand-side barriers such as exam failure and lack of interest in school are indicative of poor teaching quality, which is a supply side barrier. We recommend that more attention be paid to supply-side barriers such as quality of teaching in primary and secondary school in order to address demand-side barriers such as exam failure and lack of interest in school. Students are dropping out of secondary school not only because the curriculum is difficult, but also because their learning abilities are very poor at the primary level. By addressing teaching quality at the primary level, academically stronger students will pass into secondary school. These students will expect better quality teaching in secondary school, and be better prepared for the class 9 exam that many students are failing. We also recommend to make after school reinforcement classes available for those preparing for class 9 exams, establish counseling desks in secondary school to help students begin to link their education with professional opportunities after school completion, and address issues related to deployment and incentivization of teachers.

56 DEMAND-SIDE BARRIERS TO GIRLS’ SECONDARY EDUCATION IN MADHYA PRADESH, INDIA
ANNEXES
ANNEX 1: HOUSEHOLD SURVEY TOOL
ANNEX 2: FOCUS GROUP DISCUSSION TOOL
ANNEX 3: IN-DEPTH INTERVIEW TOOL
ANNEX 4: METHODOLOGY FOR CALCULATING OPTIMUM SUBSIDY
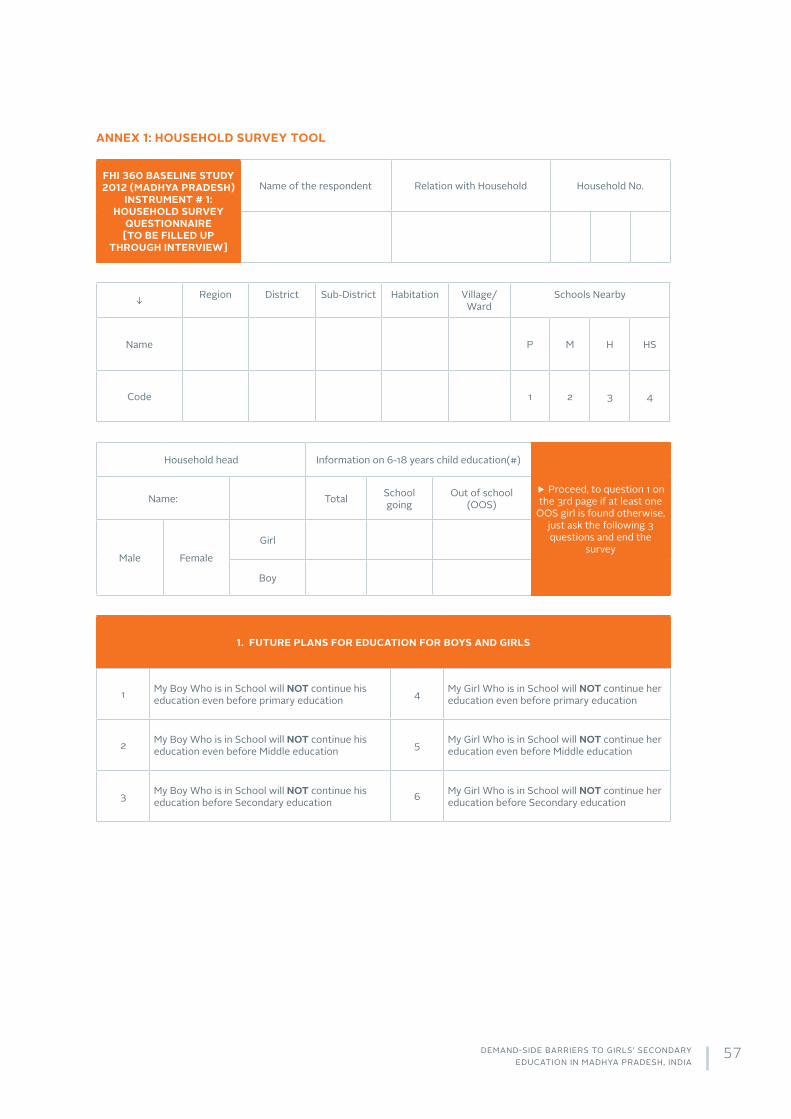
57DEMAND-SIDE BARRIERS TO GIRLS’ SECONDARY EDUCATION IN MADHYA PRADESH, INDIA
ANNEX 1: HOUSEHOLD SURVEY TOOL
FHI 360 BASELINE STUDY 2012 (MADHYA PRADESH)
INSTRUMENT # 1: HOUSEHOLD SURVEY
QUESTIONNAIRE[TO BE FILLED UP
THROUGH INTERVIEW]
Name of the respondent Relation with Household Household No.
↓ Region District Sub-District Habitation Village/Ward
Schools Nearby
Name P M H HS
Code 1 2 3 4
Household head Information on 6-18 years child education(#)
▶ Proceed, to question 1 on the 3rd page if at least one
OOS girl is found otherwise, just ask the following 3 questions and end the
survey
Name: Total School going
Out of school (OOS)
Male Female
Girl
Boy
1. FUTURE PLANS FOR EDUCATION FOR BOYS AND GIRLS
1 My Boy Who is in School will NOT continue his education even before primary education 4 My Girl Who is in School will NOT continue her
education even before primary education
2 My Boy Who is in School will NOT continue his education even before Middle education 5 My Girl Who is in School will NOT continue her
education even before Middle education
3 My Boy Who is in School will NOT continue his education before Secondary education 6 My Girl Who is in School will NOT continue her
education before Secondary education

58 DEMAND-SIDE BARRIERS TO GIRLS’ SECONDARY EDUCATION IN MADHYA PRADESH, INDIA
2. REASONS
Reasons for BOYS not attending school in the future Reasons for GIRLS not attending school in the future
Long Distance To School Long Distance To School
Poor Quality Of Education Poor Quality Of Education
Parental Poverty Parental Poverty
Labor Required In The House Or In The Field Labor Required In The House Or In The Field
Education Is Expensive Education Is Expensive
Discrimination In School Discrimination In School
Physical Disability Physical Disability
Early Marriage Early Marriage
Just Not Interested Just Not Interested
Lack of Awareness about Benefits of Education Lack of Awareness about Benefits of Education
Less Education Good For Girls
Other Other
3. IF ONE OF THE CHOICES FOR GIRLS FROM THE ABOVE MENU IS “LABOR REQUIRED IN THE HOUSE OR IN THE FIELD” OR “EARLY MARRIAGE” ASK THE FOLLOWING QUESTIONS:
Question Yes No Maybe
If your girl was offered a scholarship will you allow her to attend school and you yourself will take care of the housework and delay her marriage?
If the answer to the second question is yes, ask how much scholarship money per month would they need for her to stay in school:

59DEMAND-SIDE BARRIERS TO GIRLS’ SECONDARY EDUCATION IN MADHYA PRADESH, INDIA
1. Education of Household head:..………class passed a) No education b) Literate/only can read
2. How many people do you have in your family? a) Male: b) Female: c) Total:
3. How many people earn in your family? a) Male: b) Female: c) Total:
4. Please tell me two (2) main income sources of your family
SOURCES(RANK 1 IS HIGHEST INCOME SOURCE, RANK 2 IS SECOND HIGHEST INCOME SOURCE) PUT TICK MARK
AGAINST THE RANK
Rank
ing
of In
com
e
Agric
ultu
re
Day
- lab
or
(agr
icul
ture
)D
ay -
labo
r (n
on-a
gric
ultu
re
Busi
ness
(sho
p)
Busi
ness
(h
awke
r)
Gov
t. se
rvic
e
Non
- Gov
t. se
rvic
eSe
rvic
e (a
d-ho
c ba
sis)
Gov
t. te
ache
r
Priv
ate
teac
her
Van/
Rick
shaw
Auto
- Ric
ksha
w
Han
dicr
aft
Fore
ign
Inco
me Is any of your girl/
boy getting an education scholarship or cash from the MP
government?
1 2 3 4 5 6 7 8 9 10 11 12 13 14 Yes (1)
No (2)
If Yes, How
much?
1st
2nd
5. How well do you run your family from your income?
A) Surplus b) Adequate c) Somehow adequate d) Inadequate
6. Please tell us about the education of children in your family: (start from old to younger)
LIST
Age
Situation of schoolingWhat does s/he do at home?
(May have multiple responses)Special-
needs childrenIf school
going If out of school
Year
s ol
d?
In w
hat c
lass
?
Dro
p ou
t of s
choo
l?
If dr
op o
ut, i
n w
hat g
rade
?
Reason of OOS?
Doe
s no
thin
g
hel
ps a
t hom
e
Ow
n Bu
sine
ss/
shop
Day
labo
ur
Em
ploy
ed in
Bus
ines
s sh
ops
etc.
Oth
er w
orks
if a
ny YES NO
Scho
ol f
ar o
ff
Pove
rty
/ fo
r wor
king
Edu
catio
n co
st h
igh
Lack
of w
illin
gnes
s
Mig
ratio
n
Inse
curit
y
Mar
riage
Ove
r age
Illne
ss
Faile
d th
e sc
hool
exa
m
Y (1)
N (2) - 1 2 3 4 5 6 7 8 9 10 0 1 2 3 4 5 1 0
Girl
Girl
Girl

60 DEMAND-SIDE BARRIERS TO GIRLS’ SECONDARY EDUCATION IN MADHYA PRADESH, INDIA
LIST
Age
Situation of schoolingWhat does s/he do at home?
(May have multiple responses)Special-
needs childrenIf school
going If out of school
Year
s ol
d?
In w
hat c
lass
?
Dro
p ou
t of s
choo
l?
If dr
op o
ut, i
n w
hat g
rade
?
Reason of OOS?
Doe
s no
thin
g
hel
ps a
t hom
e
Ow
n Bu
sine
ss/
shop
Day
labo
ur
Em
ploy
ed in
Bus
ines
s sh
ops
etc.
Oth
er w
orks
if a
ny YES NOSc
hool
far
off
Pove
rty
/ fo
r wor
king
Edu
catio
n co
st h
igh
Lack
of w
illin
gnes
s
Mig
ratio
n
Inse
curit
y
Mar
riage
Ove
r age
Illne
ss
Faile
d th
e sc
hool
exa
m
Y (1)
N (2) - 1 2 3 4 5 6 7 8 9 10 0 1 2 3 4 5 1 0
Boy
Boy
Boy
If girls from this household are getting a scholarship or an incentive for education from the government, fill out the following:
THE INCENTIVE PROVIDED BY THE GOVERNMENT COVERS THE FOLLOWING:
1 Lump Sum Yearly Cash
2 Transportation 3 Materials 4 Uniform 5 Exam Fees
Yes No Yes No Yes No Yes No Yes No
1 2 1 2 1 2 1 2 1 2
If lump sum yearly incentive, list the rupee amount per girl: Rs.

61DEMAND-SIDE BARRIERS TO GIRLS’ SECONDARY EDUCATION IN MADHYA PRADESH, INDIA
If for the out of school girls, parents cite either poverty, cost of school too high, or failed the school exam as the reason, proceed by filling out the following. If none of these reasons are given for the dropout, stop the survey here.
IF YOUR DAUGHTER WAS GIVEN A SCHOLARSHIP TO STUDY OR TO RETURN TO SCHOOL, WOULD YOU ALLOW HER TO DO SO?
Yes No Maybe
1 2 3
If the answer to the above question is yes or maybe, fill out the following?
IFHOW MUCH MONEY WOULD YOU NEED PER YEAR TO RESEND OR KEEP YOUR GIRL IN THE SCHOOL FOR EDUCATION?
For Transportation For uniform/shoes For learning materials For private tuition Just need yearly
cash
Rs. Rs. Rs. Rs. Rs.
Notes of interest:
Signature(Name)
Investigator Date: 2012 Cross checker/Supervisor
Date: 2012

62 DEMAND-SIDE BARRIERS TO GIRLS’ SECONDARY EDUCATION IN MADHYA PRADESH, INDIA
ANNEX 2: FOCUS GROUP DISCUSSION TOOL
General Guidelines for Conducting Focus Group Interview with this Group
1. Before starting the interview, obtain parental consent and minor assent by filling out the appropriate forms (see below)
2. Make sure that 7-9 boys of similar age are invited for this focus group
3. Do not mix secondary school dropouts with primary school dropouts
4. Conduct the interview in a quiet area
5. Ensure that boys are able to speak freely without intimidation from adults or male members of the family
6. Ensure that everyone’s point of view is heard during the interview
7. Record important words that are uttered by the respondents to develop themes and perspectives
8. Focus on “silence” from certain members, if there is any. Encourage them to put forward their opinion
9. Monitor for race/status/rich/poor dynamics during the focus group interviews
10. Encourage all to talk
11. Make thorough notes and record important quotations
12. If there are two interviewers, share your notes after the interview to ensure consistency and then transcribe
Parental Consent for: FOCUS GROUP DISCUSSION: ADOLESCENT (12-18 YEARS)
Thank you for agreeing to speak with me today.
My name is __________________________.
I am working with_______________________________________, a research agency. We are working with Family Health International (FHI 360).
Your daughter/son is being asked to take part in a research study to understand the obstacles your community faces to continue sending their girls to secondary schools. We are speaking with adolescent girls in five districts in the state of Madhya Pradesh. Your child’s participation will help us understand the reasons why girls in your community do not go to school and what should be done to retain them in secondary schools.

63DEMAND-SIDE BARRIERS TO GIRLS’ SECONDARY EDUCATION IN MADHYA PRADESH, INDIA
YOUR CHILD’S PART IN THE RESEARCHIf you agree to allow your child to take part in this research, she will be invited to participate in a group discussion. There will be about 10 young women (12-20 years old), in this discussion. The discussion will take approximately 30-45 minutes.
POSSIBLE RISKS Participation in this research poses very minimal risk to your child. She will not be required to answer any question that she does not want to answer. In addition, she can refuse to participate in the research study.
POSSIBLE BENEFITS Being in this study may not directly benefit your child however, it will help in improving the lives of young girls in your village
IF YOU DECIDE NOT TO ALLOW YOUR CHILD TO BE IN THE RESEARCHYou are free to decide if you want your child to be in this research or not. If you decide that she cannot participate, your decision will not affect your or her ability to receive services/education at the school or community.
CONFIDENTIALITYI will not share any of the information you tell me with anybody outside of our research team. I will not share the information with your family or friends. There is a risk that other group members will disclose some of the information that your child discusses, but all members will be instructed to keep information confidential. Your child’s name will not appear on the interview form or in any reports. We will protect information about you and your child’s participation to the best of our ability.
LEAVING THE RESEARCH If your child wishes to leave the study, she may exit the group discussion at any time. Even if she decides to be in the research, she can refuse to answer any questions at any time.
DIGITAL RECORDINGYour child will be asked to allow the interviewer to digitally record the interview, so that the study staff can make sure that the interviews are being carried out correctly and so that they understand what is being said by participants.
This study has been approved by the FHI 360 Protection of Human Subjects Committee in the United States and the Institutional Review Board at CMS Social.
If you need to contact us after the interview with any questions, please contact:
Dr. Sharmistha Basu, Senior Technical Specialist (Research), H-5 GF, Green Park Extension, New Delhi-110016 (011-40487777).
If you have any questions about your rights as a participant in this research, please contact:
Dr. N.B. Rao, Chair of CMS-Institutional Review Board, Research House, Saket Community Centre, New Delhi- 110017 (011-26851660).
Do you understand what I have just told you and do you agree to participate in this study?
Yes = 1 No = 2 → STOP

64 DEMAND-SIDE BARRIERS TO GIRLS’ SECONDARY EDUCATION IN MADHYA PRADESH, INDIA
INTERVIEWER:You must sign below before taking assent from the child.
I certify that the individual being interviewed has provided his/her verbal consent. I further certify that the nature and purpose, the potential benefits, and possible risks associated with participating in this research have been explained to the parent of the child being interviewed and a copy of this consent form has been offered. I also certify that I have answered his/her questions. Interviewers please sign at the appropriate place.
Signature of interviewer______________________________ Date__________________
GIVE A COPY OF THE INFORMED CONSENT TO THE PARENT.
Assent Form for MinorsINTRODUCTION
Thank you for agreeing to speak with me today.
My name is __________________________.
I am working with ___________________________, a research agency. We are working with Family Health International (FHI 360). You are being asked to take part in a research study to understand the obstacles your community faces to continue sending their girls to secondary schools.
We are speaking with adolescent girls in five districts in the state of Madhya Pradesh. Your participation will help us understand the reasons why girls in your community do not go to school and what should be done to retain them in secondary schools. There is no right or wrong response.
YOUR PART IN THE RESEARCHIf you agree to take part in this research, you will be invited to participate in a group discussion. There will be about 10 young women (12-20 years old), in this discussion. The discussion will take approximately 30-45 minutes.
POSSIBLE RISKS Participation in this research poses very minimal risk. You will not be required to answer any question that you do not want to answer. In addition, you can refuse to participate in the research study.
POSSIBLE BENEFITS Being in this study may not directly benefit you however, it will benefit in improving the lives of young girls in your village.
[For those below 18 years of age] Since you are less than 18 years of age, we have already spoken to your father/guardian and got his permission for you to participate.
IF YOU DECIDE NOT TO BE IN THE RESEARCHYou are free to decide if you want to be in this research or not. If you decide not to participate, your decision will not affect your ability to receive services/education at the school or community.

65DEMAND-SIDE BARRIERS TO GIRLS’ SECONDARY EDUCATION IN MADHYA PRADESH, INDIA
CONFIDENTIALITYI will not share any of the information you tell me with anybody outside of our research team. I will not share the information with your family or friends. There is a risk that other group members will disclose some of the information that your child discusses, but all members will be instructed to keep information confidential. Your name will not appear on the interview form or in any reports. We will protect information about you participation to the best of our ability.
LEAVING THE RESEARCH If you wish to leave the study, you may exit the group discussion at any time. Even if you decide to be in the research, you can refuse to answer any questions at any time.
DIGITAL RECORDINGWe would digitally record the interview, so that the study staff can make sure that the interviews are being carried out correctly and so that they understand what is being said by participants. Please let us know if you agree to it.
This study has been approved by the FHI 360 Protection of Human Subjects Committee in the United States and the Institutional Review Board at CMS Social.
If you need to contact us after the interview with any questions, please contact:
Dr. Sharmistha Basu, Senior Technical Specialist (Research), H-5 GF, Green Park Extension, New Delhi-110016 (011-40487777).
If you have any questions about your rights as a participant in this research, please contact:
Dr. N.B. Rao, Chair of CMS-Institutional Review Board, Research House, Saket Community Centre, New Delhi- 110017 (011-26851660).
Do you understand what I have just told you and do you agree to participate in this study?
Yes = 1 No = 2 → STOP
INTERVIEWER:
You must sign below.
I certify that the individual being interviewed has her/his verbal consent. I further certify that the nature and purpose, the potential benefits, and possible risks associated with participating in this research have been explained to the parent of the child being interviewed and a copy of this consent form has been offered. I also certify that I have answered her questions. Interviewers please sign at the appropriate place.
Signature of interviewer___________________________ Date_____________________
GIVE A COPY OF THE INFORMED CONSENT.

66 DEMAND-SIDE BARRIERS TO GIRLS’ SECONDARY EDUCATION IN MADHYA PRADESH, INDIA
Interview Questions for Boys (ages 12-20) who have Dropped Out Of Schools
District Ward Village/Habitation Other
1. What is the general age range of this group? 12-15 15-17 17-20 20+(Note for the interviewer: ask about the age and then circle of the above ranges)
2. What was the last grade you attended in school?
3. How many sisters and brothers do you have?
a. How many brothers and how many sisters currently attend school and what grades are they in?
4. Why did you leave the school? (Note for the interviewer: list the things that each participant says)
a. Why did you leave the school? Was it for financial reasons? Get details.
5. Did your parents have expectations that you should be doing something else, other than going to school? What? Get details.
6. Do you know boys who dropped out of secondary school?
a. What are they doing now?
b. What is their social status in the community?
7. Do you know girls who dropped out of secondary school?
a. What are they doing now? What is their social status in the community?
8. What are the main reasons that boys drop out of secondary school?
9. What is the main reason that girls drop out of schools and do not reach secondary school?
10. What are the differences between boys and girls in terms of completing schooling in your community?
a. Is there a reason as to why boys should get education
b. And why should girls get education?
c. If you think that there is a difference, why do you think there is a difference?
11. Are you planning to marry an educated girl? Why or Why not?
12. Will you educate your daughter(s) if you have any later? Upto what level of education?

67DEMAND-SIDE BARRIERS TO GIRLS’ SECONDARY EDUCATION IN MADHYA PRADESH, INDIA
13. Are you currently planning to enroll in a school? If so, what grade will you enroll in?
14. Will your family (mother/father/other extended family) support you if you received a scholarship to go back to school?
15. How would you rate the general quality of the school which you were attending?
a. Cannot tell
or
i) Slightly good
ii) Good
iii) Excellent
b. Why?
16. Was there something that you liked about your school? What was it?
a. What did you like about it?
17. What did you not like about your school?
18. What did you learn in your school that helped you in your life outside of school?
19. Did you like your teachers? Did you feel that they were good teachers and taught you well?
20. Did other boys/teachers treat you well in school?
a. If the answer is no, why? What did they do/say that made you feel that they did not treat you well?
21. If you could have had something that would have made school easier for you and complete secondary education without dropping out, what would it be?
22. How much per month (range) did your parents spend to send you to school?
a. What did this money cover?
23. Note for this interviewer: This question is for boys whose brothers and sisters are currently in schools – Do you know the range of money that your parents spend on the education of your brothers and sisters in sec. school now?
a. How much (range) do you think it is?
24. How much money (range) does it take per month to send a girl to secondary school?
a. Is there is a difference between cost of secondary school compared with primary school? How?

68 DEMAND-SIDE BARRIERS TO GIRLS’ SECONDARY EDUCATION IN MADHYA PRADESH, INDIA
ANNEX 3: IN-DEPTH INTERVIEW TOOL
General Guidelines for Conducting Focus Group Discussions with Girls and Boys
1. Before starting the interview, obtain teacher consent and minor assent by filling out the appropriate forms (see below)
2. Make sure that 7-9 girls of similar age are invited for this focus group
3. Do not mix secondary school dropouts with primary school dropouts
4. Conduct the interview in a quiet area
5. Ensure that girls are able to speak freely without intimidation from adults or male members of the family
6. Ensure that everyone’s point of view is heard during the interview
7. Record important words that are uttered by the respondents to develop themes and perspectives
8. Focus on “silence” from certain members, if there is any. Encourage them to put forward their opinion
9. Monitor for race/status/rich/poor dynamics during the focus group interviews
10. Encourage all to talk
11. Make thorough notes and record important quotations
12. If there are two interviewers, share your notes after the interview to ensure consistency and then transcribe
A Study of the Demand Side Incentives to Enhance Disadvantaged Girls’ Access to Secondary Schools in Madhya Pradesh
Class Teacher’s Consent for: FOCUS GROUP DISCUSSION: ADOLESCENT (12-20 YEARS) IN SCHOOLS
Thank you for agreeing to speak with me today.
My name is __________________________.
I am working with ___________________________, a research agency. We are working with Family Health International (FHI 360). Your student is being asked to take part in a research study to understand the obstacles your community faces to continue sending their girls to secondary schools.
We are speaking with adolescent girls in five districts in the state of Madhya Pradesh. Your student’s participation will help us understand the reasons why girls in your community do not go to school and what should be done to retain them in secondary schools.

69DEMAND-SIDE BARRIERS TO GIRLS’ SECONDARY EDUCATION IN MADHYA PRADESH, INDIA
YOUR STUDENT’S ROLE IN THE RESEARCHIf you agree to allow your student to take part in this research, she will be invited to participate in a group discussion. There will be about 10 young women (12-20 years old), in this discussion. The discussion will take approximately 30-45 minutes.
POSSIBLE RISKS Participation in this research poses very minimal risk to your student. She will not be required to answer any question that she does not want to answer. In addition, she can refuse to participate in the research study before or at any time during the study.
POSSIBLE BENEFITS Being in this study may not directly benefit your student however, it will help in improving the lives of young girls in your community.
If You Decide Not to allow your student to be in the Research
You are free to decide if you want your student to be in this research or not. If you decide that she cannot participate, your decision will not affect your or her ability to receive services at the school or community.
CONFIDENTIALITYI will not share any of the information you tell me with anybody outside of our research team. I will not share the information with your family or friends. There is a risk that other group members will disclose some of the information that your child discusses, but all members will be instructed to keep information confidential. Your student’s name will not appear on the interview form or in any reports. We will protect information about you and your student’s participation to the best of our ability.
LEAVING THE RESEARCH If your student wishes to leave the study, she may exit the group discussion at any time. Even if she decides to be in the research, she can refuse to answer any questions at any time.
DIGITAL RECORDINGWe would like to digitally record the interview, so that the study staff can make sure that the interviews are being carried out correctly and so that they understand what is being said by participants. Please let us know if you agree to it.
This study has been approved by the FHI 360 Protection of Human Subjects Committee in the United States and the Institutional Review Board at CMS Social.
If you need to contact us after the interview with any questions, please contact:
Dr. Sharmistha Basu, Senior Technical Specialist (Research), H-5 GF, Green Park Extension, New Delhi-110016 (011-40487777).
If you have any questions about your rights as a participant in this research, please contact:
Dr. N.B. Rao, Chair of CMS-Institutional Review Board, Research House, Saket Community Centre, New Delhi- 110017 (011-26851660).
Do you understand what I have just told you and do you agree to participate in this study?
Yes = 1 No = 2 → STOP

70 DEMAND-SIDE BARRIERS TO GIRLS’ SECONDARY EDUCATION IN MADHYA PRADESH, INDIA
INTERVIEWER:You must sign below before taking assent from the child.
I certify that the individual being interviewed has provided his/her verbal consent. I further certify that the nature and purpose, the potential benefits, and possible risks associated with participating in this research have been explained to the parent of the child being interviewed and a copy of this consent form has been offered. I also certify that I have answered his/her questions. Interviewers please sign at the appropriate place.
Signature of interviewer______________________________ Date ____________________
GIVE A COPY OF THE INFORMED CONSENT TO THE PERSON YOU ARE INTERVIEWING.
Assent Form for MinorsINTRODUCTION
Thank you for agreeing to speak with me today.
My name is __________________________, and I am working with ____________________, a research agency.
We are working with Family Health International (FHI 360). You are being asked to take part in a research study to understand the obstacles your community faces to continue sending their girls to secondary schools.
We are speaking with adolescent girls in five districts in the state of Madhya Pradesh. Your participation will help us understand the reasons why girls in your community do not go to school and what should be done to retain them in secondary schools. There is no right or wrong response.
YOUR ROLE IN THE RESEARCHIf you agree to take part in this research, you will be invited to participate in a group discussion. There will be about 10 young women (12-20 years old), in this discussion. The discussion will take approximately 30-45 minutes.
POSSIBLE RISKS Participation in this research poses very minimal risk. You will not be required to answer any question that you do not want to answer. In addition, you can refuse to participate in the research study.
POSSIBLE BENEFITSBeing in this study may not directly benefit you however, it will benefit in improving the lives of young girls in your village.
[For those below 18 years of age] Since you are less than 18 years of age, we have already spoken to your father/guardian and got his permission for you to participate.
IF YOU DECIDE NOT TO PARTICIPATE IN THE RESEARCHYou are free to decide if you want to participate in this research or not. If you decide not to participate, your decision will not affect your ability to receive services/education at the school or community.

71DEMAND-SIDE BARRIERS TO GIRLS’ SECONDARY EDUCATION IN MADHYA PRADESH, INDIA
CONFIDENTIALITYI will not share any of the information you tell me with anybody outside of our research team. I will not share the information with your family or friends. There is a risk that other group members will disclose some of the information that your child discusses, but all members will be instructed to keep information confidential. Your name will not appear on the interview form or in any reports. We will protect information about you participation to the best of our ability.
LEAVING THE RESEARCH If you wish to leave the study, you may exit the group discussion at any time. Even if you decide to participate in the research, you can refuse to answer any questions at any time.
DIGITAL RECORDINGWe would like to digitally record the interview, so that the study staff can make sure that the interviews are being carried out correctly and so that they understand what is being said by participants. Please let us know if you agree to it.
This study has been approved by the FHI 360 Protection of Human Subjects Committee in the United States and the Institutional Review Board at CMS Social.
If you need to contact us after the interview with any questions, please contact:
Dr. Sharmistha Basu, Senior Technical Specialist (Research), H-5 GF, Green Park Extension, New Delhi-110016 (011-40487777).
If you have any questions about your rights as a participant in this research, please contact:
Dr. N.B. Rao, Chair of CMS-Institutional Review Board, Research House, Saket Community Centre, New Delhi- 110017 (011-26851660).
Do you understand what I have just told you and do you agree to participate in this study?
Yes = 1 No = 2 → STOP
INTERVIEWER:You must sign below.
I certify that the individual being interviewed has her verbal consent. I further certify that the nature and purpose, the potential benefits, and possible risks associated with participating in this research have been explained to the parent of the child being interviewed and a copy of this consent form has been offered. I also certify that I have answered her questions. Interviewers please sign at the appropriate place.
Signature of interviewer_____________________________ Date _______________________
GIVE A COPY OF THE INFORMED CONSENT TO THE PERSON BEING INTERVIEWED.

72 DEMAND-SIDE BARRIERS TO GIRLS’ SECONDARY EDUCATION IN MADHYA PRADESH, INDIA
Indepth Interview Questions with Girls in School (Class 9 and 10)
School Name District Ward Village/Habitation Other
QUESTIONS FOR ALL GIRLS AS RELATED TO ASSESSING DEMAND SIDE BARRIERS TO GIRLS’ EDUCATION
Age Current Grade
Girl 1
Girl 2
Girl 3
Girl 4
Girl 5
Girl 6
Girl 7
Girl 8
Girl 9
Girl 10
# of School Age Sisters(6-16 yrs)
Going to Primary School
Going to Secondary School
Not Going to School
# of School Age Brothers(6-16 yrs)
Going to Primary School
Going to Secondary School
Not Going to School
Girl 1
Girl 2
Girl 3
Girl 4
Girl 5
Girl 6
Girl 7
Girl 8
Girl 9
Girl 10

73DEMAND-SIDE BARRIERS TO GIRLS’ SECONDARY EDUCATION IN MADHYA PRADESH, INDIA
1. Have any of your brothers and sisters dropped out of school?
a. What were the reasons?
2. Do you know some other girls in your community who could not continue their education to secondary level? What were the reasons for their dropout?
3. How do you get to school every day?
a. If you take public transportation, how much does it cost on monthly/daily basis?
b. Do you face any dangers going to school or returning home from school?
4. Are your parents/other family members supportive of your education?
a. In what way are they supportive?
b. In what ways are they not supportive?
5. How much money per month are your parents spending to send you to school?
a. What is this money used for?
6. In your community, generally, whose education is mostly supported, boys or girls? And Why?
7. What will you do when you leave school?
a. Will you attend university?
b. Will you work?
c. Will you get married very soon after?
8. What is the main source of income in your house?
a. Father’s job
b. Mother’s job
c. Both
d. Other
9. What do you and your parents think about marriage and education?
a. In your community, are educated girls more in demand by the boys?
b. Do educated girls in your community ask for educated husbands?
c. Are girls allowed to study even after getting married? Until what grade?
d. What will be the attitude of your future husband if you have not completed secondary school?
e. Is schooling more important for boys or for girls? Why?

74 DEMAND-SIDE BARRIERS TO GIRLS’ SECONDARY EDUCATION IN MADHYA PRADESH, INDIA
10. Tell us about what you do when you are at home
a. In the morning before you came to school, what did you have to do
b. When you go home from school, what do you have to do?
c. When do you do your homework?
d. Does anyone help you with the homework at home? Who?
QUESTIONS FOR ALL GIRLS AS RELATED TO ASSESSING SUPPLY SIDE BARRIERS TO GIRLS’ EDUCATION
1. Do you like your school? Why? Why not?
2. Do you think you are learning in school? How?
a. What are you learning well?
b. What are you not learning well?
c. How do you think learning could improve?
3. Do you think that what you were learning in school is important to your life outside of school?
4. Note for the interviewer: on the following question take a quick vote and encircle the majority answer:
a. How would you rate the general quality of your school?
i) Cannot tell
ii) Poor
iii) Slightly good
iv) Good
v) Excellent
b. Why?
5. Do you think your other friends or brothers/sisters are happy and learning in (their) school?
a. How do you know?
6. Tell us about the homework that you have?
a. Are you able to easily do this homework?
b. Do your teachers support you if you have to do extra school/studies work?

75DEMAND-SIDE BARRIERS TO GIRLS’ SECONDARY EDUCATION IN MADHYA PRADESH, INDIA
7. Do you receive any scholarship, conditional or unconditional cash award for you to attend school? (Definitions: scholarship are direct resources like books and uniforms that are given directly to you or the school; conditional cash transfer is money given to you or your family on a regular schedule with the requirement that you must attend school; unconditional cash transfer is money given to you or your family with no requirements about how to use the money)
a. What type of award do you receive?
b. How much did you receive?
c. How long have you received this award?
d. How easy was it to get this award? If not, what are constraints
e. Has this award been helpful to you?
i) How?
f. How many other girls are receiving such awards in your school?
8. If you could have something that would make school easier for you and complete secondary education without dropping out, what would it be?
9. What are the barriers for girls not going to secondary school?
Ask the participants to vote for and rank the list of potential barriers that currently exist in this community that prevent girls from entering and completing secondary schools:
Most important Important Less
importantNot important
at all Don’t know
Child not interested in studies
Parents not interested in sending girl for further studies
School far off
To work for wage /salary
For participation in other economic activities
To look after younger siblings/ grand parents
To attend other domestic chores
Financial constraints
Poor quality of education
Failed in examination /didn’t get promoted to next class
Poor health/medical reason
Discrimination faced in school
Marriage

76 DEMAND-SIDE BARRIERS TO GIRLS’ SECONDARY EDUCATION IN MADHYA PRADESH, INDIA
10. Rating of School expenditures
Note for Interviewer: To fill out the table below follow the following two steps:
To fill out Column 1 - Ask the FG participants to provide you an approximate cost of the various items necessary for secondary schooling of girls. Write the rupee value in front of the item. Then ask them to rate each item column 1 with a number ranging from 1 to 4 of importance to them; with
1= not at all important
2= somewhat unimportant (slightly important)
3=somewhat important (Moderately important)
4= very important
To fill out Column 2 - Then ask them to rate whether these items are being currently covered by either parents, government schemes or through a donor program. Depending upon the level of coverage, fill Column 2 currently provided by parent, NGO or govt. /donor portion on a scale of 1-4; with
1= not provided at all
2= slightly provided but not enough
3= moderately provided (but more than slightly)
4= fully provided
IMPORTANT ELEMENTS FOR GIRLS’ EDUCATION
COLUMN 1Optimal Required1= not at all important2= somewhat unimportant (slightly important)3=somewhat important (Moderately important)4= very important
COLUMN 2Currently Provided by the parent (insert A), NGO (insert B) or Govt. (insert C) please insert alphanumeric code1= not provided at all2= slightly provided but not enough3= moderately provided (but more than slightly)4= fully provided
Monthly costs to cover education expenses Rating Rating
Books
Stationary (copy/pencil)
Uniform/Shoes and Bag
Transport
Tuition fee (at school)
Examination fee
Development fee
Coaching facility/fee
Electricity/Kerosene for lanterns
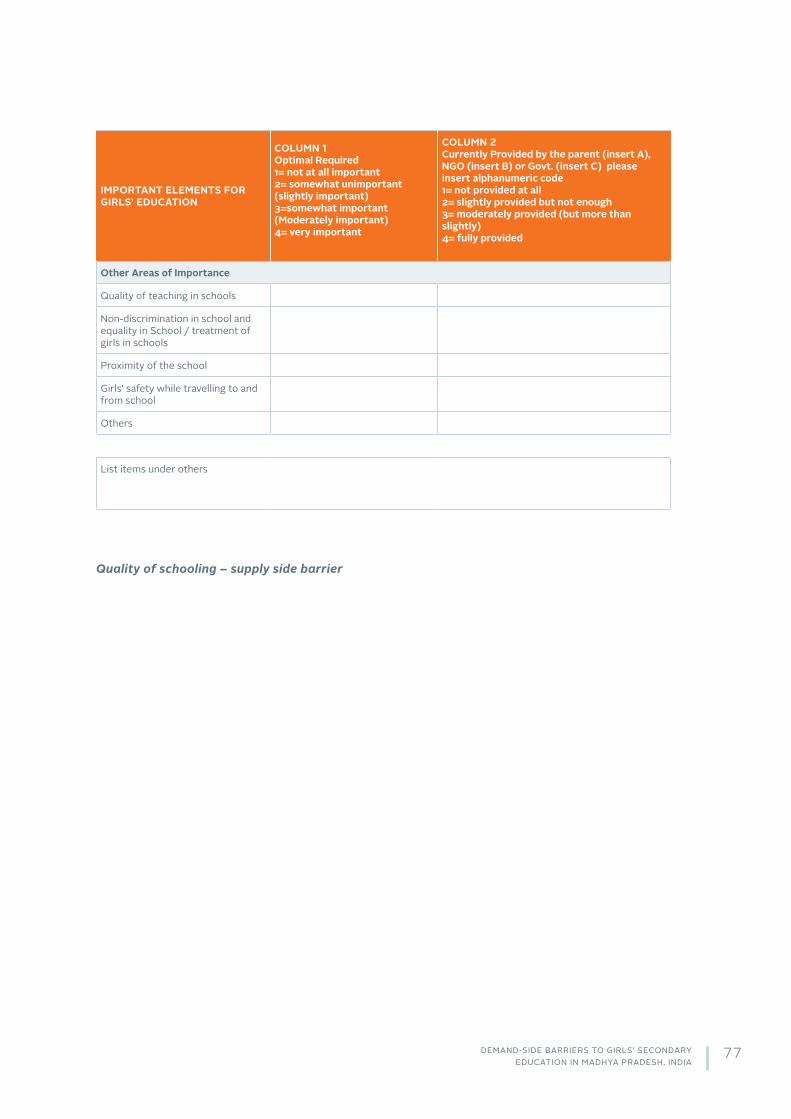
77DEMAND-SIDE BARRIERS TO GIRLS’ SECONDARY EDUCATION IN MADHYA PRADESH, INDIA
IMPORTANT ELEMENTS FOR GIRLS’ EDUCATION
COLUMN 1Optimal Required1= not at all important2= somewhat unimportant (slightly important)3=somewhat important (Moderately important)4= very important
COLUMN 2Currently Provided by the parent (insert A), NGO (insert B) or Govt. (insert C) please insert alphanumeric code1= not provided at all2= slightly provided but not enough3= moderately provided (but more than slightly)4= fully provided
Other Areas of Importance
Quality of teaching in schools
Non-discrimination in school and equality in School / treatment of girls in schools
Proximity of the school
Girls’ safety while travelling to and from school
Others
List items under others
Quality of schooling – supply side barrier
78 DEMAND-SIDE BARRIERS TO GIRLS’ SECONDARY EDUCATION IN MADHYA PRADESH, INDIA
ANNEX 4: METHODOLOGY FOR CALCULATING OPTIMUM SUBSIDY
Methodology for Calculating Optimum Subsidy (Tipping Point): How large a subsidy would be required to get a fixed percentage of girls to stay in school?
From the household survey the variable on those households with drop-out girls who were willing to send their daughters to school if provided cash subsidy (expected amount in Rs./month) is used for calculating the optimum subsidy. Then we calculated the cumulative percentage that would stay in school as a function of the subsidy. [For example, if 100 percent would stay in school for X Rs./month, what percent would stay if subsidy were reduced to Y? And so on until no one would choose to keep their daughter in school]
Based on the point estimates of cumulative percentages, we graphed a cumulative percentage willing to accept and amount in expected in Rs. /month. We quickly got to 59 percent acceptance at 550 Rs./month. After that, the next big gain was at 650 Rs./month taking us to 72% acceptance. From there on, the subsequent gains became very costly. Therefore we would not recommend a subsidy greater than Rs. 650/month for ten months (Rs. 6500) of attending school as during that time students incur recurring costs.


FHI 360 HEADQUARTERS2224 E NC Hwy 54Durham, NC 27713 USAT 1.919.544.7040F 1.919.544.7261
WASHINGTON DC OFFICE1825 Connecticut Ave., NWWashington, DC 20009T 1.202.884.8000F 1.202.884.8400
www.FHI360.org