democracy and economic development: a fuzzy classification approach … · democracy and economic...
TRANSCRIPT
Research – Work in Progress – nº180, July 2005
FEP WORKING PAPERS FEP WORKING PAPERS
Democracy and Economic Democracy and Economic DevelopmentDevelopment: a: a Fuzzy Fuzzy
Classification ApproachClassification Approach
AnaAna MargaridaMargarida Oliveira Oliveira BrochadoBrochado
andand
FranciscoFrancisco VitorinoVitorino MartinsMartins
Faculdade de Economia do Porto - Rua Dr. Roberto Frias - 4200-464 - Porto -Portugal Tel . (351) 225 571 100 - Fax. (351) 225 505 050 - http://www.fep.up.pt

1
DEMOCRACY AND ECONOMIC DEVELOPMENT: A FUZZY CLASSIFICATION
APPROACH
Ana Oliveira-Brochado Francisco Vitorino Martins ([email protected]) ([email protected])
Faculdade de Economia, Universidade do Porto
Rua Dr. Roberto Frias, 4200-464 Porto, Portugal.
ABSTRACT
The aim of this work is to (1) analyse whether countries differ on political indicators
(democracy, rule of law, government effectiveness and corruption) and (2) study whether
countries with different political profiles are associated with different levels of economic,
human development and gender-related development indicators. Using a fuzzy classification
approach (fuzzy k-means algorithm), we propose a typology of 124 countries based on 10
political variables. Six segments are identified; these political groups implicate the access to
different levels of economic and human development. In this study evidence of a positive but
not perfect relationship between democracy and economic and human development is
observed, thus presenting new insights for the understanding of the heterogeneity of behaviors
relatively to political indicators.
Keywords: Democracy, Economic Development, Fuzzy k-means.
JEL-Codes: C21;C61; O10; O57
2
1. Introduction
During the 20th century we witnessed a significant expansion in the number of sovereign
states and the number of governments democratically elected. In fact, “[i]n a very real sense,
the 20th century has become the ´democratic century’” (Freedom House, 2002: 1).
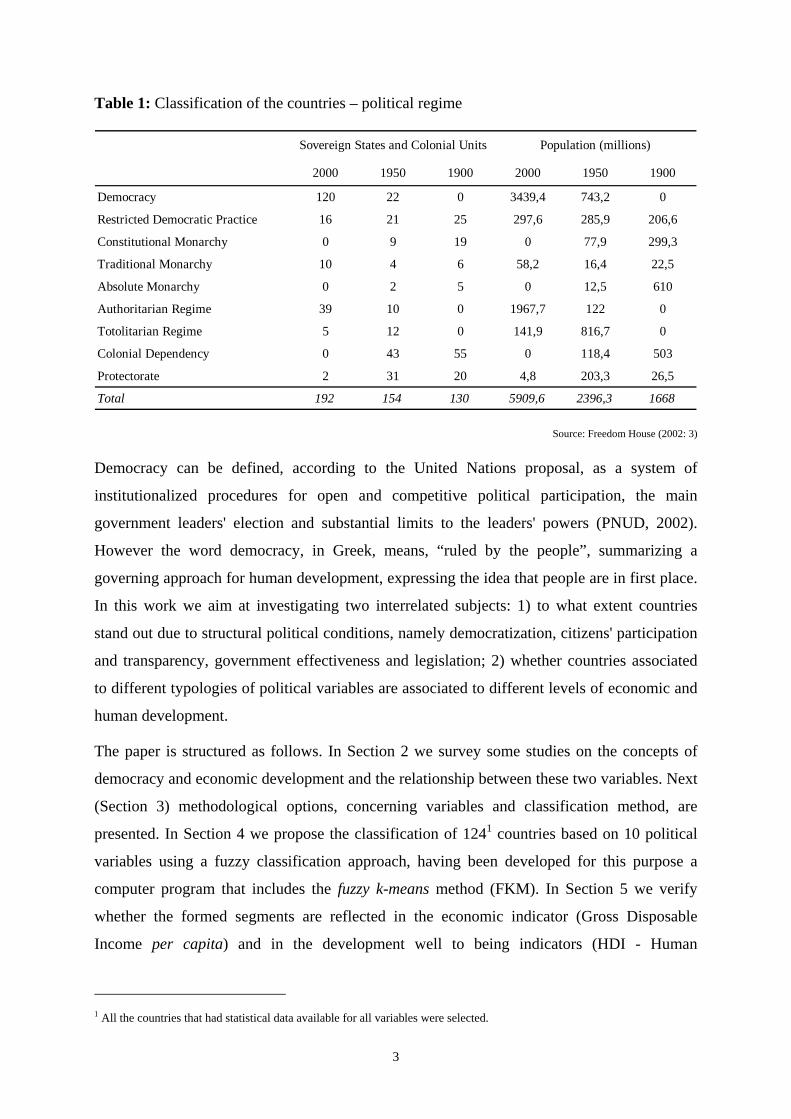
In 1900 no country could be classified as an electoral democracy by universal suffrage, with
multiparty elections. In the beginning of the 20th century, 25 countries are classified by
Freedom House (1999) as having 'Restricted Democratic Practices' (Table 1), i.e., regimes
where the dominant party controlled civil laws or the freedom of press or where the right to
vote was denied women, ethnic segments, racial minorities, or the impoverished. Democracy,
as a national political system, won great acceptance in the last half of the last century,
motivated by the defeat of the Nazi totalitarianism, the process of post war decolonization and
the reconstruction of Europe and of Japan (Freedom House, 2002). The percentage of
population that lives under electoral governments with universal suffrage increased from 31%
in 1950 up to 58,3% in the year 2000, and 98 countries took their steps towards democracy;
these movements increased since the 70s - denominated as the ‘democratic age’ (Freedom
House, 2002: 2). In spite of this, nowadays some countries still live under authoritarian
regimes and some new democratic nations didn't get stabilization and therefore retreated in
the political regime; other countries that took steps towards democracy are still in a semi-
democratic phase. As for the countries considered democratic, in the objective sense of the
existence of free, competitive elections and electoral participation, these possess different
results in terms of political organization, civil freedom, political rights, freedom of the press,
voice and accountability, political stability and the lack of violence, law and order, rules of
law, government effectiveness and graft (PNUD, 2002).
In this context, heterogeneity of behaviors in relation to political factors should be
systematized, enabling the identification of countries with similar profiles.
3
Table 1: Classification of the countries – political regime
2000 1950 1900 2000 1950 1900
Democracy 120 22 0 3439,4 743,2 0
Restricted Democratic Practice 16 21 25 297,6 285,9 206,6
Constitutional Monarchy 0 9 19 0 77,9 299,3
Traditional Monarchy 10 4 6 58,2 16,4 22,5
Absolute Monarchy 0 2 5 0 12,5 610
Authoritarian Regime 39 10 0 1967,7 122 0
Totolitarian Regime 5 12 0 141,9 816,7 0
Colonial Dependency 0 43 55 0 118,4 503
Protectorate 2 31 20 4,8 203,3 26,5
Total 192 154 130 5909,6 2396,3 1668
Sovereign States and Colonial Units Population (millions)
Source: Freedom House (2002: 3)
Democracy can be defined, according to the United Nations proposal, as a system of
institutionalized procedures for open and competitive political participation, the main
government leaders' election and substantial limits to the leaders' powers (PNUD, 2002).
However the word democracy, in Greek, means, “ruled by the people”, summarizing a
governing approach for human development, expressing the idea that people are in first place.
In this work we aim at investigating two interrelated subjects: 1) to what extent countries
stand out due to structural political conditions, namely democratization, citizens' participation
and transparency, government effectiveness and legislation; 2) whether countries associated
to different typologies of political variables are associated to different levels of economic and
human development.
The paper is structured as follows. In Section 2 we survey some studies on the concepts of
democracy and economic development and the relationship between these two variables. Next
(Section 3) methodological options, concerning variables and classification method, are
presented. In Section 4 we propose the classification of 1241 countries based on 10 political
variables using a fuzzy classification approach, having been developed for this purpose a
computer program that includes the fuzzy k-means method (FKM). In Section 5 we verify
whether the formed segments are reflected in the economic indicator (Gross Disposable
Income per capita) and in the development well to being indicators (HDI - Human
1 All the countries that had statistical data available for all variables were selected.

4
Development Index and GDI- Gender-Related Development Index), by using multiple lineal
regression models. Finally, we present a conclusive synthesis.
2. Economic development and democracy: an overview
Why is a positive relationship between democracy and economic development expected? Do
richer countries have larger probability of being democratic? Is democracy a prerequisite for
economic development? Or is economic development a prerequisite for democracy? The
study of the relationship between Democracy and Development is widely discussed and a
multidisciplinary theme (Ramaswamy and Cason, 2003) - the literature in the political science
and economy area offers a great variety of answers to these questions.
Many investigators, both in theoretical and empirical terms, support the hypothesis of the
existence of a positive relationship between democracy and development. Lipset’s (1959)
pioneering work has inspired a great number of empirical studies about the relationship
between Democracy and Development. The author argued that in a country with a higher
development rate the population possesses larger probability of believing in the democratic
values that will support a democratic system. According to the author, only in a society where
there is well-being can intelligent participation in political subjects be verified – “the mass of
the population could intelligently participate in politics and could develop the self-restraint
necessary to avoid succumbing to the appeals of irresponsible demagogues. The society
divided between the large impoverished mass and small favored elite would result either in
oligarchy (…) or in tyranny” (Lipset, 1959: 75).
Studies on the relationship between democracy and development reveal the existence of a
positive relationship between the two variables (e.g. Cutright, 1963; Neubauer, 1967; Olsen,
1968; Jackman, 1973; Bollen, 1979, 1980, 1983; Bollen and Jackman, 1985; Burkhart and
Lewis-Beck, 1994), in spite of the differences in the methodological options. The differences
in the studies can be grouped into six topics: measurement of democracy; measurement of
development and other variables; countries in the study (sample); period of study; nature of
the quantitative methods used; type of relationship tested (lineal versus non-linear).
Measurement of democracy
Although all the studies use the same theoretical concept of democracy, its quantification
form varies, from the definition as a non-metric variable (through categories) (e.g.,
Gasiorowski, 1996; Przeworski and Limongi, 1997) to the use of indexes developed or
compiled by international organizations (Bollen and Paxon, 2000).

5
In this study several subjective indicators are used that intend to evaluate the extension of
Democracy and Civil and Political laws of the various countries. In relation to previous
studies, variables that are not limited to the concept of Democracy are considered,
emphasizing the Evaluation of the Government (Table 2).
Measurement of development
The empirical tests of the relationship between democracy and development have been
developing according to two lines. The first approach, considered by Lipset (1959), analyzes
the relationship between development and democracy by crossing the levels of development
and democracy. In this investigation line, there are studies that use either monetary indicators
of economic development, like the Gross Disposable Income per capita (e.g., Bollen and
Jackman, 1985; Lipset et al., 2001; Przeworski and Limongi, 1997), or a social-economic
development definition, a reflex of the universal needs or characteristics, usually recognized,
of development such as: high income levels, high human capital, high life expectancy at birth
(e.g., Cutright, 1963; Olsen, 1968; Diamond, 1992). These authors emphasize the fact that
monetary indicators, like the Gross Disposable Income per capita, do not reflect the standard
of living of the population in general and they potentially underestimate the development in
developing countries where a lot of the economic activity takes place in the informal
economy. Other explanatory variables have been proposed, such as urbanization, urban
wages/salaries and the consumption of energy (Bernhagem, 2001). Some authors explore
alternative propositions, including variables such as cultural pluralism (Bollen and Jackman,
1985), religious groups (Bollen 1979, 1983), military expenses (Lipset et al., 1991) and
Center-Periphery relationships (Doorenspleet, 2001).
Recent studies question and test the relationship between democracy and economic
development in a dynamic perspective, choosing the growth rate of the Gross Disposable
Income per capita as an indicator of economic growth (for instance, Barro 1991, 1996;
Perotti, 1996; Tavares and Wacziarg, 2001; Shen, 2002). These studies focus on the
elaboration of explanatory models of economic growth, and therefore Democracy is an
explanatory variable, among others, such as the stock of human capital, the degree of
openness to the exterior, or public consumption.
This study is framed into the first investigation line, i.e. the importance of Democracy (or of
other regimes) for Economic Development (conjugating economic development, human
development and gender-related development indicators).

6
Sample of the countries in the study
Studies that consider the relationship between Democracy and Development differ in relation
to the segment of countries selected; for instance, Olsen (1968) and Vanhannen (1997)
consider all independent countries; Cutright (1963) excludes the African countries from the
analysis; Jackman (1973) looks for the non-communist regimes, Jackman (1973) and
Bernhagen (2001) just include Latin American countries, and recent studies seek a larger
coverage (Arat, 1991; Gasiorowksi, 1996; Doorenspleet, 2000). The present study follows
these later, tring to maximize the number of countries to include in the sample. The sole
restriction is the availability of data for the selected variables.
Period of study
The studies also refer to different moments in time; Bollen (1980, 1983), Bollen and Jackman
(1985) and Copedge and Reinecke 1991 are some cases of cross-section studies. Arat (1991)
selects the 1948-1984 period, Gasiorowksi (1996) Alvarez et al., (1996) include observations
since 1950 and Vanhanen (1997) goes back to 1850. Some of these studies allow us to
formulate the hypothesis that the relationship pattern between democracy and development
varies throughout time and between 'democratization waves' (Huntington, 1991, Diamond,
1992); for instance, Doorenspleet (2000) concludes that the relationship between democracy
and development can be separated into the period before the Cold War and the period after.
The present study is cross-section, with information since the year 2002.
Nature of the statistical methods used
Due to the democracy measurement scale and the type of relationship to be tested, the use of
cross-tables (Coleman 1960; Huntington 1991), the analysis of correlations (Cutright, 1963;
Neubauer, 1967; Olsen, 1968), the analysis of multiple regression (Jackman, 1973; Bollen and
Jackan, 1985; Lipset, et al., 1991) and logistic regression models (Gasiorowski, 1996; Lipset
et al., 1991; Doorenspleet, 2000) can be verified.
In the proposed study, the methods to use should incorporate the multiple explanatory factors
- Democracy, Government Effectiveness, Rule of Law and Corruption - and should consider
the diversity of political segments where the countries are framed. Therefore, having the
variables selected a multivariate character, and considering the heterogeneity as a central
requirement, we propose the use of the cluster analysis in the construction of a typology of
segments of countries. In a second phase, regression analysis is used with the purpose of

7
verifying if the different formed segments exhibit different behaviors in relation to the
economic and human development variables.
Type of linear or non-linear relationship
Since Lipset’s (1959) initial work, there has been a lot of debate on the existing relationship
between development and the presence of democracy and of it being or not linear. Przeworski
and Limondi (1997) refer that the relationship is non-linear and there is a minimum threshold
of development from which the probability of democracy being reached and maintained
increases. The authors emphasize that results are influenced by the measurement used to
quantify democracy (metric or non-metric). The used methodology - constitution of groups of
countries - allows the estimate of different proximities inter segments and the definition of
non-lineal hierarchies for the segments.
In the following section a thorough description of the methodology used in the present study
is presented.
3. Variables and classification methods
In the segmentation that involves countries as an analysis unit, just as in any other
segmentation process, two technical options are necessary: the choice of the segmentation
base – the variables used, and a classification method option.
In the present work 10 subjective indicators are used for the political factors (PNUD, 2002) to
classify 124 countries based on the fuzzy classification method fuzzy k-means.
3.1 Political factors
The democracy can be defined as a system of institutionalized procedures for an open and
competitive political participation, the election of the main government’s leaders and
substantial limits to the leaders' powers (PNUD, 2002). Considering that a truly democratic
government requests the citizens' widespread and substantive participation and the
responsibility of the people that have the power, the use of subjective indicators, based on the
specialists' opinions on the degree of democracy of a country, constitutes the most appropriate
approach for the reception of this qualitative concept for each country (in spite of the possible
bias resulting of knowledge differences, opinion and the specialists' perception). In this work

8
the data used is the one published in the United Nations Report (PNUD, 2002), which comes
from several sources (Appendix).2
Thus, the classification is made based on a segmentation base of 10 variables, defined in
evaluation scales that intend to capture the extension of democracy, governmental
effectiveness and rule of law and corruption level (Table 2). It is important to emphasize that
the variables civil freedom, political rights and freedom of the press are codified contrarily to
the remaining ones, therefore its increase represents a more negative classification.
Table 2: Political factors: characterization of the segmentation variables
Indicator Variable Source Range Average Standard-deviation Maximum Minimum
Political score IV dataset University of Maryland
-10 (less democratic) to 10 (most democratic) 4,33 6,29 10 -10
Civil liberties Freedom House 1-2,5 free; 3-5 partly free; 6-7 not free 3,44 1,69 7 1
Political rights Freedom House 1-2,5 free; 3-5 partly free; 6-7 not free 3,21 2,12 7 1
Freedom press Freedom House 0-30 free; 31-60 partly free; 61-100 not free 43,83 23,84 100 5
Voice and accountability World Bank Governance Indicators Dataset -2,5 (worst) to 2,5 (better) 0,18 0,92 1,73 -1,93
Political stability and lack of violence World Bank -2,5 (worst) a 2,5 (better) 0,13 0,86 1,61 -2,01
Law and order International County Risk Guide 0 (worst) a 6 (better) 3,83 1,41 6 0,50
Rule of law World Bank Governance Indicators Dataset -2,5 (worst) a 2,5 (better) 0,12 0,94 1,91 -1,50
Government effectiveness World Bank Governance Indicators Dataset -2,5 (worst) a 2,5 (better) 0,10 0,93 2,16 -1,58
Cor
rupt
ion
Graft World Bank Governance Indicators Dataset -2,5 (worst) a 2,5 (better) 0,09 0,97 2,25 -1,24
Rul
e of
aw
and
gov
ernm
ent
effe
ctiv
enes
sD
emoc
racy
In the present study a fuzzy classification method is used to identify the component countries
of each segment (it is assumed that a country can belong to more than a segment, thus being
calculated the respective probabilities of belonging). .
3.2. Fuzzy k-means
The governmental classification of the 124 countries is based on a fuzzy classification
approach – the Fuzzy k-Means (FKM) proposed by Bezdek (1973, 1974) and Dunn (1974).
The model and its associated algorithm were developed on the Statistical package, according
to the Statistical Basic programming language.
2 Polity IV Database (Center for International Development and Conflict Management at the University of Maryland); Freedom House and Indexes from the World Bank.

9
The Fuzzy- k-means model is a fuzzy version of the non-overlapping partition model hard k-
means or hard ISODATA algorithm, and it is based on the generalized fuzzy variance
criterion:
∑∑= =
=N
1n
S
1s
2ns
rnsFKM dpJ (1)
where [ ]1,0pns ∈ , 1pS
1sns =∑
=
represents the membership degree of object n ( )Nn1 ≤≤
in group s ( )Ss1 ≤≤ . The extension is made by introducing a weight r, named ‘fuzziness
factor’, which characterizes the family { }∞<≤ r1J FKM . If 1r = , the obtained solution would
be a non-overlapping partition. If r tends to the infiniteness then the membership degree
values to each class become close to1 S . The fuzzy partition degree grows with r, and 2 is the
most used value (Dunn’s original version (1974)). From (1) we can infer that FKMJ is a
function of 2nsd , a measurement of the error incurred on the representation of the object n by
the centroid sv of each group s:
( ) ( )snT
snAsnns vxAvxd −−=−= vx2 (2)
Three choices are possible for matrix A, which lead to the Euclidean, Diagonal and
Mahalanobis distance.
Thus, the FKM model constitutes a nonlinear optimization model, which is synthesized in
Table 3.
Table 3: Fuzzy k-means model
( ) ( )
0p
1p
:a .suj
vxpmin,PJmin
ns
S
1sns
N
1n
S
1sAsn
rnsFKM
≥
=
⎭⎬⎫
⎩⎨⎧
−=
∑
∑∑
=
= =
Av,
The optimal strategy to minimize the FKMJ function, subdivided into classical stages –
Initialization (1 and 2), Iteration (3 and 4) and Stop Criterion (5 ) - is synthesized in Table 4.

10
Table 4: Fuzzy k-means algorithm
(1) Determining an initial fuzzy partition matrix, selecting the distance measure and parameter
r fixation.
(2) Calculation of the group centroids using the expression:
∑
∑
=
== N
1n
rns
N
1nnk
rns
sk
p
xpv (3)
where nkx represents the value of variable k ( )Kk1 ≤≤ for object n ( )Nn1 ≤≤ .
(3) Construction of a new fuzzy partition matrix (determination of the new membership
values):
(3.1) if an object n keeps a distance 0 from the centre of class s, the value of nsp is
equal to 1 and the membership values of n towards the remaining classes is equal to 0;
(3.2) if all the distances from an object to the centroids of the S groups are above 0, the
membership values are determined by:
( )1S
1t
1r2ntnsns ddp
−
=
−⎥⎦
⎤⎢⎣
⎡= ∑ (4)
(4) Calculation of the group centroids associated to the partition determined in 3 from
expression (3).
(5) Repetition of steps 3 and 4 until the stop criterion is reached.
Source: adapted from Dunn (1974: 37)
4. Political classification
4.1. Determining of the number of segments
For the selection of the number of existent groups in the data, the validation measures used
are the ones proposed by Riviera et al. (1990) - 'Minimum Hard Tendency' and 'Mean Hard
Tendency’.3 These are robust measures, totally independent from the number of segments and
3 For each country the quotient between its two highest membership degrees (rs) is defined; this quotient ranges between 0 (non-overlapping membership of country n) and 1 (completely fuzzy membership). Additionally, a hard partition matrix is defined based on the highest membership values in the fuzzy membership partition matrix. The set of countries belonging to

11
of the size of the data being classified and they don't exhibit the undesirable tendency to
underestimate of the number of segments revealed by other measures published in the
literature. The search of the best partition of the clustering suggests the maximization of these
functions.4 This way a 6-class segment is chosen (Table 5).
Table 5: Selection of the number of segments
2 3 4 5 6 7
Number of iterations 12 20 31 46 27 didn't converge
Minimum Hard Tendency 0,719 0,652 1,237 0,786 1,386
Mean Hard Tendency 0,647 0,492 0,629 0,540 0,644
CriteriaNumber of Political Groups
4.2. Evaluation of the heterogeneity in the government
We now proceed to the classification using the fuzzy classification algorithm fuzzy k-means.
The derivation of a non-overlapping partition matrix from the matrix of fuzzy partition allows
obtaining six relatively balanced segments (Segment 1-18; Segment 2-23; Segment 3-20;
Segment 4-18; Segment 5-24; Segment 6-21) in terms of dimensions (number of countries).
The result of the non-parametric Kruskall-Wallis test for the difference between segment
centroids reveals that all the variables present different mean patterns (statistically significant)
in the obtained result (Table 6).
the S non-overlapping segments is defined as: ( ){ }ntStnsns ppxY
≤≤==
1max: . The hard tendency of each segment s (Ts)is defined
as de average of all quotients rn of countries classified in non-overlapping cluster s. Mean hard tendency is defined as ( )101
1 logSss
S T=−∑ and Minimum hard tendency is calculated through ( )101
max log ss ST
≤ ≤−⎡ ⎤⎣ ⎦ .
4Notice that the fuzzy partition obtained tends towards to be non-overlapping as Minimum hard tendency and Mean hard tendency values increase.

12
Table 6: Results of the political grouping
Number of contries
Political score
Civil liberties
Political rights
Freedom press
Voice & accountability
Political stability & lack
of violence
Law and order Rule of law Government
effectiveness Graft
Cluster 1 18 -3,78 5,39 6,06 71,44 -1,06 -0,96 2,61 -0,93 -0,87 -0,77Cluster 2 23 7,52 2,96 2,26 36,04 0,27 0,07 2,80 -0,35 -0,31 -0,42Cluster 3 20 4,95 4,20 3,80 55,35 -0,31 -0,74 3,00 -0,67 -0,76 -0,70Cluster 4 18 -5,17 5,44 6,00 71,83 -0,64 0,43 4,56 0,31 0,30 0,06Cluster 5 24 9,04 2,17 1,33 26,54 0,91 0,52 4,29 0,60 0,53 0,53Cluster 6 21 9,95 1,29 1,00 13,48 1,45 1,29 5,62 1,60 1,55 1,70
106,0 103,5 106,5 84,3 100,7 72,8 62,2 84,7 91,0 66,40,000 0,000 0,000 0,000 0,000 0,000 0,000 0,000 0,000 0,000
Centroid
Kruskal-Wallis Significance value
Segment 6 includes the 21 countries that occupy the best positions in all indicators: they
present the most democratic systems of the sample and register the highest degree of respect
for civil and political laws; they possess the institutional factors (laws and institutions)
necessary for an effective democratic participation. These countries are the leaders of
democracy and have one of the largest governmental effectiveness, thus can be classified as
Political Vanguard.
Segment 5 gathers the countries that present close profiles of the first Segment, but less
effective on the democratic and of government effectiveness level. They occupy the second
place in all 10 variables, of political nature, considered. It is the Politically Developed
Segment.
Segment 4 includes the 18 countries that present the largest deficit in the democratic
variables: political organization, political rights and freedom of the press and the next to last
place in the voice and accountability indicator. They are characterized by political systems
where the citizens' participation is restricted, there is little objectivity in the media and
limitations to the freedom of expression; the main government leaders' recruitment is
considered to be the least competitive of the sample. In spite of this, they present positive
results in the variables associated to rules of law and government effectiveness, and
corruption doesn't assume a very expressive place. This Segment is named the Political
Effectiveness Segment.
In Segment 3 there are 20 countries that present, in average, the second worst punctuations in
political stability and lack of violence, law and order, rules of law, government effectiveness
and graft, the fourth worst positions in civil freedom, political rights and freedom of the press
but they possess some (although weak) political organization. It is a segment that, in a
summarized way, can be considered as Restricted Governmental Practices.

13
In Segment 2 are the countries that are positioned in the third place relatively to the
democratic variables: political organization, civil freedom, political rights, freedom of press
and voice and accountability; however they present negative indicators thus descending a
position in the variables associated to rules of law, government effectiveness and graft. It is
the Democratic Development Segment.
In Segment 1 are included the countries that present the worst punctuations in terms of
government effectiveness, and the second worst places in democracy terms. This is, therefore,
a segment where there are limitations in the political process, civil freedom and freedom in
developing points of view. These are Democratic Deficit countries.
Figure 1 summarizes the relevant information for the interpretation of the structure of the
formed segments.
-2
-1,5
-1
-0,5
0
0,5
1
1,5
2
Political score Civil liberties Political rights Freedom press Voice andaccountability
Politicalstability and
lack ofviolence
Law and order Rule of law Governmenteffectiveness
Graft
Cluster 1 Cluster 2 Cluster 3 Cluster 4 Cluster 5 Cluster 6
Figure 1: Political factors: centroides of the segments
After an analysis of the mean profiles, it becomes interesting to study the characteristics of
some of the fuzzy classified countries (Figure 2) (i.e., those that share characteristics of more
than one segment), referring the variables where these countries distance themselves from the
centroides of the segments where they were classified and that eventually are share the
characteristics of other segments:
14
- Spain, classified in Segment 6, assumes indicators that distances itself from this group
in the criteria of political stability and lack of violence and law and order, assuming a
similar pattern for these variables as the countries classified in the Segment 5.
- Thailand distances itself from the mean pattern of the countries of Segment 5 when
assuming punctuations similar to those of the countries classified in Segment 2 in
political organization, civil freedoms, political rights and graft; it assumes the second
worst position in political stability and lack of violence and government effectiveness
of Segment 5.
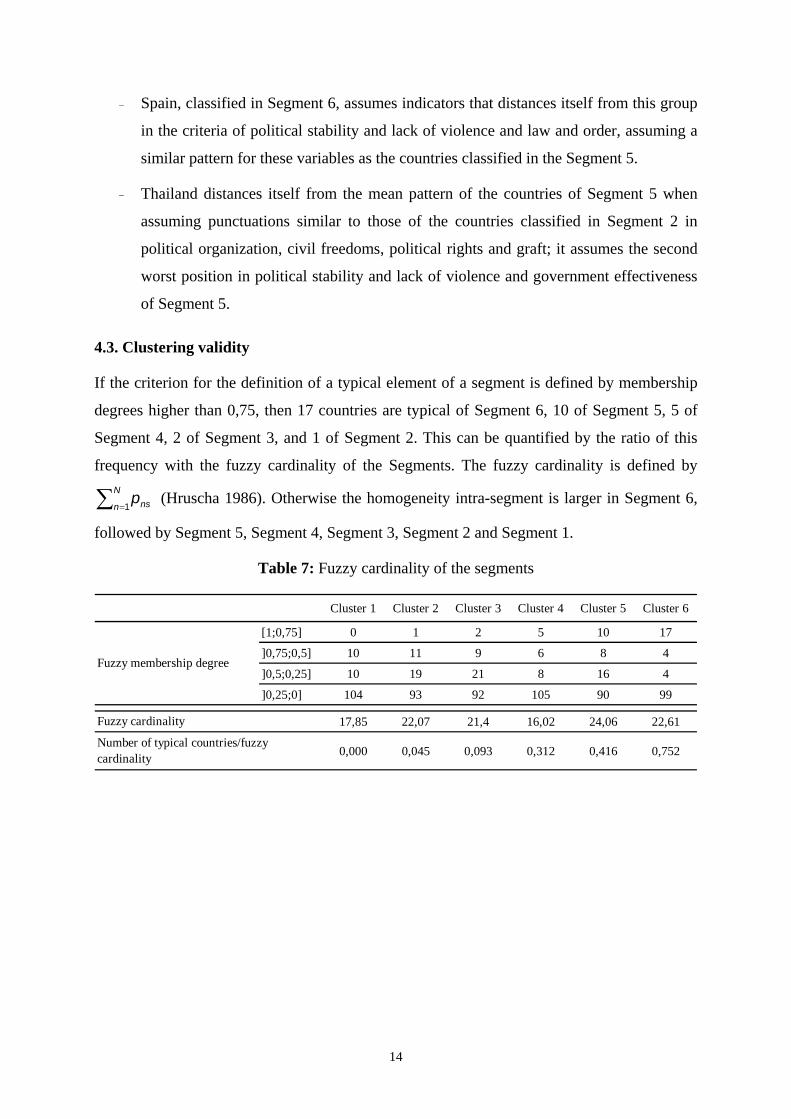
4.3. Clustering validity
If the criterion for the definition of a typical element of a segment is defined by membership
degrees higher than 0,75, then 17 countries are typical of Segment 6, 10 of Segment 5, 5 of
Segment 4, 2 of Segment 3, and 1 of Segment 2. This can be quantified by the ratio of this
frequency with the fuzzy cardinality of the Segments. The fuzzy cardinality is defined by
∑ =
N
n nsp1
(Hruscha 1986). Otherwise the homogeneity intra-segment is larger in Segment 6,
followed by Segment 5, Segment 4, Segment 3, Segment 2 and Segment 1.
Table 7: Fuzzy cardinality of the segments
Cluster 1 Cluster 2 Cluster 3 Cluster 4 Cluster 5 Cluster 6
[1;0,75] 0 1 2 5 10 17
]0,75;0,5] 10 11 9 6 8 4
]0,5;0,25] 10 19 21 8 16 4
]0,25;0] 104 93 92 105 90 99
17,85 22,07 21,4 16,02 24,06 22,61
0,000 0,045 0,093 0,312 0,416 0,752
Fuzzy membership degree
Fuzzy cardinality
Number of typical countries/fuzzy cardinality

15
Australia Korea, Rep. of
Canada Slovakia
Austria Hungary
Denmark Poland
Luxembourg Spain Czech Republic
Norway Cyprus Trinidad and Tobago El Salvador
Netherlands Chile Lithuania Thailand Philippines
United States Estonia South Africa Mexico
Sweden Botswana Croatia Brazil
New Zealand Latvia Namibia Peru
United Kingdom Costa Rica Bulgaria Madagáscar
Iceland Greece Panama Romania
Finland Mongolia Jamaica Dominica Republic
Ireland Slovenia Guiana India
Switzerland Uruguay Senegal
Germany Argentina Malawi
Belgium Italy Nicaragua
Portugal Israel Mozambique
Japan Singapore Bolivia
France Egypt Jordanian Papua New Guinea
Gambia Malaysia Mali
China Ghana
Bahrain Honduras
Saudi Arabia Indonesia
United Arab Emigrates Moldavia
Oman TanzaniaViet name Burkina Faso
Cuba
Tunisia Malaysia Armenia
Morocco Iran, Islamic Rep. of Bangladesh
Kuwait Ethiopia AlbaniaIran, Islamic Rep. of Ukraine
Kyrgyzstan GuatemalaSyria Russian Federation
Libya Paraguay
Guinea Niger
Angola Ecuador
Algeria Uganda Nigeria
Azerbaijan Gabon Venezuela
Cameroon Guinea-Bissau Turkey
Congo Burkina Faso Zambia
Côte d'Ivoire Ethiopia Colombia
Haiti Sri Lanka
Yemen
Myanmar
Tajikistan
Kenya
Sudan
Togo
Zimbabwe
GRO
UP
3
GRO
UP
1G
ROU
P 5
GRO
UP
6
GRO
UP
2
GRO
UP
4
Figure 2: Political factors: segmentation structure

16
5. Political factors: contribution for economic and human development
Here we verify, for the obtained classification structure, if the respective segments appear
associated to different Gross Disposable Income levels per capita, of human development and
gender-related development. In order to accomplish that, the model of multiple lineal
regression is used, considering, as explanatory variables, the dummy variables related to the
segments (5 Dummy variables where Di=1, if the observation belongs to Segment i,
i=1,2,3,4,5; 0, otherwise) and as dependent variables, one at a time, Gross Disposable Income
per capita5, Human Development Index (HDI)6 and Gender-Related Development Index 7
(GDI).
The univariate statistical analysis of the three dependent variables in the sample of 124
countries allows the extraction the following conclusions (Table 7 and Figure 3):
- Gross Disposable Income per capita assumes a left-bias distribution, 50% of the countries
present a higher Gross Disposable Income per capita value than 5878; it possesses an
extreme outlier, Luxembourg, registering a Gross Disposable Income per capita of 50061,
and a moderate outlier, for a Gross Disposable Income per capita of 24142, in the USA; the
mean for 5% is 8502.
- The mean value of HDI is 0,7 and 50% of the countries register values higher than 0,748;
the minimum value is 0,277 (Niger) and the maximum 0,942 (Norway).
- The behavior of the GDI is similar to the HDI. However the mean value (0,708) and the
median (0,716) are smaller, thus suggesting a small inequality between men and women in
the sample.
Table 7: Descriptive statistics
Variable Mean 95% Confidence Interval for mean Median Std.
Deviation Minimum Maximum
GDP pc 9362 [7648;11075] 5878 9640 523 50061
HDI 0,710 [0,679;0,742] 0,748 0,177 0,277 0,942
GDI 0,708 [0,674;0,740] 0,744 0,180 0,263 0,956
5 The Gross Disposable Income per capita is a measurement of a country’s well being. 6 HDI is a summary of three dimensions of the concept human development: live a long and healthy life, be educated and have a dignified lifestyle. It combines life expectancy, education and income. 7 GDI adjusts the HDI to the inequalities between men and women.

17
Figure 3: Boxplot: GDPpc, HDI and GDI
Economic development – Gross Disposable Income per capita
When determining the Gross Disposable Income per capita, we can conclude (equation 1)
that the political segments (through the two dummy variables D1, D2, D3, D4 and D5) are
statistically significant (at 1%) either individually or globally considered. The political
Segments explain 73,4% of the Gross Disposable Income per capita variations. The countries
that present the highest Gross Disposable Income per capita in mean terms are the ones
classified in Segment 6, located in the Political Vanguard, followed by Politically Developed
countries, classified as Segment 5, Political Effectiveness countries (Segment 4), Democratic
Development countries (Segment 2), countries with Restricted Governmental Practices
(Segment 3) and Democratic Deficit countries (Segment 1).
Human development - Human Development Index (HDI)
To evaluate the importance of the political factors in a country’s performance the Human
Development Index, that adjusts the Gross Disposable Income per capita indicator according
to social factors, was also considered. The democratic Segments (equation 2) reveal their
strong explanatory capacity again (their three variables explain about 56,3% of the variations
of HDI). The hierarchy of the HDI mean values remains, in relation to the Gross Disposable
Income per capita (Segment 6-5-4-3-2-1).

18
Table 8: Influence of the politicians in economic performance and human development
Eq. 1 Eq. 2 Eq. 3
GDPpc HDI GDI
Explanatory variables Coefficients.
(p-value)
Coeficients.
(p-value)
Coeficients.
(p-value)
Intercept 26061.86
(0.000)
0.928
(0.000)
0.927
(0.000)
G1 -23628.69
(0.000)
-0.394
(0.000)
-0.414
(0.000)
G2 -22448.94
(0.000)
-0.295
(0.000)
-0.301
(0.000)
G3 -22996.41
(0.000)
-0.332
(0.000)
-0.339
(0.000)
G4 -17677.08
(0.000)
-0.202
(0.000)
-0.213
(0.000)
G5 -14626.77
(0.000)
-0.121702
(0.001)
-0.122982
(0.000)
R2 0.734 0.563 0.568
F 65.265
(0.000)
30.406
(0.000)
29.431
(0.000)
Human development – Gender-Related Development Index (GDI)
Next, the relationship between the political segments and IDH is analyzed and adjusted to the
inequalities between men and women. Once again a statistically significant relationship is
verified, both individually and globally (R2=56,8%). The highest differential between the
mean values of the HDI and the GDI occurs in Segment 1 (IDG=0,512 versus IDH=0,534),
revealing inequalities disfavoring women.
Conclusion
The pioneering work of Lipset (1959) originated a great number of empirical studies about the
relationship between Democracy and Economic Development. Using several methodologies,
the studies are consensual in the results - in sectional terms, a positive but not perfect
correlation exists, between the two variables.
In this work an alternative methodology in the study of the relationship between economic
development and democracy is proposed. The conjugation of a group of data on subjective

19
indicators obtained from the specialists' opinion, related not only to the democratic profile of
the countries, but also to government effectiveness, was an innovation in this type of studies.
Based on this set of 10 variables, we proceeded to the classification of the 124 countries, with
the objective of systemizing the heterogeneity of the sample in relation to political indicators.
The advantages of the fuzzy classification methods are demonstrated (method fuzzy k-means)
in the international classification context, when detecting countries that share characteristics
of more than one segment.
The partition made revealed pertinent because it allows the countries to be grouped according
to their degree of political development based on concrete variables - six segments are
identified, denominated as Political Vanguard (Segment 6), Politically Developed (Segment
5), Political Effectiveness (Segment 4), Restricted Governmental Practices (Segment 3),
Democratic Development (Segment 2) and Democratic Deficit (Segment 1). In hierarchical
terms, the Political Vanguard Segment is followed by the Politically Developed Segment in
the Evaluation of the Government; Segments 4 and 2 share positions amongst themselves, i.e.,
the Political Effectiveness Segment presents a political deficit, but good indicators of
governmental effectiveness, and the Democratic Development Segment presents weak
punctuation in government effectiveness and better punctuation (relative) in the government
indicators. Segments 3 and 1 can again be nested, the Democratic Deficit Segment occupying
the worst positions.
These Segments also implicate the access to certain levels of economic and human
development. The defined hierarchy corresponds to different mean punctuations in the
indicators of economic and human development; surprisingly, in the Segments that share
positions in the hierarchy (4 and 2), the countries that possess better result in the indicators of
government effectiveness (and worse in the democratic indicators) reveal better indicative
means of well-being.
To conclude, in this study evidence of a positive relationship between democracy and
economic and human development was once again demonstrated, thus presenting new
insights for the understanding of the heterogeneity of behaviors in the indicators of the
evaluation of the government.

20
References
Alvarez, M., Cheibud, J.A., Lomongi, F. and Przeworski, A. (1996). “Classifying Political
Regimes”. Studies in International Comparative Development, 31: 3-36.
Arat, Zehra F. (1991). Democracy and Human Rights in Developing Countries. Lynne
Rienner Publishers.
Barro, R. (1991). “Economic Growth in a Cross-Section of Countries”. Quarterly Journal of
Economics. 106 (2): 407-473.
Barro, R. (1996). “Democracy and Growth”. Journal of Economic Growth. 1 (1): 1-27.
Bernhagen, Patrick (2001). “Economic Development and Democracy in Latin America: A
Replication and Extension”.
[http://www.tcd.ie/Political_Science/P.Bernhagen/DemDevExt.pdf]. April 2004.
Bezdek, J. C. (1973). Fuzzy Mathematics in Pattern Classification. Ph.D. Thesis. Applied
Math. Center, Cornell University, Ithaca.
Bezdek, J. C. (1974). “Numerical Taxonomy with Fuzzy Sets”. Journal of Mathematical
Biology. 1 (1): 57-71.
Bollen, K.A. (1980). "Issues in the Comparative Measurement of Political Democracy."
American Sociological Review 80:370-90.
Bollen, K. A. and Paxon, P. (2000). “Subjective Measures of Liberal Democracy”.
Comparative Political Studies 33 :58-86.
Bollen, K.A. (1979). "Political Democracy and the Timing of Development." American
Sociological Review. 44: 572-587.
Bollen, K.A. (1983). “World System Position, Dependency and Democracy: the Cross-
National Evidence”. American Sociological Review 48: 468-479.
Bollen, K.A. and Jackman, Robert (1985). “Political Democracy and the Size Distribution of
Income” American Sociological Review 50:438-57.
Burkhart, R. E. and Lewis-Beck, M. (1994). “Comparative Democracy. The Economic
Development Thesis”. American Political Science Review 88: 903-910.
Coppedge, M. and Reinicke, W. H. (1991). “Measuring Polyarchy”. In Inkeles, A. (eds.) On
Measuring Democracy, Its Consequences and Concomitants. Transactional
Publishers: 47-68.

21
Cutright, Ph. (1963). “National Political Development: Measurement and Analysis”.
American Sociological Review 28: 253-264.
Diamond, L. (1992). “Economic Development and Democracy Reconsidered”. American
Behavioural Scientist 35: 450-499.
Doorenspleet, R. (2001). “Centre-Periphery Relations & Democratization”. Paper presented
at the ECPR Joint Sessions of Workshops, Grenoble, France, April 2001.
Doorenspleet, R. (2000). “Development and Democracy: Power and Problems of Empirical
Research”.
http://www.essex.ac.uk/ecpr/events/jointsessions/paperarchive/copenhagen/ws4/doo
renspleet.PDF. April 2004.
Dunn, J. C. (1974). “A Fuzzy Relative of the ISODATA Process and its Use in Detecting
Compact Well-Separated Clusters”. Journal of Cybernetics 3: 32-57.
Freedom House (2002). “Democracy´s Century. A survey of Global Political Change in the
20th Century”. [www.freedomhouse.org/reports/century.html]. April 2004.
Gasiorowksi, M.J. (1996). “An Overview of the Political Regime Change Dataset”.
Comparative Political Studies 29: 469-483.
Huntington, S.P. (1991). The Third Wave; democratization in the late twentieth century.
University of Oklahoma Press.
Hruschka, H. (1986). “Market Definition and Segmentation Using Fuzzy Clustering
Methods”. International Journal of Research in Marketing 3: 117-134.
Jackman, Robert W. (1973). “On the Relation of Economic Development to Democratic
Performance”. American Journal of Political Science 17: 611-621.
Landam, Todd (1999). “Economic Development and Democracy: the view from Latin
America”. Political Studies 47: 607-626.
Lipset, S. M. (1959). “Some Social Requisites of Democracy: Economic Development and
Political Legitimacy”. American Political Science Review: 53: 69-105.
Lipset, S. M (1994). “The Social Requisites of Democracy Revisited”. American Sociological
Review 59: 1-22.
Lipset, S. M., Seong, K. R. and Torres, J. C. (1993). “A Comparative Analysis of the Social
Requisites of Democracy”. International Social Science Journal 16: 155-175.

22
Neubauer, Daene E. (1967). “Some Conditions of Democracy”. American Political Science
Review 61: 1002-1009.
Olsen, M.E. (1968). “Multivariate Analysis of National Political Development”. American
Sociological Review 33: 699-712.
Perotti, R. (1996). “Growth, Income Distribution, and Democracy: What the Data Say”.
Journal of Economic Growth 1: 149-187.
PNUD - Programa das Nações Unidas para o Desenvolvimento (2002). Relatório do
desenvolvimento humano 2002. Aprofundar a democracia num mundo fragmentado.
Trinova Editora.
Przeworski, A. and Limongi, F. (1997). “Modernization: Theories and Facts”. World Politics,
49: 155-183.
Ramaswamy, S. and Cason, J. (2003). Development and Democracy: New Perspectives or an
Old Debate. Middlebury College Press, University Press of New England.
Rivera, F. F., Zapata, E. L. and Carazo, J. M. (1990). “Cluster Validity Based on the Hard
Tendency of the Fuzzy Classification”. Pattern Recognition Letters, 11: 7-12.
Shen, Jian-Guang (2002). “Democracy and Growth: An alternative Empirical Approach”.
BOFIT Discussion papers n. 13. Bank of Finland Institute for Economies in
Transition.
Tavares, J. and Waczairg, R. (2001). “How Democracy Affects Growth”. European Economic
Review 45: 1341-1378.
Vanhannen (1997). Prospects of Democracy: a Study of 172 Countries. Routledge.

23
Appendix
Indicator Variables Concept measured Source
Competitiveness of chief recruitmentOpenness of chief executive recruitmentConstraints on chief executiveRegulation of participationRegulation of executive recruitmentCompetitiveness of participationFreedom of expression and beliefFreedom of association and organizational rightsRule of law and human rightsPersonal economy and economics rightsFree and fair elections for offices with real powerFreedom of political organizationSignificant oppositionFreedom from domination by powerful groupsautonomy or political inclusion on minority groupsMedia objectivityFreedom of expression and beliefFree and fair electionsFreedom of the pressCivil libertiesPolitical rightsMilitary in politicsChange in governmentTransparency
Business is kept informed of developments in laws and policies
Business ca express its concerns over changes in laws and policies
Political stability and lack of violence
Perceptions of the likelihood of destabilization (ethnic tensions, armed conflict, social unrest, terrorist threat, internal conflict, fractionalization of the political spectrum, constitutional changes, military coups)
World Bank Governance Indicators Dataset
Legal impartialityPopular observance of the lawBlack marketsEnforceability of private government contractsCorruption in bankingCrime and theft as obstacles to businessLosses from and costs of crimeUnpredictability of the judiaryBureaucratic qualityTransaction costsQuality of public health careGovernment stabilityCorruption among public officialsCorruption as an obstacle to business
Frequency of "irregular payments" to officials and judiciary
Perceptions of corruption in-civil serviceBusiness interest payment
Gra
ft
Corruption World Bank Governance Indicators Dataset
World Bank Governance Indicators Dataset
Rul
e of
law
and
gov
ernm
ent e
ffec
tiven
ess
Law and order International Country Risk Guide
Rule of law World Bank Governance Indicators Dataset
Government effectiveness World Bank Governance Indicators Dataset
Dem
ocra
cy
Polity score Polity IV dataset University of Maryland
Civil liberties Freedom House
Political rights Freedom House
Press freedom Freedom House
Voice and accountability

Recent FEP Working Papers
Nº 179 Mário Alexandre Silva and Aurora A. C. Teixeira, A Model of the Learning Process with Local Knowledge Externalities Illustrated with an Integrated Graphical Framework, June 2005
Nº 178 Leonor Vasconcelos Ferreira, Dinâmica de Rendimentos, Persistência da Pobreza e Políticas Sociais em Portugal, June 2005
Nº 177 Carlos F. Alves and F. Teixeira dos Santos, The Informativeness of Quarterly Financial Reporting: The Portuguese Case, June 2005
Nº 176 Leonor Vasconcelos Ferreira and Adelaide Figueiredo, Welfare Regimes in the UE 15 and in the Enlarged Europe: An exploratory analysis, June 2005
Nº 175
Mário Alexandre Silva and Aurora A. C. Teixeira, Integrated graphical framework accounting for the nature and the speed of the learning process: an application to MNEs strategies of internationalisation of production and R&D investment, May 2005
Nº 174 Ana Paula Africano and Manuela Magalhães, FDI and Trade in Portugal: a gravity analysis, April 2005
Nº 173 Pedro Cosme Costa Vieira, Market equilibrium with search and computational costs, April 2005
Nº 172 Mário Rui Silva and Hermano Rodrigues, Public-Private Partnerships and the Promotion of Collective Entrepreneurship, April 2005
Nº 171 Mário Rui Silva and Hermano Rodrigues, Competitiveness and Public-Private Partnerships: Towards a More Decentralised Policy, April 2005
Nº 170 Óscar Afonso and Álvaro Aguiar, Price-Channel Effects of North-South Trade on the Direction of Technological Knowledge and Wage Inequality, March 2005
Nº 169 Pedro Cosme Costa Vieira, The importance in the papers' impact of the number of pages and of co-authors - an empirical estimation with data from top ranking economic journals, March 2005
Nº 168 Leonor Vasconcelos Ferreira, Social Protection and Chronic Poverty: Portugal and the Southern European Welfare Regime, March 2005
Nº 167 Stephen G. Donald, Natércia Fortuna and Vladas Pipiras, On rank estimation in symmetric matrices: the case of indefinite matrix estimators, February 2005
Nº 166 Pedro Cosme Costa Vieira, Multi Product Market Equilibrium with Sequential Search, February 2005
Nº 165 João Correia-da-Silva and Carlos Hervés-Beloso, Contracts for uncertain delivery, February 2005
Nº 164 Pedro Cosme Costa Vieira, Animals domestication and agriculture as outcomes of collusion, January 2005
Nº 163 Filipe J. Sousa and Luís M. de Castro, The strategic relevance of business relationships: a preliminary assessment, December 2004
Nº 162 Carlos Alves and Victor Mendes, Self-Interest on Mutual Fund Management: Evidence from the Portuguese Market, November 2004
Nº 161 Paulo Guimarães, Octávio Figueiredo and Douglas Woodward, Measuring the Localization of Economic Activity: A Random Utility Approach, October 2004
Nº 160 Ana Teresa Tavares and Stephen Young, Sourcing Patterns of Foreign-owned Multinational Subsidiaries in Europe, October 2004
Nº 159 Cristina Barbot, Low cost carriers, secondary airports and State aid: an economic assessment of the Charleroi affair, October 2004
Nº 158 Sandra Tavares Silva, Aurora A. C. Teixeira and Mário Rui Silva, Economics of the Firm and Economic Growth. An hybrid theoretical framework of analysis, September 2004
Nº 157 Pedro Rui Mazeda Gil, Expected Profitability of Capital under

Uncertainty – a Microeconomic Perspective, September 2004
Nº 156 Jorge M. S. Valente, Local and global dominance conditions for the weighted earliness scheduling problem with no idle time, September 2004
Nº 155 João Correia-da-Silva and Carlos Hervés-Beloso, Private Information:Similarity as Compatibility, September 2004
Nº 154 Rui Henrique Alves, Europe: Looking for a New Model, September 2004
Nº 153 Aurora A. C. Teixeira, How has the Portuguese Innovation Capability Evolved? Estimating a time series of the stock of technological knowledge, 1960-2001, September 2004
Nº 152 Aurora A. C. Teixeira, Measuring aggregate human capital in Portugal. An update up to 2001, August 2004
Nº 151 Ana Paula Delgado and Isabel Maria Godinho, The evolution of city size distribution in Portugal: 1864-2001, July 2004
Nº 150 Patrícia Teixeira Lopes and Lúcia Lima Rodrigues, Accounting practices for financial instruments. How far are the Portuguese companies from IAS?, July 2004
Nº 149 Pedro Cosme Costa Vieira, Top ranking economics journals impact variability and a ranking update to the year 2002, June 2004
Nº 148 Maria do Rosário Correia, Scott C. Linn and Andrew Marshall, An Empirical Investigation of Debt Contract Design: The Determinants of the Choice of Debt Terms in Eurobond Issues, June 2004
Nº 147 Francisco Castro, Foreign Direct Investment in a Late Industrialising Country: The Portuguese IDP Revisited, May 2004
Nº 146 Óscar Afonso and Álvaro Aguiar, Comércio Externo e Crescimento da Economia Portuguesa no Século XX, May 2004
Nº 145 Álvaro Aguiar and Manuel M. F. Martins, O Crescimento da Produtividade da Indústria Portuguesa no Século XX, May 2004
Nº 144 Álvaro Aguiar and Manuel M. F. Martins, Growth Cycles in XXth Century European Industrial Productivity: Unbiased Variance Estimation in a Time-varying Parameter Model, May 2004
Nº 143 Jorge M. S. Valente and Rui A. F. S. Alves, Beam search algorithms for the early/tardy scheduling problem with release dates, April 2004
Nº 142 Jorge M. S. Valente and Rui A. F. S. Alves, Filtered and Recovering beam search algorithms for the early/tardy scheduling problem with no idle time, April 2004
Nº 141 João A. Ribeiro and Robert W. Scapens, Power, ERP systems and resistance to management accounting: a case study, April 2004
Nº 140 Rosa Forte, The relationship between foreign direct investment and international trade. Substitution or complementarity? A survey, March 2004
Nº 139 Sandra Silva, On evolutionary technological change and economic growth: Lakatos as a starting point for appraisal, March 2004
Nº 138 Maria Manuel Pinho, Political models of budget deficits: a literature review, March 2004
Nº 137 Natércia Fortuna, Local rank tests in a multivariate nonparametric relationship, February 2004
Nº 136 Argentino Pessoa, Ideas driven growth: the OECD evidence, December 2003
Editor: Prof. Aurora Teixeira ([email protected]) Download available at: http://www.fep.up.pt/investigacao/workingpapers/workingpapers.htm also in http://ideas.repec.org/PaperSeries.html

FEP 2005