democracy at dusk? · liberal democracy – status and trends 08 ... how much does corruption in...
TRANSCRIPT

Democracy at Dusk?V-Dem AnnuAl RepoRt 2017
I N S T I T U T EVa r ie t ies of D e m o cr acy


Table of Contents
IntRoDuCtIonA woRD fRom the DIReCtoR
V-Dem In A nutShellV-Dem In numbeRS, methoDology & Key CollAboRAtIonS
0605
SeCtIon 1lIbeRAl DemoCRACy – StAtuS AnD tRenDS
08
SeCtIon 2eleCtoRAl DemoCRACy: StAtuS AnD tRenDS
16
SeCtIon 3the lIbeRAl pRInCIple of DemoCRACy: StAtuS AnD tRenDS
22
SeCtIon 4the egAlItARIAn pRInCIple of DemoCRACy: StAtuS AnD tRenDS 32
SeCtIon 5the pARtICIpAtoRy pRInCIple of DemoCRACy: StAtuS AnD tRenDS 36
SeCtIon 6the DelIbeRAtIVe pRInCIple of DemoCRACy: StAtuS AnD tRenDS 40
CountRy SCoReS2016 SCoReS
44
AppenDIxRefeRenCeS
56
produced by the V-Dem Institute V-Dem Annual Report team: Anna Lührmann (Lead
Author and Coordination), Staffan I. Lindberg, Valeriya
Mechkova, Moa Olin, Francesco Piccinelli Casagrande,
Constanza Sanhueza Petrarca, Laura Saxer
V-Dem Data and management team: Joshua Krusell,
Johannes von Römer, Kyle Marquardt, Fahrhad Miri, Dan
Pemstein, Josefine Pernes, Natalia Stepanova, Eitan Tzelgov,
Yi-ting Wang, Brigitte Zimmermann
editing/proof-Reading: John Jennings, Virginia Langum
Design: Anders Wennerström, Spiro Kommunikation AB
printing: Response Tryck, Borås
June 2017 (Version 2)
V-Dem Institute: Department of Political Science
University of Gothenburg
Sprängkullsgatan 19, PO 711
SE 405 30 Gothenburg Sweden
+46 (0) 31 786 30 43
www.v-dem.net
facebook.com/vdeminstitutetwitter.com/vdeminstitute website: www.v-dem.net
follow uSon SoCIAl meDIA
V-Dem is a new approach to conceptualizing and measuring democracy. The project’s multidimensional, nuanced and disaggregated approach acknowledges the complexity of the concept of democracy.
V-Dem is or has been funded by (not in order of magnitude): the European Union/the European Commission, the European Research Council, Riksbankens Jubileumsfond, the
Ministry of Foreign Affairs-Sweden, the Swedish Research Council, Marianne & Marcus Wallenberg Foundation, International IDEA, the Ministry of Foreign Affairs-Denmark,
the Danish Research Council, the Canadian International Development Agency, NORAD/the Norwegian Research Council, Aarhus University, Fundação Francisco Manuel dos
Santos, Mo Ibrahim Foundation, Knut & Alice Wallenberg Foundation and the Quality of Government Institute, with co-funding from University of Gothenburg and University
of Notre Dame.
This publication has been produced with the assistance of the European Union. The contents of this publication are the sole responsibility of the V-Dem Institute and can in no
way be taken to reflect the views of the European Union or any other donor.
It IS my pleASuRe to introduce the very first Varieties of Democ-
racy (V-Dem) Annual Report. As many of you already know, V-Dem
is a new approach to conceptualizing and measuring democracy.
Acknowledging the complexity of democracy as a system of rule
that goes beyond the simple presence of elections, we adopt a mul-
tidimensional and disaggregated approach. V-Dem is one of the
largest-ever social science data collection efforts, involving almost
3,000 scholars from over 170 countries and utilizing cutting-edge
social science methodologies to produce a database containing
about 18 million data points.
With this annual report we release the new version 7.0 of the data,
covering 177 countries, 117 years, and more than 350 indicators, as
well as 52 indices measuring varying aspects of democracy. Most of
these data are also made available for online analysis on our web-
page https://v-dem.net, where users, including those without a sta-
tistical background, can produce and download their own graphs
without having to download the entire dataset.
Sadly, our first annual report comes at a time when democracy and
freedom are challenged in many countries. This makes our efforts at
measuring hundreds of aspects of democracy even more important.
To what extent are legislatures actually using their powers to hold
the executive to account? How much self-censorship is the media
exercising? To what degree are women denied their formal civil or
political rights? How much does corruption in the judiciary under-
mine the rule of law? These are critical aspects of any system aspiring
to be democratic. Yet, before V-Dem, there were no reliable meas-
ures that both covered most countries and did so over a sufficiently
long period of time to enable robust analysis.
To adequately portray the long and complex road leading
up to this point would require far more space than is al-
lowed. Suffice it to say that my co-Principal Investigators,
(Michael Coppedge, John Gerring, Svend-Erik Skaaning,
and until 2016, Jan Teorell); the 14 Project Managers; the
31 Regional Managers; the 8 current and past post-
doctoral researchers; the thousands of country
experts; and our amazing core team at the
V-Dem Institute, led by Josefine Pernes and
Natalia Stepanova, have together made
this happen over the past six years. So
many people have contributed so much to
the project that it is impossible to give due
credit to everyone here, but please trust
me when I say that we recognize and value
every one of you immensely.
Our ambition is to provide the most comprehensive and reliable
data on democracy and related issues that social science can pro-
duce, while being fully transparent on all aspects of data collection,
processing, and aggregation. In this light, we are very proud that
in 2016, V-Dem received the most prestigious award for compara-
tive datasets in political science: the Lijphart/Przeworski/Verba Best
Dataset Award presented by the American Political Science Associa-
tion, Comparative Politics Section.
I am also proud that V-Dem has managed not only to produce an
infrastructure for research that is now being used by tens of thou-
sands of scholars, but which is also becoming a key resource for pol-
icymakers and practitioners. This is something we always strive for
– to be of use to the “real” world beyond academia. Today, interna-
tional actors such as the World Bank, UNDP, Transparency Interna-
tional, and International IDEA, as well as local/regional actors such
as Bibliotecha Alexandria and the Mo Ibrahim Foundation, are using
V-Dem data in their work. This is very gratifying to us.
This report provides some highlights from our newest version of the
data (7.0). The main focus is on democracy and where democracy is
heading in the world today. Are we seeing a trend towards backslid-
ing as some have warned in recent years, or is it merely a question
of stagnation? Some countries make advances while others suffer
setbacks. Meanwhile, certain areas of democracy have declined in
recent years whereas others continue to improve. This annual report
seeks to clarify these issues and thus serve as an entry point to the
world of V-Dem’s 18 million data points, whilst also showing what
the world looks like today in light of the last 117 years.
I would also like to express our collective gratitude to all
those showing an interest in V-Dem and this report. We
hope that you will find it useful. Let me end by once
again expressing my sincerest thanks both to those who
have contributed and those who continue to contribute
to the V-Dem venture. Thank you.
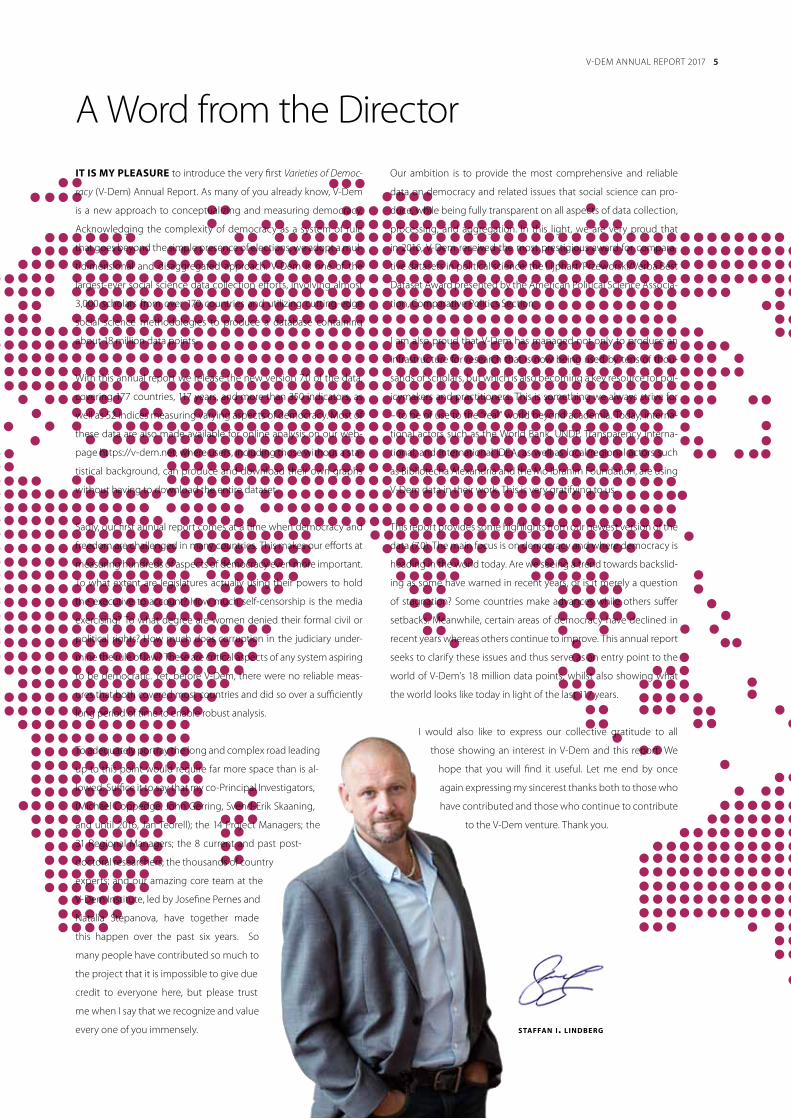
staffan i. lindberg
A Word from the Director
V-DEM ANNUAL REPORT 2017 5
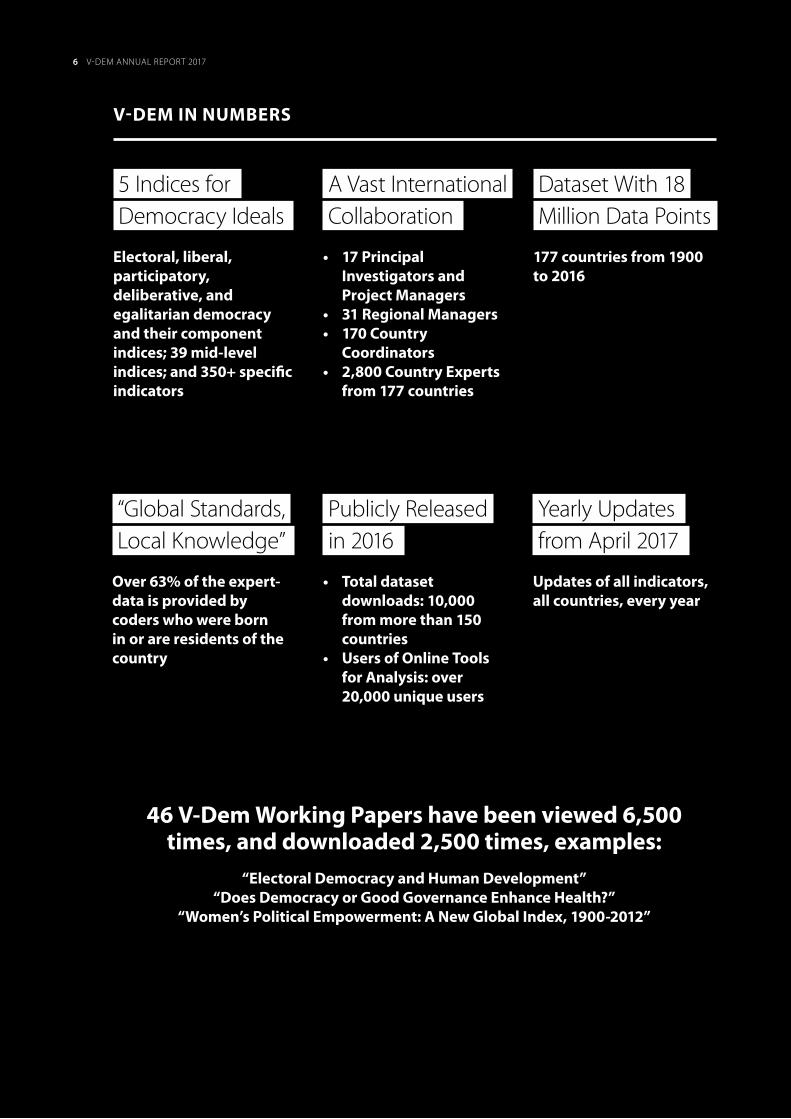
V-Dem In numbeRS
Dataset With 18 Million Data Points
177 countries from 1900 to 2016
“Global Standards, Local Knowledge”
over 63% of the expert-data is provided by coders who were born in or are residents of the country
Publicly Released in 2016
• Totaldatasetdownloads: 10,000 from more than 150 countries
• UsersofOnlineToolsfor Analysis: over 20,000 unique users
Yearly Updates from April 2017
updates of all indicators, all countries, every year
46 V-Dem working papers have been viewed 6,500 times, and downloaded 2,500 times, examples:
“electoral Democracy and human Development”“Does Democracy or good governance enhance health?”
“women’s political empowerment: A new global Index, 1900-2012”
5 Indices for Democracy Ideals:
5 Indices for Democracy Ideals
electoral, liberal, participatory, deliberative, and egalitarian democracy and their component indices; 39 mid-level indices; and 350+ specific indicators
A Vast International Collaboration
• 17PrincipalInvestigators and project managers
• 31RegionalManagers• 170Country
Coordinators• 2,800CountryExperts
from 177 countries
6 V-DEM ANNUAL REPORT 20176

V-Dem methoDology
V-Dem draws on theoretical and methodological expertise from its worldwide team to produce data in the most objective and reliable way possible. Approximately half of the indicators in the V-Dem dataset are based on factual information obtainable from official documents such as constitutions and government records. the remainder consists of more subjective assessments on topics like democratic and governing practices and compliance with de jure rules. on such issues, typically five experts provide ratings for the country, thematic area and time period for which they have expertise. to address variation in coder ratings, V-Dem works closely with leading social science research methodologists and has developed a state of the art bayesian measurement
model that, to the extent possible, addresses coder error and issues of comparability across countries and over time. V-Dem also provides upper and lower point estimates, which represent a range of probable values for a given observation. when the ranges of two observations do not overlap, we are relatively confident that difference between them is significant.1 V-Dem is continually experimenting with new techniques and soliciting feedback from experts throughout the field. In this sense, V-Dem is at the cutting edge of developing new and improved methods to increase both the reliability and comparability of expert survey data.2 V-Dem also draws on the team’s academic expertise to develop theoretically informed techniques for aggregating indicators into mid- and high-level indices.3
Key CollAboRAtIonS AnD foRumS
International IDEA
production of different types of reports and briefs, joint conferences, publications, consultancies, and outreach as well as dissemination activities
UNDP’s Work With the SDGs (Goal 16)
V-Dem was included in a Virtual network consisting of a broad range of international actors, the task of which was to propose how the new goals should be measured and evaluated. the final proposal that is to be reviewed by the Secretariat includes 60 V-Dem indicators.
Communities of Democracies (CoD)
V-Dem will over the coming years be one of CoD’s main partners when it comes to constructing a democracy measure based on their warsaw Declaration, as well as provision of data for that measure and joint dissemination activities.
1. For the individual indicators, these estimates are based on the confidence interval (highest posterior density) in which the measurement model places 68 percent of the probability mass for each country-year score, which is approximately equivalent to one standard deviation upper and lower bounds. For the aggregated indices the confidence bands are based on one standard deviation. 2. For more details see Pemstein et al. (2015). 3. See Coppedge et al. (2016).
Direct Interaction With: oeCD / DAC, fordi, epD, unDp, un Democracy fund, Ipu, Council of europe, Korea Democracy fund, ebA, uSAID, and the european endowment for Democracy, among others.
World Bank/World Development Report (WDR) 2016/17:
provision of special expert-survey data; background paper on accountability mechanisms; and inclusion of data in wDR.
V-Dem Data will be Included in:
Democracy or other measures by International IDeA, Community of Democracies, tI’s CpI, mo Ibrahim Index of African governance, and the world bank governance Indicators.
V-DEM ANNUAL REPORT 2017 77

I s there evidence of a global democratic backslide? the answer is, unfortunately, yes. the average level of democracy in the world seems to have regressed back to, roughly speaking, where it was some 10 to 15 years ago. even if this change falls within the confidence levels, the trend in the data is worrisome. At the same time,
the decline is moderate and there is still much more democracy in the world today than before the end of the Cold war.
Section 1: Liberal Democracy – Status and Trends
fIguRe 1.1: StAte of lIbeRAl DemoCRACy In the woRlD 2016
0 0.1 0.1 0.3 0.4 0.5 0.6 0.7 0.8 0.9 1
Note: The map depicts V-Dem’s Liberal Democracy Index ranging from 0 (not democratic) to 1 (fully democratic). V-Dem Data Set Version 7.
thIS AnAlySIS AnD RepoRt are based on the largest-ever de-
mocracy database in the world: V-Dem, with over 18 million data
points on democracy across 350 highly specific indicators. Released
in May this year, Version 7.0 covers 177 countries until the end of
2016.1 Hence, we can now adjudicate what has been intensely de-
bated over the past few years: the state of democracy in the world
and whether the world is in a democratic recession.2 V-Dem likely
provides the most accurate rendering of the world so far in terms of
the concepts of electoral and liberal democracy.
What is the state of democracy in the world as of the end of 2016?
Figure 1.1 portrays the level of liberal democracy in the world in
2016 based on the Varieties of Democracy (V-Dem) Liberal Democ-
racy Index (LDI), where each quintile on the 0-1 scale has its own
color-code. It presents the state of democracy in the world in broad
strokes and does not take into account the confidence intervals
around each country’s point estimate found in the data. Figure 1.3
and the Appendix of this report give more detailed information on
each country’s score.
1. V-Dem Codebook V7; V-Dem Data Set V7; Pemstein et al. 2017.
2. The 2008 Freedom House report on “Global Freedom in Retreat” sparked a lively debate on the state and future of democracy, where several authors expressed concerns, e.g. Foa and Mounk 2017; Bermeo 2016; Diamond 2015. Others are more optimistic and emphasize the continuously large number of democracies in the world, such as Levitsky and Way 2015; Merkel 2010; Erdmann 2011; Norris 2017.
8 V-DEM ANNUAL REPORT 2017
0 0.1 0.1 0.3 0.4 0.5 0.6 0.7 0.8 0.9 1
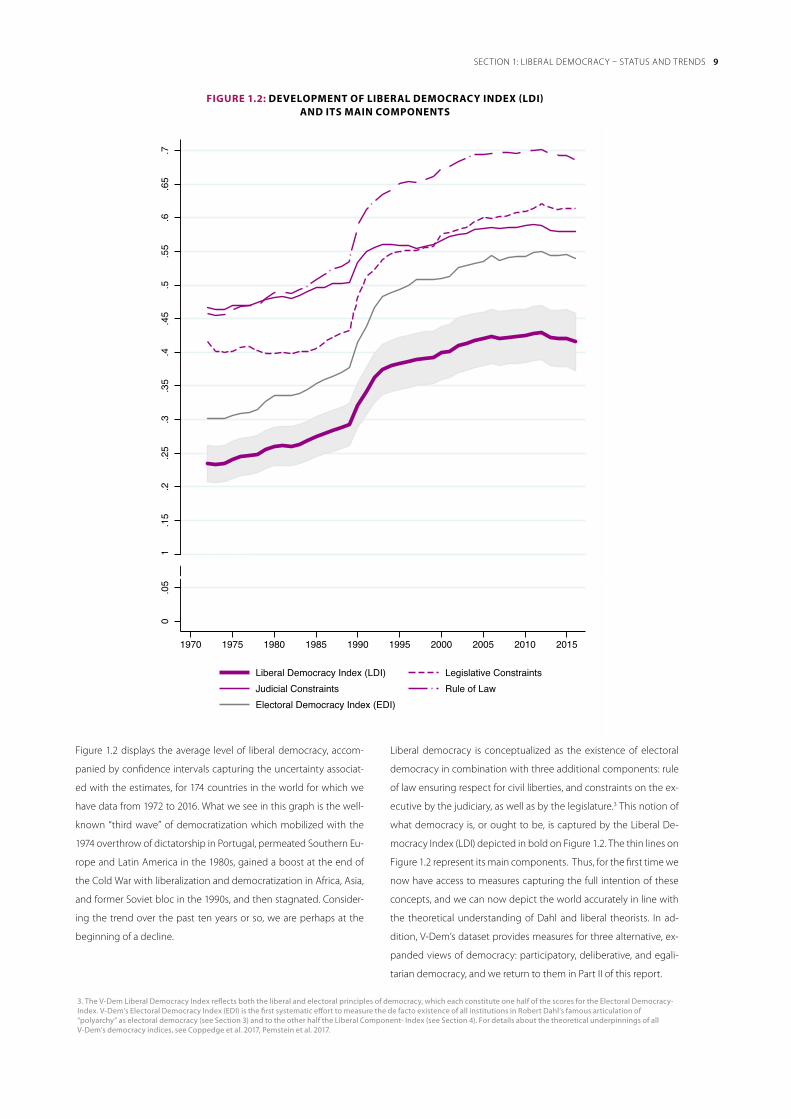
Figure 1.2 displays the average level of liberal democracy, accom-
panied by confidence intervals capturing the uncertainty associat-
ed with the estimates, for 174 countries in the world for which we
have data from 1972 to 2016. What we see in this graph is the well-
known “third wave” of democratization which mobilized with the
1974 overthrow of dictatorship in Portugal, permeated Southern Eu-
rope and Latin America in the 1980s, gained a boost at the end of
the Cold War with liberalization and democratization in Africa, Asia,
and former Soviet bloc in the 1990s, and then stagnated. Consider-
ing the trend over the past ten years or so, we are perhaps at the
beginning of a decline.
Liberal democracy is conceptualized as the existence of electoral
democracy in combination with three additional components: rule
of law ensuring respect for civil liberties, and constraints on the ex-
ecutive by the judiciary, as well as by the legislature.3 This notion of
what democracy is, or ought to be, is captured by the Liberal De-
mocracy Index (LDI) depicted in bold on Figure 1.2. The thin lines on
Figure 1.2 represent its main components. Thus, for the first time we
now have access to measures capturing the full intention of these
concepts, and we can now depict the world accurately in line with
the theoretical understanding of Dahl and liberal theorists. In ad-
dition, V-Dem’s dataset provides measures for three alternative, ex-
panded views of democracy: participatory, deliberative, and egali-
tarian democracy, and we return to them in Part II of this report.
0.0
5.1
.15
.2.2
5.3
.35
.4.4
5.5
.55
.6.6
5.7
1970 1975 1980 1985 1990 1995 2000 2005 2010 2015
Liberal Democracy Index (LDI) Legislative ConstraintsJudicial Constraints Rule of LawElectoral Democracy Index (EDI)
V-Dem In numbeRS
fIguRe 1.2: DeVelopment of lIbeRAl DemoCRACy InDex (lDI) AnD ItS mAIn ComponentS
3. The V-Dem Liberal Democracy Index reflects both the liberal and electoral principles of democracy, which each constitute one half of the scores for the Electoral Democracy- Index. V-Dem’s Electoral Democracy Index (EDI) is the first systematic effort to measure the de facto existence of all institutions in Robert Dahl’s famous articulation of “polyarchy” as electoral democracy (see Section 3) and to the other half the Liberal Component- Index (see Section 4). For details about the theoretical underpinnings of all V-Dem’s democracy indices, see Coppedge et al. 2017, Pemstein et al. 2017.
9SECTION 1: LIBERAL DEMOCRACY – STATUS AND TRENDS

fIguRe 1.3: CountRIeS by SCoRe on V-Dem’S lIbeRAl DemoCRACy InDex 2006 AnD 2016
Note: The figure depicts V-Dem’s Liberal Democracy Index (LDI) ranging from 0 (not democratic) to 1 (fully democratic). V-Dem Data Set Version 7. Advancers are countries that improved their LDI score from 2006 to 2016 at a statistically significant level whereas the LDI score for backsliders declined.
10 SECTION 1: LIBERAL DEMOCRACY – STATUS AND TRENDS

11SECTION 1: LIBERAL DEMOCRACY – STATUS AND TRENDS

Notwithstanding the near constant world average of the key V-Dem
Indices over the last decades, country-level volatility has increased.
Figure 1.4 illustrates this varying volatility by showing the number of
countries for which the LDI record registers statistically significant
changes over the last five and ten years respectively. By this meas-
ure, the height of the third wave occurred in 1993-1994 when over
60 countries made significant advances on the LDI each year com-
pared to only 4 countries sliding back.
In fact, this predominance of democratic advances over setbacks
has persisted every year to varying degrees since 1978: the num-
ber of countries improving always exceeded the number of coun-
tries with declines. The trend reversed in 2013 when the number of
countries backsliding on the LDI started to outnumber the countries
with significant progression. In 2016, this measure counts 21 coun-
tries that regressed compared to their 2011-levels on the LDI, while
13 countries improved (Figure 1.4.1).
3025
2015
105
05
1015
2025
3035
4045
5055
6065
7075
80N
umbe
r of C
ount
ries
1970 1975 1980 1985 1990 1995 2000 2005 2010 2015
Advancers Backsliders
1.4.1 Change over the prior 5 Years, by Year
3025
2015
105
05
1015
2025
3035
4045
5055
6065
7075
80N
umbe
r of C
ount
ries
1970 1975 1980 1985 1990 1995 2000 2005 2010 2015
Advancers Backsliders
1.4.2 Change over the prior 10 Years, by Year
4. We thank Michael Coppedge for the inspiration to use this plot.
The portrayed volatility is moderated when we calculate chang-
es within countries over a ten year period instead of five. With this
measure, the third wave continued with unabated strength until the
early 2000s and while it seems to have stagnated, the number of
countries improving – 23 – still outnumbers those declining – only
19 – in 2016 (Figure 1.4.2).
To summarize the recent trajectory of democracy: more countries
experienced significant democratic backsliding than improvement
over the last 5 years, suggesting a decline in democracy. However,
over the past 10 years, the balance of countries experiencing demo-
cratic gains and setbacks remains slightly positive.
Aggregates of average levels of democracy and volatility of changes
are useful to describe overall patterns but disguise varying country
trajectories. Figure 1.5 provides a country-by-country comparison
by plotting LDI point estimates of the level of liberal democracy in
2006 on the x-axis versus the level of liberal democracy in 2016 on
the y-axis.4 Countries above the diagonal line have thus improved
significantly and countries below the diagonal line have fallen back.
From this perspective, the dynamics play out differently by region.
Many of the countries advancing democracy in the last 10 years are
found in Africa (blue dots), with 10 countries improving and 2 coun-
tries declining in that region. Nigeria’s noticeable enhancement of
the freedom and fairness of its elections in recent years, which led to
the country’s first peaceful alternation in power in 2015, is a case in
point. Burkina Faso is another example where elections in 2012 and
2015 improved its earlier record substantially.
Asia Pacific (purple dots) is a second region where positive changes
outweigh backslides: five countries improved significantly over the
last ten years and three countries regressed. Among the five, we find
Bhutan, Nepal, and Myanmar, which introduced relatively competi-
tive multi-party elections to appoint the chief executive, even if My-
anmar is far from qualifying as a democracy proper.
fIguRe 1.4: numbeR of CountRIeS wIth SIgnIfICAnt ChAngeS on the lIbeRAl DemoCRACy InDex (lDI) 1972 to 2016
12 SECTION 1: LIBERAL DEMOCRACY – STATUS AND TRENDS
Tajikistan
Russia
Hungary
Serbia
Georgia
Kyrgyzstan
Romania
Poland
Ukraine
Macedonia
Bolivia
Ecuador
Brazil
Nicaragua
Yemen
LibyaTurkey
Tunisia
CAR
Togo
Zambia
Nigeria
Burkina Faso
Burundi
Bangladesh
Thailand
Nepal Sri Lanka
Myanmar
Bhutan
0.2
.4.6
.81
Libe
ral D
emoc
racy
201
6
0 .2 .4 .6 .8 1Liberal Democracy 2006
Eastern Europe and Central Asia Latin America and the CaribbeanMENA Sub−Saharan AfricaWestern Europe and North America Asia−Pacific
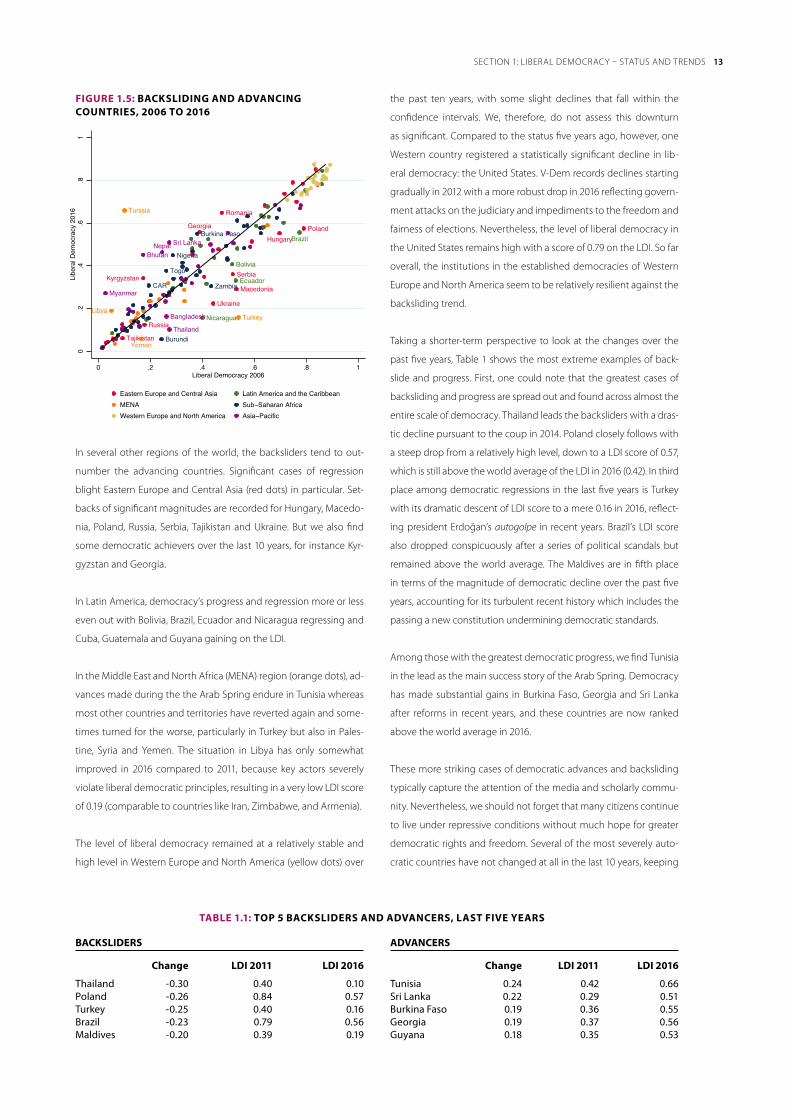
fIguRe 1.5: bACKSlIDIng AnD ADVAnCIng CountRIeS, 2006 to 2016
In several other regions of the world, the backsliders tend to out-
number the advancing countries. Significant cases of regression
blight Eastern Europe and Central Asia (red dots) in particular. Set-
backs of significant magnitudes are recorded for Hungary, Macedo-
nia, Poland, Russia, Serbia, Tajikistan and Ukraine. But we also find
some democratic achievers over the last 10 years, for instance Kyr-
gyzstan and Georgia.
In Latin America, democracy’s progress and regression more or less
even out with Bolivia, Brazil, Ecuador and Nicaragua regressing and
Cuba, Guatemala and Guyana gaining on the LDI.
In the Middle East and North Africa (MENA) region (orange dots), ad-
vances made during the the Arab Spring endure in Tunisia whereas
most other countries and territories have reverted again and some-
times turned for the worse, particularly in Turkey but also in Pales-
tine, Syria and Yemen. The situation in Libya has only somewhat
improved in 2016 compared to 2011, because key actors severely
violate liberal democratic principles, resulting in a very low LDI score
of 0.19 (comparable to countries like Iran, Zimbabwe, and Armenia).
The level of liberal democracy remained at a relatively stable and
high level in Western Europe and North America (yellow dots) over
the past ten years, with some slight declines that fall within the
confidence intervals. We, therefore, do not assess this downturn
as significant. Compared to the status five years ago, however, one
Western country registered a statistically significant decline in lib-
eral democracy: the United States. V-Dem records declines starting
gradually in 2012 with a more robust drop in 2016 reflecting govern-
ment attacks on the judiciary and impediments to the freedom and
fairness of elections. Nevertheless, the level of liberal democracy in
the United States remains high with a score of 0.79 on the LDI. So far
overall, the institutions in the established democracies of Western
Europe and North America seem to be relatively resilient against the
backsliding trend.
Taking a shorter-term perspective to look at the changes over the
past five years, Table 1 shows the most extreme examples of back-
slide and progress. First, one could note that the greatest cases of
backsliding and progress are spread out and found across almost the
entire scale of democracy. Thailand leads the backsliders with a dras-
tic decline pursuant to the coup in 2014. Poland closely follows with
a steep drop from a relatively high level, down to a LDI score of 0.57,
which is still above the world average of the LDI in 2016 (0.42). In third
place among democratic regressions in the last five years is Turkey
with its dramatic descent of LDI score to a mere 0.16 in 2016, reflect-
ing president Erdoğan’s autogolpe in recent years. Brazil’s LDI score
also dropped conspicuously after a series of political scandals but
remained above the world average. The Maldives are in fifth place
in terms of the magnitude of democratic decline over the past five
years, accounting for its turbulent recent history which includes the
passing a new constitution undermining democratic standards.
Among those with the greatest democratic progress, we find Tunisia
in the lead as the main success story of the Arab Spring. Democracy
has made substantial gains in Burkina Faso, Georgia and Sri Lanka
after reforms in recent years, and these countries are now ranked
above the world average in 2016.
These more striking cases of democratic advances and backsliding
typically capture the attention of the media and scholarly commu-
nity. Nevertheless, we should not forget that many citizens continue
to live under repressive conditions without much hope for greater
democratic rights and freedom. Several of the most severely auto-
cratic countries have not changed at all in the last 10 years, keeping
bACKSlIDeRS
Change lDI 2011 lDI 2016
Thailand -0.30 0.40 0.10Poland -0.26 0.84 0.57Turkey -0.25 0.40 0.16Brazil -0.23 0.79 0.56Maldives -0.20 0.39 0.19
ADVAnCeRS
Change lDI 2011 lDI 2016
Tunisia 0.24 0.42 0.66Sri Lanka 0.22 0.29 0.51Burkina Faso 0.19 0.36 0.55Georgia 0.19 0.37 0.56Guyana 0.18 0.35 0.53
tAble 1.1: top 5 bACKSlIDeRS AnD ADVAnCeRS, lASt fIVe yeARS
13SECTION 1: LIBERAL DEMOCRACY – STATUS AND TRENDS

their citizens in an “autocracy trap.” Among these we find, for in-
stance, North Korea, Eritrea, Turkmenistan, China, Azerbaijan, Saudi
Arabia, and Qatar.
We have focused the analysis in this section on the V-Dem Liberal
Democracy Index, which reflects both the liberal and the elector-
al principles of democracy. Figure 5 illustrates the average devel-
opment of the other principles of democracy – egalitarian, partici-
patory and deliberative, which we introduce and analyze more in
depth in the subsequent sections. It is important to note that all of
these component indices have improved on world average over the
course of the last 100 years although in different patterns. The elec-
toral, deliberative and participatory components improved relative-
ly continuously. The liberal component was already at a relatively
high average level at the beginning of the last century, demonstrat-
ing the early advancements in rule of law and legislative oversight in
several countries. The egalitarian component improved monumen-
tally between the end of World War II and 1974 –probably reflecting
the improvements in the inclusiveness of political systems in several
countries.
fIguRe 1.6: woRlD AVeRAgeS on V-Dem’S DemoCRAtIC Component InDICeS
Electoral Democracy
Liberal Component
Egalitarian ComponentParticipatory Component
Deliberative Component
.2
.4
.6
.8
1
1916 19451974 19902016
5. Youngs and Carothers 2017
not tolling the Death Knell…Democracy is facing challenges across the world, yet we argue that
alarmist reports about a global demise of democracy are not war-
ranted. The average levels of democracy in the world are still close
to their highest ever recorded level even if a slight (statistically insig-
nificant) decline may be detectable over the last few years. At the
same time, we find grounds to be worried when providing the more
nuanced picture called for by Carothers and Youngs for example.5
Several countries (e.g. South Korea, Hungary, Poland, Brazil) have re-
ceded considerably over the past decade, while as of yet are still
democratic. Other countries have fallen to levels so low on the LDI
that we can safely speak of democratic breakdown (e.g. Turkey, Ven-
ezuela, Ukraine).
Yet, it seems that the normative power of democracy remains rela-
tively strong. Even dictators continue to try to disguise their repres-
sive regimes with de jure democratic practices such as multiparty
elections and even strive to strengthen such facades by engaging
less frequently in irregularities and intimidation. As one example,
President Erdogan of Turkey sought to legitimize his autogolpe with
the (widely criticized) popular referendum held on April 17, 2017.
During the last decade, we have also witnessed some success sto-
ries in unlikely places: in Nigeria, with the first peaceful alternation
in power following the elections in 2015 and in Tunisia, with what
can clearly be identified as a transition to democracy following the
2011 uprising setting off the Arab Spring. In 2006, Tunisia was ruled
by Ben Ali, one of the most repressive dictators in the Middle East
and North Africa region. By 2016, the country has seen two peaceful
changes in power and fairly widespread freedoms, even if elections
at the local level still have not been held and there are periods of
emergency rule.
On balance, we may be at a watershed for democracy. Various de-
velopments – the rise of intolerance and right-wing populism call-
ing for various forms of more “illiberal” democracy in many estab-
lished democracies; the gradual erosion of democratic rights and
institutions in a series of newer democracies; relapses to harsh elec-
toral autocracy in places such as Russia, Venezuela, and Turkey, and
increasing repression in countries such as Burundi, Tajikistan, and
Thailand – suggest a global challenge to, and perhaps the future
demise of, democracy.
On the other side of the scale, other conditions – the possible re-
treat of the illiberal populist wave of the first years of the century in
Latin America; the visible mobilization of pro-democratic forces in
the United States, Europe and in parts of Africa and Asia; the robust
democratic stability of a majority of countries – promise a brighter
democratic future. Or, in another ten years time, the world may still
be in approximately the same state we find it today. Whatever the
case may be, the analyses presented in this 2017 V-Dem Annual Re-
port demonstrate that it is premature to toll the death-knell for de-
mocracy just yet.
14 SECTION 1: LIBERAL DEMOCRACY – STATUS AND TRENDS

“The V-Dem indicator of government attacks on the judiciary, which reveals government rhetoric calling into question the integrity of the judiciary, dropped precipitously in 2010, likely reflecting President Barack Obama’s State of the Union address in which he criticized the Supreme Court’s decision in Citizens United vs. Federal Election Commission. President Donald Trump has sharply increased the pointedness of verbal attacks on the judiciary, referring to one of the judges who blocked his first executive order on immigration as a “so-called judge.” Pub-lic criticism of the judiciary can be a healthy part of maintain-ing the balance between judicial independence and judicial accountability. Yet it can also be part of an unraveling of core checks on power. Coupled with the politicization of the judicial nominations process and the dismantling of super-majoritarian rules of appointing all Article III judges, supporters of democ-racy would be wise to pay close attention to executive-judicial relations in the United States.”
01
23
4
2006 2007 2008 2009 2010 2011 2012 2013 2014 2015 2016
Government attachks on judiciary Educational equality
Jeffrey StatonV-Dem Project Manager on the Judiciary
“The Russian government has continued to grow more authori-tarian during the last decade. This trend is attributable, in part, to increased government restrictions on alternative sources of information and civic activity. In 2011 and 2012 there were mass protests of Vladimir Putin’s plans to again seek the presi-dency and electoral fraud. Putin’s administration responded by cracking down on critical journalists, civic groups, and protest activities. Nonetheless, one of the few remaining prominent opposition voices, Aleksei Navalny, managed to organize in the spring of 2017 mass protests of government corruption. Unu-sual in many respects, including in their size and involvement of youth, these protests may herald a new stage in opposition politics.”
0.2
.4.6
.81
2000 2003 2006 2009 2012 2015
Core Civil Society Index Alternative Sources of InformationLegislative Constraints on the Executive
Kelly mcmannV-Dem Project Manager on Subnational Government
unIteD StAteSDemocratic backsliding?
RuSSIAContinued Autocratization
15IN THE SPOTLIGHT

for several decades, scholars and practitioners alike have depicted democracy in the world as though the extant measures really captured what is meant by the concept “electoral democracy”. yet, we have all known that they did not.1 V-Dem is the first systematic effort to measure the de facto existence of all the institutions
in Robert Dahl’s famous articulation of “polyarchy” as electoral democracy. the V-Dem electoral Democracy Index (eDI) captures not only the extent to which regimes hold clean, free and fair elections, but also their actual freedom of expression, alternative sources of information, and association, as well as male and female suffrage and the degree to which government policy is vested in elected political officials (figure 2.1).
Section 2: The Electoral Principle of Democracy – Status and Trends
1. For details on this discussion, see Coppedge et al. 2017. 2. Dahl 1971; Dahl 1998; V-Dem Codebook V7; V-Dem Data Set V7; Coppedge et al. 2016.
the eDI IS bASeD on separate indices for each of those institu-
tions, which in turn are aggregated from 41 highly specific indica-
tors: the clean elections index (v2xel_frefair) captures the freedom
and fairness of elections including the absence of registration fraud,
systematic irregularities, government intimidation of the opposi-
tion, vote buying, and election violence, as well as the capacity and
autonomy of the election management body. The freedom of as-
sociation index (v2x_frassoc_thick) indicates the extent to which
parties, including opposition parties, are allowed to form, operate
autonomously, and participate in elections, and to what extent civil
society organizations are able to form and operate freely. The free-
dom of expression index (v2x_freexp_thick) includes Dahl’s notion
of alternative sources of information and captures the extent to
which the government respects press, media, and internet freedom;
e.g., harassment of journalists. The freedom of expression index also
covers media’s possible bias, e.g., that they provide the full range of
political perspectives and open criticism of the government when
called for. Finally, the index measures freedom of both male and fe-
male citizens to discuss political matters at home and in the public
sphere, as well as the freedom of academic and cultural expression.
Furthermore, EDI includes a measure of the share of adult citizens
with the legal right to vote (v2x_suffr) and an indicator of wheth-
er the chief executive and members of the legislature in command
of government policy are directly or indirectly appointed through
popular elections (v2x_elecoff).
The aggregation rule for the EDI incorporates the two most well-
known aggregation formulas in the literature, namely “compensa-
tion” where one strong sub-component can partially compensate
for lack of electoral democracy in others, and “punishment” for
countries weak in one sub-component according to the “weakest
link” argument. Thus, the index is formed in one half by the weight-
ed average of the previously described indices and in the other half
by the multiplication of those indices. For those who prefer one of
these alternate aggregation rules, the V-Dem dataset provides each
version separately, as well: the Multiplicative Polyarchy Index (v2x_
mpi) and the Additive Polyarchy Index (v2x_api).
global and Regional trendsFigure 2.2 displays the level of electoral democracy in the world
since 1900 to the end of 2016, using V-Dem’s EDI that runs from 0
(total absence of electoral democracy) to 1 (fully democratic). Dis-
tinct from any other existing democracy-measure, no country has
ever scored “100%” democratic on the EDI. Even in the best electoral
democracies in the world, improvements are possible.
The main line of the graph, with confidence intervals in shaded grey,
demonstrates that the level of electoral democracy has improved
dramatically since 1900. Yet, compared to other depictions of the
same period, the “first wave” of democratization after World War
I, the drop during World War II, and the “second wave” following
the war, are much less pronounced when rendered with the V-Dem
data. This is because of the inclusion of colonies: we show under
which conditions the majority of the population in the world ac-
tually lived, in distinction to existing data where only independent
states are included.
The most dramatic increase follows the beginning of the “third
wave” in 1974 after the overthrow of the Portuguese dictatorship,
and in particular, at the end of the Cold War around 1990. In broad
strokes, the turn of 21th century witnessed more countries in the
world than ever before with higher levels of electoral democracy.
However, the level of electoral democracy has stagnated since then,
and perhaps even declined slightly during the last five to ten years
- although the confidence intervals show that we cannot be fully
certain about this.
16

freedom of association index
Party ban
Barriers to parties
Opposition parties autonomy
Elections multiparty
CSO entry and exit
CSO repression
Share of population with suffrage
Percent of population with suffrage
elected officials index
Clean elections index
EMB autonomy
EMB capacity
Election voter registry
Election vote buying
Election other voting irregularities
Election government intimidation
Election other electoral violence
Election free and fair
fIguRe 2.2: the eleCtoRAl DemoCRACy InDex (eDI): woRlD AnD RegIonAl AVeRAgeS, 1900 to 2016
The overall pattern naturally hides differences across the regions.
Some of the regional patterns are well known. In Western Europe
and North America (the dark blue line), the level of electoral de-
mocracy follows closely the “three waves of democratization” (upon
which so much of the existing knowledge about democratization
is based): democratization at the end of World War I, breakdowns
during World War II followed by a resurgence, and then another in-
crease after the Carnation Revolution in Portugal in 1974.
In Eastern Europe and Central Asia (the red line), electoral democ-
racy expanded significantly during the first wave of democratiza-
tion but fell back quickly with World War II. However, the second
wave entirely missed the region. In 1989 at the end of the Cold War,
dramatic changes restored democracy until a decline began some
five to ten years ago in countries such as Hungary, Poland, Macedo-
nia, and Serbia.
Latin America and the Caribbean were largely left out of the first
wave, but a few countries such as Chile, Argentina, and Brazil among
0.1
.2.3
.4.5
.6.7
.8.9
1
1900 1910 1920 1930 1940 1950 1960 1970 1980 1990 2000 2010
Eastern Europe and Central Asia Latin America and the CaribbeanMENA Sub−Saharan AfricaWestern Europe and North America Asia−PacificWorld Average
Note: Grey shaded areas indicate confidence bands.
expanded freedom of expression index
Government censorship effort – Media
Government censorship effort - Internet
Harassment of journalists
Media self-censorship
Media bias
Print/broadcast media critical
Print/broadcast media perspectives
Freedom of discussion for men
Freedom of discussion for women
Freedom of academic and cultural expression
fIguRe 2.1: the V-Dem eleCtoRAl DemoCRACy InDex
17SECTION 2: THE ELECTORAL PRINCIPLE OF DEMOCRACY – STATUS AND TRENDS

others made advances during the second, while most of the re-
gion democratized during the third wave of democratization in the
1980s. However, in this region levels of electoral democracy have
fallen in the 21st century. Venezuela is probably the most high pro-
file case, but we also record significant negative developments also
in countries such as Nicaragua, Ecuador, and Brazil.
Average levels of electoral democracy in Sub-Saharan Africa (yellow
line) improved modestly with independence of many countries in
the region. While decolonialization typically meant democratization
in the 1950s and 1960s, most countries rapidly turned into military
dictatorships or one-party systems, and large-scale democratization
across the continent only started during the third wave following
the end of the Cold War. Noticeably different from Europe, North
and Latin America, we find no evidence of democratic backsliding
in Africa during the last decade. We may even see a continued up-
ward trend although it is still a little uncertain. As Africa’s 49 states
and two semi-autonomous entities (Somaliland and Zanzibar cod-
ed separately) constitute almost 30 percent of the countries in this
world sample, this progress moderates the fall in the average world
levels of democracy.
The overall trend for Asia and the Pacific (purple line) follows Africa
with marginal changes during the first wave, moderate improve-
ments during the second, and more dramatic positive changes dur-
ing the third wave starting in the 1980s with the democratization of
countries such as the Philippines and South Korea. As for Africa, the
first 16 years of the 21st century have been a little volatile but the
overall trend is positive towards higher levels of electoral democ-
racy in the region. Asia and the Pacific contain another 27 countries,
and the two regions where electoral democracy is on average im-
proving together make up almost 45 percent of all countries.
The Middle East and North Africa (MENA) is the region where elec-
toral democracy has remained at a low level throughout the last 60
years, even if a noticeable – but largely elusive - improvement reg-
istered during the Arab Spring where Tunisia stands out as the re-
maining success story. Nonetheless, expansion in areas such as the
freedom of speech and association occurred during in the 1990s in
several countries and continue to develop, if incrementally and be-
ginning at low levels, in countries such as Morocco and Jordan.
backsliding and Advances – CountriesAggregate numbers are useful to describe overall patterns but mask
variation of country trajectories. Over the past 10 years, changes at
the country-level are sometimes considerable. In this section, we
highlight the countries that have the most democratic backsliding,
and those that have made the most progress with electoral democ-
racy. There is high volatility, particularly in the middle of the regime
spectrum (Figure 2.3). Countries at the high-end and at the bottom
rung tend to be stable. Over the last 10 years and only counting sta-
tistically significant changes, the balance is positive: 25 countries
have improved their EDI score while 18 countries register declines.
Detailed country-level figures for all countries are found in Part III of
this report.
fIguRe 2.3: eleCtoRAl DemoCRACy InDex: RegReSSIng AnD ADVAnCIng CountRIeS between 2006 AnD 2016
Figure 2.3 demonstrates that some countries in all regions have im-
proved in terms of electoral democracy. Over the past decade, the
countries with the greatest positive changes are Nepal and Bhutan,
following their transitions from monarchial to representative demo-
cratic systems, as well as Tunisia. As Figure 2.3 illustrates, in 2016, Tu-
nisia’s level of electoral democracy ranked higher than that of Nige-
ria and Malawi, both of which also improved significantly in the last
ten years. Guinea, Togo, Kyrgyzstan, Burma, and Sri Lanka are other
examples of countries with substantial improvements.
In contrast, we observe noteworthy negative trends in countries such
as Turkey where president Recep Erdogan has cracked down on all op-
position, imprisoning thousands of journalists, opposition politicians,
and academics, while closing down essentially all critical media and in-
fringing on the freedom and fairness of elections. The EDI scores have
also declined significantly for Bangladesh, Venezuela, and Zambia. Fur-
thermore, Thailand experienced drastic regression after its latest coup
in May 2014 when the National Council for Peace and Order reinstated
military dictatorship. Burundi has plummeted from the middle of the
regime spectrum in 2006, at a point when many hoped for further lib-
eralization, to a dictatorship after President Pierre Nkurunziza was al-
lowed a disputed third term in office following a coup attempt, severe
repression, shutdown of independent media, and exodus of hundreds
of thousands citizens from the country in 2015.
Georgia
Hungary
Kyrgyzstan Macedonia
Poland
Romania
Serbia
Ukraine
Bolivia
BrazilColombia
Venezuela
Libya
Palestine
Tunisia
Turkey
Yemen
Angola
Burundi
CARGuinea
Malawi
Mauritania
NigeriaTogo
Zambia
Bangladesh
Bhutan
Myanmar
Nepal
Sri Lanka
Thailand0
.1.2
.3.4
.5.6
.7.8
.91
Elec
tora
l Dem
ocra
cy 2
016
0 .1 .2 .3 .4 .5 .6 .7 .8 .9 1Electoral Democracy 2006
Eastern Europe and Central Asia Latin America and the CaribbeanMENA Sub−Saharan AfricaWestern Europe and North America Asia−Pacific
Note: Countries above the diagonal line have improved their level of electoral democracy from 2006 to 2016. Countries below the diagonal line have deteriorated.
18 SECTION 2: THE ELECTORAL PRINCIPLE OF DEMOCRACY – STATUS AND TRENDS
At the same time, Europe and North America are not immune from
backsliding. The United States registers a significant decline on the
EDI over the last five years. It has declined from a record high of 0.94
on the index in 2012, down to 0.84 in 2016 – or down from a rank of
3 to 20 in the world - following worsening scores primarily for the
overall freedom and fairness of the electoral process, but also for
reduction in the sub-index for freedom of speech and alternative
sources of information.
European countries recording significant drops in their EDI scores are
Croatia, Macedonia, Moldova, Poland, Serbia, Ukraine, and Hungary.
The latter shows a particularly disturbing downward trajectory from
0.81 in 2005 to 0.68 to or rank number 41 to rank 63 in the world in
2016. Hungary’s decline is primarily due to weakening in the freedom
of expression and alternative sources of information, with simultane-
ous declines in the overall freedom and fairness of elections.
which Aspects of electoral Democracy have been most Affected?With this mix of countries backsliding and advancing over the last
10 years, which aspects of democracy are affected the most? When
political leaders and other relevant actors weaken - or even derail
- electoral democracy, which elements of democracy are affected
most severely? Across the countries with advances, which qualities
improve the most? The V-Dem dataset is unique in that its indices of
democracy are built from a large number of very specific indicators:
23 substantive indicators factor into the EDI. This level of detail makes
it possible for us to analyze exactly which aspects of electoral de-
mocracy are declining and progressing the most, around the world.
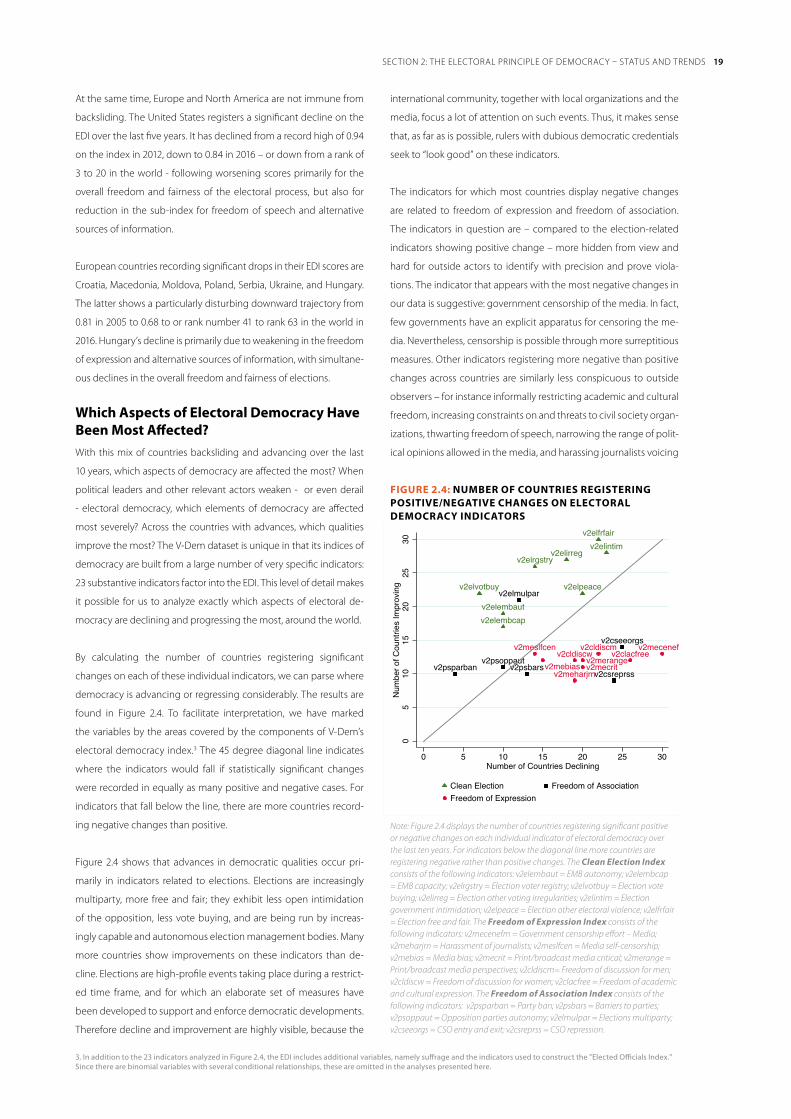
By calculating the number of countries registering significant
changes on each of these individual indicators, we can parse where
democracy is advancing or regressing considerably. The results are
found in Figure 2.4. To facilitate interpretation, we have marked
the variables by the areas covered by the components of V-Dem’s
electoral democracy index.3 The 45 degree diagonal line indicates
where the indicators would fall if statistically significant changes
were recorded in equally as many positive and negative cases. For
indicators that fall below the line, there are more countries record-
ing negative changes than positive.
Figure 2.4 shows that advances in democratic qualities occur pri-
marily in indicators related to elections. Elections are increasingly
multiparty, more free and fair; they exhibit less open intimidation
of the opposition, less vote buying, and are being run by increas-
ingly capable and autonomous election management bodies. Many
more countries show improvements on these indicators than de-
cline. Elections are high-profile events taking place during a restrict-
ed time frame, and for which an elaborate set of measures have
been developed to support and enforce democratic developments.
Therefore decline and improvement are highly visible, because the
international community, together with local organizations and the
media, focus a lot of attention on such events. Thus, it makes sense
that, as far as is possible, rulers with dubious democratic credentials
seek to “look good” on these indicators.
The indicators for which most countries display negative changes
are related to freedom of expression and freedom of association.
The indicators in question are – compared to the election-related
indicators showing positive change – more hidden from view and
hard for outside actors to identify with precision and prove viola-
tions. The indicator that appears with the most negative changes in
our data is suggestive: government censorship of the media. In fact,
few governments have an explicit apparatus for censoring the me-
dia. Nevertheless, censorship is possible through more surreptitious
measures. Other indicators registering more negative than positive
changes across countries are similarly less conspicuous to outside
observers – for instance informally restricting academic and cultural
freedom, increasing constraints on and threats to civil society organ-
izations, thwarting freedom of speech, narrowing the range of polit-
ical opinions allowed in the media, and harassing journalists voicing
v2elembautv2elembcap
v2elfrfairv2elintim
v2elirreg
v2elpeace
v2elrgstry
v2elvotbuy
v2cseeorgs
v2csreprss
v2elmulpar
v2psbarsv2psoppaut
v2psparbanv2clacfree
v2cldiscmv2cldiscw
v2mebias
v2mecenef
v2mecritv2meharjrn
v2merangev2meslfcen
05
1015
2025
30N
umbe
r of C
ount
ries
Impr
ovin
g
0 5 10 15 20 25 30Number of Countries Declining
Clean Election Freedom of AssociationFreedom of Expression
Note: Figure 2.4 displays the number of countries registering significant positive or negative changes on each individual indicator of electoral democracy over the last ten years. For indicators below the diagonal line more countries are registering negative rather than positive changes. The Clean Election Index consists of the following indicators: v2elembaut = EMB autonomy; v2elembcap = EMB capacity; v2elrgstry = Election voter registry; v2elvotbuy = Election vote buying; v2elirreg = Election other voting irregularities; v2elintim = Election government intimidation; v2elpeace = Election other electoral violence; v2elfrfair = Election free and fair. The Freedom of Expression Index consists of the following indicators: v2mecenefm = Government censorship effort – Media; v2meharjrn = Harassment of journalists; v2meslfcen = Media self-censorship; v2mebias = Media bias; v2mecrit = Print/broadcast media critical; v2merange = Print/broadcast media perspectives; v2cldiscm= Freedom of discussion for men; v2cldiscw = Freedom of discussion for women; v2clacfree = Freedom of academic and cultural expression. The Freedom of Association Index consists of the following indicators: v2psparban = Party ban; v2psbars = Barriers to parties; v2psoppaut = Opposition parties autonomy; v2elmulpar = Elections multiparty; v2cseeorgs = CSO entry and exit; v2csreprss = CSO repression.
3. In addition to the 23 indicators analyzed in Figure 2.4, the EDI includes additional variables, namely suffrage and the indicators used to construct the ”Elected Officials Index.” Since there are binomial variables with several conditional relationships, these are omitted in the analyses presented here.
fIguRe 2.4: numbeR of CountRIeS RegISteRIng poSItIVe/negAtIVe ChAngeS on eleCtoRAl DemoCRACy InDICAtoRS
19SECTION 2: THE ELECTORAL PRINCIPLE OF DEMOCRACY – STATUS AND TRENDS

critique of government. These every-day processes are susceptible
to gradual and often hidden retrogression by anti-democratic rul-
ers. They can also have the effect of undermining the more visible
advances in the electoral arena. Procedurally free and fair elections
in which opposition parties are allowed to run for office are much
less threatening for rulers when they manage to undermine critical,
alternative sources of information and restrict speech, as well as civil
society actions.4 This seems to be the direction in which the world
has moved over the last ten years in terms of electoral democracy.
Nevertheless, when it comes to the core indicator of free and fair
elections, the state of the world looks fairly positive as indicated by
the left-hand axis in Figure 2.5. The majority of the world’s popula-
tion (59%) lives in countries with free and fair or at least somewhat
free and fair elections. Yet, 23% of the world’s population lives in
countries without free and fair elections, with China contributing a
majority. The right-hand axis of Figure 2.5 displays income levels of
countries in which the populations live. Most people in countries
with free and fair elections live either in high-income countries or
lower middle-income countries such as India. Yet, populations with
less than free and fair elections are split between living in mainly
upper-middle and low income countries.
4. The findings here are corroborated by findings in a recent World Bank paper analyzing the sequences of improving accountability. Many of the same indicators we find being attacked the most here, are the same that this report singles out as being the last to develop in full for effective accountability of a government (see Mechkova et al. 2017)
fIguRe 2.5: ShARe of woRlD populAtIon by leVel of eleCtoRAl fReeDom AnD fAIRneSS AnD InCome In 2016
42.5
%
High Income Countries
Upper Middle Income Countries
Lower Middle Income Countries
Low Income Countries
Free Fair Elections
Somewhat Free Fair Elections
Ambiguous Free Fair Elections
Not Really Free Fair Elections
Not Free Fair Elections
16.2
%11
.4 %
7.1
%22
.7 %
8.1 %39.4 %
35.1 %17.3 %
Shar
e of
Wor
ld P
opul
atio
n
Share of World Population
Note: The chart divides world population by level of electoral freedom and fairness (v2elfrfair_ord; left) and income level of the countries they belong (right; World Bank Classification, 2016). The width of the links between the two sides represents the share of population. The larger it is, the more people it represents. The chart is based on an online tool from Politecnico di Milano: Studio Colibro (2017) and population data for 2015 from the World Bank (2017).
20 SECTION 2: THE ELECTORAL PRINCIPLE OF DEMOCRACY – STATUS AND TRENDS

“In the last ten years, a number of countries have declined noticeably in terms of democracy. Turkey is an archetypal ex-ample. In 2006, Turkey was an undisputed electoral democ-racy. It had essentially clean elections, relatively high respect for freedom of speech and association, a fairly predictable and autonomous judicial environment, an independent and critical media reflecting a wide range of perspectives, and somewhat robust checks and balances. In 2016, most of these areas of democratic space disintegrated. Accordingly, Turkey’s score on V-Dem’s Electoral Democracy Index has declined drastically: from 0.69 to 0.34. Turkey today is an electoral autocracy. Most recently, Turkish President Erdoğan sought to legitimize his au-togolpe with the widely criticized referendum in April 2017.”
0.2
.4.6
.81
2006 2007 2008 2009 2010 2011 2012 2013 2014 2015 2016
Core Civil Society Index Alternative Sources of InformationLegislative Constraints on the Executive
Anna lührmannPost-doctoral Research Fellow, V-
Dem Institute
“Tunisia and Egypt took very different paths in the last decade. In 2006, Tunisia was one of the most repressive regimes in the Middle East and North Africa; Egypt was experiencing political liberalisation, including the first competitive presidential elec-tions and unprecedented representation of the Muslim Broth-erhood in parliament. By 2016, Tunisia was one of the most democratic regimes in the region, with two peaceful turnovers in power since 2011. Egypt, in contrast, had become increas-ingly authoritarian, with limitations in political rights and prac-tices far greater than that experienced before the revolution. Tunisians and Egyptians all face challenges today, but they do so in very different political conditions.”
0.2
.4.6
.81
Libe
ral d
emoc
racy
inde
x
2006 2007 2008 2009 2010 2011 2012 2013 2014 2015 2016
Tunisia Egypt
ellen lustMember of the V-Dem Steering Committee
tuRKeythe Slippery Slope to Autocracy
tunISIA AnD egyptChallenges in Different political Conditions
21IN THE SPOTLIGHT

t he liberal notion of democracy adopts a “negative” view on democracy where one evaluates democracy, beyond the existence of a satisfactory level of electoral democracy, by the limits placed on governments in terms of two key aspects: 1) protection of individual liberties; and 2) checks and balances
between institutions. therefore, in V-Dem’s conceptual scheme the liberal principle of democracy embodies the importance of protecting individual and minority rights against both the tyranny of the state and the tyranny of the majority. It also captures the “horizontal” methods of accountability between more or less equally standing institutions that ensure the effective checks and balances between institutions and in particular, limit the exercise of executive power. this is achieved by strong rule of law and constitutionally protected civil liberties, independent judiciary and strong parliament that are able to hold the executive to account and limit its powers. the three indices that capture these dimensions are: the equality before the law and individual liberties (v2xcl_rol), judicial constraints on the executive (v2x_jucon), and legislative constraints on the executive (v2xlg_legcon). taken together they measure the V-Dem liberal Component Index (v2x_liberal).
Section 3: The Liberal Principle of Democracy – Status and Trends
the lCI IS the main focus for this section of 2017 Annual Report.
In the V-Dem datasets, the LCI is combined with the Electoral De-
mocracy Index (EDI) to measure the concept of liberal democracy
(measured by the Liberal Democracy Index, LDI). Countries can, at
least theoretically, have high scores of “liberalness” on the LCI with-
out being very democratic in terms of electoral democracy. Such a
country would not score very high on the LDI, because of the lack of
requisite electoral processes and rights. Here, nevertheless, we want
to focus on the specific liberal dimension. Hence, the analyses be-
low are based on LCI, rather than LDI.
global and Regional trendsDifferent from the previous sections of the Annual Report 2017, this
section analyses an index that measures a specific dimension of de-
mocracy distinct from, and in isolation from, electoral aspects: the
Liberal Component Index (LCI). It is thus important to note that the
below is not an analysis of liberal democracy as such, only the liberal
dimension of it.
Figure 3.2 shows the trajectory of the liberal dimension in the world
since 1900 to the end of 2016, using V-Dem’s Liberal Component
Index (LCI). Like all V-Dem indices it ranges from 0 to 1. Zero corre-
sponds to a complete absence of space for liberal qualities, and a
score of one indicates that the liberal ideals of equality before the
law, protection of individual liberties, and effective constraints on
the executive have been achieved. It is worth noting that similar to
the Electoral Democracy Index, no country in the world has reached
a perfect score yet on this component.
The black line in the graph, with confidence intervals around it in
shaded grey, demonstrates that the average level of satisfaction of
the liberal ideals starts with relatively high scores just above 0.4 al-
ready in the beginning of the 20th century. There is not much of a
record of a “first wave” of democratization in this dimension after
World War I as that wave was primarily about improving electoral
democracy, not the liberal dimension. The only really significant
drop follows in the 1940s when, as result of the World War II, liberal
rights and freedoms were curtailed across most of Europe and parts
of Asia, and unconstrained dictators ruled over an increasing num-
ber of countries. With the end of the war, respect for liberal values
return approximately to their previous levels. It is not until the Cold
War starts to wind down in the mid-1980s that the liberal dimension
gains greater traction in the world, to stagnate around the turn of
the century. We think this is a previously largely unrecorded aspect
of the development of democracy in the world over the 20th cen-
tury: the liberal dimension did not change much at all for the first 80
years or so and the expansion of respect for liberal aspects of de-
mocracy is primarily a “third wave” phenomenon.
22

SECTION 3: THE LIBERAL PRINCIPLE OF DEMOCRACY – STATUS AND TRENDS
expanded freedom of expression index
Rigorous and impartial public administration
Transparent laws with predictable enforcement
Access to justice for men
Access to justice for women
Property rights for men
Property rights for women
Freedom from torture
Freedom from political killings
Freedom from forced labor for men
fIguRe 3.1: the V-Dem lIbeRAl Component InDex (lCI)
Freedom from forced labor for women
Freedom of religion
Freedom of foreign movement
Freedom of domestic movement for men
Freedom of domestic movement for women
Judicial constraints on the executive index
Executive respects constitution
Compliance with judiciary
Compliance with high court
High court independence
Lower court independence
legislative constraints on the executive index
Legislature questions officials in practice
Executive oversight
Legislature investigates in practice
Legislature opposition parties
Figure 3.2 also presents average levels disaggregated by region de-
tailing specific patterns. In Western Europe and North America (dark
blue line) the regional average score is close to 0.8 already from
the beginning of the time series. This captures that, already during
those first years of the century, many countries in Western Europe
and North America had established legislatures that could hold
the executive to account, as well as relatively independent judici-
ary and equality before the law. While expansion of liberal protec-
tions and rights in Eastern Europe was then the main driver of the
modest world-average increase in the liberal dimension after World
War I, Western and Eastern Europe were almost entirely responsi-
ble for the world-average drop during World War II. As we know,
the post-war period brought about renewed liberalization in West-
ern Europe while Eastern Europe was engulfed by the Eastern Bloc.
Finally, with democratization in southern Europe by the mid-1970s,
at a time when the civil rights movement in the United States had
forced greater protection of rights for all, the liberal dimension of de-
mocracy reached its all-time highest score: around .9 for that region.
In Eastern Europe and Central Asia (the red line), communism natu-
rally kept liberalism extremely constrained (average levels hovering
around 0.2 until the 1990s when the Cold War ended. The com-
munist regimes kept legislatures and judiciaries totally controlled by
the ruling party, and individual liberties were almost nonexistent.
0.1
.2.3
.4.5
.6.7
.8.9
1
1900 1910 1920 1930 1940 1950 1960 1970 1980 1990 2000 2010
Eastern Europe and Central Asia Latin America and the CaribbeanMENA Sub−Saharan AfricaWestern Europe and North America Asia−PacificWorld Average
Note: Grey shaded areas indicate confidence bands.
fIguRe 3.2: the lIbeRAl Component InDex (lCI): woRlD AnD RegIonAl AVeRAgeS, 1900 to 2016
23

Millions of citizens were killed as result of famines (for example, in
Ukraine 1932-33); the Russian working camps, or Gulags; or as result
of death sentences in the so-called People’s Courts in countries such
as Bulgaria. By the early 1990s the average level for liberal dimen-
sion was close to the world average in Eastern Europe and Central
Asia. Nevertheless, recent democratic backsliding in countries such
as Russia, Ukraine, Macedonia, and Serbia contributes to the down-
ward trend in recent years.
In Latin America and the Caribbean (green line) the liberal dimen-
sion of democracy roughly tracks the world average throughout
the past 117 years. Scores fluctuate around 0.45 until the wave of
military coups and other political setbacks through the 1960s and
1970s affected this region particularly harshly. Brazil’s military took
and held power from 1964 to 1985, Chile turned into a military dic-
tatorship under Augusto Pinochet in 1973, the same year that Uru-
guay’s military seized power. Furthermore, Argentina suffered from
the so-called “Dirty War” when the military repressed the popula-
tion severely. During the mid-1980s the third wave of democratiza-
tion meant that the liberal dimension of democracy spread more
widely and thoroughly for the first time across the world, and this
development is particularly notable for Latin America and the Carib-
bean. More countries than ever before established democratically
elected legislatures with real investigative and other powers to hold
executives to account, and more independent judiciaries to enforce
the rule of law and protection of individual rights. So even if we see
a trend of slightly decreasing scores after the turn of the 21st cen-
tury, the situation in the region on average is nevertheless close to
the best it has ever been: the second highest in terms of the liberal
component of democracy after Western Europe and North America.
Africa (yellow line) has the lowest regional averages at the begin-
ning of the 20th century. As colonial rule lasted until the early 1960s
in most countries, individual liberties were severely curbed, rule of
law was mostly absent, and horizontal accountability was at best
oblique. The first legislatures were elected in 1946 in French colo-
nies such as Benin and Ivory Coast. Their powers to hold the execu-
tive to account were severely limited, however and the scores for the
liberal component only rise later with decolonialization in the 1960s.
That advancement was modest and quickly faded when most coun-
tries turned into military dictatorships or one-party systems short-
ly after independence. Only five countries were somewhat demo-
cratic in the early 1980s: Botswana, Gambia, Mauritius, Senegal, and
Zimbabwe. As in most of the world outside of Europe and North
America, the first really widespread expansion in the liberal aspects
of democracy came about with the end of the Cold War, yet was
more limited on the continent than in for example Latin America.
The 1990s is also associated with the massive curbing of civil rights
in, for example Rwanda and Burundi, and the genocide, as well as
civil wars in the DRC, Liberia and Sierra Leone. As of today, many
Sub-Saharan African parliaments continue to struggle with the ex-
tent to which they can constrain the executive powers, facing ex-
ecutives with very strong constitutional, as well as, informal powers.
In a series of countries, for example, term limits have been compro-
mised – most recently and prominently perhaps by the presidents
of Burundi and Uganda.
The trajectory for realization of liberal aspects in Asia-Pacific (purple
line) mirrors Western Europe and North America while the levels are
much lower and for most of the period are below world average.
Precipitous declines are associated with World War II and the atroci-
ties during the Chinese civil war. The dips in LCI in the 1960s and
1970s capture, among other things, the massive violations of basic
human rights and killings in Indonesia (1965 - 1966) and the Cambo-
dian genocide (1975 – 1979). Visible improvements to the extent of
checks and balances between institutions, rule of law and protec-
tion of individual rights starting in the 1980s continues through to
the present day, if incrementally and still at relatively low levels. The
regional average for Asia-Pacific is the second worst in the world;
only MENA has a lower regional average. Yet, we note recent ad-
vances in Bhutan, Vietnam and Myanmar, as well as in South Korea
where after the massive corruption scandal, the country’s Constitu-
tional Court unanimously upheld a parliamentary vote to impeach
the president demonstrating strength in terms of executive con-
straints.
MENA (blue line) is the region where the liberal component is pres-
ently at the lowest average level, significantly below world average
and unchanged for most of 20th and 21st centuries. The regional
average stays well below the midpoint of the scale until the Arab
Spring in 2011 indicating very limited space for horizontal account-
ability, and at best arbitrary protection of individual liberties by the
states. While only Tunisia, Lebanon, and Israel can be viewed as de-
mocracies in 2016, countries such as Morocco and Algeria are still
very gradually allowing more individual rights and freedoms. In
many other countries torn by war, military takeovers, and repression
such as Egypt, Libya, Turkey and Yemen effective checks and bal-
ances, rule of law, and protection of individual liberties are almost
non-existent.
backsliding and Advances – CountriesIn this section we highlight the countries that have experienced the
greatest changes, both improvement and decline, in terms of the
liberal component of democracy as measured by the LCI. Figure
3 presents the intersection of scores for 2006 and 2016. Countries
above the line have gained ground, and those below the line have
lost ground. Counting only the statistically significant changes, ten
countries have improved their scores on the LCI while 13 countries
have regressed. The details for each country are presented in Part III
of this report.
SECTION 3: THE LIBERAL PRINCIPLE OF DEMOCRACY – STATUS AND TRENDS24

“Kyrgyzstan’s political developments have been the most vola-tile compared to many of its post-soviet neighbors. Experienc-ing two popular revolts in 2005 and 2010 which ousted first two presidents, Kyrgyzstan had the first peaceful transfer of power in Central Asia six years ago. In the last few years hopes for democratization with increased political competition and powers transferred to the parliament were trumped by infor-mal consolidation of powers by the incumbent president. Presi-dential elections await later in 2017 and expected leadership transition puts prospects for reversal of recent authoritarian trends into the state of uncertainty.”
0.2
.4.6
.81
2006 2007 2008 2009 2010 2011 2012 2013 2014 2015 2016
Electoral Democracy Index (EDI) Liberal Component Index (LCI)
medet tiulegenovV-Dem Regional Manager for Central Asia
“Democracy in Nigeria has had a chequered history with ups and downs, alternating between military dictatorship and democratic civil rule. The return to current democratic rule in Nigeria started in 1999 with elections holding every fourth year. The trajectory of democracy in Nigeria shows, initially, electoral irregularities, especially in 2003 and 2007 with sub-sequent improvement in each electoral cycle thereafter (2011 and 2015). The upward trend culminated in the opposition party winning the presidential and majority of parliamentary elections in 2015, thereby deepening the acceptance of demo-cratic rule in the country. “
01
23
4
1998 2000 2002 2004 2006 2008 2010 2012 2014 2016
Elections Free and Fair Elections Losers accept Results
Afolabi olugbemiga SamuelV-Dem Regional Manager for Anglophone
Central & Eastern Africa
KyRgyzStAnprospects for Democratization
nIgeRIAelectoral turn-over of power in 2015
IN THE SPOTLIGHT 25

Similar to electoral democracy, there is more volatility among coun-
tries in the middle of the regime spectrum. Countries at the high-
end are relatively stabile liberal democracies, and many countries in
Europe and North America continue to score highly on this compo-
nent of democracy even if countries such as Poland, Hungary, and
Macedonia in particular, record worrying declines on the LCI. Re-
cording substantially higher levels in 2006, Macedonia and Ukraine
are found at the middle of the 0 to 1 scale on the LCI in 2016. Poland
was previously considered to be a stable liberal democracy but now
we register significant declines, because the government under-
mined the independence of both the legislature and the judiciary
over the last few years.
fIguRe 3.3: lIbeRAl Component InDex: RegReSSIng AnD ADVAnCIng CountRIeS between 2006 AnD 2016
The most pronounced improvement on the LCI is Tunisia, register-
ing an advancement of almost 0.6 on the 0 to 1 scale and in 2016
is ranked 30 in the world with a score similar to countries such as
Bulgaria, Italy, and Botswana. Myanmar is another country with sub-
stantial gains in terms of respect for civil liberties and horizontal ac-
countability. It had among the lowest scores in the world in 2006,
and ten years later is found on the upper half of the spectrum with
scores close to 0.6 on the LCI, a level similar to Mozambique, Hon-
duras, and Kosovo. Bhutan, Burkina Faso, Guyana and Sri Lanka are
other countries with noticeable improvements.
Below the line in Figure 3.3 we find countries backsliding on the liber-
al component. Turkey’s autocratization is captured also in this compo-
nent in terms of drastic reversals of the legislature and judiciary’s abili-
ty to act independently of the executive, as well as the decrease in the
protection of individual rights. The civil war in Yemen has naturally led
to significant losses on the LCI. The shrinking of horizontal account-
ability in Burundi is reflected in the graph with a substantial decline in
this country’s scores. Both Yemen and Burundi are below 0.2 on the
LCI in 2016, which puts them at the very bottom alongside countries
such as China, Turkmenistan, Equatorial Guinea, and Sudan. The mili-
tary coup in Thailand in May 2014 and the lifting of term limits in Nica-
ragua the same year followed by further deterioration of the rule of
law, are examples of other negative developments. In 2016 Thailand
and Nicaragua rank close to Djibouti, Bangladesh, and Turkey.
In Latin America the two countries that have negative changes out-
side of the confidence intervals are Brazil and Suriname.
which Aspects of the lCI have Changed the most?When looking at the constituting indicators of the LCI, which are the
areas where countries have advanced or retreated the most in the
last ten years? In order to find out, we calculate the number of coun-
tries logging significant changes (outside of the confidence intervals)
between 2006 and 2016, on the 23 individual indicators that make
up the LCI. Thus, we are able to say what aspects have changed the
most, positively or negatively, on average across the world.
The results from this analysis are presented in Figure 3.4. The diago-
nal line indicates an equal number of countries with advances and
regressions across each indicator. For the indicators below the line,
there are more countries recording negative changes than positive.
Indicators above the line, are positive cases where more countries
change for the better.. We use different markers to specify the sub-
component index to which each variable contributes: equality be-
fore the law and individual liberties, judicial, or legislative constraints
on the executive.
Among those tapping into legislative constraints on the executive,
two indicators stand out for their progress: the likelihood that when
1) the executive is engaged in an unconstitutional activity the legis-
lature (v2lginvstp) or 2) other oversight bodies, such as an ombuds-
man or prosecutor general (v2lgotovst), will start an investigation
and issue a decision that is unfavorable to the executive. Both regis-
ter more than 15 countries making significant advances versus fewer
than 10 declining. Burkina Faso, Georgia and Slovenia are among the
countries improving on these critical institutions of horizontal ac-
countability. They ensure that legislatures and oversight bodies are
able to demand information from the chief executive and its minis-
tries, and that they can also take actions to sanction the executive
when called for.
However, the indicator that measures if opposition parties in the leg-
islature (v2lgoppart) are able to exercise oversight and investigatory
functions against the wishes of the governing party or coalition, reg-
isters a significant decline in almost 20 countries and advancements
in fewer than 15. Nicaragua and Ecuador are among the states that
have declined the most on this indicator in the last 10 years.
Poland
Ukraine
Kyrgyzstan
Macedonia
HungarySurinameBrazil
Nicaragua
Ecuador
Guyana
Yemen
Tunisia
Turkey
Burkina Faso
Zimbabwe
Mauritania
Burundi
Myanmar Vietnam
Thailand
Bhutan
Sri Lanka
0.1
.2.3
.4.5
.6.7
.8.9
1Li
bera
l Com
pone
nt 2
016
0 .1 .2 .3 .4 .5 .6 .7 .8 .9 1Liberal Component 2006
Eastern Europe and Central Asia Latin America and the CaribbeanMENA Sub−Saharan AfricaWestern Europe and North America Asia−Pacific
SECTION 3: THE LIBERAL PRINCIPLE OF DEMOCRACY – STATUS AND TRENDS26

“Since the victories of Fidesz – Hungarian Civic Alliance in land-slide victories in the general elections of 2010 and 2014, Prime Minister Viktor Orbán has dominated Hungarian politics. The Orbán government has controlled a supermajority in parlia-ment and has effected constitutional changes to entrench its political power, e.g. changing electoral rules and role of the courts. In summer of 2014 Orbán shocked his fellow Europe-ans by decrying liberal democracy and advocating “illiberal democracy” that privileged the rights of the community over the individual. In 2017 Hungary and its fellow EU members have tottered on crisis as the Orbán government has rejected immigration quotas, passed legislation directed at closing Cen-tral European University in Budapest, discussed legislation to force NGOs who get extensive international funding to declare themselves foreign agents, and has prepared a national con-sultation (referendum) on the EU called “Let’s Stop Brussels.” These actions led to extensive demonstrations in Budapest in April 2017 involving tens of thousands of protestors.”
0.2
.4.6
.81
2007 2008 2009 2010 2011 2012 2013 2014 2015 2016
Civil Society Participation Index Legislative Constraints on the Executive
michael bernhardV-Dem Project Manager on Civil Society
and Sovereignty
“Whereas most of the countries shaken by the Arab Uprisings failed to democratize due to civil wars, coups and maneuvers of authoritarian rulers, Tunisia emerged as the sole success story. However, its path to democratization was not easy either. While Tunisia had a major political transformation, first free and fair elections, and first democratically elected government in 2011, the process of democratization went through a tough road in the following years. Thanks to the National Dialogue process in 2014, Tunisia survived the threat of an authoritarian reversal similar to its neighbors and came back on the track of democratization by a second peaceful transition of power and adoption of a new constitution. Today, while having advanced significantly, Tunisia still suffers from birth pains of a new de-mocracy, especially in terms of horizontal accountability and corruption, just like the new Latin American and Eastern Euro-pean democracies did in the 1990s.”
0.2
.4.6
.81
1998 2000 2002 2004 2006 2008 2010 2012 2014 2016
Electoral Democracy Index (EDI) Liberal Democracy Index (LDI
tahir KilavuzV-Dem Country Coordinator for Algeria
hungARyDecry in liberal Democracy
tunISIA the Success Story
IN THE SPOTLIGHT 27

Three out of five indicators of judiciary constraints on the executive
record more regressions than gains: to what extent the executive re-
spects the constitution (v2exrescon), and the independence of the
higher and lower courts (v2juhcind and v2juncind). These indicators
register declines in 15 countries, and improvements in 10 countries,
indicating an area where a series of countries are actively undermin-
ing the liberal component of democracy by executives deciding to
overstep their power and constitutional limits (examples include
Uganda and Burundi). The negative trend for the two indicators of
court independence capture that over the last ten years, both the
lower and higher courts have been increasingly unable to rule inde-
pendently in cases that have been salient to the government. Coun-
tries showing a negative trend in this regard are Macedonia and Ec-
uador. Taken together, these form a worrisome trend where more
governments than before are acting in disregard of constitutional
limits with impunity. The remaining two indicators of judicial con-
straints – compliance of the government with important decisions
by the higher court (v2juhccomp) and other courts (v2jucomp) with
which the government disagrees, record approximately equal num-
ber of advances and declines.
More grave concerns emerge in the area covered by the subcom-
ponent-index “Equality before the law and individual liberties”. In 10
out of the 14 indicators in this area, a larger number of countries
register backslides than advances. This gives an indication of where
rulers in the world have made the most efforts to restrain liberal as-
pects of democracy over the last ten years.
More grave concerns emerge in the area covered by the subcom-
ponent-index “Equality before the law and individual liberties”. In 10
out of the 14 indicators in this area, a larger number of countries reg-
ister backsliding than advances. This gives an indication of where
rulers in the world have made the most efforts to restrain liberal as-
pects of democracy over the last ten years.
It is particularly disconcerting that such a critical aspect covered by
freedom of political killings (v2clkill) is the indicator where we find
the most negative changes over the past ten years. As many as 20
countries have significantly increased the physical repression of
their opponents for political reasons. Some prominent examples are
Turkey, Russia and Thailand.
Another worrisome indicator is freedom of movement for men
(v2cldmovem), where there is a large number of countries increased
repression while very few countries improved. Among the worst
cases are naturally war-torn Syria, Iraq and Libya but also Ukraine,
Burundi, and Yemen. Ominously, there is also a significant increase
in terms of freedom from servitude and other types of forced la-
bor both for men and for women (v2clslavef and v2clslavem) where
Egypt, Yemen and Thailand are cases in point where the situation
has gone from bad to worse.
Among the ambivalent areas we find the indicator on the extent
to which there are transparent laws with predictable enforcement
(v2cltrnslw), where 18 countries around the world have made gains
but 14 countries regressed considerably. Romania, Sri Lanka and
Tunisia are among the best achievers in area, while Venezuela, Tur-
key and Greece are among the regressing countries. The indicator
measuring the extent to which property rights for men are real-
ized (v2clprptym) also registers more countries with advancement,
whereas for women (v2clprptyw) the number is equally distributed
between improvements and declines.
Finally, we look in Figure 3.5 at share of the population in the world in
2016, by income-levels as defined by the World Bank, as well as by the
indicator measuring the extent to which the legislature investigates the
executive in practice if and when the latter oversteps its authority or
engages in illicit behavior (v2lginvstp). This is also one of the key indica-
tors of horizontal accountability.
SECTION 3: THE LIBERAL PRINCIPLE OF DEMOCRACY – STATUS AND TRENDS
fIguRe 3.4: numbeR of CountRIeS RegISteRIng poSItIVe/negAtIVe ChAngeS on InDICAtoRS In lIbeRAl Component InDex
Note: Figure 3.4 displays the number of countries registering significant positive or negative changes on each individual indicator of liberal component over the last ten years. For indicators below the diagonal line more countries are registering negative rather than positive changes. The Equality Before the Law and Individual Liberty Index consists of the following indicators: v2clrspct = Rigorous and impartial public administration; v2cltrnslw = Transparent laws with predictable enforcement; v2clacjstm = Access to justice for men; v2clacjstw = Access to justice for women; v2clprptym = Property rights for men; v2clprptyw = Property rights for women; v2cltort = Freedom from torture; v2clkill = Freedom from political killings; v2clslavem = Freedom from forced labor for men; v2clslavef = Freedom from forced labor for women; v2clrelig = Freedom of religion; v2clfmove = Freedom of foreign movement; v2cldmovem = Freedom of domestic movement for men; v2cldmovew = Freedom of domestic movement for women. The Judicial Constraints on the Executive Index consists of the following indicators: v2exrescon = Executive respects constitution; v2jucomp = Compliance with judiciary; v2juhccomp = Compliance with high court; v2juhcind = High court independence; v2juncind = Lower court independence. The Legislative Constraints on the Executive Index consists of the following indicators: v2lgqstexp = Legislature questions officials in practice; v2lgotovst = Executive oversight; v2lginvstp = Legislature investigates in practice; v2lgoppart = Legislature opposition parties.
v2clacjstmv2clacjstw
v2cldmovemv2cldmovew
v2clfmove
v2clkill
v2clprptym
v2clprptyw v2clrelig
v2clrspct
v2clslavefv2clslavem
v2cltortv2cltrnslw
v2exresconv2jucomp
v2juhccomp
v2juhcindv2juncind
v2lginvstp
v2lgoppart
v2lgotovst
v2lgqstexp
02
46
810
1214
1618
20N
umbe
r of C
ount
ries
Impr
ovin
g
0 2 4 6 8 10 12 14 16 18 20Number of Countries Declining
Equality before the Law Judicial Constraints on the ExecutivLegislative Constraints on the Executive
28
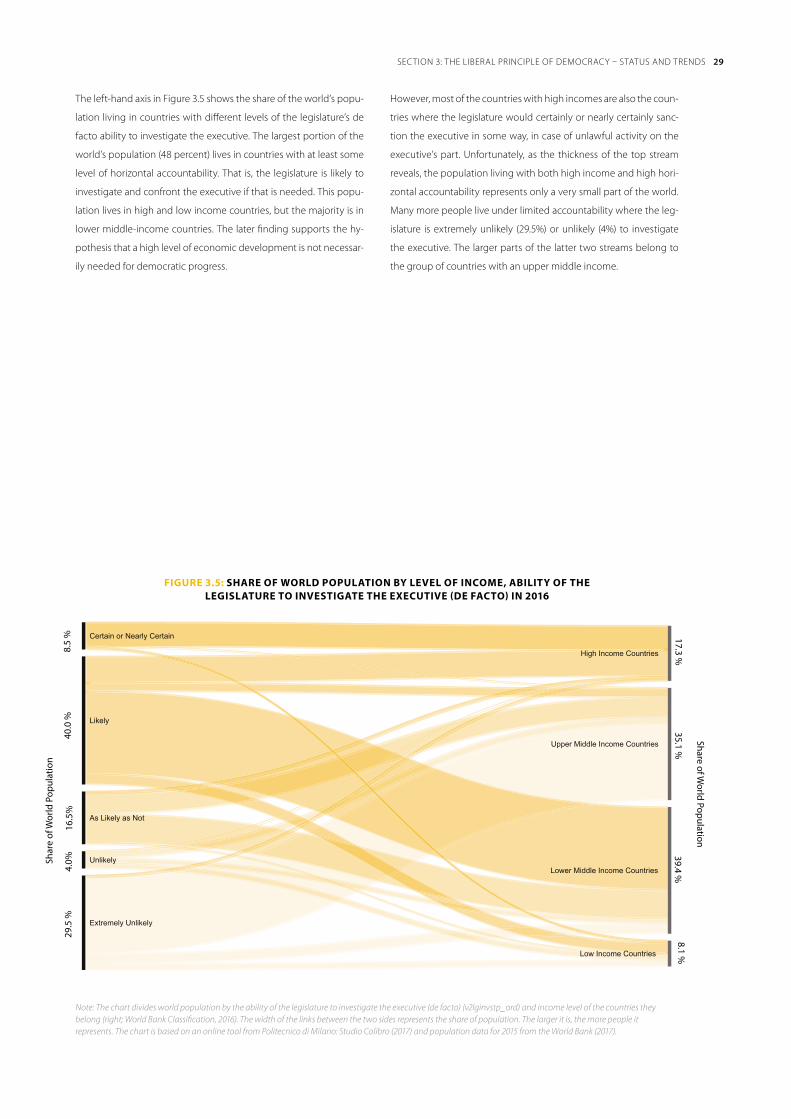
The left-hand axis in Figure 3.5 shows the share of the world’s popu-
lation living in countries with different levels of the legislature’s de
facto ability to investigate the executive. The largest portion of the
world’s population (48 percent) lives in countries with at least some
level of horizontal accountability. That is, the legislature is likely to
investigate and confront the executive if that is needed. This popu-
lation lives in high and low income countries, but the majority is in
lower middle-income countries. The later finding supports the hy-
pothesis that a high level of economic development is not necessar-
ily needed for democratic progress.
However, most of the countries with high incomes are also the coun-
tries where the legislature would certainly or nearly certainly sanc-
tion the executive in some way, in case of unlawful activity on the
executive’s part. Unfortunately, as the thickness of the top stream
reveals, the population living with both high income and high hori-
zontal accountability represents only a very small part of the world.
Many more people live under limited accountability where the leg-
islature is extremely unlikely (29.5%) or unlikely (4%) to investigate
the executive. The larger parts of the latter two streams belong to
the group of countries with an upper middle income.
fIguRe 3.5: ShARe of woRlD populAtIon by leVel of InCome, AbIlIty of the legISlAtuRe to InVeStIgAte the exeCutIVe (De fACto) In 2016
High Income Countries
Upper Middle Income Countries
Lower Middle Income Countries
Low Income Countries
Certain or Nearly Certain
Likely
As Likely as Not
Unlikely
Extremely Unlikely
8.1 %39.4 %
35.1 %17.3 %
29.5
%
4.0%
16
.5%
40.0
%
8.5
%
Shar
e of
Wor
ld P
opul
atio
n
Share of World
Population
Note: The chart divides world population by the ability of the legislature to investigate the executive (de facto) (v2lginvstp_ord) and income level of the countries they belong (right; World Bank Classification, 2016). The width of the links between the two sides represents the share of population. The larger it is, the more people it represents. The chart is based on an online tool from Politecnico di Milano: Studio Colibro (2017) and population data for 2015 from the World Bank (2017).
SECTION 3: THE LIBERAL PRINCIPLE OF DEMOCRACY – STATUS AND TRENDS 29
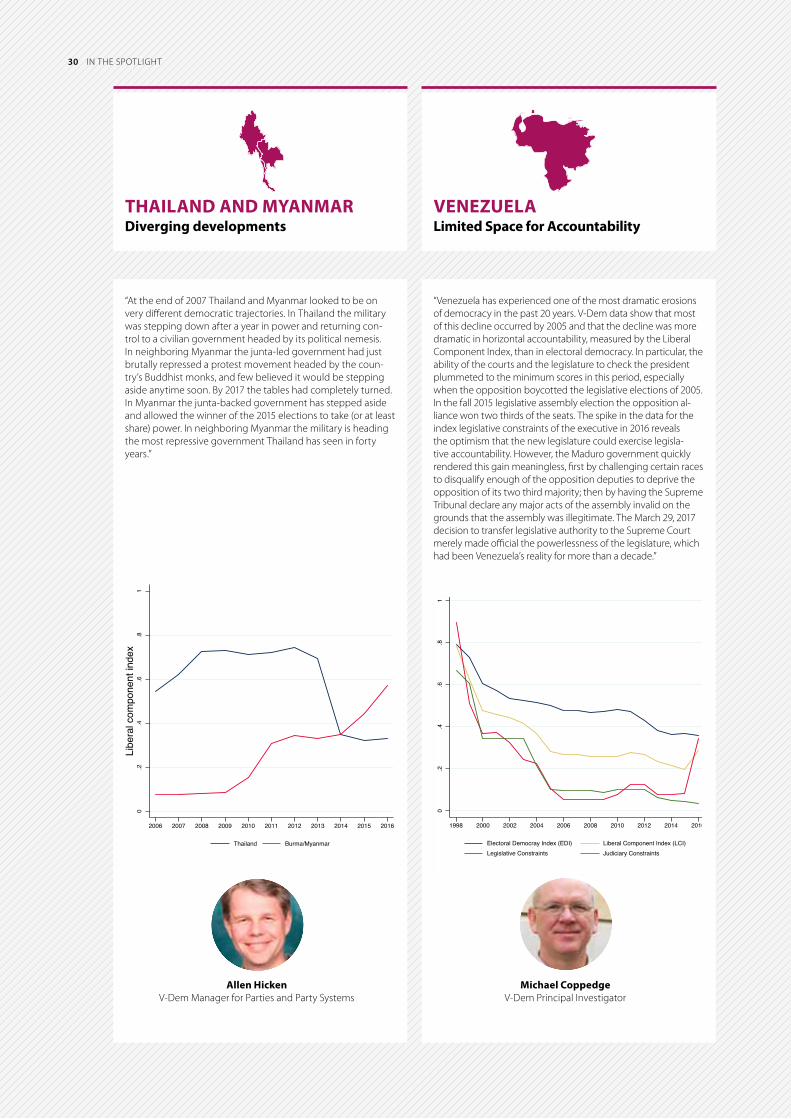
“At the end of 2007 Thailand and Myanmar looked to be on very different democratic trajectories. In Thailand the military was stepping down after a year in power and returning con-trol to a civilian government headed by its political nemesis. In neighboring Myanmar the junta-led government had just brutally repressed a protest movement headed by the coun-try’s Buddhist monks, and few believed it would be stepping aside anytime soon. By 2017 the tables had completely turned. In Myanmar the junta-backed government has stepped aside and allowed the winner of the 2015 elections to take (or at least share) power. In neighboring Myanmar the military is heading the most repressive government Thailand has seen in forty years.”
Allen hickenV-Dem Manager for Parties and Party Systems
“Venezuela has experienced one of the most dramatic erosions of democracy in the past 20 years. V-Dem data show that most of this decline occurred by 2005 and that the decline was more dramatic in horizontal accountability, measured by the Liberal Component Index, than in electoral democracy. In particular, the ability of the courts and the legislature to check the president plummeted to the minimum scores in this period, especially when the opposition boycotted the legislative elections of 2005. In the fall 2015 legislative assembly election the opposition al-liance won two thirds of the seats. The spike in the data for the index legislative constraints of the executive in 2016 reveals the optimism that the new legislature could exercise legisla-tive accountability. However, the Maduro government quickly rendered this gain meaningless, first by challenging certain races to disqualify enough of the opposition deputies to deprive the opposition of its two third majority; then by having the Supreme Tribunal declare any major acts of the assembly invalid on the grounds that the assembly was illegitimate. The March 29, 2017 decision to transfer legislative authority to the Supreme Court merely made official the powerlessness of the legislature, which had been Venezuela’s reality for more than a decade.”
0.2
.4.6
.81
1998 2000 2002 2004 2006 2008 2010 2012 2014 2016
Electoral Democray Index (EDI) Liberal Component Index (LCI)Legislative Constraints Judiciary Constraints
michael CoppedgeV-Dem Principal Investigator
thAIlAnD AnD myAnmARDiverging developments
VenezuelAlimited Space for Accountability
0.2
.4.6
.81
Libe
ral c
ompo
nent
inde
x
2006 2007 2008 2009 2010 2011 2012 2013 2014 2015 2016
Thailand Burma/Myanmar
IN THE SPOTLIGHT30
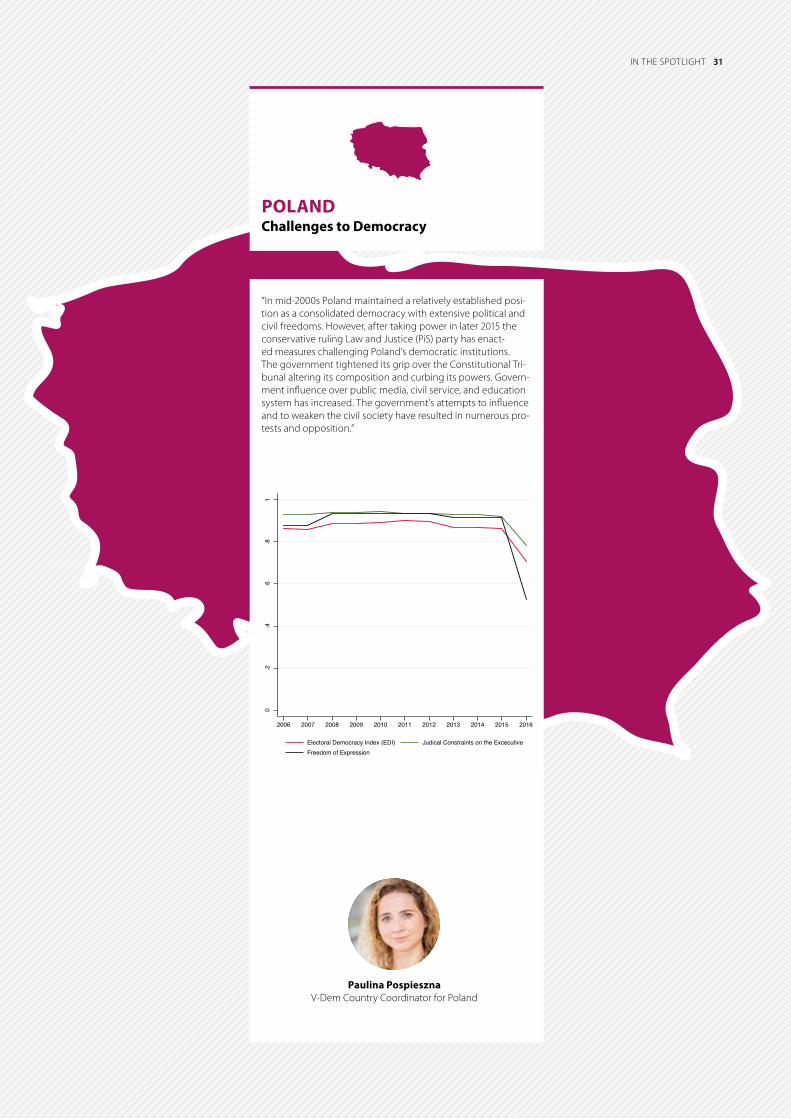
michael bernhardV-Dem Project Manager on Civil Society
and Sovereignty
tahir KilavuzV-Dem Country Coordinator for Algeria
“In mid-2000s Poland maintained a relatively established posi-tion as a consolidated democracy with extensive political and civil freedoms. However, after taking power in later 2015 the conservative ruling Law and Justice (PiS) party has enact-ed measures challenging Poland’s democratic institutions. The government tightened its grip over the Constitutional Tri-bunal altering its composition and curbing its powers. Govern-ment influence over public media, civil service, and education system has increased. The government’s attempts to influence and to weaken the civil society have resulted in numerous pro-tests and opposition.”
0.2
.4.6
.81
2006 2007 2008 2009 2010 2011 2012 2013 2014 2015 2016
Electoral Democracy Index (EDI) Judical Constraints on the ExcecutiveFreedom of Expression
polAnDChallenges to Democracy
paulina pospiesznaV-Dem Country Coordinator for Poland
IN THE SPOTLIGHT 31
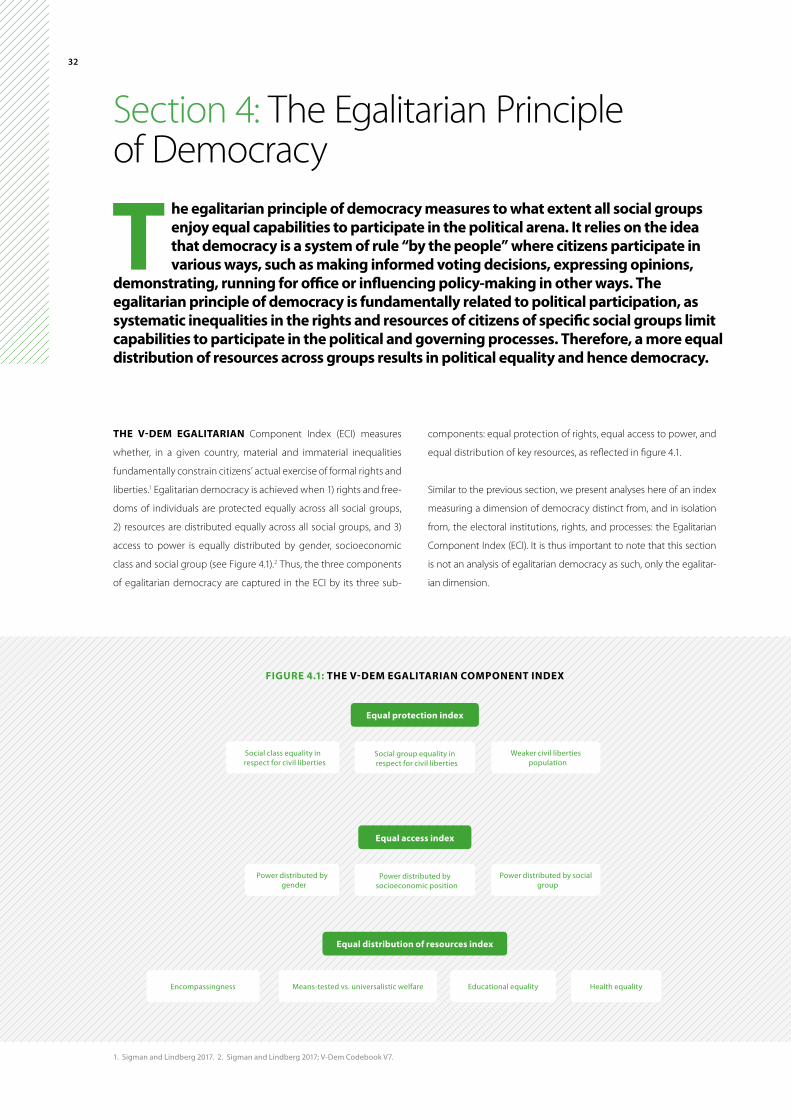
the egalitarian principle of democracy measures to what extent all social groups enjoy equal capabilities to participate in the political arena. It relies on the idea that democracy is a system of rule “by the people” where citizens participate in various ways, such as making informed voting decisions, expressing opinions,
demonstrating, running for office or influencing policy-making in other ways. the egalitarian principle of democracy is fundamentally related to political participation, as systematic inequalities in the rights and resources of citizens of specific social groups limit capabilities to participate in the political and governing processes. therefore, a more equal distribution of resources across groups results in political equality and hence democracy.
Section 4: The Egalitarian Principle of Democracy
the V-Dem egAlItARIAn Component Index (ECI) measures
whether, in a given country, material and immaterial inequalities
fundamentally constrain citizens’ actual exercise of formal rights and
liberties.1 Egalitarian democracy is achieved when 1) rights and free-
doms of individuals are protected equally across all social groups,
2) resources are distributed equally across all social groups, and 3)
access to power is equally distributed by gender, socioeconomic
class and social group (see Figure 4.1).2 Thus, the three components
of egalitarian democracy are captured in the ECI by its three sub-
components: equal protection of rights, equal access to power, and
equal distribution of key resources, as reflected in figure 4.1.
Similar to the previous section, we present analyses here of an index
measuring a dimension of democracy distinct from, and in isolation
from, the electoral institutions, rights, and processes: the Egalitarian
Component Index (ECI). It is thus important to note that this section
is not an analysis of egalitarian democracy as such, only the egalitar-
ian dimension.
1. Sigman and Lindberg 2017. 2. Sigman and Lindberg 2017; V-Dem Codebook V7.
equal protection index
Social class equality in respect for civil liberties
Social group equality in respect for civil liberties
Weaker civil liberties population
fIguRe 4.1: the V-Dem egAlItARIAn Component InDex
equal access index
Compliance with high court
equal distribution of resources index
Power distributed by gender
Power distributed by socioeconomic position
Power distributed by social group
Encompassingness Means-tested vs. universalistic welfare Health equalityEducational equality
32

SECTION 4: THE EGALITARIAN PRINCIPLE OF DEMOCRACY
global and Regional trendsFigure 4.2 shows the trajectory of the egalitarian dimension from 1900
to the end of 2016, using V-Dem’s ECI. Like all V-Dem indices it ranges
from 0 to 1. Zero corresponds to a complete absence of the egalitarian
dimension, while a score of one would indicate that the egalitarian as-
pects of equal protection of rights, equal access to power, and equal
distribution of key resources have been achieved. It is worth noting
that similar to the Electoral Democracy Index, no country in the world
has reached a perfect score yet on this component index.
The black line in the Figure 4.2 (with confidence intervals around it in
shaded grey) depicts an interesting and somewhat different trajec-
tory compared to the other democracy-component indices. We usu-
ally think of the 20th century in terms of the standard ”three waves”
of democratization. On the egalitarian dimension – never measured
systematically across countries and time before – the world has seen
only two “waves” – with no real signs of a reversal in between.
The first wave followed the familiar pattern, with an expansion after
World War I. A tendency toward reversal occurred during World War
II but nothing of the magnitude we observe for other dimensions
of democracy. Then a second, protracted but quite dramatic, wave
swept across the world starting after the war and continued una-
bated until just a few years ago.
For Western Europe and North America this development collapsed
into one single, long wave at the beginning of the 20th century until
its end when stagnation set in. As across all regions, a slight decline
can perhaps be projected.
The slight decline in egalitarian democracy during World War II can
be attributed entirely to changes in Eastern Europe and Central Asia
(red line) after which communism quickly spread egalitarianism. The
region had the highest level of egalitarian democracy in the world
already by the late 1940s. With the fall of the Soviet Union, inequality
increased again. However, the region still outperforms world aver-
age on this dimension of democracy.
Sub-Saharan Africa (yellow line), Latin America and the Caribbean
(green line), Asia-Pacific (purple line) and the MENA (light blue line)
have taken similar paths, starting from low levels during the first
decades of the 20th century, followed by an upward trajectory after
World War II (and a little later in Africa) that continued until recently.
backsliding and Advances – CountriesFigure 4.3 demonstrates the relative stability of the egalitarian di-
mension of democracy in comparison to the other dimensions.
Most countries have remained on substantially the same level of ECI
since 2006. Only five countries record changes that are statistically
significant and among these, Tunisia is the only country that has im-
0.1
.2.3
.4.5
.6.7
.8.9
1
1900 1910 1920 1930 1940 1950 1960 1970 1980 1990 2000 2010
Eastern Europe and Central Asia Latin America and the CaribbeanMENA Sub−Saharan AfricaWestern Europe and North America Asia−PacificWorld Average
Macedonia
Syria
Tunisia
IraqBurundi
0.1
.2.3
.4.5
.6.7
.8.9
1Eg
alita
rian
Com
pone
nt 2
016
0 .1 .2 .3 .4 .5 .6 .7 .8 .9 1Egalitarian Component 2006
Eastern Europe and Central Asia Latin America and the CaribbeanMENA Sub−Saharan AfricaWestern Europe and North America Asia−Pacific
fIguRe 4.2: egAlItARIAn Component InDex (eCI): woRlD AnD RegIonAl AVeRAgeS, 1900 to 2016
Note: Grey shaded areas indicate confidence bends.
fIguRe 4.3: egAlItARIAn Component InDex: RegReSSIng AnD ADVAnCIng CountRIeS between 2006 AnD 2016
Note: Countries above the diagonal line have improved their level of Egalitarian Democracy from 2006 to 2016. Countries below the diagonal line have declined. Only countries with changes at a statistically significant level are labeled.
33
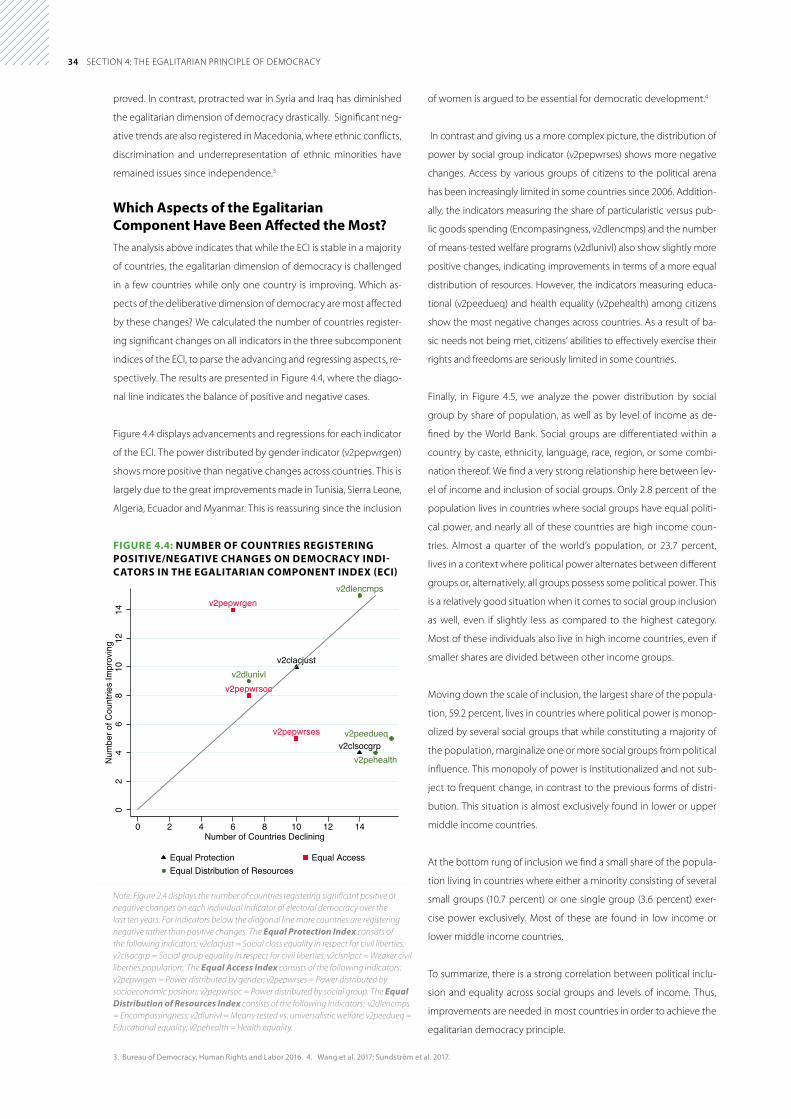
SECTION 4: THE EGALITARIAN PRINCIPLE OF DEMOCRACY
proved. In contrast, protracted war in Syria and Iraq has diminished
the egalitarian dimension of democracy drastically. Significant neg-
ative trends are also registered in Macedonia, where ethnic conflicts,
discrimination and underrepresentation of ethnic minorities have
remained issues since independence.3
which Aspects of the egalitarian Component have been Affected the most?The analysis above indicates that while the ECI is stable in a majority
of countries, the egalitarian dimension of democracy is challenged
in a few countries while only one country is improving. Which as-
pects of the deliberative dimension of democracy are most affected
by these changes? We calculated the number of countries register-
ing significant changes on all indicators in the three subcomponent
indices of the ECI, to parse the advancing and regressing aspects, re-
spectively. The results are presented in Figure 4.4, where the diago-
nal line indicates the balance of positive and negative cases.
Figure 4.4 displays advancements and regressions for each indicator
of the ECI. The power distributed by gender indicator (v2pepwrgen)
shows more positive than negative changes across countries. This is
largely due to the great improvements made in Tunisia, Sierra Leone,
Algeria, Ecuador and Myanmar. This is reassuring since the inclusion
of women is argued to be essential for democratic development.4
In contrast and giving us a more complex picture, the distribution of
power by social group indicator (v2pepwrses) shows more negative
changes. Access by various groups of citizens to the political arena
has been increasingly limited in some countries since 2006. Addition-
ally, the indicators measuring the share of particularistic versus pub-
lic goods spending (Encompasingness, v2dlencmps) and the number
of means-tested welfare programs (v2dlunivl) also show slightly more
positive changes, indicating improvements in terms of a more equal
distribution of resources. However, the indicators measuring educa-
tional (v2peedueq) and health equality (v2pehealth) among citizens
show the most negative changes across countries. As a result of ba-
sic needs not being met, citizens’ abilities to effectively exercise their
rights and freedoms are seriously limited in some countries.
Finally, in Figure 4.5, we analyze the power distribution by social
group by share of population, as well as by level of income as de-
fined by the World Bank. Social groups are differentiated within a
country by caste, ethnicity, language, race, region, or some combi-
nation thereof. We find a very strong relationship here between lev-
el of income and inclusion of social groups. Only 2.8 percent of the
population lives in countries where social groups have equal politi-
cal power, and nearly all of these countries are high income coun-
tries. Almost a quarter of the world’s population, or 23.7 percent,
lives in a context where political power alternates between different
groups or, alternatively, all groups possess some political power. This
is a relatively good situation when it comes to social group inclusion
as well, even if slightly less as compared to the highest category.
Most of these individuals also live in high income countries, even if
smaller shares are divided between other income groups.
Moving down the scale of inclusion, the largest share of the popula-
tion, 59.2 percent, lives in countries where political power is monop-
olized by several social groups that while constituting a majority of
the population, marginalize one or more social groups from political
influence. This monopoly of power is institutionalized and not sub-
ject to frequent change, in contrast to the previous forms of distri-
bution. This situation is almost exclusively found in lower or upper
middle income countries.
At the bottom rung of inclusion we find a small share of the popula-
tion living in countries where either a minority consisting of several
small groups (10.7 percent) or one single group (3.6 percent) exer-
cise power exclusively. Most of these are found in low income or
lower middle income countries.
To summarize, there is a strong correlation between political inclu-
sion and equality across social groups and levels of income. Thus,
improvements are needed in most countries in order to achieve the
egalitarian democracy principle.
v2clacjust
v2clsocgrp
v2pepwrgen
v2pepwrses
v2pepwrsoc
v2dlencmps
v2dlunivl
v2peedueq
v2pehealth
02
46
810
1214
Num
ber o
f Cou
ntrie
s Im
prov
ing
0 2 4 6 8 10 12 14Number of Countries Declining
Equal Protection Equal AccessEqual Distribution of Resources
3. Bureau of Democracy, Human Rights and Labor 2016. 4. Wang et al. 2017; Sundström et al. 2017.
fIguRe 4.4: numbeR of CountRIeS RegISteRIng poSItIVe/negAtIVe ChAngeS on DemoCRACy InDI-CAtoRS In the egAlItARIAn Component InDex (eCI)
Note: Figure 2.4 displays the number of countries registering significant positive or negative changes on each individual indicator of electoral democracy over the last ten years. For indicators below the diagonal line more countries are registering negative rather than positive changes. The Equal Protection Index consists of the following indicators: v2clacjust = Social class equality in respect for civil liberties; v2clsocgrp = Social group equality in respect for civil liberties; v2clsnlpct = Weaker civil liberties population;. The Equal Access Index consists of the following indicators: v2pepwrgen = Power distributed by gender; v2pepwrses = Power distributed by socioeconomic position; v2pepwrsoc = Power distributed by social group. The Equal Distribution of Resources Index consists of the following indicators: v2dlencmps = Encompassingness; v2dlunivl = Means-tested vs. universalistic welfare; v2peedueq = Educational equality; v2pehealth = Health equality.
34

2.8%
23.6
%59
.2 %
10.7
%3.
6 %
8.1 %39.4 %
35.1 %17.3 %
Shar
e of
Wor
ld P
opul
atio
n
Share of World Population
High Income Countries
Upper Middle Income Countries
Lower Middle Income Countrie
Low Income Countries
All Social Groups have Roughly Equal Political Power
All Significant Groups have a Turn at the Seat of Power
Political Power is Monopolized by Several Social Groups Comprising a Majority
Political Power is Monopolized by Several Social Groups Comprising a Minority
Political Power is Monopolized by One Social Group Comprising a Minority
moa olinData Officer at the V-Dem Institute
“Women’s political empowerment has increased significantly in all parts of the world since the end of World War II. Western Europe and North America has as of 2016 come the farthest in regard to women’s empowerment. All other regions, with the exception of the MENA countries, have also seen significant in-creases. Although it is evident that women’s empowerment is still an important struggle in most parts of the world, women have today greater possibilities of choice, agency and participa-tion in the political arena than in the middle of the last century. This is promising for the democratic development.”
Rise in women’s political empowerment
0.1
.2.3
.4.5
.6.7
.8.9
1
1945 1955 1965 1975 1985 1995 2005 2015
Eastern Europe and Central Asia Latin America and the CaribbeanMENA Sub−Saharan AfricaWestern Europe and North America Asia−PacificWorld Average
SECTION 4: THE EGALITARIAN PRINCIPLE OF DEMOCRACY
fIguRe 4.5: ShARe of woRlD populAtIon, by leVel of poweR DIStRIbutIon ACRoSS SoCIAl gRoupS, AnD by InCome In 2016
Note: The chart divides world population by power distribution by social group (v2pepwrsoc_ord) and income level of the countries they belong (right; World Bank Classification). The width of the links between the two sides represents the share of population. The larger it is, the more people it represents. The chart is based on an online tool from Politecnico di Milano: Studio Colibro (2017) and population data for 2015 from the World Bank (2017).
V-Dem Women Empowerment Index: Global and Regional Trends
35

t he participatory principle of democracy emphasizes active participation by citizens in all political processes, electoral and non-electoral. this principle prefers direct rule by citizens as practicable. the V-Dem participatory Component Index (pCI) takes into account four important aspects of citizen
participation: civil society organizations, mechanisms of direct democracy, and participation and representation through local and regional governments (figure 5.1). four different V-Dem indices capture these aspects and are the basis for the pCI.
Section 5: The Participatory Principle of Democracy – Status and Trends
the V-Dem CIVIl SoCIety pARtICIpAtIon index reflects par-
ticipation in civil society organizations that bridge the divide be-
tween popular and the state spheres of activity, specifically in the
form of labor unions, interest groups and other non-governmental
organizations. We assess the extent of civil society participation
through questions about the selection of national legislative candi-
dates (v2pscnslnl), the degree to which policymakers consult major
civil society organizations (v2cscnsult), the extent to which people
are involved in civil society organizations (v2csprtcpt) and the extent
of women’s participation in civil society (v2csgender).
Mechanisms of direct democracy make it possible for citizens to decide
or express their opinion on issues directly at the ballot box through a
universal and secret vote. The V-Dem Direct Popular Vote Index meas-
ures the strength and quality of direct democracy in a state. It does so
by analyzing how easy it is to initiate and approve different types of
popular voting and how consequential these votes are.1
The two subnational V-Dem indices capture popular participation and
representation in both regional governments, the level below the na-
tional government, and the level below regional governments, the lo-
cal level.2 The existence of subnational governments (local: v2ellocgov/
regional: v2elreggov) can facilitate citizens’ political engagement be-
cause they deal with concerns potentially more proximate to citizens’
day-to-day life than those at the national level. Free and fair elections
of subnational governments allow citizens to fully participate in the
selection of their local or regional officials (local: v2ellocelc/ regional:
v2elsrgel). If, in turn, these elected officials have authority relative to
non-elected officials (regional: v2ellocpwr/ local: v2elrgpwr) it enables
them to act on their citizens’ preferences and thus ensure more inclu-
sive, participatory and representative decision-making.
In the V-Dem datasets, the PCI is combined with the Electoral De-
mocracy Index (EDI) to measure the concept of participatory de-
mocracy. This combined measure is the Participatory Democracy
1. Altman 2016. 2. McMann Forthcoming. 3. Buxton and Konovalova 2012.
David AltmanV-Dem Project Manager on Direct democracy
“The increase in the national uses of mechanisms of direct democ-racy is notably positive and statistically significant since 1900. Actu-ally, the year 2016 denotes the apex in their use. Nonetheless, once we dig out which type of mechanism is used the most, plebiscites and obligatory referendums clearly lead over popular initiatives or derogatory referendums. This is not good news. Actually, in many instances plebiscites are used to bypass other states bodies (such as legislatures), as a legitimizing weapon of a leader, or as a mean to avoid the political price of adopting a tough policy.”
Rise in Direct Democracy?
0.2
.4.6
.81
1900 1910 1920 1930 1940 1950 1960 1970 1980 1990 2000 2010
World Average Direct Popular Vote Index Electoral Democracy
36

Candidate selection-National/local CSO consultation CSO participatory
environmentCSO womens participation
fIguRe 5.1: the V-Dem pARtICIpAtoRy Component InDex (pCI)
Index. Countries can, at least theoretically, have high scores for par-
ticipation on the PCI without having a high level of electoral democ-
racy. Such countries would not score very high on the Participatory
Democracy Index because they lack requisite electoral processes
and rights. This section focuses on the PCI, not the Participatory De-
mocracy Index, because we want to focus on participation, concep-
tually disaggregated from electoral democracy.
global and Regional trendsFigure 5.2 displays the level of popular participation in politics
across the world from 1900 to 2016 using V-Dem’s PCI. The values of
the PCI run from 0 (total absence of participation) to 1 (full partici-
pation). On the world average, the level of participation has stead-
ily improved over the last century and there is hardly any decline in
recent years. At 0.465, the 2016 world average remains close to the
all-time high of 0.467 in 2014. However, room for improvement in
participation remains.
Over time, the most important changes in participation have occurred
in the region of Eastern Europe and Central Asia. Starting at a point
near the world average in 1900, participatory democracy increased
dramatically after the fall of the Russian Empire when local move-
ments, such as peasants and proletarian organizations, emerged in
the 1920s. In the beginning of the 1930s, however, the level of partici-
pation decreased after the government enforced collectivization of
agriculture; the level lowered drastically during the internal political
purges in the late 1930s.3 These events mark the beginning of a period
of repression of civil society that gave no room to participatory de-
mocracy. Only the dissolution of the Soviet Union in the 1990s and the
independence of its constituent entities triggered a rapid increase of
participatory democracy in Eastern Europe and Central Asia. After this
point, the level of participation overtook other regions of the world
including MENA, Asia and the Pacific and Sub-Saharan Africa.
fIguRe 5.2: pARtICIpAtoRy Component InDex (DCI): woRlD AnD RegIonAl AVeRAgeS, 1900 to 2016
0.1
.2.3
.4.5
.6.7
.8.9
1
1900 1910 1920 1930 1940 1950 1960 1970 1980 1990 2000 2010
Eastern Europe and Central Asia Latin America and the CaribbeanMENA Sub−Saharan AfricaWestern Europe and North America Asia−PacificWorld Average
SECTION 5: THE PARTICIPATORY PRINCIPLE OF DEMOCRACY – STATUS AND TRENDS
Civil society participation index
Direct popular vote index local government index
Local government elected Local offices relative power Local government
exists
Regional government index
Regional government elected Regional offices relative power Regional government
exists
37

In Latin America and the Caribbean during the 1990s we observe
similarly steep improvements in participation. This trend reflects so-
cial, economic and political transition and reform following the col-
lapse of the dictatorships that dominated the region in the 1970s
and 1980s. By 2016, participation in Latin America and the Caribbean
were above the world average, although the data indicates a slight,
but not statistically significant, decrease since the mid-2000s.
The MENA region shows a bumpy trend of improving participation,
with a minor drop after the turn of the century. This trend set the
stage for a rapid increase in participation during the Arab Spring,
though the trend reversed in more recent years. However, it is worth
noting that the current level of participatory democracy in the MENA
is still higher than it was before the Arab Spring. By the end of 2016,
Western Europe and North America display the highest score on the
PCI in the world, though this score has stagnated in recent decades.
backsliding and Advances - CountriesAggregate numbers are useful to describe overall patterns but
mask variation in country trajectories. In this section, we highlight
the countries that have made the greatest strides and backslides
in popular political participation in the last decade. Compared to
other democratic principles, the PCI has been relatively stable in re-
cent years. Over the last 10 years, only nine countries have improved
their PCI score at a statistically significant level, while seven countries
have registered a decline by the same criterion. All other countries
have remained stable. We report detailed country-level figures in
Part III of this report.
Figure 5.3 shows the level of the PCI in selected countries in 2006
compared to 2016. Countries above the diagonal line have im-
proved over the course of that time period, while countries below
the line have declined in their scores. We find improvements in
three Asian countries: Sri Lanka, East Timor and Myanmar. This find-
ing corresponds to an overall improvement of democracy in these
countries. The same applies for Tunisia, Georgia and Malawi. Even in
Libya, after the fall of Gaddafi, participation in civil society organi-
zations and local governments improved notably even though the
country has descended into chaos in recent years. Also noteworthy
is the improvement in Oman due to the first-ever local elections in
2012. The downward trend in Senegal and Yemen corresponds to
the overall worsening of the political situation in these countries.
The PCI registers significant changes over the last ten years in five
Western countries. While direct democracy potential in Canada is
very low, in terms of local and regional elections, as well as civil soci-
ety participation, the scores for Canada in recent years are near the
top of the scale. As a result, Canada attained the highest PCI score in
2016. Austria and Australia closely follow Canada. We register some
decline in Iceland and the United States due to slightly lower scores
for local elections (in both the US and Iceland) and civil society par-
ticipation (US). However, both countries remain at a relatively high
level of participation. Conversely, the Ireland’s score dropped steep-
ly in 2013. Ireland’s decreasing scores are a function of weakening
local governance. The Council of Europe harshly criticized deficits
in local governance in Ireland in 20134 and, in 2014, the Local Gov-
ernment Reform Act further centralized government by abolishing
town councils.5
which Aspects of the participatory principle Changed the most?By calculating the number of countries registering significant chang-
es on each of the individual indicators that comprise the PCI, we can
parse where democracy is advancing or regressing considerably.
Figure 5.4 presents the results from these analyses. The 45 degree
diagonal line indicates where a given indicator would fall if an equal
number of cases registered statistically significant changes in posi-
tive and negative directions. If an indicator falls below the line, more
countries register negative changes than positive on the indicator.
Findings regarding local government give cause for optimism: the
power of elected officials at the local level compared to non-elect-
ed local officials has increased in 20 countries, whereas this form of
relative power has declined in only four countries. Increasing local
power presents the possibility for elected officials to act on voters’
preferences, contributing to the participatory principle of democ-
racy. At the regional level, the number of countries with positive and
negative changes with regard to the power of elected regional of-
ficials is equivalent.
GeorgiaLibya
Oman
Qatar
Tunisia
Yemen
LiberiaMalawi
Senegal
Canada
Iceland
Ireland
United States
MyanmarEast Timor
Sri Lanka
0.1
.2.3
.4.5
.6.7
.8.9
1Pa
rtici
pato
ry C
ompo
nent
201
6
0 .1 .2 .3 .4 .5 .6 .7 .8 .9 1Participatory Component 2006
Eastern Europe and Central Asia Latin America and the CaribbeanMENA Sub−Saharan AfricaWestern Europe and North America Asia−Pacific
4. Council of Europe 2013. 5. Quinlivan 2014.
SECTION 5: THE PARTICIPATORY PRINCIPLE OF DEMOCRACY – STATUS AND TRENDS
fIguRe 5.3: pARtICIpAtoRy Component InDex (pCI): RegReSSIng AnD ADVAnCIng CountRIeS between 2006 AnD 2016
Note: Countries above the diagonal line have improved their level of participation from 2006 to 2016. Countries below the diagonal line have deteriorated.
38

The indicators that comprise the Civil Society Participation Index
show a mixed picture. The participatory environment for CSOs –
meaning the existence of independent CSOs and popular involve-
ment in them – improved in 18 countries, such as Bhutan, Tunisia
and Sri Lanka. The CSO environment worsened in seven countries,
including Burundi, Ethiopia, Turkey and Albania. Equally importantly,
the number of women participating in CSOs increased in ten coun-
tries but declined in six.
We also register great volatility in terms of consultation with civil so-
ciety organizations. In many countries, policymakers extended con-
sultations to major organizations when taking decisions on relevant
policies. However, in a slightly larger number of countries the gov-
ernments decreased their consultations. There is some volatility re-
garding the indicator on candidate selection within parties for na-
tional legislative elections, with ten countries improving and eight
declining. Often, the power to select candidates is divided between
local actors, regional or state-level party organizations, and national
party leaders. The more directly the candidates are chosen by citi-
zens, the more democratic the selection process. The use of direct
democracy mechanisms has been increasing worldwide, in demo-
cratic as well as autocratic systems, but remains overall at a low level.
Figure 5.5 further zooms-in on the participatory environment of
CSOs. It shows the share of world population by the kind of partici-
patory environment and the income level they live in. Only very few
people (0.07%) live in countries where most organizations are state-
sponsored, namely Cuba, Eritrea, North Korea, Qatar, Syria, Turkmeni-
stan and Uzbekistan (bottom line on the left). Most people live in
countries with a large number of CSOs and are either minimally
(41.8%) or at least occasionally active in them (32.6%).
CSO Consultation
CSO Women Participation
CSO Participatory Environment
Candidate Selection
Local Government Relative Power
Regional Government Relative Power
02
46
810
1214
1618
20N
umbe
r of C
ount
ries
Impr
ovin
g
0 2 4 6 8 10 12 14 16 18 20Number of Countries Declining
fIguRe 5.5: ShARe of woRlD populAtIon by pARtICIpAtoRy enVIRonment foR CSoS AnD InCome In 2016
0.07
%32
.6%
24.8
%41
.8%
High Income Countries
Upper Middle Income Countries
Lower Middle Income Countries
Low Income Countries
Voluntary CSOs Exists but Few People are Active in Them
There are Many Diverse CSOs and Popular Involvment is Minimal
Most Associations are State-Sponsored
There are Many Diverse CSOs and People are Occasionally Active
8.1 %39.4 %
35.1 %17.3 %
Shar
e of
Wor
ld P
opul
atio
n
Share of World Population
Note: The chart divides world population by participatory environment for CSOs (v2csprtcpt_ord; left) and income level of the countries to which they belong (right; World Bank Classification). The width of the links between the two sides represents the share of population. The larger it is, the more people it represents. The chart is based on an online tool from Politecnico di Milano: Studio Colibro (2017) and population data for 2015 from the World Bank (2017).
fIguRe 5.4: numbeR of CountRIeS RegISteRIng poSItIVe/ negAtIVe ChAngeS on pARtICIpAtoRy Component InDICAtoRS
Note: Figure 5.4 displays the number of countries registering significant positive or negative changes on indicators of the PCI over the last ten years. For indicators below the diagonal line more countries registered negative rather than positive changes. Several indicators included in the PCI are coded by V-Dem Project Managers directly instead of using the standard procedure involving country expert coders (e.g. the Direct Popular Vote Index). They do not include estimates of uncertainty and are therefore not included in this figure.
SECTION 5: THE PARTICIPATORY PRINCIPLE OF DEMOCRACY – STATUS AND TRENDS 39
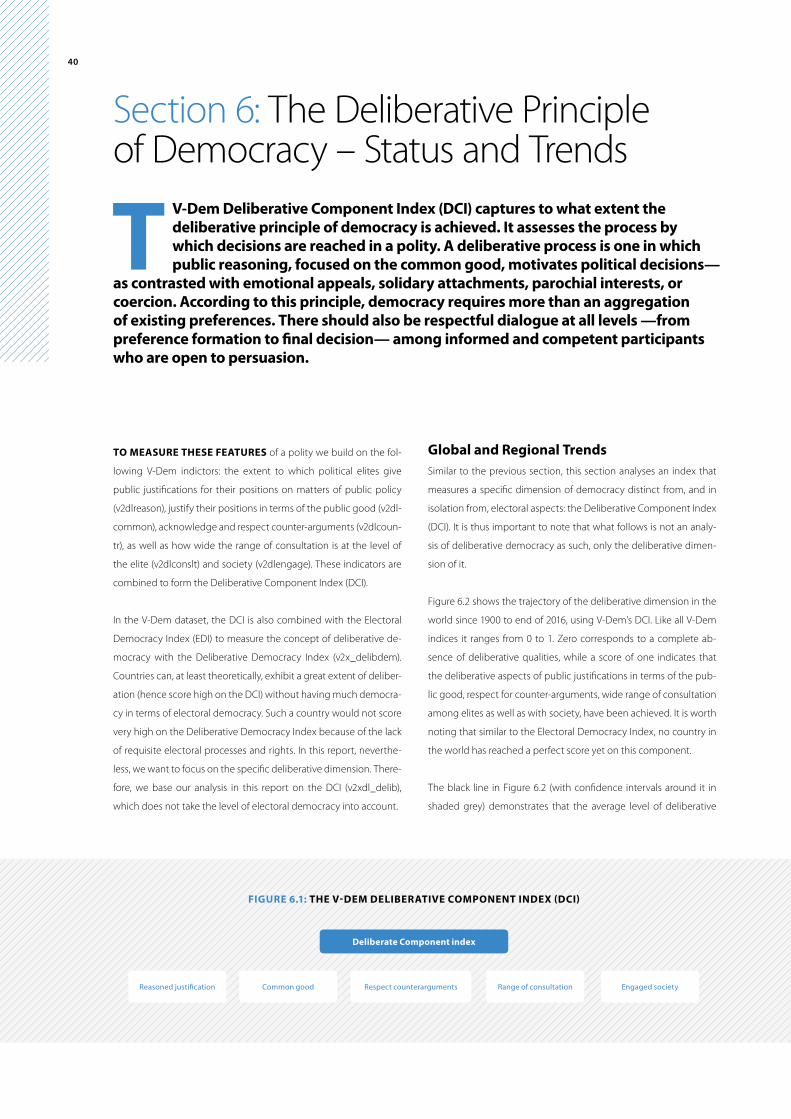
t V-Dem Deliberative Component Index (DCI) captures to what extent the deliberative principle of democracy is achieved. It assesses the process by which decisions are reached in a polity. A deliberative process is one in which public reasoning, focused on the common good, motivates political decisions—
as contrasted with emotional appeals, solidary attachments, parochial interests, or coercion. According to this principle, democracy requires more than an aggregation of existing preferences. there should also be respectful dialogue at all levels —from preference formation to final decision— among informed and competent participants who are open to persuasion.
Section 6: The Deliberative Principle of Democracy – Status and Trends
to meASuRe theSe feAtuReS of a polity we build on the fol-
lowing V-Dem indictors: the extent to which political elites give
public justifications for their positions on matters of public policy
(v2dlreason), justify their positions in terms of the public good (v2dl-
common), acknowledge and respect counter-arguments (v2dlcoun-
tr), as well as how wide the range of consultation is at the level of
the elite (v2dlconslt) and society (v2dlengage). These indicators are
combined to form the Deliberative Component Index (DCI).
In the V-Dem dataset, the DCI is also combined with the Electoral
Democracy Index (EDI) to measure the concept of deliberative de-
mocracy with the Deliberative Democracy Index (v2x_delibdem).
Countries can, at least theoretically, exhibit a great extent of deliber-
ation (hence score high on the DCI) without having much democra-
cy in terms of electoral democracy. Such a country would not score
very high on the Deliberative Democracy Index because of the lack
of requisite electoral processes and rights. In this report, neverthe-
less, we want to focus on the specific deliberative dimension. There-
fore, we base our analysis in this report on the DCI (v2xdl_delib),
which does not take the level of electoral democracy into account.
global and Regional trendsSimilar to the previous section, this section analyses an index that
measures a specific dimension of democracy distinct from, and in
isolation from, electoral aspects: the Deliberative Component Index
(DCI). It is thus important to note that what follows is not an analy-
sis of deliberative democracy as such, only the deliberative dimen-
sion of it.
Figure 6.2 shows the trajectory of the deliberative dimension in the
world since 1900 to end of 2016, using V-Dem’s DCI. Like all V-Dem
indices it ranges from 0 to 1. Zero corresponds to a complete ab-
sence of deliberative qualities, while a score of one indicates that
the deliberative aspects of public justifications in terms of the pub-
lic good, respect for counter-arguments, wide range of consultation
among elites as well as with society, have been achieved. It is worth
noting that similar to the Electoral Democracy Index, no country in
the world has reached a perfect score yet on this component.
The black line in Figure 6.2 (with confidence intervals around it in
shaded grey) demonstrates that the average level of deliberative
Reasoned justification Common good Respect counterarguments Range of consultation Engaged society
fIguRe 6.1: the V-Dem DelIbeRAtIVe Component InDex (DCI)
Deliberate Component index
40

SECTION 6: THE DELIBERATIVE PRINCIPLE OF DEMOCRACY – STATUS AND TRENDS
qualities in the world records a slight – but not statistically signifi-
cant - decline during the last few years after peaking around 2012.
From 1900 and through the 20th century, the DCI tracks the pattern
of the “three waves” of democratization: an increase after World War
I, decline during World War II, uptake again during the second wave,
and slight regression into the 1970s, followed by expansion during
the third wave starting in earnest in the mid-1970s. Even the levels of
“deliberativeness” on the 0 to 1 scale are similar to the ones record-
ed by the Electoral Democracy Index (EDI). From this perspective, it
seems that the deliberative dimension of democracy covaries with
the gains and losses in electoral aspects of democracy, and much
more so than other dimensions of democracy (liberal, participa-
tory, egalitarian). Perhaps this makes sense: clean, fair, inclusive elec-
toral institutions and processes with extensive freedom of speech
and media should arguably put a premium on deliberative quali-
ties, such as wide ranging consultations based on reasoned justifi-
cations for the common good and respect for counter-arguments.
Conversely, high quality of debate and consultation by elites, who
show respect for each other and interest in the public good, should
make it much easier to conduct, and thus further, free and fair, in-
clusive electoral processes. Ultimately, we should probably not be
surprised that the deliberative dimension is the one that follows the
EDI most closely.1
fIguRe 6.2: DelIbeRAtIVe Component InDex (DCI): woRlD AnD RegIonAl AVeRAgeS, 1900 to 2016
Regional trends in the deliberative principle also follow the devel-
opment of the EDI by region (discussed in Section 2) closely. For
instance, in terms of developments in Western Europe and North
America (the dark blue line), we recognize the three waves of de-
mocratization. We may note, however, that the deliberative princi-
ple is at a substantially higher level in the early decades of the 20th
century than the EDI. It is thus possible to record substantial levels of
deliberative qualities in the circles of elites, even if aspects, such as
suffrage, are still highly restricted. Since Western Europe and North
America is also a region with many of the established, stable democ-
racies, this raises an interesting specter of sequence: perhaps it is ad-
vantageous to develop the deliberative dimension among smaller
groups of elites early, or even before far-ranging democratization.
Pending further investigation, we leave this as an open question and
food for thought here.
Advance and Decline – CountriesFor a vast majority of countries in the world (88 percent), the DCI
did not change significantly in the l0 years between 2006 and 2016.
However, among the countries undergoing a change during the pe-
riod, those with a significant decline (N=15) outnumber those where
deliberative practices improved (N=8). In Figure 6.3 we compare DCI
scores from 2006 to 2016 at country level. Countries with no signifi-
cant change cluster along the diagonal line following their level on
the DCI.
Four countries in Africa (dark blue), at very different 2006-levels on
the DCI, register significant declines by 2016; Burundi, Guinea-Bissau,
Zambia, and Mauritius. The latter is a little disconcerting for one rea-
son. One of two older and established democracies, Mauritius has
been best in class in Africa. The small island state hosted a culture
of respectful, reasoned debate between elites competing for power
since independence. The index registers signs of a decline in those
qualities since 2012 even though Mauritius still scores relatively high.
In Latin America, three countries slid back substantially on the de-
liberative dimension of democracy: Brazil, Nicaragua, and the most
pronounced case – Venezuela after the election of Hugo Chavez.
The promise of a 21st century socialism has resulted in, among other
things, reduced scope for deliberation in the country. The Chavez
administration disrupted a continuous trajectory of progressively
greater deliberative qualities starting in 1941, which reached its peak
in 1998 with a score of 0.91 on the DCI. The negative trend contin-
ued after the death of Hugo Chávez in 2013, resulting in a score of
merely 0.13 in 2016. This demonstrates the extent of the decay in the
quality of the Venezuelan political climate.
1. This is also corroborated by pairwise correlations: the strongest correlation is found between the EDI and the DCI at 0.88.
0.1
.2.3
.4.5
.6.7
.8.9
1
1900 1910 1920 1930 1940 1950 1960 1970 1980 1990 2000 2010
Eastern Europe and Central Asia Latin America and the CaribbeanMENA Sub−Saharan AfricaWestern Europe and North America Asia−PacificWorld Average
41
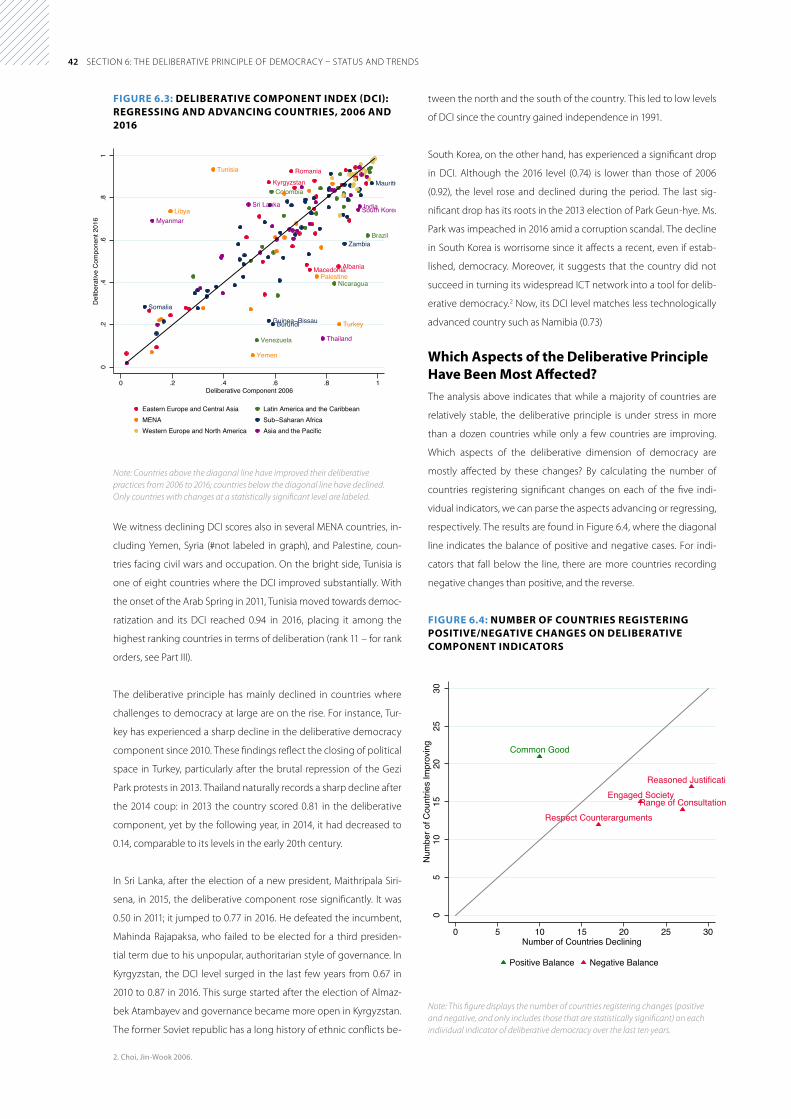
SECTION 6: THE DELIBERATIVE PRINCIPLE OF DEMOCRACY – STATUS AND TRENDS
fIguRe 6.3: DelIbeRAtIVe Component InDex (DCI): RegReSSIng AnD ADVAnCIng CountRIeS, 2006 AnD 2016
Note: Countries above the diagonal line have improved their deliberative practices from 2006 to 2016; countries below the diagonal line have declined. Only countries with changes at a statistically significant level are labeled.
We witness declining DCI scores also in several MENA countries, in-
cluding Yemen, Syria (#not labeled in graph), and Palestine, coun-
tries facing civil wars and occupation. On the bright side, Tunisia is
one of eight countries where the DCI improved substantially. With
the onset of the Arab Spring in 2011, Tunisia moved towards democ-
ratization and its DCI reached 0.94 in 2016, placing it among the
highest ranking countries in terms of deliberation (rank 11 – for rank
orders, see Part III).
The deliberative principle has mainly declined in countries where
challenges to democracy at large are on the rise. For instance, Tur-
key has experienced a sharp decline in the deliberative democracy
component since 2010. These findings reflect the closing of political
space in Turkey, particularly after the brutal repression of the Gezi
Park protests in 2013. Thailand naturally records a sharp decline after
the 2014 coup: in 2013 the country scored 0.81 in the deliberative
component, yet by the following year, in 2014, it had decreased to
0.14, comparable to its levels in the early 20th century.
In Sri Lanka, after the election of a new president, Maithripala Siri-
sena, in 2015, the deliberative component rose significantly. It was
0.50 in 2011; it jumped to 0.77 in 2016. He defeated the incumbent,
Mahinda Rajapaksa, who failed to be elected for a third presiden-
tial term due to his unpopular, authoritarian style of governance. In
Kyrgyzstan, the DCI level surged in the last few years from 0.67 in
2010 to 0.87 in 2016. This surge started after the election of Almaz-
bek Atambayev and governance became more open in Kyrgyzstan.
The former Soviet republic has a long history of ethnic conflicts be-
tween the north and the south of the country. This led to low levels
of DCI since the country gained independence in 1991.
South Korea, on the other hand, has experienced a significant drop
in DCI. Although the 2016 level (0.74) is lower than those of 2006
(0.92), the level rose and declined during the period. The last sig-
nificant drop has its roots in the 2013 election of Park Geun-hye. Ms.
Park was impeached in 2016 amid a corruption scandal. The decline
in South Korea is worrisome since it affects a recent, even if estab-
lished, democracy. Moreover, it suggests that the country did not
succeed in turning its widespread ICT network into a tool for delib-
erative democracy.2 Now, its DCI level matches less technologically
advanced country such as Namibia (0.73)
which Aspects of the Deliberative principle have been most Affected?The analysis above indicates that while a majority of countries are
relatively stable, the deliberative principle is under stress in more
than a dozen countries while only a few countries are improving.
Which aspects of the deliberative dimension of democracy are
mostly affected by these changes? By calculating the number of
countries registering significant changes on each of the five indi-
vidual indicators, we can parse the aspects advancing or regressing,
respectively. The results are found in Figure 6.4, where the diagonal
line indicates the balance of positive and negative cases. For indi-
cators that fall below the line, there are more countries recording
negative changes than positive, and the reverse.
fIguRe 6.4: numbeR of CountRIeS RegISteRIng poSItIVe/negAtIVe ChAngeS on DelIbeRAtIVe Component InDICAtoRS
Note: This figure displays the number of countries registering changes (positive and negative, and only includes those that are statistically significant) on each individual indicator of deliberative democracy over the last ten years.
Albania
Kyrgyzstan
Macedonia
Romania
Brazil
Colombia
Nicaragua
Venezuela
Libya
Palestine
Tunisia
Turkey
Yemen
BurundiGuinea−Bissau
Mauritiu
Somalia
Zambia
Myanmar
IndiaSouth KoreaSri Lanka
Thailand
0.2
.4.6
.81
Del
iber
ativ
e C
ompo
nent
201
6
0 .2 .4 .6 .8 1Deliberative Component 2006
Eastern Europe and Central Asia Latin America and the CaribbeanMENA Sub−Saharan AfricaWestern Europe and North America Asia and the Pacific
2. Choi, Jin-Wook 2006.
Common Good
Range of ConsultationRespect Counterarguments
Engaged SocietyReasoned Justificatio
05
1015
2025
30N
umbe
r of C
ount
ries
Impr
ovin
g
0 5 10 15 20 25 30Number of Countries Declining
Positive Balance Negative Balance
42

On the positive side in Figure 6.4, the indicator for common good –
capturing “When important policy changes are being considered, to
what extent do political elites justify their positions in terms of the
common good?” – is making gains in 21 countries, whereas only 10
countries register significant decline.
Yet, four out of five indicators portray a negative balance. We first
note that all the deliberative indicators are located off the diago-
nal, and they convey significant volatility. Even for the least affected
variable (respect for counterarguments) 17 countries faced reversals
and an additional 12 recorded gains, meaning that a total 29 coun-
tries changed significantly over the last ten years. The most vola-
tile variable is reasoned justification – capturing “When important
policy changes are being considered, i.e. before a decision has been
made, to what extent do political elites give public and reasoned
justifications for their positions?” with 28 countries backsliding and
17 countries changing for the better.
In particular, declines in the engaged society indicator – measur-
ing to what extent “When important policy changes are being con-
sidered, how wide and how independent are public deliberations?”
– are worrisome because this indicator captures a key principle of
open, deliberative democratic processes. This indicator has not only
declined in countries such as the United States in 2016, but also in
countries considered to be success stories for the third wave of de-
mocratization, such as Ghana and Mongolia, as well as in global
powers such as Brazil and India. In particular, India’s troubles in terms
of deliberation and openness of the decision-making process come
as a surprise, because broad deliberation was historically an impor-
tant aspect of Indian democracy.3 The fact that India is declining
drastically on this indicator (-1.4 over the last ten years) means that a
huge share of the world’s population has fewer chances to be heard.
In Figure 6.5 we analyze the level of societal engagement, by share
of world population and income levels in 2016. A plurality, 44 per-
cent, of the world’s population lives in places where public delib-
eration is infrequent – for instance in China – or even have no (2%)
or a limited chance to participate in public deliberations (8%). This
means that, as of 2016, a plurality of the world’s population still has
but little voice in the policy making process. Public deliberation
tends to be encouraged more in high income countries than in
poorer countries.
3. Parthasarathy and Vijayendra 2017.
fIguRe 6.5: ShARe of woRlD populAtIon by leVel of SoCIetAl engAgement AnD InCome In 2016
Note: The chart divides world population by level of societal engagement (v2dlengage_ord; left) and income level of the countries to which they belong (right; World Bank Classification; 2016). The width of the links between the two sides represents the share of population. The larger it is, the more people it represents. The chart is based on an online tool from Politecnico di Milano: Studio Colibro (2017) and population data for 2015 from the World Bank (2017).
High Income Countries
Upper Middle Income Countries
Lower Middle Income Countries
Low Income Countries
Common and Unconstrained Public Deliberation
Broad Public Deliberation
Encouraged but Confined Public Deliberation
Infrequent Public Deliberation
Limited Public Deliberation
No Public Deliberation
8.1 %39.4 %
35.1 %17.3 %
Share of World Population
1.7
%8,
4 %
19.1
%44
.8%
23.9
%
Shar
e of
Wor
ld P
opul
atio
n
1.9
%SECTION 6: THE DELIBERATIVE PRINCIPLE OF DEMOCRACY – STATUS AND TRENDS 43

Rank Score SD+/- Rank Score SD+/- Rank Score SD+/- Rank Score SD+/- Rank Score SD+/- Rank Score SD+/-France 1 0.874 0.035 1 0.925 0.029 9 0.944 0.024 8 0.915 0.044 5 0.656 0.038 13 0.932 0.035Sweden 2 0.873 0.040 2 0.908 0.035 2 0.969 0.015 14 0.906 0.044 21 0.622 0.030 3 0.983 0.011Norway 3 0.854 0.045 5 0.892 0.040 3 0.966 0.017 1 0.971 0.019 16 0.638 0.022 1 0.989 0.008Estonia 4 0.850 0.039 3 0.902 0.031 8 0.945 0.030 18 0.887 0.050 4 0.660 0.039 8 0.945 0.031Denmark 5 0.844 0.047 8 0.881 0.043 1 0.970 0.018 2 0.952 0.030 7 0.651 0.016 4 0.974 0.016Costa Rica 6 0.844 0.043 4 0.897 0.037 10 0.944 0.028 22 0.873 0.051 31 0.605 0.038 9 0.942 0.029Australia 7 0.841 0.046 6 0.887 0.041 4 0.956 0.022 30 0.843 0.061 3 0.672 0.033 15 0.930 0.036Netherlands 8 0.821 0.048 12 0.868 0.045 5 0.954 0.022 10 0.912 0.043 43 0.586 0.042 18 0.925 0.040Switzerland 9 0.820 0.048 9 0.879 0.042 14 0.935 0.031 7 0.919 0.045 10 0.644 0.023 2 0.986 0.009New Zealand 10 0.811 0.049 14 0.864 0.044 7 0.947 0.027 12 0.909 0.044 18 0.634 0.024 61 0.812 0.081Canada 11 0.810 0.047 7 0.882 0.039 21 0.917 0.037 41 0.799 0.062 1 0.709 0.022 6 0.959 0.024Germany 12 0.808 0.052 17 0.859 0.048 6 0.950 0.025 5 0.924 0.037 11 0.644 0.022 5 0.970 0.017Portugal 13 0.807 0.045 10 0.873 0.040 16 0.927 0.033 9 0.914 0.038 37 0.594 0.045 32 0.887 0.051United Kingdom 14 0.802 0.057 18 0.858 0.054 11 0.942 0.024 24 0.872 0.048 17 0.634 0.024 42 0.857 0.065Belgium 15 0.794 0.052 13 0.864 0.047 18 0.919 0.037 15 0.900 0.049 14 0.640 0.022 10 0.937 0.031Slovenia 16 0.790 0.056 16 0.860 0.049 17 0.921 0.035 21 0.879 0.048 29 0.607 0.040 14 0.932 0.036United States 17 0.785 0.040 20 0.843 0.035 12 0.940 0.027 57 0.729 0.082 6 0.652 0.014 38 0.863 0.059Lithuania 18 0.784 0.047 19 0.845 0.041 13 0.936 0.029 13 0.908 0.043 39 0.591 0.045 28 0.899 0.049Uruguay 19 0.782 0.053 11 0.870 0.043 28 0.893 0.048 33 0.839 0.062 20 0.626 0.033 12 0.935 0.037Finland 20 0.781 0.055 21 0.843 0.052 15 0.934 0.033 3 0.935 0.035 19 0.626 0.024 31 0.889 0.056Czech Republic 21 0.780 0.048 15 0.860 0.040 24 0.905 0.036 11 0.911 0.045 28 0.609 0.053 63 0.810 0.080 Spain 22 0.763 0.058 23 0.835 0.052 20 0.918 0.034 16 0.898 0.042 33 0.601 0.039 25 0.911 0.044 Ireland 23 0.756 0.059 25 0.830 0.055 22 0.913 0.036 28 0.859 0.059 128 0.363 0.058 29 0.894 0.051 Chile 24 0.752 0.055 27 0.828 0.048 23 0.912 0.041 105 0.565 0.081 59 0.559 0.057 19 0.921 0.038 Italy 25 0.744 0.058 26 0.830 0.055 26 0.895 0.039 19 0.883 0.045 34 0.600 0.045 24 0.911 0.043Austria 26 0.742 0.055 32 0.813 0.051 19 0.919 0.033 23 0.873 0.057 2 0.699 0.030 23 0.911 0.046Cape Verde 27 0.737 0.062 24 0.833 0.050 34 0.879 0.050 26 0.861 0.056 44 0.583 0.051 30 0.890 0.057Latvia 28 0.737 0.056 22 0.838 0.046 36 0.871 0.048 32 0.843 0.064 49 0.578 0.046 33 0.881 0.054Greece 29 0.736 0.054 29 0.827 0.050 30 0.888 0.050 20 0.880 0.044 47 0.579 0.062 20 0.916 0.046Iceland 30 0.732 0.052 28 0.827 0.044 32 0.881 0.045 4 0.928 0.038 9 0.645 0.021 86 0.717 0.104Cyprus 31 0.709 0.055 30 0.822 0.053 39 0.851 0.049 25 0.871 0.062 110 0.455 0.045 50 0.841 0.074 Slovakia 32 0.700 0.059 34 0.798 0.055 35 0.874 0.042 43 0.789 0.074 41 0.590 0.042 105 0.632 0.112 Taiwan 33 0.685 0.053 33 0.802 0.041 41 0.843 0.062 17 0.889 0.051 15 0.639 0.025 26 0.910 0.047 Japan 34 0.683 0.057 36 0.789 0.054 38 0.860 0.052 6 0.923 0.039 45 0.582 0.055 7 0.945 0.030 Bulgaria 35 0.683 0.050 39 0.765 0.046 25 0.899 0.038 39 0.807 0.064 53 0.568 0.053 39 0.863 0.064Jamaica 36 0.677 0.056 31 0.818 0.050 49 0.806 0.059 61 0.721 0.074 27 0.610 0.035 58 0.821 0.080 South Korea 37 0.669 0.058 42 0.758 0.057 31 0.886 0.045 35 0.830 0.057 58 0.560 0.051 81 0.743 0.097 Mauritius 38 0.663 0.060 35 0.791 0.056 46 0.824 0.053 48 0.747 0.079 94 0.501 0.077 35 0.870 0.061 Tunisia 39 0.659 0.062 46 0.744 0.062 29 0.891 0.041 47 0.766 0.073 111 0.455 0.072 11 0.935 0.034 Romania 40 0.649 0.050 38 0.768 0.044 43 0.835 0.053 52 0.742 0.077 69 0.549 0.051 17 0.927 0.039 Argentina 41 0.636 0.060 41 0.760 0.058 47 0.823 0.051 63 0.718 0.083 35 0.599 0.044 79 0.752 0.101 Benin 42 0.633 0.044 51 0.731 0.048 37 0.867 0.046 34 0.834 0.055 32 0.603 0.032 16 0.928 0.038 Trinidad & Tob. 43 0.629 0.063 47 0.738 0.063 40 0.847 0.052 42 0.789 0.065 63 0.554 0.059 22 0.912 0.045 Barbados 44 0.628 0.066 55 0.709 0.067 27 0.893 0.042 37 0.817 0.065 150 0.266 0.043 44 0.848 0.070 South Africa 45 0.625 0.060 45 0.744 0.062 45 0.831 0.053 90 0.618 0.071 30 0.606 0.041 41 0.859 0.066Namibia 46 0.612 0.061 44 0.746 0.057 51 0.804 0.060 93 0.611 0.082 75 0.538 0.059 83 0.728 0.097 Suriname 47 0.601 0.062 37 0.779 0.052 71 0.737 0.071 56 0.731 0.078 13 0.641 0.055 46 0.847 0.069 Israel 48 0.590 0.061 50 0.733 0.059 57 0.785 0.068 44 0.776 0.070 8 0.647 0.052 37 0.868 0.062 São Tomé & Pr. 49 0.588 0.054 57 0.699 0.055 44 0.835 0.058 80 0.652 0.079 86 0.520 0.056 75 0.766 0.093 Panama 50 0.586 0.067 43 0.749 0.067 65 0.754 0.062 58 0.728 0.080 82 0.524 0.059 55 0.832 0.076 Senegal 51 0.585 0.075 52 0.726 0.070 58 0.785 0.063 76 0.670 0.081 133 0.347 0.059 40 0.862 0.063 Peru 52 0.582 0.064 48 0.737 0.060 63 0.762 0.058 102 0.580 0.092 42 0.586 0.047 77 0.758 0.097 Croatia 53 0.579 0.052 54 0.714 0.055 54 0.796 0.063 54 0.731 0.083 54 0.567 0.052 95 0.676 0.114 Botswana 54 0.577 0.056 59 0.685 0.055 42 0.836 0.048 74 0.682 0.086 48 0.579 0.045 67 0.793 0.082 Poland 55 0.574 0.054 56 0.707 0.056 53 0.797 0.058 27 0.860 0.061 65 0.553 0.057 106 0.631 0.116Georgia 56 0.558 0.050 40 0.761 0.044 83 0.689 0.070 49 0.746 0.081 117 0.422 0.066 45 0.847 0.068 Brazil 57 0.555 0.055 53 0.718 0.056 68 0.744 0.056 114 0.520 0.095 38 0.594 0.033 108 0.623 0.120 Ghana 58 0.553 0.053 60 0.682 0.056 55 0.796 0.056 73 0.683 0.088 141 0.323 0.043 60 0.813 0.076 Hungary 59 0.553 0.057 63 0.677 0.061 52 0.804 0.060 31 0.843 0.057 84 0.520 0.063 132 0.483 0.134 Vanuatu 60 0.553 0.068 67 0.667 0.079 48 0.818 0.056 65 0.714 0.071 40 0.591 0.046 51 0.839 0.071 Burkina Faso 61 0.550 0.066 49 0.734 0.067 80 0.711 0.066 62 0.720 0.083 96 0.496 0.050 21 0.914 0.045 Guyana 62 0.525 0.066 70 0.659 0.072 59 0.776 0.060 97 0.597 0.078 60 0.558 0.053 117 0.569 0.131 Colombia 63 0.524 0.057 61 0.680 0.063 69 0.743 0.061 131 0.462 0.087 25 0.613 0.035 56 0.830 0.073 Mongolia 64 0.513 0.052 62 0.677 0.051 72 0.726 0.067 46 0.768 0.065 92 0.504 0.050 36 0.869 0.057 Sri Lanka 65 0.509 0.064 71 0.658 0.075 67 0.745 0.064 79 0.659 0.090 46 0.581 0.044 73 0.769 0.091Indonesia 66 0.506 0.065 65 0.667 0.073 73 0.726 0.066 78 0.661 0.091 23 0.619 0.032 27 0.901 0.047 East Timor 67 0.500 0.062 58 0.688 0.067 85 0.684 0.065 104 0.566 0.078 79 0.528 0.060 96 0.666 0.105 El Salvador 68 0.494 0.057 69 0.661 0.064 79 0.711 0.062 142 0.390 0.082 77 0.532 0.060 87 0.716 0.094 Lesotho 69 0.493 0.059 68 0.664 0.063 81 0.706 0.063 36 0.826 0.069 100 0.485 0.041 70 0.783 0.089 India 70 0.488 0.063 73 0.648 0.071 76 0.718 0.059 118 0.508 0.095 62 0.554 0.059 76 0.760 0.100 Liberia 71 0.483 0.057 74 0.642 0.064 75 0.719 0.066 85 0.634 0.079 108 0.456 0.033 49 0.842 0.072 Mexico 72 0.481 0.056 64 0.671 0.065 90 0.674 0.070 130 0.470 0.091 70 0.549 0.055 66 0.797 0.078 Guatemala 73 0.481 0.059 66 0.667 0.067 88 0.678 0.064 161 0.302 0.079 64 0.554 0.075 99 0.659 0.110 Albania 74 0.477 0.049 93 0.535 0.060 33 0.880 0.045 53 0.736 0.083 50 0.577 0.058 133 0.476 0.146 Solomon Islands 75 0.472 0.058 72 0.652 0.067 87 0.683 0.069 108 0.554 0.092 95 0.500 0.064 113 0.604 0.123Seychelles 76 0.468 0.062 80 0.593 0.071 61 0.763 0.062 60 0.721 0.082 149 0.274 0.047 68 0.792 0.086 Nepal 77 0.464 0.057 79 0.593 0.062 64 0.755 0.067 99 0.592 0.075 99 0.486 0.077 103 0.645 0.123 Moldova 78 0.453 0.046 84 0.572 0.055 60 0.766 0.063 81 0.644 0.090 87 0.515 0.054 130 0.497 0.124 Bhutan 79 0.451 0.054 90 0.544 0.064 50 0.805 0.059 38 0.812 0.068 71 0.546 0.054 72 0.780 0.090 Nigeria 80 0.449 0.061 78 0.608 0.070 82 0.700 0.074 95 0.602 0.089 22 0.621 0.050 65 0.798 0.077 Paraguay 81 0.437 0.061 76 0.618 0.067 94 0.659 0.072 154 0.346 0.079 89 0.510 0.061 129 0.502 0.132 Mali 82 0.435 0.059 83 0.577 0.076 78 0.715 0.060 72 0.688 0.078 88 0.513 0.070 52 0.838 0.072 Niger 83 0.430 0.054 91 0.540 0.066 62 0.762 0.069 50 0.744 0.079 24 0.615 0.039 62 0.811 0.081 Malawi 84 0.414 0.047 94 0.527 0.060 66 0.747 0.065 146 0.374 0.083 103 0.477 0.064 85 0.720 0.100 Bolivia 85 0.407 0.056 77 0.613 0.068 104 0.605 0.075 82 0.643 0.073 55 0.567 0.050 84 0.726 0.098 Philippines 86 0.399 0.044 87 0.566 0.047 95 0.655 0.078 153 0.355 0.094 61 0.558 0.049 59 0.814 0.081 Ivory Coast 87 0.395 0.049 81 0.581 0.057 100 0.626 0.079 111 0.546 0.082 90 0.509 0.073 74 0.767 0.090
liberal Democracy Index (lDI)
electoral Democracy Index (eDI)
liberal Component Index (lCI)
egalitarian Component Index (eCI)
paricipartory Component Index (pCI)
Deliberative Component Index (DCI)
APPENDIx: COUNTRY SCORES FOR 2016
table 1: Country Scores for the liberal Democracy Index (lDI) and all Components Indices
44
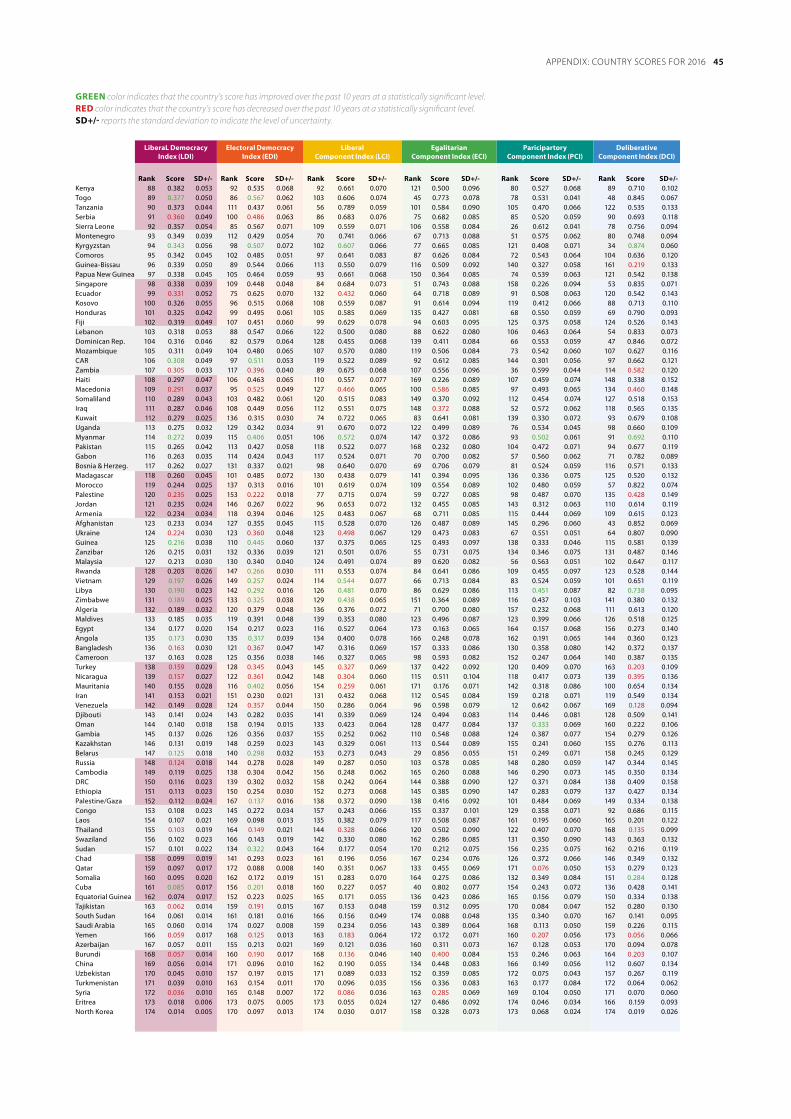
liberal Democracy Index (lDI)
electoral Democracy Index (eDI)
liberal Component Index (lCI)
egalitarian Component Index (eCI)
paricipartory Component Index (pCI)
Deliberative Component Index (DCI)
Rank Score SD+/- Rank Score SD+/- Rank Score SD+/- Rank Score SD+/- Rank Score SD+/- Rank Score SD+/- Kenya 88 0.382 0.053 92 0.535 0.068 92 0.661 0.070 121 0.500 0.096 80 0.527 0.068 89 0.710 0.102 Togo 89 0.377 0.050 86 0.567 0.062 103 0.606 0.074 45 0.773 0.078 78 0.531 0.041 48 0.845 0.067 Tanzania 90 0.373 0.044 111 0.437 0.061 56 0.789 0.059 101 0.584 0.090 105 0.470 0.066 122 0.535 0.133 Serbia 91 0.360 0.049 100 0.486 0.063 86 0.683 0.076 75 0.682 0.085 85 0.520 0.059 90 0.693 0.118 Sierra Leone 92 0.357 0.054 85 0.567 0.071 109 0.559 0.071 106 0.558 0.084 26 0.612 0.041 78 0.756 0.094Montenegro 93 0.349 0.039 112 0.429 0.054 70 0.741 0.066 67 0.713 0.088 51 0.575 0.062 80 0.748 0.094 Kyrgyzstan 94 0.343 0.056 98 0.507 0.072 102 0.607 0.066 77 0.665 0.085 121 0.408 0.071 34 0.874 0.060 Comoros 95 0.342 0.045 102 0.485 0.051 97 0.641 0.083 87 0.626 0.084 72 0.543 0.064 104 0.636 0.120 Guinea-Bissau 96 0.339 0.050 89 0.544 0.066 113 0.550 0.079 116 0.509 0.092 140 0.327 0.058 161 0.219 0.133 Papua New Guinea 97 0.338 0.045 105 0.464 0.059 93 0.661 0.068 150 0.364 0.085 74 0.539 0.063 121 0.542 0.138 Singapore 98 0.338 0.039 109 0.448 0.048 84 0.684 0.073 51 0.743 0.088 158 0.226 0.094 53 0.835 0.071 Ecuador 99 0.331 0.052 75 0.625 0.070 132 0.432 0.060 64 0.718 0.089 91 0.508 0.063 120 0.542 0.143 Kosovo 100 0.326 0.055 96 0.515 0.068 108 0.559 0.087 91 0.614 0.094 119 0.412 0.066 88 0.713 0.110 Honduras 101 0.325 0.042 99 0.495 0.061 105 0.585 0.069 135 0.427 0.081 68 0.550 0.059 69 0.790 0.093 Fiji 102 0.319 0.049 107 0.451 0.060 99 0.629 0.078 94 0.603 0.095 125 0.375 0.058 124 0.526 0.143Lebanon 103 0.318 0.053 88 0.547 0.066 122 0.500 0.080 88 0.622 0.080 106 0.463 0.064 54 0.833 0.073 Dominican Rep. 104 0.316 0.046 82 0.579 0.064 128 0.455 0.068 139 0.411 0.084 66 0.553 0.059 47 0.846 0.072 Mozambique 105 0.311 0.049 104 0.480 0.065 107 0.570 0.080 119 0.506 0.084 73 0.542 0.060 107 0.627 0.116 CAR 106 0.308 0.049 97 0.511 0.053 119 0.522 0.089 92 0.612 0.085 144 0.301 0.056 97 0.662 0.121 Zambia 107 0.305 0.033 117 0.396 0.040 89 0.675 0.068 107 0.556 0.096 36 0.599 0.044 114 0.582 0.120 Haiti 108 0.297 0.047 106 0.463 0.065 110 0.557 0.077 169 0.226 0.089 107 0.459 0.074 148 0.338 0.152 Macedonia 109 0.291 0.037 95 0.525 0.049 127 0.466 0.065 100 0.586 0.085 97 0.493 0.065 134 0.460 0.148 Somaliland 110 0.289 0.043 103 0.482 0.061 120 0.515 0.083 149 0.370 0.092 112 0.454 0.074 127 0.518 0.153 Iraq 111 0.287 0.046 108 0.449 0.056 112 0.551 0.075 148 0.372 0.088 52 0.572 0.062 118 0.565 0.135 Kuwait 112 0.279 0.025 136 0.315 0.030 74 0.722 0.065 83 0.641 0.081 139 0.330 0.072 93 0.679 0.108Uganda 113 0.275 0.032 129 0.342 0.034 91 0.670 0.072 122 0.499 0.089 76 0.534 0.045 98 0.660 0.109 Myanmar 114 0.272 0.039 115 0.406 0.051 106 0.572 0.074 147 0.372 0.086 93 0.502 0.061 91 0.692 0.110 Pakistan 115 0.265 0.042 113 0.427 0.058 118 0.522 0.077 168 0.232 0.080 104 0.472 0.071 94 0.677 0.119 Gabon 116 0.263 0.035 114 0.424 0.043 117 0.524 0.071 70 0.700 0.082 57 0.560 0.062 71 0.782 0.089 Bosnia & Herzeg. 117 0.262 0.027 131 0.337 0.021 98 0.640 0.070 69 0.706 0.079 81 0.524 0.059 116 0.571 0.133 Madagascar 118 0.260 0.045 101 0.485 0.072 130 0.438 0.079 141 0.394 0.095 136 0.336 0.075 125 0.520 0.132 Morocco 119 0.244 0.025 137 0.313 0.016 101 0.619 0.074 109 0.554 0.089 102 0.480 0.059 57 0.822 0.074 Palestine 120 0.235 0.025 153 0.222 0.018 77 0.715 0.074 59 0.727 0.085 98 0.487 0.070 135 0.428 0.149 Jordan 121 0.235 0.024 146 0.267 0.022 96 0.653 0.072 132 0.455 0.085 143 0.312 0.063 110 0.614 0.119 Armenia 122 0.234 0.034 118 0.394 0.046 125 0.483 0.067 68 0.711 0.085 115 0.444 0.069 109 0.615 0.123Afghanistan 123 0.233 0.034 127 0.355 0.045 115 0.528 0.070 126 0.487 0.089 145 0.296 0.060 43 0.852 0.069 Ukraine 124 0.224 0.030 123 0.360 0.048 123 0.498 0.067 129 0.473 0.083 67 0.551 0.051 64 0.807 0.090 Guinea 125 0.216 0.038 110 0.445 0.060 137 0.375 0.065 125 0.493 0.097 138 0.333 0.046 115 0.581 0.139 Zanzibar 126 0.215 0.031 132 0.336 0.039 121 0.501 0.076 55 0.731 0.075 134 0.346 0.075 131 0.487 0.146 Malaysia 127 0.213 0.030 130 0.340 0.040 124 0.491 0.074 89 0.620 0.082 56 0.563 0.051 102 0.647 0.117 Rwanda 128 0.203 0.026 147 0.266 0.030 111 0.553 0.074 84 0.641 0.086 109 0.455 0.097 123 0.528 0.144 Vietnam 129 0.197 0.026 149 0.257 0.024 114 0.544 0.077 66 0.713 0.084 83 0.524 0.059 101 0.651 0.119 Libya 130 0.190 0.023 142 0.292 0.016 126 0.481 0.070 86 0.629 0.086 113 0.451 0.087 82 0.738 0.095 Zimbabwe 131 0.189 0.025 133 0.325 0.038 129 0.438 0.065 151 0.364 0.089 116 0.437 0.103 141 0.380 0.132 Algeria 132 0.189 0.032 120 0.379 0.048 136 0.376 0.072 71 0.700 0.080 157 0.232 0.068 111 0.613 0.120Maldives 133 0.185 0.035 119 0.391 0.048 139 0.353 0.080 123 0.496 0.087 123 0.399 0.066 126 0.518 0.125 Egypt 134 0.177 0.020 154 0.217 0.023 116 0.527 0.064 173 0.163 0.065 164 0.157 0.068 156 0.273 0.140 Angola 135 0.173 0.030 135 0.317 0.039 134 0.400 0.078 166 0.248 0.078 162 0.191 0.065 144 0.360 0.123 Bangladesh 136 0.163 0.030 121 0.367 0.047 147 0.316 0.069 157 0.333 0.086 130 0.358 0.080 142 0.372 0.137 Cameroon 137 0.163 0.028 125 0.356 0.038 146 0.327 0.065 98 0.593 0.082 152 0.247 0.064 140 0.387 0.135 Turkey 138 0.159 0.029 128 0.345 0.043 145 0.327 0.069 137 0.422 0.092 120 0.409 0.070 163 0.203 0.109 Nicaragua 139 0.157 0.027 122 0.361 0.042 148 0.304 0.060 115 0.511 0.104 118 0.417 0.073 139 0.395 0.136 Mauritania 140 0.155 0.028 116 0.402 0.056 154 0.259 0.061 171 0.176 0.071 142 0.318 0.086 100 0.654 0.134 Iran 141 0.153 0.021 151 0.230 0.021 131 0.432 0.068 112 0.545 0.084 159 0.218 0.071 119 0.549 0.134 Venezuela 142 0.149 0.028 124 0.357 0.044 150 0.286 0.064 96 0.598 0.079 12 0.642 0.067 169 0.128 0.094Djibouti 143 0.141 0.024 143 0.282 0.035 141 0.339 0.069 124 0.494 0.083 114 0.446 0.081 128 0.509 0.141 Oman 144 0.140 0.018 158 0.194 0.015 133 0.423 0.064 128 0.477 0.084 137 0.333 0.069 160 0.222 0.106 Gambia 145 0.137 0.026 126 0.356 0.037 155 0.252 0.062 110 0.548 0.088 124 0.387 0.077 154 0.279 0.126 Kazakhstan 146 0.131 0.019 148 0.259 0.023 143 0.329 0.061 113 0.544 0.089 155 0.241 0.060 155 0.276 0.113 Belarus 147 0.125 0.018 140 0.298 0.032 153 0.273 0.043 29 0.856 0.055 151 0.249 0.071 158 0.245 0.129 Russia 148 0.124 0.018 144 0.278 0.028 149 0.287 0.050 103 0.578 0.085 148 0.280 0.059 147 0.344 0.145 Cambodia 149 0.119 0.025 138 0.304 0.042 156 0.248 0.062 165 0.260 0.088 146 0.290 0.073 145 0.350 0.134 DRC 150 0.116 0.023 139 0.302 0.032 158 0.242 0.064 144 0.388 0.090 127 0.371 0.084 138 0.409 0.158 Ethiopia 151 0.113 0.023 150 0.254 0.030 152 0.273 0.068 145 0.385 0.090 147 0.283 0.079 137 0.427 0.134 Palestine/Gaza 152 0.112 0.024 167 0.137 0.016 138 0.372 0.090 138 0.416 0.092 101 0.484 0.069 149 0.334 0.138Congo 153 0.108 0.023 145 0.272 0.034 157 0.243 0.066 155 0.337 0.101 129 0.358 0.071 92 0.686 0.115 Laos 154 0.107 0.021 169 0.098 0.013 135 0.382 0.079 117 0.508 0.087 161 0.195 0.060 165 0.201 0.122 Thailand 155 0.103 0.019 164 0.149 0.021 144 0.328 0.066 120 0.502 0.090 122 0.407 0.070 168 0.135 0.099 Swaziland 156 0.102 0.023 166 0.143 0.019 142 0.330 0.080 162 0.286 0.085 131 0.350 0.090 143 0.363 0.132 Sudan 157 0.101 0.022 134 0.322 0.043 164 0.177 0.054 170 0.212 0.075 156 0.235 0.075 162 0.216 0.119 Chad 158 0.099 0.019 141 0.293 0.023 161 0.196 0.056 167 0.234 0.076 126 0.372 0.066 146 0.349 0.132 Qatar 159 0.097 0.017 172 0.088 0.008 140 0.351 0.067 133 0.455 0.069 171 0.076 0.050 153 0.279 0.123 Somalia 160 0.095 0.020 162 0.172 0.019 151 0.283 0.070 164 0.275 0.086 132 0.349 0.084 151 0.284 0.128 Cuba 161 0.085 0.017 156 0.201 0.018 160 0.227 0.057 40 0.802 0.077 154 0.243 0.072 136 0.428 0.141 Equatorial Guinea 162 0.074 0.017 152 0.223 0.025 165 0.171 0.055 136 0.423 0.086 165 0.156 0.079 150 0.334 0.138Tajikistan 163 0.062 0.014 159 0.191 0.015 167 0.153 0.048 159 0.312 0.095 170 0.084 0.047 152 0.280 0.130 South Sudan 164 0.061 0.014 161 0.181 0.016 166 0.156 0.049 174 0.088 0.048 135 0.340 0.070 167 0.141 0.095 Saudi Arabia 165 0.060 0.014 174 0.027 0.008 159 0.234 0.056 143 0.389 0.064 168 0.113 0.050 159 0.226 0.115 Yemen 166 0.059 0.017 168 0.125 0.013 163 0.183 0.064 172 0.172 0.071 160 0.207 0.056 173 0.056 0.066 Azerbaijan 167 0.057 0.011 155 0.213 0.021 169 0.121 0.036 160 0.311 0.073 167 0.128 0.053 170 0.094 0.078 Burundi 168 0.057 0.014 160 0.190 0.017 168 0.136 0.046 140 0.400 0.084 153 0.246 0.063 164 0.203 0.107 China 169 0.056 0.014 171 0.096 0.010 162 0.190 0.055 134 0.448 0.083 166 0.149 0.056 112 0.607 0.134 Uzbekistan 170 0.045 0.010 157 0.197 0.015 171 0.089 0.033 152 0.359 0.085 172 0.075 0.043 157 0.267 0.119 Turkmenistan 171 0.039 0.010 163 0.154 0.011 170 0.096 0.035 156 0.336 0.083 163 0.177 0.084 172 0.064 0.062 Syria 172 0.036 0.010 165 0.148 0.007 172 0.086 0.036 163 0.285 0.069 169 0.104 0.050 171 0.070 0.060 Eritrea 173 0.018 0.006 173 0.075 0.005 173 0.055 0.024 127 0.486 0.092 174 0.046 0.034 166 0.159 0.093 North Korea 174 0.014 0.005 170 0.097 0.013 174 0.030 0.017 158 0.328 0.073 173 0.068 0.024 174 0.019 0.026
gReen color indicates that the country’s score has improved over the past 10 years at a statistically significant level. ReD color indicates that the country’s score has decreased over the past 10 years at a statistically significant level. SD+/- reports the standard deviation to indicate the level of uncertainty.
APPENDIx: COUNTRY SCORES FOR 2016 45

APPENDIx: COUNTRY SCORES FOR 2016
table 2: Country Scores for the electoral Democracy Index (eDI) and its main Components
Rank Score SD+/- Rank Score SD+/- Rank Score SD+/- Rank Score SD(+/-) France 1 0.925 0.029 2 0.933 0.031 1 0.979 0.013 1 0.984 0.008Sweden 2 0.908 0.035 5 0.927 0.036 4 0.975 0.015 7 0.962 0.018Estonia 3 0.902 0.031 17 0.905 0.043 2 0.977 0.014 2 0.976 0.012Costa Rica 4 0.897 0.037 3 0.931 0.034 7 0.968 0.018 12 0.952 0.021Norway 5 0.892 0.040 6 0.921 0.038 14 0.958 0.024 5 0.969 0.015Australia 6 0.887 0.041 11 0.915 0.042 8 0.967 0.020 13 0.950 0.022Canada 7 0.882 0.039 10 0.915 0.040 9 0.963 0.022 17 0.944 0.025Denmark 8 0.881 0.043 26 0.894 0.048 13 0.959 0.024 6 0.968 0.016Switzerland 9 0.879 0.042 12 0.914 0.041 21 0.944 0.033 4 0.971 0.015Portugal 10 0.873 0.040 35 0.881 0.050 3 0.976 0.015 11 0.953 0.021Uruguay 11 0.870 0.043 14 0.913 0.040 20 0.947 0.029 14 0.947 0.022Netherlands 12 0.868 0.045 22 0.899 0.046 12 0.961 0.023 19 0.941 0.027Belgium 13 0.864 0.047 50 0.869 0.057 11 0.963 0.022 3 0.974 0.012New Zealand 14 0.864 0.044 13 0.914 0.041 18 0.948 0.030 22 0.937 0.027Czech Republic 15 0.860 0.040 20 0.900 0.044 10 0.963 0.021 23 0.935 0.027Slovenia 16 0.860 0.049 16 0.910 0.040 22 0.943 0.031 25 0.932 0.028Germany 17 0.859 0.048 45 0.872 0.056 16 0.956 0.026 10 0.960 0.019United Kingdom 18 0.858 0.054 8 0.918 0.039 31 0.922 0.040 8 0.960 0.019Lithuania 19 0.845 0.041 54 0.867 0.055 25 0.934 0.036 18 0.944 0.024United States 20 0.843 0.035 1 0.936 0.031 43 0.883 0.052 27 0.927 0.029Finland 21 0.843 0.052 44 0.872 0.058 6 0.971 0.017 26 0.927 0.031Latvia 22 0.838 0.046 33 0.884 0.050 32 0.917 0.043 15 0.946 0.024Spain 23 0.835 0.052 58 0.863 0.056 19 0.947 0.028 24 0.933 0.029Cape Verde 24 0.833 0.050 4 0.928 0.036 39 0.895 0.052 28 0.922 0.032Ireland 25 0.830 0.055 48 0.871 0.058 27 0.928 0.039 16 0.945 0.025Italy 26 0.830 0.055 28 0.892 0.049 30 0.924 0.041 29 0.922 0.032Chile 27 0.828 0.048 34 0.881 0.054 5 0.973 0.016 39 0.882 0.042Iceland 28 0.827 0.044 27 0.894 0.048 15 0.957 0.026 41 0.877 0.047Greece 29 0.827 0.050 21 0.900 0.048 23 0.939 0.033 31 0.904 0.039Cyprus 30 0.822 0.053 39 0.880 0.053 37 0.900 0.051 21 0.938 0.026Jamaica 31 0.818 0.050 7 0.919 0.038 42 0.886 0.056 30 0.910 0.037Austria 32 0.813 0.051 51 0.869 0.055 40 0.888 0.056 9 0.960 0.019Taiwan 33 0.802 0.041 41 0.877 0.054 35 0.905 0.048 35 0.893 0.039Slovakia 34 0.798 0.055 53 0.867 0.057 26 0.932 0.037 40 0.878 0.048Mauritius 35 0.791 0.056 52 0.869 0.059 33 0.915 0.044 42 0.876 0.046Japan 36 0.789 0.054 24 0.896 0.046 34 0.905 0.046 50 0.853 0.052Suriname 37 0.779 0.052 40 0.880 0.054 28 0.928 0.039 59 0.837 0.059Romania 38 0.768 0.044 42 0.874 0.053 41 0.887 0.054 48 0.854 0.050Bulgaria 39 0.765 0.046 49 0.871 0.055 54 0.833 0.071 34 0.898 0.039Georgia 40 0.761 0.044 60 0.852 0.060 50 0.845 0.070 38 0.884 0.044Argentina 41 0.760 0.058 36 0.881 0.053 53 0.838 0.073 46 0.866 0.050Korea. South 42 0.758 0.057 82 0.822 0.070 17 0.949 0.029 65 0.827 0.056Panama 43 0.749 0.067 29 0.890 0.049 49 0.845 0.071 63 0.831 0.057Namibia 44 0.746 0.057 19 0.902 0.043 47 0.850 0.067 68 0.822 0.057South Africa 45 0.744 0.062 31 0.889 0.049 58 0.824 0.080 49 0.854 0.052Tunisia 46 0.744 0.062 38 0.880 0.049 62 0.790 0.082 33 0.899 0.040Trinidad and Tobago 47 0.738 0.063 30 0.889 0.050 48 0.848 0.072 66 0.826 0.060Peru 48 0.737 0.060 75 0.830 0.071 46 0.859 0.067 45 0.868 0.051Burkina Faso 49 0.734 0.067 81 0.823 0.070 55 0.829 0.079 32 0.901 0.042Israel 50 0.733 0.059 88 0.809 0.074 38 0.899 0.050 62 0.832 0.058Benin 51 0.731 0.048 23 0.897 0.046 64 0.783 0.087 55 0.845 0.053Senegal 52 0.726 0.070 63 0.850 0.063 71 0.744 0.094 20 0.939 0.025Brazil 53 0.718 0.056 59 0.859 0.056 29 0.924 0.039 95 0.745 0.072Croatia 54 0.714 0.055 71 0.834 0.064 36 0.905 0.047 87 0.756 0.071Barbados 55 0.709 0.067 70 0.836 0.070 51 0.843 0.073 72 0.809 0.062Poland 56 0.707 0.056 73 0.831 0.064 24 0.938 0.035 104 0.707 0.081São Tomé och Príncipe 57 0.699 0.055 77 0.826 0.070 57 0.824 0.076 74 0.800 0.060East Timor 58 0.688 0.067 74 0.830 0.070 70 0.761 0.097 56 0.844 0.053Botswana 59 0.685 0.055 9 0.916 0.038 60 0.801 0.082 86 0.766 0.067Ghana 60 0.682 0.056 25 0.895 0.050 83 0.659 0.118 36 0.892 0.040Colombia 61 0.680 0.063 15 0.912 0.042 79 0.687 0.109 64 0.829 0.056Mongolia 62 0.677 0.051 66 0.847 0.062 75 0.705 0.105 43 0.876 0.044Hungary 63 0.677 0.061 76 0.826 0.068 45 0.881 0.058 92 0.747 0.069Mexico 64 0.671 0.065 61 0.851 0.060 66 0.766 0.087 77 0.789 0.065Indonesia 65 0.667 0.073 72 0.832 0.069 76 0.700 0.110 52 0.848 0.056Guatemala 66 0.667 0.067 55 0.867 0.056 68 0.763 0.097 85 0.775 0.069Vanuatu 67 0.667 0.079 32 0.885 0.053 85 0.655 0.123 44 0.875 0.046Lesotho 68 0.664 0.063 18 0.904 0.044 63 0.788 0.088 103 0.712 0.076El Salvador 69 0.661 0.064 57 0.863 0.057 77 0.694 0.103 60 0.834 0.059Guyana 70 0.659 0.072 56 0.865 0.056 65 0.778 0.091 96 0.736 0.084Sri Lanka 71 0.658 0.075 43 0.873 0.057 81 0.682 0.121 58 0.839 0.059Solomon Islands 72 0.652 0.067 47 0.871 0.057 84 0.658 0.111 67 0.823 0.058India 73 0.648 0.071 98 0.776 0.085 67 0.764 0.091 75 0.799 0.065Liberia 74 0.642 0.064 37 0.880 0.055 90 0.623 0.119 51 0.852 0.051Ecuador 75 0.625 0.070 111 0.694 0.100 56 0.826 0.078 84 0.776 0.073Paraguay 76 0.618 0.067 64 0.849 0.061 73 0.715 0.104 97 0.729 0.076Bolivia 77 0.613 0.068 86 0.813 0.072 72 0.723 0.101 99 0.723 0.078Nigeria 78 0.608 0.070 93 0.797 0.083 92 0.616 0.128 37 0.885 0.046Nepal 79 0.593 0.062 79 0.824 0.070 93 0.616 0.120 73 0.809 0.059Seychelles 80 0.593 0.071 107 0.735 0.093 69 0.761 0.098 106 0.705 0.083Ivory Coast 81 0.581 0.057 92 0.799 0.078 74 0.710 0.106 111 0.671 0.082Dominican Republic 82 0.579 0.064 46 0.871 0.059 98 0.555 0.134 81 0.784 0.070Mali 83 0.577 0.076 87 0.810 0.072 103 0.541 0.141 53 0.846 0.057Moldova 84 0.572 0.055 91 0.800 0.075 87 0.632 0.119 98 0.729 0.076Sierra Leone 85 0.567 0.071 69 0.837 0.068 96 0.589 0.132 76 0.790 0.067Togo 86 0.567 0.062 95 0.796 0.080 97 0.556 0.136 71 0.812 0.064Philippines 87 0.566 0.047 94 0.796 0.077 107 0.517 0.130 54 0.846 0.053
eleCtoRAl DemoCRACy InDex (eDI)
fReeDom of ASSoCIAtIon InDex
CleAn eleCtIon InDex
fReeDom of expReSSIon InDex
46
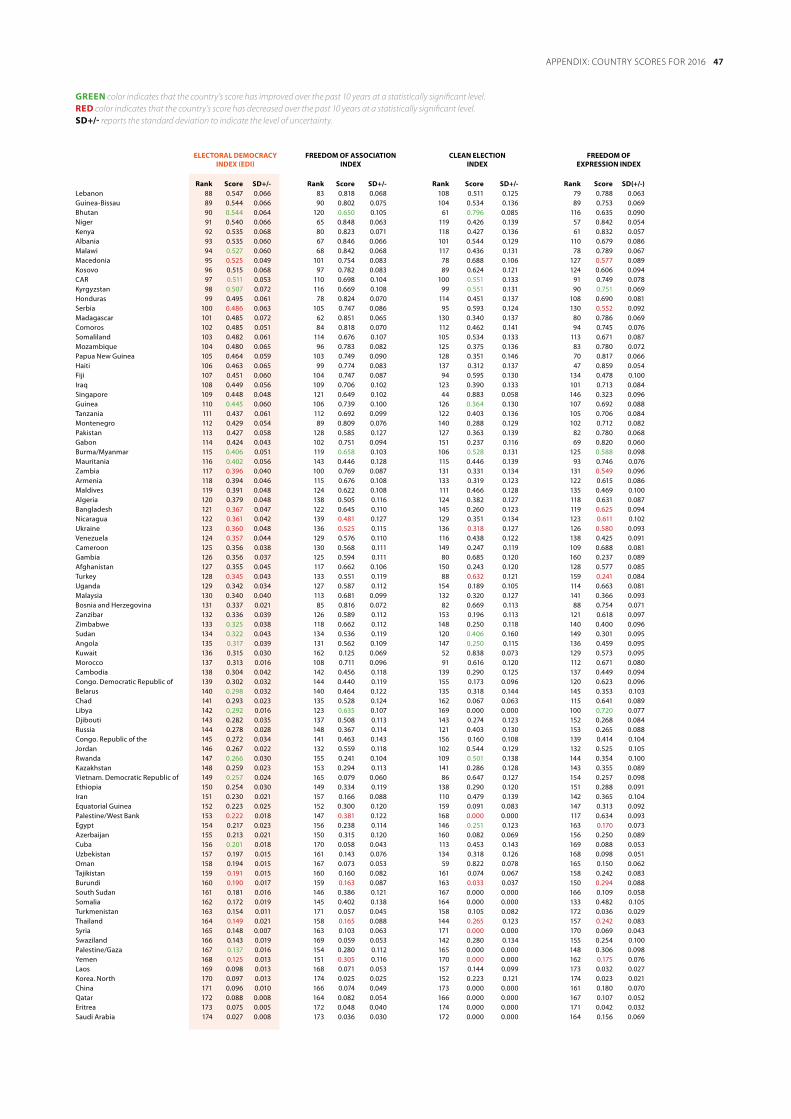
APPENDIx: COUNTRY SCORES FOR 2016
gReen color indicates that the country’s score has improved over the past 10 years at a statistically significant level. ReD color indicates that the country’s score has decreased over the past 10 years at a statistically significant level. SD+/- reports the standard deviation to indicate the level of uncertainty.
Rank Score SD+/- Rank Score SD+/- Rank Score SD+/- Rank Score SD(+/-) Lebanon 88 0.547 0.066 83 0.818 0.068 108 0.511 0.125 79 0.788 0.063Guinea-Bissau 89 0.544 0.066 90 0.802 0.075 104 0.534 0.136 89 0.753 0.069Bhutan 90 0.544 0.064 120 0.650 0.105 61 0.796 0.085 116 0.635 0.090Niger 91 0.540 0.066 65 0.848 0.063 119 0.426 0.139 57 0.842 0.054Kenya 92 0.535 0.068 80 0.823 0.071 118 0.427 0.136 61 0.832 0.057Albania 93 0.535 0.060 67 0.846 0.066 101 0.544 0.129 110 0.679 0.086Malawi 94 0.527 0.060 68 0.842 0.068 117 0.436 0.131 78 0.789 0.067Macedonia 95 0.525 0.049 101 0.754 0.083 78 0.688 0.106 127 0.577 0.089Kosovo 96 0.515 0.068 97 0.782 0.083 89 0.624 0.121 124 0.606 0.094CAR 97 0.511 0.053 110 0.698 0.104 100 0.551 0.133 91 0.749 0.078Kyrgyzstan 98 0.507 0.072 116 0.669 0.108 99 0.551 0.131 90 0.751 0.069Honduras 99 0.495 0.061 78 0.824 0.070 114 0.451 0.137 108 0.690 0.081Serbia 100 0.486 0.063 105 0.747 0.086 95 0.593 0.124 130 0.552 0.092Madagascar 101 0.485 0.072 62 0.851 0.065 130 0.340 0.137 80 0.786 0.069Comoros 102 0.485 0.051 84 0.818 0.070 112 0.462 0.141 94 0.745 0.076Somaliland 103 0.482 0.061 114 0.676 0.107 105 0.534 0.133 113 0.671 0.087Mozambique 104 0.480 0.065 96 0.783 0.082 125 0.375 0.136 83 0.780 0.072Papua New Guinea 105 0.464 0.059 103 0.749 0.090 128 0.351 0.146 70 0.817 0.066Haiti 106 0.463 0.065 99 0.774 0.083 137 0.312 0.137 47 0.859 0.054Fiji 107 0.451 0.060 104 0.747 0.087 94 0.595 0.130 134 0.478 0.100Iraq 108 0.449 0.056 109 0.706 0.102 123 0.390 0.133 101 0.713 0.084Singapore 109 0.448 0.048 121 0.649 0.102 44 0.883 0.058 146 0.323 0.096Guinea 110 0.445 0.060 106 0.739 0.100 126 0.364 0.130 107 0.692 0.088Tanzania 111 0.437 0.061 112 0.692 0.099 122 0.403 0.136 105 0.706 0.084Montenegro 112 0.429 0.054 89 0.809 0.076 140 0.288 0.129 102 0.712 0.082Pakistan 113 0.427 0.058 128 0.585 0.127 127 0.363 0.139 82 0.780 0.068Gabon 114 0.424 0.043 102 0.751 0.094 151 0.237 0.116 69 0.820 0.060Burma/Myanmar 115 0.406 0.051 119 0.658 0.103 106 0.528 0.131 125 0.588 0.098Mauritania 116 0.402 0.056 143 0.446 0.128 115 0.446 0.139 93 0.746 0.076Zambia 117 0.396 0.040 100 0.769 0.087 131 0.331 0.134 131 0.549 0.096Armenia 118 0.394 0.046 115 0.676 0.108 133 0.319 0.123 122 0.615 0.086Maldives 119 0.391 0.048 124 0.622 0.108 111 0.466 0.128 135 0.469 0.100Algeria 120 0.379 0.048 138 0.505 0.116 124 0.382 0.127 118 0.631 0.087Bangladesh 121 0.367 0.047 122 0.645 0.110 145 0.260 0.123 119 0.625 0.094Nicaragua 122 0.361 0.042 139 0.481 0.127 129 0.351 0.134 123 0.611 0.102Ukraine 123 0.360 0.048 136 0.525 0.115 136 0.318 0.127 126 0.580 0.093Venezuela 124 0.357 0.044 129 0.576 0.110 116 0.438 0.122 138 0.425 0.091Cameroon 125 0.356 0.038 130 0.568 0.111 149 0.247 0.119 109 0.688 0.081Gambia 126 0.356 0.037 125 0.594 0.111 80 0.685 0.120 160 0.237 0.089Afghanistan 127 0.355 0.045 117 0.662 0.106 150 0.243 0.120 128 0.577 0.085Turkey 128 0.345 0.043 133 0.551 0.119 88 0.632 0.121 159 0.241 0.084Uganda 129 0.342 0.034 127 0.587 0.112 154 0.189 0.105 114 0.663 0.081Malaysia 130 0.340 0.040 113 0.681 0.099 132 0.320 0.127 141 0.366 0.093Bosnia and Herzegovina 131 0.337 0.021 85 0.816 0.072 82 0.669 0.113 88 0.754 0.071Zanzibar 132 0.336 0.039 126 0.589 0.112 153 0.196 0.113 121 0.618 0.097Zimbabwe 133 0.325 0.038 118 0.662 0.112 148 0.250 0.118 140 0.400 0.096Sudan 134 0.322 0.043 134 0.536 0.119 120 0.406 0.160 149 0.301 0.095Angola 135 0.317 0.039 131 0.562 0.109 147 0.250 0.115 136 0.459 0.095Kuwait 136 0.315 0.030 162 0.125 0.069 52 0.838 0.073 129 0.573 0.095Morocco 137 0.313 0.016 108 0.711 0.096 91 0.616 0.120 112 0.671 0.080Cambodia 138 0.304 0.042 142 0.456 0.118 139 0.290 0.125 137 0.449 0.094Congo. Democratic Republic of 139 0.302 0.032 144 0.440 0.119 155 0.173 0.096 120 0.623 0.096Belarus 140 0.298 0.032 140 0.464 0.122 135 0.318 0.144 145 0.353 0.103Chad 141 0.293 0.023 135 0.528 0.124 162 0.067 0.063 115 0.641 0.089Libya 142 0.292 0.016 123 0.635 0.107 169 0.000 0.000 100 0.720 0.077Djibouti 143 0.282 0.035 137 0.508 0.113 143 0.274 0.123 152 0.268 0.084Russia 144 0.278 0.028 148 0.367 0.114 121 0.403 0.130 153 0.265 0.088Congo. Republic of the 145 0.272 0.034 141 0.463 0.143 156 0.160 0.108 139 0.414 0.104Jordan 146 0.267 0.022 132 0.559 0.118 102 0.544 0.129 132 0.525 0.105Rwanda 147 0.266 0.030 155 0.241 0.104 109 0.501 0.138 144 0.354 0.100Kazakhstan 148 0.259 0.023 153 0.294 0.113 141 0.286 0.128 143 0.355 0.089Vietnam. Democratic Republic of 149 0.257 0.024 165 0.079 0.060 86 0.647 0.127 154 0.257 0.098Ethiopia 150 0.254 0.030 149 0.334 0.119 138 0.290 0.120 151 0.288 0.091Iran 151 0.230 0.021 157 0.166 0.088 110 0.479 0.139 142 0.365 0.104Equatorial Guinea 152 0.223 0.025 152 0.300 0.120 159 0.091 0.083 147 0.313 0.092Palestine/West Bank 153 0.222 0.018 147 0.381 0.122 168 0.000 0.000 117 0.634 0.093Egypt 154 0.217 0.023 156 0.238 0.114 146 0.251 0.123 163 0.170 0.073Azerbaijan 155 0.213 0.021 150 0.315 0.120 160 0.082 0.069 156 0.250 0.089Cuba 156 0.201 0.018 170 0.058 0.043 113 0.453 0.143 169 0.088 0.053Uzbekistan 157 0.197 0.015 161 0.143 0.076 134 0.318 0.126 168 0.098 0.051Oman 158 0.194 0.015 167 0.073 0.053 59 0.822 0.078 165 0.150 0.062Tajikistan 159 0.191 0.015 160 0.160 0.082 161 0.074 0.067 158 0.242 0.083Burundi 160 0.190 0.017 159 0.163 0.087 163 0.033 0.037 150 0.294 0.088South Sudan 161 0.181 0.016 146 0.386 0.121 167 0.000 0.000 166 0.109 0.058Somalia 162 0.172 0.019 145 0.402 0.138 164 0.000 0.000 133 0.482 0.105Turkmenistan 163 0.154 0.011 171 0.057 0.045 158 0.105 0.082 172 0.036 0.029Thailand 164 0.149 0.021 158 0.165 0.088 144 0.265 0.123 157 0.242 0.083Syria 165 0.148 0.007 163 0.103 0.063 171 0.000 0.000 170 0.069 0.043Swaziland 166 0.143 0.019 169 0.059 0.053 142 0.280 0.134 155 0.254 0.100Palestine/Gaza 167 0.137 0.016 154 0.280 0.112 165 0.000 0.000 148 0.306 0.098Yemen 168 0.125 0.013 151 0.305 0.116 170 0.000 0.000 162 0.175 0.076Laos 169 0.098 0.013 168 0.071 0.053 157 0.144 0.099 173 0.032 0.027Korea. North 170 0.097 0.013 174 0.025 0.025 152 0.223 0.121 174 0.023 0.021China 171 0.096 0.010 166 0.074 0.049 173 0.000 0.000 161 0.180 0.070Qatar 172 0.088 0.008 164 0.082 0.054 166 0.000 0.000 167 0.107 0.052Eritrea 173 0.075 0.005 172 0.048 0.040 174 0.000 0.000 171 0.042 0.032Saudi Arabia 174 0.027 0.008 173 0.036 0.030 172 0.000 0.000 164 0.156 0.069
eleCtoRAl DemoCRACy InDex (eDI)
fReeDom of ASSoCIAtIon InDex
CleAn eleCtIon InDex
fReeDom of expReSSIon InDex
47

table 3: Country Scores for the liberal Component Index (lCI) and its main Components
APPENDIx: COUNTRY SCORES FOR 2016
Rank Score SD+/- Rank Score SD+/- Rank Score SD+/- Rank Score SD+/- Denmark 1 0.970 0.018 2 0.985 0.009 2 0.969 0.020 2 0.981 0.013Sweden 2 0.969 0.015 10 0.978 0.012 1 0.976 0.016 3 0.977 0.015Norway 3 0.966 0.017 6 0.980 0.011 4 0.965 0.023 1 0.981 0.013Australia 4 0.956 0.022 22 0.960 0.021 3 0.966 0.022 4 0.977 0.015Netherlands 5 0.954 0.022 9 0.978 0.012 7 0.952 0.031 7 0.963 0.023Germany 6 0.950 0.025 5 0.981 0.011 5 0.962 0.025 19 0.943 0.033New Zealand 7 0.947 0.027 14 0.973 0.015 14 0.934 0.040 6 0.967 0.022Estonia 8 0.945 0.030 3 0.983 0.010 16 0.930 0.043 10 0.958 0.027France 9 0.944 0.024 1 0.988 0.007 17 0.929 0.038 17 0.946 0.030Costa Rica 10 0.944 0.028 12 0.974 0.014 11 0.945 0.033 8 0.959 0.025United Kingdom 11 0.942 0.024 21 0.961 0.019 6 0.957 0.028 21 0.938 0.035United States 12 0.940 0.027 18 0.963 0.019 13 0.938 0.037 14 0.947 0.031Lithuania 13 0.936 0.029 23 0.959 0.022 10 0.946 0.033 20 0.939 0.036Switzerland 14 0.935 0.031 24 0.956 0.025 23 0.911 0.051 5 0.973 0.017Finland 15 0.934 0.033 7 0.980 0.012 27 0.905 0.057 11 0.957 0.028Portugal 16 0.927 0.033 13 0.974 0.014 26 0.905 0.053 23 0.933 0.039Slovenia 17 0.921 0.035 30 0.948 0.026 8 0.949 0.033 27 0.916 0.050Belgium 18 0.919 0.037 4 0.981 0.011 22 0.916 0.050 28 0.915 0.047Austria 19 0.919 0.033 15 0.968 0.018 25 0.906 0.054 22 0.935 0.037Spain 20 0.918 0.034 17 0.965 0.019 33 0.887 0.063 16 0.946 0.032Canada 21 0.917 0.037 11 0.977 0.013 29 0.900 0.055 26 0.917 0.048Ireland 22 0.913 0.036 8 0.979 0.012 44 0.849 0.076 9 0.958 0.026Chile 23 0.912 0.041 33 0.943 0.029 30 0.900 0.057 13 0.950 0.033Czech Republic 24 0.905 0.036 16 0.967 0.017 39 0.858 0.071 30 0.912 0.050Bulgaria 25 0.899 0.038 41 0.926 0.035 19 0.926 0.045 34 0.867 0.068Italy 26 0.895 0.039 27 0.952 0.025 18 0.926 0.043 38 0.854 0.072Barbados 27 0.893 0.042 29 0.949 0.025 49 0.833 0.086 18 0.945 0.033Uruguay 28 0.893 0.048 20 0.962 0.019 48 0.834 0.093 24 0.930 0.040Tunisia 29 0.891 0.041 60 0.871 0.053 9 0.947 0.032 31 0.897 0.058Greece 30 0.888 0.050 28 0.951 0.025 32 0.890 0.064 36 0.864 0.070South Korea 31 0.886 0.045 32 0.945 0.026 21 0.924 0.045 44 0.825 0.085Iceland 32 0.881 0.045 26 0.953 0.025 64 0.798 0.101 15 0.947 0.034Albania 33 0.880 0.045 31 0.946 0.028 20 0.925 0.045 45 0.823 0.087Cape Verde 34 0.879 0.050 34 0.939 0.031 50 0.832 0.088 29 0.914 0.050Slovakia 35 0.874 0.042 37 0.937 0.032 34 0.882 0.064 40 0.842 0.084Latvia 36 0.871 0.048 36 0.937 0.031 72 0.770 0.103 12 0.952 0.030Benin 37 0.867 0.046 40 0.928 0.035 31 0.899 0.055 50 0.805 0.088Japan 38 0.860 0.052 38 0.930 0.034 12 0.941 0.035 67 0.744 0.121Cyprus 39 0.851 0.049 35 0.939 0.029 53 0.825 0.086 41 0.838 0.083Trinidad and Tobago 40 0.847 0.052 54 0.888 0.047 40 0.855 0.075 42 0.834 0.077Taiwan 41 0.843 0.062 19 0.963 0.020 61 0.803 0.090 53 0.791 0.106Botswana 42 0.836 0.048 39 0.928 0.033 47 0.844 0.073 56 0.785 0.092Romania 43 0.835 0.053 62 0.865 0.054 66 0.794 0.095 35 0.866 0.067São Tomé och Príncipe 44 0.835 0.058 44 0.910 0.043 35 0.875 0.064 66 0.745 0.108South Africa 45 0.831 0.053 65 0.857 0.059 38 0.862 0.069 51 0.802 0.090Mauritius 46 0.824 0.053 46 0.908 0.041 28 0.901 0.056 74 0.702 0.117Argentina 47 0.823 0.051 55 0.885 0.049 42 0.853 0.077 60 0.775 0.100Vanuatu 48 0.818 0.056 47 0.907 0.041 51 0.828 0.085 64 0.750 0.107Jamaica 49 0.806 0.059 68 0.846 0.062 62 0.802 0.094 43 0.832 0.080Bhutan 50 0.805 0.059 81 0.794 0.076 65 0.797 0.096 32 0.875 0.067Namibia 51 0.804 0.060 42 0.921 0.037 94 0.671 0.126 37 0.859 0.070Hungary 52 0.804 0.060 48 0.906 0.042 84 0.706 0.120 39 0.850 0.074Poland 53 0.797 0.058 57 0.882 0.051 69 0.786 0.108 55 0.785 0.091Croatia 54 0.796 0.063 50 0.902 0.045 67 0.790 0.105 63 0.760 0.105Ghana 55 0.796 0.056 49 0.906 0.040 58 0.815 0.089 72 0.717 0.121Tanzania 56 0.789 0.059 87 0.770 0.087 43 0.852 0.078 57 0.782 0.111Israel 57 0.785 0.068 69 0.841 0.064 37 0.862 0.074 76 0.690 0.138Senegal 58 0.785 0.063 61 0.866 0.055 79 0.750 0.109 62 0.763 0.101Guyana 59 0.776 0.060 56 0.884 0.049 70 0.781 0.108 77 0.688 0.124Moldova 60 0.766 0.063 72 0.825 0.068 89 0.689 0.127 48 0.817 0.095Seychelles 61 0.763 0.062 63 0.860 0.058 102 0.618 0.136 33 0.872 0.067Niger 62 0.762 0.069 58 0.878 0.051 54 0.823 0.091 95 0.606 0.143Peru 63 0.762 0.058 103 0.703 0.093 24 0.908 0.053 71 0.729 0.114Nepal 64 0.755 0.067 106 0.673 0.099 36 0.865 0.074 58 0.778 0.102Panama 65 0.754 0.062 25 0.953 0.023 56 0.817 0.092 108 0.531 0.147Malawi 66 0.747 0.065 84 0.777 0.077 45 0.847 0.079 83 0.659 0.129Sri Lanka 67 0.745 0.064 67 0.846 0.059 125 0.477 0.152 25 0.922 0.044Brazil 68 0.744 0.056 86 0.773 0.080 81 0.743 0.107 65 0.747 0.104Colombia 69 0.743 0.061 93 0.748 0.090 75 0.760 0.111 61 0.763 0.108Montenegro 70 0.741 0.066 59 0.873 0.053 112 0.572 0.148 46 0.819 0.086Suriname 71 0.737 0.071 66 0.849 0.059 73 0.763 0.112 91 0.627 0.156Mongolia 72 0.726 0.067 70 0.839 0.065 85 0.703 0.121 78 0.685 0.122Indonesia 73 0.726 0.066 102 0.703 0.099 68 0.787 0.099 73 0.707 0.122Kuwait 74 0.722 0.065 101 0.717 0.091 46 0.845 0.077 90 0.631 0.129Liberia 75 0.719 0.066 88 0.767 0.082 77 0.759 0.108 80 0.669 0.123India 76 0.718 0.059 121 0.614 0.108 80 0.749 0.112 49 0.812 0.086Palestine 77 0.715 0.074 94 0.736 0.089 101 0.619 0.137 70 0.730 0.110Mali 78 0.715 0.060 79 0.798 0.078 57 0.816 0.090 99 0.571 0.150El Salvador 79 0.711 0.062 96 0.733 0.091 86 0.700 0.117 68 0.744 0.112Burkina Faso 80 0.711 0.066 76 0.809 0.068 95 0.658 0.127 75 0.692 0.126Lesotho 81 0.706 0.063 99 0.719 0.095 106 0.590 0.139 47 0.819 0.087Nigeria 82 0.700 0.074 89 0.764 0.085 52 0.826 0.078 104 0.539 0.164Georgia 83 0.689 0.070 77 0.805 0.077 88 0.691 0.119 94 0.613 0.147Singapore 84 0.684 0.073 45 0.910 0.043 122 0.515 0.160 86 0.650 0.131East Timor 85 0.684 0.065 74 0.817 0.068 107 0.588 0.141 81 0.668 0.126Serbia 86 0.683 0.076 43 0.912 0.042 114 0.562 0.151 97 0.587 0.143Solomon Islands 87 0.683 0.069 92 0.758 0.082 116 0.554 0.149 54 0.788 0.098
legISlAtIVe ConStRAIntS on the exCeCutIVe InDex
lIbeRAl Component InDex (lCI)
equAlIty befoRe the lAw AnD InDIVIDuAl lIbeRty InDex
JuDICIAl ConStRAIntS on the exCeCutIVe InDex
48

APPENDIx: COUNTRY SCORES FOR 2016
Guatemala 88 0.678 0.064 112 0.636 0.108 63 0.800 0.094 87 0.638 0.145Zambia 89 0.675 0.068 119 0.618 0.107 78 0.759 0.113 79 0.683 0.124Mexico 90 0.674 0.070 107 0.673 0.096 97 0.644 0.140 69 0.743 0.107Uganda 91 0.670 0.072 120 0.615 0.113 76 0.759 0.107 84 0.657 0.136Kenya 92 0.661 0.070 124 0.584 0.109 60 0.805 0.092 88 0.633 0.133Papua New Guinea 93 0.661 0.068 114 0.633 0.103 82 0.742 0.123 85 0.653 0.133Paraguay 94 0.659 0.072 78 0.801 0.078 110 0.575 0.135 92 0.621 0.135Philippines 95 0.655 0.078 129 0.528 0.118 91 0.682 0.131 59 0.775 0.108Jordan 96 0.653 0.072 90 0.763 0.079 109 0.576 0.138 96 0.602 0.141Comoros 97 0.641 0.083 71 0.834 0.068 93 0.677 0.136 120 0.429 0.170Bosnia and Herzegovina 98 0.640 0.070 53 0.888 0.049 126 0.476 0.154 107 0.531 0.151Fiji 99 0.629 0.078 83 0.786 0.075 117 0.548 0.151 105 0.537 0.153Ivory Coast 100 0.626 0.079 64 0.860 0.057 113 0.570 0.145 113 0.489 0.166Morocco 101 0.619 0.074 111 0.659 0.105 92 0.678 0.125 101 0.551 0.150Kyrgyzstan 102 0.607 0.066 95 0.735 0.089 83 0.723 0.121 123 0.395 0.149Togo 103 0.606 0.074 82 0.791 0.078 98 0.643 0.141 125 0.381 0.162Bolivia 104 0.605 0.075 91 0.761 0.083 120 0.545 0.150 103 0.541 0.150Honduras 105 0.585 0.069 73 0.821 0.078 130 0.370 0.179 102 0.550 0.161Myanmar 106 0.572 0.074 139 0.418 0.125 119 0.546 0.159 52 0.795 0.096Mozambique 107 0.570 0.080 116 0.624 0.106 123 0.512 0.161 100 0.558 0.151Kosovo 108 0.559 0.087 127 0.551 0.115 105 0.608 0.129 109 0.529 0.177Sierra Leone 109 0.559 0.071 85 0.775 0.080 128 0.417 0.150 112 0.495 0.163Haiti 110 0.557 0.077 80 0.797 0.078 118 0.546 0.180 130 0.346 0.175Rwanda 111 0.553 0.074 97 0.727 0.096 108 0.578 0.155 126 0.377 0.151Iraq 112 0.551 0.075 148 0.323 0.113 59 0.813 0.089 106 0.532 0.169Guinea-Bissau 113 0.550 0.079 122 0.596 0.110 111 0.574 0.151 114 0.486 0.158Vietnam 114 0.544 0.077 100 0.718 0.099 96 0.645 0.144 136 0.290 0.142Afghanistan 115 0.528 0.070 149 0.307 0.112 55 0.820 0.092 116 0.452 0.161Egypt 116 0.527 0.064 163 0.198 0.094 15 0.931 0.048 115 0.466 0.164Gabon 117 0.524 0.071 51 0.897 0.047 138 0.334 0.163 131 0.330 0.171Pakistan 118 0.522 0.077 146 0.333 0.118 100 0.620 0.143 82 0.665 0.138CAR 119 0.522 0.089 142 0.382 0.132 71 0.781 0.105 121 0.403 0.156Somaliland 120 0.515 0.083 113 0.634 0.110 104 0.610 0.148 135 0.299 0.156Zanzibar 121 0.501 0.076 126 0.573 0.122 103 0.617 0.146 133 0.305 0.145Lebanon 122 0.500 0.080 117 0.623 0.105 115 0.557 0.137 132 0.316 0.150Ukraine 123 0.498 0.067 132 0.498 0.116 74 0.760 0.113 141 0.229 0.146Malaysia 124 0.491 0.074 133 0.485 0.114 137 0.338 0.151 93 0.620 0.131Armenia 125 0.483 0.067 75 0.816 0.070 131 0.363 0.144 138 0.248 0.136Libya 126 0.481 0.070 164 0.171 0.083 41 0.855 0.074 118 0.450 0.156Macedonia 127 0.466 0.065 105 0.678 0.098 99 0.626 0.139 162 0.102 0.104Dominican Republic 128 0.455 0.068 98 0.720 0.094 147 0.214 0.133 122 0.402 0.160Zimbabwe 129 0.438 0.065 150 0.307 0.107 124 0.493 0.152 111 0.495 0.154Madagascar 130 0.438 0.079 123 0.589 0.112 134 0.344 0.165 128 0.362 0.147Iran 131 0.432 0.068 138 0.423 0.113 90 0.684 0.123 148 0.198 0.128Ecuador 132 0.432 0.060 52 0.895 0.049 144 0.245 0.152 161 0.106 0.096Oman 133 0.423 0.064 109 0.662 0.101 153 0.153 0.119 119 0.446 0.150Angola 134 0.400 0.078 134 0.468 0.116 159 0.121 0.108 98 0.586 0.154Laos 135 0.382 0.079 159 0.233 0.106 132 0.361 0.175 110 0.516 0.162Algeria 136 0.376 0.072 110 0.662 0.098 142 0.257 0.145 146 0.201 0.135Guinea 137 0.375 0.065 118 0.623 0.112 141 0.267 0.151 142 0.228 0.123Palestine/Gaza 138 0.372 0.090 145 0.346 0.120 87 0.699 0.126 127 0.370 0.155Maldives 139 0.353 0.080 141 0.382 0.123 127 0.427 0.148 139 0.246 0.143Qatar 140 0.351 0.067 130 0.524 0.116 169 0.062 0.072 117 0.450 0.159Djibouti 141 0.339 0.069 125 0.574 0.112 149 0.187 0.126 140 0.232 0.130Swaziland 142 0.330 0.080 155 0.263 0.103 133 0.344 0.168 129 0.349 0.163Kazakhstan 143 0.329 0.061 115 0.631 0.111 161 0.115 0.107 144 0.206 0.122Thailand 144 0.328 0.066 157 0.242 0.102 163 0.094 0.107 89 0.632 0.145Turkey 145 0.327 0.069 147 0.331 0.112 129 0.393 0.163 137 0.255 0.138Cameroon 146 0.327 0.065 128 0.541 0.114 143 0.255 0.150 156 0.148 0.129Bangladesh 147 0.316 0.069 135 0.468 0.120 154 0.149 0.112 134 0.301 0.159Nicaragua 148 0.304 0.060 104 0.681 0.100 165 0.084 0.097 163 0.100 0.099Russia 149 0.287 0.050 131 0.504 0.114 150 0.187 0.122 152 0.153 0.116Venezuela 150 0.286 0.064 136 0.451 0.128 135 0.342 0.173 169 0.036 0.050Somalia 151 0.283 0.070 169 0.103 0.068 121 0.534 0.168 149 0.177 0.138Ethiopia 152 0.273 0.068 137 0.431 0.122 155 0.142 0.125 147 0.199 0.135Belarus 153 0.273 0.043 108 0.663 0.104 170 0.061 0.077 167 0.056 0.063Mauritania 154 0.259 0.061 152 0.299 0.127 146 0.217 0.146 143 0.207 0.130Gambia 155 0.252 0.062 143 0.376 0.119 160 0.120 0.119 145 0.203 0.127Cambodia 156 0.248 0.062 144 0.365 0.123 152 0.164 0.131 155 0.148 0.119Congo 157 0.243 0.066 151 0.303 0.124 140 0.270 0.170 159 0.116 0.112DRC 158 0.242 0.064 162 0.200 0.088 136 0.340 0.160 151 0.154 0.117Saudi Arabia 159 0.234 0.056 160 0.221 0.101 171 0.058 0.076 124 0.387 0.145Cuba 160 0.227 0.057 140 0.391 0.113 162 0.096 0.097 154 0.149 0.111Chad 161 0.196 0.056 154 0.267 0.106 156 0.141 0.120 158 0.116 0.099China 162 0.190 0.055 153 0.286 0.109 166 0.082 0.084 153 0.152 0.115Yemen 163 0.183 0.064 171 0.073 0.055 139 0.289 0.196 157 0.119 0.107Sudan 164 0.177 0.054 167 0.145 0.075 145 0.240 0.156 160 0.113 0.094Equatorial Guinea 165 0.171 0.055 158 0.237 0.097 148 0.200 0.142 170 0.030 0.045South Sudan 166 0.156 0.049 170 0.099 0.062 151 0.181 0.123 150 0.162 0.110Tajikistan 167 0.153 0.048 161 0.211 0.096 158 0.127 0.110 164 0.088 0.080Burundi 168 0.136 0.046 168 0.139 0.082 157 0.135 0.111 165 0.084 0.077Azerbaijan 169 0.121 0.036 156 0.252 0.103 167 0.077 0.075 173 0.009 0.018Turkmenistan 170 0.096 0.035 166 0.150 0.083 174 0.041 0.061 168 0.046 0.057Uzbekistan 171 0.089 0.033 165 0.165 0.078 168 0.064 0.078 172 0.014 0.024Syria 172 0.086 0.036 172 0.057 0.044 164 0.088 0.088 166 0.073 0.080Eritrea 173 0.055 0.024 173 0.051 0.041 172 0.058 0.067 171 0.017 0.028North Korea 174 0.030 0.017 174 0.012 0.015 173 0.054 0.062 174 0.004 0.010
gReen color indicates that the country’s score has improved over the past 10 years at a statistically significant level. ReD color indicates that the country’s score has decreased over the past 10 years at a statistically significant level. SD+/- reports the standard deviation to indicate the level of uncertainty.
legISlAtIVe ConStRAIntS on the exCeCutIVe InDex
lIbeRAl Component InDex (lCI)
equAlIty befoRe the lAw AnD InDIVIDuAl lIbeRty InDex
JuDICIAl ConStRAIntS on the exCeCutIVe InDex
49

Rank Score SD+/- Rank Score SD+/- Rank Score SD+/- Rank Score SD+/-Norway 1 0.971 0.019 2 0.972 0.019 1 0.983 0.011 2 0.985 0.012Denmark 2 0.952 0.030 1 0.974 0.021 8 0.953 0.028 1 0.986 0.011Finland 3 0.935 0.035 6 0.952 0.035 10 0.950 0.031 4 0.958 0.031Iceland 4 0.928 0.038 20 0.926 0.048 5 0.960 0.026 6 0.955 0.033Germany 5 0.924 0.037 4 0.962 0.027 23 0.923 0.045 7 0.941 0.041Japan 6 0.923 0.039 3 0.970 0.023 3 0.970 0.019 23 0.872 0.079Switzerland 7 0.919 0.045 10 0.938 0.047 16 0.939 0.039 3 0.963 0.027France 8 0.915 0.044 17 0.928 0.040 2 0.972 0.016 19 0.907 0.061Portugal 9 0.914 0.038 14 0.934 0.043 28 0.903 0.050 5 0.955 0.033Netherlands 10 0.912 0.043 13 0.934 0.041 11 0.950 0.030 12 0.926 0.050Czech Republic 11 0.911 0.045 8 0.943 0.038 7 0.953 0.031 18 0.907 0.062New Zealand 12 0.909 0.044 7 0.946 0.038 22 0.923 0.044 13 0.918 0.056Lithuania 13 0.908 0.043 22 0.923 0.048 21 0.924 0.041 9 0.933 0.045Sweden 14 0.906 0.044 23 0.922 0.054 15 0.939 0.035 14 0.915 0.054Belgium 15 0.900 0.049 25 0.919 0.053 17 0.933 0.039 10 0.931 0.047Spain 16 0.898 0.042 9 0.943 0.039 29 0.903 0.052 17 0.912 0.057Taiwan 17 0.889 0.051 24 0.921 0.051 14 0.940 0.035 25 0.872 0.077Estonia 18 0.887 0.050 18 0.928 0.052 4 0.966 0.021 40 0.831 0.094Italy 19 0.883 0.045 32 0.904 0.055 35 0.893 0.056 15 0.914 0.057Greece 20 0.880 0.044 46 0.840 0.086 26 0.912 0.049 8 0.939 0.042Slovenia 21 0.879 0.048 26 0.918 0.054 25 0.913 0.047 22 0.875 0.076Costa Rica 22 0.873 0.051 15 0.934 0.043 27 0.904 0.053 26 0.869 0.082Austria 23 0.873 0.057 16 0.934 0.046 20 0.926 0.041 37 0.833 0.101United Kingdom 24 0.872 0.048 30 0.906 0.050 12 0.945 0.030 44 0.823 0.104Cyprus 25 0.871 0.062 27 0.916 0.054 6 0.959 0.027 47 0.812 0.111Cape Verde 26 0.861 0.056 39 0.877 0.074 36 0.893 0.059 24 0.872 0.083Poland 27 0.860 0.061 31 0.906 0.058 33 0.893 0.057 36 0.834 0.096Ireland 28 0.859 0.059 5 0.959 0.031 51 0.828 0.085 30 0.847 0.096Belarus 29 0.856 0.055 36 0.890 0.066 31 0.900 0.052 28 0.855 0.088Australia 30 0.843 0.061 28 0.913 0.052 50 0.829 0.082 31 0.847 0.096Hungary 31 0.843 0.057 11 0.936 0.043 54 0.808 0.085 32 0.843 0.091Latvia 32 0.843 0.064 29 0.909 0.059 39 0.880 0.060 41 0.829 0.101Uruguay 33 0.839 0.062 50 0.813 0.093 40 0.877 0.063 20 0.900 0.065Benin 34 0.834 0.055 12 0.936 0.042 59 0.779 0.090 27 0.865 0.082South Korea 35 0.830 0.057 52 0.805 0.093 18 0.929 0.039 49 0.810 0.105Lesotho 36 0.826 0.069 42 0.850 0.086 42 0.863 0.073 33 0.841 0.101Barbados 37 0.817 0.065 54 0.799 0.103 34 0.893 0.057 39 0.832 0.102Bhutan 38 0.812 0.068 41 0.855 0.086 19 0.927 0.043 67 0.731 0.141Bulgaria 39 0.807 0.064 33 0.900 0.064 63 0.751 0.106 35 0.837 0.093Cuba 40 0.802 0.077 85 0.702 0.133 13 0.941 0.039 34 0.841 0.101Canada 41 0.799 0.062 76 0.722 0.120 43 0.853 0.067 21 0.879 0.076Trinidad and Tobago 42 0.789 0.065 34 0.894 0.061 57 0.784 0.093 59 0.764 0.130Slovakia 43 0.789 0.074 59 0.790 0.111 48 0.838 0.074 45 0.818 0.106Israel 44 0.776 0.070 48 0.837 0.095 55 0.808 0.092 68 0.731 0.136Togo 45 0.773 0.078 69 0.742 0.125 32 0.894 0.057 70 0.729 0.147Mongolia 46 0.768 0.065 66 0.764 0.110 62 0.755 0.097 42 0.826 0.097Tunisia 47 0.766 0.073 21 0.925 0.046 86 0.662 0.125 60 0.762 0.131Mauritius 48 0.747 0.079 47 0.840 0.098 38 0.881 0.064 101 0.608 0.179Georgia 49 0.746 0.081 58 0.791 0.121 46 0.840 0.075 78 0.692 0.157Niger 50 0.744 0.079 40 0.866 0.078 82 0.665 0.120 56 0.773 0.122Singapore 51 0.743 0.088 57 0.792 0.148 41 0.871 0.067 95 0.649 0.174Romania 52 0.742 0.077 62 0.772 0.109 73 0.716 0.114 54 0.785 0.118Albania 53 0.736 0.083 84 0.702 0.135 52 0.818 0.092 57 0.773 0.130Croatia 54 0.731 0.083 90 0.678 0.140 37 0.882 0.059 82 0.685 0.158Zanzibar 55 0.731 0.075 92 0.659 0.142 49 0.831 0.083 69 0.730 0.145Suriname 56 0.731 0.078 63 0.769 0.113 78 0.682 0.125 52 0.790 0.115United States 57 0.729 0.082 65 0.767 0.115 85 0.664 0.110 48 0.811 0.108Panama 58 0.728 0.080 45 0.841 0.091 79 0.673 0.135 62 0.742 0.135Palestine 59 0.727 0.085 91 0.662 0.144 64 0.748 0.129 38 0.833 0.105Seychelles 60 0.721 0.082 74 0.726 0.146 30 0.903 0.057 103 0.603 0.175Jamaica 61 0.721 0.074 108 0.583 0.188 67 0.733 0.107 16 0.913 0.057Burkina Faso 62 0.720 0.083 38 0.885 0.072 83 0.664 0.129 84 0.678 0.164Argentina 63 0.718 0.083 56 0.794 0.107 75 0.694 0.107 66 0.734 0.139Ecuador 64 0.718 0.089 49 0.826 0.110 88 0.645 0.132 63 0.740 0.134Vanuatu 65 0.714 0.071 44 0.847 0.085 123 0.411 0.148 11 0.930 0.048Vietnam 66 0.713 0.084 19 0.927 0.049 90 0.635 0.149 104 0.602 0.183Montenegro 67 0.713 0.088 51 0.809 0.099 44 0.842 0.076 122 0.540 0.190Armenia 68 0.711 0.085 61 0.775 0.102 56 0.789 0.091 98 0.626 0.172Bosnia and Herzegovina 69 0.706 0.079 73 0.730 0.129 61 0.755 0.097 80 0.688 0.153Gabon 70 0.700 0.082 35 0.894 0.072 92 0.625 0.132 89 0.669 0.167Algeria 71 0.700 0.080 88 0.689 0.130 53 0.813 0.088 90 0.661 0.162Mali 72 0.688 0.078 37 0.888 0.070 114 0.467 0.158 58 0.764 0.129Ghana 73 0.683 0.088 68 0.755 0.109 99 0.571 0.136 55 0.777 0.119Botswana 74 0.682 0.086 79 0.715 0.120 72 0.723 0.102 94 0.656 0.152Serbia 75 0.682 0.085 89 0.683 0.156 68 0.730 0.103 87 0.671 0.158Senegal 76 0.670 0.081 113 0.564 0.158 84 0.664 0.117 46 0.816 0.104Kyrgyzstan 77 0.665 0.085 86 0.697 0.133 80 0.669 0.115 88 0.669 0.165Indonesia 78 0.661 0.091 99 0.624 0.153 87 0.652 0.131 72 0.711 0.152Sri Lanka 79 0.659 0.090 107 0.589 0.162 65 0.746 0.114 86 0.675 0.164São Tomé and Príncipe 80 0.652 0.079 82 0.708 0.119 97 0.579 0.125 73 0.711 0.144Moldova 81 0.644 0.090 109 0.581 0.164 77 0.683 0.111 85 0.676 0.147Bolivia 82 0.643 0.073 71 0.738 0.123 119 0.422 0.134 53 0.790 0.112Kuwait 83 0.641 0.081 105 0.607 0.147 24 0.921 0.045 145 0.404 0.208Rwanda 84 0.641 0.086 101 0.613 0.176 60 0.779 0.097 123 0.532 0.196Liberia 85 0.634 0.079 83 0.706 0.133 124 0.408 0.136 29 0.849 0.091Libya 86 0.629 0.086 103 0.612 0.142 103 0.545 0.153 61 0.746 0.133Comoros 87 0.626 0.084 43 0.848 0.091 128 0.399 0.140 81 0.687 0.157Lebanon 88 0.622 0.080 55 0.797 0.096 98 0.574 0.130 127 0.493 0.207
equAl DIStRIbutIon of ReSouRCeS InDex
egAlItARIAn Component InDex (eCI)
equAl pRoteCtIon InDex
equAl ACCeSS InDex
APPENDIx: COUNTRY SCORES FOR 2016
table 4: Country Scores for the egalitarian Component Index (eCI) and its main Components
50

Rank Score SD+/- Rank Score SD+/- Rank Score SD+/- Rank Score SD+/-Malaysia 89 0.620 0.082 128 0.476 0.151 45 0.841 0.075 118 0.548 0.184South Africa 90 0.618 0.071 64 0.767 0.111 127 0.399 0.140 74 0.710 0.145Kosovo 91 0.614 0.094 80 0.713 0.150 100 0.567 0.131 97 0.626 0.185CAR 92 0.612 0.085 121 0.507 0.188 105 0.537 0.138 43 0.823 0.103Namibia 93 0.611 0.082 53 0.801 0.103 109 0.509 0.133 120 0.546 0.180Fiji 94 0.603 0.095 106 0.604 0.152 93 0.623 0.125 105 0.601 0.184Nigeria 95 0.602 0.089 87 0.696 0.135 125 0.407 0.154 75 0.705 0.151Venezuela 96 0.598 0.079 95 0.648 0.139 135 0.364 0.149 50 0.810 0.109Guyana 97 0.597 0.078 94 0.653 0.130 95 0.614 0.133 117 0.555 0.185Cameroon 98 0.593 0.082 81 0.709 0.125 81 0.668 0.120 141 0.431 0.206Nepal 99 0.592 0.075 72 0.738 0.133 142 0.319 0.141 65 0.735 0.133Macedonia 100 0.586 0.085 115 0.554 0.162 70 0.724 0.104 119 0.547 0.181Tanzania 101 0.584 0.090 111 0.574 0.144 106 0.536 0.161 79 0.691 0.158Peru 102 0.580 0.092 77 0.718 0.140 121 0.412 0.145 93 0.656 0.170Russia 103 0.578 0.085 126 0.477 0.179 74 0.698 0.110 114 0.567 0.184East Timor 104 0.566 0.078 60 0.780 0.108 154 0.256 0.132 77 0.697 0.154Chile 105 0.565 0.081 122 0.498 0.172 107 0.535 0.128 91 0.659 0.165Sierra Leone 106 0.558 0.084 119 0.523 0.190 122 0.412 0.143 64 0.737 0.137Zambia 107 0.556 0.096 93 0.654 0.143 140 0.336 0.136 83 0.685 0.159Solomon Islands 108 0.554 0.092 70 0.741 0.121 147 0.297 0.147 100 0.619 0.167Morocco 109 0.554 0.089 67 0.762 0.110 134 0.369 0.131 113 0.568 0.185Gambia 110 0.548 0.088 75 0.722 0.115 102 0.555 0.142 148 0.368 0.198Ivory Coast 111 0.546 0.082 100 0.623 0.160 156 0.245 0.149 51 0.791 0.115Iran 112 0.545 0.084 110 0.580 0.159 69 0.726 0.121 147 0.370 0.214Kazakhstan 113 0.544 0.089 125 0.485 0.157 66 0.745 0.102 146 0.397 0.197Brazil 114 0.520 0.095 116 0.538 0.167 132 0.374 0.144 96 0.639 0.163Nicaragua 115 0.511 0.104 118 0.525 0.220 110 0.507 0.163 124 0.530 0.191Guinea-Bissau 116 0.509 0.092 123 0.493 0.143 117 0.444 0.153 99 0.621 0.177Laos 117 0.508 0.087 97 0.627 0.158 118 0.432 0.154 133 0.471 0.197India 118 0.508 0.095 96 0.647 0.164 144 0.316 0.136 106 0.598 0.185Mozambique 119 0.506 0.084 98 0.626 0.132 159 0.230 0.130 92 0.659 0.170Thailand 120 0.502 0.090 141 0.357 0.154 91 0.632 0.130 110 0.574 0.191Kenya 121 0.500 0.096 129 0.450 0.154 111 0.483 0.141 109 0.579 0.178Uganda 122 0.499 0.089 152 0.287 0.181 112 0.476 0.156 76 0.698 0.148Maldives 123 0.496 0.087 102 0.613 0.150 115 0.458 0.146 138 0.440 0.193Djibouti 124 0.494 0.083 117 0.527 0.146 116 0.449 0.162 128 0.490 0.202Guinea 125 0.493 0.097 78 0.718 0.140 145 0.311 0.137 131 0.486 0.207Afghanistan 126 0.487 0.089 104 0.607 0.170 151 0.288 0.133 112 0.568 0.197Eritrea 127 0.486 0.092 120 0.518 0.190 108 0.522 0.138 139 0.435 0.198Oman 128 0.477 0.084 142 0.354 0.167 58 0.783 0.083 160 0.269 0.188Ukraine 129 0.473 0.083 157 0.245 0.187 71 0.723 0.108 135 0.445 0.219Mexico 130 0.470 0.091 124 0.492 0.152 137 0.350 0.128 102 0.606 0.175Colombia 131 0.462 0.087 131 0.426 0.159 133 0.370 0.137 116 0.560 0.187Jordan 132 0.455 0.085 139 0.371 0.173 76 0.688 0.111 154 0.338 0.209Qatar 133 0.455 0.069 159 0.204 0.157 9 0.951 0.028 170 0.160 0.154China 134 0.448 0.083 150 0.304 0.152 113 0.469 0.130 107 0.598 0.167Honduras 135 0.427 0.081 143 0.348 0.166 149 0.294 0.131 108 0.597 0.177Equatorial Guinea 136 0.423 0.086 156 0.249 0.153 101 0.565 0.135 137 0.441 0.206Turkey 137 0.422 0.092 114 0.557 0.154 130 0.389 0.157 159 0.290 0.218Palestine/Gaza 138 0.416 0.092 155 0.251 0.171 96 0.596 0.159 157 0.323 0.218Dominican Republic 139 0.411 0.084 148 0.311 0.172 146 0.309 0.135 115 0.565 0.194Burundi 140 0.400 0.084 144 0.333 0.193 143 0.316 0.143 126 0.507 0.192Madagascar 141 0.394 0.095 138 0.376 0.246 171 0.084 0.091 71 0.711 0.150El Salvador 142 0.390 0.082 147 0.315 0.152 155 0.255 0.149 121 0.544 0.193Saudi Arabia 143 0.389 0.064 160 0.200 0.141 47 0.838 0.072 172 0.125 0.131DRC 144 0.388 0.090 135 0.388 0.184 148 0.296 0.146 129 0.488 0.202Ethiopia 145 0.385 0.090 130 0.426 0.180 131 0.388 0.132 151 0.348 0.198Malawi 146 0.374 0.083 151 0.295 0.159 153 0.264 0.133 111 0.572 0.183Myanmar 147 0.372 0.086 140 0.358 0.161 160 0.212 0.130 125 0.515 0.192Iraq 148 0.372 0.088 162 0.197 0.197 120 0.413 0.144 136 0.445 0.202Somaliland 149 0.370 0.092 137 0.381 0.173 150 0.292 0.167 140 0.433 0.202Papua New Guinea 150 0.364 0.085 127 0.477 0.167 166 0.144 0.112 144 0.417 0.214Zimbabwe 151 0.364 0.089 149 0.306 0.149 138 0.343 0.151 149 0.366 0.210Uzbekistan 152 0.359 0.085 172 0.060 0.090 89 0.643 0.133 150 0.353 0.200Philippines 153 0.355 0.094 161 0.199 0.176 141 0.329 0.137 132 0.479 0.185Paraguay 154 0.346 0.079 132 0.404 0.169 163 0.177 0.109 143 0.421 0.189Congo 155 0.337 0.101 158 0.207 0.231 129 0.393 0.202 155 0.337 0.217Turkmenistan 156 0.336 0.083 145 0.326 0.171 104 0.544 0.150 171 0.128 0.146Bangladesh 157 0.333 0.086 164 0.145 0.150 126 0.404 0.145 134 0.453 0.207North Korea 158 0.328 0.073 174 0.035 0.073 94 0.620 0.127 158 0.323 0.211Tajikistan 159 0.312 0.095 133 0.404 0.227 136 0.351 0.167 174 0.120 0.142Azerbaijan 160 0.311 0.073 112 0.573 0.162 168 0.129 0.117 168 0.184 0.182Guatemala 161 0.302 0.079 165 0.134 0.132 158 0.231 0.119 130 0.488 0.198Swaziland 162 0.286 0.085 153 0.274 0.195 139 0.340 0.142 167 0.190 0.192Syria 163 0.285 0.069 134 0.398 0.175 157 0.233 0.120 169 0.183 0.171Somalia 164 0.275 0.086 136 0.382 0.178 172 0.078 0.086 156 0.334 0.203Cambodia 165 0.260 0.088 169 0.094 0.136 162 0.195 0.132 142 0.426 0.209Angola 166 0.248 0.078 166 0.123 0.145 161 0.210 0.124 153 0.339 0.202Chad 167 0.234 0.076 146 0.322 0.160 165 0.145 0.117 166 0.195 0.177Pakistan 168 0.232 0.080 171 0.091 0.131 164 0.162 0.110 152 0.344 0.213Haiti 169 0.226 0.089 168 0.109 0.136 152 0.267 0.161 162 0.230 0.196Sudan 170 0.212 0.075 154 0.269 0.189 173 0.070 0.069 161 0.241 0.178Mauritania 171 0.176 0.071 167 0.113 0.128 167 0.133 0.112 164 0.212 0.186Yemen 172 0.172 0.071 163 0.152 0.162 170 0.094 0.085 163 0.220 0.187Egypt 173 0.163 0.065 170 0.093 0.119 169 0.111 0.100 165 0.200 0.173South Sudan 174 0.088 0.048 173 0.038 0.069 174 0.029 0.042 173 0.120 0.150
APPENDIx: COUNTRY SCORES FOR 2016
equAl DIStRIbutIon of ReSouRCeS InDex
egAlItARIAn Component InDex (eCI)
equAl pRoteCtIon InDex
equAl ACCeSS InDex
gReen color indicates that the country’s score has improved over the past 10 years at a statistically significant level. ReD color indicates that the country’s score has decreased over the past 10 years at a statistically significant level. SD+/- reports the standard deviation to indicate the level of uncertainty.
51

Rank Score SD (+/-) Rank Score SD (+/-) Rank Score Rank Score SD (+/-) Rank Score SD (+/-)Canada 1 0.709 0.022 12 0.944 0.039 123 0.015 18 0.968 0.038 4 0.984 0.023Austria 2 0.699 0.030 13 0.942 0.040 32 0.193 29 0.950 0.061 17 0.966 0.040Australia 3 0.672 0.033 21 0.924 0.052 98 0.032 19 0.968 0.042 8 0.978 0.032Estonia 4 0.660 0.039 59 0.814 0.106 63 0.101 13 0.973 0.027 79 0.483 0.017France 5 0.656 0.038 33 0.877 0.076 82 0.053 30 0.946 0.060 23 0.956 0.038United States 6 0.652 0.014 3 0.976 0.018 161 0 33 0.941 0.028 1 0.995 0.006Denmark 7 0.651 0.016 1 0.978 0.016 37 0.185 20 0.967 0.045 14 0.973 0.043Israel 8 0.647 0.052 71 0.789 0.116 139 0.013 11 0.976 0.034 82 0.462 0.043Iceland 9 0.645 0.021 5 0.974 0.020 43 0.163 10 0.977 0.037 160 0.000 0.000Switzerland 10 0.644 0.023 7 0.960 0.029 1 0.679 25 0.958 0.052 9 0.978 0.034Germany 11 0.644 0.022 6 0.968 0.024 142 0.011 34 0.938 0.055 7 0.979 0.035Venezuela 12 0.642 0.067 135 0.560 0.199 11 0.274 85 0.748 0.082 75 0.576 0.102Suriname 13 0.641 0.055 51 0.832 0.103 112 0.02 82 0.798 0.132 44 0.849 0.112Belgium 14 0.640 0.022 9 0.950 0.035 122 0.017 14 0.972 0.033 19 0.964 0.052Taiwan 15 0.639 0.025 10 0.949 0.037 21 0.212 6 0.978 0.038 20 0.963 0.040Norway 16 0.638 0.022 2 0.978 0.017 125 0.015 35 0.932 0.067 31 0.922 0.064United Kingdom 17 0.634 0.024 11 0.949 0.036 50 0.135 81 0.803 0.093 13 0.973 0.034New Zealand 18 0.634 0.024 17 0.935 0.046 4 0.406 7 0.978 0.031 38 0.876 0.112Finland 19 0.626 0.024 4 0.974 0.020 127 0.015 44 0.917 0.060 99 0.369 0.079Uruguay 20 0.626 0.033 24 0.906 0.060 2 0.565 15 0.970 0.041 11 0.976 0.035Sweden 21 0.622 0.030 15 0.939 0.044 105 0.028 23 0.962 0.037 41 0.856 0.067Nigeria 22 0.621 0.050 30 0.883 0.075 147 0.007 65 0.861 0.136 66 0.673 0.177Indonesia 23 0.619 0.032 25 0.902 0.066 158 0 49 0.910 0.070 15 0.970 0.042Niger 24 0.615 0.039 27 0.893 0.068 24 0.205 45 0.915 0.100 22 0.960 0.066Colombia 25 0.613 0.035 37 0.866 0.082 16 0.241 21 0.964 0.048 2 0.988 0.022Sierra Leone 26 0.612 0.041 16 0.938 0.044 145 0.009 40 0.921 0.097 92 0.411 0.070Jamaica 27 0.610 0.035 38 0.865 0.080 106 0.026 3 0.980 0.028 159 0.000 0.000Czech Republic 28 0.609 0.053 73 0.783 0.118 80 0.06 53 0.898 0.074 30 0.927 0.056Slovenia 29 0.607 0.040 20 0.925 0.050 40 0.168 37 0.928 0.065 173 0.000 0.000South Africa 30 0.606 0.041 42 0.852 0.087 113 0.02 58 0.875 0.093 34 0.902 0.077Costa Rica 31 0.605 0.038 19 0.930 0.048 36 0.186 46 0.914 0.076 78 0.490 0.015Benin 32 0.603 0.032 8 0.954 0.034 110 0.02 57 0.877 0.061 134 0.062 0.033Spain 33 0.601 0.039 49 0.837 0.094 64 0.1 9 0.977 0.033 6 0.979 0.029Italy 34 0.600 0.045 52 0.832 0.102 10 0.279 22 0.962 0.047 5 0.980 0.031Argentina 35 0.599 0.044 40 0.853 0.090 124 0.015 43 0.918 0.055 10 0.976 0.021Zambia 36 0.599 0.044 62 0.806 0.110 52 0.133 61 0.871 0.078 88 0.437 0.036Portugal 37 0.594 0.045 53 0.831 0.101 56 0.123 2 0.981 0.021 170 0.000 0.000Brazil 38 0.594 0.033 70 0.790 0.116 58 0.116 5 0.978 0.021 21 0.963 0.031Lithuania 39 0.591 0.045 64 0.800 0.105 3 0.424 1 0.984 0.019 167 0.000 0.000Vanuatu 40 0.591 0.046 35 0.871 0.081 138 0.013 39 0.926 0.084 169 0.000 0.000Slovakia 41 0.590 0.042 61 0.810 0.110 8 0.342 32 0.944 0.077 26 0.953 0.071Peru 42 0.586 0.047 58 0.817 0.108 13 0.266 24 0.961 0.050 25 0.954 0.068Netherlands 43 0.586 0.042 29 0.883 0.073 29 0.198 75 0.833 0.108 40 0.867 0.097Cape Verde 44 0.583 0.051 34 0.876 0.078 79 0.063 89 0.725 0.203 42 0.855 0.123Japan 45 0.582 0.055 76 0.777 0.122 134 0.013 4 0.979 0.030 12 0.975 0.035Sri Lanka 46 0.581 0.044 36 0.871 0.082 102 0.031 102 0.626 0.119 35 0.899 0.072Greece 47 0.579 0.062 63 0.802 0.114 28 0.2 87 0.746 0.209 55 0.812 0.161Botswana 48 0.579 0.045 54 0.829 0.099 85 0.045 62 0.870 0.075 48 0.837 0.100Latvia 49 0.578 0.046 69 0.790 0.114 15 0.251 17 0.969 0.040 156 0.000 0.000Albania 50 0.577 0.058 115 0.632 0.168 83 0.053 8 0.978 0.041 16 0.967 0.050Montenegro 51 0.575 0.062 87 0.754 0.129 57 0.123 59 0.873 0.106 171 0.000 0.000Iraq 52 0.572 0.062 86 0.754 0.138 75 0.076 128 0.295 0.086 47 0.839 0.100Bulgaria 53 0.568 0.053 77 0.773 0.123 5 0.398 28 0.951 0.039 93 0.408 0.052Croatia 54 0.567 0.052 74 0.783 0.123 9 0.312 55 0.890 0.091 37 0.878 0.087Bolivia 55 0.567 0.050 39 0.857 0.083 7 0.344 66 0.853 0.105 61 0.732 0.102Malaysia 56 0.563 0.051 92 0.747 0.133 163 0 123 0.383 0.110 50 0.829 0.088Gabon 57 0.560 0.062 48 0.838 0.100 96 0.033 74 0.844 0.154 72 0.620 0.162South Korea 58 0.560 0.051 95 0.731 0.134 103 0.031 26 0.958 0.061 3 0.986 0.026Chile 59 0.559 0.057 46 0.839 0.098 126 0.015 73 0.846 0.106 65 0.678 0.144Guyana 60 0.558 0.053 82 0.763 0.126 131 0.013 79 0.806 0.119 33 0.903 0.080Philippines 61 0.558 0.049 81 0.764 0.127 76 0.07 50 0.903 0.054 32 0.921 0.050India 62 0.554 0.059 90 0.749 0.133 169 0 108 0.558 0.110 18 0.966 0.044Trinidad and Tobago 63 0.554 0.059 43 0.851 0.090 159 0 60 0.872 0.110 158 0.000 0.000Guatemala 64 0.554 0.075 68 0.795 0.119 94 0.033 91 0.704 0.159 162 0.000 0.000Poland 65 0.553 0.057 94 0.738 0.141 174 27 0.953 0.049 43 0.851 0.082Dominican Republic 66 0.553 0.059 88 0.753 0.137 99 0.032 41 0.920 0.084 86 0.442 0.047Ukraine 67 0.551 0.051 50 0.837 0.098 59 0.113 68 0.853 0.073 80 0.481 0.173Honduras 68 0.550 0.059 84 0.757 0.135 78 0.068 51 0.900 0.080 89 0.437 0.048Romania 69 0.549 0.051 57 0.818 0.103 12 0.271 93 0.698 0.076 51 0.829 0.124Mexico 70 0.549 0.055 101 0.703 0.145 77 0.069 52 0.898 0.086 24 0.955 0.051Bhutan 71 0.546 0.054 91 0.747 0.131 114 0.02 77 0.825 0.131 46 0.840 0.085Comoros 72 0.543 0.064 134 0.564 0.172 62 0.105 172 0.000 0.000 56 0.799 0.101Mozambique 73 0.542 0.060 72 0.784 0.119 101 0.031 64 0.863 0.107 114 0.166 0.133Papua New Guinea 74 0.539 0.063 83 0.761 0.135 135 0.013 63 0.866 0.140 59 0.755 0.157Namibia 75 0.538 0.059 102 0.697 0.146 100 0.031 38 0.928 0.069 57 0.788 0.093Uganda 76 0.534 0.045 65 0.799 0.109 39 0.181 84 0.777 0.129 62 0.719 0.112El Salvador 77 0.532 0.060 89 0.751 0.134 130 0.013 56 0.878 0.090 90 0.424 0.077Togo 78 0.531 0.041 32 0.878 0.079 87 0.042 163 0.027 0.033 140 0.044 0.056East Timor 79 0.528 0.060 103 0.688 0.153 121 0.018 48 0.912 0.084 97 0.390 0.089Kenya 80 0.527 0.068 75 0.781 0.125 49 0.138 119 0.427 0.061 53 0.825 0.110Bosnia and Herzegovina 81 0.524 0.059 122 0.611 0.173 166 0 36 0.928 0.052 27 0.952 0.048Panama 82 0.524 0.059 119 0.618 0.175 60 0.108 16 0.969 0.045 102 0.336 0.104Vietnam 83 0.524 0.059 111 0.659 0.161 117 0.02 76 0.826 0.098 36 0.882 0.115Hungary 84 0.520 0.063 118 0.619 0.170 17 0.24 31 0.945 0.060 58 0.757 0.199Serbia 85 0.520 0.059 128 0.594 0.175 42 0.164 54 0.894 0.094 28 0.939 0.071São Tomé and Príncipe 86 0.520 0.056 106 0.678 0.149 119 0.02 69 0.852 0.097 52 0.827 0.123Moldova 87 0.515 0.054 80 0.770 0.122 30 0.197 83 0.792 0.078 63 0.705 0.100
APPENDIx: COUNTRY SCORES FOR 2016
table 5: Country Scores for the participatory Component Index (pCI) and its main Components
pARtICIpAtoRy Component InDex (pCI)
CIVIl SoCIety pARtICIpAtIon InDex
DIReCt populAR Vote InDex
loCAl goVeRnment InDex
RegIonAl goVeRnment InDex
52
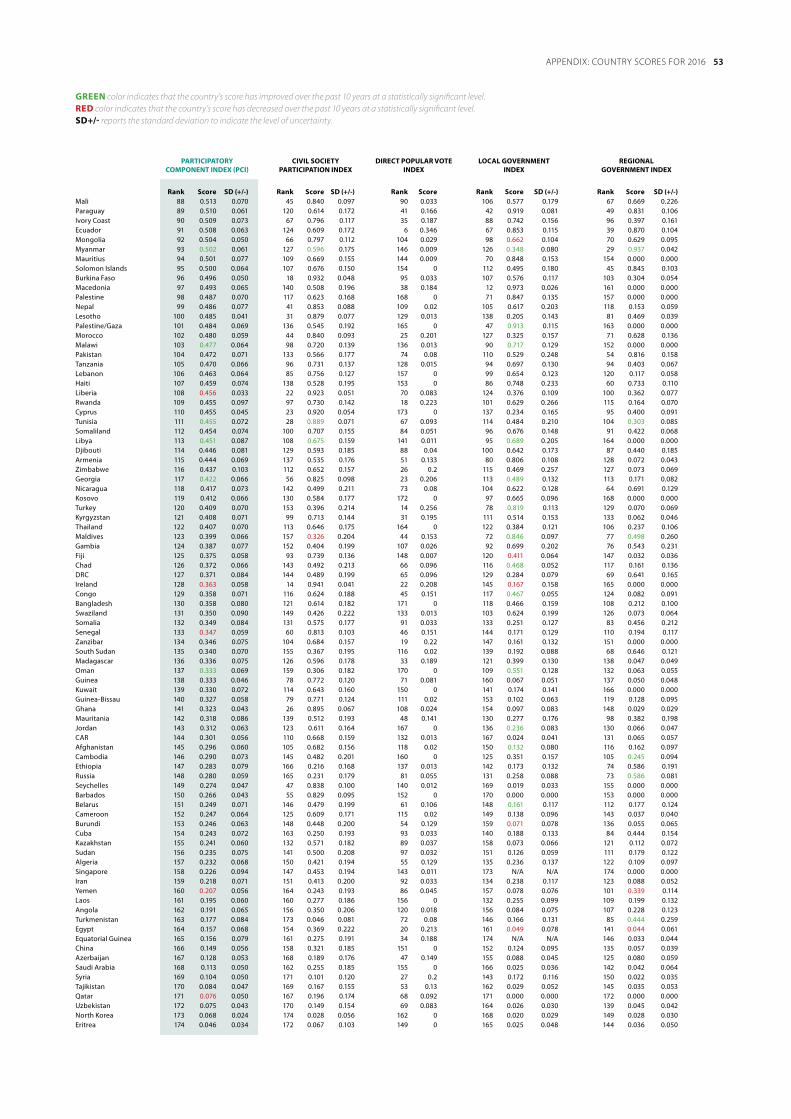
Rank Score SD (+/-) Rank Score SD (+/-) Rank Score Rank Score SD (+/-) Rank Score SD (+/-)Mali 88 0.513 0.070 45 0.840 0.097 90 0.033 106 0.577 0.179 67 0.669 0.226Paraguay 89 0.510 0.061 120 0.614 0.172 41 0.166 42 0.919 0.081 49 0.831 0.106Ivory Coast 90 0.509 0.073 67 0.796 0.117 35 0.187 88 0.742 0.156 96 0.397 0.161Ecuador 91 0.508 0.063 124 0.609 0.172 6 0.346 67 0.853 0.115 39 0.870 0.104Mongolia 92 0.504 0.050 66 0.797 0.112 104 0.029 98 0.662 0.104 70 0.629 0.095Myanmar 93 0.502 0.061 127 0.596 0.175 146 0.009 126 0.348 0.080 29 0.937 0.042Mauritius 94 0.501 0.077 109 0.669 0.155 144 0.009 70 0.848 0.153 154 0.000 0.000Solomon Islands 95 0.500 0.064 107 0.676 0.150 154 0 112 0.495 0.180 45 0.845 0.103Burkina Faso 96 0.496 0.050 18 0.932 0.048 95 0.033 107 0.576 0.117 103 0.304 0.054Macedonia 97 0.493 0.065 140 0.508 0.196 38 0.184 12 0.973 0.026 161 0.000 0.000Palestine 98 0.487 0.070 117 0.623 0.168 168 0 71 0.847 0.135 157 0.000 0.000Nepal 99 0.486 0.077 41 0.853 0.088 109 0.02 105 0.617 0.203 118 0.153 0.059Lesotho 100 0.485 0.041 31 0.879 0.077 129 0.013 138 0.205 0.143 81 0.469 0.039Palestine/Gaza 101 0.484 0.069 136 0.545 0.192 165 0 47 0.913 0.115 163 0.000 0.000Morocco 102 0.480 0.059 44 0.840 0.093 25 0.201 127 0.325 0.157 71 0.628 0.136Malawi 103 0.477 0.064 98 0.720 0.139 136 0.013 90 0.717 0.129 152 0.000 0.000Pakistan 104 0.472 0.071 133 0.566 0.177 74 0.08 110 0.529 0.248 54 0.816 0.158Tanzania 105 0.470 0.066 96 0.731 0.137 128 0.015 94 0.697 0.130 94 0.403 0.067Lebanon 106 0.463 0.064 85 0.756 0.127 157 0 99 0.654 0.123 120 0.117 0.058Haiti 107 0.459 0.074 138 0.528 0.195 153 0 86 0.748 0.233 60 0.733 0.110Liberia 108 0.456 0.033 22 0.923 0.051 70 0.083 124 0.376 0.109 100 0.362 0.077Rwanda 109 0.455 0.097 97 0.730 0.142 18 0.223 101 0.629 0.266 115 0.164 0.070Cyprus 110 0.455 0.045 23 0.920 0.054 173 0 137 0.234 0.165 95 0.400 0.091Tunisia 111 0.455 0.072 28 0.889 0.071 67 0.093 114 0.484 0.210 104 0.303 0.085Somaliland 112 0.454 0.074 100 0.707 0.155 84 0.051 96 0.676 0.148 91 0.422 0.068Libya 113 0.451 0.087 108 0.675 0.159 141 0.011 95 0.689 0.205 164 0.000 0.000Djibouti 114 0.446 0.081 129 0.593 0.185 88 0.04 100 0.642 0.173 87 0.440 0.185Armenia 115 0.444 0.069 137 0.535 0.176 51 0.133 80 0.806 0.108 128 0.072 0.043Zimbabwe 116 0.437 0.103 112 0.652 0.157 26 0.2 115 0.469 0.257 127 0.073 0.069Georgia 117 0.422 0.066 56 0.825 0.098 23 0.206 113 0.489 0.132 113 0.171 0.082Nicaragua 118 0.417 0.073 142 0.499 0.211 73 0.08 104 0.622 0.128 64 0.691 0.129Kosovo 119 0.412 0.066 130 0.584 0.177 172 0 97 0.665 0.096 168 0.000 0.000Turkey 120 0.409 0.070 153 0.396 0.214 14 0.256 78 0.819 0.113 129 0.070 0.069Kyrgyzstan 121 0.408 0.071 99 0.713 0.144 31 0.195 111 0.514 0.153 133 0.062 0.046Thailand 122 0.407 0.070 113 0.646 0.175 164 0 122 0.384 0.121 106 0.237 0.106Maldives 123 0.399 0.066 157 0.326 0.204 44 0.153 72 0.846 0.097 77 0.498 0.260Gambia 124 0.387 0.077 152 0.404 0.199 107 0.026 92 0.699 0.202 76 0.543 0.231Fiji 125 0.375 0.058 93 0.739 0.136 148 0.007 120 0.411 0.064 147 0.032 0.036Chad 126 0.372 0.066 143 0.492 0.213 66 0.096 116 0.468 0.052 117 0.161 0.136DRC 127 0.371 0.084 144 0.489 0.199 65 0.096 129 0.284 0.079 69 0.641 0.165Ireland 128 0.363 0.058 14 0.941 0.041 22 0.208 145 0.167 0.158 165 0.000 0.000Congo 129 0.358 0.071 116 0.624 0.188 45 0.151 117 0.467 0.055 124 0.082 0.091Bangladesh 130 0.358 0.080 121 0.614 0.182 171 0 118 0.466 0.159 108 0.212 0.100Swaziland 131 0.350 0.090 149 0.426 0.222 133 0.013 103 0.624 0.199 126 0.073 0.064Somalia 132 0.349 0.084 131 0.575 0.177 91 0.033 133 0.251 0.127 83 0.456 0.212Senegal 133 0.347 0.059 60 0.813 0.103 46 0.151 144 0.171 0.129 110 0.194 0.117Zanzibar 134 0.346 0.075 104 0.684 0.157 19 0.22 147 0.161 0.132 151 0.000 0.000South Sudan 135 0.340 0.070 155 0.367 0.195 116 0.02 139 0.192 0.088 68 0.646 0.121Madagascar 136 0.336 0.075 126 0.596 0.178 33 0.189 121 0.399 0.130 138 0.047 0.049Oman 137 0.333 0.069 159 0.306 0.182 170 0 109 0.551 0.128 132 0.063 0.055Guinea 138 0.333 0.046 78 0.772 0.120 71 0.081 160 0.067 0.051 137 0.050 0.048Kuwait 139 0.330 0.072 114 0.643 0.160 150 0 141 0.174 0.141 166 0.000 0.000Guinea-Bissau 140 0.327 0.058 79 0.771 0.124 111 0.02 153 0.102 0.063 119 0.128 0.095Ghana 141 0.323 0.043 26 0.895 0.067 108 0.024 154 0.097 0.083 148 0.029 0.029Mauritania 142 0.318 0.086 139 0.512 0.193 48 0.141 130 0.277 0.176 98 0.382 0.198Jordan 143 0.312 0.063 123 0.611 0.164 167 0 136 0.236 0.083 130 0.066 0.047CAR 144 0.301 0.056 110 0.668 0.159 132 0.013 167 0.024 0.041 131 0.065 0.057Afghanistan 145 0.296 0.060 105 0.682 0.156 118 0.02 150 0.132 0.080 116 0.162 0.097Cambodia 146 0.290 0.073 145 0.482 0.201 160 0 125 0.351 0.157 105 0.245 0.094Ethiopia 147 0.283 0.079 166 0.216 0.168 137 0.013 142 0.173 0.132 74 0.586 0.191Russia 148 0.280 0.059 165 0.231 0.179 81 0.055 131 0.258 0.088 73 0.586 0.081Seychelles 149 0.274 0.047 47 0.838 0.100 140 0.012 169 0.019 0.033 155 0.000 0.000Barbados 150 0.266 0.043 55 0.829 0.095 152 0 170 0.000 0.000 153 0.000 0.000Belarus 151 0.249 0.071 146 0.479 0.199 61 0.106 148 0.161 0.117 112 0.177 0.124Cameroon 152 0.247 0.064 125 0.609 0.171 115 0.02 149 0.138 0.096 143 0.037 0.040Burundi 153 0.246 0.063 148 0.448 0.200 54 0.129 159 0.071 0.078 136 0.055 0.065Cuba 154 0.243 0.072 163 0.250 0.193 93 0.033 140 0.188 0.133 84 0.444 0.154Kazakhstan 155 0.241 0.060 132 0.571 0.182 89 0.037 158 0.073 0.066 121 0.112 0.072Sudan 156 0.235 0.075 141 0.500 0.208 97 0.032 151 0.126 0.059 111 0.179 0.122Algeria 157 0.232 0.068 150 0.421 0.194 55 0.129 135 0.236 0.137 122 0.109 0.097Singapore 158 0.226 0.094 147 0.453 0.194 143 0.011 173 N/A N/A 174 0.000 0.000Iran 159 0.218 0.071 151 0.413 0.200 92 0.033 134 0.238 0.117 123 0.088 0.052Yemen 160 0.207 0.056 164 0.243 0.193 86 0.045 157 0.078 0.076 101 0.339 0.114Laos 161 0.195 0.060 160 0.277 0.186 156 0 132 0.255 0.099 109 0.199 0.132Angola 162 0.191 0.065 156 0.350 0.206 120 0.018 156 0.084 0.075 107 0.228 0.123Turkmenistan 163 0.177 0.084 173 0.046 0.081 72 0.08 146 0.166 0.131 85 0.444 0.259Egypt 164 0.157 0.068 154 0.369 0.222 20 0.213 161 0.049 0.078 141 0.044 0.061Equatorial Guinea 165 0.156 0.079 161 0.275 0.191 34 0.188 174 N/A N/A 146 0.033 0.044China 166 0.149 0.056 158 0.321 0.185 151 0 152 0.124 0.095 135 0.057 0.039Azerbaijan 167 0.128 0.053 168 0.189 0.176 47 0.149 155 0.088 0.045 125 0.080 0.059Saudi Arabia 168 0.113 0.050 162 0.255 0.185 155 0 166 0.025 0.036 142 0.042 0.064Syria 169 0.104 0.050 171 0.101 0.120 27 0.2 143 0.172 0.116 150 0.022 0.035Tajikistan 170 0.084 0.047 169 0.167 0.155 53 0.13 162 0.029 0.052 145 0.035 0.053Qatar 171 0.076 0.050 167 0.196 0.174 68 0.092 171 0.000 0.000 172 0.000 0.000Uzbekistan 172 0.075 0.043 170 0.149 0.154 69 0.083 164 0.026 0.030 139 0.045 0.042North Korea 173 0.068 0.024 174 0.028 0.056 162 0 168 0.020 0.029 149 0.028 0.030Eritrea 174 0.046 0.034 172 0.067 0.103 149 0 165 0.025 0.048 144 0.036 0.050
APPENDIx: COUNTRY SCORES FOR 2016
gReen color indicates that the country’s score has improved over the past 10 years at a statistically significant level. ReD color indicates that the country’s score has decreased over the past 10 years at a statistically significant level. SD+/- reports the standard deviation to indicate the level of uncertainty.
pARtICIpAtoRy Component InDex (pCI)
CIVIl SoCIety pARtICIpAtIon InDex
DIReCt populAR Vote InDex
loCAl goVeRnment InDex
RegIonAl goVeRnment InDex
53

APPENDIx: COUNTRY SCORES FOR 2016
table 6: Country Scores for the Deliberative Component Index (DCI) and its Components
Rank Score SD (+/-) Rank Score SD (+/-) Rank Score SD (+/-) Rank Score SD (+/-) Rank Score SD (+/-) Rank Score SD (+/-)Norway 1 0.989 0.008 4 2.853 0.146 12 3.753 0.247 1 4.521 0.443 1 4.887 0.113 6 4.453 0.315Switzerland 2 0.986 0.009 2 2.878 0.122 52 3.300 0.381 14 3.617 0.443 2 4.825 0.172 1 4.844 0.156Sweden 3 0.983 0.011 1 2.914 0.085 1 3.901 0.099 11 3.703 0.395 3 4.750 0.245 7 4.447 0.458Denmark 4 0.974 0.016 9 2.674 0.319 4 3.852 0.148 3 3.943 0.500 12 4.382 0.426 2 4.690 0.302Germany 5 0.970 0.017 6 2.806 0.194 46 3.384 0.310 2 3.979 0.419 4 4.667 0.287 14 4.215 0.363Canada 6 0.959 0.024 10 2.658 0.286 8 3.797 0.203 33 3.306 0.559 8 4.511 0.352 8 4.406 0.393Japan 7 0.945 0.030 3 2.869 0.130 56 3.277 0.313 16 3.608 0.329 15 4.295 0.432 44 3.639 0.422Estonia 8 0.945 0.031 25 2.384 0.412 9 3.785 0.214 19 3.579 0.454 21 4.068 0.397 11 4.326 0.410Costa Rica 9 0.942 0.029 17 2.451 0.357 3 3.858 0.142 4 3.930 0.426 19 4.117 0.288 22 4.036 0.435Belgium 10 0.937 0.031 7 2.758 0.235 36 3.498 0.388 36 3.277 0.369 6 4.535 0.379 38 3.743 0.400Tunisia 11 0.935 0.034 37 2.263 0.322 30 3.570 0.394 44 3.139 0.403 13 4.380 0.510 9 4.363 0.490Uruguay 12 0.935 0.037 50 2.118 0.357 29 3.571 0.414 20 3.504 0.541 7 4.526 0.408 17 4.092 0.555France 13 0.932 0.035 11 2.633 0.367 25 3.599 0.354 13 3.658 0.210 25 3.916 0.509 18 4.073 0.560Slovenia 14 0.932 0.036 47 2.181 0.287 21 3.676 0.282 18 3.588 0.380 32 3.829 0.451 4 4.478 0.388Australia 15 0.930 0.036 15 2.564 0.361 45 3.387 0.322 17 3.591 0.453 14 4.340 0.452 32 3.823 0.463Benin 16 0.928 0.038 45 2.196 0.260 2 3.900 0.100 12 3.662 0.463 27 3.876 0.489 23 4.030 0.391Romania 17 0.927 0.039 8 2.684 0.308 14 3.738 0.262 48 3.042 0.438 10 4.400 0.483 58 3.468 0.434Netherlands 18 0.925 0.040 70 1.914 0.283 58 3.268 0.363 10 3.712 0.447 5 4.596 0.400 28 3.932 0.557Chile 19 0.921 0.038 12 2.618 0.293 49 3.370 0.316 26 3.425 0.442 20 4.104 0.401 26 3.976 0.407Greece 20 0.916 0.046 42 2.214 0.550 6 3.811 0.189 27 3.413 0.569 44 3.610 0.537 5 4.455 0.508Burkina Faso 21 0.914 0.045 77 1.841 0.256 10 3.773 0.227 30 3.369 0.480 63 3.223 0.476 3 4.600 0.392Trinidad & Tobago 22 0.912 0.045 5 2.817 0.180 48 3.370 0.375 34 3.292 0.430 59 3.335 0.650 25 3.987 0.450Austria 23 0.911 0.046 20 2.423 0.381 40 3.474 0.514 56 2.920 0.541 11 4.389 0.506 37 3.746 0.782Italy 24 0.911 0.043 23 2.399 0.337 77 3.124 0.294 5 3.928 0.490 30 3.851 0.494 33 3.763 0.520Spain 25 0.911 0.044 34 2.319 0.337 15 3.737 0.247 41 3.190 0.602 41 3.653 0.443 12 4.265 0.442Taiwan 26 0.910 0.047 13 2.602 0.311 84 2.995 0.444 15 3.615 0.500 40 3.668 0.499 34 3.755 0.436Indonesia 27 0.901 0.047 51 2.110 0.213 62 3.242 0.377 21 3.499 0.408 29 3.858 0.568 16 4.145 0.613Lithuania 28 0.899 0.049 33 2.334 0.334 5 3.850 0.150 32 3.321 0.443 9 4.421 0.354 94 2.845 0.298Ireland 29 0.894 0.051 21 2.414 0.356 123 2.554 0.277 83 2.491 0.417 16 4.228 0.510 24 3.989 0.557Cape Verde 30 0.890 0.057 28 2.348 0.370 7 3.808 0.192 22 3.498 0.492 34 3.798 0.552 64 3.319 0.581Finland 31 0.889 0.056 36 2.272 0.431 100 2.828 0.643 37 3.269 0.616 24 3.935 0.608 19 4.064 0.592Portugal 32 0.887 0.051 48 2.154 0.349 11 3.764 0.236 31 3.344 0.296 18 4.150 0.394 73 3.215 0.344Latvia 33 0.881 0.054 16 2.555 0.332 33 3.519 0.379 66 2.750 0.359 31 3.848 0.426 57 3.481 0.485Kyrgyzstan 34 0.874 0.060 22 2.413 0.314 35 3.498 0.375 52 2.989 0.417 42 3.626 0.496 51 3.588 0.506Mauritius 35 0.870 0.061 44 2.205 0.372 150 1.699 0.573 24 3.478 0.448 35 3.792 0.475 35 3.752 0.645Mongolia 36 0.869 0.057 81 1.812 0.217 44 3.415 0.387 6 3.888 0.409 62 3.241 0.407 27 3.951 0.392Israel 37 0.868 0.062 54 2.056 0.328 13 3.742 0.258 58 2.886 0.488 50 3.431 0.585 39 3.686 0.450United States 38 0.863 0.059 61 2.014 0.187 32 3.559 0.377 72 2.638 0.312 39 3.690 0.396 31 3.848 0.359Bulgaria 39 0.863 0.064 91 1.678 0.160 79 3.091 0.376 47 3.073 0.448 17 4.220 0.445 43 3.650 0.426Senegal 40 0.862 0.063 66 1.969 0.239 27 3.593 0.395 38 3.254 0.559 49 3.466 0.487 29 3.931 0.401South Africa 41 0.859 0.066 14 2.577 0.355 80 3.058 0.313 60 2.842 0.584 37 3.739 0.497 67 3.282 0.452United Kingdom 42 0.857 0.065 46 2.189 0.270 55 3.278 0.373 65 2.791 0.527 36 3.777 0.539 50 3.588 0.466Afghanistan 43 0.852 0.069 56 2.036 0.373 22 3.648 0.351 45 3.134 0.420 45 3.608 0.663 68 3.281 0.410Barbados 44 0.848 0.070 35 2.290 0.313 86 2.954 0.359 68 2.712 0.467 26 3.915 0.613 75 3.205 0.349Georgia 45 0.847 0.068 32 2.336 0.303 57 3.269 0.269 28 3.413 0.380 90 2.676 0.438 42 3.657 0.509Suriname 46 0.847 0.069 110 1.453 0.365 88 2.952 0.323 70 2.690 0.386 43 3.611 0.486 15 4.215 0.556Dominican Rep. 47 0.846 0.072 31 2.337 0.389 47 3.384 0.597 98 2.238 0.502 57 3.371 0.412 36 3.751 0.432Togo 48 0.845 0.067 18 2.446 0.255 70 3.193 0.342 8 3.746 0.508 64 3.218 0.404 106 2.677 0.495Liberia 49 0.842 0.072 43 2.212 0.408 93 2.883 0.760 54 2.931 0.644 72 3.054 0.677 45 3.633 0.436Cyprus 50 0.841 0.074 26 2.378 0.350 126 2.506 0.734 53 2.961 0.702 33 3.816 0.583 77 3.137 0.658Vanuatu 51 0.839 0.071 105 1.508 0.328 117 2.606 0.449 55 2.931 0.512 38 3.734 0.507 21 4.044 0.583Mali 52 0.838 0.072 78 1.832 0.322 118 2.578 0.498 84 2.466 0.382 58 3.363 0.377 10 4.356 0.463Singapore 53 0.835 0.071 24 2.388 0.333 17 3.706 0.293 99 2.226 0.325 23 3.981 0.472 93 2.872 0.477Lebanon 54 0.833 0.073 69 1.923 0.338 73 3.174 0.568 46 3.122 0.548 61 3.255 0.717 53 3.562 0.515Panama 55 0.832 0.076 53 2.087 0.588 95 2.871 0.433 59 2.873 0.614 60 3.327 0.575 30 3.861 0.813Colombia 56 0.830 0.073 67 1.967 0.321 129 2.416 0.553 39 3.245 0.505 47 3.508 0.462 60 3.395 0.454Morocco 57 0.822 0.074 19 2.427 0.373 19 3.679 0.313 78 2.589 0.410 98 2.566 0.248 47 3.613 0.396Jamaica 58 0.821 0.080 40 2.250 0.392 60 3.259 0.469 7 3.777 0.500 83 2.837 0.464 90 2.902 0.484Philippines 59 0.814 0.081 72 1.902 0.381 26 3.596 0.403 75 2.618 0.494 52 3.411 0.674 69 3.255 0.626Ghana 60 0.813 0.076 87 1.705 0.214 51 3.333 0.354 114 1.986 0.316 22 4.061 0.382 52 3.564 0.292New Zealand 61 0.812 0.081 68 1.947 0.356 85 2.958 0.500 63 2.822 0.533 67 3.167 0.614 46 3.615 0.672Niger 62 0.811 0.081 128 1.283 0.196 34 3.512 0.471 67 2.718 0.436 76 3.021 0.679 13 4.253 0.446Czech Republic 63 0.810 0.080 59 2.022 0.212 39 3.474 0.416 62 2.830 0.397 54 3.395 0.451 74 3.209 0.315Ukraine 64 0.807 0.090 100 1.541 0.424 24 3.611 0.386 103 2.143 0.427 55 3.391 0.817 20 4.052 0.591Nigeria 65 0.798 0.077 55 2.055 0.284 87 2.953 0.262 43 3.153 0.333 78 2.879 0.322 79 3.117 0.326Mexico 66 0.797 0.078 98 1.547 0.206 53 3.290 0.342 23 3.493 0.380 56 3.388 0.457 88 2.985 0.369Botswana 67 0.793 0.082 64 2.005 0.224 64 3.229 0.330 50 2.994 0.471 46 3.561 0.454 107 2.676 0.300Seychelles 68 0.792 0.086 65 1.982 0.259 69 3.204 0.376 40 3.209 0.359 73 3.046 0.593 86 2.999 0.530Honduras 69 0.790 0.093 57 2.032 0.538 112 2.638 0.845 25 3.470 0.607 85 2.777 0.549 66 3.298 0.604Lesotho 70 0.783 0.089 29 2.347 0.345 67 3.224 0.604 88 2.435 0.775 81 2.870 0.471 72 3.225 0.510Gabon 71 0.782 0.089 27 2.358 0.306 75 3.152 0.513 109 2.033 0.502 69 3.071 0.561 71 3.239 0.360Bhutan 72 0.780 0.090 41 2.218 0.273 72 3.180 0.461 49 3.017 0.716 79 2.878 0.514 100 2.753 0.385Sri Lanka 73 0.769 0.091 38 2.255 0.346 74 3.164 0.368 79 2.565 0.435 89 2.684 0.429 87 2.998 0.404Ivory Coast 74 0.767 0.090 73 1.899 0.354 54 3.285 0.394 105 2.114 0.372 68 3.162 0.447 59 3.414 0.411São Tomé & Príncipe 75 0.766 0.093 75 1.885 0.248 108 2.712 0.234 76 2.608 0.304 74 3.039 0.379 54 3.516 0.498India 76 0.760 0.100 30 2.343 0.276 63 3.233 0.463 81 2.552 0.607 71 3.056 0.650 118 2.392 0.503Peru 77 0.758 0.097 63 2.006 0.323 41 3.456 0.491 82 2.493 0.468 104 2.480 0.608 63 3.322 0.403Sierra Leone 78 0.756 0.094 62 2.011 0.322 151 1.684 0.359 42 3.181 0.418 91 2.657 0.460 70 3.240 0.448Argentina 79 0.752 0.101 84 1.750 0.454 104 2.777 0.585 51 2.991 0.591 80 2.875 0.565 84 3.064 0.484Montenegro 80 0.748 0.094 49 2.122 0.354 127 2.487 0.295 69 2.705 0.351 96 2.608 0.421 76 3.185 0.360South Korea 81 0.743 0.097 107 1.469 0.247 28 3.580 0.354 57 2.895 0.484 120 1.995 0.528 40 3.676 0.439Libya 82 0.738 0.095 76 1.851 0.319 115 2.626 0.330 86 2.453 0.411 48 3.474 0.534 103 2.706 0.326Namibia 83 0.728 0.097 60 2.016 0.239 81 3.050 0.380 95 2.279 0.233 70 3.060 0.437 108 2.672 0.373Bolivia 84 0.726 0.098 93 1.645 0.206 23 3.641 0.345 126 1.814 0.265 105 2.411 0.468 41 3.662 0.430Malawi 85 0.720 0.100 121 1.367 0.195 65 3.226 0.365 94 2.285 0.437 53 3.400 0.492 82 3.072 0.561Iceland 86 0.717 0.104 39 2.252 0.474 91 2.939 0.783 107 2.088 0.464 106 2.410 0.605 81 3.094 0.545El Salvador 87 0.716 0.094 108 1.456 0.164 138 2.267 0.322 71 2.645 0.408 28 3.869 0.469 120 2.318 0.293Kosovo 88 0.713 0.110 99 1.541 0.514 82 3.044 0.565 106 2.104 0.479 65 3.216 0.531 85 3.013 0.495
DelIbeRAtIVe Component InDex (DCI)
ReASoneD JuStIfICAtIon
Common gooD JuStIfICAtIon
ReSpeCt foR CounteRARgumentS
RAnge of ConSultAtIon
engAgeD SoCIety
54

APPENDIx: COUNTRY SCORES FOR 2016
Rank Score SD (+/-) Rank Score SD (+/-) Rank Score SD (+/-) Rank Score SD (+/-) Rank Score SD (+/-) Rank Score SD (+/-)Kenya 89 0.710 0.102 90 1.682 0.277 92 2.889 0.329 35 3.283 0.580 103 2.493 0.474 110 2.620 0.378Serbia 90 0.693 0.118 129 1.281 0.461 20 3.679 0.320 116 1.938 0.456 113 2.170 0.623 55 3.514 0.616Myanmar 91 0.692 0.110 96 1.590 0.229 78 3.111 0.696 29 3.380 0.533 121 1.983 0.332 99 2.768 0.360Congo 92 0.686 0.115 79 1.831 0.369 99 2.833 0.860 77 2.601 0.552 109 2.338 0.519 112 2.574 0.767Kuwait 93 0.679 0.108 74 1.896 0.233 42 3.455 0.316 115 1.954 0.306 130 1.699 0.333 61 3.372 0.350Pakistan 94 0.677 0.119 149 0.980 0.236 155 1.559 0.557 64 2.799 0.421 82 2.842 0.645 49 3.594 0.549Croatia 95 0.676 0.114 95 1.593 0.331 121 2.556 0.534 136 1.551 0.413 101 2.506 0.556 48 3.598 0.497East Timor 96 0.666 0.105 115 1.408 0.256 97 2.850 0.349 74 2.622 0.317 97 2.584 0.610 91 2.884 0.318CAR 97 0.662 0.121 134 1.201 0.262 122 2.556 0.678 112 2.012 0.498 75 3.036 0.666 83 3.069 0.577Uganda 98 0.660 0.109 86 1.722 0.171 101 2.794 0.447 89 2.418 0.344 102 2.503 0.319 105 2.686 0.319Guatemala 99 0.659 0.110 112 1.421 0.254 134 2.371 0.411 91 2.356 0.448 95 2.638 0.414 92 2.875 0.314Mauritania 100 0.654 0.134 118 1.384 0.369 83 3.029 0.565 102 2.161 0.573 100 2.506 0.772 80 3.102 0.546Vietnam 101 0.651 0.119 92 1.669 0.327 105 2.759 0.290 96 2.273 0.489 93 2.643 0.517 116 2.437 0.591Malaysia 102 0.647 0.117 104 1.513 0.317 145 1.914 0.540 61 2.840 0.445 51 3.413 0.508 133 1.817 0.385Nepal 103 0.645 0.123 97 1.548 0.238 141 2.090 0.543 100 2.180 0.462 84 2.792 0.577 101 2.739 0.556Comoros 104 0.636 0.120 142 1.146 0.248 137 2.308 0.338 9 3.732 0.512 136 1.579 0.398 96 2.808 0.460Slovakia 105 0.632 0.112 116 1.405 0.190 143 2.081 0.356 101 2.163 0.383 86 2.732 0.412 89 2.962 0.438Poland 106 0.631 0.116 89 1.686 0.207 76 3.124 0.319 145 1.281 0.392 115 2.133 0.377 62 3.360 0.415Mozambique 107 0.627 0.116 94 1.634 0.307 61 3.251 0.532 104 2.135 0.373 108 2.370 0.482 119 2.375 0.312Brazil 108 0.623 0.120 109 1.456 0.246 114 2.627 0.418 92 2.344 0.426 107 2.381 0.562 109 2.666 0.604Armenia 109 0.615 0.123 123 1.336 0.335 50 3.339 0.308 123 1.838 0.299 139 1.545 0.336 56 3.513 0.438Jordan 110 0.614 0.119 120 1.374 0.257 120 2.568 0.422 80 2.553 0.362 124 1.894 0.450 97 2.798 0.319Algeria 111 0.613 0.120 83 1.792 0.340 128 2.448 0.313 139 1.415 0.366 88 2.686 0.352 111 2.606 0.301China 112 0.607 0.134 58 2.024 0.269 16 3.720 0.270 162 0.760 0.306 87 2.704 0.535 124 2.129 0.434Solomon Islands 113 0.604 0.123 127 1.286 0.300 144 2.026 0.604 90 2.406 0.344 111 2.283 0.408 95 2.808 0.372Zambia 114 0.582 0.120 71 1.912 0.290 125 2.520 0.343 124 1.819 0.279 126 1.853 0.338 117 2.406 0.390Guinea 115 0.581 0.139 102 1.527 0.292 154 1.560 0.624 97 2.261 0.693 66 3.207 0.676 132 1.845 0.430Bosnia & Herzeg. 116 0.571 0.133 141 1.157 0.341 164 0.989 0.428 85 2.457 0.360 122 1.961 0.393 65 3.310 0.545Guyana 117 0.569 0.131 130 1.274 0.182 94 2.872 0.453 120 1.881 0.380 127 1.853 0.679 102 2.718 0.625Iraq 118 0.565 0.135 82 1.806 0.312 153 1.571 0.657 128 1.762 0.460 148 1.360 0.354 78 3.117 0.480Iran 119 0.549 0.134 80 1.830 0.502 106 2.741 0.640 117 1.914 0.649 118 2.019 0.506 135 1.795 0.360Ecuador 120 0.542 0.143 85 1.745 0.239 43 3.452 0.326 146 1.209 0.516 125 1.875 0.599 122 2.274 0.614Papua New Guinea 121 0.542 0.138 111 1.448 0.298 136 2.353 0.497 87 2.441 0.389 117 2.052 0.530 130 1.869 0.593Tanzania 122 0.535 0.133 140 1.166 0.240 116 2.624 0.361 93 2.327 0.385 110 2.290 0.536 131 1.853 0.554Rwanda 123 0.528 0.144 88 1.699 0.327 71 3.183 0.467 113 2.004 0.385 123 1.920 0.519 137 1.668 0.530Fiji 124 0.526 0.143 101 1.528 0.207 90 2.951 0.545 108 2.038 0.530 128 1.717 0.703 128 1.890 0.516Madagascar 125 0.520 0.132 114 1.412 0.309 89 2.951 0.334 141 1.383 0.406 99 2.544 0.469 126 1.947 0.505Maldives 126 0.518 0.125 119 1.382 0.206 66 3.226 0.486 135 1.560 0.369 137 1.571 0.479 121 2.309 0.427Somaliland 127 0.518 0.153 157 0.801 0.370 135 2.361 0.647 118 1.913 0.433 77 2.885 0.889 125 2.071 0.494Djibouti 128 0.509 0.141 126 1.297 0.198 132 2.379 0.877 137 1.510 0.532 116 2.065 0.700 114 2.459 0.429Paraguay 129 0.502 0.132 162 0.657 0.224 160 1.329 0.469 119 1.906 0.264 94 2.640 0.497 113 2.538 0.384Moldova 130 0.497 0.124 124 1.330 0.269 113 2.637 0.350 122 1.858 0.375 114 2.152 0.345 136 1.775 0.311Zanzibar 131 0.487 0.146 106 1.492 0.299 107 2.712 0.436 125 1.816 0.367 133 1.599 0.447 129 1.879 0.575Hungary 132 0.483 0.134 122 1.348 0.356 131 2.386 0.532 127 1.778 0.519 119 2.011 0.419 134 1.801 0.323Albania 133 0.476 0.146 132 1.249 0.263 146 1.887 0.358 111 2.030 0.559 150 1.323 0.419 123 2.247 0.650Macedonia 134 0.460 0.148 147 1.010 0.448 98 2.850 0.336 121 1.876 0.438 153 1.267 0.247 115 2.444 0.609Palestine 135 0.428 0.149 117 1.397 0.495 140 2.156 0.984 73 2.622 0.786 155 1.176 0.471 155 1.166 0.435Cuba 136 0.428 0.141 52 2.088 0.234 18 3.700 0.295 150 1.039 0.475 145 1.427 0.374 154 1.174 0.397Ethiopia 137 0.427 0.134 133 1.247 0.259 38 3.486 0.452 142 1.365 0.365 131 1.640 0.392 146 1.468 0.310DRC 138 0.409 0.158 135 1.194 0.491 139 2.266 0.484 131 1.648 0.723 112 2.282 0.660 158 1.037 0.388Nicaragua 139 0.395 0.136 113 1.416 0.288 110 2.668 0.387 144 1.301 0.459 144 1.436 0.459 139 1.630 0.454Cameroon 140 0.387 0.135 170 0.305 0.126 163 1.231 0.457 129 1.748 0.378 129 1.702 0.473 104 2.701 0.383Zimbabwe 141 0.380 0.132 148 0.985 0.212 96 2.859 0.334 151 1.022 0.311 92 2.651 0.434 145 1.468 0.449Bangladesh 142 0.372 0.137 156 0.818 0.265 148 1.848 0.293 130 1.711 0.397 135 1.588 0.254 143 1.522 0.407Swaziland 143 0.363 0.132 137 1.178 0.413 130 2.391 0.518 133 1.580 0.305 147 1.372 0.367 148 1.426 0.359Angola 144 0.360 0.123 150 0.949 0.227 111 2.646 0.455 132 1.610 0.200 140 1.513 0.306 152 1.247 0.373Cambodia 145 0.350 0.134 139 1.169 0.243 168 0.892 0.470 138 1.429 0.406 141 1.500 0.375 142 1.524 0.382Chad 146 0.349 0.132 143 1.132 0.304 166 0.958 0.393 134 1.566 0.262 142 1.490 0.368 147 1.457 0.434Russia 147 0.344 0.145 144 1.097 0.303 31 3.561 0.406 148 1.135 0.369 160 0.960 0.342 141 1.563 0.500Haiti 148 0.338 0.152 152 0.900 0.401 161 1.290 0.538 170 0.423 0.245 151 1.310 0.637 98 2.776 0.370Palestine/Gaza 149 0.334 0.138 103 1.526 0.183 59 3.260 0.591 110 2.032 0.570 171 0.408 0.202 151 1.257 0.431Equatorial Guinea 150 0.334 0.138 145 1.035 0.381 158 1.349 0.477 140 1.402 0.389 134 1.592 0.406 144 1.505 0.360Somalia 151 0.284 0.128 151 0.916 0.392 165 0.984 0.357 155 0.958 0.349 143 1.480 0.330 149 1.398 0.472Tajikistan 152 0.280 0.130 153 0.883 0.274 133 2.372 0.600 154 0.959 0.341 154 1.249 0.393 157 1.133 0.332Qatar 153 0.279 0.123 138 1.176 0.234 109 2.684 0.462 152 1.006 0.475 157 1.131 0.416 161 0.989 0.345Gambia 154 0.279 0.126 131 1.265 0.333 149 1.779 0.640 160 0.821 0.352 138 1.552 0.315 162 0.936 0.289Kazakhstan 155 0.276 0.113 158 0.798 0.317 147 1.872 0.570 149 1.075 0.409 163 0.888 0.318 138 1.667 0.261Egypt 156 0.273 0.140 125 1.325 0.354 103 2.780 0.704 158 0.875 0.449 164 0.881 0.349 160 1.000 0.342Uzbekistan 157 0.267 0.119 163 0.621 0.240 68 3.219 0.386 143 1.333 0.417 132 1.615 0.351 169 0.571 0.265Belarus 158 0.245 0.129 165 0.604 0.289 37 3.488 0.385 153 0.994 0.360 168 0.509 0.292 140 1.568 0.412Saudi Arabia 159 0.226 0.115 146 1.023 0.295 167 0.922 0.427 164 0.681 0.323 149 1.346 0.322 163 0.926 0.376Oman 160 0.222 0.106 160 0.718 0.250 157 1.430 0.532 163 0.722 0.382 159 1.024 0.278 150 1.261 0.337Guinea-Bissau 161 0.219 0.133 166 0.581 0.329 174 0.057 0.085 166 0.548 0.308 152 1.289 0.600 127 1.940 0.541Sudan 162 0.216 0.119 161 0.677 0.266 159 1.332 0.670 165 0.605 0.242 158 1.053 0.399 153 1.234 0.461Turkey 163 0.203 0.109 136 1.185 0.335 119 2.570 0.377 147 1.164 0.387 169 0.494 0.203 167 0.724 0.318Burundi 164 0.203 0.107 159 0.761 0.250 171 0.674 0.333 161 0.767 0.328 156 1.149 0.303 159 1.013 0.383Laos 165 0.201 0.122 167 0.566 0.247 102 2.781 0.313 168 0.499 0.237 146 1.413 0.415 166 0.724 0.343Eritrea 166 0.159 0.093 154 0.840 0.253 162 1.274 0.347 167 0.502 0.238 165 0.819 0.235 164 0.852 0.321South Sudan 167 0.141 0.095 171 0.238 0.112 170 0.715 0.279 157 0.887 0.262 161 0.953 0.301 165 0.833 0.262Thailand 168 0.135 0.099 155 0.833 0.251 142 2.090 0.884 156 0.896 0.280 166 0.693 0.233 173 0.301 0.142Venezuela 169 0.128 0.094 168 0.393 0.167 124 2.549 0.451 171 0.337 0.184 172 0.385 0.179 156 1.136 0.419Azerbaijan 170 0.094 0.078 164 0.615 0.297 172 0.442 0.191 159 0.862 0.377 170 0.477 0.230 172 0.367 0.165Syria 171 0.070 0.060 169 0.358 0.172 169 0.810 0.312 169 0.497 0.200 173 0.241 0.110 170 0.530 0.210Turkmenistan 172 0.064 0.062 172 0.220 0.110 156 1.485 0.401 173 0.108 0.093 167 0.585 0.249 168 0.617 0.244Yemen 173 0.056 0.066 173 0.170 0.119 173 0.150 0.144 172 0.223 0.168 162 0.894 0.392 171 0.377 0.203North Korea 174 0.019 0.026 174 0.141 0.086 152 1.584 0.516 174 0.047 0.047 174 0.130 0.079 174 0.103 0.074
DelIbeRAtIVe Component InDex (DCI)
ReASoneD JuStIfICAtIon
Common gooD JuStIfICAtIon
ReSpeCt foR CounteRARgumentS
RAnge of ConSultAtIon
engAgeD SoCIety
gReen color indicates that the country’s score has improved over the past 10 years at a statistically significant level. ReD color indicates that the country’s score has decreased over the past 10 years at a statistically significant level. SD+/- reports the standard deviation to indicate the level of uncertainty.
55

References
Altman, David. 2016. “The Potential of Direct Democracy: A Global
Measure (1990-2014).” Social Indicators Research, 1-21.
Bermeo, Nancy. 2016. “On Democratic Backsliding.” Journal of De-
mocracy, 27(1): 5-19.
Bureau of Democracy, Human Rights and Labor. 2016. Macedonian
2016 Human Rights Report. Available at: https://www.state.gov/docu-
ments/organization/265658.pdf. [2017-04-26]
Buxton, Charles and Evgenia Konovalova. 2012. “Russian Civil Soci-
ety: History, Today, and Future Prospects.” INTRAC: Briefing Paper 37.
Carothers, Thomas, and Richard Youngs. 2017. “Democracy Is Not Dy-
ing: Seeing Through the Doom and Gloom.” Foreign Affairs.April 2017.
Choi, Jin-Wook. 2006. “Deliberative Democracy, Rational Participa-
tion and e-Voting in South Korea.” Asian Journal of Political Science,
14 (1):64-81.
Coppedge, Michael, John Gerring, Staffan I. Lindberg, Svend-Erik
Skaaning, and Jan Teorell. 2017. “V-Dem Comparisons and Contrasts
with Other Measurement Projects.” University of Gothenburg, Varie-
ties of Democracy Institute: Working Paper No. 45. April 2017. Avail-
able at: https://www.v-dem.net/en/news-publications/working-pa-
pers/
V-Dem CoDebooK V7
Coppedge, Michael, John Gerring, Staffan I. Lindberg, Svend-Erik
Skaaning, Jan Teorell, David Altman, Michael Bernhard, M. Steven
Fish, Adam Glynn, Allen Hicken, Carl Henrik Knutsen, Joshua Krusell,
Anna Lührmann, Kyle L. Marquardt, Kelly McMann, Valeriya Mechko-
va, Moa Olin, Pamela Paxton, Daniel Pemstein, Josefine Pernes, Con-
stanza Sanhueza Petrarca, Johannes von Römer, Laura Saxer, Brigitte
Seim, Rachel Sigman, Jeffrey Staton, Natalia Stepanova, and Steven
Wilson. 2017. “V-Dem Codebook V7.” Varieties of Democracy (V-Dem)
Project.
V-Dem DAtA Set V7
Coppedge, Michael, John Gerring, Staffan I. Lindberg, Svend-Erik
Skaaning, Jan Teorell, David Altman, Michael Bernhard, M. Steven
Fish, Adam Glynn, Allen Hicken, Carl Henrik Knutsen, Joshua Krusell,
Anna Lührmann, Kyle L. Marquardt, Kelly McMann, Valeriya Mechko-
va, Moa Olin, Pamela Paxton, Daniel Pemstein, Josefine Pernes, Con-
stanza Sanhueza Petrarca, Johannes von Römer, Laura Saxer, Brigitte
Seim, Rachel Sigman, Jeffrey Staton, Natalia Stepanova, and Steven
Wilson. 2017. “V-Dem [Country-Year/Country-Date] Dataset V7.” Vari-
eties of Democracy (V-Dem) Project.
V-Dem methoDology DoCument V7
Skaaning, Svend-Erik, Jan Teorell, Joshua Krusell, Kyle L. Marquardt,
Valeriya Mechkova, Daniel Pemstein, Josefine Pernes, Laura Saxer,
Natalia Stepanova, Eitan Tzelgov, Yi-ting Wang, and Steven Wilson.
2017. “V-Dem Methodology V7.” Varieties of Democracy (V-Dem)
Project.
this publication mainly builds on the following Key References
Additional References
56

APPENDIx: REFERENCES
Coppedge, Michael, Staffan I. Lindberg, Jan Teorell, and Svend-Erik
Skaaning. 2016. “Measuring High Level Democratic Principles Using
V-Dem Data.” International Political Science Review, 37 (5): 580-593.
Council of Europe. 2013. Local Democracy in Ireland. Available at: htt-
ps://wcd.coe.int/ViewDoc.jsp?p=&id=2113703&direct=true [Down-
loaded: 2017-04-27]
Dahl, Robert. 1971. Polyarchy: Participation and Opposition. New Ha-
ven: Yale University Press.”
Dahl, Robert. 1989. Democracy and Its Critics. New Haven, CT: Yale
University Press.
Diamond, Larry. 2015. “Facing up to the Democratic Recession.” Jour-
nal of Democracy, 26 (1): 141-155.
Erdmann, Gero. 2011. “Decline of Democracy.” Comparative Govern-
ance and Politics, 1: 21-58.
Foa, Roberto and Yousha Mounk. 2017. “The Signs of Deconsolida-
tion.” Journal of Democracy 28(1): 5-15.
McMann, Kelly M. 2017. “Measuring Subnational Democracy: Toward
Improved Regime Typologies and Theories of Regime Change.” De-
mocratization.
Levitsky, Steven and Lucan Way. 2015. “The Myth of Democratic Re-
cession.” Journal of Democracy, 26(1): 45–58.
Mechkova, Valeriya, Anna Lührmann, and Staffan I. Lindberg. 2017.
“From de-jure to de-facto: Mapping Dimensions and Sequences of
Accountability.” Background Paper: Governance and the Law. World
Bank: World Development Report 2017.
Merkel, Wolfgang. 2010. “Are Dictatorships Returning? Revisiting the
‘Democratic Rollback’ Hypothesis.” Contemporary Politics 16 (1): 17-31.
Norris, Pippa. 2017. “Is Western Democracy Backsliding? Diagnosing
the Risks.” Journal of Democracy. Online Exchange on “Democratic
Deconsolidation.”
Parthasarathy, Ramya and Rao Vijayendra. 2017. “Deliberative De-
mocracy in India.” Policy Research: Working Paper No. WPS 7995.
Washington, D.C.: World Bank Group.
Pemstein, Daniel, Kyle L. Marquardt, Eitan Tzelgov, Yi-ting Wang,
and Farhad Miri. 2017. “The V-Dem Measurement Model: Latent Vari-
able Analysis for Cross-National and Cross- Temporal Expert-Coded
Data.” University of Gothenburg, Varieties of Democracy Institute:
Working Paper (WP), No. 21, 2nd edition. April 2017. Available at: htt-
ps://www.v-dem.net/en/news-publications/working-papers/
Politecnico di Milano: Studio Calibro, 2017. Raw Graphs. Available at:
http://rawgraphs.io [Downloaded: 2017-04-20]
Sigman, Rachel, and Staffan I. Lindberg. 2015. “The Index of Egalitari-
an Democracy and Its Components: V-Dem’s Conceptualization and
Measurement.” University of Gothenburg, Varieties of Democracy In-
stitute: Working Paper No. 22. December 2015. Available at: https://
www.v-dem.net/en/news-publications/working-papers/
Sigman, Rachel,and Staffan I. Lindberg. 2017. “Democracy for All:
Conceptualizing and Measuring Egalitarian Democracy.” Forthcom-
ing in Political Science Research and Methods.
Sundström, Aksel, Pamela Paxton, Yi-ting Wang, and Staffan I. Lind-
berg. 2017. ”Women’s Political Empowerment: A New Global Index,
1900-2012.” World Development 94:321-335.
Quinlivan, Aodh. 2014. “We Have Casually Removed a Level of Local
Democracy. “ The Irish Times, May 7th 2014.
The World Bank. 2016. “New Country Classifications by Income Lev-
el”. Available at: https://blogs.worldbank.org/opendata/new-coun-
try-classifications-2016 [Downloaded: 2017-04-20]
The World Bank.2017. “Population Total.” Available at: http://data.
worldbank.org/indicator/SP.POP.TOTL [Downloaded: 2017-04-20]
Wang, Yi-Ting, Patrik Lindenfors, Aksel Sundström, Fredrik Jansson,
Pamel Paxton and Staffan I. Lindberg. 2017. “Women’s Rights in Dem-
ocratic Transition: A Global Sequence Analysis, 1900-1912.” European
Journal of Political Research. Online first.
57
58

59

Department of Political Science University of GothenburgSprängkullsgatan 19, PO 711SE 405 30 Gothenburg [email protected] +46 (0) 31 786 30 43 www.v-dem.netwww.facebook.com/vdeminstitutewww.twitter.com/vdeminstitute
I N S T I T U T E
Global Standards, Local Knowledge