democratization and electrification in post-apartheid south africa
TRANSCRIPT
A Better Life for All?
Democratization and Electrification in Post-Apartheid South Africa
Verena Kroth*, Valentino Larcinese†, and Joachim Wehner‡
* Department of Government, London School of Economics and Political Science, Houghton Street, London
WC2A 2AE, United Kingdom ([email protected]).
† Department of Government, London School of Economics and Political Science, Houghton Street, London
WC2A 2AE, United Kingdom ([email protected]).
‡ Department of Government, London School of Economics and Political Science, Houghton Street, London
WC2A 2AE, United Kingdom ([email protected]).
Abstract: Does democracy affect basic service delivery? If yes, who benefits, and which elements of
democracy matter - enfranchisement, the liberalization of political organization, or both? In 1994, 19 million
South Africans gained the right to vote. The previously banned African National Congress was elected
promising “a better life for all”. Using a difference-in-differences approach, we exploit heterogeneity in the
share of newly enfranchised voters across municipalities to evaluate how franchise extension affected
household electrification. Our unique dataset combines nightlight satellite imagery, geo-referenced census
data, and municipal election results from the 1990s. We include covariates, run placebo regressions, and
examine contiguous census tracts. We find that enfranchisement increased electrification. In parts of the
country where municipalities lacked distribution capacity, the national electricity company prioritized core
constituencies of the ANC. The effect of democratization on basic services depends on the national
government’s ability to influence distribution at the local level.
Keywords: Democracy; Distributive politics; Electricity; South Africa.
1
Does democracy affect the delivery of essential basic services? If yes, who benefits, and which elements of
democracy trigger changes in implemented policies – enfranchisement, the liberalization of political
organization, or both? Several studies find that democracies are better at providing public services than
autocratic regimes (e.g., Lake and Baum 2001, Bueno de Mesquita et al. 2003, Min 2015). Franchise
extension can shift the median voter in a way that affects the size of government and redistribution towards
the poor (e.g., Meltzer and Richard 1981, Husted and Kenny 1997, Boix 2003, Aidt and Eterovic 2011, Aidt
and Jensen 2013) and the delivery of services benefiting the newly enfranchised (Aidt and Dallal 2008,
Miller 2008, Fujiwara 2013, Vernby 2013).
However, it is difficult to quantify the direct effect of democratization on the lives of the poor. Cross-country
comparisons may suffer from omitted variable bias, reverse causality, and sample selection bias (Ross 2006,
Hollyer et al. 2011). Reliance on cross-national data of uneven quality gives rise to concerns about
measurement error. Other studies examine the impact of democracy on resource allocation rather than
services delivered (Stasavage 2005). Yet, especially in poor countries, funds are often not spent as intended
(Stasavage and Moyo 2000, Reinikka and Svensson 2004). An additional challenge is that the process of
democratization typically entails a bundle of different changes, including franchise extension as well as the
lifting of barriers to political activity and organization. Yet, empirical work based on standard indices of
democracy (Munck and Verkuilen 2002) leaves unresolved what precisely it is about democracy that
accounts for the effect of interest. Tackling such “compound treatment” problems requires separating the
effects of franchise extension and political parties on service delivery.
This paper examines electrification in South Africa during the first period of democratic local government,
which provides a particularly good opportunity to evaluate the effect of democracy on service delivery. We
examine a case of contemporary democratization with unique scale: in 1994 suffrage was extended to about
19 million non-white South Africans, representing 84% of the estimated 22.7 million adult citizens and
permanent residents who had the right to vote (Southall 1994: 639). Restrictions on political activity were
2
lifted and all parties were free to compete in elections, including the previously banned African National
Congress (ANC) led by Nelson Mandela. At the same time, backlogs in basic services reflected the apartheid
era’s political inequality. Two-thirds of households were estimated to lack access to electricity (African
National Congress 1994: para. 2.7.1). Our identification strategy exploits heterogeneity in the share of the
newly enfranchised population across municipalities. This subnational approach helps mitigate several
concerns raised above. In particular, municipalities within a country are more comparable than countries with
different historical, cultural, and institutional circumstances, which reduces the risk of omitted variable bias.1
We use an innovative method to combine two sets of census data, the most reliable data available to directly
measure actual service delivery outcomes, which in turn we corroborate with nightlight satellite imagery.
Our study extends prior work on the politics of electrification. Brown and Mobarak (2009) document a
relative shift in the distribution of electricity from industry towards households that is associated with
democratization, but this cross-national work suffers from shortcomings including standard identification and
compound treatment problems discussed above. Closely related is the path-breaking work by Min (2015)
with nighttime lights data. His cross-national results link democratic rule to electrification that benefits the
poor, while in village-level data from India he finds that politicians and parties manipulate electricity supply
at crucial moments such as elections. Our subnational results on franchise extension are consistent with
Min’s cross-national work, and we add robustness by using different data sources. However, in contrast to
Baskaran et al. (2015) and Min (2015: 149), we uncover strong evidence for the targeting of core
constituencies under particular institutional settings. As we discuss in the conclusion, this contributes to a
growing debate about context conditionality in distributive politics.
Our estimates show that municipalities with larger shares of newly enfranchised voters and thus a clear
change in the identity of the median voter experienced larger improvements in household access to electricity
in the period 1996-2001. We also show that political alignment plays an important mediating role. In areas
1 Moreover, our dataset covers the entire territory of the country, so we have no sample selection problems.
3
where the state-owned electricity company Eskom carried out electrification, ANC core constituencies were
prioritized. On the other hand, partisan effects are absent in areas where municipalities undertook
electrification, suggesting that, at the local level, parties converged on the median voter. What matters is not
only the ideology of the party in power, but its control over the levers of supply.
1. Enfranchisement, political parties, and electrification
South Africa’s “negotiated revolution” (Sparks 1995) culminated in democratic elections in April 1994,
when for the first time all adult South Africans had the right to vote (Mattes 1995). The country’s mass
electrification campaign was inherently linked to the transition to democracy, which had fundamental
implications for the composition of the electorate and the party political landscape. In this section, we
develop our expectations as to how these events affected electrification patterns at the local level.
Enfranchisement. Under apartheid, the policy of racial segregation implemented by the National Party (NP)
during its time in government between 1948 and 1994, meaningful political representation was reserved for
the white population. Out of 22.7 million eligible voters in 1994, only 16% belonged to the previously
enfranchised “white” population, while the remaining 72% “black African”, 9% “coloured”2, and 3% “Indian
or Asian” adults enjoyed full voting rights for the first time (Southall 1994: 637). This population
classification remains in use for census purposes and in public policy debates today, and forms the basis of
our analysis.
Our expectations are grounded in standard median voter theory. While under apartheid the median local voter
was white and had access to electricity, franchise extension meant the median voter became non-white in
most municipalities and less likely to have access to electricity. According to the 1996 census, 99% of white
2 Under apartheid, people regarded to be of mixed descent were classified as “coloured” and distinguished
from other groups, often with arbitrary rules. The continued use of the classification is not uncontroversial.
4
(and Indian) households were already electrified as opposed to 44% of black and 84% of coloured
households (Statistics South Africa 2005: 145). At the local level, the likelihood that the post-apartheid
median voter has no electricity is therefore increasing in the share of the non-white population. Given
apartheid’s legacy of racial segregation (Christopher 1994: 103-140), non-white households that were already
electrified also benefited from further connections in their community due to positive externalities such as
improvements in air quality and reduced fire risk from paraffin lamps and candles (Department of Minerals
and Energy 2001: 30). Since it is reasonable to assume that all voters desire for themselves and their
community to have access to electricity, we expect a positive effect of enfranchisement, in particular of black
and coloured voters, on electrification.
Hypothesis 1: Median voter. Following the end of apartheid and the extension of voting rights to the non-
white population, ceteris paribus, municipalities with higher rates of enfranchisement experience bigger
increases in household access to electricity.
Party politics. In a pure median voter framework enfranchisement would cause an increase in electrification
regardless of which political party is in power, as parties compete to please the median voter and eventually
converge on the same platform (Downs 1957). Alternative theories give more careful consideration to the
role of political parties and, more generally, to the identity of policy-makers (Wittman 1983, Besley and
Coate 1997). A growing body of empirical work investigates whether the identity of the party in power does
affect public policy, with mixed results. Some studies identify significant impacts (Pettersson-Lidbom 2008),
whilst others find weaker (Blais et al. 1993) or no effects (Ferreira and Gyourko 2009).
South Africa’s transition to democracy brought fundamental changes in party political control. The NP was
challenged by the previously banned ANC led by Nelson Mandela, who had been released from prison. In
addition, a range of smaller parties competed for electoral support. Among these were the Democratic Party
(DP), the official opposition to the NP during apartheid, as well as the Zulu-nationalist Inkatha Freedom
Party (IFP) led by Mangosuthu Buthelezi, a former Chief Minister of KwaZulu, a pseudo-independent
5
“homeland” for Zulu people.3 In 1994, the ANC won 63% of the national vote in the first general election
after its unbanning, giving it 252 out of 400 seats in the National Assembly, and a majority of seats in six out
of nine provincial legislatures (Southall 1994). In 1995 and 1996, municipal councils elected under universal
suffrage became responsible for delivering essential services (Cameron 1996). The ANC won about 53% of
municipal seats, 6032 out of 11368 (Elections Task Group 1996: 230-232). While the party attracted the
majority of black voters, these elections were not purely determined along racial lines (Mattes 1995). In
several provinces, dominant population groups divided across parties, notably coloured voters in the Western
Cape and the Northern Cape, as well as the Zulu-speaking population in KwaZulu-Natal. Moreover, 40% of
councilors were elected using proportional representation and the remainder on a ward basis that favored
local minorities and reduced proportionality (Cameron 1996: 30-31). It is important to assess whether or not
these changes influenced electrification patterns independently of the changes in the identity of local median
voters.
Shortly after its unbanning in 1990, the ANC adopted mass electrification as a central political goal. Eskom,
the country’s state-owned electricity company, and the ANC agreed a set of electrification targets (Bekker et
al. 2008: 3128). These became part of a National Electrification Program (NEP) and the ANC’s manifesto for
the 1994 elections, the Reconstruction and Development Program (RDP). The ANC promised “electricity for
all” and pledged “access to electricity for an additional 2.5 million households by the year 2000” (ANC
1994: para. 2.7.7). This high-level commitment meant that the ANC’s performance would be measured in no
small part by whether it would be able to achieve this ambitious target.4 Since the 1996 constitution left
responsibility for electricity reticulation with local authorities, as had been the case prior to democracy, the
3 “Homelands” or “bantustans” had been reserved for different segments of the black population under
apartheid, and became synonymous with poverty and underdevelopment (Christopher 1994: 65-101). In
1994, they were dissolved and reintegrated into the territory of the Republic of South Africa.
4 Progress with electrification is also highly visible, and hence verifiable (Harding and Stasavage 2014).
6
party’s manifesto for the municipal elections (“A Better Life: Let’s Make It Happen Where We Live”)
highlighted that democratic local councils have a crucial role in deciding “where new electricity supplies…
will be put in” (ANC 1995). In contrast, the DP and NP campaigns emphasized crime (Lodge 1999: 44). The
IFP had other priorities still, in particular the future role of traditional authorities, which provided an
important power base in its rural strongholds in KwaZulu-Natal (Beall et al. 2005). Given the ANC’s high-
level commitment to electrification, the party had the strongest incentives to connect more households to the
grid. This leads us to the following alternative hypotheses:
Hypothesis 2a: Programmatic parties. Municipalities with stronger ANC representation experience larger
increases in electrification rates, ceteris paribus.
Hypothesis 2b: Converging parties. All political parties converge on the preference of the median voter,
hence partisan representation on local councils does not matter for electrification, ceteris paribus.
National and local politics. Hypotheses 2a and 2b are derived under the assumption that local authorities are
entirely responsible for electrification and can freely allocate resources. Eskom, which had responsibility for
generation and transmission, had substantial excess capacity during this period – Bekker et al. (2008: 3126)
report a 55% reserve margin in 1990. However, not all municipalities had the capacity to connect households
to the grid. Only about a third of municipalities had their own electricity distributors, established between
1888 and 1980, which mainly served urban and adjacent rural areas (Department of Minerals and Energy
2001: 5). The NEP thus envisaged municipalities to deliver one third of new connections, and Eskom the
others (Gaunt 2005: 1310). In the mid-1990s, the regulatory authorities issued temporary licenses to the pre-
existing municipal distributors (National Electricity Regulator 2000: 93). Municipal distributors were directly
controlled by local governments and subject to their political direction: councils identified priorities and
needs, while municipal electricity departments had to clarify technical requirements, seek funding from the
council, and plan implementation (Qase et al. 2001). This facilitated local accountability, as “elected
councillors who are part of the local authority structure provide a channel whereby user needs are
7
communicated to the municipalities’ electricity departments, and municipal issues are communicated to
households” (Department of Minerals and Energy 2001: 10).
In parts of the country without effective municipal distribution, Eskom took on the task of electrification and
direct distribution to households, especially in former “homelands” and rural areas. The company had to rely
on internal financing, so it had incentives to prioritize areas where potential consumption was high and that
could be electrified cheaply, which depends on factors such as distance from the grid, settlement density, as
well as topographical conditions (Dinkelman 2011: 3084). In addition, Eskom faced political pressures. Its
senior managers had incentives to please the ANC in order to delay a restructuring of the electricity industry
and increased competition (Department of Minerals and Energy 1998, Gaunt 2005: 1315). Moreover,
successive governments had used their role in the appointment of senior management to ensure that Eskom’s
key policies and objectives served “the interests of key constituencies behind the political party in power”
(Davis and Steyn 1998: 68). Although formally the selection of electrification projects was internal to
Eskom, the company’s main accountability relationship was thus with the national government, led by the
ANC, and it was likely to have to deliver to the party’s “key constituencies”. Unlike municipal distributors,
Eskom was “not directly accountable to customers” and put less emphasis on community involvement
(Department of Minerals and Energy 2001: 14).
The distributive politics literature offers theoretical reasons to expect central government interference with
the geographical allocation of resources. For example, Cox and McCubbins (1986) argue that ideological
similarities induce incumbent governments to allocate more resources to core support groups and therefore to
areas where they have greater electoral support. Targeting co-partisan voters can increase chances of re-
election also because parties may have better knowledge of their supporters’ preferences (Dixit and
Londregan 1996). National leaders may favor areas controlled by members of the same party also to increase
the chances of re-election of co-partisan local politicians (McCarty 2000). These theories stand in contrast
8
with the “swing voter” hypothesis, which predicts that public resources are disproportionately allocated to
centrist voters since all parties try to capture the center of the political spectrum.5
This discussion leads us to anticipate different partisan effects on electrification depending on whether
distribution was in the hands of Eskom or local authorities. In the latter case, the link to the political
alignment of the local council and its administration is through representation. We examine such
representation effects, reflected in hypotheses 2a and 2b, in the municipal distribution subsample. However,
partisan effects in Eskom distribution areas could be rather different. Since Eskom was at least indirectly
subject to pressure from the dominant party at the central government level, its selection of electrification
projects could be used to target specific municipalities and voters. The ANC had been elected on an
ambitious program of electrification, so we have reason to assume that Eskom would prioritize the party’s
core constituencies, disrupting local accountability channels:
Hypothesis 3: Core constituencies. In municipalities where Eskom distributes electricity directly, the positive
effect of enfranchisement on household electrification is amplified if a municipality is a core constituency of
the ANC, ceteris paribus.
5 The swing voter hypothesis is derived from probabilistic voting models (see Lindbeck and Weibull 1987
and 1993). Although in these models platform convergence may not happen exactly at the median, the swing
voter hypothesis implies a centrist tendency similar to the median voter theorem. Evidence in support of the
“core voters” model includes Case (2001) on Albania, Miguel and Zaidi (2003) on Ghana, and Larcinese et
al. (2006) on the US. Other empirical work (e.g., Dahlberg and Johansson 2002, Kwon 2005, Banful 2010,
Casey 2013) is consistent with competing models where “swing voters” get priority.
9
2. Variables and data
The empirical analysis is based on a dataset of 799 municipalities located in nine provinces (see Figure B1 in
the appendix). We used Statistics South Africa’s Community Profiles and GIS databases to generate a unique
dataset that aligns 2001 census results with 1996 municipal data for the first time. Prior studies of service
delivery in South Africa have often resorted to coarser data on just nine provinces, since their boundaries
have been more stable (Statistics South Africa 2005). Shortly before the 2001 census, a new local
government structure with 262 municipalities replaced the one that existed at the time of the 1996 census. To
make data from 1996 and 2001 comparable, we took advantage of their spatial attributes and aggregated
information on 21,243 enumeration units or census tracts from the 2001 census up to the level of 1996
municipal boundaries.6 Further details are in the data appendix. One contribution of this paper is the resulting
longitudinal dataset, covering South Africa’s entire geographic extent over two census waves, which creates
new opportunities to study electoral and socio-demographic outcomes at the municipal level during this
crucial period in the country’s history.
Dependent variables. Our main dependent variable Electricityit is based on census information and measures
the percentage share of households with access to electricity in municipality i at time t. A full description is
in the data appendix. Most municipalities had substantial numbers of households that were not connected to
the grid. According to the 1996 census, merely seven municipalities had universal access, while half had
household electrification rates of 70% or lower. Sizable improvements were possible in the vast majority of
municipalities. Map 1 in Figure 1 visualizes changes in Electricity between 1996 and 2001.
6 Our 2001 municipal boundaries are thus “virtual boundaries” that enable us to measure local progress with
electrification by 2001. Political decisions taken by councils elected in 1995/6 directly affected areas
belonging to a municipality defined according to 1996 boundaries. Hence, reporting 2001 outcomes within
1996 boundaries is the correct procedure if we want to evaluate the impact of the 1995/6 elections.
10
[Figure 1 about here]
We use Nightlightit as an alternative dependent variable, which is calculated using satellite images of the
earth at night for the years 1992, 1996, and 2001. Figure 2 visualizes how we transform these data: we first
use the raw nighttime lights images (Map 1) to classify each of the over one million pixels as either “lit” or
“unlit” (Map 2). This binary classification ensures that non-linearity of luminosity in the images is “no longer
a concern” (Michalopoulos and Papaioannou 2013: 135) and addresses problems with comparability over
time (Chen and Nordhaus 2010, Elvidge et al. 2013). We then calculate the percentage share of lit pixels
within the 1996 municipal boundaries to yield information on local electrification levels (Map 3) as well as
the change between 1996-2001 (Map 4). The data appendix contains a full discussion, and explains why
alternative population-adjusted methodologies (see Elvidge et al. 2010) are unsuitable in our case.
[Figure 2 about here]
The correlation between Nightlight and Electricity (in levels) for the years 1996 and 2001 is .47. This is
broadly consistent with other comparisons of nighttime lights to national electricity data (e.g., Elvidge et al.
2001, Min et al. 2013).7 In the absence of stable outdoor lighting, pixels appear unlit even where households
have access to electricity. This matters in our context, since street lighting was “often not provided” when
households were connected to the grid (Department of Minerals and Energy 2001: viii). Outdoor lighting can
also be too dim to be detected (Elvidge et al. 2009). Moreover, Nightlight captures light from uninhabited
industrial sites and highways. South Africa’s mines and main highways are clearly visible from outer space.
In areas around Johannesburg and Cape Town we also observe the overglow effect, due to the tendency of
light “to travel to pixels outside of those in which it originates, and light tends to be magnified over certain
7 Nighttime lights have been used to study electoral effects on electricity provision (Min 2015), and as a
proxy for economic activity (Henderson et al. 2012, Storeygard 2012, Pinkovskiy 2011), regional
development (Michalopoulos and Papaioannou 2013), and spatial inequality (Alesina et al. 2012).
11
terrain types such as water and snow cover” (Pinkovskiy 2011: 9). The quality of South Africa’s official
statistics is recognized as uniquely high on the continent (Jerven 2013: 101). Hence, for our purposes, the
census is the ideal data source, as it directly and reliably captures household access to electricity. We use the
satellite data to assess the robustness of our results and to analyze years without census data.
Independent variable. The main independent variable Enfranchisedi refers to newly (post-apartheid)
enfranchised voters: it is the percentage of citizens of voting age who are non-white in municipality i in 1996.
The census also allows us to break down this variable into separate groups of newly enfranchised voters
categorized as black, coloured, and Indian (or Asian). Map 2 in Figure 1 shows the share of all newly
enfranchised voters across municipalities. As noted in the discussion of Hypothesis 1, black voters constitute
the most deprived subset of the non-white population, and their share of the electorate is depicted in Map 3.
Control variables. To address concerns that Enfranchised is correlated with other variables that are in turn
correlated with trends in Electricity, we include several control variables.8 As discussed in the previous
section, we include geographic covariates that affect the supply of electricity: the distance to the electricity
grid in 1996, the distance to the closest main road in 1996, the average slope, and elevation. We control for
the demand for electricity with socioeconomic variables relating to education and income, demographic
variables such as population density and the total number of households, as well as the number of non-
electrified households in 1996.9 Finally, our regressions also include province fixed effects. As the dependent
variable is a difference, they capture province-specific shocks and absorb fixed spatial autocorrelation. Given
space constraints, we report summary statistics in the appendix (Tables B1 and B2).
8 To avoid “post-treatment bias” (King 2010), we do not include “bad controls” (Angrist and Pischke 2009:
64) that are themselves potential outcomes of Enfranchised, such as changes in other public services.
9 Recall that the NEP stated targets in terms of the number of households to be electrified. Moreover, we
include the number of non-electrified households in a specification that already controls for total population
levels, which helps to purge our results from the electrification needs of the various municipalities.
12
3. Empirical strategy
In an ideal setting, we would like to compare our data with a counterfactual scenario in which
democratization did not occur. Since we cannot observe this counterfactual we exploit the heterogeneity in
enfranchisement in the first democratic elections across South African municipalities.10 We determine the
effect of enfranchisement on electrification by using a difference-in-differences specification, where the
shares of newly enfranchised represent the intensity of treatment across municipalities. Using the variables
defined in the previous section, our model can be expressed as follows, with i indexing a given municipality:
ΔElectricityi1996-2001 = α + βEnfranchisedi1996 + γControlsi1996 + Δεi1996-2001 (1)
Using a specification in changes rather than levels purges our regressions of omitted unobservables that are
fixed over time. However, we remain concerned about changing characteristics of municipalities that could
be correlated with changes in electrification via Enfranchised. Our main identifying assumption is that,
conditional on the observables we control for, Enfranchised is uncorrelated with the error term.
A paramount concern is that electrification in areas with high enfranchisement could be due to some
underlying growth in electrification that occurs regardless of regime type. First, municipalities with high
electrification rates in 1996 have little margins for further electrification and this could mechanically
generate a correlation between enfranchisement and electrification since low-electrification areas are also
predominantly inhabited by non-whites. Second, our estimates could reflect pre-democratization trends in
electrification if predominantly non-white municipalities are electrifying faster and “catching up” already in
the pre-democracy era. Our empirical analysis considers these confounding hypotheses. In particular, we
analyze pre-existing trends with placebo regressions to rule out as far as possible that our results are driven
by a violation of the parallel trends assumption (Angrist and Pischke 2009: 227-243). Placebo regressions
check whether our main explanatory variable accounts for electrification in the pre-democratization era. If
10 This is a well-established methodology. See for example Berlinski and Dewan (2011) and Vernby (2013).
13
enfranchisement has no explanatory power before it actually occurs, this would provide evidence against a
catching up effect that is unrelated to democratization, since it is not obvious that such an effect should only
emerge after the first democratic elections. We further corroborate our findings by examining contiguous
census tracts and carry out other robustness checks, which we discuss in the following section.
4. Main results
4.1 Baseline estimates
Table 1 reports our baseline estimates, using the census-based measure of access to electricity as the
dependent variable and the share of newly enfranchised voters as the main explanatory variable. We report
results from several specifications, starting with a simple regression (column 1) and progressively including
province-specific shocks (column 2), geographic controls (column 3), population and socioeconomic controls
at their 1996 levels (column 4), and the number of non-electrified households in 1996 (column 5).11 We then
include 1996-2001 differences in population and socioeconomic controls (column 6).12
The coefficient of interest is positive and statistically significant throughout. We can safely conclude that the
share of newly enfranchised (non-white) voters has a positive and statistically significant effect on household
electrification rates, as stated in Hypothesis 1. The magnitude of the coefficients ranges from .19 to .34.
11 We report the coefficients on the province fixed effects from column 5 in the appendix (Figure B2). Three
of these are negative and significant: KwaZulu-Natal, Northern Cape, and Western Cape – the three regions
in which the ANC faced its strongest electoral challenges from opposition parties. This presages the party
political story that we unpack in the following section.
12 This introduces the possibility of post-treatment bias (Angrist and Pischke 2009: 64, King 2010), but
failing to control for these differences may also result in bias. The fact that these controls do not alter the
pattern of results is reassuring.
14
These represent the effect of an increase in the share of newly enfranchised voters by one percentage point.
The lower bound suggests that one standard deviation in enfranchisement led to an increase in electrification
of at least 3.5 percentage points, more than one third of the sample mean: a substantively large effect.
[Table 1 about here]
In column 7 we distinguish between newly enfranchised black, coloured, and Indian voters. The effect is
particularly strong for black voters, positive but less strong for coloured voters, and statistically insignificant
for Indian voters. The coefficients indicate that an increase of one standard deviation in the share of black
voters led to an increase of 12 percentage points in the household electrification rate, and about half that size
for coloured voters.
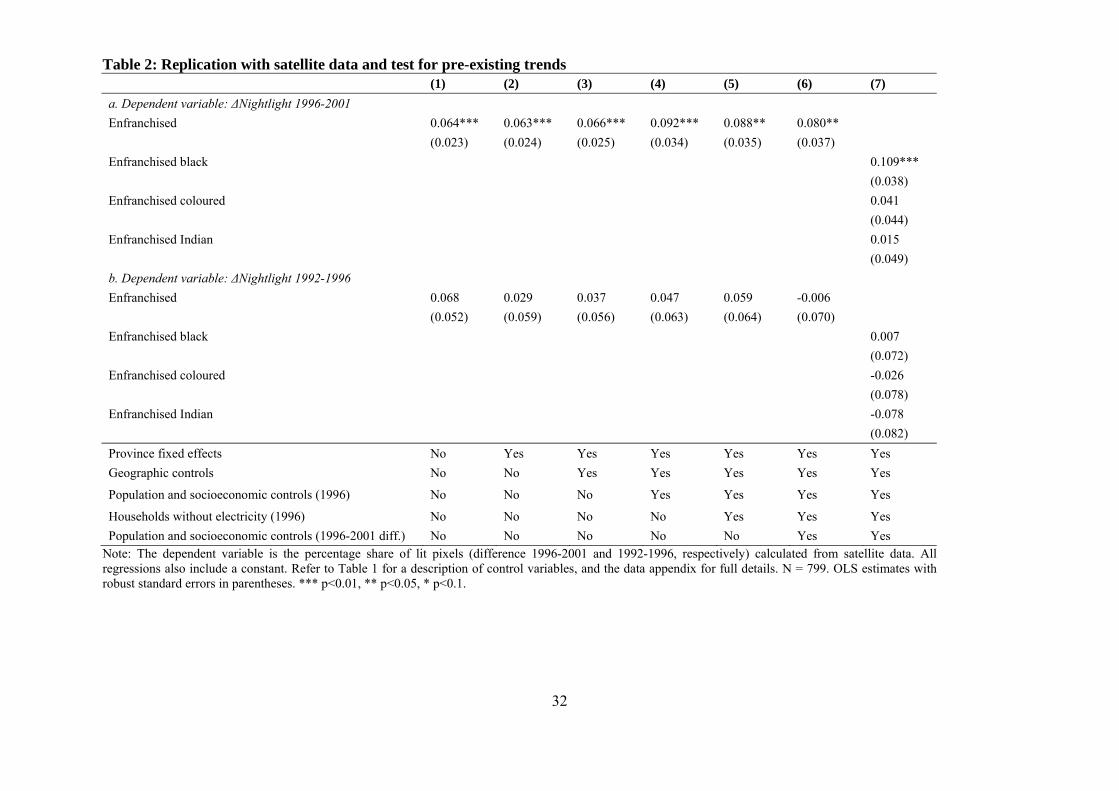
4.2 Placebo regressions
The most important identification concern is that our estimates could capture a pre-existing trend associated
with Enfranchised that occurs regardless of regime type. To rule this out, we follow the standard procedure
and check whether enfranchisement can explain electrification before democratization (when it should not).
Comparable information for the period prior to 1996 does not exist, as apartheid-era census data from the
early 1990s are incomplete.13 For this reason we use Nightlight as an alternative dependent variable. This has
two important advantages. First, Nightlight is based on an entirely independent data source with complete
records covering all of South Africa. As such, the images function as an additional source of data that we use
to corroborate our findings. Second, the satellite images are publicly available as annual composites from
1992, so they provide information about electrification in the years prior to democratization.
Panel (a) in Table 2 replicates the models in Table 1 using changes in the share of lit pixels during 1996-2001
as the dependent variable. The coefficients of interest are statistically significant and stable across
13 The 1991 census excludes some homeland areas and lacks information on household access to electricity.
15
specifications, but magnitudes are smaller than with census data: the estimated effect of an increase in the
share of newly enfranchised voters by one percentage point ranges from .06 to .09. One standard deviation in
the share of non-white voters leads to a maximum 1.7 percentage point increase in Nightlight. It is reassuring
that the estimated effects of enfranchisement relative to mean changes in electrification are similar across
models using census and satellite data.
[Table 2 about here]
In panel (b) of Table 2 we report our placebo regressions. Here, we replace the dependent variable with
changes in the share of lit pixels during 1992-1996. All coefficients on Enfranchised are far from acceptable
significance levels. We also experimented with a range of alternative nightlight-based variables used in the
literature, notably population-adjusted measures discussed in the data appendix. The overall pattern is highly
robust, with significant enfranchisement effects for the period 1996-2001 and insignificant effects for 1992-
1996. Despite the limitations of the satellite data, these results strongly suggest that what we capture with our
estimates is unlikely to be due to pre-existing electrification trends.
4.3 Examining contiguous census tracts from different municipalities
The need for electrification at the municipal level is highly correlated with enfranchisement, both being
correlated with the non-white population share at the time of democratization. In this section we further
corroborate our results by using an alternative empirical strategy based on spatial discontinuity. We use more
fine-grained data at the census tract (CT) level14 and match adjacent CTs that lie on different sides of a
municipal boundary, thus restricting the sample to CTs that lie on municipal borders only.15 Including a fixed
effect for each pair of neighbouring CTs means that identification is obtained by matching CTs that belong to
14 Our census tract dataset combines 1996 “placename” level data with 2001 “subplace” level data following
the same approach as for our municipality dataset, as explained in detail in the data appendix.
15 This strategy draws on Holmes (1998), as extended by Dube et al. (2010) and Duranton et al. (2011).
16
different municipalities (hence treated with differential levels of enfranchisement), but that are adjacent
(hence generally similar in other respects).16
By using this strategy we take into account several confounding factors. First, it is less likely that economic
and social conditions vary discontinuously along municipal borders, which makes comparisons more reliable.
Second, electricity needs and socioeconomic conditions may be specific to a CT, especially with segregated
communities that are typical for South African municipalities (Christopher 1994: 103-140). The relevant
decision-making unit, however, is not the CT but the municipality. As a result, municipal-level
enfranchisement should now better capture the effect of democratization, since we can separate its impact on
the decision-making unit (via the overall share of newly enfranchised in a municipality) from a “catching up”
effect that is unrelated to it (as reflected in the electrification need of a specific CT). By differentiating census
tract and municipality we thus break a correlation that can represent an important confounding factor. We
estimate the following equation, which omits the years from subscripts:
ΔElectricitycpi = αp + βEnfranchisedi + γControlsc + Δεcpi (2)
As before, i indicates a municipality, while c indicates a CT and p indicates a pair of adjacent CTs that lie
across a municipal boundary. Controls are now at the CT level, but Enfranchised remains at the municipal
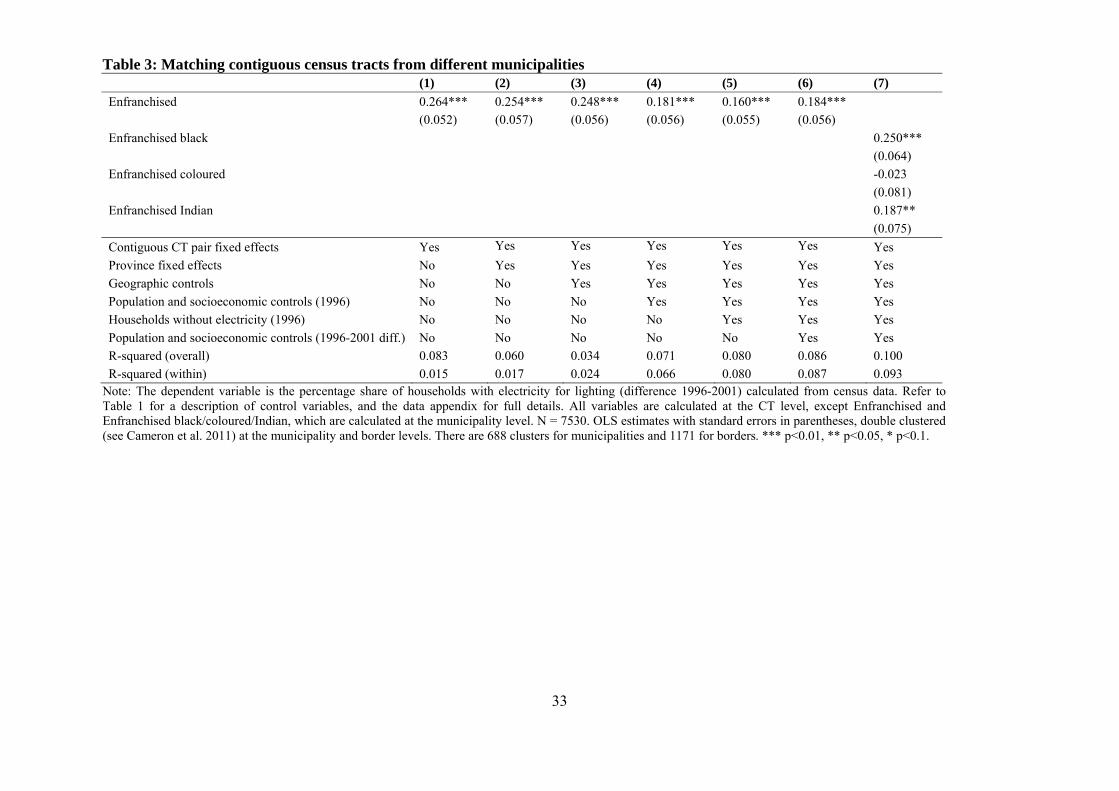
level. Results are reported in Table 3 and are in line with those obtained with our main specification. The
coefficient on Enfranchised is always statistically significant at the 1% level and ranges from .16 to .26,
slightly lower than what we obtained previously.17 When we distinguish different non-white groups, the
16 A CT bordering more than one CT of an adjacent municipality enters multiple times into the sample, each
time with a separate pair fixed effect. To correct for the resulting correlations across pairs on the same
municipality boundary, we use two-way clustering (Cameron et al. 2011), by municipality and by each
border between municipalities.
17 This is not surprising given that the sample is also different.
17
effect of black enfranchisement remains positive, statistically significant, and with a magnitude close to that
in Table 1. The effects for coloured and Indian voters become statistically insignificant and significant
respectively: these are the only relevant differences compared to our main specification. Overall, our results
are robust to this demanding specification.
[Table 3 about here]
4.4 Other robustness checks
As noted earlier, another concern is that our dependent variable has an upper bound of 100. Areas that were
highly electrified in the pre-treatment period have lower margins to improve and, since pre-treatment
electrification levels are not orthogonal to enfranchisement, this may bias the coefficients of interest. We
repeated our exercise with a restricted sample, excluding municipalities where more than 90% of the
population had access to electricity in 1996, using the same specification as in column 5 of Table 1. The
coefficient on Enfranchised is twice as large as in the full sample, and it gets larger as we further reduce this
threshold. Electrification gains were lower in areas with very high levels of household access to electricity in
1996, but the basic pattern is robust. These results appear in appendix Table B3, panel (a). Further robustness
checks reported in appendix Table B4, panel (a), show that our main results go through when we exclude, in
turn, the municipalities that fall into any one of the nine provinces: the relationship we document is not
limited to any particular region of the country.
5. The role of political parties
We now return to the important question of how party politics affected electrification during this period. In
principle, municipal distributors should be responsive to changes in the local median voter. In discussing our
hypotheses, we noted that party politics can display its effects at two levels. First, local ANC politicians
could have particular incentives to electrify households, as stated in Hypothesis 2a. Second, electricity
distribution could be part of a national strategy. As stated in Hypothesis 3, we expect that in municipalities
18
where Eskom distributes electricity directly, the positive effect of enfranchisement on household
electrification is amplified if the municipality is a core constituency of the ANC.
We use 1996 membership data from the Association of Municipal Electricity Undertakings (AMEU) to
distinguish municipalities served by Eskom from municipalities served by a local distributor. The data
appendix contains a detailed description. Our statistical analysis relies on the variable ANC seat sharei, the
share of total seats on local council i won by the ANC in the 1995/6 elections (Elections Task Group 1996).
This was the first time following its unbanning that the ANC was able to freely contest municipal elections.18
Hence, the share of seats obtained in those elections at the same time represents the change in the share of
ANC seats from zero prior to democracy. Map 4 in Figure 1 shows the geographic distribution, with spatial
clusters of councils dominated by the ANC in the Eastern Cape, North West, Mpumalanga, and Limpopo
(initially called Northern Transvaal and then Northern Province). These provinces contain ANC core
constituencies and coincide with areas that experienced large changes in electrification as depicted in Map 1.
To test our hypotheses, we first check whether enfranchisement is merely a proxy for the changed landscape
in municipal representation or, put differently, if the impact of democratization on electrification is channeled
via municipal representation of the ANC. We augment our model with the ANC seat share variable, which
has a correlation of .49 with our measure of enfranchisement. Column (1) of Table 4 shows that the ANC’s
seat share had no direct effect on electrification, while the coefficient on Enfranchised remains positive and
statically significant. This suggests the latter is not merely a proxy for ANC representation. Only when we
exclude Enfranchised is the effect of ANC representation statistically significant (column 2). We also find no
evidence of a direct effect of ANC seat share in either Eskom (column 3) or municipal distribution (column
18 This fact reduces concerns about the endogeneity of voting returns (Larcinese et al. 2013).
19
4) areas.19 This evidence is compatible with Hypothesis 2b (converging parties) and suggests that we should
reject Hypothesis 2a (programmatic parties).
If not via municipal representation, another possibility is that the impact of enfranchisement itself differed as
a function of ANC strength. To test this, we augment our model with an interaction between Enfranchised
and ANC seat share. We report results for the full sample (column 5) and separately for municipalities
supplied by Eskom (column 6) and municipal distributors (column 7).20 The coefficient on the interaction
term is positive and significant only in the full sample and the Eskom subsample. The magnitude of the
coefficient is larger in the latter case. In sum, we find support for Hypothesis 3 (core constituencies).
To probe the precise nature of the partisan effect, we construct separate dummies for each quarter of ANC
seat share. We then use these dummies and their interactions with enfranchisement in our regressions (the
first quarter, 0-25%, is the reference category), replacing the continuous seat share measure and its
interaction. The results in columns (8) to (10) and summarized in Figure 3 reveal important nuances. First,
the 50% threshold does not matter; the conditional coefficients for the second and third quarters are not
statistically distinguishable. Second, F-tests indicate that in Eskom-served municipalities the marginal effect
of franchise extension when the party controls 75% of seats or more is statistically different from the other
conditional coefficients. If it simply were the case that the coordination between a non-ANC council and
Eskom was more difficult, then it should matter whether the ANC had a majority or not, irrespective of its
size, but this is not the pattern we detect. For councils with municipal distributors, the effect of
enfranchisement is larger in the three highest quarters of ANC representation than in the reference category,
but the differences are small and statistically insignificant.
19 The coefficient on Enfranchised in column 4 falls just short of significance at standard levels, but the
pattern of results is as in column 3. Sample size is smaller than for the Eskom subsample.
20 When we replaced the ANC’s seat share with NP or IFP seat shares, the results convey the story inversely.
See Figure B3 in the appendix.
20
[Table 4 about here] [Figure 3 about here]
We also conduct a formal test of whether the corresponding coefficients depicted in panels (b) and (c) of
Figure 3 are statistically different. Using the full sample, we estimate a model with a three-way interaction of
enfranchisement, the seat share quarter dummies, and an indicator of whether a municipality is supplied
directly by Eskom. The coefficient on the interaction between Enfranchised, ANC seat share Q4, and the
Eskom indicator is .801 (the difference between .967 and 0.166 in columns 9 and 10 of Table 4), with a
standard error of .248 (p = .001).21 For all other seat share quarters, the corresponding differences between
the two subsamples are not statistically distinguishable. In other words, Eskom delivered a significant top-up
to core constituencies of the ANC, as predicted by Hypothesis 3. Panels (b) of Tables B3 and B4 in the
appendix repeat earlier supplementary robustness checks that yield consistent results.
In sum, we detect two distinct patterns of service delivery, depending on institutional responsibility for
electrification. In municipal distribution areas, the partisan composition of local councils does not condition
the effect of enfranchisement. Local decision-making appears consistent with party convergence predicted by
standard models of electoral competition (Downs 1957). The results for Eskom distribution areas, on the
other hand, point to a strong role for partisan influences compatible with core-voter models of distributive
politics (e.g., Cox and McCubbins 1986). Here, the pattern of results is in line with our expectation that the
dominant party in the national government, via Eskom, rewarded its “key constituencies”, as predicted by
Davis and Steyn (1998: 68). Since Eskom was responsible for two-thirds of the electrification target under
the NEP, this effect dominates in the full sample.
21 To recover the precise coefficients reported in columns 9 and 10 of Table 4, we follow Kam and Franzese
(2007: 103-111) and estimate a “fully dummy-interactive” model that also includes interactions of all other
covariates, including the constant, with the Eskom indicator. The results reported here are substantively the
same whether we do this or not.
21
6. Conclusions
Enfranchisement shifted the median voter and led to increased household electrification rates during the first
period of democratic local government in South Africa. For the years 1996-2001, we estimate an average
increase in the share of municipal households with electricity access of between 3 and 6 percentage points
per standard deviation of enfranchisement. Taking the most conservative lower bound estimate from our
main results, the average share of newly enfranchised voters in the municipal electorate, 82%, implies an
increase in the share of electrified households by 16 percentage points. The effect is largest in municipalities
with higher shares of black voters, who had the greatest electrification backlog. Our analysis also shows how
party politics mediated the effect of enfranchisement. ANC core constituencies supplied by Eskom saw the
largest gains. However, the partisan composition of the local council made no difference in areas with
municipal distributors. This suggests that the median voter logic is strong enough to drive even a party such
as the NP – which had previously denied voting rights to the non-white population – to expand services to
the newly enfranchised. Hence, the effect of democratization on basic services depends on the national
government’s ability to influence distribution at the local level.
These results extend the literature on democracy and public service delivery.22 Compared with existing
literature, our analysis establishes analytically separate effects of franchise extension and changes in partisan
representation: not only does it matter that more people receive the right to vote but, depending on
institutional responsibility for delivery, it also matters which party they vote for. This is a valuable first step
22 In addition to work cited earlier, Martinez-Bravo et al. (2012) and Zhang et al. (2004) show that the
introduction of local elections in Chinese municipalities led to an increase in public good provision. Skoufias
et al. (2014) study the impact of direct elections in Indonesian municipalities. Olken (2010) provides
experimental evidence that participatory, rather than representative, democracy in Indonesian villages led to
higher voter satisfaction with development projects. The responsiveness of elected leaders also depends on
the circulation of newspapers and, more generally, an informed electorate (Besley and Burgess 2002).
22
in addressing the “compound treatment” problem in cross-national work on this topic, although we
acknowledge that there are other dimensions of democratization that we leave unexplored.23 Moreover, by
directly measuring service delivery outcomes (using two independent data sources) our analysis focuses on
the ultimate outcome of interest: whether people’s lives were actually affected. This is essential for assessing
the implications of democracy for the poor in contexts where resource allocation is a limited indicator for
actual service delivery, as in many developing countries.
We also add to prior work on the politics of electricity. Consistent with Min (2015), we find that democracy
improves access to electricity, and our data allows us to pinpoint impacts on households directly. However,
our evidence in favor of the core voter hypothesis contrasts with findings by Baskaran et al. (2015) and Min
(2015) on India. It is likely that partisan effects in established democracies are different from those in new
ones (Keefer 2007). Our focus is on a large-scale and sustained electrification effort immediately after
democratization, whereas the short-term cycles that Min documents occur in a more settled political context.
While the ANC’s dominance during this period made its immediate electoral outlook fairly certain (Southall
1994), the party was challenged to demonstrate to its supporters that it was capable to deliver “a better life
for all” including the concrete improvements it had promised. Follow-up work could examine more recent
electricity supply patterns in South Africa, which might be more comparable to the Indian experience also in
23 One important dimension is the protection of individual rights. After 1994, and especially after the
adoption of a new constitution in 1996, the non-white population could use new freedoms and increased
protection of their personal rights to form interest groups and put pressure on administrations and providers.
Non-electoral channels are outside the scope of our work but we acknowledge that they might have played a
role in shaping patterns of electrification.
23
other respects.24 More broadly, these contrasting results add to a growing debate about the contextual
conditions under which different voters or constituencies are targeted (e.g. Weitz-Shapiro 2012, Diaz-
Cayeros et al. 2016).
Our results also contribute to a debate on South African politics about whether the ANC “punished” voters
that did not vote for it. Ferree (2011: 15) cites delivery patterns for housing and social grants across the nine
provinces to argue that there is “no evidence of a punishment scheme” but cautions that “more careful
examination of less aggregated data could produce different conclusions”. Indeed, the electrification patterns
we document at the municipal level show precisely such a politicization of service delivery. While we do not
find that the ANC “punished” voters that supported other parties, we show that parts of the country with
newly enfranchised voters that overwhelmingly voted for the ANC benefited more than others, but depending
on municipal capacity for electrification. This also implies that opposition support tended to be more costly
in rural areas and former homelands, which were less likely to have municipal distribution capacity. These
subtle differences are only revealed by a disaggregated analysis that we provide, which contributes an
important piece of new evidence that helps to clarify this debate.
How generalizable are our results? On the one hand, the South African context is unusual in that the
conditions for a rapid rollout of electricity existed at the time of the transition to democracy. Electricity
generation was initially not an obstacle to expansion. Post-democratization electrification gains might be less
impressive in countries with low reserve margins. Nonetheless, we have reasons to believe that the patterns
we document are not peculiar to the case we study. Recent work on enfranchisement in very different
geographic and historical contexts (e.g., Miller 2008, Vernby 2013) yields compatible results. Related work
on how democracy affects health outcomes in Sub-Saharan Africa also suggests that the basic pattern we
24 Electricity access in South Africa continued to improve in later years, but disconnections due to non-
payment also increased (Fjeldstad 2004). More recent electricity blackouts reflect under-investment in
generation capacity and poor planning (Johnson 2009: 473-481).

24
document applies to other services (Kudamatsu 2012).25 There is scope to expand both the set of countries
and the type of policies that are investigated, and with a greater focus on the role of partisan politics and the
degree of decentralization in service delivery that we identify as central in our study.
25 Kramon and Posner (2013) argue for more systematic comparisons across different goods. We plan further
work on housing and water to enable us to explore trade-offs across several outcomes.
25
Acknowledgments: For helpful comments, we thank Jim Alt, Mark Borchers, Robert Cameron, Daniel de
Kadt, Torun Dewan, Taryn Dinkelman, Andy Eggers, Chris Elvidge, Steven Friedman, Elliott Green,
Dominik Hangartner, Simon Hix, Ryan Jablonski, Mareike Kleine, Evan Lieberman, Johannes Lindvall, Bob
Mattes, Brian Min, Pablo Querubin, Jeremy Seekings, David Soskice, Grové Steyn, Daniel Sturm, Johannes
Urpelainen, Leonard Wantchekon, Paul Whelan, Sarah Wilson Sokhey, and three anonymous reviewers.
South African census data were provided by Faizel Mohammed and Kevin Perry at Statistics South Africa
(StatsSA). Richard Drummond, Fazlin Harribi, and Harald Winkler from the Energy Research Centre at the
University of Cape Town facilitated access to case study material. Jean Venter from the Association of
Municipal Electricity Utilities (AMEU) kindly supplied 1996 membership data. Ronel Rogers from the
National Library of South Africa patiently responded to queries. We are also grateful for feedback from
seminar participants at Harvard, LSE, NYU, Oxford, the University of Cape Town, and at the 2013 MPSA,
2013 APSA, and 2014 EPSA meetings. Simo Goshev at the Harvard-MIT Data Center, Kevin Perry at
StatsSA, Giovanni Zambotti and Stacy Bogan at the Harvard Center for Geographic Analysis, and Steve
Gibbons at LSE’s Department of Geography and Environment provided valuable support with data and
spatial analysis.
26
References
African National Congress. 1994. The Reconstruction and Development Programme: A Policy Framework. Johannesburg: Umanyano Publications.
African National Congress. 1995. “1995 Local Government Elections Manifesto. A Better Life: Let’s Make It Happen Where We Live.” August 24. http://www.anc.org.za/show.php?id=2541 (accessed February 20, 2013).
Aidt, Toke S., and Bianca Dallal. 2008. “Female Voting Power: The Contribution of Women’s Suffrage to the Growth of Social Spending in Western Europe (1869–1960).” Public Choice 134(3-4): 391-417.
Aidt, Toke S., and Dalibor S. Eterovic. 2011. “Political Competition, Electoral Participation and Public Finance in 20th Century Latin America.” European Journal of Political Economy 27(1): 181-200.
Aidt, Toke S., and Peter S. Jensen. 2013. “Democratization and the Size of Government: Evidence from the Long 19th Century.” Public Choice 157(3-4): 511-542.
Alesina, Alberto, Stelios Michalopoulos, and Elias Papaioannou. 2012. “Ethnic Inequality.” NBER Working Paper 18512.
Angrist, Joshua D., and Jörn-Steffen Pischke. 2009. Mostly Harmless Econometrics: An Empiricist’s Companion. Princeton, NJ: Princeton University Press.
Banful, Afua B. 2010. “Do Formula-Based Intergovernmental Transfer Mechanisms Eliminate Politically Motivated Targeting? Evidence from Ghana.” Journal of Development Economics 96(2): 380-390.
Baskaran, Thushyanthan, Brian Min, and Yogesh Uppal. 2015. “Election Cycles and Electricity Provision: Evidence from a Quasi-Experiment with Indian Special Elections.” Journal of Public Economics 126: 64-73.
Beall, Jo, Sibongiseni Mkhize, and Shahid Vawda. 2005. “Emergent Democracy and ‘Resurgent’ Tradition: Institutions, Chieftaincy and Transition in KwaZulu-Natal.” Journal of Southern African Studies 31(4): 755-771.
Bekker, Bernard, Anton Eberhard, Trevor Gaunt, and Andrew Marquard. 2008. “South Africa’s Rapid Electrification Programme: Policy, Institutional, Planning, Financing and Technical Innovations.” Energy Policy 36(8): 3125-3137.
Berlinski, Samuel, and Torun Dewan. 2011. “The Political Consequences of Franchise Extension: Evidence from the Second Reform Act.” Quarterly Journal of Political Science 6(3-4): 329-376.
Besley, Timothy, and Robin Burgess. 2002. “The Political Economy of Government Responsiveness: Theory and Evidence from India.” Quarterly Journal of Economics 117(4): 1415-1451.
Besley, Timothy, and Stephen Coate. 1997. “An Economic Model of Representative Democracy.” Quarterly Journal of Economics 112(1): 85–114.
Blais, André, Donald Blake, and Stéphane Dion. 1993. “Do Parties Make a Difference? Parties and the Size of Government in Liberal Democracies.” American Journal of Political Science 37(1): 40-62.
Boix, Carles. 2003. Democracy and Redistribution. New York, NY: Cambridge University Press.
Bueno de Mesquita, Bruce, Alastair Smith, Randolph M. Siverson, and James D. Morrow. 2003. The Logic of Political Survival. Cambridge, MA: MIT Press.
Brown, David S., and Ahmed M. Mobarak. 2009. “The Transforming Power of Democracy: Regime Type and the Distribution of Electricity.” American Political Science Review 103(2): 193-213.
27
Cameron, Robert. 1996. “The Democratisation of South African Local Government.” Local Government Studies 22(1): 19-39.
Cameron, A. Colin, Jonah B. Gelbach, and Douglas L. Miller. 2011. “Robust Inference with Multiway Clustering.” Journal of Business and Economic Statistics 29(2): 238-249.
Case, Anne. 2001. “Election Goals and Income Redistribution: Recent Evidence from Albania.” European Economic Review 45(3): 405-423.
Casey, Katherine E. 2013. “Crossing Party Lines: The Effects of Information on Redistributive Politics.” Stanford GSB Research Paper 2099R.
Chen, Xi, and William D. Nordhaus. 2010. “The Value of Luminosity Data as a Proxy for Economic Statistics.” Cowles Foundation Discussion Paper 1766.
Christopher, Anthony J. 1994. The Atlas of Apartheid. Johannesburg: Witwatersrand University Press.
Cox, Gary W., and Mathew D. McCubbins. 1986. “Electoral Politics as a Redistributive Game.” Journal of Politics 48(2): 370-389.
Dahlberg, Matz, and Eva Johansson. 2002. “On the Vote-Purchasing Behavior of Incumbent Governments.” American Political Science Review 96(1): 27-40.
Davis, Mark, and Grové Steyn. 1998. Electricity in South Africa. London: Financial Times Energy.
Department of Minerals and Energy. 1998. White Paper on the Energy Policy of the Republic of South Africa. Pretoria: Department of Minerals and Energy.
Department of Minerals and Energy. 2001. National Electrification Programme (NEP) 1994-1999: Summary Evaluation Report. Pretoria: Department of Minerals and Energy.
Diaz-Cayeros, Alberto, Federico Estevez, and Beatriz Magaloni. 2016. The Political Logic of Poverty Relief: Electoral Strategies and Social Policy in Mexico. New York, NY: Cambridge University Press.
Dinkelman, Taryn. 2011. “The Effects of Rural Electrification on Employment: New Evidence from South Africa.” American Economic Review 101(7): 3078-3108.
Dixit, Avinash, and John Londregan. 1996. “The Determinants of Success of Special Interests in Redistributive Politics.” Journal of Politics 58(4): 1132-1155.
Downs, Anthony. 1957. An Economic Theory of Democracy. New York, NY: Harper and Row.
Dube, Arindrajit, T. William Lester, and Michael Reich. 2010. “Minimum Wage Effects Across State Borders: Estimates Using Contiguous Counties.” Review of Economics and Statistics 92(4): 945-964.
Duranton, Gilles, Laurent Gobillon, and Henry G. Overman. 2011. “Assessing the Effects of Local Taxation using Microgeographic Data.” Economic Journal 121(555): 1017-1046.
Elections Task Group. 1996. Local Government Elections in South Africa 1995/1996. Johannesburg: Elections Task Group.
Elvidge, Christopher D., Feng-Chi Hsu, Kimberly E. Baugh, and Tilottama Ghosh. 2013. “National Trends in Satellite Observed Lighting: 1992-2012.” Qihao Weng, ed., Global Urban Monitoring and Assessment Through Earth Observation. Boca Raton, FL: CRC Press, 97-120.
Elvidge, Christopher D., Kimberly E. Baugh, Paul C. Sutton, Budhendra Bhaduri, Benjamin T. Tuttle, Tilotamma Ghosh, Daniel Ziskin, and Edward H. Erwin. 2010. “Who’s In The Dark: Satellite Based Estimates Of Electrification Rates.” Xiaojun Yang, ed., Urban Remote Sensing: Monitoring, Synthesis and Modeling in the Urban Environment. Chichester: Wiley-Blackwell, 211-224.
28
Elvidge, Christopher D., Paul C. Sutton, Tilotamma Ghosh, Benjamin T. Tuttle, Kimberly E. Baugh, Budhendra Bhaduri, Edward Bright. 2009. “A Global Poverty Map Derived from Satellite Data.” Computers and Geosciences 35(8): 1652-1660.
Elvidge, Christopher D., Marc L. Imhoff, Kimberly E. Baugh, Vinita R. Hobson, Ingrid Nelson, Jeff Safran, John B. Dietz, and Benjamin T. Tuttle. 2001. “Night-time Lights of the World: 1994-1995.” ISPRS Journal of Photogrammetry and Remote Sensing 56(2): 81-99.
Ferree, Karen E. 2011. Framing the Race in South Africa: The Political Origins of Racial Census Elections. New York, NY: Cambridge University Press.
Ferreira, Fernando, and Joseph Gyourko. 2009. “Do Political Parties Matter? Evidence from US Cities.” Quarterly Journal of Economics 124(1): 349-397.
Fjeldstad, Odd-Helge. 2004. “What’s Trust Got to Do With It? Non-payment of Service Charges in Local Authorities in South Africa.” Journal of Modern African Studies 42(4): 539-562.
Fujiwara, Thomas. 2013. “Voting Technology, Political Responsiveness, and Infant Health: Evidence from Brazil.” Unpublished manuscript.
Gaunt, C. Trevor. 2005. “Meeting Electrification's Social Objectives in South Africa, and Implications For Developing Countries.” Energy Policy 33(10): 1309-1317.
Harding, Robin, and David Stasavage. 2014. “What Democracy Does (and Doesn’t Do) for Basic Services: School Fees, School Inputs, and African Elections.” Journal of Politics 76(1): 229-245.
Henderson, J. Vernon, Adam Storeygard, and David N. Weil. 2012. “Measuring Economic Growth from Outer Space.” American Economic Review 102(2): 994-1028.
Hollyer, James R., B. Peter Rosendorff, and James R. Vreeland. 2011. “Democracy and Transparency.” Journal of Politics 73(4): 1191-1205.
Holmes, Thomas J. 1998. “The Effect of State Policies on the Location of Manufacturing: Evidence from State Borders.” Journal of Political Economy 106(4): 667-705.
Husted, Thomas A., and Lawrence W. Kenny. 1997. “The Effect of the Expansion of the Voting Franchise on the Size of Government.” Journal of Political Economy 105(1): 54-82.
Jerven, Morten. 2013. Poor Numbers: How We Are Misled by African Development Statistics and What to Do About It. Ithaca, NY: Cornell University Press.
Johnson, R. W. 2009. South Africa's Brave New World: The Beloved Country Since the End of Apartheid. New York, NY: Allen Lane.
Kam, Cindy D., and Robert J. Franzese Jr. 2007. Modeling and Interpreting Interactive Hypotheses in Regression Analysis. Ann Arbor, MI: University of Michigan Press.
Keefer, Philip. 2007. “Clientelism, Credibility, and the Policy Choices of Young Democracies.” American Journal of Political Science 51(4): 804-821.
King, Gary. 2010. “A Hard Unsolved Problem? Post-Treatment Bias in Big Social Science Questions.” Presented at the “Hard Problems in Social Science” Symposium, April 10, Cambridge, MA.
Kramon, Eric, and Daniel N. Posner. 2013. “Who Benefits from Distributive Politics? How the Outcome One Studies Affects the Answer One Gets.” Perspectives on Politics 11(2): 461-474.
Kudamatsu, Masayuki. 2012. “Has Democratization Reduced Infant Mortality in Sub-Saharan Africa? Evidence from Micro Data.” Journal of the European Economic Association 10(6): 1294-1317.

29
Kwon, Hyeok Y. 2005. “Targeting Public Spending in a New Democracy: Evidence from South Korea.” British Journal of Political Science 35(2): 321-341.
Lake, David A., and Matthew A. Baum. 2001. “The Invisible Hand of Democracy: Political Control and the Provision of Public Services.” Comparative Political Studies 34(6): 587-621.
Larcinese, Valentino, Leonzio Rizzo, and Cecilia Testa. 2006. “Allocating the US Federal Budget to the States: The Impact of the President.” Journal of Politics 68(2): 447-456.
Larcinese, Valentino, James M. Snyder Jr., and Cecilia Testa. 2013. “Testing Models of Distributive Politics Using Exit Polls to Measure Voter Preferences and Partisanship.” British Journal of Political Science 43(4): 845-875.
Lindbeck, Assar, and Jörgen Weibull. 1987. “Balanced Budget Redistribution as the Outcome of Political Competition.” Public Choice 52(3): 237-297.
Lindbeck, Assar, and Jörgen Weibull. 1993. “A Model of Political Equilibrium in a Representative Democracy.” Journal of Public Economics 51(2): 195-209.
Lodge, Tom. 1999. South African Politics Since 1994. Cape Town: David Philip Publishers.
Martinez-Bravo, Monica, Gerard Padró i Miquel, Nancy Qian and Yang Yao. 2012. “The Effects of Democratization on Public Goods and Redistribution: Evidence from China.” Unpublished manuscript.
Mattes, Robert B. 1995. The Election Book: Judgement and Choice in South Africa's 1994 Election. Cape Town: Idasa.
McCarty, Nolan M. 2000. “Presidential Pork, Executive Veto Power and Distributive Politics.” American Political Science Review 94(1): 117-129.
Meltzer, Allan H., and Scott F. Richard. 1981. “A Rational Theory of the Size of Government.” Journal of Political Economy 89(5): 914-927.
Michalopoulos, Stelios, and Elias Papaioannou. 2013. “Pre-colonial Ethnic Institutions and Contemporary African Development.” Econometrica 81(1): 113–152.
Miguel, Edward, and Farhan Zaidi. 2003. “Do Politicians Reward their Supporters? Regression Discontinuity Evidence from Ghana.” Unpublished manuscript.
Miller, Grant. 2008. “Women’s Suffrage, Political Responsiveness, and Child Survival in American History.” Quarterly Journal of Economics 123(3): 1287-1327.
Min, Brian. 2015. Power and the Vote: Elections and Electricity in the Developing World. New York, NY: Cambridge University Press.
Min, Brian, Kwawu M. Gaba, Ousmane F. Sarr, and Alassane Agalassou. 2013. “Detection of Rural Electrification in Africa using DMSP-OLS Night Lights Imagery.” International Journal of Remote Sensing 34(22): 8118-8141.
Munck, Gerardo L., and Jay Verkuilen. 2002. “Conceptualizing and Measuring Democracy: Evaluating Alternative Indices.” Comparative Political Studies 35(1): 5-34.
National Electricity Regulator. 2000. Lighting Up South Africa: A Century of Electricity Serving Humankind. Fichardt Park, South Africa: Open Hand Press.
Olken, Benjamin A. 2010. “Direct Democracy and Local Public Goods: Evidence from a Field Experiment in Indonesia.” American Political Science Review 104(2): 243-267.
Pettersson-Lidbom, Per. 2008. “Do Parties Matter for Economic Outcomes? A Regression-Discontinuity Approach.” Journal of the European Economic Association 6(5): 1037-1056.
30
Pinkovskiy, Maxim L. 2011. “Economic Discontinuities at Borders: Evidence from Satellite Data on Lights at Night.” Unpublished manuscript.
Qase, Nomawethu, Trevor Gaunt, Harald Winkler, Justice Mavhungu, Mark Borchers, Yaw Afrane-Okese, and Cecile Thom. 2001. National Electrification Programme Evaluation. Interim Outcomes Report: Programme Evaluations. Cape Town: Energy and Development Research Centre, University of Cape Town.
Reinikka, Ritva, and Jakob Svensson. 2004. “Local Capture: Evidence from a Central Government Transfer Program in Uganda.” Quarterly Journal of Economics 119(2): 679-705.
Ross, Michael. 2006. “Is Democracy Good for the Poor?” American Journal of Political Science 50(4): 860-874.
Skoufias, Emmanuel, Ambar Narayan, Basab Dasgupta, and Kai Kaiser. 2014. “Electoral Accountability and Local Government Spending in Indonesia.” World Bank Policy Research Working Paper 6782.
Southall, Roger. 1994. “The South African Elections of 1994: The Remaking of a Dominant-Party State.” Journal of Modern African Studies 32(4): 629-655.
Sparks, Allister. 1995. Tomorrow is Another Country: The Inside Story of South Africa's Negotiated Revolution. London: Heinemann.
Stasavage, David. 2005. “Democracy and Education Spending in Africa.” American Journal of Political Science 49(2): 343-358.
Stasavage, David, and Dambisa Moyo. 2000. “Are Cash Budgets a Cure for Excess Fiscal Deficits (and at What Cost)?” World Development 28(12): 2105-2122.
Statistics South Africa. 2005. Achieving a Better Life For All: Progress Between Census ’96 and Census 2001. Pretoria: Statistics South Africa.
Storeygard, Adam. 2012. “Farther on Down the Road: Transport Costs, Trade and Urban Growth in Sub-Saharan Africa.” World Bank Policy Research Working Paper 6444.
Vernby, Kåre. 2013. “Inclusion and Public Policy: Evidence from Sweden’s Introduction of Noncitizen Suffrage.” American Journal of Political Science 57(1): 15-29.
Weitz-Shapiro, Rebecca. 2012. “What Wins Votes: Why Some Politicians Opt Out of Clientelism.” American Journal of Political Science 56(3): 568-583.
Wittman, Donald. 1983. “Candidate Motivation: A Synthesis of Alternative Theories.” American Political Science Review 77(1): 142-157.
Zhang, Xiaobo, Shenggen Fan, Linxiu Zhang, and Jikun Huang. 2004. “Local Governance and Public Goods Provision in Rural China.” Journal of Public Economics 88(12): 2857-2871.
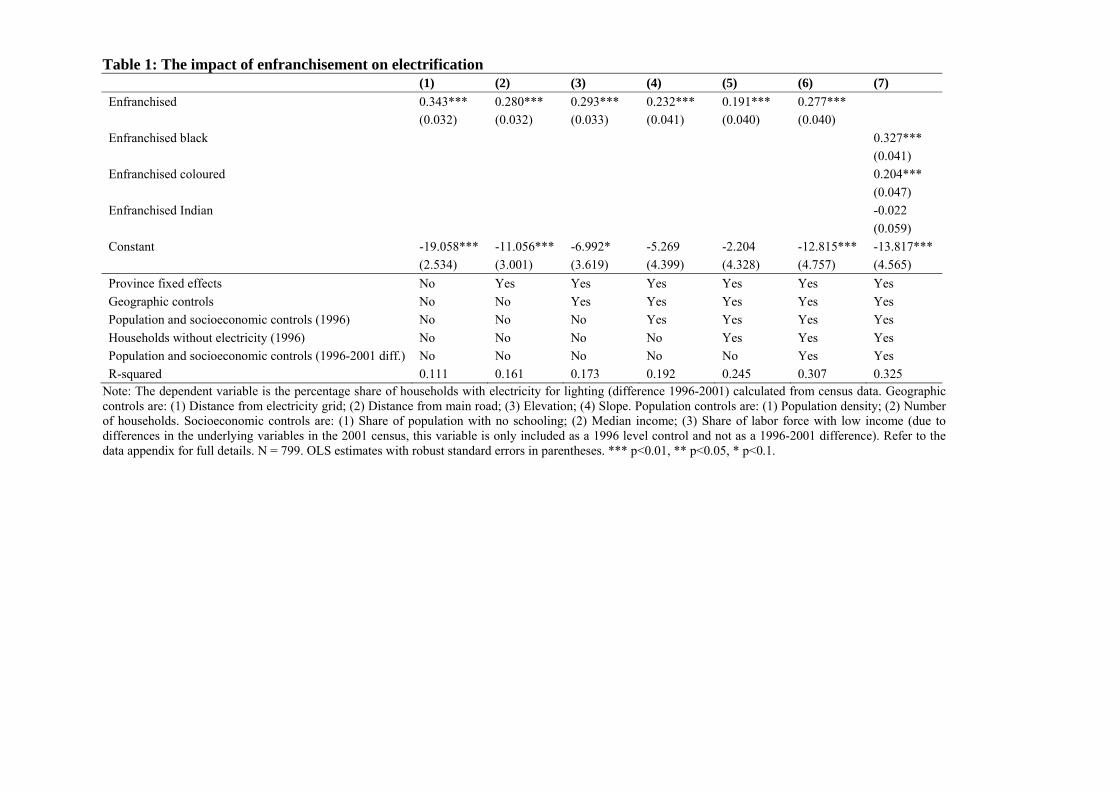
Table 1: The impact of enfranchisement on electrification (1) (2) (3) (4) (5) (6) (7)
Enfranchised 0.343*** 0.280*** 0.293*** 0.232*** 0.191*** 0.277***
(0.032) (0.032) (0.033) (0.041) (0.040) (0.040)
Enfranchised black 0.327***
(0.041)
Enfranchised coloured 0.204***
(0.047)
Enfranchised Indian -0.022
(0.059)
Constant -19.058*** -11.056*** -6.992* -5.269 -2.204 -12.815*** -13.817***
(2.534) (3.001) (3.619) (4.399) (4.328) (4.757) (4.565)
Province fixed effects No Yes Yes Yes Yes Yes Yes
Geographic controls No No Yes Yes Yes Yes Yes
Population and socioeconomic controls (1996) No No No Yes Yes Yes Yes
Households without electricity (1996) No No No No Yes Yes Yes
Population and socioeconomic controls (1996-2001 diff.) No No No No No Yes Yes
R-squared 0.111 0.161 0.173 0.192 0.245 0.307 0.325 Note: The dependent variable is the percentage share of households with electricity for lighting (difference 1996-2001) calculated from census data. Geographic controls are: (1) Distance from electricity grid; (2) Distance from main road; (3) Elevation; (4) Slope. Population controls are: (1) Population density; (2) Number of households. Socioeconomic controls are: (1) Share of population with no schooling; (2) Median income; (3) Share of labor force with low income (due to differences in the underlying variables in the 2001 census, this variable is only included as a 1996 level control and not as a 1996-2001 difference). Refer to the data appendix for full details. N = 799. OLS estimates with robust standard errors in parentheses. *** p<0.01, ** p<0.05, * p<0.1.
32
Table 2: Replication with satellite data and test for pre-existing trends (1) (2) (3) (4) (5) (6) (7)
a. Dependent variable: ΔNightlight 1996-2001
Enfranchised 0.064*** 0.063*** 0.066*** 0.092*** 0.088** 0.080**
(0.023) (0.024) (0.025) (0.034) (0.035) (0.037)
Enfranchised black 0.109***
(0.038)
Enfranchised coloured 0.041
(0.044)
Enfranchised Indian 0.015
(0.049)
b. Dependent variable: ΔNightlight 1992-1996
Enfranchised 0.068 0.029 0.037 0.047 0.059 -0.006
(0.052) (0.059) (0.056) (0.063) (0.064) (0.070)
Enfranchised black 0.007
(0.072)
Enfranchised coloured -0.026
(0.078)
Enfranchised Indian -0.078
(0.082)
Province fixed effects No Yes Yes Yes Yes Yes Yes
Geographic controls No No Yes Yes Yes Yes Yes
Population and socioeconomic controls (1996) No No No Yes Yes Yes Yes
Households without electricity (1996) No No No No Yes Yes Yes
Population and socioeconomic controls (1996-2001 diff.) No No No No No Yes Yes Note: The dependent variable is the percentage share of lit pixels (difference 1996-2001 and 1992-1996, respectively) calculated from satellite data. All regressions also include a constant. Refer to Table 1 for a description of control variables, and the data appendix for full details. N = 799. OLS estimates with robust standard errors in parentheses. *** p<0.01, ** p<0.05, * p<0.1.
33
Table 3: Matching contiguous census tracts from different municipalities (1) (2) (3) (4) (5) (6) (7)
Enfranchised 0.264*** 0.254*** 0.248*** 0.181*** 0.160*** 0.184*** (0.052) (0.057) (0.056) (0.056) (0.055) (0.056) Enfranchised black 0.250***
(0.064)
Enfranchised coloured -0.023
(0.081)
Enfranchised Indian 0.187**
(0.075)
Contiguous CT pair fixed effects Yes Yes Yes Yes Yes Yes Yes
Province fixed effects No Yes Yes Yes Yes Yes Yes
Geographic controls No No Yes Yes Yes Yes Yes
Population and socioeconomic controls (1996) No No No Yes Yes Yes Yes
Households without electricity (1996) No No No No Yes Yes Yes
Population and socioeconomic controls (1996-2001 diff.) No No No No No Yes Yes
R-squared (overall) 0.083 0.060 0.034 0.071 0.080 0.086 0.100
R-squared (within) 0.015 0.017 0.024 0.066 0.080 0.087 0.093 Note: The dependent variable is the percentage share of households with electricity for lighting (difference 1996-2001) calculated from census data. Refer to Table 1 for a description of control variables, and the data appendix for full details. All variables are calculated at the CT level, except Enfranchised and Enfranchised black/coloured/Indian, which are calculated at the municipality level. N = 7530. OLS estimates with standard errors in parentheses, double clustered (see Cameron et al. 2011) at the municipality and border levels. There are 688 clusters for municipalities and 1171 for borders. *** p<0.01, ** p<0.05, * p<0.1.
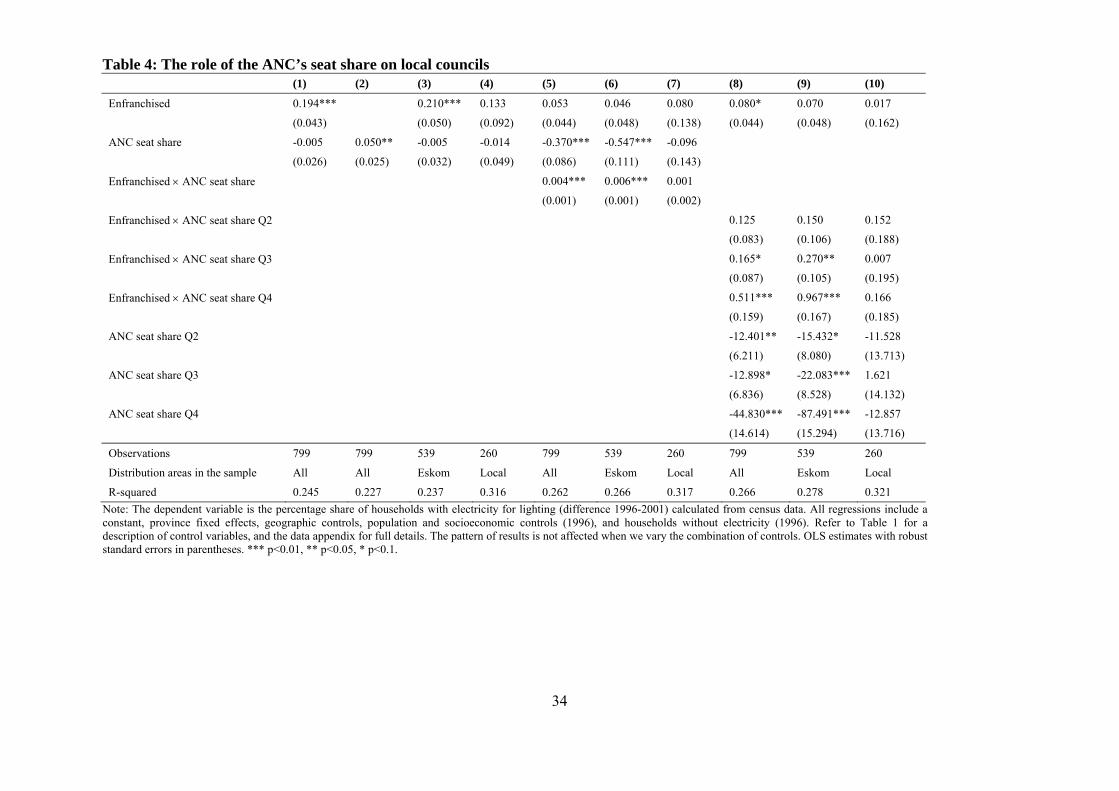
34
Table 4: The role of the ANC’s seat share on local councils (1) (2) (3) (4) (5) (6) (7) (8) (9) (10)
Enfranchised 0.194*** 0.210*** 0.133 0.053 0.046 0.080 0.080* 0.070 0.017
(0.043) (0.050) (0.092) (0.044) (0.048) (0.138) (0.044) (0.048) (0.162)
ANC seat share -0.005 0.050** -0.005 -0.014 -0.370*** -0.547*** -0.096
(0.026) (0.025) (0.032) (0.049) (0.086) (0.111) (0.143)
Enfranchised ANC seat share 0.004*** 0.006*** 0.001
(0.001) (0.001) (0.002)
Enfranchised ANC seat share Q2 0.125 0.150 0.152
(0.083) (0.106) (0.188)
Enfranchised ANC seat share Q3 0.165* 0.270** 0.007
(0.087) (0.105) (0.195)
Enfranchised ANC seat share Q4 0.511*** 0.967*** 0.166
(0.159) (0.167) (0.185)
ANC seat share Q2 -12.401** -15.432* -11.528
(6.211) (8.080) (13.713)
ANC seat share Q3 -12.898* -22.083*** 1.621
(6.836) (8.528) (14.132)
ANC seat share Q4 -44.830*** -87.491*** -12.857
(14.614) (15.294) (13.716)
Observations 799 799 539 260 799 539 260 799 539 260
Distribution areas in the sample All All Eskom Local All Eskom Local All Eskom Local
R-squared 0.245 0.227 0.237 0.316 0.262 0.266 0.317 0.266 0.278 0.321
Note: The dependent variable is the percentage share of households with electricity for lighting (difference 1996-2001) calculated from census data. All regressions include a constant, province fixed effects, geographic controls, population and socioeconomic controls (1996), and households without electricity (1996). Refer to Table 1 for a description of control variables, and the data appendix for full details. The pattern of results is not affected when we vary the combination of controls. OLS estimates with robust standard errors in parentheses. *** p<0.01, ** p<0.05, * p<0.1.
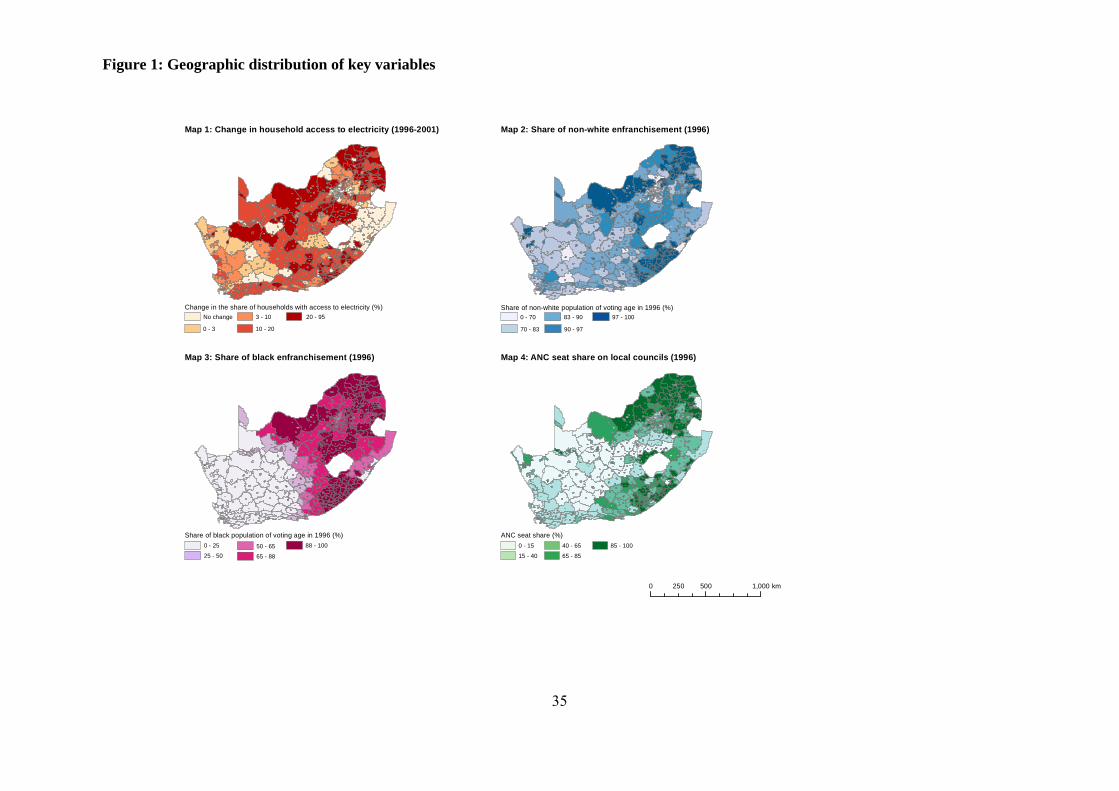
35
Figure 1: Geographic distribution of key variables
Map 1: Change in household access to electricity (1996-2001)
Map 4: ANC seat share on local councils (1996)Map 3: Share of black enfranchisement (1996)
Share of black population of voting age in 1996 (%)0 - 25
25 - 5050 - 65
65 - 88
88 - 100
Change in the share of households with access to electricity (%)No change
0 - 3
3 - 10
ANC seat share (%)0 - 15
15 - 40
40 - 65
65 - 85
85 - 100
Map 2: Share of non-white enfranchisement (1996)
Share of non-white population of voting age in 1996 (%)0 - 70
70 - 83
83 - 90
90 - 97
97 - 100
0 500 1,000250 km
10 - 20
20 - 95
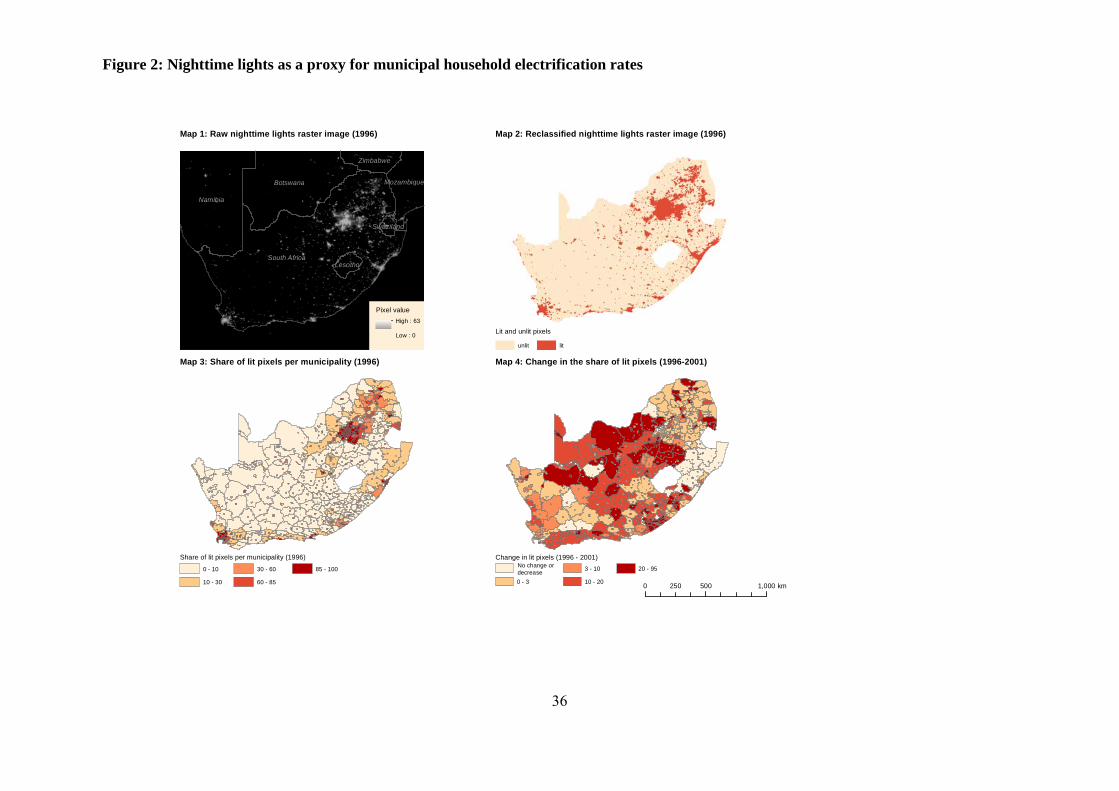
36
Figure 2: Nighttime lights as a proxy for municipal household electrification rates
South Africa
Namibia
Botswana
Zimbabwe
Mozambique
Lesotho
Swaziland
Map 1: Raw nighttime lights raster image (1996) Map 2: Reclassified nighttime lights raster image (1996)
Lit and unlit pixels
unlit lit
Change in lit pixels (1996 - 2001)
0 - 3
3 - 10
10 - 20
20 - 95
Map 3: Share of lit pixels per municipality (1996) Map 4: Change in the share of lit pixels (1996-2001)
Share of lit pixels per municipality (1996)
0 - 10
10 - 30
30 - 60
60 - 85
85 - 100
0 500 1,000250 km
Pixel value
Low : 0
High : 63
No change ordecrease
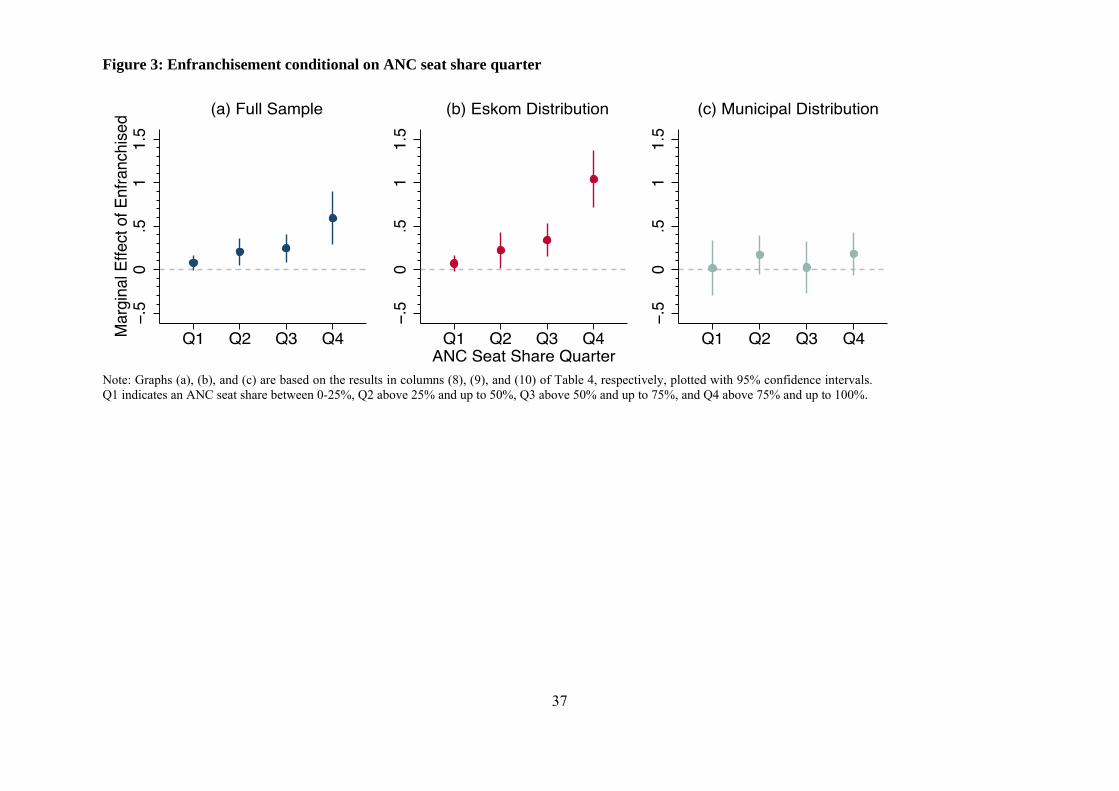
37
Figure 3: Enfranchisement conditional on ANC seat share quarter
Note: Graphs (a), (b), and (c) are based on the results in columns (8), (9), and (10) of Table 4, respectively, plotted with 95% confidence intervals. Q1 indicates an ANC seat share between 0-25%, Q2 above 25% and up to 50%, Q3 above 50% and up to 75%, and Q4 above 75% and up to 100%.
38
Supporting Information
A Better Life for All?
Democratization and Electrification in Post-Apartheid South Africa
Verena Kroth, Valentino Larcinese, and Joachim Wehner
London School of Economics and Political Science
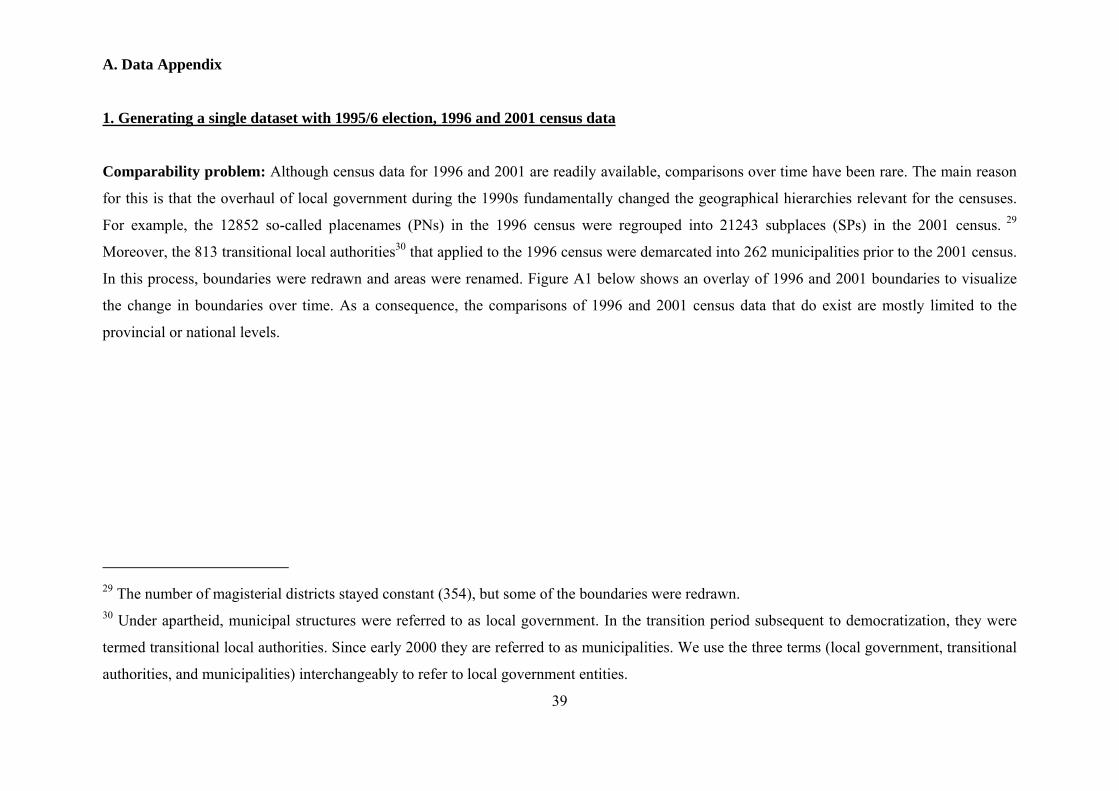
39
A. Data Appendix
1. Generating a single dataset with 1995/6 election, 1996 and 2001 census data
Comparability problem: Although census data for 1996 and 2001 are readily available, comparisons over time have been rare. The main reason
for this is that the overhaul of local government during the 1990s fundamentally changed the geographical hierarchies relevant for the censuses.
For example, the 12852 so-called placenames (PNs) in the 1996 census were regrouped into 21243 subplaces (SPs) in the 2001 census. 29
Moreover, the 813 transitional local authorities30 that applied to the 1996 census were demarcated into 262 municipalities prior to the 2001 census.
In this process, boundaries were redrawn and areas were renamed. Figure A1 below shows an overlay of 1996 and 2001 boundaries to visualize
the change in boundaries over time. As a consequence, the comparisons of 1996 and 2001 census data that do exist are mostly limited to the
provincial or national levels.
29 The number of magisterial districts stayed constant (354), but some of the boundaries were redrawn. 30 Under apartheid, municipal structures were referred to as local government. In the transition period subsequent to democratization, they were
termed transitional local authorities. Since early 2000 they are referred to as municipalities. We use the three terms (local government, transitional
authorities, and municipalities) interchangeably to refer to local government entities.
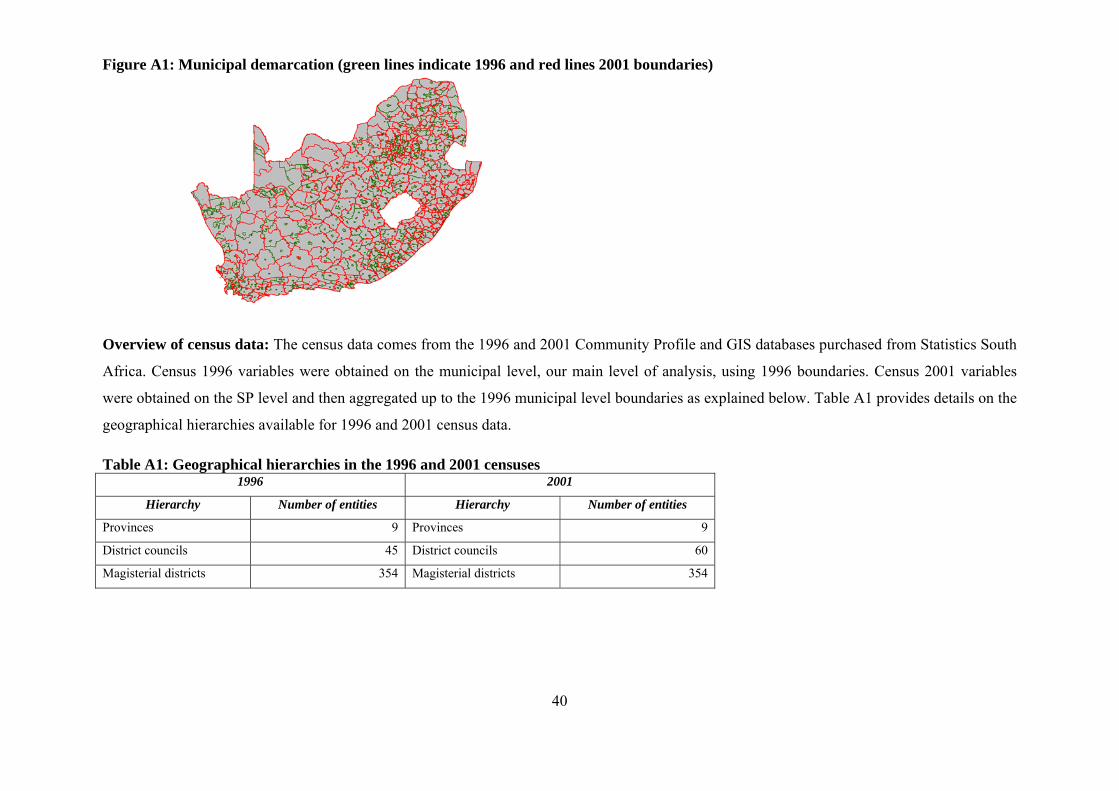
40
Figure A1: Municipal demarcation (green lines indicate 1996 and red lines 2001 boundaries)
Overview of census data: The census data comes from the 1996 and 2001 Community Profile and GIS databases purchased from Statistics South
Africa. Census 1996 variables were obtained on the municipal level, our main level of analysis, using 1996 boundaries. Census 2001 variables
were obtained on the SP level and then aggregated up to the 1996 municipal level boundaries as explained below. Table A1 provides details on the
geographical hierarchies available for 1996 and 2001 census data.
Table A1: Geographical hierarchies in the 1996 and 2001 censuses 1996 2001
Hierarchy Number of entities Hierarchy Number of entities
Provinces 9 Provinces 9
District councils 45 District councils 60
Magisterial districts 354 Magisterial districts 354
41
Transitional local
Authorities
81331 Municipalities 262
Placenames 12851 Main places 3109
Subplaces 21243
Generating 2001 census data for 1996 boundaries: In order to obtain 2001 census data on the 1996 municipal level, we carried out the
following steps. First, we extracted all variables based on the smallest geographical hierarchy in the 2001 census, i.e., 21243 SP units. Second, we
merged this data file with the corresponding SP shape file in ArcGIS based on the numerical code that uniquely identifies each SP in both the
shape file and the data file. Third, we assigned each 2001 SP to a 1996 municipality (799 polygons, also obtained from the StatsSA GIS database).
Fourth, we used ArcMap’s spatial join analysis tool (using the option “intersect”) to assign a polygon from the lower geographical hierarchy to the
higher level, if there is an intersection between the two. This method works best when the lower level geographical units are perfectly contained
within the higher-level geographical units. In the case of the South African census, most SP polygons are smaller than the municipality polygons
and are often fully contained within a higher-level polygon, as shown in Figure A2, Example 1. However, there are also several cases in which
2001 SPs cross the border of a 1996 municipality, as shown in Figure A2, Example 2. This introduces a double counting problem because the
spatial join / intersect method adds the attributes of the overlapping subplace to every municipality with which the subplace intersects. The
following explains how we address this.
31 The number of municipalities in the original shape file is 813. To see why we use 799 municipalities in our analysis, please refer to the
discussion on “Number of municipalities in 1996” below.
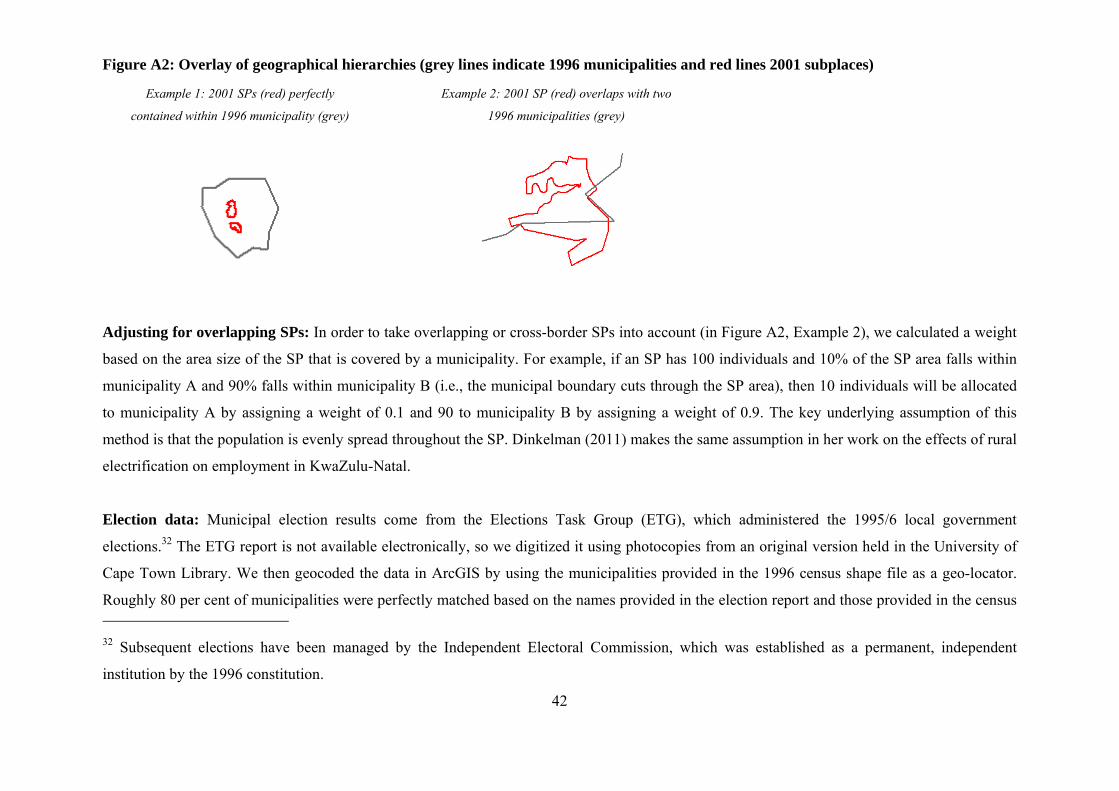
42
Figure A2: Overlay of geographical hierarchies (grey lines indicate 1996 municipalities and red lines 2001 subplaces)
Example 1: 2001 SPs (red) perfectly
contained within 1996 municipality (grey)
Example 2: 2001 SP (red) overlaps with two
1996 municipalities (grey)
Adjusting for overlapping SPs: In order to take overlapping or cross-border SPs into account (in Figure A2, Example 2), we calculated a weight
based on the area size of the SP that is covered by a municipality. For example, if an SP has 100 individuals and 10% of the SP area falls within
municipality A and 90% falls within municipality B (i.e., the municipal boundary cuts through the SP area), then 10 individuals will be allocated
to municipality A by assigning a weight of 0.1 and 90 to municipality B by assigning a weight of 0.9. The key underlying assumption of this
method is that the population is evenly spread throughout the SP. Dinkelman (2011) makes the same assumption in her work on the effects of rural
electrification on employment in KwaZulu-Natal.
Election data: Municipal election results come from the Elections Task Group (ETG), which administered the 1995/6 local government
elections.32 The ETG report is not available electronically, so we digitized it using photocopies from an original version held in the University of
Cape Town Library. We then geocoded the data in ArcGIS by using the municipalities provided in the 1996 census shape file as a geo-locator.
Roughly 80 per cent of municipalities were perfectly matched based on the names provided in the election report and those provided in the census
32 Subsequent elections have been managed by the Independent Electoral Commission, which was established as a permanent, independent
institution by the 1996 constitution.
43
shape file. The remaining 20 per cent were matched manually.33 The names in the shape file were adjusted in correspondence with the names in
the electoral report in order to avoid duplication during the merger. Finally, we assigned the electoral results to the 799 municipality polygons in
the 1996 census shape file.
Number of municipalities in 1996: The number of municipalities in our analysis is 799. In 1993, the Local Government Transition Act created
843 interim local government structures. Each of these belonged to one of three municipal categories: metropolitan, local, or district council.
However, in terms of both geography and local government representation these structures were not uniquely identified. For example, a district
council generally included more than one municipality. Our analysis focuses on municipalities that are uniquely identified in terms of both
geography and representation. Our dataset contains 14 municipalities less than the original shape file obtained from StatsSA, which shows 813
municipalities. This small discrepancy has various reasons. For instance, one municipality (Doringberg TRC) appears twice in the census shape
file, i.e., it has mistakenly been assigned to the same polygon twice, and some entities (e.g., Renovaal TLC, Vierfontein TLC) do not appear as
separate entries in the election results (Elections Task Group 1996).
33 The two main reasons for the absence of a perfect match between the names provided in the electoral report and the shape file are spelling
discrepancies and duplications. For example, the electoral report provides abbreviated versions of long names, which do not match perfectly with
the complete spelling embedded in the list of municipalities in the shape file. Another inconsistency between the two lists was that sometimes the
word “rural” forms part of the name of a transitional council and sometimes not. Duplicates included Middelberg Transitional Rural Council and
Middelberg Transitional Local Council, which are municipalities in Mpumalanga and the Eastern Cape. Richmond Transitional Local Council is
the name of a municipality in the Northern Cape as well as in KwaZulu-Natal.
44
2. Description of variables
Dependent variables:
Electricity. This variable is defined as the percentage share of households with access to electricity in a given municipality, based on the answer
“electricity” to the census question: “What type of energy/fuel does this household MAINLY use for lighting?” (as per section B, 2.1 and H-28 in
the 1996 and 2001 census household questionnaires respectively). We also have data on the type of energy used for cooking and heating, but these
are inferior proxies for electricity access (Statistics South Africa 2005: 144): “In the case of heating and cooking, use may be limited for reasons of
expense, both of the electricity itself and of appliances, so no conclusions can be drawn about access to electricity. The use of electricity for
lighting, however, can be taken as a proxy for access to at least some level of electricity.” As non-technical losses such as theft or illegal
connections were widespread, it is important to note that our dependent variable captures actual electricity use, not just connections and official
users (Statistics South Africa 2005: 144). Illegal connections might make it difficult to attribute electrification to Eskom or municipalities. Only
the 1996 census distinguishes municipal and Eskom connections from other connections. Less than 2% of households indicated they get electricity
from the latter in the 1996 census, and the “other connections” category was dropped from the 2001 census. This suggests that changes in
household access to electricity between 1996 and 2001, as captured by our key dependent variable, are overwhelmingly attributable to Eskom and
municipalities, either through new connections or, less likely, newly used old connections.
Source: Statistics South Africa, 1996 and 2001 Community Profiles and GIS databases.
Nightlight. We define Nightlight as the percentage share of lit pixels in a municipality. Lit pixels are identified using satellite images of the earth
at night collected with the Defense Meteorological Satellite Program’s Operational Linescan System (DMSP-OLS) and released by the National
Geophysical Data Center (NGDC) for the years from 1992. We use the annual composites of cloud-free, visible, stable lights that are cleaned up to
filter out fires and background noise to calculate Nightlight for the years 1992, 1996, and 2001. The calculations include the following steps,
45
which we apply to the raw nighttime lights rasters for the years 1992, 1996, and 2001:34 First, we convert the stable lights image into a binary grid,
where 1 represents pixels in which light is detected and 0 where no light is detected. This has the key advantage that instead of interpreting the
brightness of a pixel as light intensity, we use a binary variable that focuses on the presence or absence of light. This is important when comparing
images over time as the use of different satellites and thus sensors to obtain nighttime light images, raises concerns about their comparability over
time. Indeed, “satellites differ in their optical quality and may degrade over time” (Chen and Nordhaus 2010: 12) and there is no in-flight
calibration of the visible band on the OLS (Elvidge et al. 2013: 3). We perform the binary conversion by using the ArcGIS reclassify tool. Note
that there were no pixels with missing values in any of the years in South Africa. The resulting raster image is depicted in Map 2 in Figure 2 of the
manuscript. Second, we calculate zonal statistics using the municipal boundaries shape file. This produces a table in which the variable “count”
represents the number of pixels in a given municipality and the variable “sum” represents the sum of lit pixels in a given municipality. The ratio of
the two is therefore the share of lit pixels in a municipality, which yields our variable nightlight (see Map 3 in Figure 2 of the manuscript).
Source: http://www.ngdc.noaa.gov/dmsp/global_composites_v2.html
An alternative method is to combine nighttime lights with population rasters to calculate the share of the population in lit pixels (see Elvidge et al.
2010). While this variable is conceptually closer to our census-based measure, it relies on the accuracy of population rasters. Main sources for
population rasters are the US Department of Energy’s Landscan data and gridded population datasets from the Center for International Earth
Science Information Network (CIESIN). The former are based on daytime population counts using daily averages that capture populations on
roads and other public areas. They are available to us only from 2002 onwards. The latter have a resolution of 2.5’ and are thus less fine-grained
than the nighttime lights data. In our case, these data are unsuitable. In the South African context, daytime population counts at the local level
differ substantially from census data due the legacy of the Group Areas Act, which under apartheid forced non-whites to live in designated areas
often requiring long commutes to work (Christopher 1994). Moreover, we lack such data for the time period examined here. For these reasons, we
prefer to use only the nighttime images.
34 In 2001 two satellites recorded nighttime lights (F14 and F15), and in this case we use the average of the two images.
46
Parallel trends. As explained in the manuscript, one reason to proxy electrification with satellite images is that, in the absence of comparable
census data, they allow us to explore pre-existing trends. Here we report a preliminary graphical inspection of the Nightlight variable. In panel (a)
of Figure A3 we divide South African municipalities by tertiles of Enfranchised and plot the share of lit pixels for each tertile during the period
1992-2001. The vertical dotted line indicates the year 1996. Panel (b) shows separate trend lines for the periods before and after 1996. For all
tertiles, the increase in the share of lit pixels is steeper before 1996. The third tertile (high non-white population) grows slightly more than the
other two but overall trends appear very similar. After 1996, however, growth continues for the third tertile but much less so for the first and the
second. Only regression analysis can take into account confounding factors and properly assess the impact of pre-existing trends on our results.
This analysis is carried out in the main empirical section and reported in Table 2 of the paper.
Figure A3: Share of lit pixels by tertiles of newly enfranchised voters
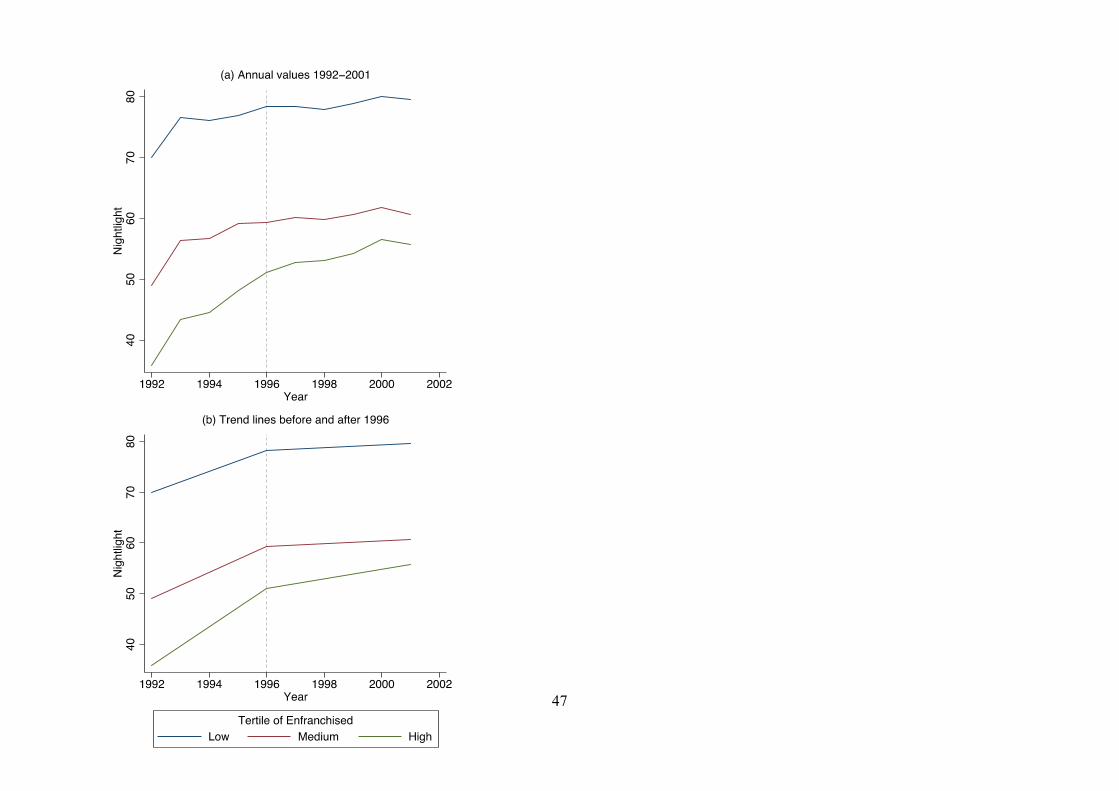
47
48
Independent variables:
Enfranchised. This variable is defined as the percentage share of newly enfranchised (i.e., non-white) citizens of voting age (18 or above) in the
municipal electorate in 1996. It is derived from a cross-tabulation of population group and age from the 1996 census. The variables Enfranchised
black, Enfranchised coloured, and Enfranchised Indian are subsets of Enfranchised that capture, respectively, the percentage share of black,
coloured, and Indian or Asian citizens of voting age. For the corresponding census questions see section A, 5 and P-06 in the census household
questionnaires used in 1996 and 2001 respectively.
Source: Statistics South Africa, 1996 and 2001 Community Profiles and GIS databases.
ANC seat share. This variable is defined as the percentage share of total seats on a given local council that were won by the African National
Congress in the 1995/6 elections. The related variables NP seat share and IFP seat share are defined as the percentage share of total seats won by
the National Party and the Inkatha Freedom Party respectively.
Source: Elections Task Group (1996).
Geographic controls:
Elevation. We calculate various descriptive statistics (mean, median, max, min, standard deviation, range) to determine the elevation of a given
municipality. We do so by using the zonal statistics tool in ArcGIS and obtain elevation indicators in meters above sea level. To obtain these
measures, we use the projected coordinate system “WGS 1984 UTM Zone 35S”. In our analysis, the variable elevation is the average municipal
elevation in meters above sea level.
Source: USGS (2004). Shuttle Radar Topography Mission, 1 ArcSecond scene SRTM_u03_n008e004, Unfilled Unfinished 2.0, Global Land
Cover Facility, University of Maryland, College Park, Maryland, February 2000.
49
Slope. In order to calculate the slope of a given municipality, we perform a surface analysis in ArcGIS and generate a new raster layer. We apply
the zonal statistics tool to this raster, using the municipality shape file and thus calculate various descriptive statistics (mean, median, max, min,
standard deviation, range) of slope in percent rise. These calculations are performed using the projected coordinate system “WGS 1984 UTM Zone
35S”.
Source: USGS (2004). Shuttle Radar Topography Mission, 1 ArcSecond scene SRTM_u03_n008e004, Unfilled Unfinished 2.0, Global Land
Cover Facility, University of Maryland, College Park, Maryland, February 2000.
Distance from electricity grid. This variable measures the shortest distance in kilometers between the centroid of a municipality and the South
African high-voltage power grid in 1996. This measure is calculated using the proximity tool in ArcGIS 10 using the municipality shape file and
power grid shape file, containing the geo-referenced high-voltage Eskom power lines in South Africa in 1996.
Source: Eskom (1997). Annual Report 1996. Johannesburg, Eskom.
Distance from main road. This variable measures the shortest distance in kilometers between the centroid of a municipality and the closest main
road in 1996. This measure is calculated using the proximity tool in ArcGIS 10 using the municipality shape file and the shape file of main roads
in 1996 included in the 1996 GIS database.
Source: Statistics South Africa, 1996 GIS databases.
Population controls:
Population density. We calculate this variable by dividing the total population in a given municipality, using 1996 and 2001 census data, by the
area of that municipality measured in square kilometers. The area is calculated using the area tool in ArcGIS 10 using the 1996 municipality shape
file.
Source: Statistics South Africa, 1996 and 2001 Community Profiles and GIS databases.
50
Number of households. This variable is the number of households living in a given municipality in 1996.
Source: Statistics South Africa, 1996 Community Profile.
Number of non-electrified households. This variable is defined as the number of households without access to electricity in a given municipality.
It counts the number of households in a municipality that do not answer “electricity” to the census question “What type of energy/fuel does this
household MAINLY use for lighting?” (see section B, 2.1 in the 1996 census household questionnaire).
Source: Statistics South Africa, 1996 Community Profile.
Socioeconomic controls:
Share of population with no schooling. This variable is the number of people aged five years or more with no schooling as a percentage of the
total population aged five years or more in a given municipality. For the census questions corresponding to schooling see section A, 16.1 and P-17
in the census household questionnaires in 1996 and 2001 respectively.
Source: Statistics South Africa, 1996 and 2001 Community Profiles.
Median income. This is the median household income in South African Rand (ZAR) in 1996 (nominal) and 2001 (real). Figures for the two years
were made comparable by inflation-adjusting the 2001 data using the Consumer Price Index (CPI). CPI base 2008 (i.e., equal to 100 in 2008) is
48.6 in 1996 and 66.1 in 2001, so we deflate 2001 income by dividing by 1.36. For the census questions corresponding to income see section A, 20
and P-22 in the census household questionnaires in 1996 and 2001 respectively.
Source: Statistics South Africa, 1996 and 2001 Community Profiles.
Share of labor force with low income. This variable is the share of individuals in the labor force earning less than 500 ZAR in 1996. Since data is
grouped in earning ranges and the two census rounds use different groupings, it was not possible to match 1996 and 2001 figures. Hence, we can
51
use the 1996 level variable in our regressions, but not the 1996-2001 difference. For the census questions corresponding to income see section A,
20 and P-22 in the census household questionnaires in 1996 and 2001 respectively.
Source: Statistics South Africa, 1996 Community Profiles.
52
3. Distinguishing Eskom and municipal electricity distribution areas
According to the Department of Minerals and Energy (2001: 5), “there were approximately 450 municipalities distributing electricity in 1991, but
the number has reduced to fewer than 250 as a result of the rationalisation of local authorities after 1994.” In 1995, the National Electricity
Regulator (NER 2000: 93) granted temporary distribution licenses to 362 municipalities. About a quarter of these made losses from their
distribution of electricity and lacked the means for large-scale electrification (Department of Minerals and Energy 1998: 43). To identify areas in
which Eskom would be likely to directly carry out electrification projects, we obtained the 1996 membership list from the Association of
Municipal Electricity Undertakings (AMEU). For each member, the list provides the address and name of the head of the electricity department of
a municipality. We use this information to approximate a split into municipal and Eskom distribution areas. Where the AMEU list indicates that a
city or town had its own electricity department, we code the relevant Metropolitan Local Council (MLC) or Transitional Local Council (TLC) as
having municipal distribution. In addition, we code any Transitional Rural Council (TRC) with the same name as a TLC identified from the
AMEU list as having municipal distribution, since “many [municipal distributors] also distribute electricity in adjacent rural areas” (Department of
Minerals and Energy 2001: 5), which makes them less likely to have to rely on Eskom. For instance, Stellenbosch is on the AMEU list, so in our
dataset both Stellenbosch TLC and Stellenbosch TRC are coded as having municipal distribution. We also make a small number of municipality-
specific coding decisions. The Lowveld and Escarpment Regional Services Council (later District Council) is on the AMEU list. It provided
services including electricity to and on behalf of a number of municipalities, several of which have separate entries on the AMEU list. We code all
municipalities that fall under it as having municipal distribution, as they did not have to rely on Eskom for electrification. Uitenhage, too, is on the
AMEU list, and we code it as part of the municipal distribution sample. Here, Eskom was involved in electrification, but through a joint venture
with the local authority (Qase et al. 2001). These choices are based on our best judgment about the degree of municipal accountability for
electrification. The pattern of results that we report does not change when we code these observations differently, or drop them from the analysis.
Our estimate is that municipal distributors were responsible for electrification in 260 municipalities in our dataset.
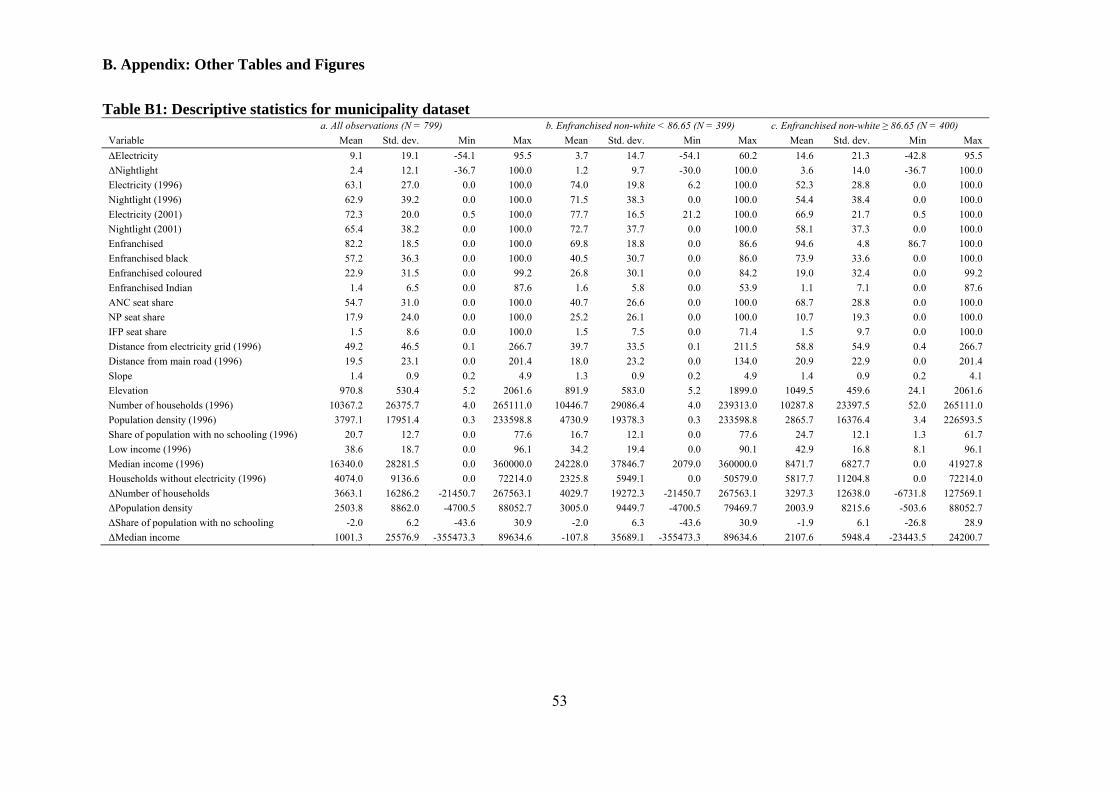
53
B. Appendix: Other Tables and Figures
Table B1: Descriptive statistics for municipality dataset
a. All observations (N = 799) b. Enfranchised non-white < 86.65 (N = 399) c. Enfranchised non-white ≥ 86.65 (N = 400)
Variable Mean Std. dev. Min Max Mean Std. dev. Min Max Mean Std. dev. Min Max
ΔElectricity 9.1 19.1 -54.1 95.5 3.7 14.7 -54.1 60.2 14.6 21.3 -42.8 95.5
ΔNightlight 2.4 12.1 -36.7 100.0 1.2 9.7 -30.0 100.0 3.6 14.0 -36.7 100.0
Electricity (1996) 63.1 27.0 0.0 100.0 74.0 19.8 6.2 100.0 52.3 28.8 0.0 100.0
Nightlight (1996) 62.9 39.2 0.0 100.0 71.5 38.3 0.0 100.0 54.4 38.4 0.0 100.0
Electricity (2001) 72.3 20.0 0.5 100.0 77.7 16.5 21.2 100.0 66.9 21.7 0.5 100.0
Nightlight (2001) 65.4 38.2 0.0 100.0 72.7 37.7 0.0 100.0 58.1 37.3 0.0 100.0
Enfranchised 82.2 18.5 0.0 100.0 69.8 18.8 0.0 86.6 94.6 4.8 86.7 100.0
Enfranchised black 57.2 36.3 0.0 100.0 40.5 30.7 0.0 86.0 73.9 33.6 0.0 100.0
Enfranchised coloured 22.9 31.5 0.0 99.2 26.8 30.1 0.0 84.2 19.0 32.4 0.0 99.2
Enfranchised Indian 1.4 6.5 0.0 87.6 1.6 5.8 0.0 53.9 1.1 7.1 0.0 87.6
ANC seat share 54.7 31.0 0.0 100.0 40.7 26.6 0.0 100.0 68.7 28.8 0.0 100.0
NP seat share 17.9 24.0 0.0 100.0 25.2 26.1 0.0 100.0 10.7 19.3 0.0 100.0
IFP seat share 1.5 8.6 0.0 100.0 1.5 7.5 0.0 71.4 1.5 9.7 0.0 100.0
Distance from electricity grid (1996) 49.2 46.5 0.1 266.7 39.7 33.5 0.1 211.5 58.8 54.9 0.4 266.7
Distance from main road (1996) 19.5 23.1 0.0 201.4 18.0 23.2 0.0 134.0 20.9 22.9 0.0 201.4
Slope 1.4 0.9 0.2 4.9 1.3 0.9 0.2 4.9 1.4 0.9 0.2 4.1
Elevation 970.8 530.4 5.2 2061.6 891.9 583.0 5.2 1899.0 1049.5 459.6 24.1 2061.6
Number of households (1996) 10367.2 26375.7 4.0 265111.0 10446.7 29086.4 4.0 239313.0 10287.8 23397.5 52.0 265111.0
Population density (1996) 3797.1 17951.4 0.3 233598.8 4730.9 19378.3 0.3 233598.8 2865.7 16376.4 3.4 226593.5
Share of population with no schooling (1996) 20.7 12.7 0.0 77.6 16.7 12.1 0.0 77.6 24.7 12.1 1.3 61.7
Low income (1996) 38.6 18.7 0.0 96.1 34.2 19.4 0.0 90.1 42.9 16.8 8.1 96.1
Median income (1996) 16340.0 28281.5 0.0 360000.0 24228.0 37846.7 2079.0 360000.0 8471.7 6827.7 0.0 41927.8
Households without electricity (1996) 4074.0 9136.6 0.0 72214.0 2325.8 5949.1 0.0 50579.0 5817.7 11204.8 0.0 72214.0
ΔNumber of households 3663.1 16286.2 -21450.7 267563.1 4029.7 19272.3 -21450.7 267563.1 3297.3 12638.0 -6731.8 127569.1
ΔPopulation density 2503.8 8862.0 -4700.5 88052.7 3005.0 9449.7 -4700.5 79469.7 2003.9 8215.6 -503.6 88052.7
ΔShare of population with no schooling -2.0 6.2 -43.6 30.9 -2.0 6.3 -43.6 30.9 -1.9 6.1 -26.8 28.9
ΔMedian income 1001.3 25576.9 -355473.3 89634.6 -107.8 35689.1 -355473.3 89634.6 2107.6 5948.4 -23443.5 24200.7
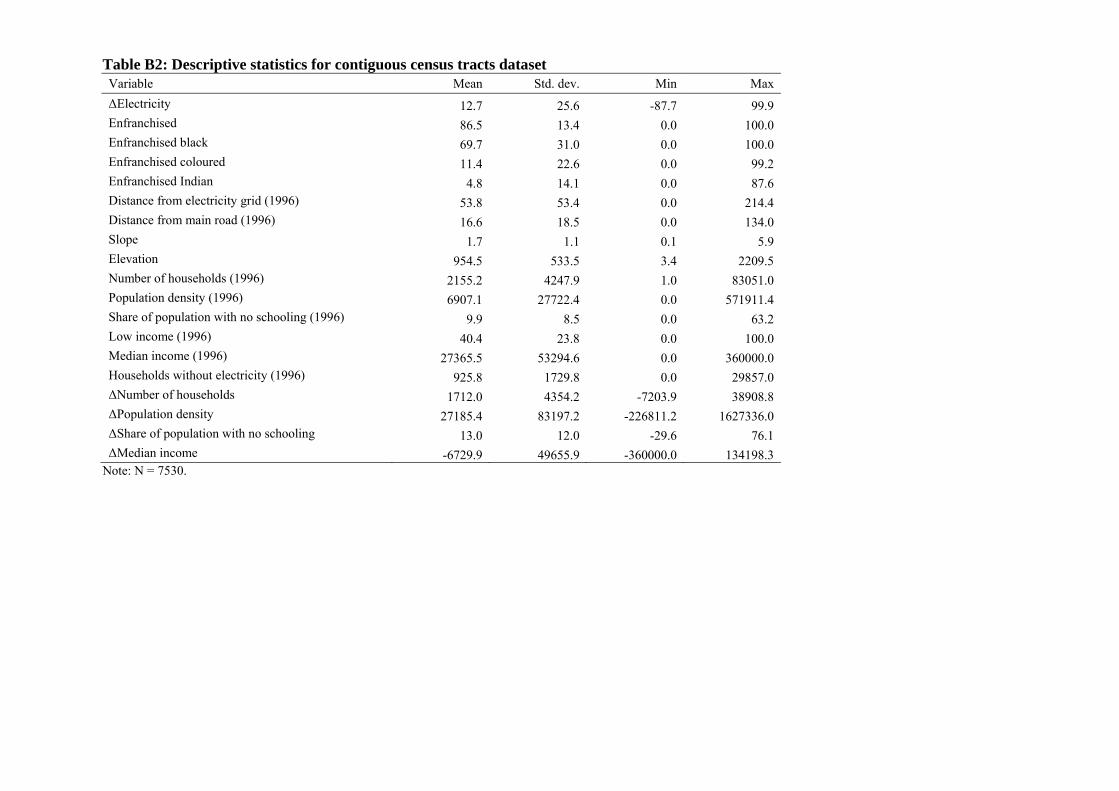
Table B2: Descriptive statistics for contiguous census tracts dataset Variable Mean Std. dev. Min Max
ΔElectricity 12.7 25.6 -87.7 99.9 Enfranchised 86.5 13.4 0.0 100.0 Enfranchised black 69.7 31.0 0.0 100.0 Enfranchised coloured 11.4 22.6 0.0 99.2 Enfranchised Indian 4.8 14.1 0.0 87.6 Distance from electricity grid (1996) 53.8 53.4 0.0 214.4 Distance from main road (1996) 16.6 18.5 0.0 134.0 Slope 1.7 1.1 0.1 5.9 Elevation 954.5 533.5 3.4 2209.5 Number of households (1996) 2155.2 4247.9 1.0 83051.0 Population density (1996) 6907.1 27722.4 0.0 571911.4 Share of population with no schooling (1996) 9.9 8.5 0.0 63.2 Low income (1996) 40.4 23.8 0.0 100.0 Median income (1996) 27365.5 53294.6 0.0 360000.0 Households without electricity (1996) 925.8 1729.8 0.0 29857.0 ΔNumber of households 1712.0 4354.2 -7203.9 38908.8 ΔPopulation density 27185.4 83197.2 -226811.2 1627336.0 ΔShare of population with no schooling 13.0 12.0 -29.6 76.1 ΔMedian income -6729.9 49655.9 -360000.0 134198.3
Note: N = 7530.
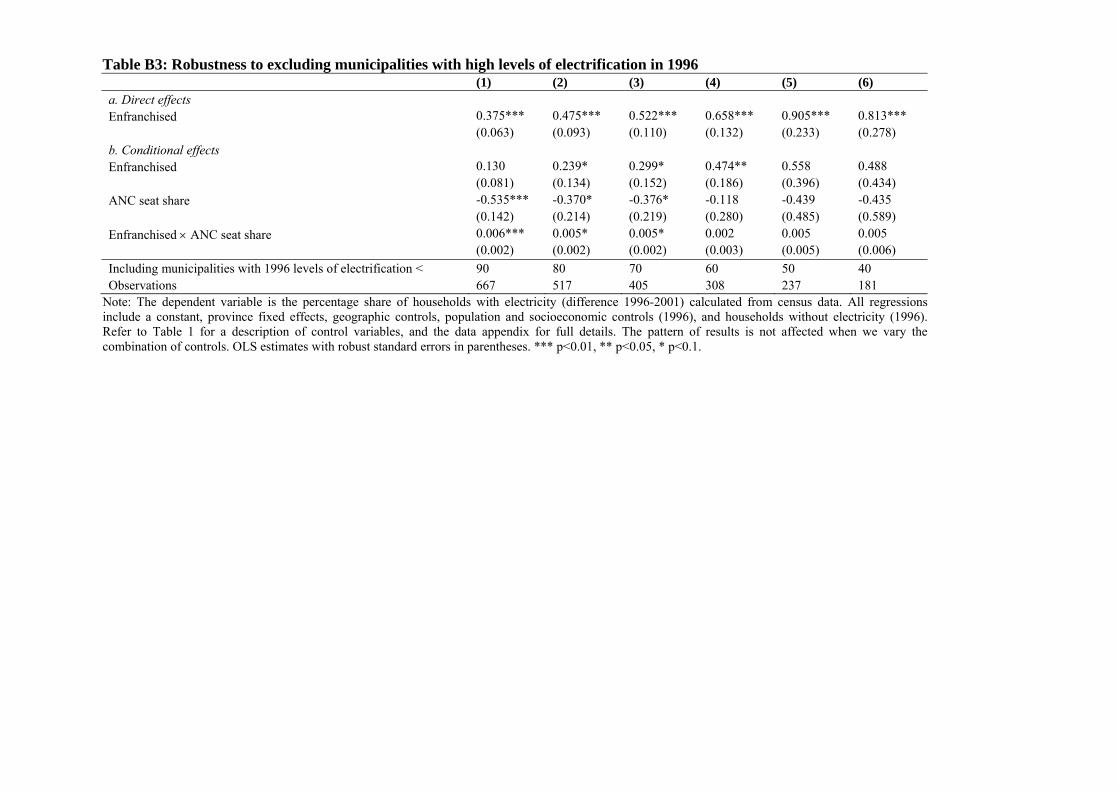
Table B3: Robustness to excluding municipalities with high levels of electrification in 1996 (1) (2) (3) (4) (5) (6) a. Direct effects Enfranchised 0.375*** 0.475*** 0.522*** 0.658*** 0.905*** 0.813*** (0.063) (0.093) (0.110) (0.132) (0.233) (0.278) b. Conditional effects Enfranchised 0.130 0.239* 0.299* 0.474** 0.558 0.488 (0.081) (0.134) (0.152) (0.186) (0.396) (0.434) ANC seat share -0.535*** -0.370* -0.376* -0.118 -0.439 -0.435 (0.142) (0.214) (0.219) (0.280) (0.485) (0.589)
Enfranchised ANC seat share 0.006*** 0.005* 0.005* 0.002 0.005 0.005 (0.002) (0.002) (0.002) (0.003) (0.005) (0.006)
Including municipalities with 1996 levels of electrification < 90 80 70 60 50 40 Observations 667 517 405 308 237 181
Note: The dependent variable is the percentage share of households with electricity (difference 1996-2001) calculated from census data. All regressions include a constant, province fixed effects, geographic controls, population and socioeconomic controls (1996), and households without electricity (1996). Refer to Table 1 for a description of control variables, and the data appendix for full details. The pattern of results is not affected when we vary the combination of controls. OLS estimates with robust standard errors in parentheses. *** p<0.01, ** p<0.05, * p<0.1.
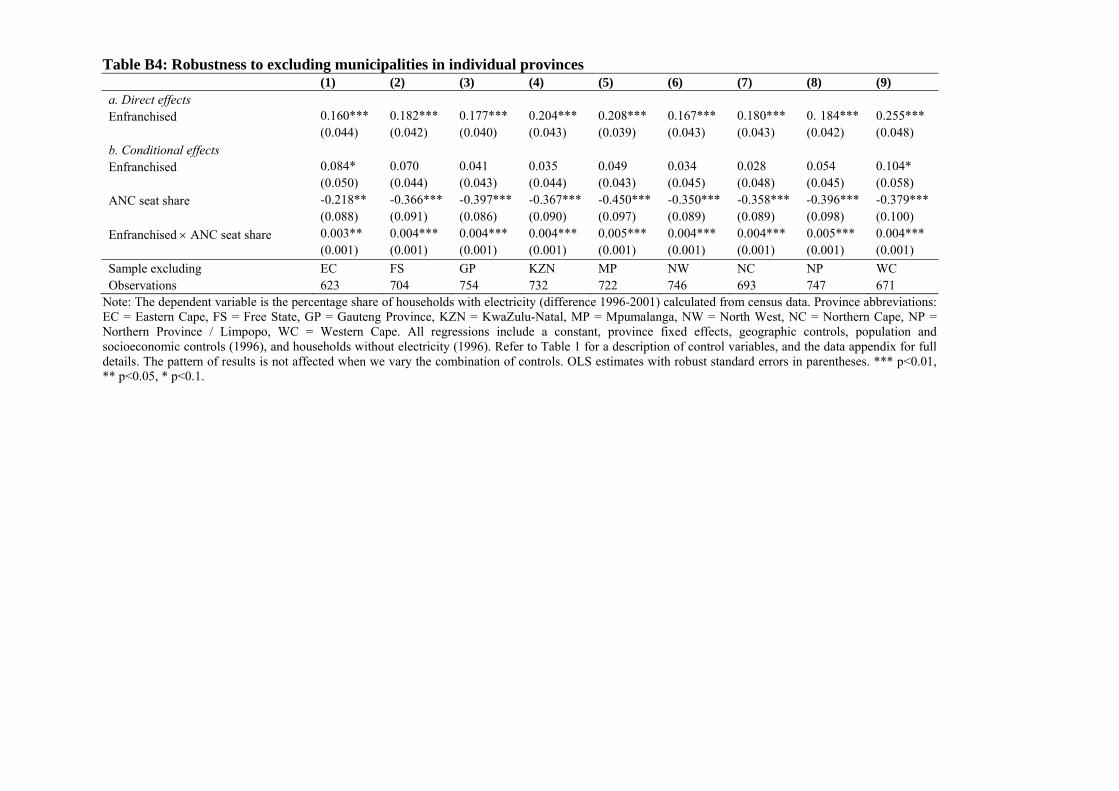
Table B4: Robustness to excluding municipalities in individual provinces (1) (2) (3) (4) (5) (6) (7) (8) (9) a. Direct effects Enfranchised 0.160*** 0.182*** 0.177*** 0.204*** 0.208*** 0.167*** 0.180*** 0. 184*** 0.255*** (0.044) (0.042) (0.040) (0.043) (0.039) (0.043) (0.043) (0.042) (0.048) b. Conditional effects Enfranchised 0.084* 0.070 0.041 0.035 0.049 0.034 0.028 0.054 0.104* (0.050) (0.044) (0.043) (0.044) (0.043) (0.045) (0.048) (0.045) (0.058) ANC seat share -0.218** -0.366*** -0.397*** -0.367*** -0.450*** -0.350*** -0.358*** -0.396*** -0.379*** (0.088) (0.091) (0.086) (0.090) (0.097) (0.089) (0.089) (0.098) (0.100)
Enfranchised ANC seat share 0.003** 0.004*** 0.004*** 0.004*** 0.005*** 0.004*** 0.004*** 0.005*** 0.004*** (0.001) (0.001) (0.001) (0.001) (0.001) (0.001) (0.001) (0.001) (0.001)
Sample excluding EC FS GP KZN MP NW NC NP WC Observations 623 704 754 732 722 746 693 747 671
Note: The dependent variable is the percentage share of households with electricity (difference 1996-2001) calculated from census data. Province abbreviations: EC = Eastern Cape, FS = Free State, GP = Gauteng Province, KZN = KwaZulu-Natal, MP = Mpumalanga, NW = North West, NC = Northern Cape, NP = Northern Province / Limpopo, WC = Western Cape. All regressions include a constant, province fixed effects, geographic controls, population and socioeconomic controls (1996), and households without electricity (1996). Refer to Table 1 for a description of control variables, and the data appendix for full details. The pattern of results is not affected when we vary the combination of controls. OLS estimates with robust standard errors in parentheses. *** p<0.01, ** p<0.05, * p<0.1.
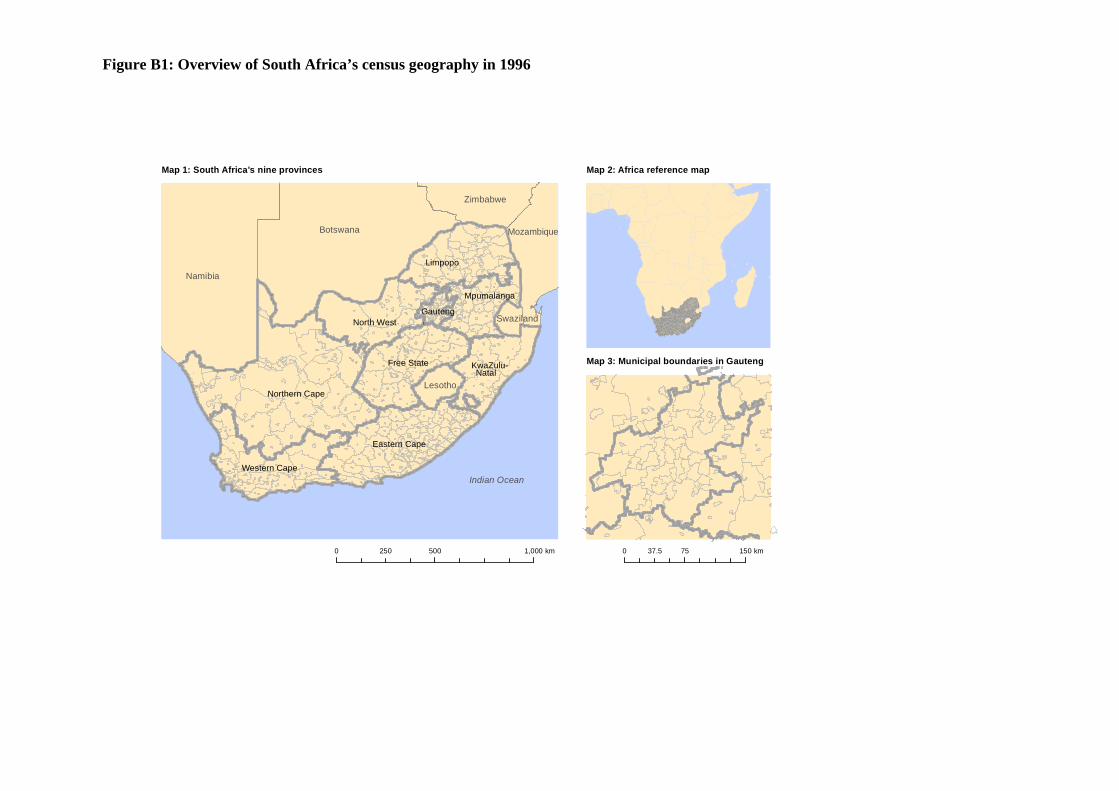
Figure B1: Overview of South Africa’s census geography in 1996
Namibia
Botswana
Zimbabwe
Mozambique
Lesotho
Swaziland
Northern Cape
Western Cape
Eastern Cape
KwaZulu-Natal
Gauteng
Limpopo
North West
Mpumalanga
Free State
Indian Ocean
0 500 1,000250 km 0 75 15037.5 km
Map 1: South Africa's nine provinces Map 2: Africa reference map
Map 3: Municipal boundaries in Gauteng
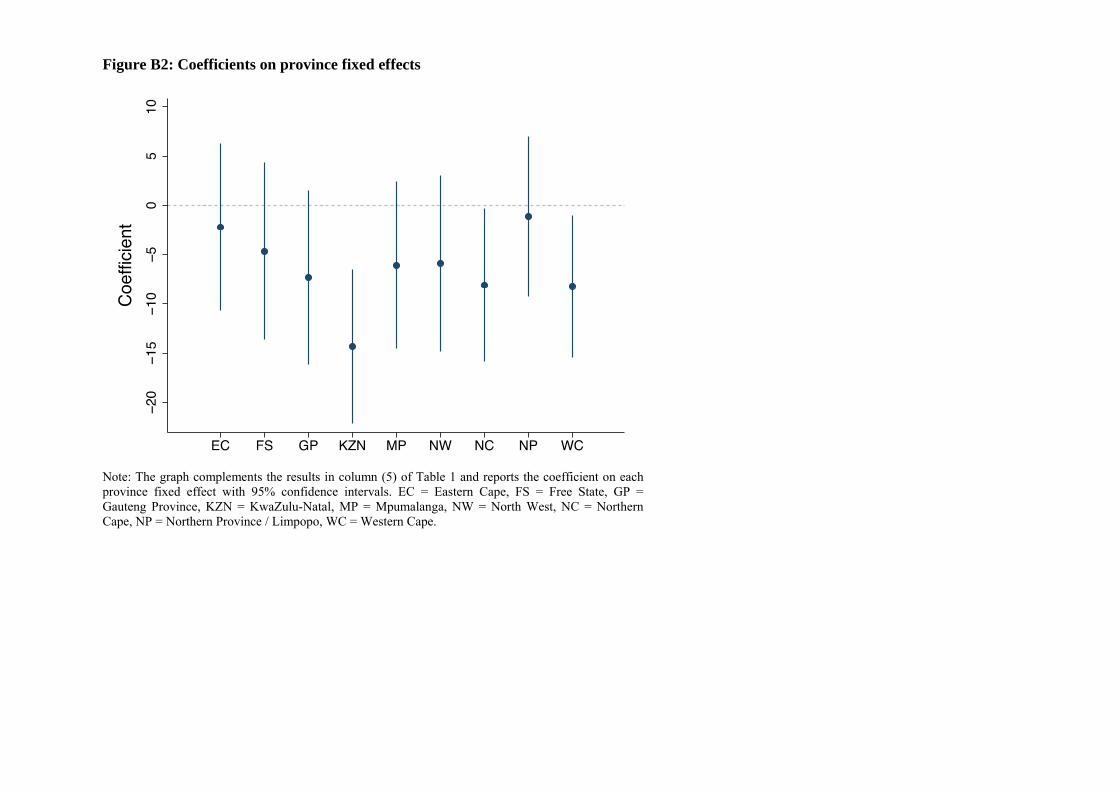
Figure B2: Coefficients on province fixed effects
Note: The graph complements the results in column (5) of Table 1 and reports the coefficient on each province fixed effect with 95% confidence intervals. EC = Eastern Cape, FS = Free State, GP = Gauteng Province, KZN = KwaZulu-Natal, MP = Mpumalanga, NW = North West, NC = Northern Cape, NP = Northern Province / Limpopo, WC = Western Cape.
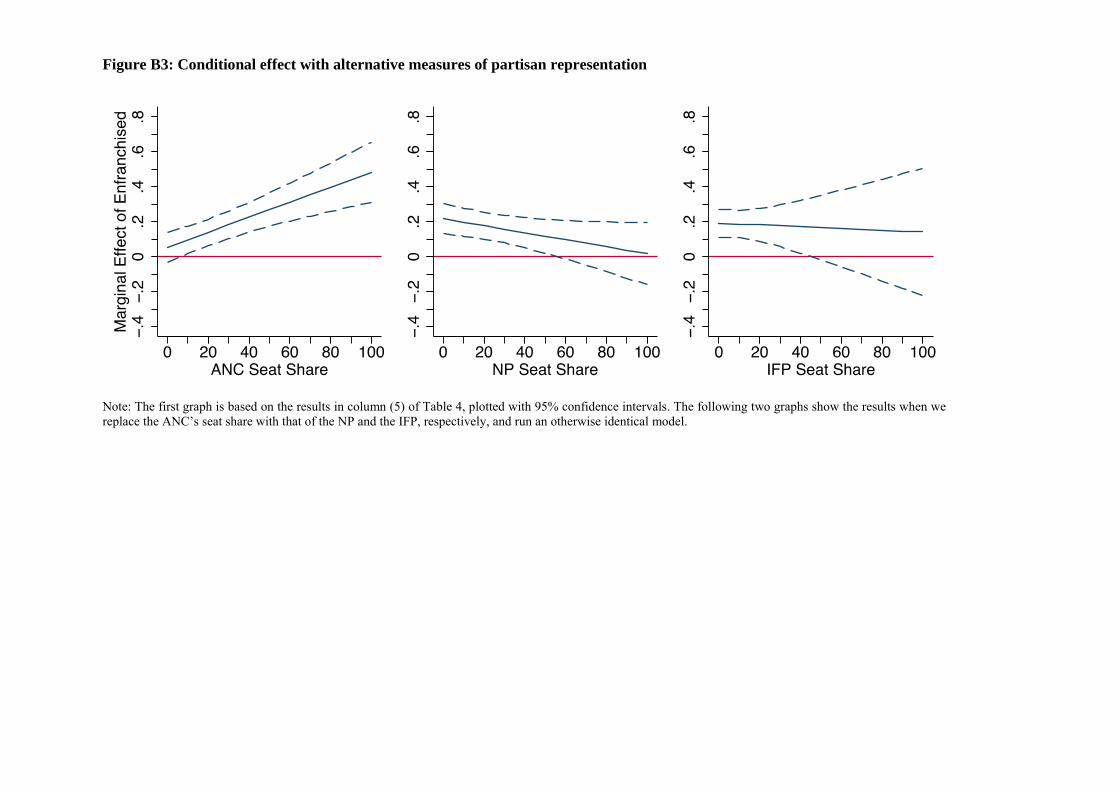
Figure B3: Conditional effect with alternative measures of partisan representation
Note: The first graph is based on the results in column (5) of Table 4, plotted with 95% confidence intervals. The following two graphs show the results when we replace the ANC’s seat share with that of the NP and the IFP, respectively, and run an otherwise identical model.