demographic and economic trends in rural … and economic trends in rural ... presentation for hud...
TRANSCRIPT

1
The views expressed are those of the author and should not be attributed to the Economic Research Service or USDA.
Demographic and Economic Trends in Rural America
John Cromartie—Geographer, ERS-USDATom Hertz—Economist, ERS-USDA
Lorin Kusmin—Economist, ERS-USDA
Presentation for HUD Rural Gateway Peer-to-Peer Call
September 28, 2016
The views expressed are those of the authors and should not be attributed to the Economic Research Service or USDA

2
The views expressed are those of the author and should not be attributed to the Economic Research Service or USDA.
Outline
• Demographic Characteristics and Trends in Rural Areas (John Cromartie)
• Rural and Urban Labor Market Trends Since 2007 (Tom Hertz)
• Educational Attainment in Rural And Urban Areas (Lorin Kusmin)
• Rural Trends by County Economic Type (Lorin Kusmin)

3
The views expressed are those of the author and should not be attributed to the Economic Research Service or USDA.
An opportunity to discuss what makes rural America unique demographically
• Slower population growth
• Older population age structure, caused by two very different trends
• Higher poverty rates, especially for children
• Lower racial-ethnic diversity, but regionally concentrated
In this presentation, ‘rural’ and ‘urban’ are synonymous with nonmetropolitan and metropolitan counties, respectively.

4
The views expressed are those of the author and should not be attributed to the Economic Research Service or USDA.
Population growth rates have been consistently lower in rural America and the gap widened considerably after the housing-market collapse and the
Great Recession.
4
What happened to long-term drivers of rural population growth?
• Rural counties adjacent to urban areas, in the path of suburbanization, stopped growing for the first time in decades.
• Rapid population growth in rural retirement and recreation destinations diminished substantially.
• Over 100 manufacturing-dependent counties began losing population since the recession.

5
The views expressed are those of the author and should not be attributed to the Economic Research Service or USDA.
Rural counties make up 85 percent of all older-age counties
5
Two sides to rural aging:
1. Retiree attraction, usually to more scenic areas
2. Persistent population loss, because out-migration consists mostly of young adults
Rural elderly in persistent population loss counties are poorer than elderly in retirement destinations, even though overall poverty is higher in retirement destinations

6
The views expressed are those of the author and should not be attributed to the Economic Research Service or USDA.
The vast majority of high-poverty counties are not only rural but are regionally concentrated
6
Rural regions of entrenched poverty divide along racial-ethnic lines:
• Predominantly white Appalachia
• African-Americans in the rural South
• Native Americans in the West and in Alaska
• Hispanics in the Southwest
Rural areas are less diverse overall, but it clearly depends on where you are looking.

7
The views expressed are those of the author and should not be attributed to the Economic Research Service or USDA.
Hispanic population growth is the only source of population growth in many
rural communities.
7
• Over 1,300 rural counties lost population in recent years (shown in light yellow)
• Hispanic population growth kept another 200 counties from losing population (shown in blue)
• Most Hispanic population growth now comes from natural increase, not immigration or domestic migration

8
The views expressed are those of the author and should not be attributed to the Economic Research Service or USDA.
Both Urban and Rural Unemployment Rates Have Nearly Returned to Pre-Recession Levels
Source: USDA-ERS analysis of Local Area Unemployment Statistics data.
Note: Shaded area indicates recession.
0
2
4
6
8
10
12
1 2 3 4 1 2 3 4 1 2 3 4 1 2 3 4 1 2 3 4 1 2 3 4 1 2 3 4 1 2 3 4 1 2 3 4 1 2
2007 2008 2009 2010 2011 2012 2013 2014 2015 2016
Un
em
plo
yme
nt
Rat
e (
Pe
rce
nt)
Urban Rural

9
The views expressed are those of the author and should not be attributed to the Economic Research Service or USDA.
But Rural Employment is Still Below Pre-Recession Level
Source: USDA-ERS analysis of Local Area Unemployment Statistics data.
Note: Shaded area indicates recession.
94
95
96
97
98
99
100
101
102
103
104
105
1 2 3 4 1 2 3 4 1 2 3 4 1 2 3 4 1 2 3 4 1 2 3 4 1 2 3 4 1 2 3 4 1 2 3 4 1 2
2007 2008 2009 2010 2011 2012 2013 2014 2015 2016
Emp
loym
ent
Ind
ex (
20
08
Q1
=1
00
)
Urban
Rural

10
The views expressed are those of the author and should not be attributed to the Economic Research Service or USDA.
The Reason Unemployment is Falling Faster Than Employment is Rising is that Many Have Left the Labor Force
Source: USDA-ERS analysis of Local Area Unemployment Statistics data.
Note: Shaded area indicates recession.
58%
59%
60%
61%
62%
63%
64%
65%
66%
67%
68%
1 2 3 4 1 2 3 4 1 2 3 4 1 2 3 4 1 2 3 4 1 2 3 4 1 2 3 4 1 2 3 4 1 2 3 4 1 2
2007 2008 2009 2010 2011 2012 2013 2014 2015 2016
Shar
e o
f A
du
lts
(16
+) in
Lab
or
Forc
e
Urban Rural
11
The views expressed are those of the author and should not be attributed to the Economic Research Service or USDA.
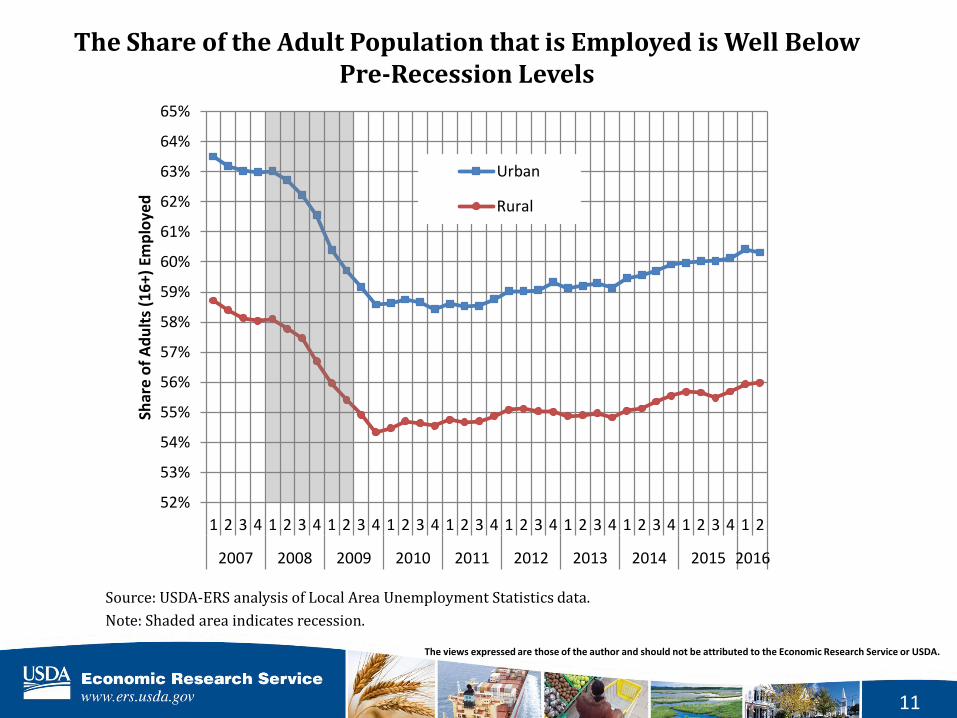
The Share of the Adult Population that is Employed is Well Below Pre-Recession Levels
Source: USDA-ERS analysis of Local Area Unemployment Statistics data.
Note: Shaded area indicates recession.
52%
53%
54%
55%
56%
57%
58%
59%
60%
61%
62%
63%
64%
65%
1 2 3 4 1 2 3 4 1 2 3 4 1 2 3 4 1 2 3 4 1 2 3 4 1 2 3 4 1 2 3 4 1 2 3 4 1 2
2007 2008 2009 2010 2011 2012 2013 2014 2015 2016
Shar
e o
f A
du
lts
(16
+) E
mp
loye
d
Urban
Rural
12
The views expressed are those of the author and should not be attributed to the Economic Research Service or USDA.
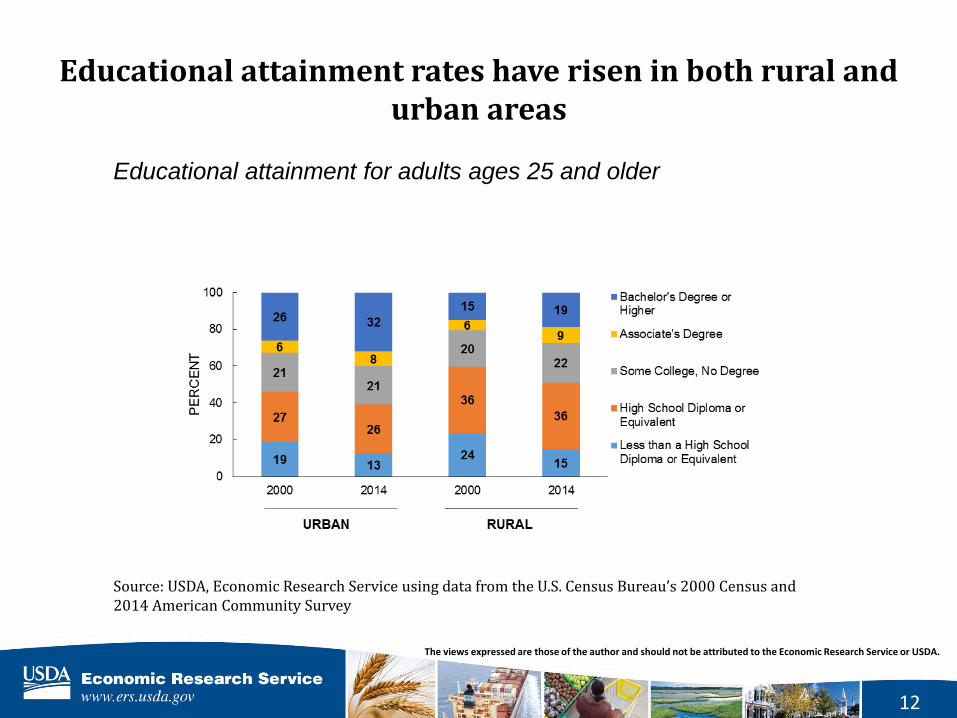
Source: USDA, Economic Research Service using data from the U.S. Census Bureau’s 2000 Census and 2014 American Community Survey
Educational attainment for adults ages 25 and older
Educational attainment rates have risen in both rural and urban areas

13
The views expressed are those of the author and should not be attributed to the Economic Research Service or USDA.
Educational attainment is associated with higher earnings, but the returns to education are greater in urban areas
Source: USDA, Economic Research Service using data from the U.S. Census Bureau 2014 American Community Survey

14
The views expressed are those of the author and should not be attributed to the Economic Research Service or USDA.
Educational attainment reduces the risk of unemployment
Rural Unemployment Rates by Educational
Attainment, Adults Ages 25-64
Source: USDA, Economic Research Service using data from the U.S. Census Bureau, Current Population Surveys, 2007-14

15
The views expressed are those of the author and should not be attributed to the Economic Research Service or USDA.
Rural counties vary in their economic structure with marked regional differences
Other nonmetro (821 counties)
Metropolitan 2013
Economic type, 2010-12
Farming (391 counties)
Mining (183 counties)
Manufacturing (351 counties)
Recreation (225 counties)
Source: USDA, Economic Research Service, based on Bureau of Economic Analysis local area data files

16
The views expressed are those of the author and should not be attributed to the Economic Research Service or USDA.
Rural recreation county population grew in the early 2000s but leveled off after the Great Recession
90
92
94
96
98
100
102
104
106
108
110
2000 2001 2002 2003 2004 2005 2006 2007 2008 2009 2010 2011 2012 2013 2014 2015
Non-specialized Farming Mining Manufacturing Recreation
Source: Economic Research Service based on county population estimates from U.S. Census Bureau.
Note: Values for all years reflect classification of counties in 2015 ERS County Typology codes.

17
The views expressed are those of the author and should not be attributed to the Economic Research Service or USDA.
Rural median household incomes were highest in recreation counties
$40,000
$41,000
$42,000
$43,000
$44,000
$45,000
$46,000
$47,000
$48,000
$49,000
$50,000
2007 2008 2009 2010 2011 2012 2013 2014
Me
dia
n H
ou
seh
old
Inco
me
(2
01
4 d
olla
rs)
Year
Nonspecialized Farm dependent Mining dependent Manufacturing dependent Government dependent Recreation
Source: Economic Research Service estimates based on Small Area Income and Poverty Estimates data sets. Note: medians shown are the population-
weighted median value of county median household income for the indicated county type: that is, one-half of those who live in this type of county are in a
county with a lower median household income, and one-half are in a county with a higher median household income. Note: in constant 2014 dollars, deflated
by CPI.

18
The views expressed are those of the author and should not be attributed to the Economic Research Service or USDA.
Questions?
Contacts:
John Pender – [email protected]
John Cromartie – [email protected]
Tom Hertz – [email protected]
Lorin Kusmin – [email protected]
ERS website: www.ers.usda.gov