demographic change in new zealand’s dairy farming industry ... · demographic change in new...
TRANSCRIPT
New Zealand Population Review, 39:77-99. Copyright © 2013 Population Association of New Zealand
Demographic Change in New Zealand’s Dairy Farming Industry: The need for a cohort perspective
NATALIE JACKSON *
Abstract
Despite a handful of studies identifying the opposite, there is an often-repeated proposition that the average age of New Zealand’s dairy farmers is somewhat greater and increasing faster than for most other New Zealand industries. This paper argues that part of the misconception is methodological, related to the failure to take a cohort perspective. Declining numbers at younger ages are interpreted as reflecting reduced entry and low rates of retention per se, while increasing numbers and proportions at older ages are interpreted as stoic farmers remaining at their posts. However similar age-structural changes are evident for the total population, reflecting the movement of Baby Boom cohorts through the age structure. This paper uses a cohort perspective to show that New Zealand’s older dairy industry workers (the majority of whom are dairy farmers and farm workers) are in fact somewhat less likely to remain in the industry than the average older worker, and that there is both recruitment and retention at younger and middle ages – albeit at lower numbers than in the past.
here is a general and often-repeated proposition that the average age of New Zealand’s dairy farmers is somewhat greater and increasing faster than those employed in most other New Zealand
industries, and that this mirrors the case in Australia (Amshoff & Reed, 2005) and further afield (ABI/Inform, 2000; Cole & Donovan, 2008; Penn, 2013). The perception is not without substance, in that the average age of New Zealand’s dairy farmers has increased from just below 38 years in 1986 to just above 40 years in 2006, although it had also been just on 40 years in 1971 (Fairweather & Mulet-Marquis, 2009, p. 122). Nevertheless, in 2006 dairy farmers had the youngest average age and the smallest increase in average age of the four farming occupations in the Fairweather & Mulet-Marquis study. * Professor of Demography and Director, National Institute of Demographic and Economic Analysis, University of Waikato. Email: [email protected].
T
78 Jackson
Part of the misconception is argued to reflect the uncritical use of industry rather than occupational data, the former including both on-farm and off-farm workers (Tipples & Wilson, 2005, p.41). Using occupational data, Wilson and Tipples (2008) do provide a comprehensive approximation of trends over time (1991-2006). However, even occupational data have a number of limitations, such as difficulties in interpreting the contribution of internal migration to farming age structures, because the census only captures present occupation, not that at the time of the previous census (Tipples & Wilson, 2005, p.42). Underlying change in both occupational and industrial classification also makes rigorous time-series analysis difficult (Fairweather & Mulet-Marquis 2009, p. 120). A further contributing factor can be the focus of the article or study itself. Studies that are concerned with, for example, stress among farmers (Firth, Williams, Herbison & McGee, 2007), as opposed to a socio-demographic profile (Wilson & Tipples, 2008), ask different questions of the data.
Asking different questions of industry data is the focus of this paper. As will be shown, dairy industry data imply an average age in 2006 of 40.9 years, up from 38.8 in 1996, very similar to that for the occupational data referred to above. They also show an almost identical increase in proportions aged 55 years or older, and reduction at younger ages. Total industry data also show similar trends in terms of ageing, because of the large “Baby Boom” cohorts working their way through the age structure. That is, the ageing of the farming industry may not be occurring only because of diminishing numbers of young entering it, low retention rates at younger ages, and/or older farmers remaining at their post (Tipples & Wilson, 2005, p.42; Fairweather & Mulet-Marquis, 2009, p. 122), but may also reflect underlying age-structure change. Subjecting the data to cohort analysis, in fact, shows that New Zealand’s older dairy industry workers are somewhat less likely to remain in the industry than the average older worker, and that there is both recruitment and retention at younger and middle ages, albeit at lower numbers than in the past.
The information is important because the idea of a “hyper-ageing” dairy industry could well challenge another significant and long-held perception, that of New Zealand’s farmers as highly innovative and entrepreneurial. This paper provides a brief overview of the changing demography, adding cohort analysis to the relatively limited New Zealand
Demographic change in New Zealand’s dairy farming industry 79
literature on the topic, and concluding with the proposition that an important rejuvenation is occurring in the industry.
Data Source, Methods and Key Concepts
As indicated above, the trends referred to throughout this paper pertain to the dairy industry and not to farmers or farm workers per se. In 2001, only 75 percent of those employed in the dairy industry were actually on-farm dairy farmers or farm workers (Tipples & Wilson, 2005, p.41). However, the dairy industry also includes critically important allied occupations, such as Herd-Testing and Artificial Breeding, while specifically excluding those engaged in allied industries such as Dairy Product Manufacturing and Services to Agriculture. Allied occupations are equally a mainstay of the dairy industry, and while it would be preferable to undertake an occupation-based analysis that showed their separate impacts (author, forthcoming), word constraints preclude such an approach in this paper. Accordingly, this paper takes a middle road wherein the majority of the analysis is disaggregated by employment status – self-employed without employees, employers, and paid employees, and these cross-sectional data from three censuses (1996, 2001 and 2006) are converted to longitudinal data to examine cohorts as they have aged.
The study draws on two census-based data sources: number employed in the dairy cattle farming industry (ANZSIC96 V4.1 code A013) by age, sex and status in employment; and number employed in the dairy cattle farming industry by age and country of birth. In both cases the data have been aggregated by Statistics New Zealand to be internally consistent by the ANZSIC code at 3-digit level for the 1996, 2001, 2006 Censuses. The analysis is undertaken for total New Zealand only, while it should be noted that there is marked underlying regional variation (Wilson & Tipples, 2008) that our cohort database confirms.
Simple distributional statistics are supported by a cohort analysis to show the extent to which there has been attrition from or augmentation to each birth cohort employed in the industry across the 1996–2006 period. The analysis therefore uses ‘open’ cohorts to allow for movement into and out of each cohort. Gain to a cohort may occur because of immigration (either international or from another industry), or from new members entering the employed labour force or the specified employment status;
80 Jackson
losses may reflect emigration to another country or industry, out of the employed labour force//employment status, or death. Using country of birth (COB) data, the cohort analysis is further developed to identify the extent to which any augmentation may reflect international migration gain (international loss cannot be ascertained as people living overseas at the time of the census do not fill in the form). However, it should be noted that our COB data cannot be definitive of migration gain, because they do not indicate length of residency – that is, some individuals born overseas may have arrived in New Zealand as children.
Three ‘ageing indicators’ are referred to. Structural ageing refers to the proportion of persons employed in the industry aged 55+ years, and numerical ageing to the absolute increase in numbers aged 55+ years. The entry:exit ratio (EE1) denotes the number of persons employed in the industry aged 15-24 years per person aged 55+ years.
Key Trends
Between 1996 and 2006, the number employed in New Zealand’s dairy industry declined by 5 percent, from 35,289 to 33,501. This resulted in the industry’s decline from 8th to 16th largest industry at the 3-digit level (which enumerates 157 industries). By comparison, the total employed workforce increased by 18.1 percent, from 1.63 to 1.98 million. Although the majority of the decline in the dairy industry occurred between 2001 and 2006, the industry had fallen to 10th position by 2001, due to the ascendancy of two other industries (Marketing and Business Management, and Community Care).
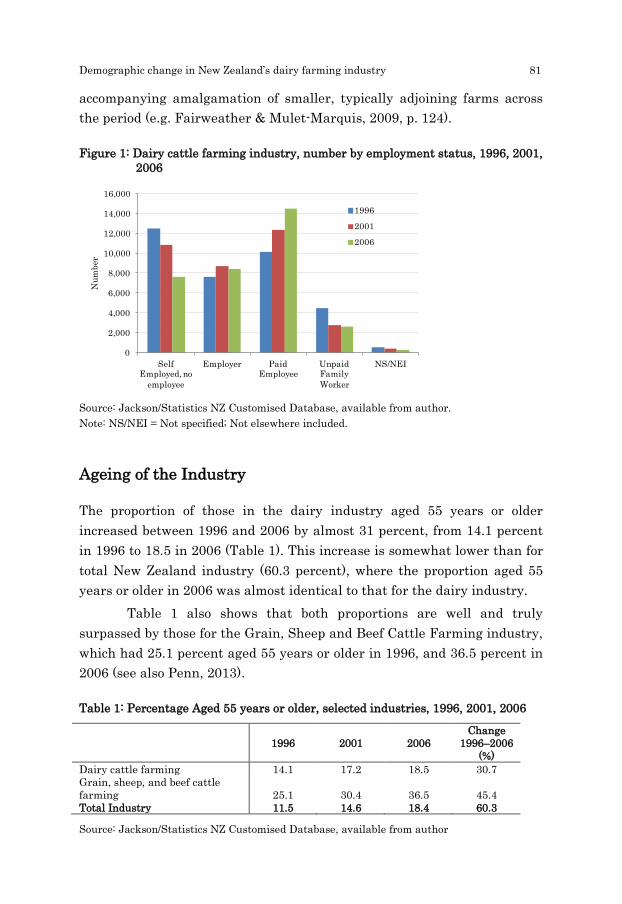
A second significant shift occurred in the employment status of the industry (Figure 1). Between 1996 and 2006 there was a systematic decline in the number self-employed with no employees, and a concomitant increase in the number of paid employees (see also Wilson & Tipples (2008) for the period 1991-2006). In 1996, self-employed with no employees outnumbered paid employees by more than 2300, while by 2006, paid employees outnumbered the self-employed by almost 7000. The number of employers also increased, but only slightly, and declined fractionally between 2001 and 2006. These trends reflect widely observable changes in the industry, with the move to significantly larger operations and
Demographic change in New Zealand’s dairy farming industry 81
accompanying amalgamation of smaller, typically adjoining farms across the period (e.g. Fairweather & Mulet-Marquis, 2009, p. 124).
Figure 1: Dairy cattle farming industry, number by employment status, 1996, 2001, 2006
Source: Jackson/Statistics NZ Customised Database, available from author. Note: NS/NEI = Not specified; Not elsewhere included.
Ageing of the Industry
The proportion of those in the dairy industry aged 55 years or older increased between 1996 and 2006 by almost 31 percent, from 14.1 percent in 1996 to 18.5 in 2006 (Table 1). This increase is somewhat lower than for total New Zealand industry (60.3 percent), where the proportion aged 55 years or older in 2006 was almost identical to that for the dairy industry.
Table 1 also shows that both proportions are well and truly surpassed by those for the Grain, Sheep and Beef Cattle Farming industry, which had 25.1 percent aged 55 years or older in 1996, and 36.5 percent in 2006 (see also Penn, 2013).
Table 1: Percentage Aged 55 years or older, selected industries, 1996, 2001, 2006
1996 2001 2006
Change 1996–2006
(%) Dairy cattle farming 14.1 17.2 18.5 30.7 Grain, sheep, and beef cattle farming 25.1 30.4 36.5 45.4 Total Industry 11.5 14.6 18.4 60.3
Source: Jackson/Statistics NZ Customised Database, available from author
0
2,000
4,000
6,000
8,000
10,000
12,000
14,000
16,000
Self Employed, no
employee
Employer Paid Employee
Unpaid Family Worker
NS/NEI
Num
ber
1996
2001
2006
82 Jackson
Table 2 gives similar data for each employment status in terms of average age. In 2006 the average age of those employed in the dairy industry was 40.9 years, against 47.8 years for the grain, sheep and beef industry, and 41.1 years for the total employed workforce. Between 1996 and 2006, the average age of dairy industry employers (the industry’s oldest category) increased by the smallest margin overall (5.6 percent), while the average age of paid employees (the industry’s youngest category) increased by the greatest margin (12.9 percent).
Table 2: Average age by employment status, selected industries, 1996, 2001, 2006
Average Age (years) Change 1996-2006
N
(years) % Dairy cattle farming Self employed, no employee 41.9 44.7 46.2 4.2 10.1 Employer 44.5 46.2 47.0 2.5 5.6 Paid employee 29.8 31.8 33.6 3.8 12.9 Unpaid family worker 41.0 42.9 46.0 5.0 12.2 TOTAL 38.8 40.4 40.9 2.1 5.3 Grain, sheep and beef cattle farming Self employed, no employee 48.5 50.9 52.9 4.4 9.1 Employer 48.5 50.0 51.4 3.0 6.2 Paid employee 36.1 37.6 39.2 3.1 8.6 Unpaid family worker 45.0 47.7 50.5 5.5 12.2 TOTAL 44.0 46.1 47.8 3.9 8.8 Total (all-industry) Self employed, no employee 44.5 46.6 47.9 3.3 7.5 Employer 44.8 46.8 47.7 2.9 6.4 Paid employee 36.4 38.1 39.1 2.8 7.6 Unpaid family worker 43.1 44.9 47.0 3.9 9.0 TOTAL 38.2 40.0 41.1 2.9 7.5 Source: Jackson/Statistics NZ Customised Database, available from author. Area of Usual Residence, Industry (ANZSIC96 V4.1) and Status in Employment by Age Group and Sex for the Employed Census Usually Resident Population Count Aged 15+ Years, 1996, 2001, 2006. Notes: calculations have been rounded to nearest decimal point.
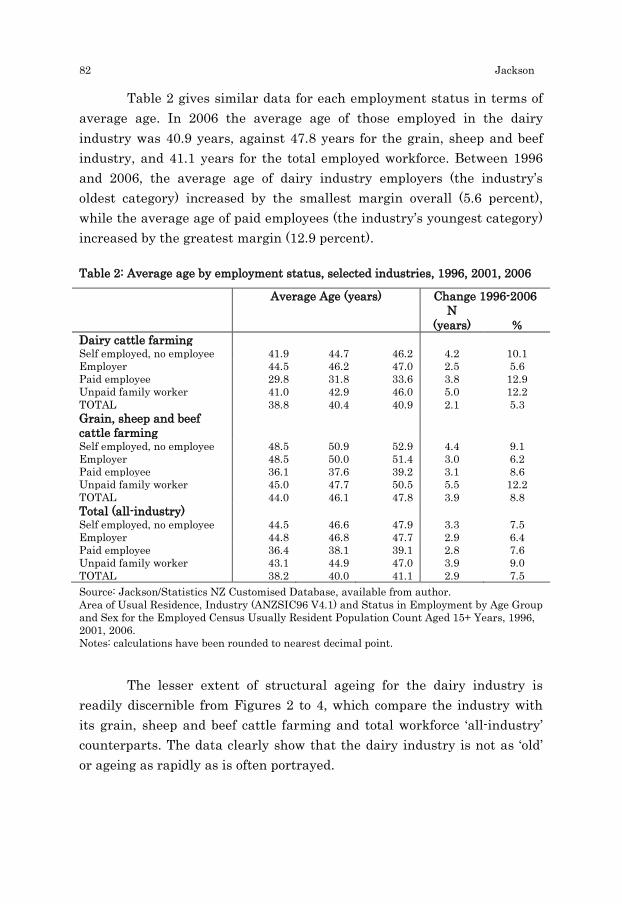
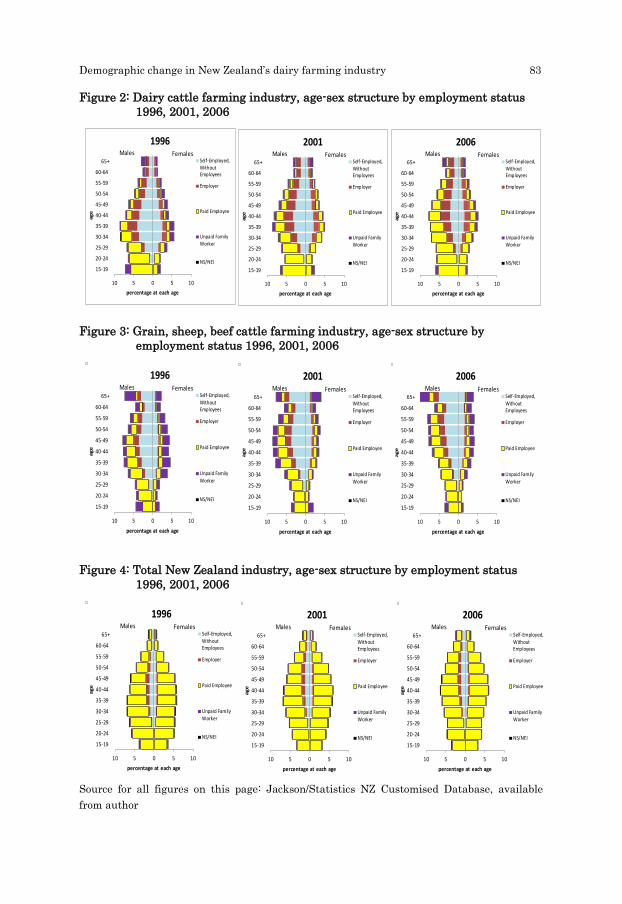
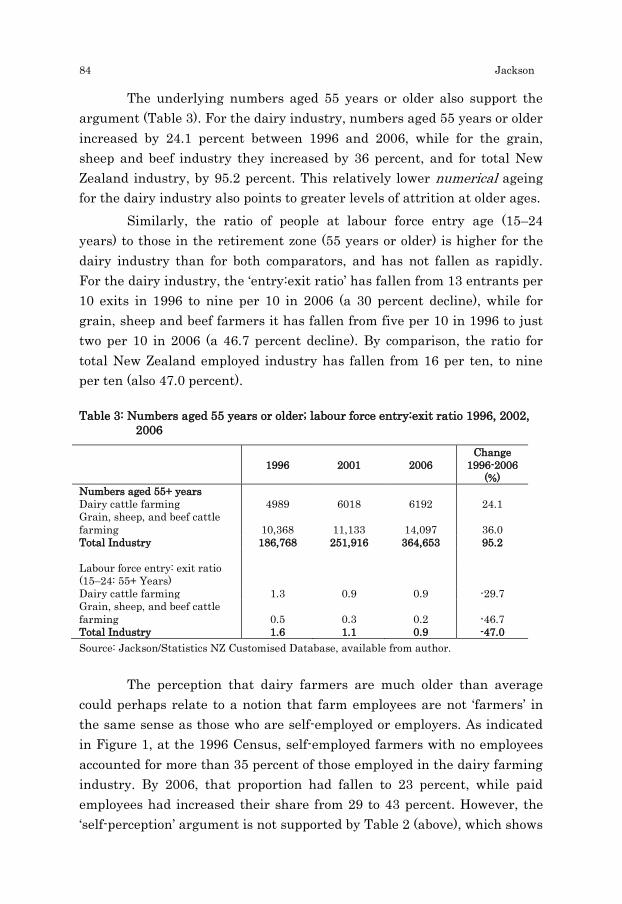
The lesser extent of structural ageing for the dairy industry is
readily discernible from Figures 2 to 4, which compare the industry with its grain, sheep and beef cattle farming and total workforce ‘all-industry’ counterparts. The data clearly show that the dairy industry is not as ‘old’ or ageing as rapidly as is often portrayed.
Demographic change in New Zealand’s dairy farming industry 83
Figure 2: Dairy cattle farming industry, age-sex structure by employment status 1996, 2001, 2006
Figure 3: Grain, sheep, beef cattle farming industry, age-sex structure by employment status 1996, 2001, 2006
Figure 4: Total New Zealand industry, age-sex structure by employment status 1996, 2001, 2006
Source for all figures on this page: Jackson/Statistics NZ Customised Database, available from author
10 5 0 5 10
15-19
20-24
25-29
30-34
35-39
40-44
45-49
50-54
55-59
60-64
65+
percentage at each age
age
1996
Self-Employed,WithoutEmployees
Employer
Paid Employee
Unpaid FamilyWorker
NS/NEI
Males Females
10 5 0 5 10
15-19
20-24
25-29
30-34
35-39
40-44
45-49
50-54
55-59
60-64
65+
percentage at each age
age
2001
Self-Employed,WithoutEmployees
Employer
Paid Employee
Unpaid FamilyWorker
NS/NEI
Males Females
10 5 0 5 10
15-19
20-24
25-29
30-34
35-39
40-44
45-49
50-54
55-59
60-64
65+
percentage at each age
age
2006
Self-Employed,WithoutEmployees
Employer
Paid Employee
Unpaid FamilyWorker
NS/NEI
Males Females
10 5 0 5 10
15-19
20-24
25-29
30-34
35-39
40-44
45-49
50-54
55-59
60-64
65+
percentage at each age
age
1996
Self-Employed,WithoutEmployees
Employer
Paid Employee
Unpaid FamilyWorker
NS/NEI
Males Females
10 5 0 5 10
15-19
20-24
25-29
30-34
35-39
40-44
45-49
50-54
55-59
60-64
65+
percentage at each age
age
2001
Self-Employed,WithoutEmployees
Employer
Paid Employee
Unpaid FamilyWorker
NS/NEI
Males Females
10 5 0 5 10
15-19
20-24
25-29
30-34
35-39
40-44
45-49
50-54
55-59
60-64
65+
percentage at each age
age
2006
Self-Employed,WithoutEmployees
Employer
Paid Employee
Unpaid FamilyWorker
NS/NEI
Males Females
84 Jackson
The underlying numbers aged 55 years or older also support the argument (Table 3). For the dairy industry, numbers aged 55 years or older increased by 24.1 percent between 1996 and 2006, while for the grain, sheep and beef industry they increased by 36 percent, and for total New Zealand industry, by 95.2 percent. This relatively lower numerical ageing for the dairy industry also points to greater levels of attrition at older ages.
Similarly, the ratio of people at labour force entry age (15–24 years) to those in the retirement zone (55 years or older) is higher for the dairy industry than for both comparators, and has not fallen as rapidly. For the dairy industry, the ‘entry:exit ratio’ has fallen from 13 entrants per 10 exits in 1996 to nine per 10 in 2006 (a 30 percent decline), while for grain, sheep and beef farmers it has fallen from five per 10 in 1996 to just two per 10 in 2006 (a 46.7 percent decline). By comparison, the ratio for total New Zealand employed industry has fallen from 16 per ten, to nine per ten (also 47.0 percent).
Table 3: Numbers aged 55 years or older; labour force entry:exit ratio 1996, 2002, 2006
1996 2001 2006
Change 1996-2006
(%) Numbers aged 55+ years Dairy cattle farming 4989 6018 6192 24.1 Grain, sheep, and beef cattle farming 10,368 11,133 14,097 36.0 Total Industry 186,768 251,916 364,653 95.2 Labour force entry: exit ratio (15–24: 55+ Years)
Dairy cattle farming 1.3 0.9 0.9 -29.7 Grain, sheep, and beef cattle farming 0.5 0.3 0.2 -46.7 Total Industry 1.6 1.1 0.9 -47.0 Source: Jackson/Statistics NZ Customised Database, available from author.
The perception that dairy farmers are much older than average could perhaps relate to a notion that farm employees are not ‘farmers’ in the same sense as those who are self-employed or employers. As indicated in Figure 1, at the 1996 Census, self-employed farmers with no employees accounted for more than 35 percent of those employed in the dairy farming industry. By 2006, that proportion had fallen to 23 percent, while paid employees had increased their share from 29 to 43 percent. However, the ‘self-perception’ argument is not supported by Table 2 (above), which shows
Demographic change in New Zealand’s dairy farming industry 85
that in 2006, all those engaged in the dairy industry, whether self-employed, employer, or paid employee, were, on average, fractionally younger than their ‘all-industry’ counterparts, and significantly younger than their grain, sheep and beef farming counterparts.
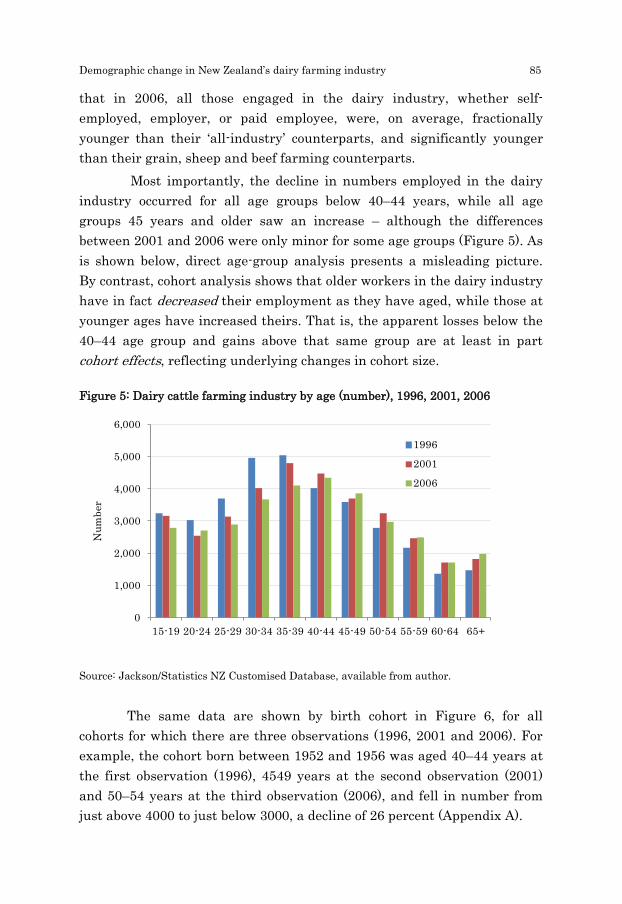
Most importantly, the decline in numbers employed in the dairy industry occurred for all age groups below 40–44 years, while all age groups 45 years and older saw an increase – although the differences between 2001 and 2006 were only minor for some age groups (Figure 5). As is shown below, direct age-group analysis presents a misleading picture. By contrast, cohort analysis shows that older workers in the dairy industry have in fact decreased their employment as they have aged, while those at younger ages have increased theirs. That is, the apparent losses below the 40–44 age group and gains above that same group are at least in part cohort effects, reflecting underlying changes in cohort size.
Figure 5: Dairy cattle farming industry by age (number), 1996, 2001, 2006
Source: Jackson/Statistics NZ Customised Database, available from author.
The same data are shown by birth cohort in Figure 6, for all cohorts for which there are three observations (1996, 2001 and 2006). For example, the cohort born between 1952 and 1956 was aged 40–44 years at the first observation (1996), 4549 years at the second observation (2001) and 50–54 years at the third observation (2006), and fell in number from just above 4000 to just below 3000, a decline of 26 percent (Appendix A).
0
1,000
2,000
3,000
4,000
5,000
6,000
15-19 20-24 25-29 30-34 35-39 40-44 45-49 50-54 55-59 60-64 65+
Num
ber
1996
2001
2006
86 Jackson
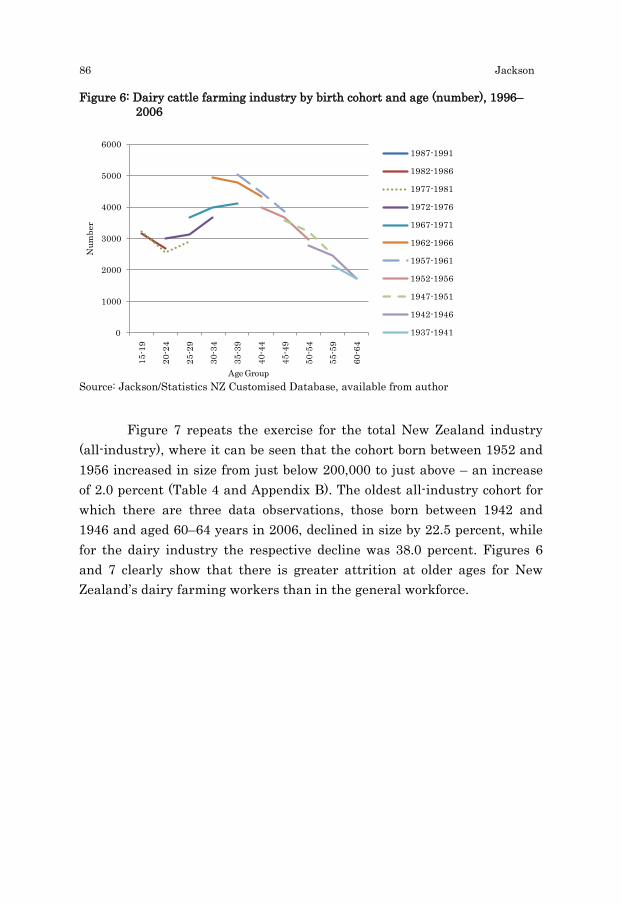
Figure 6: Dairy cattle farming industry by birth cohort and age (number), 1996–2006
Source: Jackson/Statistics NZ Customised Database, available from author
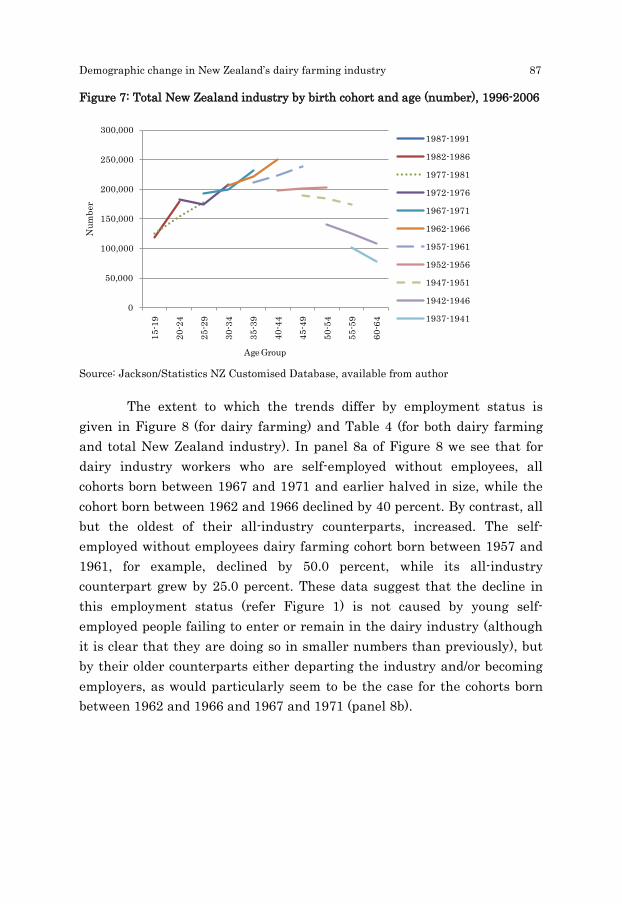
Figure 7 repeats the exercise for the total New Zealand industry
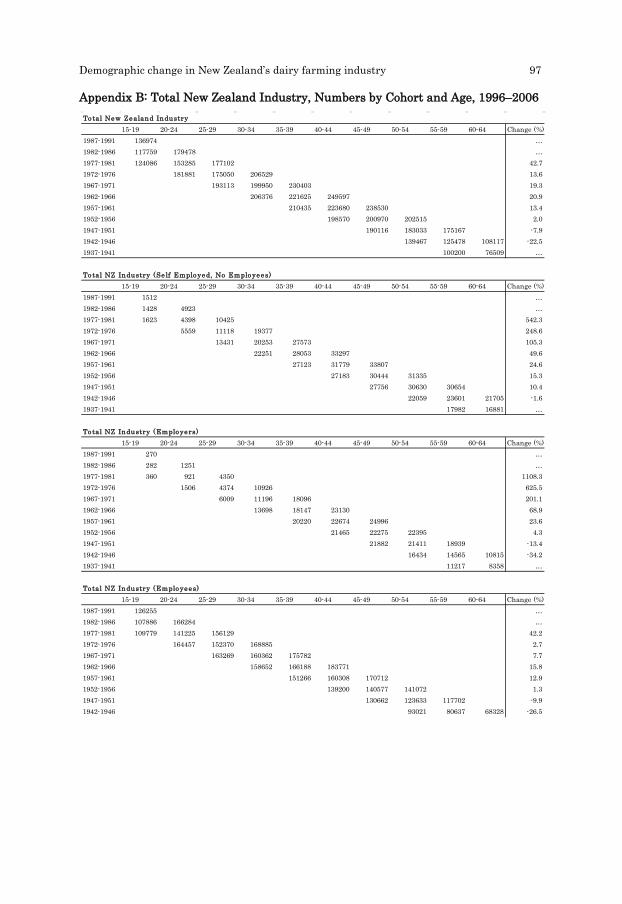
(all-industry), where it can be seen that the cohort born between 1952 and 1956 increased in size from just below 200,000 to just above – an increase of 2.0 percent (Table 4 and Appendix B). The oldest all-industry cohort for which there are three data observations, those born between 1942 and 1946 and aged 60–64 years in 2006, declined in size by 22.5 percent, while for the dairy industry the respective decline was 38.0 percent. Figures 6 and 7 clearly show that there is greater attrition at older ages for New Zealand’s dairy farming workers than in the general workforce.
0
1000
2000
3000
4000
5000
600015
-19
20-2
4
25-2
9
30-3
4
35-3
9
40-4
4
45-4
9
50-5
4
55-5
9
60-6
4
Num
ber
Age Group
1987-1991
1982-1986
1977-1981
1972-1976
1967-1971
1962-1966
1957-1961
1952-1956
1947-1951
1942-1946
1937-1941
Demographic change in New Zealand’s dairy farming industry 87
Figure 7: Total New Zealand industry by birth cohort and age (number), 1996-2006
Source: Jackson/Statistics NZ Customised Database, available from author
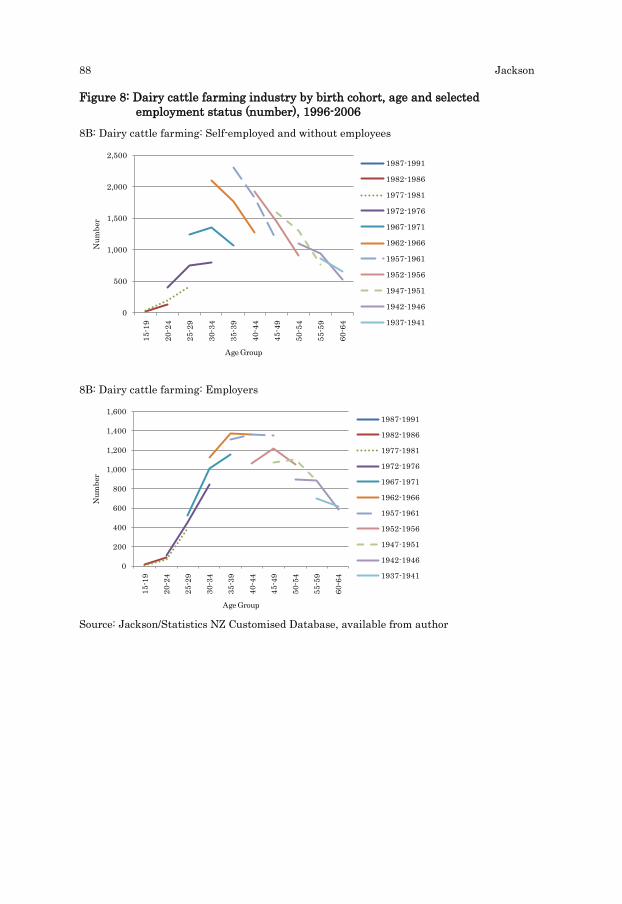
The extent to which the trends differ by employment status is given in Figure 8 (for dairy farming) and Table 4 (for both dairy farming and total New Zealand industry). In panel 8a of Figure 8 we see that for dairy industry workers who are self-employed without employees, all cohorts born between 1967 and 1971 and earlier halved in size, while the cohort born between 1962 and 1966 declined by 40 percent. By contrast, all but the oldest of their all-industry counterparts, increased. The self-employed without employees dairy farming cohort born between 1957 and 1961, for example, declined by 50.0 percent, while its all-industry counterpart grew by 25.0 percent. These data suggest that the decline in this employment status (refer Figure 1) is not caused by young self-employed people failing to enter or remain in the dairy industry (although it is clear that they are doing so in smaller numbers than previously), but by their older counterparts either departing the industry and/or becoming employers, as would particularly seem to be the case for the cohorts born between 1962 and 1966 and 1967 and 1971 (panel 8b).
0
50,000
100,000
150,000
200,000
250,000
300,000
15-1
9
20-2
4
25-2
9
30-3
4
35-3
9
40-4
4
45-4
9
50-5
4
55-5
9
60-6
4
Num
ber
Age Group
1987-1991
1982-1986
1977-1981
1972-1976
1967-1971
1962-1966
1957-1961
1952-1956
1947-1951
1942-1946
1937-1941
88 Jackson
Figure 8: Dairy cattle farming industry by birth cohort, age and selected employment status (number), 1996-2006
8B: Dairy cattle farming: Self-employed and without employees
8B: Dairy cattle farming: Employers
Source: Jackson/Statistics NZ Customised Database, available from author
0
500
1,000
1,500
2,000
2,50015
-19
20-2
4
25-2
9
30-3
4
35-3
9
40-4
4
45-4
9
50-5
4
55-5
9
60-6
4
Num
ber
Age Group
1987-1991
1982-1986
1977-1981
1972-1976
1967-1971
1962-1966
1957-1961
1952-1956
1947-1951
1942-1946
1937-1941
0
200
400
600
800
1,000
1,200
1,400
1,600
15-1
9
20-2
4
25-2
9
30-3
4
35-3
9
40-4
4
45-4
9
50-5
4
55-5
9
60-6
4
Num
ber
Age Group
1987-1991
1982-1986
1977-1981
1972-1976
1967-1971
1962-1966
1957-1961
1952-1956
1947-1951
1942-1946
1937-1941
Demographic change in New Zealand’s dairy farming industry 89
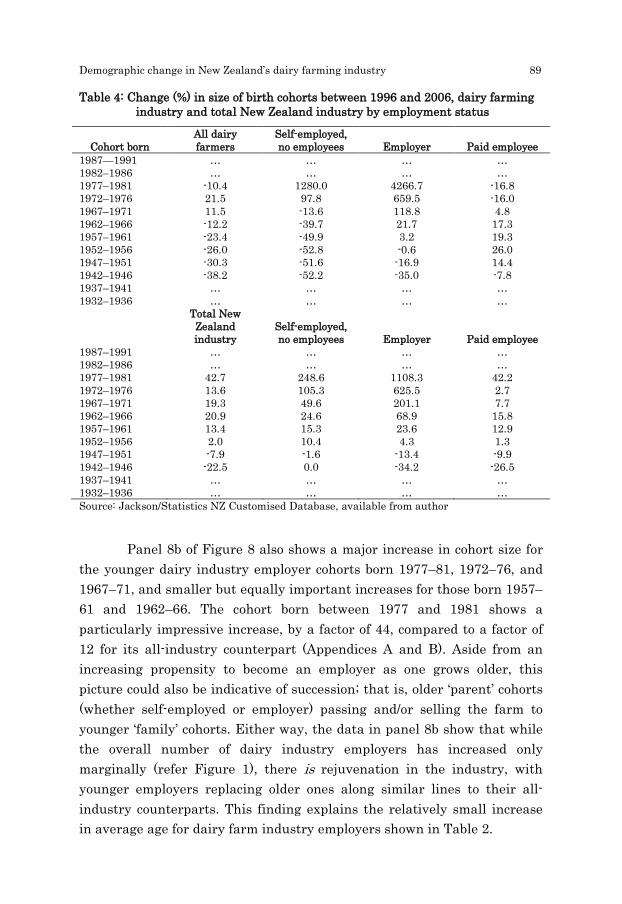
Table 4: Change (%) in size of birth cohorts between 1996 and 2006, dairy farming industry and total New Zealand industry by employment status
Cohort born All dairy farmers
Self-employed, no employees Employer Paid employee
1987—1991 … … … … 1982–1986 … … … … 1977–1981 -10.4 1280.0 4266.7 -16.8 1972–1976 21.5 97.8 659.5 -16.0 1967–1971 11.5 -13.6 118.8 4.8 1962–1966 -12.2 -39.7 21.7 17.3 1957–1961 -23.4 -49.9 3.2 19.3 1952–1956 -26.0 -52.8 -0.6 26.0 1947–1951 -30.3 -51.6 -16.9 14.4 1942–1946 -38.2 -52.2 -35.0 -7.8 1937–1941 … … … … 1932–1936 … … … …
Total New Zealand industry
Self-employed, no employees Employer Paid employee
1987–1991 … … … … 1982–1986 … … … … 1977–1981 42.7 248.6 1108.3 42.2 1972–1976 13.6 105.3 625.5 2.7 1967–1971 19.3 49.6 201.1 7.7 1962–1966 20.9 24.6 68.9 15.8 1957–1961 13.4 15.3 23.6 12.9 1952–1956 2.0 10.4 4.3 1.3 1947–1951 -7.9 -1.6 -13.4 -9.9 1942–1946 -22.5 0.0 -34.2 -26.5 1937–1941 … … … … 1932–1936 … … … … Source: Jackson/Statistics NZ Customised Database, available from author
Panel 8b of Figure 8 also shows a major increase in cohort size for
the younger dairy industry employer cohorts born 1977–81, 1972–76, and 1967–71, and smaller but equally important increases for those born 1957–61 and 1962–66. The cohort born between 1977 and 1981 shows a particularly impressive increase, by a factor of 44, compared to a factor of 12 for its all-industry counterpart (Appendices A and B). Aside from an increasing propensity to become an employer as one grows older, this picture could also be indicative of succession; that is, older ‘parent’ cohorts (whether self-employed or employer) passing and/or selling the farm to younger ‘family’ cohorts. Either way, the data in panel 8b show that while the overall number of dairy industry employers has increased only marginally (refer Figure 1), there is rejuvenation in the industry, with younger employers replacing older ones along similar lines to their all-industry counterparts. This finding explains the relatively small increase in average age for dairy farm industry employers shown in Table 2.
90 Jackson
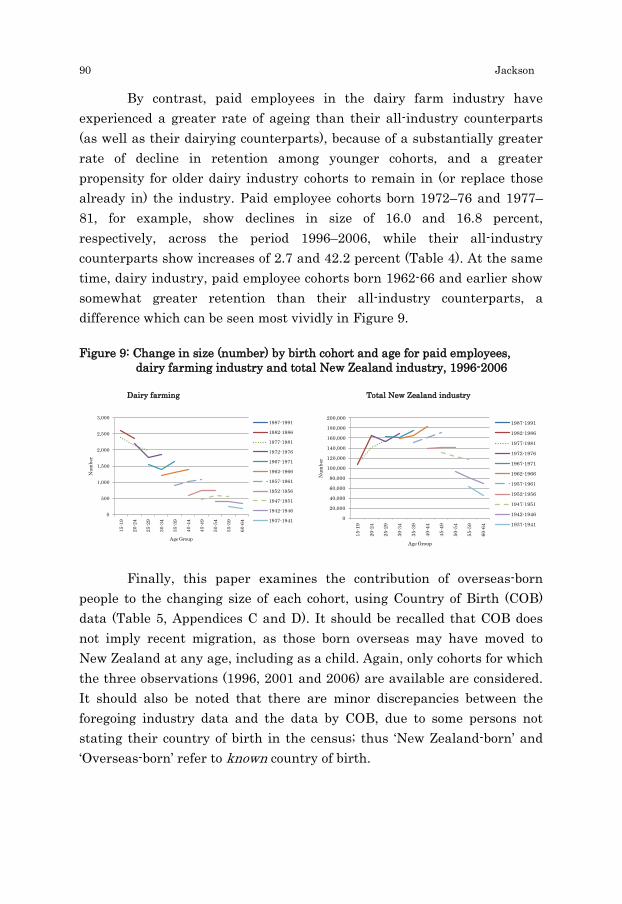
By contrast, paid employees in the dairy farm industry have experienced a greater rate of ageing than their all-industry counterparts (as well as their dairying counterparts), because of a substantially greater rate of decline in retention among younger cohorts, and a greater propensity for older dairy industry cohorts to remain in (or replace those already in) the industry. Paid employee cohorts born 1972–76 and 1977–81, for example, show declines in size of 16.0 and 16.8 percent, respectively, across the period 1996–2006, while their all-industry counterparts show increases of 2.7 and 42.2 percent (Table 4). At the same time, dairy industry, paid employee cohorts born 1962-66 and earlier show somewhat greater retention than their all-industry counterparts, a difference which can be seen most vividly in Figure 9.
Figure 9: Change in size (number) by birth cohort and age for paid employees, dairy farming industry and total New Zealand industry, 1996-2006
Dairy farming Total New Zealand industry
Finally, this paper examines the contribution of overseas-born people to the changing size of each cohort, using Country of Birth (COB) data (Table 5, Appendices C and D). It should be recalled that COB does not imply recent migration, as those born overseas may have moved to New Zealand at any age, including as a child. Again, only cohorts for which the three observations (1996, 2001 and 2006) are available are considered. It should also be noted that there are minor discrepancies between the foregoing industry data and the data by COB, due to some persons not stating their country of birth in the census; thus ‘New Zealand-born’ and ‘Overseas-born’ refer to known country of birth.
0
500
1,000
1,500
2,000
2,500
3,000
15-1
9
20-2
4
25-2
9
30-3
4
35-3
9
40-4
4
45-4
9
50-5
4
55-5
9
60-6
4
Num
ber
Age Group
1987-1991
1982-1986
1977-1981
1972-1976
1967-1971
1962-1966
1957-1961
1952-1956
1947-1951
1942-1946
1937-1941 0
20,000
40,000
60,000
80,000
100,000
120,000
140,000
160,000
180,000
200,000
15-1
9
20-2
4
25-2
9
30-3
4
35-3
9
40-4
4
45-4
9
50-5
4
55-5
9
60-6
4
Num
ber
Age Group
1987-1991
1982-1986
1977-1981
1972-1976
1967-1971
1962-1966
1957-1961
1952-1956
1947-1951
1942-1946
1937-1941
Demographic change in New Zealand’s dairy farming industry 91
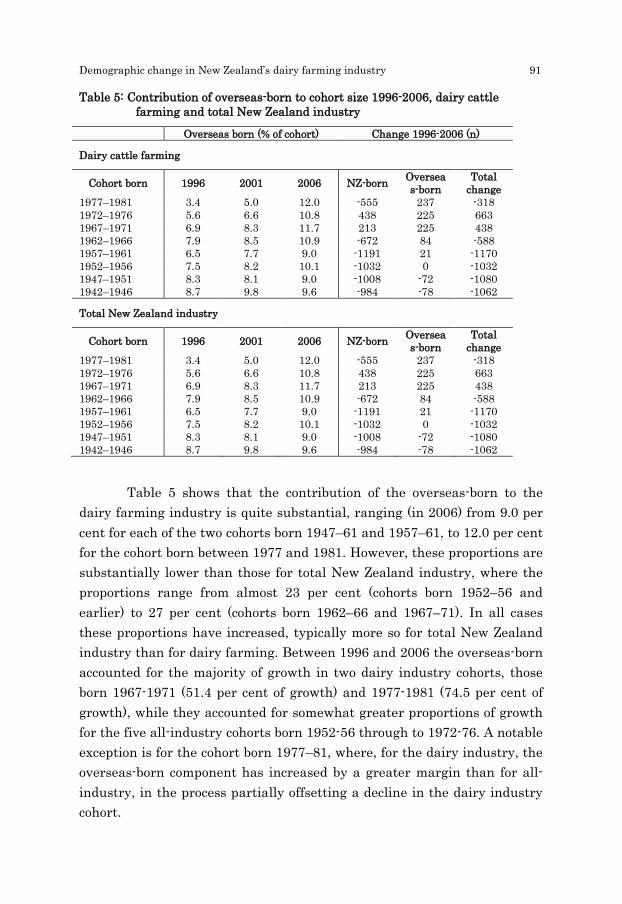
Table 5: Contribution of overseas-born to cohort size 1996-2006, dairy cattle farming and total New Zealand industry
Overseas born (% of cohort) Change 1996-2006 (n)
Dairy cattle farming
Cohort born 1996 2001 2006 NZ-born Overseas-born
Total change
1977–1981 3.4 5.0 12.0 -555 237 -318 1972–1976 5.6 6.6 10.8 438 225 663 1967–1971 6.9 8.3 11.7 213 225 438 1962–1966 7.9 8.5 10.9 -672 84 -588 1957–1961 6.5 7.7 9.0 -1191 21 -1170 1952–1956 7.5 8.2 10.1 -1032 0 -1032 1947–1951 8.3 8.1 9.0 -1008 -72 -1080 1942–1946 8.7 9.8 9.6 -984 -78 -1062
Total New Zealand industry
Cohort born 1996 2001 2006 NZ-born Overseas-born
Total change
1977–1981 3.4 5.0 12.0 -555 237 -318 1972–1976 5.6 6.6 10.8 438 225 663 1967–1971 6.9 8.3 11.7 213 225 438 1962–1966 7.9 8.5 10.9 -672 84 -588 1957–1961 6.5 7.7 9.0 -1191 21 -1170 1952–1956 7.5 8.2 10.1 -1032 0 -1032 1947–1951 8.3 8.1 9.0 -1008 -72 -1080 1942–1946 8.7 9.8 9.6 -984 -78 -1062
Table 5 shows that the contribution of the overseas-born to the dairy farming industry is quite substantial, ranging (in 2006) from 9.0 per cent for each of the two cohorts born 1947–61 and 1957–61, to 12.0 per cent for the cohort born between 1977 and 1981. However, these proportions are substantially lower than those for total New Zealand industry, where the proportions range from almost 23 per cent (cohorts born 1952–56 and earlier) to 27 per cent (cohorts born 1962–66 and 1967–71). In all cases these proportions have increased, typically more so for total New Zealand industry than for dairy farming. Between 1996 and 2006 the overseas-born accounted for the majority of growth in two dairy industry cohorts, those born 1967-1971 (51.4 per cent of growth) and 1977-1981 (74.5 per cent of growth), while they accounted for somewhat greater proportions of growth for the five all-industry cohorts born 1952-56 through to 1972-76. A notable exception is for the cohort born 1977–81, where, for the dairy industry, the overseas-born component has increased by a greater margin than for all-industry, in the process partially offsetting a decline in the dairy industry cohort.
92 Jackson
For all older dairy farming cohorts (born 1962–66 and earlier), there is a decline in the New Zealand-born component, while this is only apparent for the 1942–46 and 1947–51 overseas-born cohorts. For total New Zealand industry, it is only the New Zealand-born cohorts of 1952–56 and earlier that show decline, and this is again apparent only for the overseas-born cohorts of 1942–46 and 1947–51.
To summarise, the COB data support the foregoing analysis. They paint a picture of older New Zealand-born dairy industry workers departing the industry earlier and in greater proportions than both their all-industry counterparts and their overseas-born counterparts (with the exception of the cohort born 1947–51, for which the proportions leaving are almost identical). At the same time, there is relatively greater offset of the youngest dairy industry cohort (here 1977–81) by the overseas-born, than of the all-industry cohort. Similar can be said of the augmentation of the farming cohorts born 1967–71 and 1972–76, where the overseas-born have accounted for respectively one-half and one-third of change over the period 1996–2006. While not as great as for their all-industry counterparts, the data also support the argument that New Zealand’s dairy farming industry is the recipient of a degree of youthful rejuvenation.
Summary and Discussion
This paper has outlined demographic change in New Zealand’s dairy industry over the period 1996 to 2006. Despite using industry data rather than occupation data, its findings in terms of average age and rates of ageing are almost identical to those found by other researchers for dairy farmer and dairy farm-worker occupations (e.g. Wilson & Tipples (2008) covering the period 1991-2006, and Fairweather & Mulet-Marquis (2009) (covering a longer period, 1971-2006). The finding suggests that dairy cattle farming industry data, of which around 75 percent is accounted for by on-farm dairy farmers and farm workers, can be used as a proxy for ‘dairy farmers’, with the added advantage of accounting for critical supporting occupations such as herd testers and artificial breeding technicians. However, where the research focus is on-farm trends or future workforce provision, it is clear that it would be better to disaggregate the on-farm and off-farm components (author, forthcoming).
Demographic change in New Zealand’s dairy farming industry 93
In the present study, which is concerned with the question of whether or not dairy farmers are ageing more rapidly than the overall New Zealand workforce, the approach has been to disaggregate dairy farming industry data by employment status (self-employed, no employees, employer’, and paid employees), and to subject these data to cohort analysis in order to trace birth cohorts as they have aged. The benefits of this approach are clear from the study’s findings. Where the previously widely reported increase in numbers and proportions over the age of 55 years in the industry has been popularly interpreted as older farmers disproportionately remaining in the industry, and the declining numbers at younger ages as plummeting entry and retention in the industry, this paper has found a somewhat different picture – at least for the self-employed with no employees, and employers. Older farm industry cohorts can be seen to have departed the industry at a considerably greater rate than their all-industry counterparts (also their grain, sheep and beef counterparts, not directly shown in this paper) and this is definitively so for the self-employed without employees group. All self-employed-no employee dairy industry cohorts born 1967–71 and earlier at least halved in size over the 1996 to 2006 period, while the changes for their all-industry counterparts range from an increase of 15.3 percent for the cohort born 1957–61 to a decline of just 1.6 percent for the cohort born 1947–51. It cannot be ascertained from these data how many who were previously “self-employed, no employees” in the dairy industry became employers over the period, but since the number of dairy industry employers increased only minimally (and fell between 2001 and 2006), it could not have been many. By comparison, the two youngest dairy industry self-employed-no employee cohorts increased in size, the youngest more so than its all-industry counterpart.
Contrasting with this picture – but also with the popular interpretations referred to above – among the youngest dairy industry employer cohorts there is a significant increase in entry/ retention that is greater than for their all-industry counterparts. The cohort born 1977–81 increased in size by a factor of 43 against a factor of just 12 for its all-industry counterpart. The dairy industry employer cohort born 1972–76 also increased by a greater margin than its all-industry counterpart, although the difference was not as pronounced.
94 Jackson
The situation for the employee population differs again, with significant loss of retention for all younger dairy industry cohorts compared with growth for their all-industry counterparts, but greater retention (or entry at older ages) for older dairy industry cohorts than all-industry cohorts. These trends explain the greater rate of ageing for the dairy industry employee population than for its self-employed-no employee and employer counterparts.
While not disaggregating by employment status, the paper also examined the role of country of birth in augmenting cohort size and/or offsetting decline. It found that dairy industry cohorts contain much smaller proportions of overseas-born than their all-industry counterparts, although in neither case can overseas-born be interpreted as recent migration, as some people may have moved to New Zealand in childhood. What did stand out among the findings is that older New Zealand-born dairy industry cohorts are vacating the industry at a greater rate than both their overseas-born counterparts and their all-industry counterparts, with the sole exception of the cohort born 1947–51, for which the proportions leaving are almost identical. At the same time, the youngest New Zealand-born dairy industry cohort (born 1977–81) experienced overall decline in the period 1996 to 2006, which would have resulted in a significantly greater decline for that overall dairy industry cohort had it not been for its overseas-born component.
In all cases these trends challenge popular perceptions of an ageing, stagnating dairy industry, and paint a picture of emerging rejuvenation and ‘reinvention’, albeit not in the same numbers as in the past. However while positive, these shifts would also appear to have important longer-term implications for the face of New Zealand’s dairy farming industry. The decreasing practice of being self-employed-without employees (e.g. the pre-1990s sharemilker), and the increasing share of overseas-born among the younger cohorts — a disproportion of whom are likely to be paid employees — suggests a relative dearth of local buyers for the slowly burgeoning number of future sellers (Penn 2013). Equally pertinent questions at this time might thus be what can be done to encourage younger New Zealanders into farming (Garnaut & Helali 1999; Waikato Times 2012), and why older dairy farmers are more likely to leave in greater proportions than their all-industry and overseas-born counterparts.
Demographic change in New Zealand’s dairy farming industry 95
References
ABI/INFORM, Global. (2000, April). Proportion of older to younger farmers increases. Fedgazette.
Amshoff, S., & Reed, D. (2005). Health, work and safety of farmers ages 50 and older. Geriatric Nursing, 26 (5), 304-308.
Cole, H., & Donovan, T. (2008, October 11). Older farmers' prevalence, capital, health, age-related limitations, and adaptations. Journal of Agromedicine, 13(2), 81–94.
Fairweather, J., & Mulet-Marquis, S. (2009). Changes in the age of New Zealand farmers: Problems for the future? New Zealand Geographer, 65, 118–125.
Firth, H., Williams, S., Herbison, G., & McGee, R. (2007). Stress in New Zealand farmers. Stress and Health, 23, 51–58.
Garnaut, J. H. & Helali, S. (1999). Age profiles of Australian broadacre and dairy farmers. Australian Farm Surveys Report, pp. 65–70.
Penn, B. (2013, July 3). Innovative ways to lure young farmers. The New Zealand Herald.
Statistics New Zealand. (n.d.). Area of usual residence, industry (ANZSIC96 V4.1) and status in employment by age group and sex for the employed census usually resident population count aged 15+ Years, 1996, 2001, 2006. Wellington, New Zealand: Author.
Statistics New Zealand. (n.d.). Area of usual residence, industry (ANZSIC96 V4.1) and Country of Birth by age group and sex for the employed census usually resident population count aged 15+ Years, 1996, 2001, 2006. Wellington, New Zealand: Author.
Tipples, R., & Wilson, J. (2005). The dairy farming population and migrations. Primary Industry Management, 8 (1), 41–45.
Waikato Times. (2012, January 1). Fears neglect on the rise as young fail to work the land. Stuff New Zealand.
Wilson, J. and Tipples, R. (2008) Employment trends in dairy farming in New Zealand 1991-2006. Lincoln University, Agriculture and Life Sciences Division, Christchurch.
96 Jackson
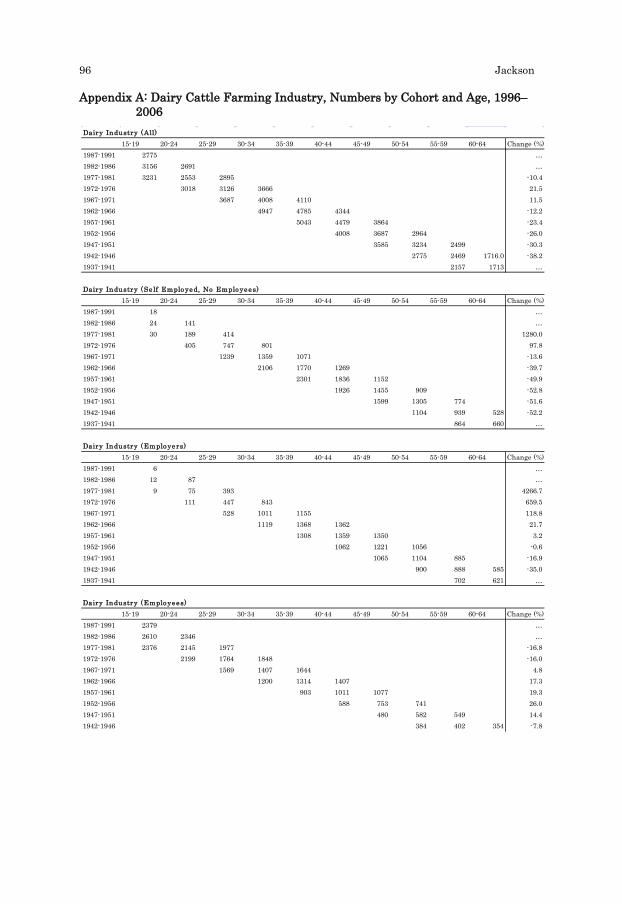
Appendix A: Dairy Cattle Farming Industry, Numbers by Cohort and Age, 1996–2006
Dairy Industry (All)15-19 20-24 25-29 30-34 35-39 40-44 45-49 50-54 55-59 60-64 Change (%)
1987-1991 2775 …1982-1986 3156 2691 …1977-1981 3231 2553 2895 -10.41972-1976 3018 3126 3666 21.51967-1971 3687 4008 4110 11.51962-1966 4947 4785 4344 -12.21957-1961 5043 4479 3864 -23.41952-1956 4008 3687 2964 -26.01947-1951 3585 3234 2499 -30.31942-1946 2775 2469 1716.0 -38.21937-1941 2157 1713 …
Dairy Industry (Se lf Employed, No Employees)15-19 20-24 25-29 30-34 35-39 40-44 45-49 50-54 55-59 60-64 Change (%)
1987-1991 18 …1982-1986 24 141 …1977-1981 30 189 414 1280.01972-1976 405 747 801 97.81967-1971 1239 1359 1071 -13.61962-1966 2106 1770 1269 -39.71957-1961 2301 1836 1152 -49.91952-1956 1926 1455 909 -52.81947-1951 1599 1305 774 -51.61942-1946 1104 939 528 -52.21937-1941 864 660 …
Dairy Industry (Employers)15-19 20-24 25-29 30-34 35-39 40-44 45-49 50-54 55-59 60-64 Change (%)
1987-1991 6 …1982-1986 12 87 …1977-1981 9 75 393 4266.71972-1976 111 447 843 659.51967-1971 528 1011 1155 118.81962-1966 1119 1368 1362 21.71957-1961 1308 1359 1350 3.21952-1956 1062 1221 1056 -0.61947-1951 1065 1104 885 -16.91942-1946 900 888 585 -35.01937-1941 702 621 …
Dairy Industry (Employees)15-19 20-24 25-29 30-34 35-39 40-44 45-49 50-54 55-59 60-64 Change (%)
1987-1991 2379 …1982-1986 2610 2346 …1977-1981 2376 2145 1977 -16.81972-1976 2199 1764 1848 -16.01967-1971 1569 1407 1644 4.81962-1966 1200 1314 1407 17.31957-1961 903 1011 1077 19.31952-1956 588 753 741 26.01947-1951 480 582 549 14.41942-1946 384 402 354 -7.8
Demographic change in New Zealand’s dairy farming industry 97
Appendix B: Total New Zealand Industry, Numbers by Cohort and Age, 1996–2006
Total New Zealand Industry15-19 20-24 25-29 30-34 35-39 40-44 45-49 50-54 55-59 60-64 Change (%)
1987-1991 136974 …1982-1986 117759 179478 …1977-1981 124086 153285 177102 42.71972-1976 181881 175050 206529 13.61967-1971 193113 199950 230403 19.31962-1966 206376 221625 249597 20.91957-1961 210435 223680 238530 13.41952-1956 198570 200970 202515 2.01947-1951 190116 183033 175167 -7.91942-1946 139467 125478 108117 -22.51937-1941 100200 76509 …
Total NZ Industry (Se lf Employed, No Employees)15-19 20-24 25-29 30-34 35-39 40-44 45-49 50-54 55-59 60-64 Change (%)
1987-1991 1512 …1982-1986 1428 4923 …1977-1981 1623 4398 10425 542.31972-1976 5559 11118 19377 248.61967-1971 13431 20253 27573 105.31962-1966 22251 28053 33297 49.61957-1961 27123 31779 33807 24.61952-1956 27183 30444 31335 15.31947-1951 27756 30630 30654 10.41942-1946 22059 23601 21705 -1.61937-1941 17982 16881 …
Total NZ Industry (Employers)15-19 20-24 25-29 30-34 35-39 40-44 45-49 50-54 55-59 60-64 Change (%)
1987-1991 270 …1982-1986 282 1251 …1977-1981 360 921 4350 1108.31972-1976 1506 4374 10926 625.51967-1971 6009 11196 18096 201.11962-1966 13698 18147 23130 68.91957-1961 20220 22674 24996 23.61952-1956 21465 22275 22395 4.31947-1951 21882 21411 18939 -13.41942-1946 16434 14565 10815 -34.21937-1941 11217 8358 …
Total NZ Industry (Employees)15-19 20-24 25-29 30-34 35-39 40-44 45-49 50-54 55-59 60-64 Change (%)
1987-1991 126255 …1982-1986 107886 166284 …1977-1981 109779 141225 156129 42.21972-1976 164457 152370 168885 2.71967-1971 163269 160362 175782 7.71962-1966 158652 166188 183771 15.81957-1961 151266 160308 170712 12.91952-1956 139200 140577 141072 1.31947-1951 130662 123633 117702 -9.91942-1946 93021 80637 68328 -26.5