demographic impacts on alberta’s provincial budget...
TRANSCRIPT

Demographic Impacts on Alberta’s Provincial Budget – Fiscal Projections

Vision 2020
Phase I Report:
Demographic Impacts On Alberta’s Provincial Budget – Fiscal Projections Through 2026
September 2004

The opinions and conclusions in this report are those of the author and do not necessarily reflect those of either the Alberta Chambers of Commerce or the Certified General Accountants of Alberta.

Foreword This study provides a timely analysis of the fiscal problems that Alberta may encounter over the coming decades as a result of population aging. While forecasting economic variables over several years―let alone decades―is extremely difficult, we know that demographic aging is going to occur. It is the product of the high birthrate in the first two decades following WWII, followed by the sharp decline in the birthrate in the following decades, and increased longevity. The impact of the baby boom generation on the public pension system will start next year when the first “Boomers” become eligible for “early” Canada Pension Plan (CPP) retirement benefits. The full impact on the public pension system will start in 2010 when they become eligible for the full CPP and OAS pensions. We are on the doorstep to profound demographic changes that will affect our society in many ways. We need to get ready―now. Population aging is going to affect many countries over roughly the same period, and other countries, including Japan, Italy, and possibly the United States, will face severe budgetary problems.1 This study reveals that, for some plausible scenarios, Alberta will be able ride the demographic wave with relative ease, thanks to the fiscal adjustments that occurred in the 1990s that allowed us to reduce our net public debt. However, we have to remember three things.
• First, Alberta has a very volatile economy and provincial revenue streams can change abruptly with fluctuations in the price of oil and natural gas. A downturn in resource revenues for a significant period of time is always possible.
• Furthermore, although Alberta will always be able to produce oil and natural gas, the conventional sources are rapidly dwindling. The new sources with higher exploration and extraction costs will generate proportionately lower resource revenues for the provincial government.
• Third, if at all possible, we want to avoid a repetition of the expenditure cutbacks that occurred in the early 1990s. That fiscal adjustment was necessary but painful, disruptive, and divisive. Alberta should pursue a cautious fiscal strategy now in order to avoid similar fiscal adjustments in the future.
This study also reveals that Alberta could face the prospects of a serious fiscal adjustment if real per capita health care costs increases continue at their long-term growth rate and if resource revenues fall by 25 per cent in relation to provincial GDP. A decline in resource revenues of this magnitude is well within the bounds of possibility. That event, combined with the status quo in health care spending, could precipitate the need for a major negative fiscal adjustment―spending cuts and/or large tax increases. In my opinion, we need to do two things now to reduce the likelihood of a negative fiscal adjustment in the future. First, we need to change the way the health care system is organized by changing the behaviour of the participants in the health care system―hospital managers, health care professionals, and the public. In order to change behaviour, we need to change incentives. Second, the provincial
1 See Nial Ferguson and Laurence J. Kotlikoff “Going Critical: American Power and the Consequences of Fiscal Overstretch” National Interest73 (Fall, 2003): 22-32.
i

government should continue to run fiscal surpluses because the study reveals that the likelihood of a fiscal adjustment is significantly reduced if the provincial government runs surpluses over the next decade and acquires more financial assets. These will cushion us from the inevitable fiscal shocks and surprises that will occur over the next 35 years. Dr. Bev Dahlby Professor, Department of Economics Fellow, Institute for Public Economics University of Alberta
ii

Executive Summary Introduction This report is the first in the Vision 2020 project series. Vision 2020 is a multi-year project intended to provide insight on how demographic changes may impact Alberta’s economic, social and policy landscape and to track how government responds to the challenges that these changes present. This first report introduces the Vision 2020 project, explains the demographic changes Alberta can expect to see through 2026, and presents the first set of results from the Vision 2020 fiscal projection model. Research Findings and Conclusions There is no question that, without much higher immigration levels, much of the developed world will experience population aging as a result of the combination of low fertility rates and increased life expectancy over the coming decades. What is uncertain is whether or not these demographic changes will cause serious fiscal problems for governments. Government-provided health care in Canada as it is currently organized is expected to produce significant cost increases through 2050, and while Canada’s overall sustainability outlook can be considered promising, it is dependent on controlling spending in general and health spending in particular. Alberta can expect its population to age in coming years and may experience significant spending increases as a result of the interaction of population aging and the age-sex structure of health care costs. Health care spending accounts for a large portion of provincial government spending in Alberta and, in real per capita terms, has been growing faster than GDP for two decades. Generally speaking, provincial government spending in Alberta grew faster than the sum of population growth and inflation by 1.5 per cent per year on average between 1982 and 2001. In addition to fiscal threats on the spending side of the ledger, Alberta must contend with serious potential threats to its revenue base as natural resource royalties are Alberta’s single largest revenue source and long-term projections of production and prices are unreliable. One of the main purposes of this paper is to present the Vision 2020 fiscal projection model for Alberta. While many scenarios for Alberta indicate that its fiscal policies are sustainable, even using a relatively stringent measure of sustainability, there are projections that indicate that we could be on an unsustainable path. These projections highlight three main risks.
iii
The first risk is real per capita health care costs continuing on their long-term growth pattern. Real per capita health expenditures have increased by 2.2 per cent per year on average between 1980/81 and 2003/04, while real GDP per capita has only grown an average of 1.5 per cent per year between 1982 and 2003. Government efforts to reform health care in Alberta need to recognize that large annual increases in health spending have not solved the fundamental problems in the provision of health care and that it is time to consider all reform options. Without reform, high health spending poses a significant risk to our fiscal future. The second risk is that natural resource royalty revenues may fall from a moderate level of 3.7 per cent of GDP on average to 2.8 per cent. While the near-term outlook for royalty revenue in Alberta is good, long-term projections are highly uncertain. Resource revenues may continue to accrue, as in recent years, with the help of oil sands production and the possibility of non-conventional natural gas production, but a significant drop in revenue is well within the range of possibilities. Although this revenue source is volatile, there are some actions the government can take on the spending side of the budget to mitigate the negative effects of a possible drop in resource revenues. In addition to controlling health care spending, total spending could be capped at the growth rate of population and inflation combined. The third risk is that future fiscal surpluses may be “spent” rather than saved. Running surpluses over the near term creates a virtuous circle of increased investment income, which makes deficits less likely to occur and helps avoid “temporary” spending increases that become permanent. Saving surpluses can have a big impact on our future fiscal performance. In the high population growth base scenario, assuming no changes in the current tax system, high revenues allow the excess of financial assets over financial liabilities, or net financial assets, to grow to 27.7 per cent of GDP in 2026 if the government saves the “excess” revenue. If the government does not run surpluses and spends the “excess” revenues instead, net financial assets fall to 0.8 per cent of GDP in 2026. In addition to controlling general spending and reforming health care, the provincial government should budget for surpluses in coming years with the expectation of needing the revenue generated by the assets and possibly the assets themselves to pay for health care spending or offset revenue decreases in other areas. As a final recommendation, the provincial government make public, their own long-term projections of fiscal balance in Alberta using a range of scenarios (i.e., low royalty revenue, high annual growth rates for health care costs). These projections should become part of the budget process, with revised projections as assumptions about demographic and economic factors are updated.
iv

Table of Contents – Overview Foreword ...................................................................................................................i Executive Summary ............................................................................................... iii I. Introduction..................................................................................................1 II. Population Aging: International and Canadian Issues ................................3 III. Population Aging and Government Finance in Alberta.............................11 IV. Rural to Urban Migration in Alberta .........................................................22 V. A Fiscal Projection For Alberta .................................................................33 VI. Summary, Conclusions and Recommendations.........................................45 Appendices.............................................................................................................49
A – Methodology ..........................................................................................49 B – Census Divisions and Corresponding Municipal Districts and Cities ...56
References..............................................................................................................59
Table of Contents – Detailed Foreword ...................................................................................................................i Executive Summary ............................................................................................... iii I. Introduction..................................................................................................1 II. Population Aging: International and Canadian Issues ................................3 International Overview .......................................................................................................3 Why is Aging a Problem?....................................................................................................3 Canadian Overview.............................................................................................................6 Summary..............................................................................................................................8 III. Population Aging and Government Finance in Alberta.............................11 Population, Government Spending and Revenue ..............................................................11 Fiscal Flexibility in Alberta ..............................................................................................19 Summary............................................................................................................................20 IV. Rural to Urban Migration in Alberta .........................................................22 Phenomenon Seen Around the World................................................................................22 Province Specific Studies ..................................................................................................23 Alberta Population by Census Division, 1996 to 2026 .....................................................28 Summary............................................................................................................................31 V. A Fiscal Projection For Alberta .................................................................33 Introduction.......................................................................................................................33 Recent Fiscal Projections for Canada ..............................................................................33 Methodology Overview .....................................................................................................34 Method of Analysis: Sustainability in Future Government Spending ...............................35 Selected Results.................................................................................................................36 Summary............................................................................................................................40 VI. Summary, Conclusions and Recommendations.........................................45 Appendices.............................................................................................................49
A – Methodology ..........................................................................................49 B – Census Divisions and Corresponding Municipal Districts and Cities ...56
References..............................................................................................................59

Glossary and List of Acronyms Glossary Agglomeration In basic terms, the shift in population as people move from rural to urban areas. Dependency Ratio A dependency ratio is an age-specific measure of the proportion of a population which is dependent on the working age population. Three are typically reported: child dependency, the ratio of those aged 0 to 14 to those aged 15 to 64; elderly dependency, the ratio of those aged 65 and older to those aged 15 to 64; and total dependency, the sum of child and elderly dependency. Fertility Rate The technical definition of fertility rate is the number of children that 1,000 women are expected to have over their child bearing period, typically defined as between the ages of 15 and 49 if current age-specific fertility rates prevail over their reproductive period. A more intuitive way to describe the fertility rate is the average number of children a woman will have in her lifetime. So, the replacement fertility rate of 2,100, i.e., one that will keep a population constant with no immigration or emigration is instead referred to as 2.1 children per woman. Population Estimate Population estimates refer to historical data. Population Projection Population projections refer to modeled scenarios of what population will be if certain assumptions hold true. Sustainability Sustainability in government finance has many possible definitions which vary depending on what one views as the appropriate role for government in society. Some would accept a high level of taxation, government spending and even the accumulation of debt with the expectation that the budget would eventually be balanced, while others would prefer a minimal level of taxation and government spending with a constantly balanced budget. List of Acronyms CPP – Canada Pension Plan CIHI – Canadian Institute for Health Information GDP – Gross Domestic Product GNP – Gross National Product OAS – Old Age Security OECD – Organisation for Economic Co-operation and Development PEA – Provincial Economic Accounts

About the Author Joel Emes is currently a senior analyst with the BC Progress Board and principal with Abacus Economics. His current work is focused around economic modeling and cross-jurisdictional comparisons of economic and social indicators. From 1996 - 2002, he was senior research economist at The Fraser Institute. His articles have appeared in the National Post, the Globe and Mail, the Calgary Herald, the Vancouver Sun and the London Free Press. He received his M.A. in Economics from Simon Fraser University in 1995. Acknowledgements I wish to thank my main reviewer, Bev Dahlby, for his many helpful and insightful comments. My appreciation extends to the research sponsors for comments, which also helped shape the final product and Dennis Wong and his colleagues at Statistics Canada for their prompt assistance. Any errors or omissions that remain in the paper are my responsibility alone.

I. Introduction This report is the first of several envisioned as part of the Vision 2020 project which has the following main goals:
• provide insight on what Alberta’s economic, social and policy landscape might look like in 2020 given expected demographic changes,
• benchmark Alberta’s performance on key economic and social indicators and analyse government performance in related policy areas,
• supply useful, accessible information and possible solutions to Albertans about some of the challenges that demographic change is likely to bring, and
• encourage discussion of issues among Albertans, including legislators and the media, and where appropriate, encourage action to mitigate or alleviate foreseeable problems.
Objectives of the current project are to:
• provide an overview of demographic challenges facing the developed world, • describe Canada’s demographic challenges and how we got ourselves into this
situation, • present the Vision 2020 fiscal projection model and initial results, • discuss agglomeration, or rural to urban migration, and how this process
coupled with demographic changes may affect Alberta’s Census Divisions, and
• introduce the Vision 2020 project and potential topics for future investigation. Readers should be aware of the limitations of the approach used in this paper. The projections presented herein, while reasonable approximations of the future based on information available today, are forecasts of what may happen, not what will happen. The projections will be updated regularly and will, as in this paper, use the most up-to-date information available and utilize commonly accepted techniques. Looming demographic changes threaten to put significant pressure on government finances in developed countries. For Alberta, as for the other Canadian provinces, the most pressing issue is the cost of public health care. This report is the first in a series intended to investigate the future provincial fiscal situation, and how demographic changes may require Albertans to make important decisions about economic and social policy. The main focus of this report is to introduce a multiyear project to model and track Alberta-specific risks related to demographic change and how Alberta policy addresses these risks, currently and going forward. The Vision 2020 model uses an accounting framework to analyze potential fiscal impacts of demographic change on Alberta government spending and revenue through 2026. Government revenue and spending as well as Gross Domestic Product are projected as a function of real income per capita, inflation, population growth and changes in population composition. Three base scenarios built around three different population growth projections, as well as several variant
1

scenarios for each base, were created. A representative set is presented in this paper. Results from this model are intended to be updated each year or two so Albertans can get a sense of how recent policy changes are likely to affect Alberta’s future fiscal situation. Additional topics that may be investigated in future reports are presented in Appendix C. Potential topics include an analysis of what other countries are doing to address aging, an investigation into alternative health care and education systems that would have the public and private sectors working more closely, and the role of immigration policy in easing some of the expected demographic challenges. In addition to the fiscal projection, agglomeration or broadly speaking the process of rural to urban migration, is discussed and a set of population projections for Alberta’s Census Divisions are presented.
2

II. Population Aging: International and Canadian Issues International Overviewi
Interest in the economic implications of population aging on the scale expected over the next several decades is a relatively new issue. Human populations, until recently, had short life expectancies, high fertility rates and few people lived over the age of 65. Little attention was paid to the economic effects of aging because high fertility rates ensured a relatively young population. As Clark notes “fertility changes dominate the age structure of a population…even if man were to become immortal, high fertility rates would produce a relatively young population.”ii
Over the next four decades, many developed countries expect to experience a significant aging of their populations. This is driven by the combination of declining fertility rates since the late 1960s and increasing life expectancy and is most commonly discussed with reference to the aging of those born between 1944 and 1964, the baby boom generation. The importance of aging, for Canada and Alberta, is that it will begin to affect public finances significantly as the baby boom cohorts progressively retire. Age-related spending as a per cent of GDP in OECD countries is expected to increase from the 2000 level of approximately 21 per cent to about 27 per cent in 2050iii. This is largely driven by expected increases in spending on old age pensions and health and long-term care, while spending on education is expected to decrease on average, but only enough to provide a small offset to the increases in other areas. On average, age-related spending in OECD countries represented 21.2 per cent of GDP in 2000 and is expected to increase by 5.8 percentage points through 2050iv. Denmark and Sweden, at around 29 per cent of GPD, had the highest 2000 age-related spending among the 21 OECD countries that reported results; Korea had the lowest at 3.1 per cent. Age-related spending in the United Kingdom is expected to grow by only 0.2 percentage points of GDP through 2050. The largest 2000 to 2050 growth is expected in Norway, Spain, and the Netherlands. Why Is Aging a Problem? There is no question that developed countries will face ccohorts move through retirement and beyond. What is not cewill translate into fiscal challenges for developed countrdemographic changes, two other relevant points should be codecides how to deal with an aging population. The first is th“fiscal flexibility” or ability to respond to fiscal challengeincreases. Limited fiscal flexibility is a relatively new phen
3
Age-related spending as a percent of GDP in OECD countries is expected to increase from the 2000 level of approximately 21 per cent to about 27 per cent in 2050.
hallenges as the baby boom rtain is that these challenges
ies. In addition to expected nsidered when a jurisdiction at many countries have little s with tax, debt or spending omena brought about by the

combination of high spending and government debt to GDP ratios in developed countries coupled with the fact that “governments have already predetermined their future budget priorities to an extent unprecedented in history.”v The second is that unforeseen circumstances such as natural disasters or terrorist attacks affect government finances; this threat has always been a factor but is more of a concern now that governments have relatively little fiscal flexibility. Government Spending There has been a similar evolution of demographics and spending in industrialized countries in the 20th century. Tanzi and Schuknechtvi find that unweighted average public expenditure around 1870 amounted to 10.7 per cent of GDP for the seventeen industrialized countries for which data could be found. Spending grew slowly between 1870 and WWI to 11.9 per cent in 1913 and reached 18.7 per cent of GDP by 1920, or shortly thereafter, due to war debt and/or reparations faced by many countries. In the countries most affected by war, expenditure exceeded 25 per cent of GDP at this time. However, Canada still belonged to the medium-sized group with spending to GDP less than 20 per cent. The Depression resulted in expansionary government spending and military spending was on the rise again (since mid-1930s) such that by 1937, public expenditure as a per cent of GDP had reached an average of 22.8 per cent, although this was partly due to decreases in GDP during the 1930s. There was relatively slow growth in public expenditures in these countries between 1937 and 1960, when it reached 28 per cent of GDP. However, by 1980 public expenditures had reached an average of 43 per cent; none of the countries analysed had shares below 30 per cent, and three were over 50 per cent. The authors note that the “Rapid expansion of public expenditures between 1960 and 1980 is remarkable because it occurred when most countries were not engaged in war effort; there was no depression, and the demographic developments were generally fiscally friendly.”vii Average public expenditure levels continued to increase to 44.8 per cent in 1990 and 45.6 per cent in 1996. According to data from the Organisation for Economic Co-operation and Development (OECD), total government outlays for 26 countries peaked in 1993 at 43.3 per cent on average, has generally decreased since and is expected to be 40.8 per cent in 2005.viii
Government Debt In contrast, public debt has been around for as long as records are available. Among the seventeen countries analysed by Tanzi and Schuknecht, seven had gross debt figures for around 1870 and five of these had debts from major wars of between 40 per cent and 100 per cent of GDP; subsequent fiscal policy saw these debts paid down significantly in all but one country. Public debt was high again as a result of WWI, with the average gross debt to GDP of 59.2 per cent in 1913 for the nine countries with data and 66.3 per cent for the fifteen countries reporting in 1920. The depression brought average debt to GDP up to 78.1 per cent by 1937 and, after WWII, balanced budgets, strong economic growth and low real interest rates caused average debt to GDP to drop to 42.9 per cent in 1970.
4

Chronic fiscal deficits saw average gross government debt increase to 46.4 per cent in 1980, then to 60.4 per cent in 1990 and 71.0 per cent in 1997. Recent OECD data shows average gross government debt for member countries at 62.0 per cent of GDP in 1990, 75.8 per cent in 2002, and a projected 82.2 per cent in 2005. This upward trend is driven mainly by debt increases in France, Germany and Japan. The same source shows net government financial liabilitiesix at 36.6 per cent of GDP in 1990, 46.2 per cent in 2002 and continued growth to reach a projected 52.7 per cent in 2005. Again, increases in average net debt are largely driven by increases in France, Germany and Japan.x Other Government Liabilities In addition to high spending and debt levels, many governments are committed to future spending on government pensions and other social spending programs without ensuring the future funding is in place to pay for them. Estimates for pension liabilities for seven or eight industrialized countries range from 66 per cent to 87 per cent of GDP, all the way up to 184 per cent of GDPxi. Estimates for Canada from these studies place our pension liabilities between 68 per cent and 250 per cent of GDP depending on different assumptions about life expectancy, interest rates and productivity growth. A recent Canadian study puts the pension liabilities at 81.5 per cent of GDP and liabilities for public health care spending at an additional 51.1 per cent of GDPxii. Tax Increases Probably Not an Option Heller succinctly lays out the factors that reduce the probability that developed countries will increase their tax burdens significantly in the futurexiii. The four main points he makes are essentially as follows:
• there seems to be a “limit to the aggregate feasible tax burden sustainable…by a market economy that is not at war.” That limit appears to be roughly 50 per cent of GDPxiv
• information on the shadow economy suggests that “the pressures on business to go outside the formal sector to avoid taxes, or on consumers to shift consumption to non-taxed goods, increase with higher average tax burdens…”
• “the average tax burden in any given country seems to vary within a fairly narrow range over time.”
• globalization may bring “pressures for tax competition among countries.” Fiscal Flexibility Getting back to the question at hand—why does aging matter? The combination of relatively high government spending and debt levels, coupled with reduced ability to increase taxation levels beyond their current high levels, means that governments have limited fiscal flexibility right now. Add in partially-funded public pension and other age-related programs and an increase in the share of the elderly
…the combination of relatively high government spending and debt levels coupled with reduced ability to increase taxation levels beyond their current high levels means that governments have limited fiscal flexibility right now.
5
relative to the working age population and you have the potential for serious fiscal challenges starting by 2010. Canadian Overview Canada’s fertility rate reached a peak of almost four children per woman in 1959. It was above average from the mid 1940s through the mid 1960s. By the time the CPP came into effect in 1966, fertility rates were already falling and are currently at historic lows. National output, as measured by real GNP per capita, had strong gains throughout the 1960s after relatively weak growth in the late 1950s. National output, as measured by real GDP per capita, showed good growth in the 1970s, but was modest through the 1980s and 1990s. Productivity, as measured by the rate of growth of GDP per hour worked, increased much faster between 1950 and 1973 than it has since 1973. In 1950, the under-15 population group in Canada represented 29.7 per cent of the total and the over-64 population group was 7.7 per cent. In 2000, the under-15 group was 19.1 per cent of the total and the over-64 group 12.6 per cent. The United Nations forecasts that in 2050 only 16.3 per cent of Canada’s population will be under the age of 15, while fully 24.3 per cent will be over the age of 64.
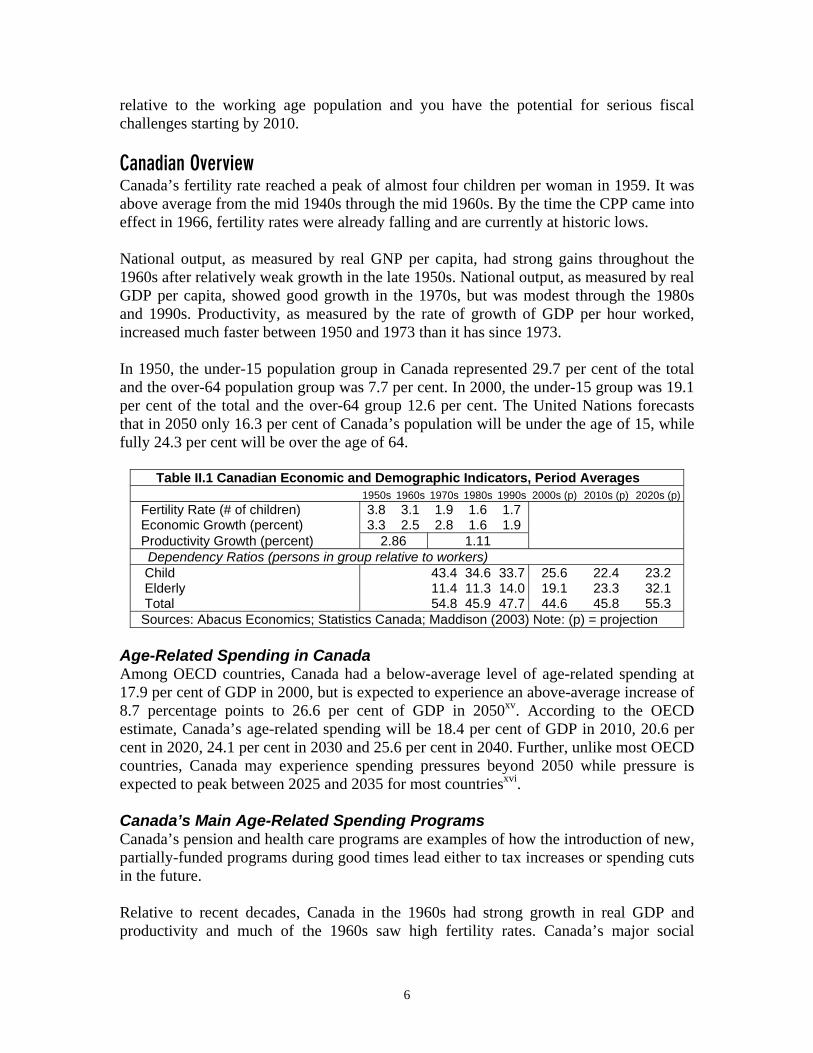
Table II.1 Canadian Economic and Demographic Indicators, Period Averages 1950s 1960s 1970s 1980s 1990s 2000s (p) 2010s (p) 2020s (p)
Fertility Rate (# of children) 3.8 3.1 1.9 1.6 1.7 Economic Growth (percent) 3.3 2.5 2.8 1.6 1.9 Productivity Growth (percent) 2.86 1.11 Dependency Ratios (persons in group relative to workers)
Child 43.4 34.6 33.7 25.6 22.4 23.2 Elderly 11.4 11.3 14.0 19.1 23.3 32.1 Total 54.8 45.9 47.7 44.6 45.8 55.3 Sources: Abacus Economics; Statistics Canada; Maddison (2003) Note: (p) = projection
Age-Related Spending in Canada Among OECD countries, Canada had a below-average level of age-related spending at 17.9 per cent of GDP in 2000, but is expected to experience an above-average increase of 8.7 percentage points to 26.6 per cent of GDP in 2050xv. According to the OECD estimate, Canada’s age-related spending will be 18.4 per cent of GDP in 2010, 20.6 per cent in 2020, 24.1 per cent in 2030 and 25.6 per cent in 2040. Further, unlike most OECD countries, Canada may experience spending pressures beyond 2050 while pressure is expected to peak between 2025 and 2035 for most countriesxvi. Canada’s Main Age-Related Spending Programs Canada’s pension and health care programs are examples of how the introduction of new, partially-funded programs during good times lead either to tax increases or spending cuts in the future. Relative to recent decades, Canada in the 1960s had strong growth in real GDP and productivity and much of the 1960s saw high fertility rates. Canada’s major social
6

spending programs were introduced or expanded during the favourable economic and demographic conditions of the 1960s. Unfortunately and perhaps predictably, these conditions did not persist.
With the exception of infants, health care costs are significantly higher for the elderly than for younger people.
Canada’s Old Age Security (OAS) program, funded from federal general tax revenues, is a monthly benefit available to most Canadians over age 65. The Old Age Security Act came into effect in 1952, replacing legislation from 1927 that required the federal government to share the cost of provincial old age benefits. The age of eligibility was dropped to 65 from 70 in 1965 and the OAS was augmented to include the Guaranteed Income Supplement in 1967. The OAS is a transfer of funds from current taxpayers to retired people rather than an “exhaustive” expenditure such as health care spending. Regardless, it must be financed either through higher taxes, deficit spending or reduced spending in other areas. According to the most recent actuarial report available, OAS expenditure as a share of GDP was 2.29 per cent in 2000, is expected to increase to 2.41 per cent by 2010 and peak at 3.16 per cent in 2030xvii. These percentages look small, but the OAS is the second largest spending category in the federal budget at $27.0 billion in 2003/04, behind debt service costs at $35.8 billion; OAS spending accounted for 15.1 per cent of federal spending in 2003/04 and its cost relative to GDP is expected to grow by 38 per cent to its peak in 2030xviii. The Canada Pension Plan (CPP), funded by investment income and mandatory contributions from employees, employers and the self-employed is a comprehensive pension plan that supplements, rather than replaces, private retirement plans. The CPP came into effect on January 1, 1966, and began payments on January 1, 1967. Treff and Perry (2003) note that: “Concern that the CPP fund would be exhausted by 2015 and that contribution rates of 14 per cent would be necessary by 2030 to cover escalating costs led to the introduction of a gradual increase in the combined rate, from 5.6 per cent in 1996 to 9.9 per cent in 2003, where it is expected to remain.”xix Currently, employees and employers each contribute 4.95 per cent of the employee’s pensionable earnings for a total contribution rate of 9.9 per cent. Canada Pension Plan expenditures were 1.91 per cent of GDP in 2001. With information from actuarial reports, we can estimate that CPP expenditures as a per cent of GDP will be 2.16 per cent in 2010 and 3.00 per cent in 2030. From a provincial spending perspective, population aging will have its largest impact on health spending. Health care funding is primarily a provincial responsibility, although the federal government also makes contributions. Until recently, federal health care transfers to the provinces were “hidden” in the Canada Health and Social Transfer (CHST). As of April 1, 2004, the CHST is separated into the Canada Health Transfer and the Canada Social Transfer. Using the most up-to-date data available, federal cash transfers to the provinces are
From a provincial spending perspective, population aging will have its largest impact on health spending.
7

expected to amount to 17.7 per cent of total government spending on health care in 2003/04. Higher percentage shares of elderly people in a population are expected to drive public health care costs higher due to the current (and assumed future) distribution of health spending by age. With the exception of infants, health care costs are significantly higher for the elderly than for younger people. In Alberta, average provincial health spending per infant in 2001 was $7,285. Average spending for those aged 1 through 49 was $1,339 and was $3,206 for those in their 50s and 60s. Average per person spending was $7,520 for people in their 70s and $14,362 for people aged 80 through 89. For those 90 and older, average provincial health spending was $18,782. This spending distribution is driven more by proximity to the end of one’s life than by age. This suggests that health care costs may not increase as rapidly as is projected in this paper because higher life expectancy (i.e., delayed mortality) will push the higher spending years later into life.xx
Fiscal Flexibility in Canada According to current Organisation for Economic Co-operation and Development (OECD) data and research summarized in the fiscal projection section below, Canada is in relatively good shape to deal with age-related spending in the future. That said, the path ahead is not easy as increased flexibility, likely through further decreases in net debt, is necessary and health care costs must be controlled. According to the OECDxxi, Canada’s general government outlays peaked at 53.3 per cent of GDP in 1992, fell steadily to 41.0 per cent in 2000 and are expected to be 39.9 per cent in 2005. Canada’s spending was well above the OECD average of 42.7 per cent in 1992 but has been below the average since 2002. Canada’s debt figures tell a similar story. General government net financial liabilities peaked at 69.3 per cent of GDP in 1995 in Canada, when the OECD average was 48.6 per cent. Canada’s net debt as a per cent of GDP has fallen steadily since then and is expected to be 30.4 per cent in 2005 while the OECD average has increased to 52.7 per cent. Although beyond the scope of this report the impact of aging on federal spending and taxation, and even on other provinces’ fiscal affairs, is relevant for Alberta due to Canada’s fiscal structure. A lack of improvement in fiscal flexibility at the federal level will likely impact Alberta’s fiscal future. Summary – Population Aging: International and Canadian Issues International
• Over the next four decades, many developed countries expect to experience a significant aging of their populations driven by the combination of low and declining fertility rates and increasing life expectancy.
• Average government spending among OECD countries is, although down from its 1993 peak, at a high level by historical standards.
• Although high debt levels are not unprecedented in developed countries, in the past they were often associated with wars or periods of economic decline and were usually paid off in subsequent years. Debt levels have remained high for several OECD countries, while others have made moderate to good progress
8

in decreasing their gross and net debt to GDP ratios. Three countries (Norway, Finland and Korea) are even net creditors.
• Many developed countries, including Canada, have pension and other spending programs in place that do not have adequate funding for the future.
• For a variety of reasons, countries may not be able to depend on tax increases to cover any future funding shortfalls.
• Population aging is a concern because many countries have little fiscal flexibility due to high government spending and debt levels coupled with limited room to increase taxation levels. Consider that many countries have made spending promises for pensions and other age-related programs without full funding in place and that a significant increase in the share of the elderly relative to the working age population is upon us, you have the potential for serious fiscal challenges starting by 2010, without any easy options to meet these challenges.
Canada
• The time when Canada’s major social spending programs were introduced or expanded had favourable economic and demographic conditions which have not persisted.
• Canada’s population is aging, and although age-related spending is currently below the OECD average, it is expected to grow at above average rates to reach 26.6 per cent of GDP in 2050; the OECD average is expected to be 27 per cent.
• From a provincial spending perspective, population aging will have its largest impact on health spending.
• With the exception of infants, health care costs are significantly higher for the elderly than for younger people.
• Canada is in a better position to deal with the public finance challenges related to population aging than in the recent past but still faces difficult choices to ensure public spending is sustainable in the future.
i Some text segments in this section are the same as those in BC Progress Board (2004); the author of this
paper also wrote the relevant sections in the reference paper. ii Robert L. Clark in Eatwell et al. (1998), Volume I, page 38. iii Casey et al. (2003), Table 2, page 35. iv Ibid, for all numbers in this paragraph. v Heller (2003), page 2. vi Tanzi and Schuknecht (2000). vii Ibid, page 16. viii Organisation for Economic Co-operation and Development (2004), Annex Table 26. ix Net government financial liabilities refers to gross government debt after taking account of government financial assets; positive net financial liabilities indicate liabilities in excess of assets. x Ibid, Annex Tables 33 and 34 xi As presented in Tanzi and Schuknecht, Table III.6, page 68: Chand and Jaeger (1996), Masson and
Mussa (1995), Van den Noord and Herd (1993). Slight variations in underlying assumptions have large impacts in these estimates because of the long time horizons involved.
xii Veldhuis et al. (2003).
9

xiii Heller (2003), all quoted sections from page 187. xiv An increase in the tax burden to 50 per cent of GDP would be a significant increase in Canada according to recent OECD data. xv Casey et al. (2003), Table 2, page 35. xvi Dang et al. (2001), page 147. xvii Office of the Chief Actuary (2002a). xviii Government of Canada (2004), Tables 3.3 and 3.5. xix Treff and Perry (2003), page 19:8. xx The debate around the net impact of this effect is ongoing as, for instance, health care costs may be higher on balance if people live longer but in poor health. xxi Organisation for Economic Co-operation and Development (2004), Annex Tables 26 and 34.
10

11
III. Population Aging and Government Finance in Alberta The papers reviewed for this study look at future scenarios for either total provincial/territorial public health spending or Canada’s overall fiscal status. There does not seem to be any publicly available projections of Alberta’s long-term fiscal prospects. Alberta’s provincial government has announced that it intends to develop a long-term vision for the province. In the 2004 Throne Speech and in Premier Klein’s February 4 televised address, the government referred to its 20-year plan which was released on March 19 with the 2004 Budget. For Vision 2020, the most relevant sections of the 20-year plan titled, “Today’s Opportunities, Tomorrow’s Promise” are under “Opportunity 4 – Making Alberta the Best Place to Live, Work and Visit” where future fiscal pressures are discussed. While it is encouraging to see a government recognize some long-term challenges exist, there are few details in this document about the nature of the challenges ahead or what the government plans to do about them. Given the level of uncertainty surrounding fiscal projections, specific plans are not realistic, but a thorough discussion of the range of possible fiscal outcomes and potential policy responses for best and worse case scenarios 5 to 20 years in the future is neither beyond their capabilities nor unreasonable to expect. Population, Government Spending and Revenue Population
Figure III.1: Alberta Population, Estimates and Projections
1.5
2.0
2.5
3.0
3.5
4.0
4.5
1971 1976 1981 1986 1991 1996 2001 2006 2011 2016 2021 2026Sources: Abacus Economics; Statistics Canada
Mill
ion
Mill
io Low
High
00-01 53.5 15.6 30.92005-06 49.7 19.8 30.52010-11 52.2 18.7 29.12015-16 55.3 18.6 26.12020-21 56.1 19.1 24.82025-26 54.7 20.8 24.6
Table III.1: Population Growth (High Growth), Percent Shares
Sources: Abacus Economics; Statistics Canada
ns
20
Natural Increase Immigration Migration
Alberta’s population has grown at an annual average rate of 2.0 per cent from 1.7 million in 1971 to 3.2 million in 2003. Canada’s population grew by an annual average rate of 1.1 per cent over this time period. Under the high population pro-jection used in this paper (scenario 1), Al-berta’s population growth rate slows to an average of 1.1 per cent for 2004 through 2026 and population reaches 4.1 million.
12
Figure III.2: Alberta Interprovincial Migration
-40
-20
0Thou
20
40
60
1972 1977 1982 1987 1992 1997 2002 2007 2012 2017 2022Sources: Abacus Economics; Statistics Canada
sand
High
Low
ands
Thou
s
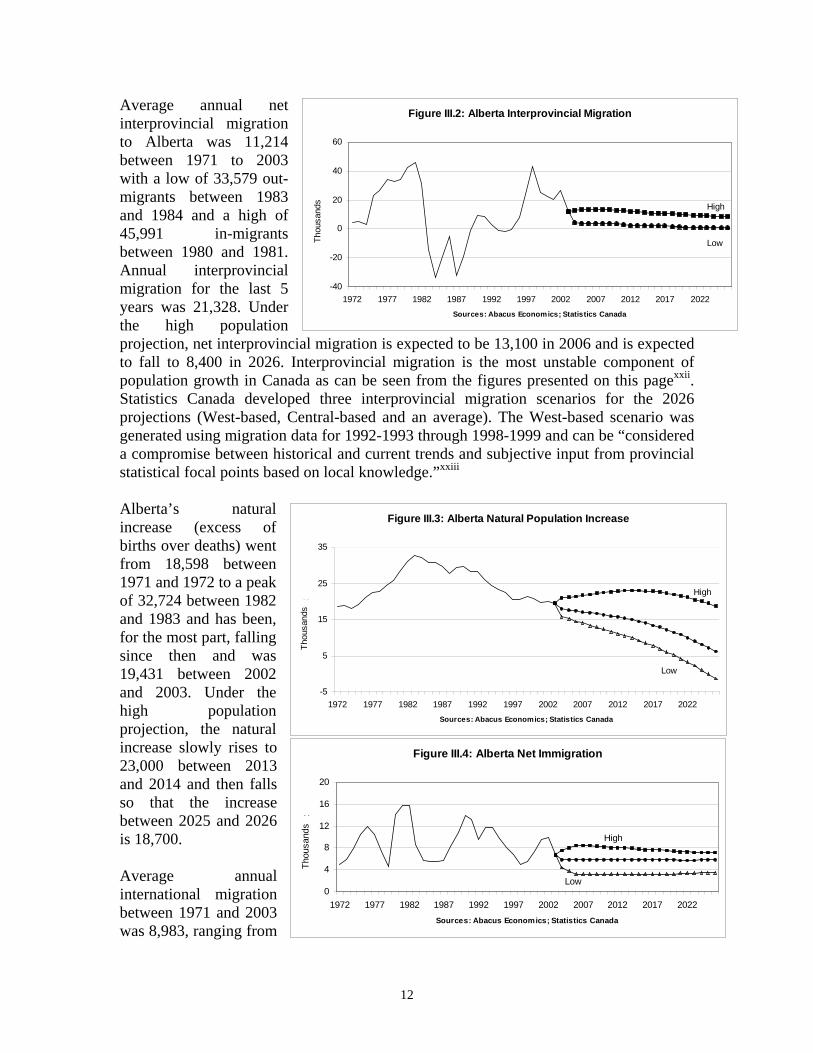
Average annual net interprovincial migration to Alberta was 11,214 between 1971 to 2003 with a low of 33,579 out-migrants between 1983 and 1984 and a high of 45,991 in-migrants between 1980 and 1981. Annual interprovincial migration for the last 5 years was 21,328. Under the high population projection, net interprovincial migration is expected to be 13,100 in 2006 and is expected to fall to 8,400 in 2026. Interprovincial migration is the most unstable component of population growth in Canada as can be seen from the figures presented on this pagexxii. Statistics Canada developed three interprovincial migration scenarios for the 2026 projections (West-based, Central-based and an average). The West-based scenario was generated using migration data for 1992-1993 through 1998-1999 and can be “considered a compromise between historical and current trends and subjective input from provincial statistical focal points based on local knowledge.”xxiii
Figure III.3: Alberta Natural Population Increase
-5
5
15
25
35
1972 1977 1982 1987 1992 1997 2002 2007 2012 2017 2022Sources: Abacus Economics; Statistics Canada
Thou
sand
High
Low
Thou
sand
s
Figure III.4: Alberta Net Immigration
0
4
8
12
16
20
1972 1977 1982 1987 1992 1997 2002 2007 2012 2017 2022Sources: Abacus Economics; Statistics Canada
Thou
sand
High
Low
hous
ands
Alberta’s natural increase (excess of births over deaths) went from 18,598 between 1971 and 1972 to a peak of 32,724 between 1982 and 1983 and has been, for the most part, falling since then and was 19,431 between 2002 and 2003. Under the high population projection, the natural increase slowly rises to 23,000 between 2013 and 2014 and then falls so that the increase between 2025 and 2026 is 18,700.
T
Average annual international migration between 1971 and 2003 was 8,983, ranging from

a low of 4,563 between 1978 and 1979 and a high of 15,790 between 1980 and 1981. The average for the last five years was 7,755. Under the high population projection, net international migration is expected to be 8,500 in 2006 and is expected to fall to 7,100 in 2026. A dependency ratio is a crude, age-specific measure of the proportion of a population which is “dependent” on the working age population. Three are typically reported: child dependency, the ratio of those aged 0 to 14 to those aged 15 to 64; elderly dependency, the ratio of those aged 65 and older to those aged 15 to 64; and total dependency, the sum of child and elderly dependency. These are crude measures in the sense that some people in the 0 to 14 and 65 and older age groups will be working and some in the 15 to 64 group will not. Also, some elderly are wealthy and not dependent on transfers from wous a reasonable idea of how dependency
Figu
0
1
2
3
4
5
6
7
1971 1977 1983 1Sourc
The child dependency ratio in Alberta under the high population projection, isgradually increase back to 2.8 in 2026. means that there are just under 3 childreage group. The elderly dependency ratioin 2003 and, under the high population pattern shows that the total dependency ratio has fallen from 6.3 in 1971 to 4.3 in 2003 and is expected to continue to fall until it reaches a trough of 4.2 in 2008. It is then expected to in-crease to 5.8 in 2026, driven by the aging of the population. If we look only at the total dnot appear to be a severe problem. Howmuch higher in the last few years of life.
If we look only at the total dependency ratio, Alberta’s aging population does not appear to be a severe problem. However, health care costs are much higher in the last few years of life. Demographic change reflected in the increase in the elderly dependency ratio is the main factor expected to drive public health care costs up.
rkers for income. Nevertheless, these ratios give in a population changes over time.
re III.5: Dependency Ratios in Alberta
989 1995 2001 2007 2013 2019 2025es: Abacus Economics; Statistics Canada
ChildElderlyTotal
has fallen from 5.1 in 1971 to 2.8 in 2003 and, expected to fall further to 2.6 in 2011 and then In general terms, a child dependency ratio of 2.8 n for every 10 workers or people in the 15 to 64 in Alberta has increased from 1.2 in 1971 to 1.5 projection, is expected to reach 2.9 in 2026. This
ependency ratio, Alberta’s aging population does ever, as pointed out above, health care costs are Demographic change reflected in the increase in
13

the elderly dependency ratio is the main factor expected to drive public health care costs up. The technical definition of fertility rate is the number of children that 1,000 women are expected to have over their child bearing period, typically defined as between the ages of 15 and 49 if current age-specific fertility rates prevail over their reproductive period. A more intuitive way to describe the fertility rate is the average number of children a woman will have in her lifetime. So, the replacement fertility rate, i.e., one that will keep a population constant with no immigration or emigration of 2,100 is instead referred to as 2.1 children per woman. Alberta’s fertility rate has fallen from 2.4 (above replacement) in 1971 to 1.5 in 2003 (below replacement) and, under the high population projection, it is expected to increase to 1.9 in 2026. The median age is the age at which half the population is younger and half is older. An aging population will have a progressively higher median age. In 1971, the median age of Alberta’s population was 24.9 years. By 2003, it had increased to 35.1 years and, under the high population projection, is expected to increase further, to 40.5 by 2026. Spending Spending data come from three sources, Statistics Canada’s Provincial Economic Accounts (PEA), Alberta’s 2004 Budget, and the Canadian Institute for Health Information (CIHI). Provincial Economic Accounts
Figure III.6: Alberta Inflation, Population and Government Spending Growth
-4.0
0.0
4.0
8.0
12.0
1981
1983
1985
1987
1989
1991
1993
1995
1997
1999
2001
2003
Sources: Abacus Economics; Statistics Canada
Perc
en
Government Spending
Populat ion & Inf lat ion
Populat ion
Inf lat ion
Per
cent
A typical benchmark for government spending growth is the sum of population growth and inflation. According to PEA data, Alberta’s population grew by an average of 1.4 per cent per year between 1982 and 2001 and by 1.7 per cent per year between 1992 and 2001. Inflation, as measured by year over year change in Alberta’s all-item consumer price index was 3.4 per cent on average between 1982 and 2001 and 2.0 per cent between 1992 and 2001. The average of the sum of population growth and inflation for 1982 through 2001 was 4.9 per cent per year and 3.7 per cent per year for 1992 through 2001.
Government spendinggrew faster than the sumof population growth andinflation by 1.5 per centper year between 1982and 2001 and by 0.9 percent between 1992 and2001.
Alberta’s provincial gov-ernment spending increased by 6.4 per cent per year on average between 1982 and 2001 and by 4.6 per cent per year between 1992 and 2001.
14

15
Government spending grew faster than the sum of population growth and inflation by 1.5 per cent per year on average between 1982 and 2001 and by 0.9 per cent between 1992 and 2001. Some data are left out of the figure on the previous page but are included in all calculated results reported here. Specifically, all data points for 1982 and 1983 are left out of the figure because the government spending, as well as the combined inflation and population figures, are so high that the resultant scale on the figure would not reveal any of the variation in the other years. The 2001 figure for government spending is left out for the same reason; 2001 spending saw a sharp increase due to natural gas rebates. Total real per capita government spending grew by 1.3 per cent per year, on average, between 1982 and 2001 and by 0.7 per cent between 1992 and 2001. Real GDP per capita grew by an average of 1.6 per cent per year between 1982 and 2001 and by 1.5 per cent between 1982 and 2003. More recently, real per capita GDP grew by an average of 2.4 per cent per year between 1992 and 2001 and by 2.0 per cent per year between 1994 and 2003.
Figure III.7: Current Expenditure: Provincial Government
10.0
20.0
30.0
1981 1983 1985 1987 1989 1991 1993 1995 1997 1999 2001Sources: Abacus Economics, Statistics Canada
Per
cent
of G
DP
erce
nt o
f GD
P
Provincial Average
Alberta
Alberta provincial gov-ernment spending as a per cent of GDP aver-aged 17.5 per cent be-tween 1981 and 2001 (16.5 per cent for 1992-2001) ranging from a minimum of 13.3 per cent in 1981 to a maximum of 21.6 per cent in 1992. Provincial government spending in Alberta was 13.5 per cent in 2000 and jumped to 15.5 per cent in 2001 due largely to natural gas rebates which are counted as transfers to business in the PEA. Provincial government spending in the PEAs is expected to be lower in 2002 and 2003.
Figure III.8: Current Expenditure: All Governments
20
30
40
50
60
1981 1983 1985 1987 1989 1991 1993 1995 1997 1999 2001Sources: Abacus Economics, Statistics Canada
Perc
ent o
f GD
Per
cent
of G
DP
Provincial Average
Alberta
All-government spend-ing as a per cent of GDP in Alberta averaged 33.0 per cent between 1981 and 2001 (31.2 per cent for 1992-2001) from a minimum of 23.0 per cent in 1981 to a maximum of 40.9 per cent in 1992. Data for 2000 and 2001 at this level of aggregation also reflect the natural gas

rebates. The provincial average for all-government spending as a per cent of GDP averaged 42.6 per cent for 1981 through 2001 (42.4 per cent for 1992-2001) from a minimum of 37.1 per cent in 2000 to a maximum of 48.9 per cent in 1992. The provincial average was 38.4 per cent in 1981. Budget
Figure III.9: Alberta Health and Education Spending
20
30
40
50
60
70
1986 1988 1990 1992 1994 1996 1998 2000 2002 2004 2006Sources: Abacus Economics; Alberta 2004 Budget
Per
cent
of T
ot
Health
Health & Education
Education
Per
cent
of T
ota
Health and education spending combined repre-sented 42.4 per cent of total spending in 1985/86, 60.3 per cent in 2002/03 and is expected to reach 65.9 per cent in 2006/07. Average education and health spending combined was 55.8 per cent for 1993/94 through 2002/03 and is expected to be 64.5 per cent for 2003/04 through 2006/07.
l Bud
get S
pend
ing
Health spending grew from 21.4 per cent of total spending in 1985/86 to 33.7 per cent in 2002/03 and is expected to grow to 38.1 per cent in 2006/07. The average health to total spending share for 1993/94 through 2002/03 was 29.3 per cent and is expected to be 36.9 per cent for 2003/04 through 2006/07. Education spending grew from 21.1 per cent of total spending in 1985/86 to 26.6 per cent in 2002/03 and is expected to grow to 27.8 per cent in 2006/07. Average education spending as a share of total spending was 26.5 per cent for 1993/94 through 2002/03 and is expected to be 27.6 per cent for 2003/04 through 2006/07.
Health and educationspending combinedrepresented 42.4 percent of total spending in1985/86, 60.3 per cent in2002/03 and is expectedto reach 65.9 per cent in2006/07.
Canadian Institute for Health Information According to data from the Canadian Institute for Health Information, health care spending in Alberta was equal to 3.6 per cent of provincial GDP in 1981/82. This was well below the Canadian average of 5.3 per cent. In 1990/91, health spending equaled 5.6 per cent of GDP and for 2003/04 the forecast is 4.9 per cent. This is an increase of 1.3 percentage points in 22 years. Alberta’s health spending to GDP ratio has
Real per capita healthexpenditures have,between 1980/81 and2003/04, increased by2.2 per cent per year.
16

17
been well below the Canadian average for most of the period 1981/82 to 2003/04. The spending rate differential ranged from a low of 0.1 percentage points in 1986/87 to a high of 1.9 percentage points in 1995/96. The largest spending component for Alberta is hospitals, at 42.6 per cent in 2001/02. Spending for any care, including drugs and professional services, that occurs in the hospital is included in this category. Other large categories include physicians at 16.1 per cent and public health and administration at 11.4 per cent. On average, other individual spending categories represent less than 10 per cent of spending including other institutions, such as residential care homes or alcohol and drug treatment centers, at 7.9 per cent and drugs at 6.4 per cent; although, as noted above, drugs dispensed in a hospital would not be included in this “drugs” category. On a per capita basis, real health expenditures have increased by 59.4 per cent from $1,421 in 1980/81 to $2,264 in 2003/04 or by 2.2 per cent per year. Revenue Historical revenue data come primarily from Statistics Canada’s Provincial Economic Accounts (PEA).
Figure III. 10: Alberta Government Revenue Shares
0
10
20
30
40
50
1981 1983 1985 1987 1989 1991 1993 1995 1997 1999 2001
Sources: Abacus Economics; Statistics Canada
Perc
ent o
f Tot
al R
eve
Federal Transfers
Personal Income TaxRoyalt ies
Per
ceal
Re
Personal income tax collections in Alberta made up 18.7 per cent of provincial government revenue on aver-age between 1981 and 2001 (21.0 per cent for 1992-2001) from a minimum of 11.9 per cent in 1985 to a maximum of 26.0 per cent in 1998.
Provincial Economic Accounts
nt o
f Tot
venu
e
Royalties on natural resources contributed an average of 25.1 per cent of Alberta’s provincial government revenue between 1981 and 2001 (22.0 per cent for 1992-2001) from a maximum of 43.2 per cent in 1981 to a minimum of 15.9 per cent in 1992. Royalties made up 34.9 per cent of revenues in 2001. Corporate income tax provided an average of 7.1 per cent of the Alberta government’s revenue between 1981-2001 (7.7 per cent for 1992-2001) from a minimum of 4.1 per cent in 1992 to a maximum of 10.5 per cent in 1997.

Investments brought in an average of 15.5 per cent of Alberta’s revenue between 1981 and 2001 (11.6 per cent for 1992-2001) from a minimum of 5.9 per cent in 2001 to a maximum of 22.3 per cent in 1982. Indirect taxes represented 14.4 per cent of Alberta’s revenue, on average, between 1981 and 2001 (19.2 per cent for 1992-2001) from a minimum of 5.6 per cent in 1981 to a maximum of 21.9 per cent in 1998. Federal transfers accounted for 12.5 per cent of Alberta provincial revenue, on average, from 1981 through 2001 (11.0 per cent for 1992-2001) from a minimum of 7.4 per cent in 1997 to a maximum of 19.8 per cent in 1992. The balance of Alberta’s average revenue for 1981 – 2001 consisted of “other current transfers from persons” (4.0 per cent) and contributions to social insurance plans (2.5 per cent). Budget Personal income tax revenue grew from 11.4 per cent of Alberta’s total budgeted revenue in 1985/86 to 21.3 per cent in 2002/03 and is expected to contribute 24.5 per cent in 2006/07. The average share for 1993/94 through 2002/03 was 20.9 per cent and is expected to be 22.0% for 2003/04 through 2006/07. Corporate income tax contributed 5.9 per cent of total revenue in 1985/86, 8.9 per cent in 2002/03 and is expected to contribute 8.8 per cent in 2006/07. The annual average contribution for 1993/94 through 2002/03 was 8.3 per cent and the average for 2003/04 through 2006/07 is expected to be 8.2 per cent. Federal transfers accounted for 13.4 per cent of Alberta’s provincial government revenue in 1985/86, 9.2 per cent in 2002/03 and is expected to account for 13.8 per cent in 2006/07. Average federal transfers for 1993/94 through 2002/03 were 9.4 per cent of revenue and are expected to be 13.1 per cent for 2003/04 through 2006/07. Royalties are an important source of Alberta’s government revenue, representing 37.1 per cent of total revenue in 1985/86, 31.5 per cent in 2002/03 and an expected 16.6 per cent in 2006/07. Average royalty revenue for 1993/94 through 2002/03 was 24.1 per cent and is expected to be 21.4 per cent for 2003/04 through 2006/07.
Average royalty revenue for1993/94 through 2002/03was 24.1 per cent and isexpected to be 21.4 percent for 2003/04 through2006/07.
Additional Information on Royalty Revenue Natural Resources Canada’s review of 2002 and outlook to 2015xxiv shows an average price for natural gas over the forecast period of $5.00 Cdn per Gigajoule (GJ); this is
18

below the price reported by the government of Alberta for the 2003/04 fiscal year but above the price for the previous two and forecasts for the subsequent three years. As of January 1, 2002, Alberta had 45 trillion cubic feet (Tcf) of proved reserves and an estimated 70 Tcf of undiscovered reserves for a total of 115 Tcf which represents 46.4 per cent of Western Canada’s, 24.2 per cent of Canada’s and 5.5 per cent of North America’s proved reserves plus undiscovered reserves.xxv Alberta’s budget shows 2002/03 natural gas production at 5.4 trillion cubic feet (Tcf) and estimates 2006/07 production at 4.6 Tcf.xxvi Royalties from natural gas accounted for 72.0 per cent of total resource royalties in 2002/03 and are expected to represent 67.0 per cent in 2006/07.xxvii Further, the budget notes that “Conventional natural gas production has now begun to decline as well, and this trend is expected to continue despite high levels of drilling activity”.xxviii Although it is too early for any definitive estimates, Alberta may have considerable non-conventional natural gas resources from coalbed methane.xxix
Natural gas demand is forecast to be strong through 2015 with usage in the US estimated at 28 Tcf in 2015, which represents average annual increases of 1.8 per cent per year and Canadian usage in 2015 estimated at 4 Tcf, which represents average annual increases of 2.7 per cent per year.xxx
Conventional oil production in the Western Canada Sedimentary Basin (WCSB) is considered to be a mature producing environment, with 64 per cent of recoverable light crude and 46 per cent of heavy oil produced. The WCSB stretches across British Columbia, Alberta, Saskatchewan and Manitoba; most of the light crude oil and roughly one-third of the heavy crude oil in the WCSB is in Alberta. In contrast to conventional oil production, only about one per cent of Alberta’s oil sands resources had been produced as of 2000.xxxi Alberta’s oil sands deposits are estimated at 400 billion cubic metres (m3) of original bitumen in place, with 49 billion m3 considered to be recoverable.xxxii
US Department of Energy estimates put the price of oil between $23.30 and $27.00 in 2002 US dollars through 2025 with a low estimated price of $16.98 for all years and a high estimated price ranging from $31.16 in 2005 to $35.03 in 2025.xxxiii Oil price assumptions through 2006/07 in the Alberta budget are consistent with this range of prices. Fiscal Flexibility in Alberta As the province with the lowest tax burden, the lowest spending to GDP ratio and net financial assets rather than debt, Alberta currently has the greatest fiscal flexibility among the provinces. As of 2001/02, Alberta had net assets per capita of $2,942 while the other provinces had per capita net debt ranging from a low of $4,007 in British Columbia to a high of $17,071 in Newfoundland and Labrador. All-government spending as a per cent of GDP in Alberta averaged 33.0 per cent between 1981 and 2001 (31.2 per cent for 1992-2001),
19

well below the all-province average at 42.6 per cent for 1981 through 2001 (42.4 per cent for 1992-2001). Tax revenue as a per cent of GDP in Alberta averaged 7.8 per cent between 1981 and 2001 (8.8 per cent for 1992-2001), well below the all-province average at 12.7 per cent for 1981 through 2001 (13.5 per cent for 1992-2001). All this translates to Alberta being in the best position, among the provinces, to deal with the coming demographic challenges. This enviable position is not without threats, however, as discussed in the fiscal projection section. Summary — Population Aging and Government Finance in Alberta Population
• Under the high population projection, Alberta’s population growth rate slows to an average of 1.1 per cent for 2004 through 2026 from the 1971 to 2003 average of 2.0 per cent and population grows from 3.2 million in 2003 to 4.1 million in 2026.
• The child dependency ratio in Alberta has fallen from 5.1 in 1971 to 2.8 in 2003, and under the high population projection, is expected to fall further to 2.6 in 2011, before gradually increasing back to 2.8 in 2026.
• In general terms, a child dependency ratio of 2.8 means that there are just under 3 children for every 10 workers or people in the 15 to 64 age group.
• The elderly dependency ratio in Alberta has increased from 1.2 in 1971 to 1.5 in 2003, and under the high population projection, is expected to reach 2.9 in 2026.
• The total dependency ratio in Alberta has fallen from 6.3 in 1971 to 4.3 in 2003 and is expected to continue to fall until it reaches a trough of 4.2 in 2008; it is expected to increase to 5.8 in 2026, driven by the aging of the population.
• If we look only at the total dependency ratio, Alberta’s aging population does not appear to be a severe problem except for the fact that health care costs are much higher in the last few years of life; demographic change reflected in the increase in the elderly dependency ratio is the main factor expected to drive public health care costs up.
• Alberta’s fertility rate has fallen from 2.4 (above the replacement rate of 2.1) in 1971 to 1.5 in 2003 (below replacement), and under the high population projection, is expected to increase to 1.9 in 2026.
Government Spending
• Alberta’s provincial government spending increased by 6.4 per cent per year on average between 1982 and 2001 and by 4.6 per cent per year between 1992 and 2001. Government spending grew faster than the sum of population growth and inflation by 1.5 per cent per year on average between 1982 and 2001 and by 0.9 per cent between 1992 and 2001.
• Alberta provincial government spending as a per cent of GDP averaged 17.5 per cent between 1981 and 2001 (16.5 per cent for 1992-2001), ranging from a minimum of 13.3 per cent in 1981 to a maximum of 21.6 per cent in 1992.
20

• On average, all-government spending as a per cent of GDP in Alberta between 1981 and 2001 at 33.0 per cent was well below the Canadian average of 42.6 per cent (31.2 per cent vs. 42.4 per cent for 1992-2001).
• In Alberta’s provincial government budget, health and education spending combined represented 42.4 per cent of total spending in 1985/86, 60.3 per cent in 2002/03 and is expected to reach 65.9 per cent in 2006/07.
• Government health care spending in Alberta has grown from 3.6 per cent of provincial GDP in 1981/82 to 5.6 per cent in 1990/91 and is forecast to be 4.9 per cent in 2003/04.
• Real per capita health expenditures have increased by 2.2 per cent per year on average between 1980/81 and 2003/04 while real GDP per capita has only grown an average of 1.5 per cent per year between 1982 and 2003.
Government Revenue
• According to the Provincial Economic Accounts, average provincial government revenues for Alberta over the 1981 through 2001 period are roughly as follows:
o 25.1 per cent from natural resource royalties o 18.7 per cent from personal income tax o 15.5 per cent from investment income o 14.4 per cent from indirect taxes o 12.5 per cent from federal transfers o 7.1 per cent from corporate income tax o 4.0 per cent from other current transfers from persons o 2.5 per cent from contributions to social insurance plans
• Royalties on resource revenue represented roughly one-quarter of Alberta’s provincial government budget revenues between 1993/94 and 2002/03 and is expected to account for more than one-fifth for 2003/04 through 2006/07.
• Prices for Alberta’s key revenue-generating royalty resources, oil and natural gas, appear strong over the near-term. Alberta has a high bitumen-based oil supply remaining, and although conventional natural gas production is in decline, there may be considerable non-conventional sources in Alberta.
xxii The interprovincial migration figure shows just how variable this component of population growth is and why it is difficult to predict. Although the projection will probably be “wrong” in any given year, the average should be more or less accurate over long time periods. xxiii Email correspondence with Statistics Canada. xxiv Natural Resources Canada (2003), page 54. xxv Ibid, page 19. xxvi Government of Alberta (2004), Fiscal Plan Tables, page 61. xxvii Ibid, Fiscal Plan, page 42. xxviii Ibid, Fiscal Plan, page 34. xxix National Energy Board (2003), page 66. xxx Natural Resources Canada (2003), page 44. xxxi National Energy Board (2003), page 52. xxxii Ibid, page 52 and Appendix Table A5.1. xxxiii United States Department of Energy (2004), page 108.
21
IV. Rural to Urban Migration in Alberta Rural to urban migration, commonly referred to as agglomeration, can be seen in Alberta and throughout the world. People are drawn to urban areas for a variety of reasons; among them are for employment opportunities, to get better access to services, to reduce commute time, and for access to a broader selection of cultural and entertainment activities. Phenomenon seen around the world The United Nations’ World Urbanization Prospects: The 2003 Revision, presents estimates and projections of urban and rural populations over the period 1950 through 2030 and estimates and projections of the population in urban agglomerations over 1950 through 2015. The main findings for the global population are:
• The urban population is expected to rise to 5.0 billion by 2030 (61 per cent of world’s population) while the rural population is expected to decline from 3.3 to 3.2 billion.
• If this projection is accurate, the urban population will outnumber the rural population by 2007.
• Agglomeration is occurring faster in less developed countries (2.3 per cent annual average growth expected over 2000 – 2030) than in more developed countries (0.5 per cent annual average growth expected over 2000 – 2030); almost all population growth over the next thirty years is expected to occur in the smaller cities (fewer than 500,000 people) in less developed countries.
Although more developed countries already have high proportions of their population living in urban areas, the proportion is expected to increase, on average, from 74 per cent in 2003 to 82 per cent in 2030. The share of population in urban areas in North America is expected to increase from 80 per cent in 2003 to 87 per cent in 2030. The report also notes that almost 40 per cent of the population of the more developed regions lives in small urban settlements.
The share of populationin urban areas in NorthAmerica is expected toincrease from 80 percent in 2003 to 87 percent in 2030.
In 2003, Calgary was 403rd in size out of 408 urban agglomerations and is expected to move up to 353rd by 2015. Toronto ranked 48th in 2003 and is expected to maintain that rank in 2015. Tokyo is the world’s largest urban agglomeration which, at 35.0 million people in 2003, has a larger population than all of Canada, which was 31.7 million in January of 2004. Tokyo is expected to grow to 36.2 million people by 2015. Also of interest in the report is the divergence between less and more developed countries when it comes to government policies towards agglomeration; only 12 per cent of more developed countries have enacted policies to reduce agglomeration while nearly 75 per
22

cent of less developed countries have such a policy. A World Bank reportxxxiv suggests that the developed countries have the correct approach as such policies are unlikely to succeed. The World Bank notes:
“The unhappy record of past government efforts to prevent rural-urban migration or to steer urban growth to particular locations leads to a straight-forward conclusion: governments are not skilled at deciding where households and firms should locate … Governments can perform a useful function by working to provide an environment conducive to economic growth, regardless of location.”
Province Specific Studies Three recent studies provide some interesting insights into the agglomeration process in general as well as some Alberta-specific facts. Burleton (2003) looks at the growth of the “Calgary-Edmonton corridor” while Stabler and Olfert (2002) analyse the “functional economic areas” in the Canadian prairie provinces and Azmier and Dobson (2003) discuss Western Canada’s “rural metro-adjacent areas.” Statistics and figures presented below come from the study under review. Edmonton-Calgary corridor likely to be the concentration of growth within Alberta Agglomeration in Alberta is highlighted by the performance of the Calgary-Edmonton corridor. This corridor is defined in a recent publication from TD Economicsxxxv as extending roughly 260 kilometres along Highway 2, encompassing the Edmonton and Calgary Census Metropolitan Areas (CMAs), as well as Spruce Grove, Leduc, Wetaskiwin, and Red Deer. With approximately 1.9 of the region’s 2.2 million people, economic activity is concentrated in the Calgary and Edmonton CMAs although the authors note the rest of the region benefits from their proximity to the main centres. The corridor is a standout in Canada because its GDP per capita, at $40,000 US (PPP basis), is 10 per cent the average of US metropolitan areas and 40 per cent above other Canadian areas. The region’s real GDP growth averaged 4.2 per cent over the last decade, and it had one of the strongest job creation records in North America over the 1992 – 2001 period and population growth (12.3 per cent between 1996 and 2001) exceeding Alberta’s (5.3 per cent), other Canadian urban agglomerations (5.5 per cent) and US metropolitan areas (5.3 per cent).
The corridor is a standout inCanada because its GDP percapita, at $40,000 US (PPPbasis), is 10 per cent theaverage of US metropolitanareas and 40 per cent aboveother Canadian areas.
23

24
Source: TD Economics, The Calgary Edmonton Corridor, Take Action Now To Ensure The Tiger’s Roar Doesn’tFade, Burleton (2003).
Among urban agglomerations, the corridor places about 25th in North America and fourth in Canada behind Ontario’s extended Golden Horseshoe at 6.7 million, Montreal and region at 3.7 million and BC’s Lower Mainland and Southern Vancouver Island (3.7 million). The corridor has benefited from interprovincial mi-gration from BC and the Atlantic provinces. The majority of these new migrants are aged 25 to 44 years which has helped keep the average age of the corridor’s population at 35.2 years. This is younger than the Canadian average by 2.4 years and is close to that found in the US. Functional Economic Areas Areas in Alberta The Stabler and Olfert study, which identifies geographic regions for planning purposes, starts with an interesting and informative review of studies about how urban centres influence behaviour in surrounding areas and the limits of this influence. While many of the studies referenced are for the US they provide useful insights for Canada as well.
Figure IV.1: The Calgary –Edmonton Corridor

25
Some of the findings in the literature review are:
• Regionally defined labour market areas (LMAs) experienced greater population growth than areas outside of the LMAs.xxxvi
• Urban centers had to achieve a threshold of 40,000 to 50,000 in population to exert any significant influence.xxxvii
• The maximum distance for rural areas to benefit from metro area growth is 50 to 60 miles.xxxviii
• Saskatoon and Regina, the largest labour market areas (LMAs) in Saskatchewan, draw on significant geographic areas to fulfill their labour market needs, and commuters to these two cities (as a per cent of the resident labour force in surrounding areas) fell to below five per cent once one reached a driving distance of approximately 90 kms.xxxix
The authors go through a 3- step process to create a system of Functional Economic Areas (FEA, see box for definition) for each of Alberta, Saskatchewan and Manitoba. Only the results pertaining to Alberta are discussed.
Ninety-seven per cent of Alberta’s population lives in one of ten FEAs. The other three per cent live in northern areas not included in the FEA system.
Functional Economic Areas (FEAs): Functional Economic Areas (FEA) aredefined by combining commuting andshopping patterns. A Functional EconomicArea is one which contains the work,shopping and public service needs ofresidents. According to Stabler et al. (2002),
“Almost all the labour resident in the area is employedwithin the area and most of the everyday goods andservices consumed in the area are purchased within itsboundaries. Similarly most of the K-12 student populationliving in the area attends school within the area and mostof its residents obtain routine health and medical carewithin the area.”
Functional Economic Areas In Alberta
Source: Functional Economic Areas of the Canadian Prairie Region,Stabler and Olfert, 2002.
Figure IV.2: Functional Economic Areas in Alberta

Twenty per cent of the labour force in Alberta commutes to work and 80.7 per cent of commuters work within their FEA of residence. A further 12.5 per cent commuted to work in a different Alberta FEA and 6.8 per cent left the province to work. The authors note that “Of the within FEA commuters, the dependence of rural dwellers on employment in the urban economy can be seen in the journeys from rural residences to places of work in focal point communities.” Ninety-four per cent of the rural dwellers working within the FEA of residence have jobs in urban focal points.
Labour Market Areas (LMAs): A labour market area may bedefined as an area that is largeenough to contain theworkplaces of most of thepeople who reside within it andthe residences of most of thepeople who work within it.
The authors also note that “[t]he viability of the FEA economies is based in large part on the job-generating capacity of larger communities within the region. A growing urban economy will attract commuters from adjacent rural areas…” Burgeoning Fringe Although The Burgeoning Fringe: Western Canada's Rural Metro-Adjacent Areasxl is focused on the public policy and planning issues related to rural metro-adjacent areas in Western Canada, it has some interesting insights about agglomeration. Population growth in Alberta’s RMAs between 1996 and 2001 was 15.5 per cent, well above the growth of the urban cores at 11.6 per cent. While rural areas experience economic difficulties and minimal population growth, RMA regions are flourishing and “are becoming younger, more family-orientated places, with diverse incomes and high levels of non-farm employment.”xli
Rural Metro-Adjacent Areas (RMAs): An RMA is defined as those regionsnot classified as part of the urbancore (therefore outside the corecity part of a census metropolitanagglomeration (CMA)), but that aredirectly adjacent to those urbancores and/or within a reasonablyshort commuting distance.
The RMAs in the west have relatively few people moving out (57.5 per cent of residents have not moved in five years) and a high percentage (25.8 per cent) of migrants locating within their boundaries. The authors note that “Of the migrants moving into RMA communities, most (71.8 per cent) are from within the province—either rural residents moving closer to an urban core, or urban residents moving out from an urban core.”xlii Perhaps the most important insight contained in this paper is that the inclusion of these rural metro-adjacent areas within the “rural heartland” is a barrier to effective rural policy development because the prosperity of these RMAs masks what is going on in “truly” rural areas. The authors note that “Through this analysis we have learned about the
26
prosperity of the rural RMA zones, but can only infer that the rural heartland must be substantially less well off based on these positive data points along the edge of what is defined as rural.”xliii
xxxiv World Bank (1999), pages 125-127. xxxv Burleton (2003). xxxvi Fox and Kumar (1965). xxxvii Berry (1970). xxxviii Mitchelson and Fisher (1987). xxxix Stabler et al. (1996). xl Azmier and Dobson (2003). xli Ibid, page 1. xlii Ibid, page 5. xliii Ibid, page 12.
27

Alberta Population by Census Division, 1996 to 2026 Upon request, Statistics Canada created a projection for Alberta’s 19 Census Divisions using “Projection 2 – Medium Population Growth” (as in scenario 2 in this paper). Estimates for 1996 through 2002, as well as projections for 2003 through 2026, were provided. A projection based on high growth (as in scenario 1 in this paper) was not available at the time the analysis was undertaken nor is one expected to be available soon. Under the medium projection, Alberta’ population rises to 3.6 million by 2026 as opposed to 4.1 million under the high projection. As with the fiscal projections presented elsewhere in this paper, these projections represent an attempt to create a reasonable picture of what Alberta may look like in the future. As described in the methodology note from Statistics Canada, these projections are based on the previous three year trends from 1999 through 2001. The methodology note has been modified slightly from the original text to enhance clarity. Dependency Ratios by Census Division The child, elderly and total dependency ratios by Census Division (CD) presented below show impacts of aging that can be expected if demographic changes continue in the path established during the 1999 through 2002 period. As with the fiscal model presented later in the paper, these projections are not predictions of what will happen. The projection described below represents one possible path for population by Census Division in Alberta. For reference, Appendix B lists the communities that are included in each of Alberta’s Census Divisions. Child Dependency Child dependency ratios are expected to decrease in all of Alberta’s Census Divisions (CDs) between 2001 and 2026. The largest per cent decreases are expected in the St. Paul, Slave Lake and Red Deer CDs.
Census Division Urban Centre 1996 2001 2006 2011 2016 2021 2026
2001 - 2026
Change
2001 - 2026
Percent Change
1 Medicine Hat 33.6 30.3 27.9 27.0 27.0 27.5 27.6 (2.7) (8.9)2 Lethbridge 35.8 32.7 29.2 27.0 26.7 27.3 27.4 (5.4) (16.4)3 Pincher Creek 42.9 36.9 33.3 32.2 33.7 35.4 35.7 (1.2) (3.3)4 Hanna 37.6 32.5 28.4 24.9 26.1 27.3 27.0 (5.5) (16.9)5 Drumheller 39.3 35.2 32.0 30.1 29.9 30.6 31.0 (4.2) (11.9)6 Calgary 30.6 27.4 24.8 23.2 22.7 22.9 23.4 (4.0) (14.5)7 Stettler 36.8 33.2 30.5 29.2 29.6 31.2 32.0 (1.2) (3.6)8 Red Deer 36.3 32.0 28.2 26.1 25.7 26.2 26.4 (5.6) (17.4)9 Rocky Mountain House 39.9 34.3 31.8 30.7 31.2 31.7 32.0 (2.3) (6.7)10 Camrose 35.1 30.0 25.7 23.9 24.5 25.4 25.4 (4.7) (15.5)11 Edmonton 31.7 28.0 24.8 22.9 22.9 23.3 23.5 (4.5) (16.1)12 St. Paul 43.9 39.2 33.2 29.2 28.7 29.7 30.2 (9.0) (22.9)13 Whitecourt 36.2 31.8 27.8 25.6 25.7 26.7 27.0 (4.8) (15.1)14 Edson 37.0 32.4 29.5 26.4 26.4 27.2 28.1 (4.3) (13.3)15 Banff 25.3 23.9 23.2 21.2 19.9 19.7 20.2 (3.6) (15.3)16 Wood Buffalo 36.8 31.7 28.9 27.4 27.1 27.2 27.1 (4.6) (14.6)17 Slave Lake 50.9 49.0 44.7 40.3 38.7 39.2 39.5 (9.5) (19.3)18 Grande Cache 39.2 36.7 35.9 33.9 33.8 34.3 35.9 (0.9) (2.3)19 Grande Prairie 37.0 32.7 30.1 28.1 27.5 27.5 27.3 (5.5) (16.7)
Alberta 33.3 29.6 26.3 24.4 24.2 24.7 25.0 (4.6) (15.4)Canada 29.9 27.6 24.7 22.5 22.3 22.8 23.3 (4.3) (15.5)
Sources: Abacus Economics; Statistics CanadaNote: Child dependency = ages 0-14 / ages 15-64
Table IV.1: Child Dependency Ratio
28

The Slave Lake CD had the highest child dependency ratio at 50.9 in 2001 and is expected to have the highest, at 39.5, in 2026. St. Paul was second-highest in 2001 at 43.9, but Grande Cache is expected to overtake this position by 2026 with a ratio of 35.9. The Banff CD had the lowest child dependency ratio in 2001 at 23.9 and is expected maintain that position with a ratio of 20.2 in 2026. Calgary was the second-lowest in 2001 at 30.6 and Edmonton the third-lowest in 2001 at 28.0. Calgary and Edmonton are expected to maintain these positions with respective 2026 ratios of 23.4 and 23.5. The child dependency ratio for Alberta is expected to drop by 15.4 per cent from 33.3 in 2001 to 25.0 in 2026. This mirrors the drop in Canada (15.5 per cent), but Alberta starts and ends with a slightly higher child dependency ratio than the country as a whole, suggesting Alberta’s population is expected to remain younger than the Canadian average. Elderly Dependency Elderly dependency ratios are expected to increase in all of Alberta’s Census Divisions (CDs) between 2001 and 2026. Per cent increases in excess of 200 per cent are expected in the Wood Buffalo, Grande Cache and Edson CDs. Eleven of the nineteen CDs are expected to have elderly dependency ratios in excess of the provincial average, which is expected to more than double between 2001 and 2026. Variations in elderly dependency ratios among Census Divisions are important because, even though all areas can expect increased pressures on health care funding related to aging, those with above-average increases in elderly dependency may have above average cost increases due to the concentration of health care spending near the end of life.
Census Division Urban Centre 1996 2001 2006 2011 2016 2021 2026
2001 - 2026
Change
2001 - 2026
Percent Change
1 Medicine Hat 21.3 21.4 21.1 21.5 23.8 27.9 32.4 11.0 51.32 Lethbridge 18.9 18.3 18.0 18.8 21.4 25.3 29.7 11.4 62.43 Pincher Creek 22.0 21.6 22.3 23.8 26.6 30.7 35.3 13.7 63.34 Hanna 23.4 24.2 24.6 25.7 29.7 35.3 40.2 16.0 65.95 Drumheller 19.8 19.1 19.4 20.8 24.4 29.2 35.1 16.0 83.66 Calgary 12.5 12.8 13.8 15.7 19.4 24.5 30.5 17.7 138.47 Stettler 22.6 21.7 21.0 21.5 23.8 27.8 32.4 10.7 49.18 Red Deer 16.0 15.8 16.2 17.1 19.8 24.1 29.5 13.6 86.19 Rocky Mountain House 14.6 16.1 18.7 21.8 25.1 29.1 35.2 19.2 119.410 Camrose 26.0 24.1 22.5 22.8 25.1 28.4 32.5 8.4 35.111 Edmonton 14.2 15.0 16.3 18.3 22.2 27.4 33.4 18.3 121.912 St. Paul 14.5 14.8 15.6 16.9 19.3 23.1 28.4 13.6 92.213 Whitecourt 19.2 19.1 19.8 21.5 24.9 29.9 35.1 16.0 83.414 Edson 10.7 11.9 14.1 16.8 22.0 28.6 36.9 25.0 209.115 Banff 11.5 11.7 13.2 15.1 19.4 26.0 32.5 20.7 176.316 Wood Buffalo 2.5 2.6 3.8 6.4 10.1 15.0 19.8 17.1 656.217 Slave Lake 8.5 9.3 10.4 11.7 13.7 16.6 20.2 10.9 117.118 Grande Cache 7.2 10.7 15.7 21.9 30.6 39.0 48.0 37.3 347.219 Grande Prairie 12.1 12.3 13.4 15.0 17.8 22.0 26.9 14.7 119.5
Alberta 14.4 14.7 15.7 17.4 20.9 25.8 31.6 16.9 115.7Canada 17.9 18.5 19.2 20.8 24.3 28.5 33.6 15.1 81.9
Sources: Abacus Economics; Statistics CanadaNote: Elderly dependency = ages 65+ / ages 15-64
Table IV.2: Elderly Dependency Ratio
In 2001, the highest elderly dependency ratio (24.2) was in Hanna. Hanna is expected to have the second-highest ratio (40.2) in 2026. Grande Cache is expected to age
29

significantly, moving from third-lowest dependency (10.7) in 2001 to the highest (48.0) in 2026. Wood Buffalo is expected to have the lowest ratio in 2001 (2.6) and in 2026 (19.8). Calgary has the seventh-lowest ratio (12.8) in 2001 and is expected to have the same position in 2026 (30.5). Edmonton is ninth-lowest in 2001 (15.0) and can expect aging to move it to twelfth-lowest by 2026 (33.4). Alberta’s elderly dependency ratio is expected to more than double from 14.7 in 2001 to 31.6 in 2026. Although this increase is greater than that expected for Canada, Alberta can still expect a lower elderly dependency ratio than Canada’s in 2026 (33.6). Total Dependency Total dependency is expected to increase in all of Alberta’s Census Divisions between 2001 and 2026. Projected increases range from 2.5 per cent in Slave Lake to 76.7 per cent in Grande Cache. Average total dependency in 2026 is expected to be 56.6 with a low of 46.8 in Wood Buffalo and a high of 83.9 in Grande Cache.
Census Division Urban Centre 1996 2001 2006 2011 2016 2021 2026
2001 - 2026
Change
2001 - 2026
Percent Change
1 Medicine Hat 54.9 51.7 49.0 48.6 50.8 55.4 60.0 8.3 16.12 Lethbridge 54.7 51.0 47.2 45.8 48.1 52.6 57.1 6.1 11.93 Pincher Creek 64.8 58.6 55.7 56.0 60.3 66.1 71.0 12.5 21.34 Hanna 61.0 56.8 53.0 50.6 55.8 62.6 67.2 10.5 18.55 Drumheller 59.1 54.3 51.4 50.9 54.3 59.9 66.1 11.8 21.76 Calgary 43.1 40.2 38.6 38.9 42.1 47.4 53.9 13.7 34.17 Stettler 59.5 54.9 51.6 50.7 53.4 59.0 64.4 9.5 17.28 Red Deer 52.3 47.8 44.4 43.1 45.5 50.3 55.9 8.1 16.99 Rocky Mountain House 54.5 50.4 50.5 52.5 56.3 60.8 67.2 16.8 33.410 Camrose 61.1 54.1 48.2 46.7 49.6 53.8 57.9 3.8 7.011 Edmonton 45.9 43.1 41.0 41.2 45.1 50.7 56.9 13.8 32.112 St. Paul 58.4 54.0 48.8 46.1 48.1 52.8 58.6 4.6 8.613 Whitecourt 55.4 50.9 47.7 47.1 50.5 56.5 62.1 11.2 21.914 Edson 47.7 44.3 43.7 43.2 48.5 55.8 65.0 20.7 46.615 Banff 36.8 35.6 36.4 36.3 39.3 45.7 52.7 17.1 47.916 Wood Buffalo 39.4 34.3 32.7 33.8 37.2 42.2 46.8 12.5 36.617 Slave Lake 59.5 58.3 55.1 52.0 52.4 55.8 59.8 1.4 2.518 Grande Cache 46.4 47.5 51.6 55.8 64.4 73.3 83.9 36.4 76.719 Grande Prairie 49.1 45.0 43.5 43.1 45.2 49.5 54.2 9.2 20.4
Alberta 47.7 44.2 42.0 41.8 45.1 50.5 56.6 12.4 28.0Canada 47.7 46.0 43.9 43.3 46.6 51.3 56.9 10.9 23.6
Note: Total Dependency = sum of Child and Elderly DependencySources: Abacus Economics; Statistics Canada
Table IV.3: Total Dependency Ratio
The highest total dependency ratio in 2001 is 58.6 in Pincher Creek, which is expected to drop to second-highest at 71.0 in 2026. The lowest total dependency ratio was in Wood Buffalo (34.3) in 2001 and is expected to remain there at 46.8 in 2026. Calgary had the third-lowest ratio in 2001 (40.2) and can expect the same in 2026 (53.9). Edmonton had the fourth-lowest ratio in 2001 (43.1) and can expect the sixth-lowest in 2026 (56.9). Total dependency in Alberta is expected to grow by 28.0 per cent from 44.2 in 2001 to 56.6 in 2026. Canada starts with a higher dependency ratio at 46.0 in 2001 but can expect a smaller increase in dependency to move essentially equal with Alberta at 56.9 in 2026.
30
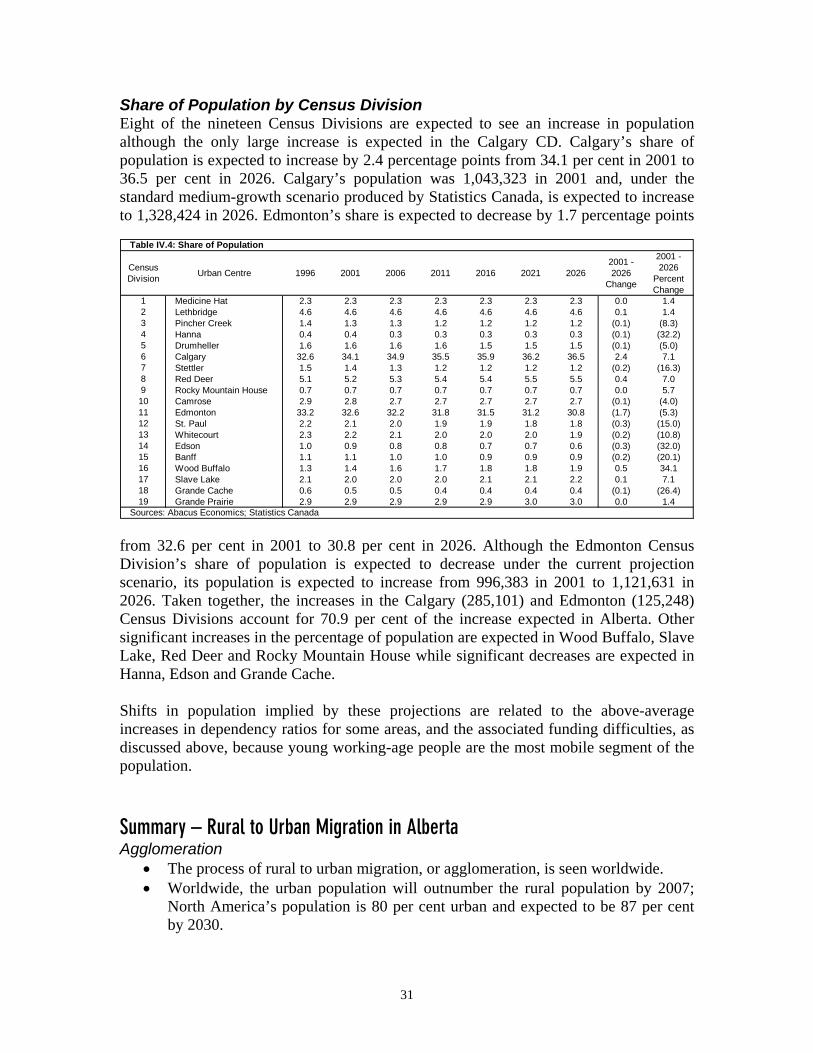
Share of Population by Census Division
Census Division Urban Centre 1996 2001 2006 2011 2016 2021 2026
2001 - 2026
Change
2001 - 2026
Percent Change
1 Medicine Hat 2.3 2.3 2.3 2.3 2.3 2.3 2.3 0.0 1.42 Lethbridge 4.6 4.6 4.6 4.6 4.6 4.6 4.6 0.1 1.43 Pincher Creek 1.4 1.3 1.3 1.2 1.2 1.2 1.2 (0.1) (8.3)4 Hanna 0.4 0.4 0.3 0.3 0.3 0.3 0.3 (0.1) (32.2)5 Drumheller 1.6 1.6 1.6 1.6 1.5 1.5 1.5 (0.1) (5.0)6 Calgary 32.6 34.1 34.9 35.5 35.9 36.2 36.5 2.4 7.17 Stettler 1.5 1.4 1.3 1.2 1.2 1.2 1.2 (0.2) (16.3)8 Red Deer 5.1 5.2 5.3 5.4 5.4 5.5 5.5 0.4 7.09 Rocky Mountain House 0.7 0.7 0.7 0.7 0.7 0.7 0.7 0.0 5.710 Camrose 2.9 2.8 2.7 2.7 2.7 2.7 2.7 (0.1) (4.0)11 Edmonton 33.2 32.6 32.2 31.8 31.5 31.2 30.8 (1.7) (5.3)12 St. Paul 2.2 2.1 2.0 1.9 1.9 1.8 1.8 (0.3) (15.0)13 Whitecourt 2.3 2.2 2.1 2.0 2.0 2.0 1.9 (0.2) (10.8)14 Edson 1.0 0.9 0.8 0.8 0.7 0.7 0.6 (0.3) (32.0)15 Banff 1.1 1.1 1.0 1.0 0.9 0.9 0.9 (0.2) (20.1)16 Wood Buffalo 1.3 1.4 1.6 1.7 1.8 1.8 1.9 0.5 34.117 Slave Lake 2.1 2.0 2.0 2.0 2.1 2.1 2.2 0.1 7.118 Grande Cache 0.6 0.5 0.5 0.4 0.4 0.4 0.4 (0.1) (26.4)19 Grande Prairie 2.9 2.9 2.9 2.9 2.9 3.0 3.0 0.0 1.4
Sources: Abacus Economics; Statistics Canada
Table IV.4: Share of Population
Eight of the nineteen Census Divisions are expected to see an increase in population although the only large increase is expected in the Calgary CD. Calgary’s share of population is expected to increase by 2.4 percentage points from 34.1 per cent in 2001 to 36.5 per cent in 2026. Calgary’s population was 1,043,323 in 2001 and, under the standard medium-growth scenario produced by Statistics Canada, is expected to increase to 1,328,424 in 2026. Edmonton’s share is expected to decrease by 1.7 percentage points
from 32.6 per cent in 2001 to 30.8 per cent in 2026. Although the Edmonton Census Division’s share of population is expected to decrease under the current projection scenario, its population is expected to increase from 996,383 in 2001 to 1,121,631 in 2026. Taken together, the increases in the Calgary (285,101) and Edmonton (125,248) Census Divisions account for 70.9 per cent of the increase expected in Alberta. Other significant increases in the percentage of population are expected in Wood Buffalo, Slave Lake, Red Deer and Rocky Mountain House while significant decreases are expected in Hanna, Edson and Grande Cache. Shifts in population implied by these projections are related to the above-average increases in dependency ratios for some areas, and the associated funding difficulties, as discussed above, because young working-age people are the most mobile segment of the population. Summary – Rural to Urban Migration in Alberta Agglomeration
• The process of rural to urban migration, or agglomeration, is seen worldwide. • Worldwide, the urban population will outnumber the rural population by 2007;
North America’s population is 80 per cent urban and expected to be 87 per cent by 2030.
31

• In 2003, Calgary was 403rd in size out of 408 urban agglomerations and is expected to move up to 353rd by 2015.
• Governments should not try to influence where households and firms locate but should try to provide an environment helpful to economic growth, no matter where people locate.
• The Calgary-Edmonton is likely to contain much of Alberta’s economic activity. The corridor is a standout in Canada because its GDP per capita is 10 per cent above the average of US metropolitan areas and 40 per cent above other Canadian areas, it had one of the strongest job creation records in North America over the 1992 – 2001 period and population growth was more than double that in Alberta as well as other Canadian urban agglomerations and US metropolitan areas
• Generally speaking, a Functional Economic Area (FEA) employs all the labour and satisfies the everyday consumption and service needs of the resident population. Ninety-seven per cent of Alberta’s population lives in one of ten FEAs.
• The inclusion of geographic areas as rural that may be more closely linked to urban areas may mask the true picture of what is going on in rural areas as these “metro-adjacent” areas have experienced strong population growth.
Population Projections by Census Division
• Child dependency ratios are expected to decrease in all of Alberta’s Census Divisions (CDs) between 2001 and 2026; Banff, Calgary and Edmonton CDs are expected to have the lowest ratios in 2026.
• Elderly dependency ratios are expected to increase in all of Alberta’s CDs between 2001 and 2026; eleven of the nineteen CDs are expected to have elderly dependency ratios in excess of the provincial average, which is expected to more than double between 2001 and 2026.
• Total dependency is expected to increase in all of Alberta’s Census Divisions between 2001 and 2026.
• Eight of the nineteen Census Divisions are expected to see an increase in population; although, the only large increase is expected in the Calgary CD.
• All areas can expect increased pressures on health care funding related to aging; those areas with declining populations and above average increases in elderly dependency may face especially difficult times.
32

V. A Fiscal Projection for Alberta Introduction Readers should be aware of the limitations of the approach used in this paper. The projections presented herein, while reasonable approximations of the future based on information available today, are forecasts of what may happen, not what will happen. The scenarios in this paper rely on assumptions about productivity growth rates, changes in the structure of the population and the constancy of several age-related distributions, which may or may not hold true. One other assumption is that the tax system remains as it is presented in the most recent budget. Effectively, any announced tax changes are incorporated into the model because these tax changes are reflected in budget revenue estimates, which are accounted for in the model. The tax system is assumed to remain as is beyond any announced tax changes. Further, these scenarios do not incorporate behavioral responses to changes in underlying conditions. The fact that the long-term projections of the type presented in this paper are likely to prove to be highly inaccurate does not mean that they are not worth presenting. Instead, as suggested by Hellerxliv, the uncertainty associated with the projections should be discussed as part of the modeling process. One of the most important assumptions that may not hold true is that of a constant age-sex distribution of public health care spending. Essentially, this assumption is used to project the current distribution of public health care spending by age and sex out to 2026. Many other factors will influence whether or not this project will accurately reflect spending through 2026, and the cost impacts, positive or negative, of many of these factors is open for debate. Some of these considerations are:
• Will pharmaceutical prices increase dramatically and will there be offsetting decreases in treatment time?
• Will new technologies improve treatment such that costs decrease or will they allow the treatment of previously untreatable illnesses?
• Will Canadians demand increased health services, such as national home care?
• Will global competition for health care providers dramatically increase the wages of doctors and nurses?
The answers to these and other relevant questions are unclear and beyond the scope of this paper. Recent Fiscal Projections For Canada The question of sustainability in Canada’s public spending programs in light of expected demographic changes has been of interest to many researchers lately. Some researchers have focused on public health spending, reflecting the fact that spending in this area is expected to be greatly influenced by population aging.
33

The Conference Board of Canadaxlv analyzed public health care expenditures in Canada and found that “public health expenditures are projected to rise from 31 per cent in 2000 to 42 per cent by 2020 as a share of total provincial and territorial government revenues.” A follow-up to this studyxlvi found that health spending was on track to reach 44 per cent of total provincial and territorial government revenues in 2020. Robsonxlvii, in an analysis of the medium-term feasibility of Canada’s public health spending found that, on average, “provincial spending on health care stood at just less than 30 per cent of revenue” and that this ratio “rises by some 7 percentage points of provincial budgets by 2020 and 20 percentage points by 2040.” Using a “generational accounting framework”, The International Monetary Fundxlviii reviewed the long-term fiscal position of Canada and found that “the results…are generally encouraging” but noted that “the analysis also illustrates that these conclusions could be easily overturned if pressures to spend the planning surpluses that are expected to emerge in coming years are not resisted and if measures are not put in place to contain the cost of health care.” The Organisation for Economic Co-operation and Developmentxlix used information provided by federal finance departments to review the medium-term fiscal implications of aging in member countries and found that Canada’s age-related spending is expected to rise from 17.9 per cent of GDP in 2000 (vs. an average of 16.9 per cent) to 26.6 per cent in 2050 (vs. an average of 22.4 per cent) and notes that, unlike most countries reviewed, Canada may see further pressures on spending from aging beyond 2050. A department of finance working paperl analyzed the long-term fiscal implications of demographic change on federal and provincial government revenue and expenditure and found that “based on our definition of existing fiscal structures and our criterion of long-term fiscal sustainability, most governments are projected to be in a fiscally sustainable position over the long term.” The definition of fiscal sustainability used in that paper is “a projected debt-to-GDP ratio that does not rise above its initial (2000/01) level at the end of the projection period.”li The authors note that “the (consolidated) provincial/territorial health spending projection…is in line with recent long-term structural projections presented in Robson (2001) and Brimacombe et al. (2001). This is however not entirely surprising given that all these studies adopt essentially the same projection approach and incorporate similar economic and demographic assumptions.”lii
Methodology Overview The Vision 2020 model uses an accounting framework to analyze potential fiscal impacts of demographic change on Alberta government spending and revenue through 2026. Government revenue and spending as well as Gross Domestic Product are projected as a function of real income per capita, inflation, population growth and changes in population composition.
34

The age-sex distribution for market income from Statistics Canada’s Social Policy Simulation Database and Model (SPSD/M) is used as the base distribution for projecting GDP. Similarly, the age-sex distribution for provincial personal income tax payable from the SPSD/M is used as the base distribution for projecting personal income tax revenues. The base fiscal data for the model are Statistics Canada’s Provincial Economic Accounts (PEA), which provide GDP for 1981 through 2003 and reasonably detailed government revenue and expenditure series from 1981 through 2001. The PEA data are augmented by other sources where necessary. The PEA does not contain detailed health or education spending data. Historical public health care spending data and detailed spending data by age and sex for 2001 are from the Canadian Institute of Health Information (CIHI). Aggregate education spending values are from the Government of Alberta’s 2004 Budgetliii and are converted to a calendar year from a fiscal year base. A detailed age-sex breakdown of government education spending in Alberta for 2001 is generated from Alberta level spending-by-education level data from the Pan-Canadian Education Indicatorsliv and detailed enrollment data for Canada from the OECD Online Education Databaselv. Historical PEA-budget relationships are analyzed, and where appropriate, used to extend the PEA time series out to 2005 in order to incorporate recent fiscal changes. Budget data for individual revenue and expenditure series are converted to a calendar year from a fiscal year base and the 1985 through 2001 average budget-to-PEA ratio is applied to budget forecasts for the revenue and spending series to estimate what the PEA values will be. For the revenue and spending series which can be extended, the projection model takes over from 2006 onwards. Other series are projected from 2002 onwards. Gross Domestic Product is projected from 2004 onwards using the interim 2003 value from the PEA as a base. The function of the projection model is identical regardless of the year of origin (2002, 2004 or 2006). Assumptions about real growth (to account for growth due to productivity gains), the inflation rate and population projections are applied to a detailed age-sex breakdown to project individual series. Method of Analysis: Sustainability in Future Government Spending Sustainability in government finance has many possible definitions that vary depending on what one views as the appropriate role for government in society. Some would accept a high level of taxation, government spending and even the accumulation of debt with the expectation that the budget would eventually be balanced while others would prefer a minimal level of taxation and government spending with a constantly balanced budget. Sustainability can be described along a continuum from a “lax” definition where taxation, spending and debt relative to GDP are allowed to rise to historically bounded but high ratios to a “tight” definition where taxation and spending are at the low levels suggested
35

by a minimal role for government and net debt is eliminated. In between these two extremes are a myriad of combinations of taxation, spending and debt levels which could reasonably be described as sustainable. This paper uses the relatively stringent measure of no increase in the government’s net debt as a per cent of GDP over the projection period with the added caveats that total provincial government expenditure should not exceed the 1981 – 2001 maximum ratio of 21.6 per cent of GDP, nor should provincial taxation revenue exceed the 1981 – 2001 maximum ratio of 10.6 per cent of GDP. This debt requirement allows for deficits but is violated if the net debt to GDP ratio in 2026 is higher than it was in 2001 (2001/02 fiscal). The 2001/02 level of net financial assets or liabilities (debt) is the most recent available from Statistics Canada’s Financial Management System.lvi Maximum spending and taxation ratios are chosen as an admittedly arbitrary upper bound for what levels of government activity Albertans are willing to accept and are included to capture the possibility of government meeting the debt criteria but with significant taxation and spending increases. A “lax” definition of sustainability for Alberta is also presented. The lax definition is based on the peak ratio of total provincial government net debt of 26.3 per cent of Canadian GDP which was reached in 1999. This allows for the accumulation of over $123 billion of net debt in Alberta by 2026. The expenditure bound of 24.1 per cent of GDP in the lax definition is based on the maximum all-province government spending to Canadian GDP ratio from 1981 – 2001. Similarly, the tax revenue bound of 14.6 per cent of GDP in this sustainability definition is based on the maximum all-province tax revenue to Canadian GDP ratio from 1981 – 2001. These bounds represent large increases in the level of government activity in Alberta and a substantial net debt. Selected Results
Fiscal Projection for Alberta, Base
-10
0
10
20
30
2001 2006 2011 2016 2021 2026Source: Abacus Economics
Perc
ent o
f GD
Per
c
Assets
SpendingRevenue
Balance
Figur Base e V.1: Fiscal Projection for Alberta,
ent o
f GD
P
Multiple projections were created under each of three population projection scenarios by making use of variant assumptions for the annual growth rate of health spending and/or the royalty revenue stream. A few illustrative scenarios are represented below. An overview of the results of all the projections is included in appendix A.
36

37
Table V.1: Revenue and Spending Components as a Percent of GDPRoyalty Revenues Under Different Assumptions
2001 2005 2010 2015 2020 2026Base 5.7 2.2 3.7 3.7 3.7 3.7
V1 5.7 2.2 3.7 3.7 3.7 3.7V2 5.7 2.2 2.8 2.8 2.8 2.8V3 5.7 2.2 2.8 2.8 2.8 2.8V4 5.7 2.2 3.7 3.7 3.7 3.7
Investment Income Under Different Assumptions2001 2005 2010 2015 2020 2026
Base 1.0 0.8 1.5 1.9 2.1 2.3
Scenario 1 — Strong Population Growth, Moderate Health Care Growth Base Results
V1 1.0 0.8 1.5 1.6 1.6 1.3V2 1.0 0.8 1.2 1.0 0.8 0.6V3 1.0 0.8 1.2 1.2 1.0 0.8V4 1.0 0.8 1.1 0.8 0.7 0.5
Health Spending Under Different Assumptions2001 2005 2010 2015 2020 2026
Base 4.9 4.9 5.1 5.3 5.7 6.3V1 4.9 4.9 5.2 5.7 6.3 7.2V2 4.9 4.9 5.2 5.7 6.3 7.2V3 4.9 4.9 5.1 5.3 5.7 6.3V4 4.9 4.9 5.1 5.3 5.7 6.3
Debt Service Cost (Interest) Under Different Assumptions2001 2005 2010 2015 2020 2026
Base 0.8 0.6 0.6 0.5 0.4 0.3V1 0.8 0.6 0.6 0.5 0.4 0.5V2 0.8 0.6 0.6 0.5 0.7 1.5V3 0.8 0.6 0.6 0.5 0.4 0.6V4 0.8 0.6 0.6 0.5 0.4 0.4
Source: Abacus Economics
Projections in this scenario produce population figures which are a close match to those presented in the 2004 Alberta budget although the trajectory in the budget indicates higher near-term population growth than that produced by this projection. However, as noted in the Alberta government’s recently released 20 year planlvii, this must moderate as “the government sees Alberta in 2025 as a province of four million people…” The strong, or high, population growth scenario presented in this paper results in a 2025 population of 4.1 million people. Scenario 1 — Base is presented as the benchmark projection based on the historical information and expectations about demographics, oil and gas production and prices and other key components of this model currently available.
Table V.2: Population Projections for Alberta
High Growth Medium Growth Low Growth
2001 3,057 3,057 3,0572006 3,282 3,239 3,2252011 3,502 3,372 3,3252016 3,717 3,490 3,4042021 3,919 3,590 3,4592026 4,101 3,665 3,486
All figures in thousands
Sources: Abacus Economics; Statistics Canada
Fiscal Projection for Alberta, Variant 2
-30
-20
-10
0
10
20
2001 2006 2011 2016 2021 2026Source: Abacus Economics
Pe o
f Grc
ent
DP
erf G
DP
Assets
Spending
Revenue
Balance
Figure V.2: Fiscal Projection for Alberta, Variant 2
cent
o
GDP grows at an annual average rate of 4.7 per cent from $152 billion in 2001 to $471 billion in 2026. Total revenue falls from 16.4 per cent of GDP in 2001 to 15.7 per cent in 2026 and total spending decreases from 15.5 per cent of GDP in 2001 to 14.6 per cent in 2026 with health spending growing from 4.9 per cent to 6.3 per cent of GDP over the period of analysis. Alberta’s fiscal balance (surplus or deficit position) increases from 0.9 per cent of GDP in 2001 to 2.1 per cent for 2013 through 2016 and then starts to fall, ending up at 1.1 per cent of GDP in 2026. This fiscal projection is sustainable through 2026 as net financial assets grow from 6.0 per cent of GDP in 2001 to 27.7
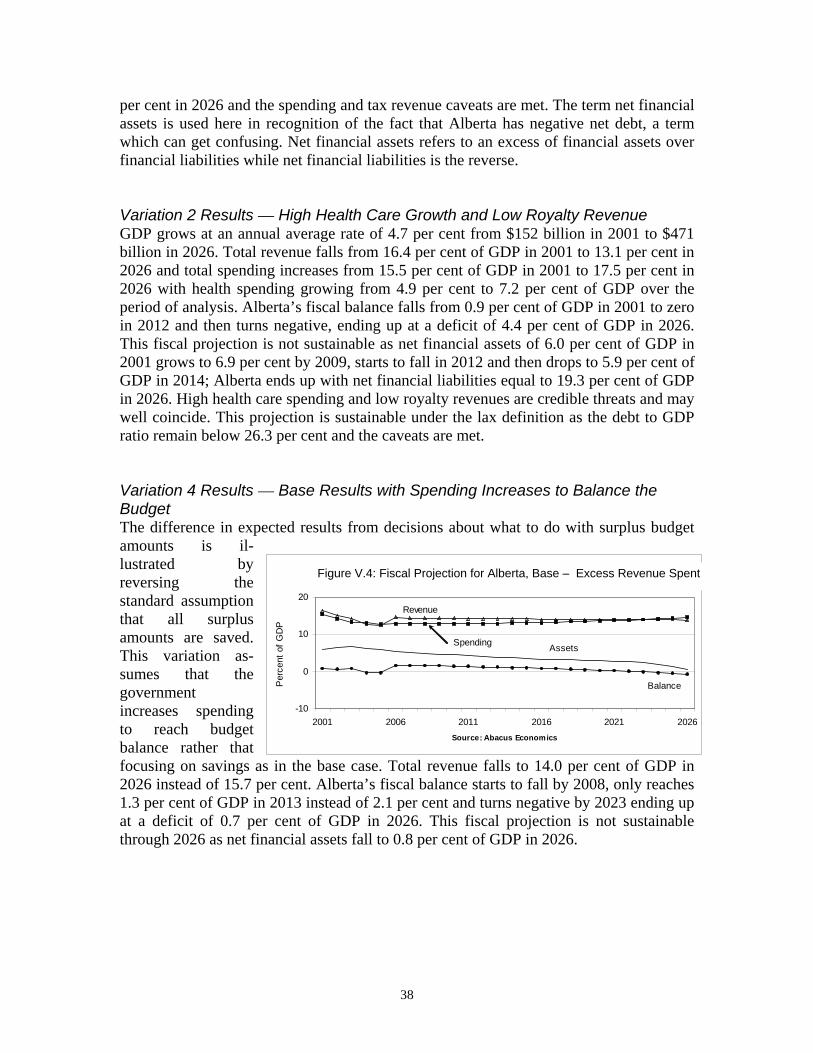
per cent in 2026 and the spending and tax revenue caveats are met. The term net financial assets is used here in recognition of the fact that Alberta has negative net debt, a term which can get confusing. Net financial assets refers to an excess of financial assets over financial liabilities while net financial liabilities is the reverse. Variation 2 Results — High Health Care Growth and Low Royalty Revenue GDP grows at an annual average rate of 4.7 per cent from $152 billion in 2001 to $471 billion in 2026. Total revenue falls from 16.4 per cent of GDP in 2001 to 13.1 per cent in 2026 and total spending increases from 15.5 per cent of GDP in 2001 to 17.5 per cent in 2026 with health spending growing from 4.9 per cent to 7.2 per cent of GDP over the period of analysis. Alberta’s fiscal balance falls from 0.9 per cent of GDP in 2001 to zero in 2012 and then turns negative, ending up at a deficit of 4.4 per cent of GDP in 2026. This fiscal projection is not sustainable as net financial assets of 6.0 per cent of GDP in 2001 grows to 6.9 per cent by 2009, starts to fall in 2012 and then drops to 5.9 per cent of GDP in 2014; Alberta ends up with net financial liabilities equal to 19.3 per cent of GDP in 2026. High health care spending and low royalty revenues are credible threats and may well coincide. This projection is sustainable under the lax definition as the debt to GDP ratio remain below 26.3 per cent and the caveats are met. Variation 4 Results — Base Results with Spending Increases to Balance the Budget
F tiscal Projection for Alberta, Base - Excess Revenue Spen
-10
0
10
20
2001 2006 2011 2016 2021 2026Source: Abacus Economics
Perc
ent o
f GD
Per
ceP
nt o
f GD
AssetsSpending
Revenue
Balance
The difference in expected results from decisions about what to do with surplus budget amounts is il-lustrated by reversing the standard assumption that all surplus amounts are saved. This variation as-sumes that the government increases spending to reach budget balance rather that focusing on savings as in the base case. Total revenue falls to 14.0 per cent of GDP in 2026 instead of 15.7 per cent. Alberta’s fiscal balance starts to fall by 2008, only reaches 1.3 per cent of GDP in 2013 instead of 2.1 per cent and turns negative by 2023 ending up at a deficit of 0.7 per cent of GDP in 2026. This fiscal projection is not sustainable through 2026 as net financial assets fall to 0.8 per cent of GDP in 2026.
Figure V.4: Fiscal Projection for Alberta, Base – Excess Revenue Spent
38

Scenario 2 — Medium Population Growth, Moderate Health Care Growth Base Results Table V.3: Revenue and Spending Components as a Percent of GDP
Royalty Revenues Under Different Assumptions2001 2005 2010 2015 2020 2026
Base 5.7 2.2 3.7 3.7 3.7 3.7V1 5.7 2.2 3.7 3.7 3.7 3.7V2 5.7 2.2 2.8 2.8 2.8 2.8V3 5.7 2.2 2.8 2.8 2.8 2.8V4 5.7 2.2 3.7 3.7 3.7 3.7
Investment Income Under Different Assumptions2001 2005 2010 2015 2020 2026
Base 1.0 0.8 1.5 1.9 2.3 2.5V1 1.0 0.8 1.5 1.7 1.7 1.4V2 1.0 0.8 1.2 1.0 0.9 0.7V3 1.0 0.8 1.3 1.2 1.1 0.9V4 1.0 0.8 1.1 0.9 0.7 0.6
Health Spending Under Different Assumptions2001 2005 2010 2015 2020 2026
Base 4.9 4.9 5.1 5.4 5.8 6.3V1 4.9 4.9 5.3 5.8 6.4 7.3V2 4.9 4.9 5.3 5.8 6.4 7.3V3 4.9 4.9 5.1 5.4 5.8 6.3V4 4.9 4.9 5.1 5.4 5.8 6.3
Debt Service Cost (Interest) Under Different Assumptions2001 2005 2010 2015 2020 2026
Base 0.8 0.6 0.7 0.5 0.4 0.4V1 0.8 0.6 0.7 0.5 0.4 0.5V2 0.8 0.6 0.7 0.6 0.7 1.5V3 0.8 0.6 0.7 0.5 0.4 0.6V4 0.8 0.6 0.7 0.5 0.4 0.4
Source: Abacus Economics
GDP grows at an annual average rate of 4.3 per cent from $152 billion in 2001 to $429 billion in 2026. Total revenue falls from 16.4 per cent of GDP in 2001 to 16.0 per cent in 2026 and total spending decreases from 15.5 per cent of GDP in 2001 to 14.5 per cent in 2026 with health spending growing from 4.9 per cent to 6.3 per cent of GDP over the period of analysis. Alberta’s surplus increases from 0.9 per cent of GDP in 2001 to 2.2 per cent in 2016 and then starts to fall, ending up at 1.4 per cent of GDP in 2026. This fiscal projection is sustainable through 2026 as net financial assets grow from 6.0 per cent of GDP in 2001 to 30.7 per cent in 2026 and the spending and tax revenue caveats are met. Variation Results — Low Royalty Revenue
Table V.4: Revenue and Spending Components as a Percent of GDPRoyalty Revenues Under Different Assumptions
2001 2005 2010 2015 2020 2026Base 5.7 2.2 3.7 3.7 3.7 3.7
V1 5.7 2.2 3.7 3.7 3.7 3.7V2 5.7 2.2 2.8 2.8 2.8 2.8V3 5.7 2.2 2.8 2.8 2.8 2.8V4 5.7 2.2 3.7 3.7 3.7 3.7
Investment Income Under Different Assumptions2001 2005 2010 2015 2020 2026
Base 1.0 0.8 1.6 2.0 2.4 2.8V1 1.0 0.8 1.5 1.7 1.8 1.5V2 1.0 0.8 1.2 1.1 0.9 0.7V3 1.0 0.8 1.3 1.3 1.2 1.0V4 1.0 0.8 1.1 0.9 0.7 0.6
Health Spending Under Different Assumptions2001 2005 2010 2015 2020 2026
Base 4.9 4.9 5.1 5.4 5.7 6.3V1 4.9 4.9 5.3 5.8 6.4 7.3V2 4.9 4.9 5.3 5.8 6.4 7.3V3 4.9 4.9 5.1 5.4 5.7 6.3V4 4.9 4.9 5.1 5.4 5.7 6.3
Debt Service Cost (Interest) Under Different Assumptions2001 2005 2010 2015 2020 2026
Base 0.8 0.6 0.7 0.5 0.5 0.4V1 0.8 0.6 0.7 0.5 0.5 0.5V2 0.8 0.6 0.7 0.6 0.7 1.4V3 0.8 0.6 0.7 0.5 0.5 0.5V4 0.8 0.6 0.7 0.5 0.5 0.4
Source: Abacus Economics
GDP grows at an annual average rate of 4.3 per cent from $152 billion in 2001 to $429 billion in 2026. Total revenue falls from 16.4 per cent of GDP in 2001 to 13.4 per cent in 2026 and total spending decreases from 15.5 per cent of GDP in 2001 to 14.7 per cent in 2026 with health spending growing from 4.9 per cent to 6.3 per cent of GDP over the period of analysis. Alberta’s surplus falls from 0.9 per cent of GDP in 2001 to zero in 2019 and then turns negative, ending up at a deficit of 1.4 per cent of GDP in 2026. This fiscal projection is not sustainable as net financial assets initially grow from 6.0 per cent of GDP in 2001 to 9.3 per cent in 2015 (through 2017) and fall to 5.1 per cent in 2024, ending up at 2.3 per cent in 2026.
39

Scenario 3 — Low Population Growth, Moderate Health Care Growth Base Results GDP grows at an annual average rate of 4.2 per cent from $152 billion in 2001 to $416 billion in 2026. Total revenue falls from 16.4 per cent of GDP in 2001 to 16.2 per cent in 2026 and total spending decreases from 15.5 per cent of GDP in 2001 to 14.3 per cent in 2026 with health spending growing from 4.9 per cent to 6.3 per cent of GDP over the period of analysis. Alberta’s surplus increases from 0.9 per cent of GDP in 2001 to 2.3 per cent for 2015 through 2021 and then starts to fall, ending up at 1.9 per cent of GDP in 2026. This fiscal projection is sustainable through 2026 as net financial assets grow from 6.0 per cent of GDP in 2001 to 34.6 per cent in 2026 and the spending and tax revenue caveats are met. Variation Results — High Health Care Growth GDP grows at an annual average rate of 4.2 per cent from $152 billion in 2001 to $416 billion in 2026. Total revenue falls from 16.4 per cent of GDP in 2001 to 15.0 per cent in 2026 and total spending increases from 15.5 per cent of GDP in 2001 to 16.1 per cent in 2026 with health spending growing from 4.9 per cent to 7.3 per cent of GDP over the period of analysis. Alberta’s surplus rises from 0.9 per cent of GDP in 2001 to 1.7 per cent in 2010, falls to zero in 2022 and then turns negative to end up at a deficit of 1.1 per cent of GDP in 2026. This fiscal projection is sustainable as net financial assets grow from 6.0 per cent of GDP in 2001 to 13.2 per cent in 2026. Summary — A Fiscal Projection Model for Alberta
• The projections presented in this paper are reasonable “guesses” about future trends based on information available today. The scenarios in this paper rely on assumptions about productivity growth rates, changes in the structure of the population and the constancy of several age-related distributions, which may or may not hold true. Further, these scenarios do not incorporate behavioral responses to changes in underlying conditions.
• Research indicates that as it is currently organized, government-provided health care in Canada is expected to produce significant cost increases through 2050.
• Using a relatively stringent measure of sustainability (no increase in net government debt relative to GDP from the 2001 level with the added caveats that total provincial government expenditure should not exceed the 1981 – 2001 maximum ratio of 21.6 per cent of GDP nor should provincial taxation revenue exceed the 1981 – 2001 maximum ratio of 10.6 per cent of GDP) many fiscal projection scenarios for Alberta are sustainable.
• However, if real per capita health care spending continues to grow on its historical path, if royalty revenues fall to a relatively low rate of 2.8 per cent of GDP, and if the government does not run surpluses over the near term, fiscal policies will not be sustainable because the net debt to GDP ratio would be constantly growing. See scenario 1, variant 2.
40

Overview of Projection Results Projection Summaries, High Population GrowthBase Scenario 1Base: High population growth, moderate health care cost increases (1.5%), average royalty revenue (3.7% GDP)
2001 2005 2010 2015 2020 2026GDP 151,173 188,397 240,550 300,616 370,670 470,538Revenue, percent of GDP 16.4 12.5 14.8 15.2 15.5 15.7
Tax 8.3 7.7 7.8 7.8 7.8 7.9Royalty 5.7 2.2 3.7 3.7 3.7 3.7Investment 1.0 0.8 1.5 1.9 2.1 2.3
Spending, percent of GDP 15.5 12.7 12.8 13.1 13.7 14.6Health 4.9 4.9 5.1 5.3 5.7 6.3Interest 0.8 0.6 0.6 0.5 0.4 0.3
Surplus / (Deficit) as a percent of GDP 0.9 (0.2) 2.0 2.1 1.9 1.1Net Financial Assets / (Liabilities) as a percent of GDP 6.0 5.8 12.9 19.8 25.2 27.7Sustainable? Yes
Variant 1: High population growth, high health care cost increases (2.2%), average royalty revenue (3.7% GDP)2001 2005 2010 2015 2020 2026
GDP 151,173 188,397 240,550 300,616 370,670 470,538Revenue, percent of GDP 16.4 12.5 14.8 15.0 15.0 14.7
Tax 8.3 7.7 7.8 7.8 7.8 7.9Royalty 5.7 2.2 3.7 3.7 3.7 3.7Investment 1.0 0.8 1.5 1.6 1.6 1.3
Spending, percent of GDP 15.5 12.7 13.2 13.8 14.8 16.6Health 4.9 4.9 5.2 5.7 6.3 7.2Interest 0.8 0.6 0.6 0.5 0.4 0.5
Surplus / (Deficit) as a percent of GDP 0.9 (0.2) 1.6 1.2 0.2 (1.9)Net Financial Assets / (Liabilities) as a percent of GDP 6.0 5.8 12.0 16.0 15.9 7.2Sustainable? Yes
Variant 2: High population growth, high health care cost increases (2.2%), low royalty revenue (2.8% GDP)2001 2005 2010 2015 2020 2026
GDP 151,173 188,397 240,550 300,616 370,670 470,538Revenue, percent of GDP 16.4 12.5 13.6 13.4 13.2 13.1
Tax 8.3 7.7 7.8 7.8 7.8 7.9Royalty 5.7 2.2 2.8 2.8 2.8 2.8Investment 1.0 0.8 1.2 1.0 0.8 0.6
Spending, percent of GDP 15.5 12.7 13.2 13.8 15.1 17.5Health 4.9 4.9 5.2 5.7 6.3 7.2Interest 0.8 0.6 0.6 0.5 0.7 1.5
Surplus / (Deficit) as a percent of GDP 0.9 (0.2) 0.4 (0.4) (1.8) (4.4)Net Financial Assets / (Liabilities) as a percent of GDP 6.0 5.8 6.9 5.2 (1.5) (19.3)Sustainable? No
Variant 3: High population growth, moderate health care cost increases (1.5%), low royalty revenue (2.8% GDP)2001 2005 2010 2015 2020 2026
GDP 151,173 188,397 240,550 300,616 370,670 470,538Revenue, percent of GDP 16.4 12.5 13.6 13.6 13.5 13.3
Tax 8.3 7.7 7.8 7.8 7.8 7.9Royalty 5.7 2.2 2.8 2.8 2.8 2.8Investment 1.0 0.8 1.2 1.2 1.0 0.8
Spending, percent of GDP 15.5 12.7 12.8 13.1 13.7 14.9Health 4.9 4.9 5.1 5.3 5.7 6.3Interest 0.8 0.6 0.6 0.5 0.4 0.6
Surplus / (Deficit) as a percent of GDP 0.9 (0.2) 0.8 0.5 (0.2) (1.6)Net Financial Assets / (Liabilities) as a percent of GDP 6.0 5.8 7.9 9.0 7.6 0.6Sustainable? No
Variant 4: Same as Base but excess revenue spent not saved2001 2005 2010 2015 2020 2026
GDP 151,173 188,397 240,550 300,616 370,670 470,538Revenue, percent of GDP 16.4 12.5 14.4 14.2 14.1 14.0
Tax 8.3 7.7 7.8 7.8 7.8 7.9Royalty 5.7 2.2 3.7 3.7 3.7 3.7Investment 1.0 0.8 1.1 0.8 0.7 0.5
Spending, percent of GDP 15.5 12.7 14.4 14.2 14.1 14.7Health 4.9 4.9 5.1 5.3 5.7 6.3Interest 0.8 0.6 0.6 0.5 0.4 0.4
Surplus / (Deficit) as a percent of GDP 0.9 (0.2) 1.5 1.1 0.4 (0.7)Net Financial Assets / (Liabilities) as a percent of GDP 6.0 5.8 4.5 3.6 2.9 0.8Sustainable? No
41

Projection Summaries, Medium Population GrowthBase Scenario 2Base: Medium population growth, moderate health care cost increases (1.5%), average royalty revenue (3.7% GDP)
2001 2005 2010 2015 2020 2026GDP 151,173 187,088 234,050 286,682 346,605 428,974Revenue, percent of GDP 16.4 12.5 14.9 15.3 15.7 16.0
Tax 8.3 7.7 7.9 7.9 7.9 7.9Royalty 5.7 2.2 3.7 3.7 3.7 3.7Investment 1.0 0.8 1.5 1.9 2.3 2.5
Spending, percent of GDP 15.5 12.8 12.9 13.1 13.6 14.5Health 4.9 4.9 5.1 5.4 5.8 6.3Interest 0.8 0.6 0.7 0.5 0.4 0.4
Surplus / (Deficit) as a percent of GDP 0.9 (0.2) 2.0 2.1 2.0 1.4Net Financial Assets / (Liabilities) as a percent of GDP 6.0 5.8 13.0 20.3 26.5 30.7Sustainable? Yes
Variant 1: Medium population growth, high health care cost increases (2.2%), average royalty revenue (3.7% GDP)2001 2005 2010 2015 2020 2026
GDP 151,173 187,088 234,050 286,682 346,605 428,974Revenue, percent of GDP 16.4 12.5 14.8 15.1 15.1 14.8
Tax 8.3 7.7 7.9 7.9 7.9 7.9Royalty 5.7 2.2 3.7 3.7 3.7 3.7Investment 1.0 0.8 1.5 1.7 1.7 1.4
Spending, percent of GDP 15.5 12.8 13.2 13.8 14.7 16.5Health 4.9 4.9 5.3 5.8 6.4 7.3Interest 0.8 0.6 0.7 0.5 0.4 0.5
Surplus / (Deficit) as a percent of GDP 0.9 (0.2) 1.6 1.2 0.4 (1.6)Net Financial Assets / (Liabilities) as a percent of GDP 6.0 5.8 12.0 16.4 17.0 9.5Sustainable? Yes
Variant 2: Medium population growth, high health care cost increases (2.2%), low royalty revenue (2.8% GDP)2001 2005 2010 2015 2020 2026
GDP 151,173 187,088 234,050 286,682 346,605 428,974Revenue, percent of GDP 16.4 12.5 13.6 13.4 13.3 13.2
Tax 8.3 7.7 7.9 7.9 7.9 7.9Royalty 5.7 2.2 2.8 2.8 2.8 2.8Investment 1.0 0.8 1.2 1.0 0.9 0.7
Spending, percent of GDP 15.5 12.8 13.2 13.8 15.0 17.4Health 4.9 4.9 5.3 5.8 6.4 7.3Interest 0.8 0.6 0.7 0.6 0.7 1.5
Surplus / (Deficit) as a percent of GDP 0.9 (0.2) 0.4 (0.4) (1.7) (4.3)Net Financial Assets / (Liabilities) as a percent of GDP 6.0 5.8 6.9 5.4 (1.0) (18.3)Sustainable? No
Variant 3: Medium population growth, moderate health care cost increases (1.5%), low royalty revenue (2.8% GDP)2001 2005 2010 2015 2020 2026
GDP 151,173 187,088 234,050 286,682 346,605 428,974Revenue, percent of GDP 16.4 12.5 13.6 13.6 13.5 13.4
Tax 8.3 7.7 7.9 7.9 7.9 7.9Royalty 5.7 2.2 2.8 2.8 2.8 2.8Investment 1.0 0.8 1.3 1.2 1.1 0.9
Spending, percent of GDP 15.5 12.8 12.9 13.1 13.6 14.7Health 4.9 4.9 5.1 5.4 5.8 6.3Interest 0.8 0.6 0.7 0.5 0.4 0.6
Surplus / (Deficit) as a percent of GDP 0.9 (0.2) 0.7 0.5 (0.1) (1.4)Net Financial Assets / (Liabilities) as a percent of GDP 6.0 5.8 7.9 9.3 8.5 2.3Sustainable? No
Variant 4: Same as Base but excess revenue spent not saved2001 2005 2010 2015 2020 2026
GDP 151,173 187,088 234,050 286,682 346,605 428,974Revenue, percent of GDP 16.4 12.5 14.4 14.2 14.1 14.0
Tax 8.3 7.7 7.9 7.9 7.9 7.9Royalty 5.7 2.2 3.7 3.7 3.7 3.7Investment 1.0 0.8 1.1 0.9 0.7 0.6
Spending, percent of GDP 15.5 12.8 14.4 14.2 14.1 14.6Health 4.9 4.9 5.1 5.4 5.8 6.3Interest 0.8 0.6 0.7 0.5 0.4 0.4
Surplus / (Deficit) as a percent of GDP 0.9 (0.2) 1.5 1.1 0.5 (0.5)Net Financial Assets / (Liabilities) as a percent of GDP 6.0 5.8 4.6 3.8 3.1 1.5Sustainable? No
42
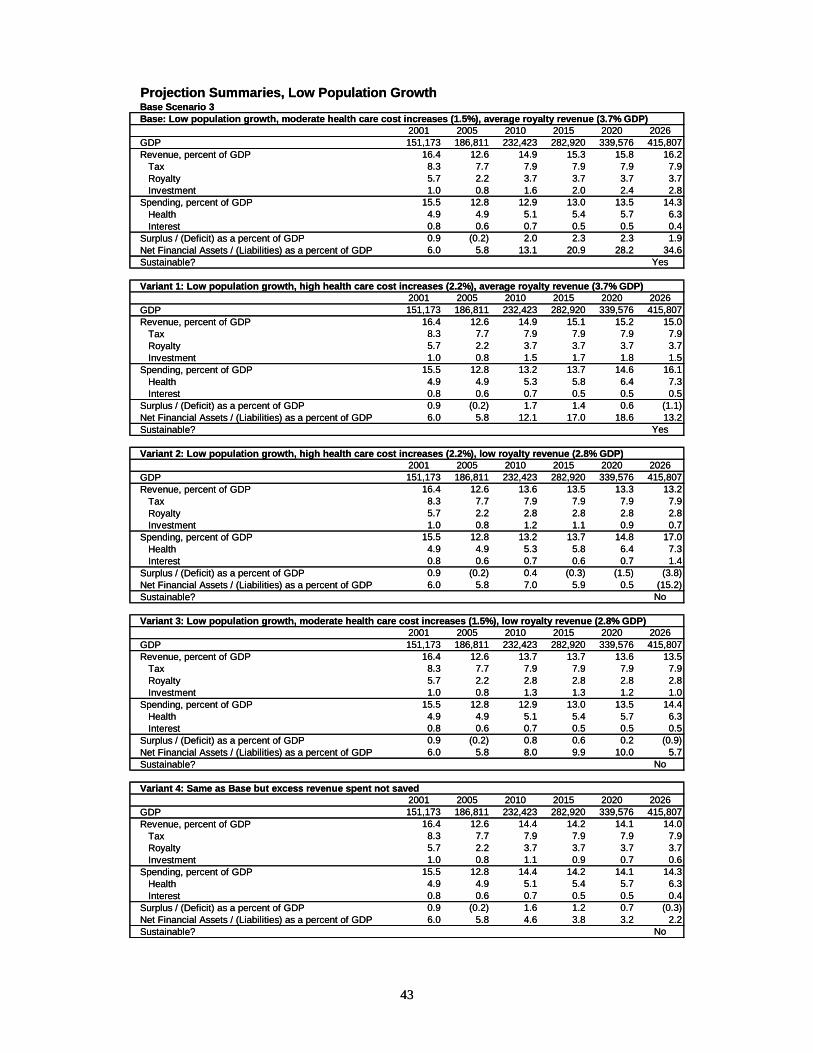
Projection Summaries, Low Population GrowthBase Scenario 3Base: Low population growth, moderate health care cost increases (1.5%), average royalty revenue (3.7% GDP)
2001 2005 2010 2015 2020 2026GDP 151,173 186,811 232,423 282,920 339,576 415,807Revenue, percent of GDP 16.4 12.6 14.9 15.3 15.8 16.2
Tax 8.3 7.7 7.9 7.9 7.9 7.9Royalty 5.7 2.2 3.7 3.7 3.7 3.7Investment 1.0 0.8 1.6 2.0 2.4 2.8
Spending, percent of GDP 15.5 12.8 12.9 13.0 13.5 14.3Health 4.9 4.9 5.1 5.4 5.7 6.3Interest 0.8 0.6 0.7 0.5 0.5 0.4
Surplus / (Deficit) as a percent of GDP 0.9 (0.2) 2.0 2.3 2.3 1.9Net Financial Assets / (Liabilities) as a percent of GDP 6.0 5.8 13.1 20.9 28.2 34.6Sustainable? Yes
Variant 1: Low population growth, high health care cost increases (2.2%), average royalty revenue (3.7% GDP)2001 2005 2010 2015 2020 2026
GDP 151,173 186,811 232,423 282,920 339,576 415,807Revenue, percent of GDP 16.4 12.6 14.9 15.1 15.2 15.0
Tax 8.3 7.7 7.9 7.9 7.9 7.9Royalty 5.7 2.2 3.7 3.7 3.7 3.7Investment 1.0 0.8 1.5 1.7 1.8 1.5
Spending, percent of GDP 15.5 12.8 13.2 13.7 14.6 16.1Health 4.9 4.9 5.3 5.8 6.4 7.3Interest 0.8 0.6 0.7 0.5 0.5 0.5
Surplus / (Deficit) as a percent of GDP 0.9 (0.2) 1.7 1.4 0.6 (1.1)Net Financial Assets / (Liabilities) as a percent of GDP 6.0 5.8 12.1 17.0 18.6 13.2Sustainable? Yes
Variant 2: Low population growth, high health care cost increases (2.2%), low royalty revenue (2.8% GDP)2001 2005 2010 2015 2020 2026
GDP 151,173 186,811 232,423 282,920 339,576 415,807Revenue, percent of GDP 16.4 12.6 13.6 13.5 13.3 13.2
Tax 8.3 7.7 7.9 7.9 7.9 7.9Royalty 5.7 2.2 2.8 2.8 2.8 2.8Investment 1.0 0.8 1.2 1.1 0.9 0.7
Spending, percent of GDP 15.5 12.8 13.2 13.7 14.8 17.0Health 4.9 4.9 5.3 5.8 6.4 7.3Interest 0.8 0.6 0.7 0.6 0.7 1.4
Surplus / (Deficit) as a percent of GDP 0.9 (0.2) 0.4 (0.3) (1.5) (3.8)Net Financial Assets / (Liabilities) as a percent of GDP 6.0 5.8 7.0 5.9 0.5 (15.2)Sustainable? No
Variant 3: Low population growth, moderate health care cost increases (1.5%), low royalty revenue (2.8% GDP)2001 2005 2010 2015 2020 2026
GDP 151,173 186,811 232,423 282,920 339,576 415,807Revenue, percent of GDP 16.4 12.6 13.7 13.7 13.6 13.5
Tax 8.3 7.7 7.9 7.9 7.9 7.9Royalty 5.7 2.2 2.8 2.8 2.8 2.8Investment 1.0 0.8 1.3 1.3 1.2 1.0
Spending, percent of GDP 15.5 12.8 12.9 13.0 13.5 14.4Health 4.9 4.9 5.1 5.4 5.7 6.3Interest 0.8 0.6 0.7 0.5 0.5 0.5
Surplus / (Deficit) as a percent of GDP 0.9 (0.2) 0.8 0.6 0.2 (0.9)Net Financial Assets / (Liabilities) as a percent of GDP 6.0 5.8 8.0 9.9 10.0 5.7Sustainable? No
Variant 4: Same as Base but excess revenue spent not saved2001 2005 2010 2015 2020 2026
GDP 151,173 186,811 232,423 282,920 339,576 415,807Revenue, percent of GDP 16.4 12.6 14.4 14.2 14.1 14.0
Tax 8.3 7.7 7.9 7.9 7.9 7.9Royalty 5.7 2.2 3.7 3.7 3.7 3.7Investment 1.0 0.8 1.1 0.9 0.7 0.6
Spending, percent of GDP 15.5 12.8 14.4 14.2 14.1 14.3Health 4.9 4.9 5.1 5.4 5.7 6.3Interest 0.8 0.6 0.7 0.5 0.5 0.4
Surplus / (Deficit) as a percent of GDP 0.9 (0.2) 1.6 1.2 0.7 (0.3)Net Financial Assets / (Liabilities) as a percent of GDP 6.0 5.8 4.6 3.8 3.2 2.2Sustainable? No
43

xliv Heller (2003), page 94. xlv Brimacombe et al. (2001). xlvi Prada et al. (2004). xlvii Robson (2001). xlviii De Masi (2003). xlix Dang and Oxley (2001). l Jackson and Matier (2003). li Ibid, page 33. lii Ibid, page 25. liii Government of Alberta (2004a), Fiscal Plan Tables 2004-07, Historical Fiscal Summary, 1985-86 and 2006-07, page 62. liv Statistics Canada (2003). lv Organisation for Economic Co-operation and Development (2004). lvi Appendix A contains additional information on FMS financial assets and liabilities. lvii Government of Alberta (2004a), released as part of Budget 2004 in “Government of Alberta Strategic Business Plan, page 15.
44
45
VI. Summary, Conclusions and Recommendations Introduction This first report in the Vision 2020 Project series is intended to explain the demographic changes Alberta can expect to see through 2026 and present the first set of results from the Vision 2020 fiscal projection model. This model, which is to be updated regularly, is designed to allow the examination of potential government revenue and expenditure paths in order to identify those that are sustainable and identify the risks from high costs or low revenue Alberta may face in the future. Scenario 1 projections, which yield a 2025 population of 4.1 million, is presented as the benchmark based on the historical information and expectations about demographics, oil and gas production and prices and other key components of this model currently available. Population Aging — International There is no question that, without much higher immigration levels, much of the developed world will experience population aging as a result of the combination of low fertility rates and increased life expectancy over the coming decades. What is uncertain is whether or not these demographic changes will cause serious fiscal problems for governments. Population aging is a concern because many countries have little fiscal flexibility due to high government spending and debt levels coupled with limited room to increase taxation levels. Considering that many countries are committed to spending on public pensions and other age-related programs, without full funding in place, and that a significant increase in the share of the elderly relative to the working age population is upon us, and you have the potential for serious fiscal challenges starting by 2010 without any easy options to meet these challenges. Population Aging — Canada Canada is in a better position to deal with the public finance challenges related to population aging than in the recent past, but still faces difficult choices to ensure public spending is sustainable in the future. Research indicates that, as it is currently organized, government provided health care in Canada is expected to produce significant cost increases through 2050 and that, while Canada’s overall sustainability outlook can be considered promising, it is dependent on controlling spending in general and health spending in particular. Population Aging — Alberta Alberta’s fertility rate is projected to remain below replacement and it can expect its population to age as reflected in the projected doubling of its elderly dependency ratio to 2.9 in 2026 from 1.5 in 2003. Total dependency in Alberta has fallen from 6.3 in 1971 to
4.3 in 2003 and is expected to continue to fall until it reaches a trough of 4.2 in 2008 after which it is expected to increase to 5.8 in 2026, driven by the aging of the population. If we look only at the total dependency ratio, Alberta’s aging population does not appear to be a severe problem except for the fact that health care costs are much higher in the last few years of life and demographic change reflected in the increase in the elderly dependency ratio is the main factor expected to drive public health care costs up. Government Spending in Alberta Provincial government spending in Alberta averaged 17.5 per cent between 1981 and 2001 and grew faster than the sum of population growth and inflation by 1.5 per cent per year on average between 1982 and 2001 and by 0.9 per cent between 1992 and 2001. All-government spending in Alberta at an average of 33.0 per cent of GDP between 1981 and 2001 was well below the Canadian average of 42.6 per cent. Health care is a significant potion of provincial spending and real per capita health expenditures have increased by 2.2 per cent per year on average between 1980/81 and 2003/04 while real GDP per capita has only grown an average of 1.5 per cent per year between 1982 and 2003. Government Revenue in Alberta Royalties from natural resources represented roughly one-quarter of Alberta’s provincial government revenues between 1993/94 and 2002/03 and is expected to account for more than one-fifth for 2003/04 through 2006/07. Personal income tax collections in Alberta made up 18.7 per cent of provincial government revenue on average between 1981 and 2001 and royalties on natural resources contributed an average of 25.1 per cent of Alberta’s provincial government revenue between 1981 and 2001. On average, corporate income tax provided 7.1 per cent of the Alberta government’s revenue between 1981 and 2001, indirect taxes accounted for 14.4 per cent and federal transfers 12.5 per cent. Rural to Urban Migration in Alberta The Calgary-Edmonton corridor is likely to contain much of Alberta’s future economic activity, and taken together, the population increases in the Calgary (285,101) and Edmonton (125,248) Census Divisions account for 70.9 per cent of the total increase expected in Alberta through 2026. All areas can expect increased pressures on health care funding related to aging but those with declining populations and above-average increases in elderly dependency may face especially difficult times. Further, these problems may be partially masked by the inclusion of geographic areas as rural that may be more closely linked to urban areas. This suggests that rural areas may face even greater pressures on health care and other service delivery than urban areas and that these greater difficulties may not be reflected in standard statistics. Government service delivery in small towns is one potential area of future research for the Vision 2020 Project. Provincial and municipal governments should consider how they plan to deliver services to cities and towns with small and shrinking
46
population bases and keep in mind the World Bank’s admonition about not trying to influence where people live but focusing on providing a strong economic environment. Fiscal Sustainability and Risks in Alberta One of the main purposes of this paper is to present the Vision 2020 fiscal projection model for Alberta. The model uses an accounting structure and detailed spending and revenue distributions coupled with productivity and inflation assumptions and detailed population projections to project possible fiscal scenarios for Alberta’s provincial government. Using a relatively stringent measure of sustainability (no increase in net government debt relative to GDP between 2001 and 2026 with the added caveats that total provincial government expenditure should not exceed the 1981 – 2001 maximum ratio of 21.6 per cent of GDP nor should provincial taxation revenue exceed the 1981 – 2001 maximum ratio of 10.6 per cent of GDP) many fiscal projection scenarios for Alberta are sustainable. The projections that are not sustainable or that appear to be on an unsustainable path beyond the current projection period exhibit at least one of three main risks. The first risk is real per capita health care costs continuing on their long-term growth pattern. Real per capita health expenditures have increased by 2.2 per cent per year on average between 1980/81 and 2003/04 while real GDP per capita has only grown an average of 1.5 per cent per year between 1982 and 2003. A standard assumption in the fiscal projection models of the type presented in this paper is that spending categories grow at the same rate as the long-term growth in real GDP per capita. The base cases in this model present this scenario of 1.5 per cent health care spending growth while the high health spending growth rate variation uses the historical growth rate of 2.2 per cent. Government efforts to reform health care in Alberta need to recognize that large annual increases in health spending have not solved the problems and that it is time to consider all reform options. In the absence of reform this risk is highly likely to be realized. The second risk is that natural resource royalty revenues may fall from a moderate level of 3.7 per cent of GDP on average to 2.8 per cent. The near-term outlook for royalty revenue in Alberta is good. However, long-term projections are highly uncertain which makes an assessment of the likelihood of this risk highly uncertain. While resource revenues may continue to accrue as in recent years with the help of oil sands production and the possibility of non-conventional natural gas production a significant drop in revenue is well within the range of possibilities. The importance of this revenue source to Alberta and its volatility demand that attention be paid to the possibility it may decrease significantly. Although this revenue source is volatile there are some actions the government can take on the spending side of the budget to mitigate the negative effects of a possible drop in resource revenues. In addition to controlling health care spending specifically, total spending could be capped at the growth rate of population and inflation combined. Alberta’s provincial government spending increased by 6.4 per cent per year on average between 1982 and 2001 and by 4.6 per cent per year between 1992 and 2001. Government spending grew faster than the sum of population growth and inflation by 1.5 per cent per year on average between 1982 and 2001.
47

The third risk is that future fiscal surpluses may be “spent” rather than saved. Running surpluses over the near term creates a virtuous circle of increased investment income which makes deficits less likely in the first place and helps avoid “temporary” spending increases that become permanent. The effect of running surpluses in the model presented here is large. In the high population growth base scenario, assuming no changes in the current tax system, high revenues allow the excess of financial assets over financial liabilities or, net financial assets, to grow to 27.7 per cent of GDP in 2026 if the government saves the “excess” revenue. If the government does not run surpluses and spends the “excess” revenues instead, net financial assets fall to 0.8 per cent of GDP in 2026. In addition to controlling spending in general and reforming health care, the provincial government should move to further improve its fiscal flexibility by saving all or a significant portion of surpluses in coming years with the expectation of needing the fiscal room to pay for health care spending or offset revenue decreases in other areas. Similar to the risk associated with resource royalties, this one is difficult to assign a likelihood to. Fortunately, the government has already established a useful benchmark for tracking how future surpluses are used. According to the recent budget “Any resource revenue above $4 billion and other net revenue higher than budgeted will continue to be transferred to the Sustainability Fund”lviii This criteria applied to the high population growth base scenario yields the same net financial assets as the save-it-all assumption. The next few years should give us a good indication of how serious the government is about saving surpluses. If large natural gas rebates erode the value of the resource revenue subject to transfer to the fund or if other revenue windfalls are spent we can expect this risk to be realized in the long-term. As a final recommendation, the provincial government should make public their own long-term projections of fiscal balance in Alberta using a range of reasonable scenarios (i.e., low royalty revenue, high annual growth rates for health care costs). These projections should become part of the budget process, with revised projections as assumptions about demographic and economic factors are updated. lviii Government of Alberta, Fiscal Plan, page 8.
48

Appendix A – Methodology Census Division Projections Methodology Note from Statistics Canada: The Cohort Component Method was used. Assumptions were developed for each component of growth, namely fertility, mortality and migration (subprovincial, interprovincial and international levels) and each component was projected separately. Firstly, a provincial projection was used to establish a context in which the CD-level projections would be produced. The assumptions of Scenario 2 (Catalogue 91-520, page 57) were used and are described below. The population on which the projections were based was the preliminary postcensal estimate as of July 1st 2002. At the time, these were the latest available estimates. Then, the CD-level projection was produced. Assumptions were evaluated for each CD based on the previous 3-year trends (1999-2001). For fertility, mortality, international out-migration and interprovincial out-migration, provincial rates were applied to the CD population and then adjusted so that the hypothetical number of events were equal to the recorded numbers. The CD/Provincial ratios were kept constant throughout the years. The components: International immigration, non-permanent residents and interprovincial in-migration, provincial events were distributed at the subprovincial level according to events occurring in 1999-2001 period. These ratios were kept constant throughout the years. With regard to the subprovincial migration component, only the net flows were projected. These flows were projected so that they would become progressively smaller throughout the years. They decreased by half every 15 years. Fiscal Projections Readers should be aware of the limitations of the approach used in this paper. The projections presented herein, while reasonable approximations of the future based on information available today, are not to be interpreted as a forecast of what will happen. The scenarios in this paper rely on assumptions about productivity growth rates, changes in the structure of the population and the constancy of several age-related distributions, which may or may not hold true. One other assumption is that the tax system remains as it is presented in the most recent budget. Effectively, any announced tax changes are incorporated into the model because these tax changes are reflected in budget revenue estimates which are accounted for in the model. The tax system is assumed to remain as is beyond any announced tax changes. Further, these scenarios do not incorporate behavioral responses to changes in underlying conditions.
49

Introduction The model presented here is built on the Generational Accounting (GA) structure but is not a full GA analysis. According to Oreopoulos and Vaillancourt (1998), analysts use generational accounting to examine two broad questions. One, “is a country’s long-run fiscal policy feasible, given projected demographic changes and the requirement that government must eventually be able to pay its bills, including any obligations from accrued debt?” Two, “what is the net tax burden on an average person in a particular generation, with the burden being calculated by allocating all taxes paid and transfers received to the appropriate age cohorts?” Oreopoulos and Vaillancourt concluded, in 1998, that “Canada is now on a fiscal track that can be sustained if budget surpluses are used to reduce the debt. Using them to increase spending or cut taxes will require government to tighten fiscal policy down the road, which would have the additional unfortunate result of throwing increased tax burdens on Canadians who are now very young or yet unborn.” While the Vision 2020 model employs some of the methods of generational accounting it does not present a full GA analysis because the primary focus of this paper is the feasibility of Alberta’s medium-term fiscal situation. Several recent papers have employed similar techniques to investigate the feasibility of Canada’s medium- and long-term fiscal situation. Process for Projecting GDP and Revenue and Expenditure Series The Jackson and Matier paperlix provides the most detailed description of the methodology employed in analyzing the fiscal implications of population aging; the terminology used below is borrowed from this paper. The Vision 2020 model uses an accounting framework to analyze potential fiscal impacts of demographic change on Alberta government spending and revenue through 2026. Government revenue and spending as well as Gross Domestic Product are projected as a function of real income per capita, inflation, population growth and changes in population composition. The age-sex distribution for market income from Statistics Canada’s Social Policy Simulation Database and Model (SPSD/M) is used as the base distribution for projecting GDP. Similarly, the age-sex distribution for provincial personal income tax payable from the SPSD/M is used as the base distribution for projecting personal income tax revenues. The base fiscal data for the model are Statistics Canada’s Provincial Economic Accounts (PEA) which provide GDP for 1981 through 2003 and reasonably detailed government revenue and expenditure series from 1981 through 2001. The PEA data are augmented by other sources where necessary. The PEA does not contain detailed health or education spending data. Historical public health care spending data and detailed spending by age and sex for 2001 are from the Canadian Institute of Health Information (CIHI). Aggregate education spending values
50

are from the Government of Alberta’s 2004 Budgetlx and are converted to a calendar year from a fiscal year base. A detailed age-sex breakdown of government education spending in Alberta for 2001 is generated from Alberta level spending-by-education level data from the Pan-Canadian Education Indicatorslxi and detailed enrollment data for Canada from the OECD Online Education Databaselxii. Historical PEA-budget relationships are analyzed, and where appropriate, used to extend the PEA time series out to 2005 in order to incorporate recent fiscal changes. Budget data for individual revenue and expenditure series are converted to a calendar year from a fiscal year base and the 1985 through 2001 average budget-to-PEA ratio, which are applied to budget forecasts for the revenue and spending series to estimate what the PEA values will be. Revenue series projected in this manner are direct taxes from persons, direct taxes from corporate and government business enterprises, investment income (investment income and other component), investment income (royalties component) and current transfers from federal government. Expenditure series projected in this manner are health spending (CIHI-budget relationship used), education spending (directly from budget), interest on public debt and total current expenditure. The projected spending for all other expenditure categories is therefore calculated as a residual. An alternative way of treating “other expenditures” would be to set a fixed maximum for total expenditures as a per cent of GDP and let the “other” category adjust to a lower level of spending once total spending reaches the threshold. This explicitly recognizes that in addition to tax increases and debt accumulation, governments can reduce spending in low priority areas in response to fiscal pressures. This alternative is not currently built into the Vision 2020 model because as the “other” category can be adjusted by raising or lowering the category’s growth rate. For the revenue and spending series which can be extended, the projection model takes over from 2006 onwards. Other series are projected from 2002 onwards. Gross Domestic Product is projected from 2004 onwards using the interim 2003 value from the PEA as a base. The function of the projection model is identical regardless of the year of origin (2002, 2004 or 2006). Assumptions about growth (to account for growth due to productivity gains), the inflation rate and population projections are applied to a detailed age-sex breakdown to project individual series. Productivity Growth Assumptions about real spending growth rates, based on future productivity growth are essential for the projections presented here. The productivity growth rate assumption is typically based on the historical performance of real GDP per capita or real GDP per person of working age. The real per capita growth components for GDP and the revenue and spending series in the base scenarios are set equal to this rate; some variant scenarios consider different growth rates for select revenue or spending series. The Vision 2020 model uses Alberta’s 1982-2003 average annual real GDP per capita growth, 1.5 per cent for all base projection scenarios; deviations from this rate in the variant scenarios are
51
discussed in the relevant sections above. Strictly speaking, the real GDP per capita growth assumption is not equivalent to a productivity projection as the labour force is growing more slowly than population. Inflation Results for fiscal projections are typically presented in nominal terms with analysis focusing on spending relative to total revenue or to GDP. Many Canada-focused studies use the middle of the Bank of Canada’s inflation target (2.0 per cent) for their inflation assumption. The average annual change in the all-item CPI (1992=100) for 1982-2003 is 3.4 per cent in Alberta and Canada. The Vision 2020 model assumes inflation at the middle of the Bank of Canada’s target (2.0 per cent) for all projection scenarios as the inflation target is set at the national level and there is no difference in average inflation rates in Alberta and Canada over the 1982-2003 period. Health Care Spending Base scenarios assume a standard growth rate of 1.5 per cent for real health care spending. Under the high growth variation, real health care spending is assumed to grow at 2.2 per cent per year – the average annual rate of growth for real per capita provincial health care in Alberta between 1981/82 and 2003/04. Natural Resource Royalty Revenue Forecasting Alberta’s royalty income is difficult in the short-term and near meaningless in the long-term given the range of price fluctuations, potential technological advancements, demand forecasts and other issues. Nevertheless, the relative importance of this revenue source to the Alberta government demands that assumptions be made about the likely range of this stream of income. Strong demand forecasts for natural gas and oil coupled with price forecasts for oil and natural gas suggest a good environment for royalty revenues, at least in the near term.lxiii
Alberta’s royalties in the Provincial Economic Accounts were $8.6 billion in 2001 and $8.9 billion in 2000. The average in the 1990s was $3.0 billion. Over the 1981 to 2001 period, resource revenues averaged 4.7 per cent of GDP and varied from a low of 2.7 per cent in 1998 to a high of 8.4 per cent in 1981. Revenues as a share of GDP in the early to mid 1980s were generally higher than in the years since 1987 when they averaged 3.7 per cent and ranged between 3.0 per cent and 3.9 per cent for 12 of 15 years. Since the 1981 to 1986 ratios do not fit well with the 1987 to 2001 data, I use the average royalty revenue to GDP ratio from 1987 through 2001 (3.7 per cent) as the base in each scenario and investigate a range of possible alternatives using the average less one standard deviation (2.8 per cent) as the lower bound (Low Royalty Revenue) and the average plus one standard deviation (4.7 per cent) as the upper bound (High Royalty Revenue).
52

Sustainability This paper uses the relatively stringent measure of no increase in the government’s net debt as a per cent of GDP over the projection period with the added caveats that total provincial government expenditure should not exceed the 1981 – 2001 maximum ratio of 21.6 per cent of GDP nor should provincial taxation revenue exceed the 1981 – 2001 maximum ratio of 10.6 per cent of GDP. This debt requirement allows for deficits but is violated if the net debt to GDP ratio in 2026 is higher than it was in 2001 (2001/02 fiscal). The 2001/02 level of net financial assets or liabilities (debt) is the most recent available from Statistics Canada’s Financial Management System.lxiv Maximum spending and taxation ratios are chosen as an admittedly arbitrary upper bound for what levels of government activity Albertans are willing to accept and are included to capture the possibility of government meeting the debt criteria but with significant taxation and spending increases. A “lax” definition of sustainability for Alberta is also presented. The lax definition is based on the peak ratio of total provincial government net debt of 26.3 per cent of Canadian GDP which was reached in 1999. This allows for the accumulation of over $123 billion of net debt in Alberta by 2026. The expenditure bound of 24.1 per cent of GDP in the lax definition is based on the maximum all-province government spending to Canadian GDP ratio from 1981 – 2001. Similarly, the tax revenue bound of 14.6 per cent of GDP in this sustainability definition is based on the maximum all-province tax revenue to Canadian GDP ratio from 1981 – 2001. These bounds represent large increases in the level of government activity in Alberta and a substantial net debt. Investment Income and Financial Assets Alberta’s investment income through 2005 is estimated using the PEA-budget relationship discussed above. Alberta’s financial assets increase by the amount of any surplus in the government’s budget. This assumes that all surplus amounts are saved by the provincial government rather than being returned through tax or natural gas rebates. This assumption is reversed in one of the variant scenarios by assuming all surplus amounts are spent. Investment income beyond 2005 is determined using the stock of financial assets and an interest rate of 7.2 per cent calculated as the average of the 1994/95 through 2001/02 implied interest rates using FMS assets and PEA investment income. Financial asset categories in Statistics Canada’s Financial Management System include: cash on hand and deposit, receivables, advances, securities and other.lxv
Interest on Public Debt and Financial Liabilities Alberta’s interest costs through 2005 are estimated using the PEA-budget relationship discussed above. As with financial assets, Alberta’s financial liabilities increase by the amount of any deficit in the government’s budget. Interest costs beyond 2005 are determined using the stock of financial liabilities and an interest rate of 6.4 per cent calculated as the average of the 1994/95 through 2001/02 implied interest rates using FMS financial liabilities and interest costs. Financial liability categories in Statistics Canada’s Financial Management System include: bank overdrafts, payables, advances,
53

treasury bills, savings bonds, bonds and debentures, other securities, deposits, liabilities to pension plans and other.lxvi
Population It is important to keep the distinction between population estimates and projections clear. Estimates refers to historical data that are subject only to revisions whereas projections refer to modeled scenarios of what population will be if certain assumptions hold true. Also, Statistics Canada is careful to note that these projections are not predictions but “an attempt to establish plausible long-term scenarios based on stated components assumptions, which are subject to varying degrees of uncertainty.” (Statistics Canada, 2001) Population Estimates Population estimates for 1971 though 2003 are from Statistics Canada’s Annual Demographic Statistics, 2003. Data for 1971 through 1995 are classified as revised intercensal estimates. Data for 1996 through 2000 are final intercensal estimates and those for 2001 are final postcensal estimates. Data for 2002 are updated postcensal estimates while 2003 data are preliminary postcensal estimates. Population Projections Three different standard population projections from Statistics Canada’s Population Projections for Canada, Provinces and Territories, 2000-2026 are used. Scenario 1 uses Projection 3: High Growth with West-Based Interprovincial Migration. Scenario 2 uses Projection 2: Medium Growth and Scenario 3 uses Projection 1: Low Growth. All projections are based on 2000 as the starting point. As population estimates for 2000 through 2003 are available, the projections through 2026 are adjusted by taking the 2003 data as the starting point and adding the year-to-year growth embodied in the projections. Scenario 1: High Growth with West-Based Interprovincial Migration Assumptions: Male Life Expectancy at Birth (Years): 78.5 in 2006 rising to 82.9 in 2026 Female Life Expectancy at Birth (Years): 82.9 in 2006 rising to 85.1 in 2026 Total Fertility Rate (Births per Woman): 1.75 in 2006 increasing to 1.94 in 2026 Net International Immigration (Persons): 8,500 in 2006 falling to 7,100 in 2026 Non-Permanent Residents (Persons): 17,000 in 2006 through 2026 Net Interprovincial Migration (Persons): 13,100 in 2006 falling to 8,400 in 2026 Notes: This projection produces population figures which are a close match to that presented in the 2004 Alberta budget although the trajectory in the budget indicates higher near-term growth than that produced by this projection. However, as noted in the Alberta government’s recently released 20 year planlxvii, this must moderate as “the government sees Alberta in 2025 as a province of four million people, slightly older than today's population and more diverse.” The population growth rate slows under all of
54

Statistics Canada’s projection scenarios. Alberta’s average annual population growth was 2.0 per cent between 1972 and 2003 and under the high growth scenario it slows to 1.1 per cent for 2004 through 2026. The rate slows to 0.7 per cent under scenario 2: Medium Growth and to 0.4 per cent under scenario 3: Low Growth. Net interprovincial migration to Alberta declines in all scenarios as net migration to BC is expected to increase over the projection period. Flows between BC and Alberta are expected to remain significant.lxviii Scenario 2: Medium Growth with Medium Interprovincial Migration Assumptions: Male Life Expectancy at Birth (Years): 77.9 in 2006 rising to 80.5 in 2026 Female Life Expectancy at Birth (Years): 82.6 in 2006 rising to 84.1 in 2026 Total Fertility Rate (Births per Woman): 1.63 throughout 2006 to 2026 Net International Immigration (Persons): basically constant, fluctuating between 5,700 in and 5,900 through 2026 Non-Permanent Residents (Persons): 17,000 in 2006 through 2026 Net Interprovincial Migration (Persons): 4,100 in 2006 falling to 800 in 2026 Scenario 3: Low Growth with Medium Interprovincial Migration Assumptions: Male Life Expectancy at Birth (Years): 77.2 in 2006 rising to 79.0 in 2026 Female Life Expectancy at Birth (Years): 82.1 in 2006 rising to 83.1 in 2026 Total Fertility Rate (Births per Woman): 1.54 in 2006 falling to 1.40 in 2026 Net International Immigration (Persons): 3,200 in 2006 increasing to 3,500 in 2026 Non-Permanent Residents (Persons): 17,000 in 2006 through 2026 Net Interprovincial Migration (Persons): 4,100 in 2006 falling to 500 in 2026 lix Jackson and Matier (2003). lx Government of Alberta (2004a), Fiscal Plan Tables 2004-07, Historical Fiscal Summary, 1985-86 and 2006-07, page 62. lxi Statistics Canada (2003). lxii Organisation for Economic Co-operation and Development (2004). lxiii See pages 17 and 18 for more information. lxiv Appendix A contains additional information on FMS financial assets and liabilities. lxv See Statistics Canada (2001) for more detail on the Financial Management System. lxvi See Statistics Canada (2001) for more detail on the Financial Management System. lxvii Government of Alberta (2004a), released as part of Budget 2004 in “Government of Alberta Strategic Business Plan, page 15. lxviii Statistics Canada (2004a), page 49.
55
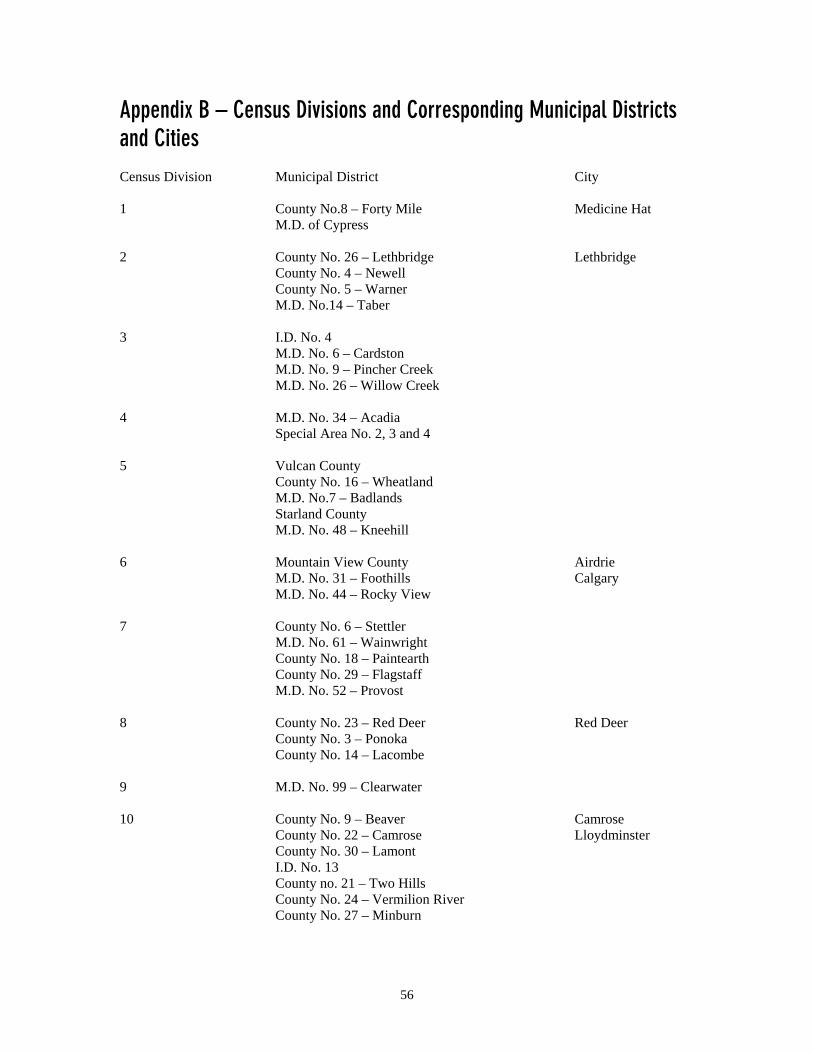
Appendix B – Census Divisions and Corresponding Municipal Districts and Cities Census Division 1 2 3 4 5 6 7 8 9 10
Municipal District County No.8 – Forty Mile M.D. of Cypress County No. 26 – Lethbridge County No. 4 – Newell County No. 5 – Warner M.D. No.14 – Taber I.D. No. 4 M.D. No. 6 – Cardston M.D. No. 9 – Pincher Creek M.D. No. 26 – Willow Creek M.D. No. 34 – Acadia Special Area No. 2, 3 and 4 Vulcan County County No. 16 – Wheatland M.D. No.7 – Badlands Starland County M.D. No. 48 – Kneehill Mountain View County M.D. No. 31 – Foothills M.D. No. 44 – Rocky View County No. 6 – Stettler M.D. No. 61 – Wainwright County No. 18 – Paintearth County No. 29 – Flagstaff M.D. No. 52 – Provost County No. 23 – Red Deer County No. 3 – Ponoka County No. 14 – Lacombe M.D. No. 99 – Clearwater County No. 9 – Beaver County No. 22 – Camrose County No. 30 – Lamont I.D. No. 13 County no. 21 – Two Hills County No. 24 – Vermilion River County No. 27 – Minburn
City Medicine Hat Lethbridge Airdrie Calgary Red Deer Camrose Lloydminster
56

C
ensus Division
11 12 13 14 15 16 17 18 19
M
unicipal District
M.D. No. 77 – Brazeau Sturgeon County County No. 10 – Wetaskiwin County No. 25 – Leduc County of Parkland Strathcona County County No. 13 – Smokey Lake County No. 19 – St. Paul M.D. No. 87 – Bonnyville Lakeland County County No. 11 – Barrhead M.D. No.15 – Woodlands M.D. No. 28 – Lac Ste. Anne County No. 7 – Thorhild County No. 12 – Athabasca M.D. No. 92 – Westlock I.D. No. 25 M.D. No. 94 – Yellowhead I.D. No. 12 Jasper Improvement District Kananaskis Improvement District I.D. No. 9 M.D. No. 8 – Bighorn M.D. No. 66 – Ranchland I.D. No. 24 Regional Municipality of Wood Buffalo M.D. No. 21 – Clear Hills M.D. No. 22 – Northern Lights M.D. No. 23 – Mackenzie M.D. No. 125 – Big Lakes M.D. No. 131 – East Peace M.D. No. 124 – Lesser Slave Lake M.D. No. 17 - Opportunity M.D. No. 16 – Greenview County No. 1 – Grande Prairie M.D. No. 19 – Birch Hills M.D. No. 20 – Saddle Hills M.D. No. 130 – Smokey River M.D. No. 133 – Spirit River M.D. No. 135 – Peace M.D. No. 136 – Fariview
C
ity
Edmonton Fort Saskatchewan Leduc Spruce Grove St. Albert Wetaskiwin Sherwood Park Cold Lake Fort McMurray Grande Prairie
)
Source: Government of Alberta (1999
57

References Azmier, Jason J. and Sarah Dobson (2003) The Burgeoning Fringe: Western Canada’s
Rural Metro-Adjacent Areas, Canada West Foundation. Azmier, Jason J. and Liam Stone (2003) The Rural West: Diversity and Dilemma,
Canada West Foundation. Baxter, David (1999) Without Care? Demographics and Health Spending in British
Columbia, 1999 to 2040, Urban Futures Institute Report 37, Urban Futures Institute.
BC Progress Board (2003) Measuring BC’s Performance – Reaching North Star 2010,
Third Annual BC Progress Board Benchmarking Report, Volume II – Internal Performance Review: Regional.
BC Progress Board (2004) Measuring BC’s Performance – Reaching North Star 2010,
Interim Benchmarking Report 2004. Berry, Brian J.L. (1970) Labour Market Participation and Regional Potential, Growth
and Change Brimacombe, Glenn G., Pedro Antunes and Jane McIntyre (2001) The Future Cost of
Health Care in Canada, 2000 to 2020, The Conference Board of Canada. Canadian Institute for Health Information (2003) National Health Expenditure Trends,
1975-2003. Canadian Institute for Health Information (2003) Preliminary Provincial and Territorial
Government Health Expenditure Estimates, 1974-1975 to 2003-2004. Casey, Bernard, Howard Oxley, Edward Whitehouse, Pablo Antolin, Romain Duval and
Willi Leibfritz (2003) Policies For An Aging Society: Recent Measures and Areas for Further Reform, OECD Economics Department Working Paper 369.
Chand, Sheetal and Albert Jaeger (1996) Aging Populations and Public Pension
Schemes, IMF, Occasional Paper No. 147, International Monetary Fund, Washington.
Dang, T-T, P. Antolin and H. Oxley (2001) The Fiscal Implications of Aging: Projections
of Age-Related Spending, OECD Economics Department Working Paper 305. De Masi, Paula, Martin Kaufman, Iryna Ivaschenko and Roberto Cardarelli (2003)
Canada: Selected Issues, IMF Country Report No. 03/34, International Monetary Fund.
58

Eatwell, John, Murray Milgate and Peter Newman (1998) The New Palgrave: A Dictionary of Economics, Palgrave Publishers.
Fox, Karl and Krishna Kumar (1965) The Functional Economic Area: Delineation and
Implications for Economic Analysis and Policy. Papers of the Regional Science Association 15: 57-84.
Government of Alberta (1999) Alberta Population Projections: Census Divisions, 1999-
2016, Alberta Finance, Statistics Unit. Government of Alberta (2004a) Budget 2004, On Route, On Course, Heading Toward
Alberta’s Second Century. Government of Alberta (2004b) Speech from the Throne, Fourth Session of the Twenty-
Fifth Legislature, available at: www.gov.ab.ca/home/thronespeech/2004/. Government of Canada (2004) The Budget Plan, 2004, Finance Canada. Health Canada (2001) Health Expenditures in Canada by Age and Sex, 1980-81 to 2000-
01, Health Policy and Communications Branch. Heller Peter S. (2003) Who Will Pay?: Coping With Aging Societies, Climate Change,
and Other Long-Term Fiscal Challenges, International Monetary Fund. Jackson, Harriet and Chris Matier (2003) Public Finance Implications of Population
Aging: An Update, Department of Finance Working Paper 2003-03, Economic and Fiscal Policy Branch, Department of Finance.
Klein, Ralph (2004) Heading Toward Alberta’s Second Century, Televised Address,
Wednesday, February 4, 2004, available at: www.gov.ab.ca/premier/address2004. Maddison, Angus (2001) The World Economy, A Millennial Perspective, Organisation
for Economic Co-operation and Development. Masson, Paul and Michael Mussa (1995) Long-Term Tendencies in Budget Deficits and
Debt, IMF Working Paper 95/128, International Monetary Fund, Washington. Mitchelson, Ronald L. and James Fisher (1987) Long Distance Commuting and
Population Change in Georgia, 1960-80. Growth and Change 18: 44-65. National Energy Board (2003) Canada’s Energy Future: Scenarios for Supply and
Demand to 2025, Government of Canada. Natural Resources Canada (2003) Canadian Natural Gas: Review of 2002 & Outlook to
2015, Natural Gas Division, Petroleum Resources Branch, Energy Sector, Natural Resources Canada, Government of Canada.
59

Office of the Chief Actuary, (2002a) Actuarial Report (5th) on the Old Age Security
Program as at December 2000, Office of the Superintendent of Financial Institutions.
Office of the Chief Actuary, (2002b) Actuarial Report (19th) supplementing the Actuarial
Report on the Canada Pension Plan as at 31 December 2000, Office of the Superintendent of Financial Institutions.
Organisation for Economic Co-operation and Development (2004a) OECD Economic
Outlook 74, December 2003. Organisation for Economic Co-operation and Development (2004b) OECD Education
Online Database. Prada, Gabriela, Glen Roberts, Stephan Vail, Malcolm Anderson, Erin Dowm, Cathy
Fooks, Al Howatson, Kelly Grimes, Steve Morgan, Karen Parent, Duncan Sinclair, Vivian Thompson and Armine Yalnizyan (2004) Understanding Health Care Cost Drivers and Escalators, Conference Board of Canada.
Stabler, Jack C., M. Rose Olfert and Jonathan Greuel (1996) Spatial Labor Markets and
the Rural Labor Force. Growth and Change 27:206-230. Stabler, Jack C. and M. Rose Olfert (2002) Functional Economic Areas of the Canadian
Prairie Region, Prepared for Agriculture Canada-PFRA, Canadian Rural Partnership (CRP) and Rural Development Division of Alberta Agriculture, Food and Rural Development.
Statistics Canada (2001) Financial Management System (FMS), Catalogue No. 68F0023,
Public Institutions Division, Statistics Canada. Statistics Canada (2003) Education Indicators in Canada, Report of the Pan-Canadian
Education Indicators Program 2003, Catalogue No. 81-582. Statistics Canada (2004a) Population Projections by Census Division for Alberta, Special
Request. Statistics Canada (2004b) Annual Demographic Statistics, 2003 Edition, Demography
Division. Statistics Canada (2004c) Financial Management System (electronic data set), Public
Institutions Division. Statistics Canada, Historical Statistics of Canada, catalogue number 11-516, Online
Reference, available at: http://www.statcan.ca/english/IPS/Data/11-516-XIE.htm.
60

Statistics Canada (2004d) Provincial Economic Accounts (electronic data set), Income and Expenditure Accounts Division.
Statistics Canada (2001) Population Projections For Canada, Provinces and Territories
2000-2026, Demography Division. Tanzi, Vito and Ludger Schuknecht (2000) Public Spending in the 20th Century: A
Global Perspective, Cambridge University Press. TD Economics (2003) The Calgary-Edmonton Corridor, Take Action Now to Ensure the
Tiger’s Roar Doesn’t Fade, TD Bank Financial Group. Treff, Karin and David B. Perry (2003) Finances of The Nation, Canadian Tax
Foundation. United Nations (2002a) World Population Aging: 1950-2050, Department of Economic
and Social Affairs, Population Division. United Nations (2004) World Urbanization Prospects, The 2003 Revision: Data Table
and Highlights, Department of Economic and Social Affairs, Population Division. United States Department of Energy (2004) Annual Energy Outlook 2004: With
Projections to 2025, Energy Information Administration, U.S. Department of Energy, Government of the United States
Van den Noord, P. and R. Herd (1993) Pension Liabilities in the Seven Major Economies,
Organisation for Economic Co-operation and Development, Paris. Veldhuis, Niels, Joel Emes, Todd Fox and Raphael Barth (2003) Canadian Government
Debt 2003: A Guide to the Indebtedness of Canada and the Provinces, Public Policy Sources No. 67, The Fraser Institute, Vancouver.
World Bank (1999) Entering the 21st Century, World Development Report, 1999/2000,
Oxford University Press. World Economic Forum (2004) Living Happily Ever After: The Economic Implications
of Aging Societies
61

