demographic research volume 10, article 1, pages … · oslo . vladimir m. shkolnikov alexander d....
TRANSCRIPT

Demographic Research a free, expedited, online journal of peer-reviewed research and commentary in the population sciences published by the Max Planck Institute for Demographic Research Konrad-Zuse Str. 1, D-18057 Rostock · GERMANY www.demographic-research.org
DEMOGRAPHIC RESEARCH VOLUME 10, ARTICLE 1, PAGES 1-26 PUBLISHED 09 JANUARY 2004 www.demographic-research.org/Volumes/Vol10/1/ DOI: 10.4054/DemRes.2004.10.1 Descriptive Findings
Educational differentials in male mortality in Russia and northern Europe. A comparison of an epidemiological cohort from Moscow and St. Petersburg with the male populations of Helsinki and Oslo
Vladimir M. Shkolnikov
Alexander D. Deev
Øystein Kravdal
Tapani Valkonen
© 2004 Max-Planck-Gesellschaft.

Table of Contents
1 Introduction 3
2 Data and methods 4
3 Results 11
4 Discussion 18
5 Acknowledgements 21
Notes 23
References 24

Demographic Research – Volume 10, Article 1
http://www.demographic-research.org 1
Descriptive Findings
Educational differentials in male mortality in Russia and northernEurope. A comparison of an epidemiological cohort from Moscowand St. Petersburg with the male populations of Helsinki and Oslo
Vladimir M. Shkolnikov1
Alexander D. Deev2
Øystein Kravdal3
Tapani Valkonen4
Abstract
Background
Prior estimates of the Russian mortality by socio-demographic group revealedsignificant differentials around the censuses of 1979 and 1989, but these studies werebased on different sources of information on education for the deceased and thepopulation at risk, leading to a potential numerator-denominator bias. To eliminate thisproblem, and to compare with the corresponding differentials in Nordic countries, anepidemiological cohort from Moscow and St. Petersburg is used for estimation ofmortality in this study, along with similar register-based data from Helsinki and Oslo.
1 Corresponding author. Max Planck Institute for Demographic Research, Konrad-Zuse-Str. 1,
Rostock D-18057, Germany. Email: [email protected] State Centre for Preventive Medicine, Petroverigskiy per. 10, Moscow, 101990 Russian Federation3 Cancer Registry of Norway and Department of Economics, University of Oslo, P.O. Box 1095,
Blindern, N-0317 Oslo Norway. Email: [email protected] Department of Sociology, University of Helsinki, P.O. Box 18, 00014 University of Helsinki,
Finland. Email: [email protected]

Demographic Research – Volume 10, Article 1
2 http://www.demographic-research.org
Data and Methods
The Russian data include 7815 men from Moscow and St. Petersburg born in 1916-35who participated in the Lipid Research Clinics (LRC) program, with a follow-up periodfrom 1975 to 1997. Data with a similar structure, covering complete cohorts, wereestablished for men born 1916-35 cohorts and living in Helsinki (1976-1995) and Oslo(1975-1991). Three educational categories were used: low (less than 10 years ofschooling), middle (10 to 12 years) and high (13+ years).
Results
In the LRC cohort, mortality of men with high education is close to the city average forHelsinki and Oslo. Absolute inter-group differences are much greater in the Russiansample than in the two other populations. Differences in temporary life expectancies(40-74) between men with high and low education are 5.2, 3.5, and 3.2 years in theLRC cohort, Helsinki, and Oslo, respectively. Also relative differences are larger in theLRC cohort, although less markedly. Low/high education ratios of standardized deathrates are 2.2, 2.0, and 1.9 in the three populations. Educational mortality differencesmeasured by a relative index of inequality are 3.1, 2.7, and 2.6 (using the all-Russiaeducational distribution in the calculation for the LRC cohort) A similar patternappears, of course, in Poisson regression models where it is controlled not only for age,but also calendar time. Consideration of causes of death shows that the larger relativedifference between educational categories in the LRC cohort than in the Nordic capitalsstems from particularly sharp gradients in mortality from cerebrovascular diseases and,more clearly, external causes. Whereas all-cause mortality has increased over time formen in the LRC cohort with low or middle education, there are indications that thosewith high education have not experienced an increase (i.e. differentials have increased).In contrast to this, the development in Oslo and Helsinki has been more favourable andmore similar for the different educational groups.
Implications
The educational gaps in mortality of the Russian population and its extreme levels inthe low education group should be addressed by adequate health policies. Trends ininequalities in health and their determinants require careful monitoring and furtheranalyses.
Demographic Research – Volume 10, Article 1
http://www.demographic-research.org 3
1. Introduction
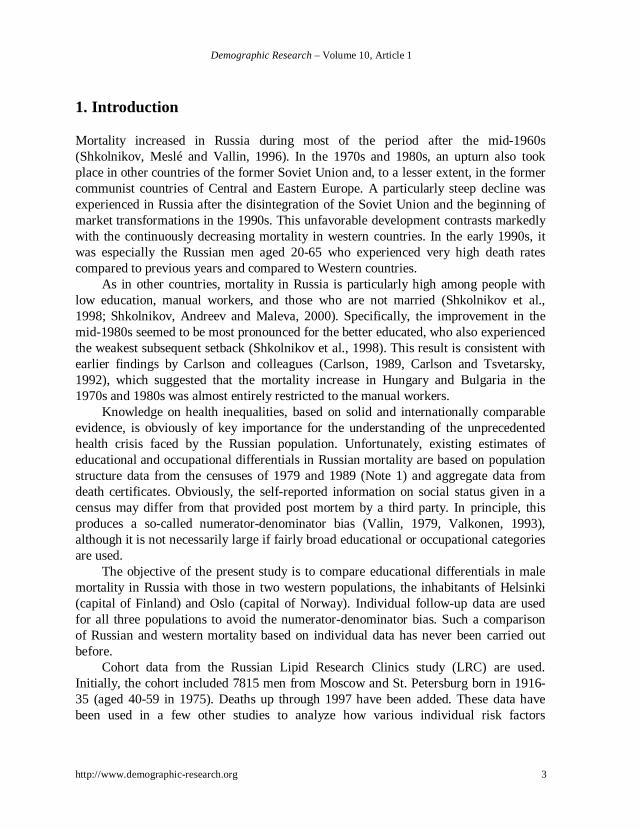
Mortality increased in Russia during most of the period after the mid-1960s(Shkolnikov, Meslé and Vallin, 1996). In the 1970s and 1980s, an upturn also tookplace in other countries of the former Soviet Union and, to a lesser extent, in the formercommunist countries of Central and Eastern Europe. A particularly steep decline wasexperienced in Russia after the disintegration of the Soviet Union and the beginning ofmarket transformations in the 1990s. This unfavorable development contrasts markedlywith the continuously decreasing mortality in western countries. In the early 1990s, itwas especially the Russian men aged 20-65 who experienced very high death ratescompared to previous years and compared to Western countries.
As in other countries, mortality in Russia is particularly high among people withlow education, manual workers, and those who are not married (Shkolnikov et al.,1998; Shkolnikov, Andreev and Maleva, 2000). Specifically, the improvement in themid-1980s seemed to be most pronounced for the better educated, who also experiencedthe weakest subsequent setback (Shkolnikov et al., 1998). This result is consistent withearlier findings by Carlson and colleagues (Carlson, 1989, Carlson and Tsvetarsky,1992), which suggested that the mortality increase in Hungary and Bulgaria in the1970s and 1980s was almost entirely restricted to the manual workers.
Knowledge on health inequalities, based on solid and internationally comparableevidence, is obviously of key importance for the understanding of the unprecedentedhealth crisis faced by the Russian population. Unfortunately, existing estimates ofeducational and occupational differentials in Russian mortality are based on populationstructure data from the censuses of 1979 and 1989 (Note 1) and aggregate data fromdeath certificates. Obviously, the self-reported information on social status given in acensus may differ from that provided post mortem by a third party. In principle, thisproduces a so-called numerator-denominator bias (Vallin, 1979, Valkonen, 1993),although it is not necessarily large if fairly broad educational or occupational categoriesare used.
The objective of the present study is to compare educational differentials in malemortality in Russia with those in two western populations, the inhabitants of Helsinki(capital of Finland) and Oslo (capital of Norway). Individual follow-up data are usedfor all three populations to avoid the numerator-denominator bias. Such a comparisonof Russian and western mortality based on individual data has never been carried outbefore.
Cohort data from the Russian Lipid Research Clinics study (LRC) are used.Initially, the cohort included 7815 men from Moscow and St. Petersburg born in 1916-35 (aged 40-59 in 1975). Deaths up through 1997 have been added. These data havebeen used in a few other studies to analyze how various individual risk factors
Demographic Research – Volume 10, Article 1
4 http://www.demographic-research.org
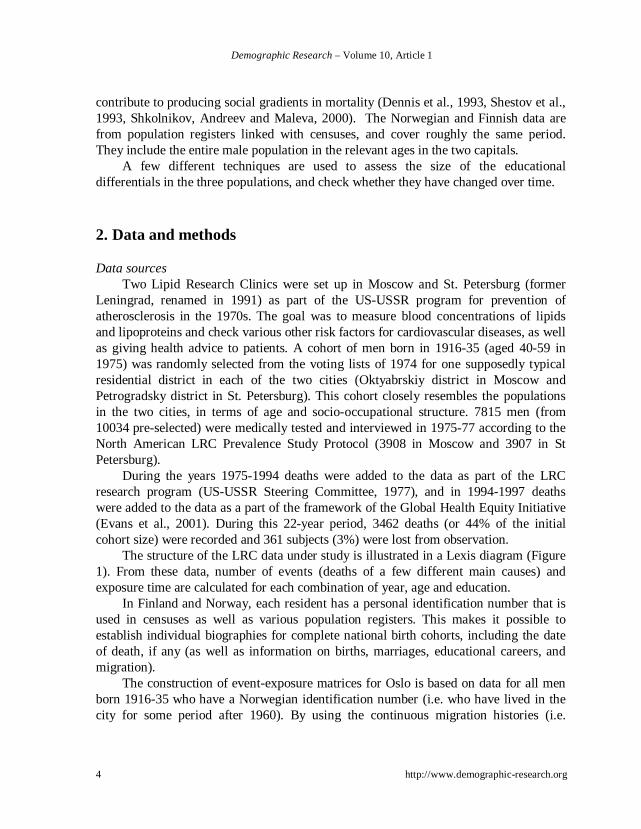
contribute to producing social gradients in mortality (Dennis et al., 1993, Shestov et al.,1993, Shkolnikov, Andreev and Maleva, 2000). The Norwegian and Finnish data arefrom population registers linked with censuses, and cover roughly the same period.They include the entire male population in the relevant ages in the two capitals.
A few different techniques are used to assess the size of the educationaldifferentials in the three populations, and check whether they have changed over time.
2. Data and methods
Data sourcesTwo Lipid Research Clinics were set up in Moscow and St. Petersburg (former
Leningrad, renamed in 1991) as part of the US-USSR program for prevention ofatherosclerosis in the 1970s. The goal was to measure blood concentrations of lipidsand lipoproteins and check various other risk factors for cardiovascular diseases, as wellas giving health advice to patients. A cohort of men born in 1916-35 (aged 40-59 in1975) was randomly selected from the voting lists of 1974 for one supposedly typicalresidential district in each of the two cities (Oktyabrskiy district in Moscow andPetrogradsky district in St. Petersburg). This cohort closely resembles the populationsin the two cities, in terms of age and socio-occupational structure. 7815 men (from10034 pre-selected) were medically tested and interviewed in 1975-77 according to theNorth American LRC Prevalence Study Protocol (3908 in Moscow and 3907 in StPetersburg).
During the years 1975-1994 deaths were added to the data as part of the LRCresearch program (US-USSR Steering Committee, 1977), and in 1994-1997 deathswere added to the data as a part of the framework of the Global Health Equity Initiative(Evans et al., 2001). During this 22-year period, 3462 deaths (or 44% of the initialcohort size) were recorded and 361 subjects (3%) were lost from observation.
The structure of the LRC data under study is illustrated in a Lexis diagram (Figure1). From these data, number of events (deaths of a few different main causes) andexposure time are calculated for each combination of year, age and education.
In Finland and Norway, each resident has a personal identification number that isused in censuses as well as various population registers. This makes it possible toestablish individual biographies for complete national birth cohorts, including the dateof death, if any (as well as information on births, marriages, educational careers, andmigration).
The construction of event-exposure matrices for Oslo is based on data for all menborn 1916-35 who have a Norwegian identification number (i.e. who have lived in thecity for some period after 1960). By using the continuous migration histories (i.e.

Demographic Research – Volume 10, Article 1
http://www.demographic-research.org 5
monthly data on place of residence), it was possible to count only the exposure anddeaths in the municipality of Oslo. The data cover the years 1975-1991, i.e. few yearsless than the LRC cohort. Educational level refers to the 1970 census (for the years1975-79) or the 1980 census (for the years 1980-91). The Finnish data include all menborn in 1916-35 who lived in Helsinki Metropolitan area in 1975 and cover the years upto 1995. Educational level refers to the 1975 census. Thus, the structure of the data fromthese two cities is as for the LRC cohort, except for a slightly shorter follow-up periods.
Figure 1: Region of observations of the LRC data set in the Lexis diagram. For theHelsinki data set follow-up period lasts from 1976 to 1995, for the Oslodata set follow-up period lasts from 1975 to 1991.
Educational distributionThe number of years of completed education is important for the individual’s
general health knowledge, wage potential, type of job (and thus occupational hazards)and the personal network. The latter could be especially important in Russia, wheresocial capital has been shown to be important for many people for meeting their
848382818079787776757473727170696867666564636261605958575655545352515049484746454443424140
1975
1976
1977
1978
1979
1980
1981
1982
1983
1984
1985
1986
1987
1988
1989
1990
1991
1992
1993
1994
1995
1996
1997

Demographic Research – Volume 10, Article 1
6 http://www.demographic-research.org
personal needs for public and private services (Rose, 2000). These general factors are inturn determinants of various risk factors such as smoking, alcohol, diet, physicalactivity, and frequency of medical check-ups.
In all three populations, three categories of education are defined: low (less thansecondary education with 9 or less years of schooling), middle (secondary educationwith 10 to 12 years of schooling) and high (tertiary or university education with 13 ormore years of schooling).
Broadly speaking, the three categories of education determine in each countrylower, medium, and upper part of the educational spectrum. Although the educationalcategories are similar in terms of years of schooling, one can not claim that they areexactly the same in the three countries in respect to content of educational programmes,amounts of knowledge gained, corresponding ranges of occupations, incomes, andsocial statuses. In the present study, we will use indices of inequality as a means toavoid major problems of inter-country incomparability of educational categories. Inparticular, regression-based indices of inequality, such as relative index of inequalityand slope index of inequality, allow comparable measurements of the magnitudes ofeducational differentials even if the cut points in the educational scale are not the sameamong countries.
Table 1 provides brief information about the data. The Helsinki data include 1216thousand person-years at risk and about 23 thousand deaths, the Oslo data include 760thousand person-years at risk and 12 thousand deaths, and the LRC data include 131thousand person-years at risk and about 3.5 thousand deaths.
The educational distribution in the LRC data is shifted upwards compared to thatin the two Nordic capitals. For example, the proportion of exposure time lived bypeople with high education is 36% in the LRC cohort and about 20% in Helsinki andOslo. This high average educational level in the two districts of Moscow and St.Petersburg fits well with census statistics. According to the 1979 census, theproportions of people with low, middle and high levels of education in the two citieswere 44%, 26% and 30%, respectively (Interstate Statistical Committee of CIS, 1996),whereas the corresponding figures in the LRC cohort are 41%, 24%, and 35%. Asexpected, the census figures for the entire Russia reveal less impressive educationalachievements. In fact, the proportions (61%, 23%, and 16%) are much closer to those inHelsinki and Oslo than to the ones in the LRC cohort. In this study, the all-Russiaeducational distribution, obtained by interpolation between 1979 and 1989 censusfigures, is used instead of the LRC distribution in some calculations.

Demographic Research – Volume 10, Article 1
http://www.demographic-research.org 7
Table 1: Characteristics of the LRC, Helsinki and Oslo data sets.
LRC (Moscow-St.Petersburg) Helsinki OsloExposure
time(years)
% Deaths % Exposuretime
(years)
% Deaths % Exposuretime
(years)
% Deaths %
Total 130508 100.0 3462 100.0 1215924 100.0 22659 100.0 759728 100.00 12276 100.0Education9 years or less (low) 50349 38.5 1797 51.9 701282 57.7 15341 67.7 349312 46.0 7043 57.410-12 years (middle) 33337 26.6 851 24.6 289508 23.8 4670 20.6 255625 33.6 3681 30.013+ (high) 46821 35.9 814 23.5 225134 18.5 2648 11.7 154790 20.4 1552 12.6
National mortality trendsAs elaborated on below, both absolute and relative mortality differentials are
estimated for the three data sets. As a backdrop for the discussion of these results, thetrends in period life expectancy of men at birth, and within the age range 40- 74 (Note2), are shown in Figure 2.
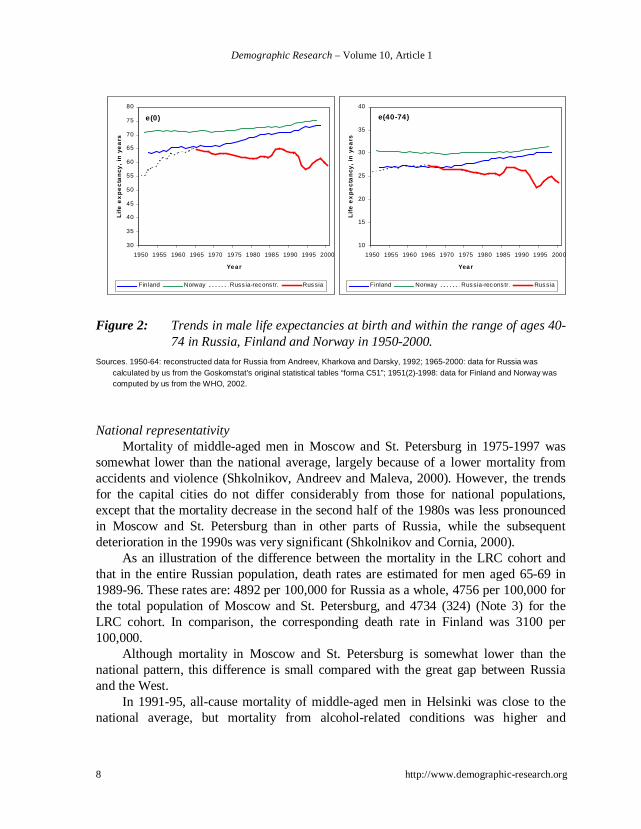
Norway started from a high life expectancy of 71 years in 1951, and made almostno progress till the mid-1970s (left panel of Figure 2). The following years saw a slowincrease, with some acceleration in the 1990s, up to a level of 75.4 years in 1997.Finland started at a much lower level (63 years in 1952), but made spectacular progressafter the mid-1970s, and reached 73.5 years in 1998. The Russian development hasbeen markedly different. After a rapid increase in the 1950s and the early 1960s, adownward trend took place from the mid-1960s to the mid-1980s. A sudden upsurgeoccurred in 1985, presumable as a result of a major anti-alcohol campaign (Shkolnikov,Meslé and Vallin, 1996). Disintegration of the Soviet Union and beginning of markettransformations in 1992-94 coincided with an abrupt drop in life expectancy to very lowvalues, succeeded by partial recuperation in 1995-97 and another decrease after 1998(Shkolnikov, McKee and Leon, 2001). Period life expectancy for Russian men was aslow as 59 years in 2000. Life expectancies within ages 40-74, which is the age range infocus of this study, show a similar pattern, although with smaller variance (right panelof Figure 2).
Demographic Research – Volume 10, Article 1
8 http://www.demographic-research.org
30
35
40
45
50
55
60
65
70
75
80
1950 1955 1960 1965 1970 1975 1980 1985 1990 1995 2000
Year
Lif
e e
xp
ec
tan
cy,
in y
ea
rs
Finland Norway Russ ia-recons tr. Russia
e(0)
10
15
20
25
30
35
40
1950 1955 1960 1965 1970 1975 1980 1985 1990 1995 2000
Year
Lif
e e
xp
ec
tan
cy,
in y
ea
rs
Finland Norway Russia-recons tr. Russia
e(40-74)
Figure 2: Trends in male life expectancies at birth and within the range of ages 40-74 in Russia, Finland and Norway in 1950-2000.
Sources. 1950-64: reconstructed data for Russia from Andreev, Kharkova and Darsky, 1992; 1965-2000: data for Russia wascalculated by us from the Goskomstat’s original statistical tables “forma C51”; 1951(2)-1998: data for Finland and Norway wascomputed by us from the WHO, 2002.
National representativityMortality of middle-aged men in Moscow and St. Petersburg in 1975-1997 was
somewhat lower than the national average, largely because of a lower mortality fromaccidents and violence (Shkolnikov, Andreev and Maleva, 2000). However, the trendsfor the capital cities do not differ considerably from those for national populations,except that the mortality decrease in the second half of the 1980s was less pronouncedin Moscow and St. Petersburg than in other parts of Russia, while the subsequentdeterioration in the 1990s was very significant (Shkolnikov and Cornia, 2000).
As an illustration of the difference between the mortality in the LRC cohort andthat in the entire Russian population, death rates are estimated for men aged 65-69 in1989-96. These rates are: 4892 per 100,000 for Russia as a whole, 4756 per 100,000 forthe total population of Moscow and St. Petersburg, and 4734 (324) (Note 3) for theLRC cohort. In comparison, the corresponding death rate in Finland was 3100 per100,000.
Although mortality in Moscow and St. Petersburg is somewhat lower than thenational pattern, this difference is small compared with the great gap between Russiaand the West.
In 1991-95, all-cause mortality of middle-aged men in Helsinki was close to thenational average, but mortality from alcohol-related conditions was higher and

Demographic Research – Volume 10, Article 1
http://www.demographic-research.org 9
mortality from ischeamic heart disease lower ( Koskinen and Martelin 1998). Mortalityin Oslo in 1975-91 was somewhat higher than the country average (Statistics Norway2002).
MethodsIn the first part of the analysis, all-cause death rates grouped by age and education
are used as building stones in the computation of life expectancies and age-standardizeddeath rates (SDR). The computations are done separately for each of the threeeducational categories. The age- and education-specific death rates are estimated as theratio of the number of deaths in the relevant age and education group to thecorresponding exposure time (assuming a constant death rate within this interval).These events and exposure times are easily produced from the matrices described aboveby summing over year and (for the events) cause of death. In other words, when wesuppress the educational dimension and consider only all-cause mortality, the deathrates at age x are calculated as Dx / Ex where
�� +=t i itx nxxdD ),( , � � +=
t i itx nxxE ),,(τ (1)
and dit(x, x+n) = 1 if an individual i dies between exact ages x and x+n in calendar year
t and dit(x, x+n) = 0 otherwise; itτ (x, x+n) is the amount of time (in years) lived by an
individual i between exact ages x and x+n in the calendar year t (n=1 or 5 dependent onwhether one- or five-year age groups are used). This is occasionally called the “personyears” approach (Kahn and Sempos, 1989).
Of course, the rates at the oldest ages reflect mortality during the last years of theperiod under analysis, whereas the opposite is the case for the youngest ages. Forexample, deaths at ages 40-49 take place in 1975-84, and deaths at ages 70-74 in 1985-97. This means that the differences across age are confounded by period changes.Special techniques have been developed to take such confounding into account, butpreliminary analyses showed that the use of such techniques have no influence on theestimates of educational differences in mortality. Therefore, life expectancies and age-standardized death rates (based on the European population standard) for ages 40-74 arecomputed in a conventional way.
Absolute differences in mortality between the different educational groups in acountry, and between countries within the same educational group, are calculated bysubtracting the country- and education-specific life expectancies. To get a measure ofrelative differences, the corresponding SDR ratios are calculated. In addition, SDRs areused in combination with education-specific weights of exposure time (proportion ofexposure time in any educational category) to compute four different indices of

Demographic Research – Volume 10, Article 1
10 http://www.demographic-research.org
educational differentials: relative and absolute indices of dissimilarity, and regression-based relative and absolute indices of inequality (Kunst and Mackenbach, 1994,Mackenbach and Kunst, 1997).
These indices of inequality express inter-group mortality differentials in a compactform and facilitate the comparison between countries.
The absolute index of dissimilarity can be interpreted as the amount of deaths thatshould be redistributed among groups in order to reach the equal mortality at the totalpopulation’s level. The relative index of dissimilarity is equal to the absolute ID dividedby the total population’s mortality rate.
�=
−⋅=3
1
||k
kkabs SDRSDRID θ , (2a)
SDRIDID absrel /= , (2b)
where k is the educational group (numbered from 1 to 3), kθ is the population weight
of the educational group k, and SDRk and SDR are age-standardized death rates in thek-th educational group and in the overall population, respectively.
The relative index of inequality (RII) and slope index of inequality (SII) are basedon the least square regression of mortality rates in educational groups on levels ofeducation, taking into account their population weights. These indices express relative(RII) and absolute (SII) gaps in mortality between the “best” and the “worst”individuals in population. The baseline assumption is that mortality changes linearlyacross individuals ranked by education.
Let2/,2/,2/ 321321211 θθθθθθ ++=+== ppp
andpbapSDR ⋅+=)(
be the linear least square regression built on the three points (p1, SDR1), (p2, SDR2), and(p3,SDR3). The indices are defined as:
bSDRSDRSII =−= )0()1( , (3a)
./)()0(/)1( abaSDRSDRRII +== (3b)
A graphical illustration of RII and SI is given below.

Demographic Research – Volume 10, Article 1
http://www.demographic-research.org 11
In the second part of the analysis, possible differences between the educationalcategories in the period of observation are controlled for. This is done by estimating thesimple Poisson model
)(,,,,
ktx educyearagektxktx eED ++⋅= , (4)
where ktx educyearage ,, are dummy variables corresponding to age group x (5-year
age intervals), calendar period t (5-year calendar periods) and educational level k (three
categories), ktxD ,, and ktxE ,, are the numbers of deaths and person-years in respective
cells of the region of observations (in analogy with the notation in (1)). The SDR ratiosdescribed above correspond to the education effects in this model when period is leftout.
The control for period is particularly important in the analysis of cause-specificmortality, not least because of temporal changes in registration of causes. Whendifferent causes of death are considered, only the Poisson regression technique is used.
To assess the changes over time in the educational gradients, interactions betweeneducation and period are included. As part of this discussion, some attention is alsodevoted to education-age interactions.
The analysis is done with the STATA6 statistical package (STATA Corp, 1999).
3. Results
Life expectancies and SDRsLife expectancies between ages 40 and 75 are shown in Table 2. The lowest
average is found in the LRC cohort (27 years, reduced to 26 years if the educationaldistribution for the entire Russian population is used) and the highest in Oslo (29 years).However, the differences are largest in the LRC cohort, where the life expectancyamong men with low education is 5.2 years higher than among those with higheducation. The corresponding differences in Helsinki and Oslo are 3.5 and 3.2 years,respectively.
The life expectancy for the highly educated in the LRC cohort is close to that inthe middle education group, and in the total populations, in the two Nordic capitals.
Twisting the perspective slightly, the differences of about 3 years between theLRC cohort and Oslo and about 2 years between the LRC cohort and Helsinki are notonly a result of high mortality among the lower social strata in Russia. There is a

Demographic Research – Volume 10, Article 1
12 http://www.demographic-research.org
difference of 1.4-2 years also among men with high education. However, thedifferences among the men with low education are as large as 3.0-3.9 years.
Table 2: Life expectancy between exact ages 40 and 75 by level of education inthree male cohorts: LRC (Moscow-St. Petersburg), Helsinki and Oslo.(in years)
Low Middle High Total
LRC 24.3 27.4 29.4 26.8/25.8**(0.6)* (0.4) (0.6) (0.4)
Helsinki 27.3 29.1 30.8 28.3(0.2) (0.2) (0.2) (0.1)
Oslo 28.2 29.8 31.4 29.3(0.2) (0.2) (0.2) (0.1)
Differences from the groups of high educationLRC 5.2 2.1 0.0 2.7/3.2
Helsinki 3.5 1.7 0.0 2.5
Oslo 3.2 1.6 0.0 2.1Differences from OsloLRC 3.9 2.4 2.0 2.5/3.5**
Helsinki 0.9 0.7 0.6 1.0
Oslo 0.0 0.0 0.0 0.0
Notes:* Doubled standard errors are given in brackets** Actual value for the LRC cohort / expected value with the all-Russia educational composition
Similar patterns appear in the SDRs in Table 3. Whereas the absolute difference in SDRbetween men with high and men with low education is much higher in the LRC cohortthan in the two Nordic capitals, the LRC-Nordic difference is less significant in relativescale, because of the much higher overall mortality in the LRC cohort. Men with loweducation in the LRC cohort have an SDR that is 2.2. times higher than that among menwith high education. The corresponding ratios are smaller in Helsinki and Oslo (2.0 and1.9, respectively), but not very markedly.
The relative SDRs are, of course, virtually identical to estimates from Possionregression models where period is left out (not shown). When period is included, theestimates are also very similar (see illustration of all-cause mortality in Figure 1).
Changing once again the perspective, the average LRC mortality is 1.5-1.7 timeshigher than that in Helsinki or Oslo. More precisely, the SDR in the LRC cohort is 2194per 100,000 (2491 per 100,000 with the all-Russia educational composition) vs. 1614per 100,000 in Helsinki and 1405 per 100,000 in Oslo. The ratios in SDR between theLRC cohort and Helsinki and Oslo do not differ much across educational groups, being

Demographic Research – Volume 10, Article 1
http://www.demographic-research.org 13
only slightly higher for the low education group than for the high education group.While it is true that highly educated men in Moscow and St. Petersburg do enjoyunusually low mortality by Russian standards, their position is indeed unfavorablecompared with men at the same level of education in Helsinki and Oslo.
Table 3: Age-standardized* death rates for the range of ages 40 to 74 by level ofeducation in three male cohorts: LRC (Moscow-St. Petersburg), Helsinkiand Oslo. (per 100,000 person-years)
Low Middle High Total
LRC 2969 2019 1346 2194/2491***(192)** (151) (110) (82)
Helsinki 1905 1405 974 1614(36) (44) (44) (24)
Oslo 1731 1270 890 1407(48) (48) (50) (28)
Ratios to the SDRs of the high education groupLRC 2.2 1.5 1.0 1.6/1.7
Helsinki 2.0 1.4 1.0 1.7
Oslo 1.9 1.4 1.0 1.6Ratios to the SDRs of OsloLRC 1.7 1.6 1.5 1.4/1.6
Helsinki 1.1 1.1 1.1 1.1
Oslo 1.0 1.0 1.0 1.0
Notes:* European population standard of the WHO is used** Doubled standard errors are given in brackets*** Actual value for the LRC cohort / expected value with the all-Russia educational composition
Indices of dissimilarity and inequalityWhereas one figure for men with low education and one for those with middle
education are shown for each country in Tables 2 and 3, one single index ofdissimilarity (absolute or relative) is shown in table 4. Indices of inequality are given asalternative measures.
As expected, the absolute index of dissimilarity (ID) is much higher in the LRCcohort than in the populations of Helsinki or Oslo. Relative ID is also high for the LRCcohort, but it diminishes from 29% to 23% if the all-Russia educational distribution isused. The latter figure is still little higher than 21% observed in Helsinki and Oslo.
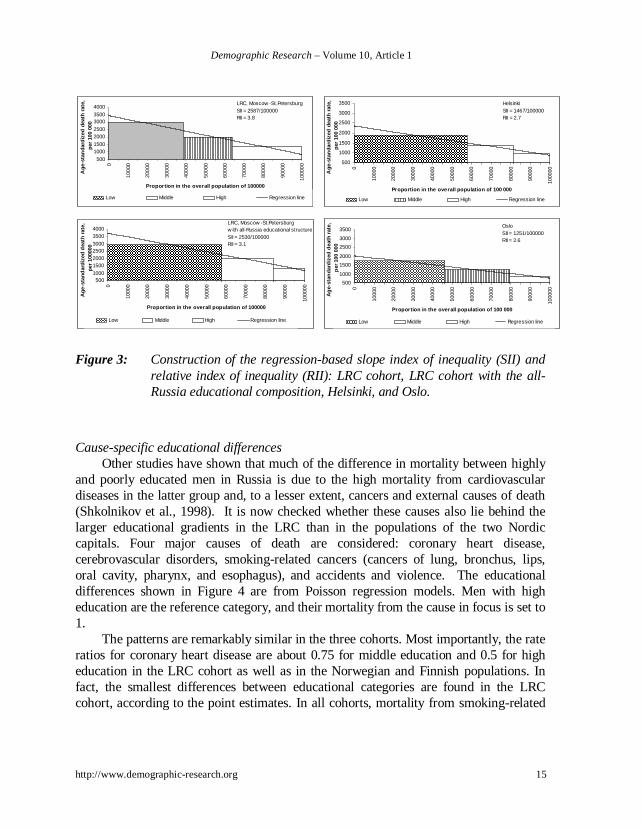
The construction of the regression-based relative index of inequality (RII) andslope index of inequality (SII) is illustrated in Figure 3 (for the LRC cohort, the LRCcohort with the all-Russia educational composition, and the populations of Helsinki and

Demographic Research – Volume 10, Article 1
14 http://www.demographic-research.org
Oslo.) There are three bars in each panel. The width of each bar corresponds to thepopulation-weight of the respective educational group and its height corresponds to theSDR. A regression line connects the “worst” (left end of the regression line) and the“best” (right-end) individuals. RII is the ratio of the “worst” to the “best” mortalityrates, and SII is the absolute difference between them.
Once again, the absolute inequality, as expressed by SII, is much greater in theLRC cohort than those in the populations of Helsinki or Oslo (about 2500 per 100,000vs. 1200-1500 per 100,000). Similarly, the relative inequality, as expressed by RII, ishighest in the LRC cohort (3.8, reduced to 3.1 if the educational distribution for Russiais used, compared with 2.6-2.7 in Helsinki and Oslo).
Table 4: Indices of inequalities based on SDRs of educational groups and theirpopulation weights.
Index of dissimilarity(ID)
Regression-based indices
Relative (%) Absolute(per 100000)
Relative index ofinequality (RII)
(times)
Slope index ofinequality (SII)
(%)
LRC 29.6 636 3.8 2587LRC with the all-Russia educational composition 23.2 583 3.1 2530Helsinki 20.8 336 2.7 1467Oslo 21.3 300 2.6 1251
Demographic Research – Volume 10, Article 1
http://www.demographic-research.org 15
500
10001500
20002500
30003500
40000
100
00
200
00
300
00
400
00
500
00
600
00
700
00
800
00
900
00
1000
00
Proportion in the overall population of 100000
Ag
e-st
and
ard
ized
dea
th r
ate,
p
er 1
00 0
00
Low Middle High Regression line
LRC, Moscow -St.PetersburgSII = 2587/100000RII = 3.8
500
1000
1500
2000
2500
3000
3500
0
1000
0
2000
0
3000
0
4000
0
5000
0
6000
0
7000
0
8000
0
9000
0
1000
00
Proportion in the overall population of 100 000
Ag
e-st
and
ard
ized
dea
th r
ate,
per
100
000
Low Middle High Regression line
OsloSII = 1251/100000RII = 2.6
500
1000
1500
2000
2500
3000
3500
0
1000
0
2000
0
3000
0
4000
0
5000
0
6000
0
7000
0
8000
0
9000
0
1000
00
Proportion in the overall population of 100 000
Ag
e-st
and
ard
ized
dea
th r
ate,
per
100
000
Low Middle High Regression line
HelsinkiSII = 1467/100000RII = 2.7
5001000
1500200025003000
35004000
0
1000
0
2000
0
3000
0
4000
0
5000
0
6000
0
7000
0
8000
0
9000
0
1000
00Proportion in the overall population of 100000
Ag
e-s
tan
dar
diz
ed d
eath
rat
e, p
er 1
0000
0
Low Middle High Regression line
LRC, Moscow -St.Petersburgw ith all-Russia educational structureSII = 2530/100000RII = 3.1
Figure 3: Construction of the regression-based slope index of inequality (SII) andrelative index of inequality (RII): LRC cohort, LRC cohort with the all-Russia educational composition, Helsinki, and Oslo.
Cause-specific educational differencesOther studies have shown that much of the difference in mortality between highly
and poorly educated men in Russia is due to the high mortality from cardiovasculardiseases in the latter group and, to a lesser extent, cancers and external causes of death(Shkolnikov et al., 1998). It is now checked whether these causes also lie behind thelarger educational gradients in the LRC than in the populations of the two Nordiccapitals. Four major causes of death are considered: coronary heart disease,cerebrovascular disorders, smoking-related cancers (cancers of lung, bronchus, lips,oral cavity, pharynx, and esophagus), and accidents and violence. The educationaldifferences shown in Figure 4 are from Poisson regression models. Men with higheducation are the reference category, and their mortality from the cause in focus is set to1.
The patterns are remarkably similar in the three cohorts. Most importantly, the rateratios for coronary heart disease are about 0.75 for middle education and 0.5 for higheducation in the LRC cohort as well as in the Norwegian and Finnish populations. Infact, the smallest differences between educational categories are found in the LRCcohort, according to the point estimates. In all cohorts, mortality from smoking-related

Demographic Research – Volume 10, Article 1
16 http://www.demographic-research.org
cancers is very much lower among men with high education than among those with loweducation (ratios of 0.25-0.30).
The slightly sharper educational gradient that appears for all-cause mortality in theLRC cohort than in the other cohorts in Figure 4 (in accordance with the higher SDRratio in Table 3), is otherwise only seen for cerebrovascular diseases (significant onlywhen comparing LRC and Helsinki) and, more sharply, for accidents and violence.Interestingly, in the LRC cohort, men with middle education experience mortality fromexternal causes very close to that among men with low education. In Helsinki and Oslo,however, the major divide is between those with low and those with middle education.In these cities, accident and violence mortality in the latter group is much lower thanthat in the former group (rate ratios are 0.6-0.7 vs. 0.9 in Russia).
Figure 4: Effects of education on mortality from major causes of death in the LRCcohort, Helsinki and Oslo male cohorts: Poisson regression rate ratios.
0.00
0.25
0.50
0.75
1.00
All caus es CHD Cerebrovascular Cancers /s m oking Accidents /Vio lence
Ra
te r
atio
Low Middle High
LRC
0.00
0.25
0.50
0.75
1.00
All caus es CHD Cerebrovascular Cancers /s m oking Accidents /Vio lence
Ra
te r
atio
Low Middle High
Helsinki
0.00
0.25
0.50
0.75
1.00
All caus es CHD Cerebrovascular Cancers /s m oking Accidents /Vio lence
Ra
te r
atio
Low Middle High
Oslo

Demographic Research – Volume 10, Article 1
http://www.demographic-research.org 17
Interactions of education effects with age and calendar period in Poisson regressionmodels for all-cause mortality
According to likelihood ratio tests, the first-order interactions involving education(education*age and education*time) do not improve the model fit significantly for theLRC cohort. However, in terms of point estimates there is a quite clear pattern in theinteraction effects that nevertheless deserves some attention. In addition, the interactioneffects are significant for Helsinki and Oslo.
The educational differentials tend to decrease with age. In the LRC cohort, as wellas for Helsinki and Oslo, the mortality rate ratio for the group with high educationincreases from about 0.3-0.4 at age 40-49 to about 0.5-0.6 at age 70-74. This pattern fitswell with the general pattern of relative inequality in mortality with maximum aroundage 35-45 and further decline with age. This pattern has been reported since very earlystudies of social differentials in mortality long time ago (Antonovsky, 1967).
The interactions between education and period are shown in Figure 5. In the LRCcohort (upper left panel), the mortality rate ratios increase from 1978-82 (taken asbaseline = 1) to 1993-97 for low and middle levels of education, and do not increase forhigh education. These (insignificant) trends are consistent with previous population-level studies (that were possibly hampered by numerator-denominator bias) showingthat the mortality increase has been most pronounced for the lower social classes(Shkolnikov et al., 1998, Shkolnikov, Andreev and Maleva, 2000). This is, of course,the same as claiming that the educational differentials have widened.
Recently, a similar result was obtained in another individual-level study bycomparison of mortality in the St. Petersburg part of the LRC cohort traced from 1975with another cohort traced from 1986 (Plavinski, Plavinskaya, Klimov, 2003).
In contrast to this, mortality is significantly declining from 1976-80 to 1991-95 inall educational groups in the Helsinki population, although most steeply among menwith high education. This is also consistent with the results of earlier studies for thewhole country (Valkonen et al., 1993). In Oslo, mortality has changed little among menwith low and middle education and declined for those with high education. Thus, theeducational differences have increased in both Nordic capitals.
As explained above, the diagonal structure of the data means that estimates forlater years are more influenced by mortality at older ages than those for earlier years.Fortunately, this does not undermine the conclusion about increasing educationaldifferences over time, as education effects were found above to diminish withincreasing age.

Demographic Research – Volume 10, Article 1
18 http://www.demographic-research.org
Figure 5: Effects of calendar period by level of education in the LRC, Helsinki andOslo cohorts: Poisson regression rate ratios.
4. Discussion
The present study provides the most accurate Russia-West comparison of mortality byeducational level published so far. On the Russian side, the estimates are based oninformation about educational attainment of members of an epidemiological cohort in1975 and data on their mortality during the following 22 years. This is a better designthan in most previous studies, which have been based on independent data sources oneducation of deceased and education of population at risk (Shkolnikov et al., 1998).Similar data covering the same periods and years were established for the entire malepopulations of Helsinki and Oslo, using population registers linked with censuses. Theeducational categories were defined very similarly in the three data sets, to make the
0.50
0.75
1.00
1.25
1.50
1.75
Total Low Middle High
Education
Rat
e r
atio
1978-82 1983-87 1988-92 1993-97
LRC
0.50
0.75
1.00
1.25
1.50
1.75
Total Low Middle High
Education
Rat
e r
atio
1976-80 1981-85 1986-90 1991-95
Helsinki
0.50
0.75
1.00
1.25
1.50
1.75
Total Low Middle High
Education
Rat
e r
atio
1975-79 1980-84 1985-91
Oslo

Demographic Research – Volume 10, Article 1
http://www.demographic-research.org 19
effects as comparable as possible (Note 4). The fact that the educational level in 1975 isused in the LRC cohort and the Helsinki population, whereas the data from Osloinclude education in 1970 or 1980, should be of no concern. The educational careers ofthe subjects had been largely completed by 1970 (when they were 39-54 years) anyway.
Lack of representativity is a potential problem. The LRC cohort has a distributionover age, education and socio-occupational categories that is very similar to that in theentire populations of Moscow and St. Petersburg in 1975. However, the sample wasdrawn randomly from populations of only one typical district in each city and couldmiss certain peculiarities in mortality, characteristic of other districts. Moreover, theLRC cohort (as any other epidemiological cohort) could hardly include homelesspeople and other "marginal" groups (Note 5).
Nevertheless, the mortality pattern in the LRC cohort was found to be very close tothat in the total male populations of Moscow and St. Petersburg. Moreover, themortality differences between the LRC cohort, Moscow and St. Petersburg, and Russiaare very small compared to the large mortality gap between Russia and the Nordiccountries. In addition, in calculations of mortality and inequality measures we madeadjustments for compositional effects connected with the educational advantage ofMoscow and St. Petersburg compared to the whole of Russia.
The data sets from Helsinki and Oslo cover the whole male population and are lessproblematic in this respect. The implication of this is probably that the mortality in thelow-education group could be somewhat underestimated in the LRC cohort, and moreso than in the Norwegian and Finnish populations.
Another potential problem is connected with comparability of educationalcategories across countries. In spite of similar numbers of years of schooling, relativedistances between groups of high, middle, and low education in terms of amounts of,for example, knowledge and job opportunities may not be the same in differentcountries. Our use of regression-based indices of inequality mitigates this problem sincethese measures are relatively insensitive to categorization as long as the order of groupsis correct.
It may well be that the three educational categories used here do not fit well withthe education-mortality function in one or more countries, i.e. that we impose threesteps when there really are, say, five shorter ones. The number and length of the realsteps may differ across countries for a number of reasons, for example different formalrequirements for high-status jobs. However, by using various indices of educationalinequality, we have obtained an impression of the overall effect of education in thedifferent countries (e.g. the impact of an additional year of education) that is quiteinsensitive to the categorization, and in that sense comparable across countries. Aremaining problem that hampers all such inter-country comparative research is, ofcourse, that such overall effects of education may have widely different explanations.

Demographic Research – Volume 10, Article 1
20 http://www.demographic-research.org
Generally, schooling has consequences for people’s income, exposure to occupationalhazards, social networks and many other factors, and these consequences are likely todiffer across countries. Similarly, their impact on mortality may differ substantially.Besides, there may be inter-country variations in the extent to which educational careersreflect resources and attitudes in the family of origin and childhood factors. In thisstudy, we make no attempt to identify any causal channels, but merely describe theeducational mortality differences.
Finally, the small size of the LRC cohort (about 8000 men) is an importantlimitation leading to wide confidence intervals. Moreover, the youngest subjects in allthree cohorts were aged 40 in 1975. This means that we entirely miss mortalityexperience at younger working ages, where relative social differentials in mortality areespecially large.
The main conclusion is that educational gradients in mortality are sharper in theLRC cohort than in the populations of Helsinki and Oslo. This appears particularlyclearly when absolute differences in life expectancy are considered, but there is asimilar pattern in age-standardized mortality rate ratios and various indices of relativeinequality. However, the difference in average mortality between the populations is notdue only to the large difference in the lower social classes. Also the better educated inthe LRC cohort have a much higher mortality than their counterparts in Helsinki andOslo.
The sharper educational differentials in the LRC cohort stem from a particularlyhigh mortality from cerebrovascular disorders among the men with low education, aswell as a high rate of external mortality. The educational gradients are particularly sharpfor the latter. In contrast to this, the differentials in the mortality from coronary heartdiseases and smoke-related cancers are no more pronounced than in Helsinki and Oslo.This may reflect that, in spite of differences in societal contexts, there is a similarity inconcrete risk factors underlying educational gradients in mortality, such as smoking,alcoholism, poor quality of nutrition, lack of attention to own health, and inequalities inaccess to advanced medical care. These risk factors are related not only to theincidence of diseases but also to survival after getting ill. For example, there are largeeducational differences in cancer survival even in Norway, with a supposedlyegalitarian health care system, and one cannot rule out the possibility that this is partlydue to differentials in access to, or ability to make use of, medical treatment (Kravdal,2000).
During the period of observation, mortality in Moscow and St. Petersburg wassomewhat lower than the all-Russia average, while mortality in Helsinki and Oslo washigher than the national levels. This means that even larger overall differences wouldhave been found between the three countries. Unfortunately, one cannot possibly know

Demographic Research – Volume 10, Article 1
http://www.demographic-research.org 21
how the educational differentials would be at a national level compared to thoseestimated in this study.
The sharper educational gradients in Russia may perhaps be considered striking,given the strong political rhetoric about egalitarianism during most of the follow-upperiod. More specifically, there has been a much weaker link between education andincome in Russia than in western countries. However, education effects surely signalmuch more than differences in purchasing power (Ross and Mirowski, 1999). In Russia,it may well be that, for example, knowledge, behaviors, and social networks contributemore than factors more directly linked with purchasing power to the overall mortalitygap between high and low educational groups.
The estimates from the LRC cohort indicate an increasing mortality among thosewith low and middle education, especially after about 1990, as opposed to absence of anincrease or even a decline in the high-education group, and thus widening differentials.A similar result has been reported also in previous population-level studies, but it isimportant to see the pattern confirmed, because these earlier studies were based onindependent data sources on education of deceased and education of population at risk.
Educational differentials seem to have increased also in the two Nordic capitals,but less markedly. At least, all groups have experienced stable or decreasing mortality.
The widening mortality differentials in Russia, indicated now also by the LRCresults, may to a large extent be a result of abrupt and ill-governed economictransformations that have created escalating income inequalities (UNDP, 1999). Thisworrying tendency should find an adequate response in public health policies. On thescientific side, trends in inequalities in health in the Russian population require carefulmonitoring and further analyses.
5. Acknowledgements
The study was supported by the Max Planck Institute for Demographic Research(Rostock, Germany).
Collection of the LRC data for the period of 1994-97 was supported by theRockefeller Foundation within the framework of the Global Health Equity Initiative.
The study was supported by funding from the Academy of Finland (project51640). We thank Statistics Finland for permission (TK 53-1783-96) to use the data forFinland.
The Norwegian data have been constructed by Statistics Norway for use in a broadsocio-demographic cancer research project carried out in the Cancer Registry ofNorway.

Demographic Research – Volume 10, Article 1
22 http://www.demographic-research.org
We are grateful to Evgeniy Andreev (Centre of Demography and Human Ecology,Moscow) for providing data for Figure 2.

Demographic Research – Volume 10, Article 1
http://www.demographic-research.org 23
Notes
1. There are a few studies employing proportional analysis of mortality by cause ofdeath for an indirect estimation of social differentials in mortality without data onpopulation at risk (Chenet et al., 1998).
2. Temporary life expectancy within the range of ages 40 to 74 is defined in terms ofstandard life table functions as
4075404035 /)( lTTe −= .
3. Doubled standard error is given in brackets.
4. For a detailed comparison of the Russian and the Finnish educational systems seealso Palosuo et al., 1995.
5. In the 1970s, these sub-populations were probably small in Moscow and St.Petersburg. They may be larger in the 1990s, in parallel with the generallyincreasing social inequalities.

Demographic Research – Volume 10, Article 1
24 http://www.demographic-research.org
References
Andreev, E., Darsky, E. and Kharkova, T. (1992). L'histoire de la population del'URSS. 1920-1959. Serie: Annales de demographie historique. Paris, 65-150.
Antonovsky, A. (1967). Social class, life expectancy and overall mortality. MilbankMemorial Fund Quarterly 43, 31-73.
Avdeev, A., Blum, A., Zakharov, S., Andreev, E. (1998). The reactions of aheterogeneous population to pertubation. An interpretative model of mortalitytrends in Russia. Population: An English Selection, 10(2), 267- 302
Carlson, E. (1989). Concentration of rising Hungarian mortality among manualworkers. Sociology and Social Research, 73(3), 119-128
Carlson, E. and Tsvetarsky, S. (1992). Concentration of rising Bulgarian mortalityamong manual workers. Sociology and Social Research, 76(2), 81-84
Chenet, L., Leon, D., Mckee, M., Vassin, S. (1998). Deaths from alcohol and violencein Moscow: socio-economic determinants. European Journal of Population, 14,19-37
Dennis, B.H., Zhukovsky, G.S., Shestov, D.B., Davis, C.E., et al. (1993) Theassociation of education with coronary heart disease mortality in the USSR LipidResearch Clinics Study. International Journal of Epidemiology, 22, 420-427.
Interstate Statisrtical Committee of CIS. (1996). Results of the 1989 All-UnionPopulation Census. CD-ROM.
Kahn, H.A., Sempos, C.T. (1989). Statistical methods in epidemiology. OxfordUniversity Press, New York-Oxford
Koskinen, S. and Martelin T. (1998). Viina tappaa keski-ikäisiä päääkaupunkiseudulla(Alcohol kills middle-aged people in the Helsinki region). Kuntapuntari, 2, 66-71
Kravdal, Ø. (2000). Social inequalities in cancer survival. Population Studies 54, 1-18.
Kunst, A.E. and Mackenbach, J.P. (1994). Measuring socio-economic inequalities inhealth. WHO Regional Office for Europe, Copenhagen
Mackenbach J.P. and Kunst A. (1997). Measuring the magnitude of socio-economicinequalities in health: an overview of available measures illustrated with twoexamples from Europe. Social Science and Medicine, 44(6), 757-771

Demographic Research – Volume 10, Article 1
http://www.demographic-research.org 25
Palosuo, H., Zhuravleva, I., Uutela, A., Lakomova, N., Shilova, L. (1995). PerceivedHealth, Health-Related Habits and Attitudes in Helsinki and Moscow: aComparative Study of Adult Populations in 1991. Publication of the NationalHealth Institute: A10, Helsinki
Plavinski, S.L., Plavinskaya, S.I., Klimov, A.N. (2003). Social factors and increase inmortality in Russia in the 1990s: prospective cohort study. British MedicalJournal, 326, 1240-1242.
Rose, R. (2000). How much does social capital add to individual health? A survey studyof Russians. Social Science and Medicine, 51, 1421-1435.
Ross, C.E. and J. Mirowski. (1999). Refining the association between education andhealth: The effects of quantity, credential, and selectivity. Demography, 36, 445-460.
Shestov, D.B., Deev, A.D., Klimov, A.N., Davis, C.E., et al. (1993). Increased risk ofcoronary heart disease death in men with low total and low-density lipoproteincholesterol in the Russian Lipid Research Clinics prevalence follow-up study.Circulation, 88, 846-853.
Shkolnikov, V., Meslé F. and Vallin, J. (1996). Health crisis in Russia. Population: AnEnglish Selection, 8, 123-190
Shkolnikov, V.M., Andreev, E.M., Maleva, T. ed. (2000). Neravenstvo i smertnost vRossii. [Inequality and Mortality in Russia] “Signal”, Moscow.
Shkolnikov V.M., McKee M., Leon D.A. (2001). Changes in life expectancy in Russiain the mid-1990s. Lancet, Vol. 357, March, pp. 917-921.
Shkolnikov, V.M., Leon, D.A., Adamets; S., Andreev, E., Deev, A. (1998). Educationallevel and adult mortality in Russia: an analysis of routine data 1979 to 1994.Social Science Medicine, 47(3), 357-369
STATA Corp. (1999). Stata Statistical Software: Release 6.0. College Station, Texas:Stata Corporation.
Statistics Norway (2002). Mortality statistics at http://www.ssb.no/english/subjects/02/02/10/dode_en/tab-2002-06-27-11-en.html last visited in August 2002.
UNDP 1999. Human Development Report (1999). Russian Federation. UNDP,Moscow.
Demographic Research – Volume 10, Article 1
26 http://www.demographic-research.org
US-USSR Steering Committee for Problem Area 1. (1977). The pathogenesis ofatherosclerosis: collaborative US-USSR study on the prevalence ofdyslipoproteinemia and ischeamic heart disease in American and Sovietpopulations. American Journal of Cardiology, 40, 260-268.
Valkonen, T. (1993). Problems in the measurements and international comparisons ofsocio-economic differences in mortality. Social Science and Medicine, 36(4),409-418
Valkonen, T., Martelin, T., Rimpelä, A., Notkola, V. and Savela, S. (1993) Socio-economic mortality differences in Finland 1981-1990. Statistics Finland,Population 1993:1
Vallin J. (1979). Socioeconomic determinants of mortality in industrialised countries.Readings in Population Research Methodology, 2, 957-971
WHO (2002). WHO Mortality Database at http://www.who.int/whosis/mort/download.htm last visited in June 2002