demographic workshop presentation - epidemic models for
TRANSCRIPT

Epidemic models for analysis of policy measures to protect COVID-19 at-risk populations in Los Angeles County
uscbiostats.github.io/COVID19
Abigail HornResearch Associate, Divisions of Biostatistics and Health Behavior
Work with
Dave ContiProfessor of Biostatistics
Department of Preventive MedicineUniversity of Southern California

Overview
We develop epidemic models for analysis of policy measures to protect COVID-19 at-risk populations in Los Angeles County
Motivating research questions:
• How did the epidemic affect different at-risk populations? • How effective were policies at preventing severe illness in at-
risk populations?
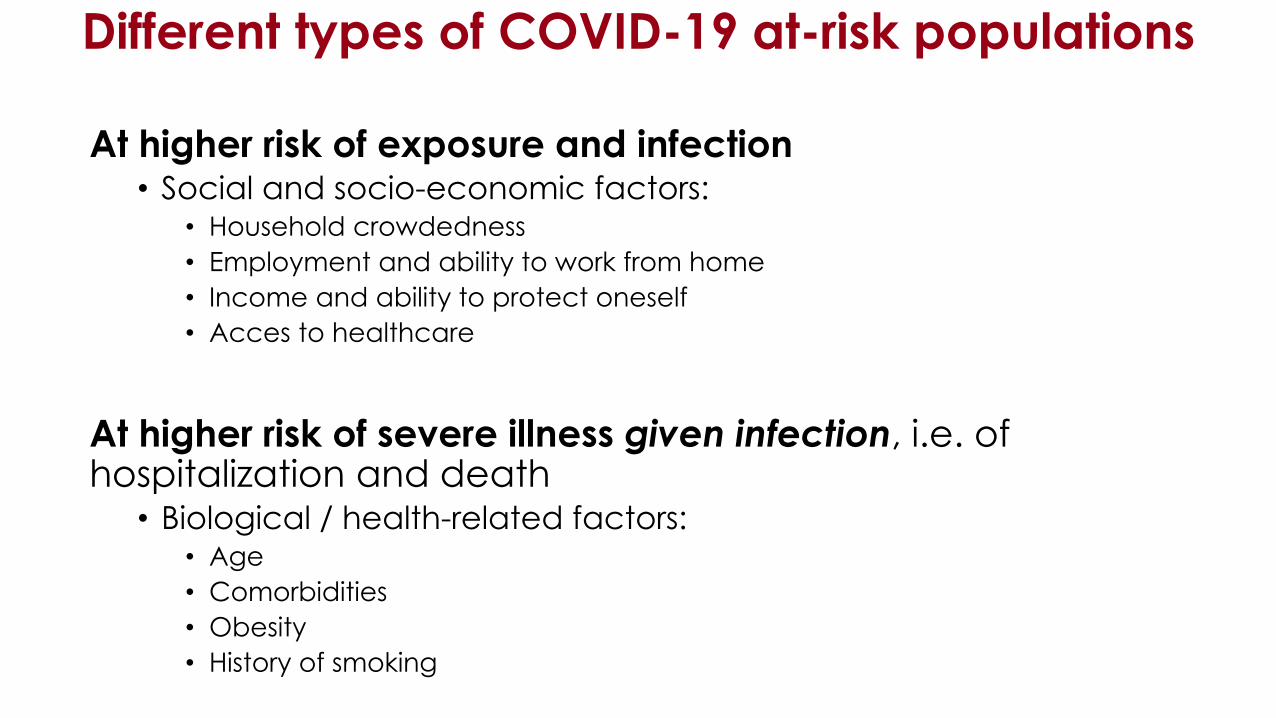
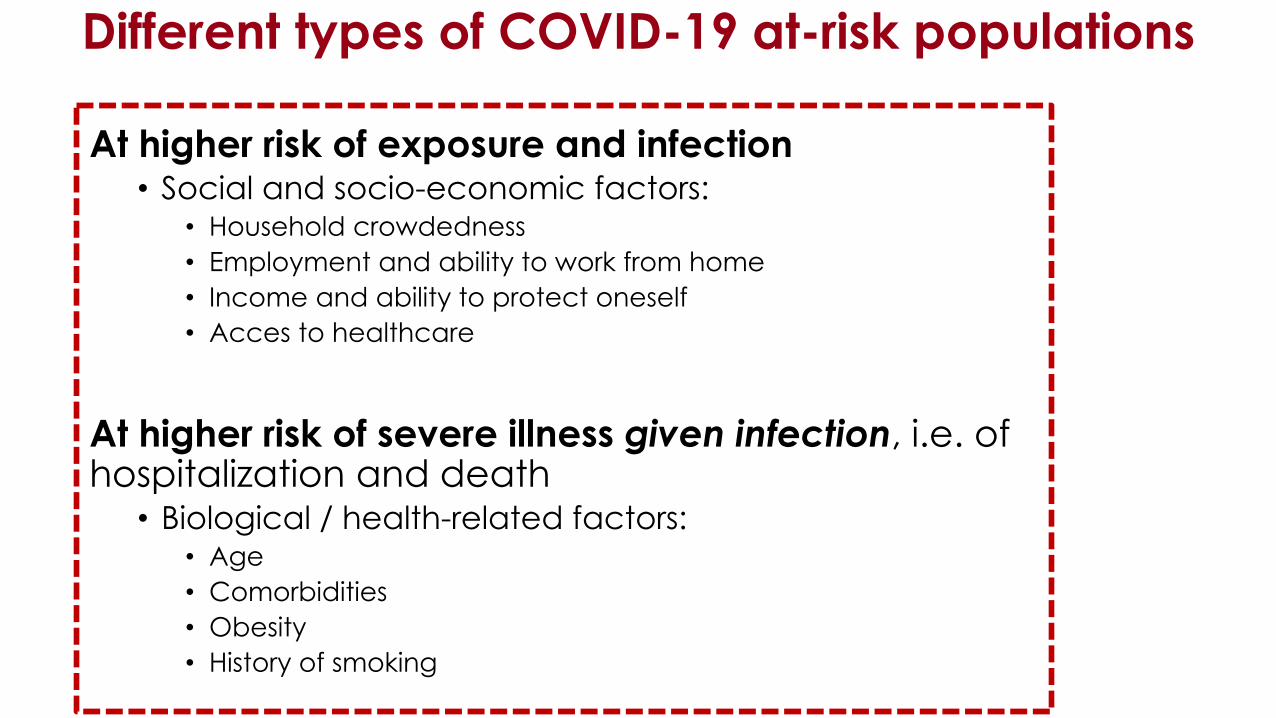
Different types of COVID-19 at-risk populations
At higher risk of exposure and infection• Social and socio-economic factors:
• Household crowdedness• Employment and ability to work from home• Income and ability to protect oneself• Acces to healthcare
At higher risk of severe illness given infection, i.e. of hospitalization and death
• Biological / health-related factors:• Age• Comorbidities• Obesity• History of smoking
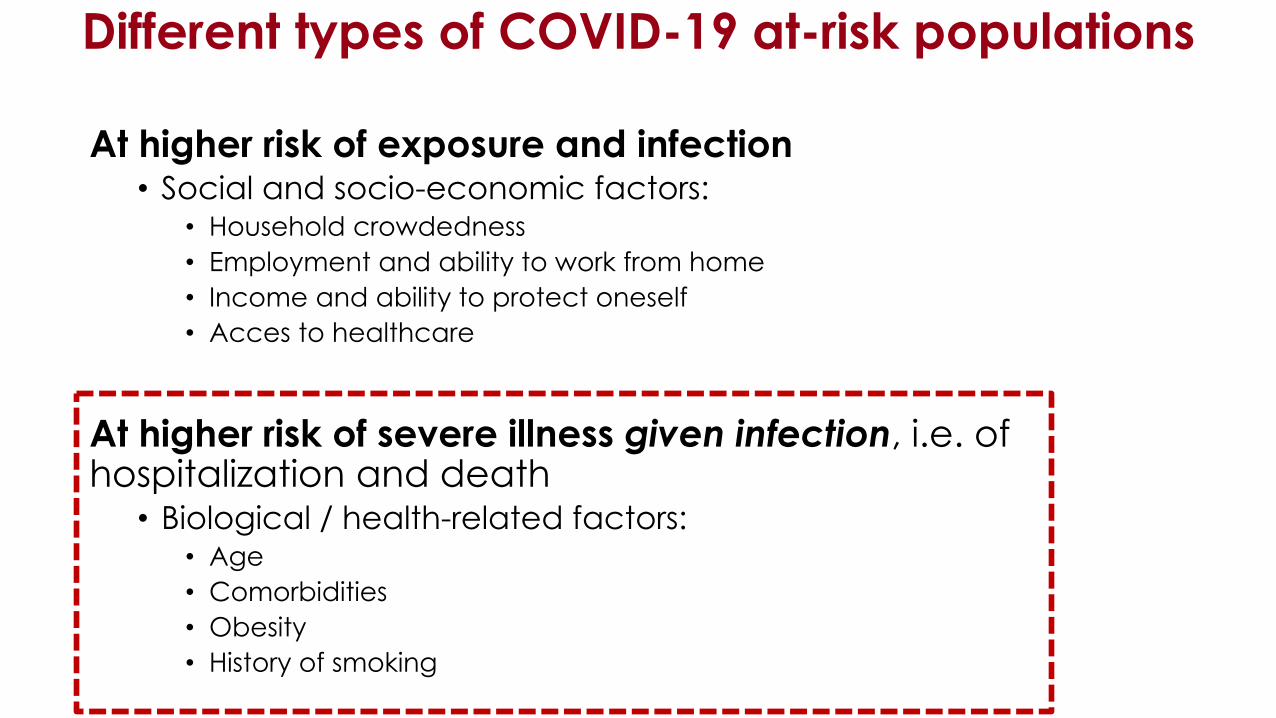

Epidemic model + risk model for policy analysis
To analyze policies related to protecting populations at-risk of severe infection, we need two modeling pieces:
1. Epidemic model that estimates dyanmics of infections, hospitalizations, and deaths
2. Risk model for estimating the probabilities of severe illness in different at-risk populations
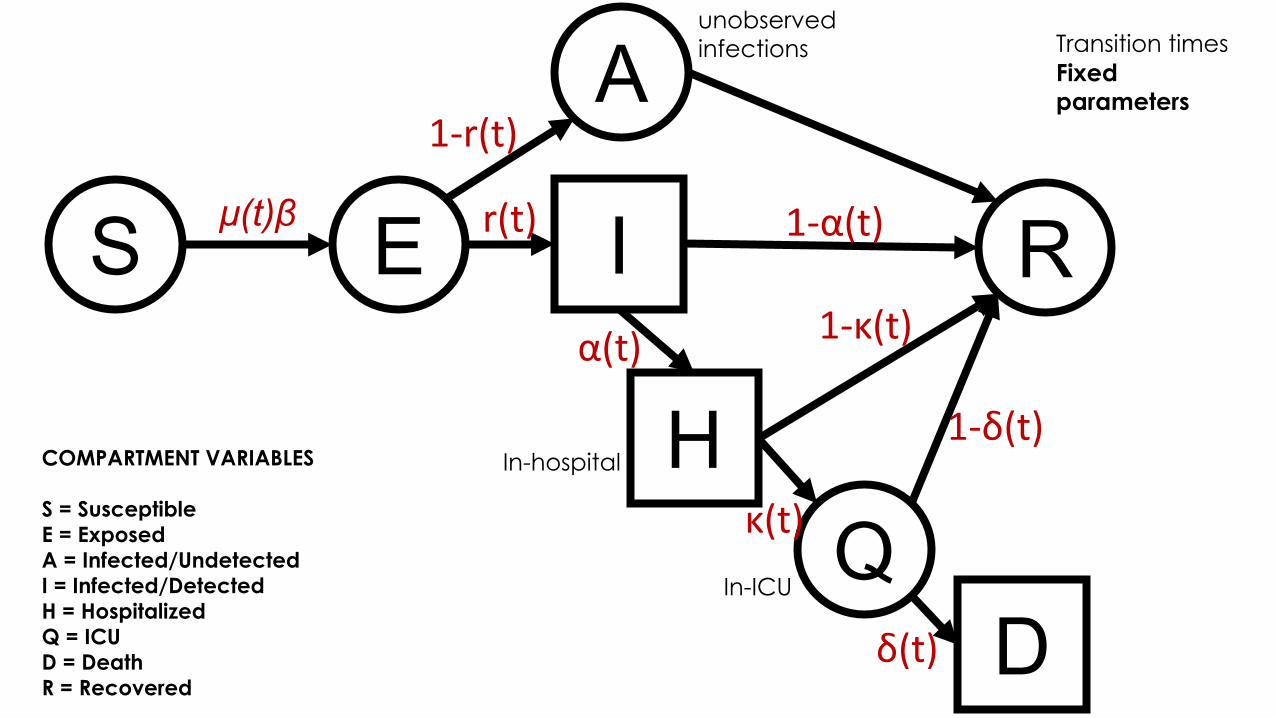
S E
A
Q
R
COMPARTMENT VARIABLES
S = SusceptibleE = ExposedA = Infected/UndetectedI = Infected/DetectedH = HospitalizedQ = ICUD = DeathR = Recovered
I
H
D
μ(t)β
α(t)
1-α(t)
δ(t)
1-δ(t)
1-r(t)
r(t)
Transition timesFixed parameters
κ(t)
1-κ(t)
unobserved infections
In-ICU
In-hospital
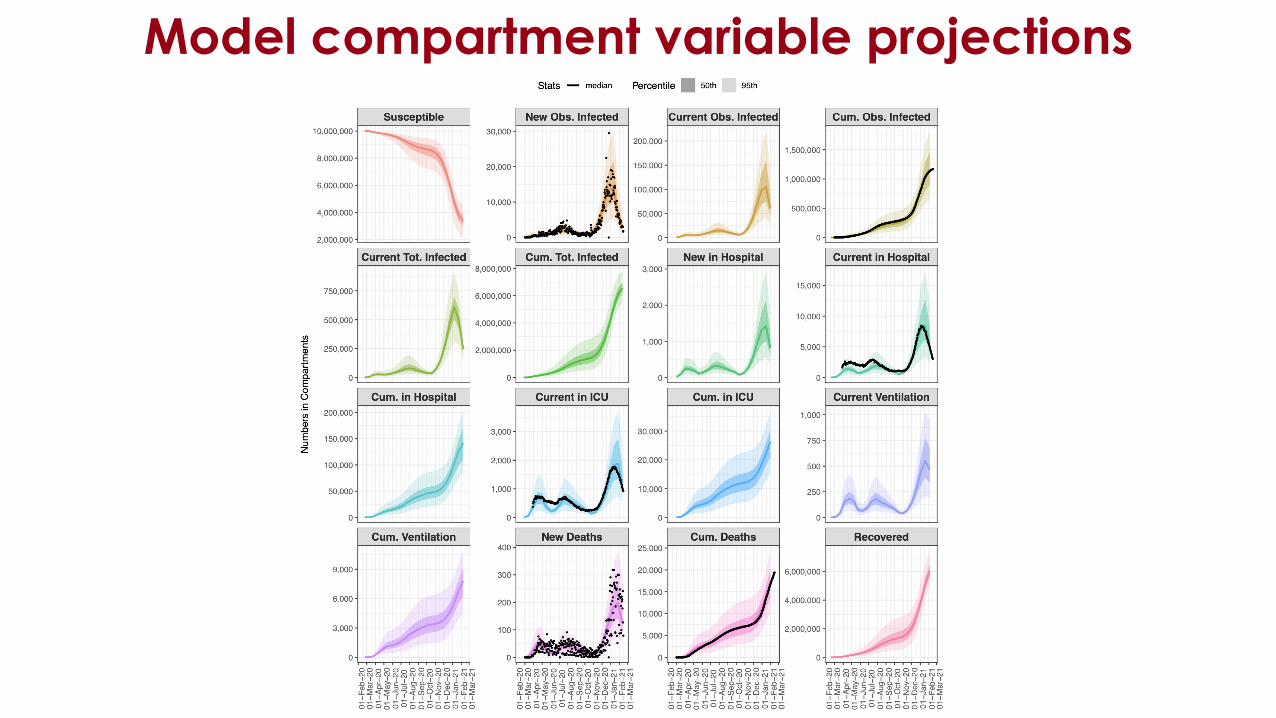
Model compartment variable projections
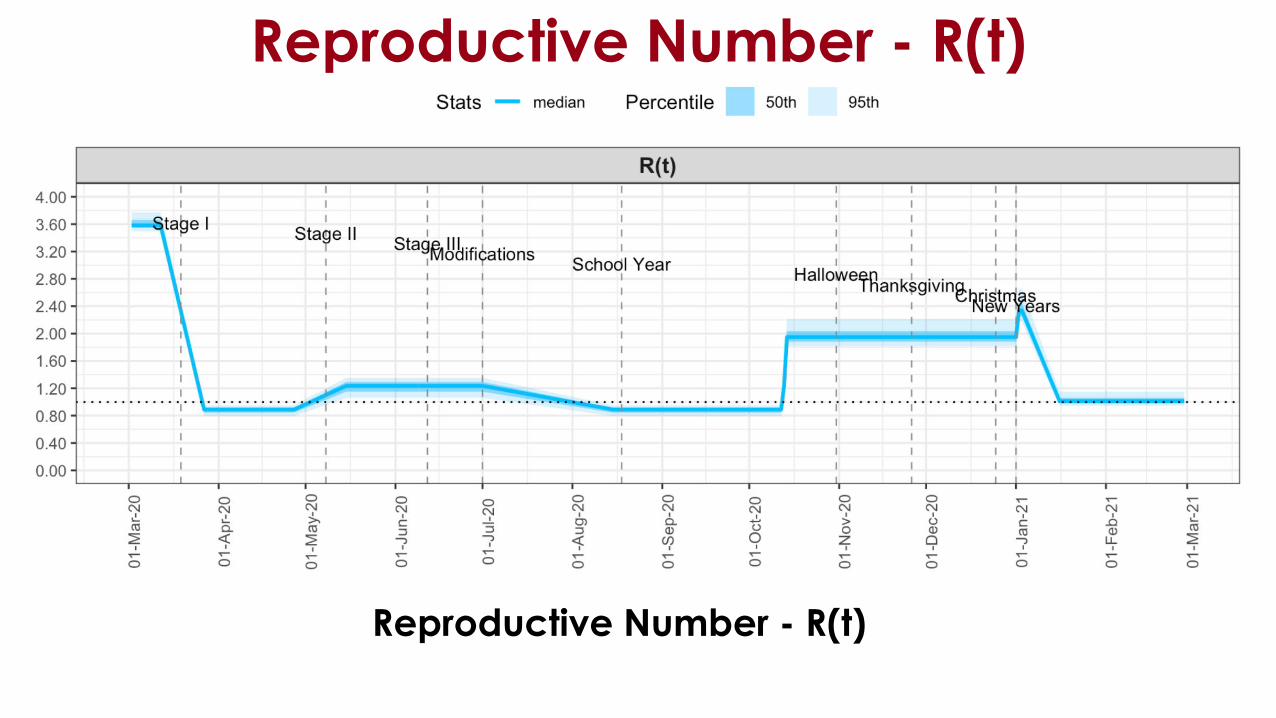
Reproductive Number - R(t)
Reproductive Number - R(t)

Time-varying infection fatality rate (IFR)
Influenza CFR=0.001; IFR=0.0005
𝑰𝑰𝑰𝑰𝑰𝑰 =𝒅𝒅𝒅𝒅𝒅𝒅𝒅𝒅𝒅𝒅𝒅𝒅
𝒐𝒐𝒐𝒐𝒅𝒅𝒅𝒅𝒐𝒐𝒐𝒐𝒅𝒅𝒅𝒅 + 𝒖𝒖𝒖𝒖𝒐𝒐𝒐𝒐𝒅𝒅𝒅𝒅𝒐𝒐𝒐𝒐𝒅𝒅𝒅𝒅 𝒊𝒊𝒖𝒖𝒊𝒊𝒅𝒅𝒊𝒊𝒅𝒅𝒊𝒊𝒐𝒐𝒖𝒖𝒅𝒅

Epidemic model + risk model for policy analysis
To analyze policies related to protecting populations at-risk of severe infection, we need two modeling pieces:
1. Epidemic model that estimates dyanmics of infections, hospitalizations, and deaths
2. Risk model for estimating the probabilities of severe illness in different at-risk populations

Biological Risk Factors• Age was categorized into five groups:
• 0-19, 20-44, 45-64, and 65-79, and 80+.• Comorbidities: diabetes, hypertension, chronic obstructive
pulmonary disease (COPD), hepatitis B, coronary heart disease, stroke, cancer and chronic kidney disease.
• Smoking: Current smoking vs. none.• Obesity was categorized as three groups:
• BMI< 30 𝑘𝑘𝑘𝑘𝑚𝑚2 ; 30 ≤ BMI ≤ 40 𝑘𝑘𝑘𝑘
𝑚𝑚2 ; BMI> 40 𝑘𝑘𝑘𝑘/𝑚𝑚2

Categorizing the LA population into risk profiles
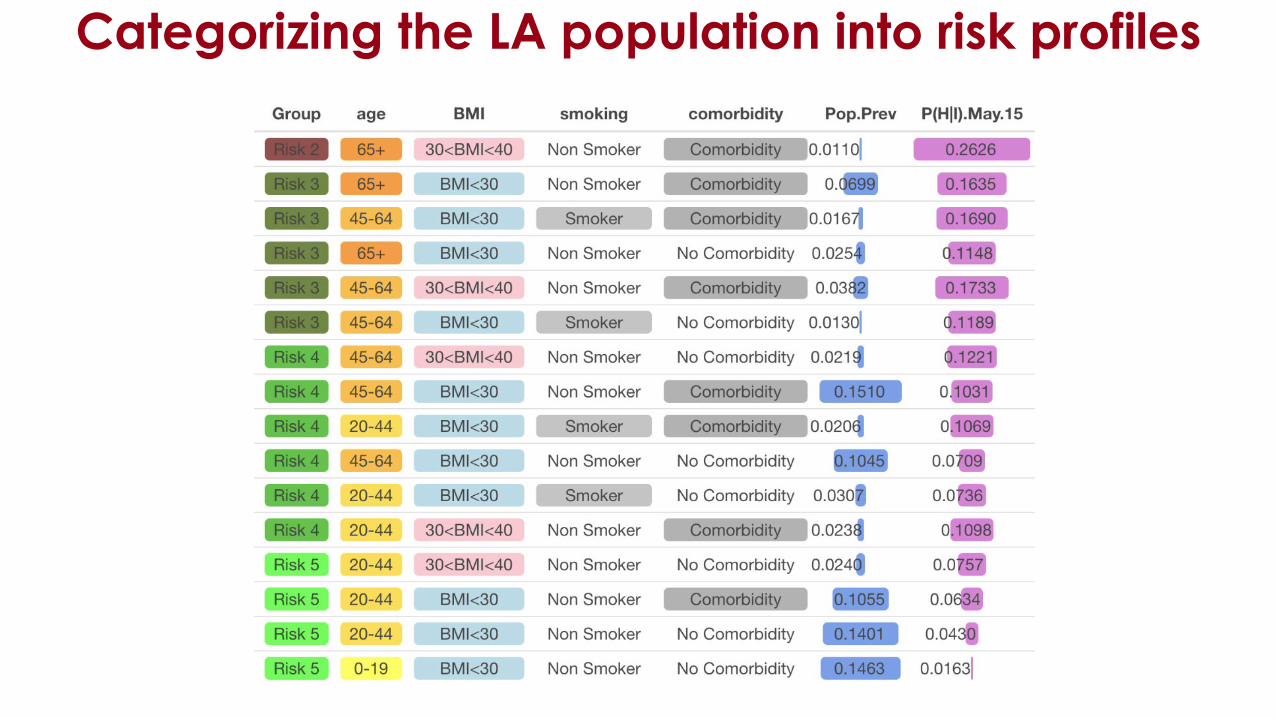
Categorizing the LA population into risk profiles

Influenza CFR=0.001; IFR=0.0005
IFR varies widely across risk profiles within age groups
Horn et al. 2021, PLOS ONE, to appear.
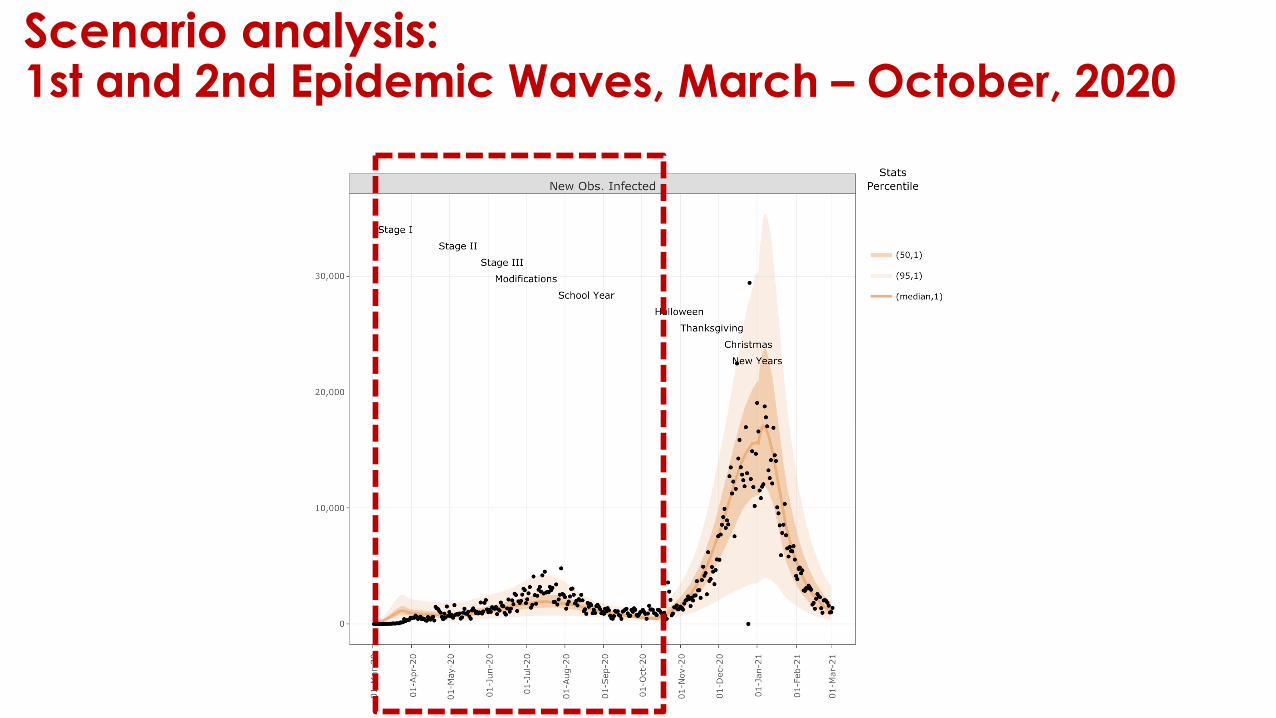
Scenario analysis:1st and 2nd Epidemic Waves, March – October, 2020
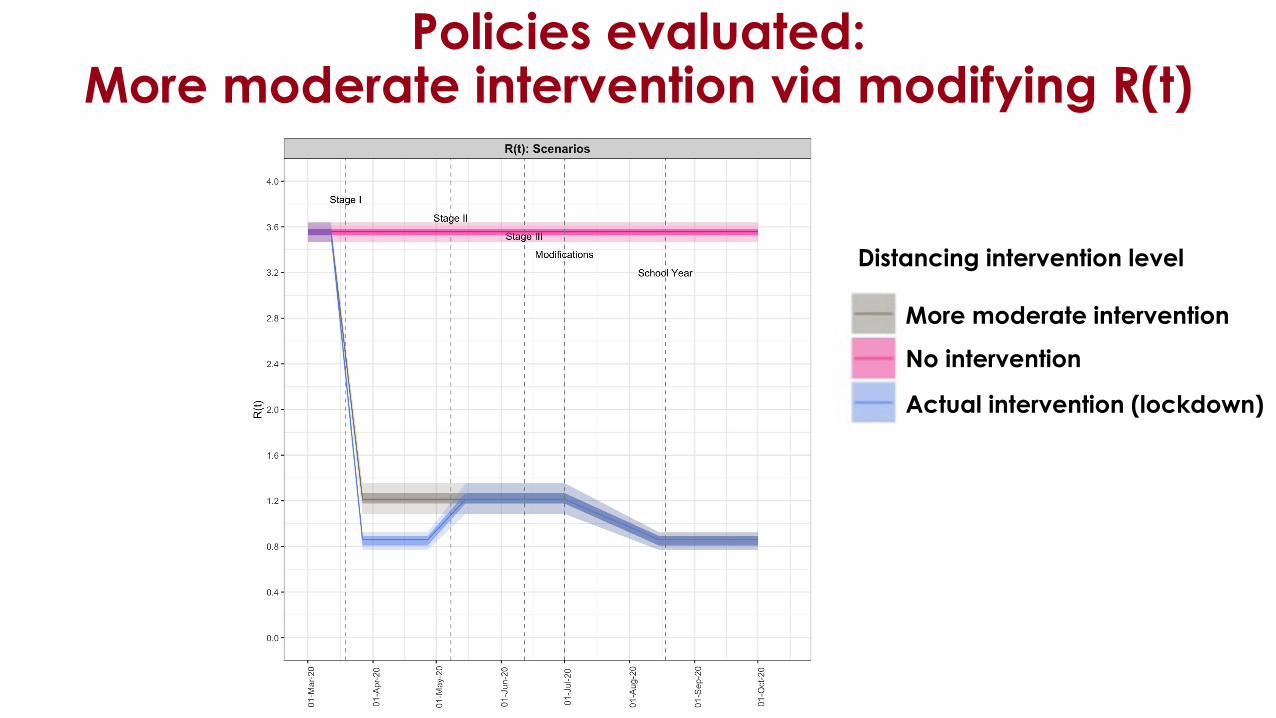
Policies evaluated: More moderate intervention via modifying R(t)
Distancing intervention level
Actual intervention (lockdown)
No intervention
More moderate intervention

Policies evaluated: Protection of at-risk populations
No (direct) protection of at-risk groups• What actually happened
Protect those > 65 years old• 17% of the LAC population
Protect those >65 years old AND/OR with highest health risk factors• ~35% of the LAC population

Counterfactual Scenario Results19
More moderate Lockdown
No protection Protect 65+ 65+ AND risks No protection Protect 65+ 65+ AND risks
Observed LockdownDeaths
In HospitalIn hospital
Infected
Actual interventions

1st and 2nd wave analysis –what went right
The strict initial lockdown period in LAC was effective because it both reduced overall transmission and protected individuals at greater risk
Moderate interventions + protection of 65+ alone would have overwhelmed healthcare capacity and doubled the death count
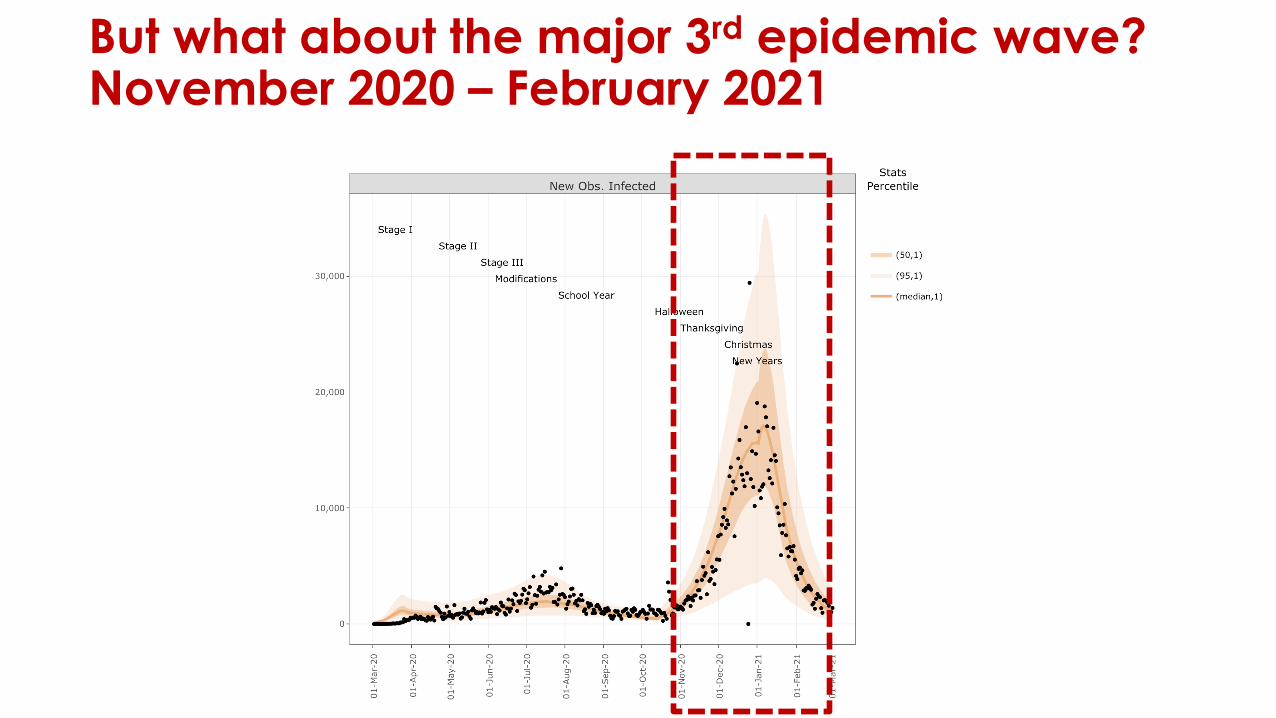
But what about the major 3rd epidemic wave? November 2020 – February 2021

3rd wave dynamics: Driven by major disparities in risk of infection
Different types of COVID-19 at-risk populations
At higher risk of exposure and infection• Social and socio-economic factors:
• Household crowdedness• Employment and ability to work from home• Income and ability to protect oneself• Acces to healthcare
At higher risk of severe illness given infection, i.e. of hospitalization and death
• Biological / health-related factors:• Age• Comorbidities• Obesity• History of smoking

• USC Department of Preventive Medicine• Lai Jiang, MS Biostatistics PhD Candidate• Emil Hvitfeldt, MS Research Programmer• Wendy Cozen, DO, MPH Professor of Preventive Medicine• Kayla de la Haye Assistant Professor of Preventive Medicine
• USC School of Public Policy• Neeraj Sood, Professor and Vice Dean of Research
• Los Angeles County Department of Public Health (LACDPH)• Paul Simon, MD, MPH, Chief Science Officer• Will Nicholas, PhD, MPH Director, Center for Health Impact Evaluation, LACDPH• Faith Washburn, MPH Epidemiology Analyst
The Team

BACKUP

• Big data from geolocation traces on smartphone devices
• A large and representative population sample (10% of US population)
• Spatial measures of:• Population able to stay at home• Population traveling in to work
• Aggregated individual-level patterns across neighborhoods
Big mobility data: Informs risk of infection by neighborhood

Measures from mobility data: who is able to stay at home
Population staying at home (ratio difference from pre-pandemic)
COVID-19 Incidence Rate

COVID-19 7-day Crude Incidence Rate Population able to stay at home
June
202
0D
ecem
ber 2
020
Crude Incidence Rate per 100,000
Ratio increase in stay-at-home proportion
Measures from mobility data – by neighborhood

Next steps:Investigating 3rd wave with neighborhood modelUse the neighborhood model to do scenario analysis on the 3rd wave to investigate:
• How effective were policy measures to protect different populations from infection, hospitalization, and death?
• What would things have looked like if we had done a greater job to help more people stay at home or not go to work if sick?
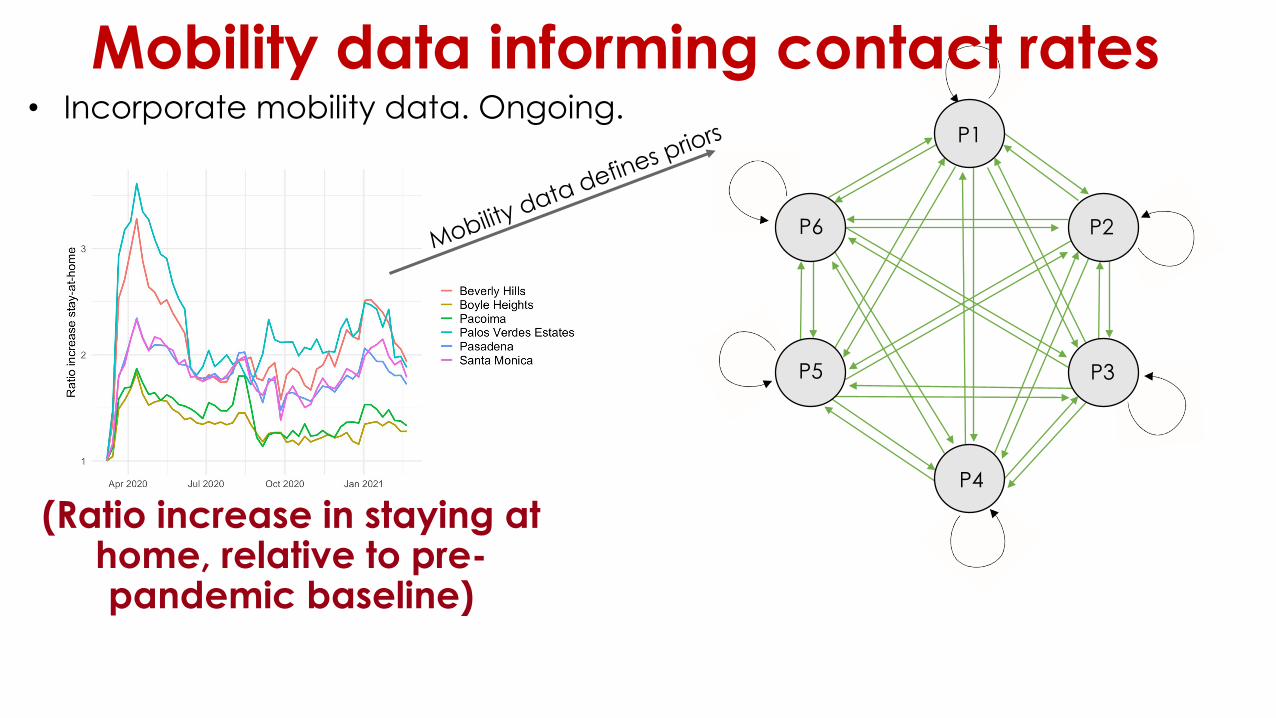
Mobility data informing contact rates • Incorporate mobility data. Ongoing.
P6
P1
P5
P4
P3
P2
(Ratio increase in staying at home, relative to pre-pandemic baseline)

Counterfactual Scenario Results
More moderate Lockdown
No protection Protect 65+ 65+ AND risks No protection Protect 65+ 65+ AND risks
Observed Lockdown
DeathsIn Hospital
Actual interventions
Horn et al. 2021, MedarXiv.