demographics and development in the 21 century initiative
TRANSCRIPT

1
Demographics and Development in the 21st Century Initiative Technical Background Paper
How Demographic Change Affects Development
By Rachel Nugent and Barbara Seligman
The Center for Global Development is an independent, nonprofit policy research organization that is dedicated to reducing global poverty and inequality and to making globalization work for the poor. The views expressed in this paper are those of the author and should not be attributed to the board of directors or funders of the Center for Global Development
Abstract
Demographics are of key importance to development, but this link is often ignored. Debates about population policy are stirring, with columnists and academics arguing about what lies ahead if global population challenges aren’t actively integrated into policy and planning processes. Population—the study of people using the tool of demography—is now appearing across development discourse, with policy implications that reach far beyond family planning and reproductive health.
Population IS undeniably important—but how, for whom, and with what consequences is a complex story. Two things are certain:
1. Population issues in the 21st century are different from those in the last century. 2. With the development world midway through an uncertain effort to reach the
Millennium Development Goals by 2015, population issues will be central to the success or failure of six of the eight goals.
CGD has launched an initiative to examine the role of population in development that, through a series of lectures, will recast the current development agenda to include the broad implications of demographic change.
This paper presents an overview of the impact that demographic changes will have on development over the first half of the 21st century by taking a close look at three demographic trends: fertility, mortality, and immigration; and examining how these will touch policy issues including poverty, public finance and infrastructure, and climate change.
2
How Demographic Change Affects Development
By: Rachel Nugent and Barbara Seligman
I. Introduction
Demographic issues are insufficiently addressed by international agencies concerned with
global development. The United Nations’ Millennium Development Goals (MDGs)
provide a framework for global development assistance but omit reference to population
growth, fertility, aging, or internal or international migration. The United States, which
for years led the world in championing slower population growth in poor countries as a
development priority, no longer includes reference to any demographic variables in its
current strategic plan for foreign assistance.1
This paper aims to kick-start a discussion of the principal ways in which demography is
expected to affect development in the first half of the 21st century. It reviews three major
demographic trends—mortality, fertility, and immigration—that will shape the size, age
structure, and distribution of tomorrow’s population. It then examines key policy issues
that will be impacted by these trends: global poverty, public finance and infrastructure
needs, and climate change.
This paper is directed at an audience of global policymakers and serves as the technical
background paper for the Demographics and Development lecture series sponsored by
the Center for Global Development.
1 U.S. Department of State, U.S. Agency for International Development, Strategic Plan, FY2004–2009. Security, Democracy, Prosperity, August 2003.

3
II. Demographic Drivers: Fertility, Mortality, and Immigration
(i) Fertility
The size of the global population is most affected by fertility rates in countries with
moderate to high population growth. At the global level, fertility rates have been falling
since the last decades of the 20th century as a result of the (largely) voluntary choices of
couples to limit the number of children born. The average number of children per woman
fell from 5 in 1950 to 2.7 in 2005.
2 Bongaarts, John and Rodolfo Bulatao, editors. 2000. Committee on Population, Commission on Behavioral and Social Sciences and Education, National Research Council. Beyond Six Billion: Forecasting the World’s Population. Washington, DC.
How reliable are demographic projections? Population projections can be highly reliable but they are not certainties. A 2000 National Academy of Sciences (NAS) review of population projections2 looks at the predictive strength of different kinds of projections. The review supports the generally held view that the more near term and aggregated the projection (e.g., for the developed or developing world), the more reliable it is likely to be. Conversely, some of the trends one would like to be able to project accurately are among the least reliable to project (e.g., immigration, size of specific age groups). Even in countries where substantial improvements have been made in basic population measurements, data quality for some measures, notably immigration and urban residence remain highly problematic. Misspecification of trends also creates inaccuracies in projections. For example, projections have historically underestimated the pace of fertility decline. Revised projections now assume steady fertility decline in the developing world, including the countries of sub-Saharan Africa, where evidence of fertility decline remains spotty. Past projections have also underestimated the pace of mortality decline, in part because of assumptions about AIDS-related mortality. This brings us to the third factor complicating demographic projections: the unforeseen and the unknowable. What prescient demographer could have projected stagnation and even reversals in life expectancy in Russia and the countries of the former Soviet Union during the 1990s, or foreseen the explosion of AIDS or the relatively rapid spread of antiretroviral therapy in the poorest corners of the world? Such events fall outside the parameters of demographic projection models. Notwithstanding these challenges, history indicates that projections of population size and structure are more accurate than projections for other types of phenomena (e.g., gasoline prices or stock market performance). They are one of our few guides to charting the future of our world.

4
Figure 1.
Very high fertility rates. Across regions, only sub-Saharan Africa’s fertility still
averages above 5 (classified as very high), ensuring continuing population growth there
into the 21st century.3 High fertility rates persist principally in 35 of the world’s poorest
countries, with Afghanistan, Nigeria, Uganda, and Yemen on course to see their
populations triple by 2050.
Stalled rates of fertility decline. While evidence of fertility decline can be found in all
regions, including Africa, the pace of the transition varies sharply across regions (see
Figure 1). Table 1 shows the countries now experiencing fertility “stalls,” or plateaus, in
the rate of fertility decline. The causes of these slowed rates may be associated with
stagnation in socioeconomic advancement.4 In some countries, a persistent preference
for sons may play an important role in keeping fertility rates above replacement levels.5
Whatever the reason, the duration of stalled rates of fertility decline, especially in
3 The African Sahel’s fragile ecosystem continues to be burdened with a population increase of 3 percent each year. (See Mary Kent and Carl Haub, 2005. The Global Demographic Divide. Population Bulletin, vol. 60, no. 4. December.) 4 John Bongaarts, 2005. “The Causes of Stalled Fertility Transitions,” Policy Research Division Working Paper. New York. Population Council. 5 See, for example, Jane Menken, Nizam Khan and Abdur Razzaque, 2008. “The Stalled Fertility Transition in Bangladesh: The Effects of Gender and Number Preferences.” Paper presented at the annual meetings of the Population Association of America, New Orleans, LA.
5
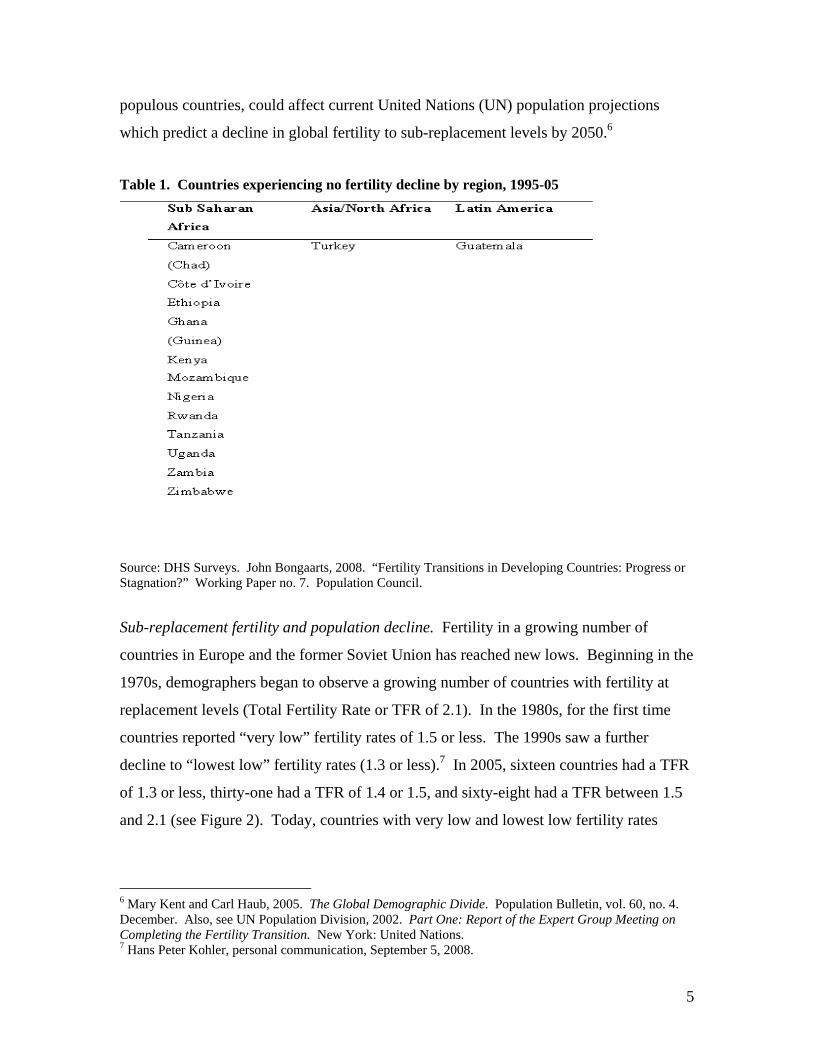
populous countries, could affect current United Nations (UN) population projections
which predict a decline in global fertility to sub-replacement levels by 2050.6
Table 1. Countries experiencing no fertility decline by region, 1995-05
Source: DHS Surveys. John Bongaarts, 2008. “Fertility Transitions in Developing Countries: Progress or Stagnation?” Working Paper no. 7. Population Council.
Sub-replacement fertility and population decline. Fertility in a growing number of
countries in Europe and the former Soviet Union has reached new lows. Beginning in the
1970s, demographers began to observe a growing number of countries with fertility at
replacement levels (Total Fertility Rate or TFR of 2.1). In the 1980s, for the first time
countries reported “very low” fertility rates of 1.5 or less. The 1990s saw a further
decline to “lowest low” fertility rates (1.3 or less).7 In 2005, sixteen countries had a TFR
of 1.3 or less, thirty-one had a TFR of 1.4 or 1.5, and sixty-eight had a TFR between 1.5
and 2.1 (see Figure 2). Today, countries with very low and lowest low fertility rates
6 Mary Kent and Carl Haub, 2005. The Global Demographic Divide. Population Bulletin, vol. 60, no. 4. December. Also, see UN Population Division, 2002. Part One: Report of the Expert Group Meeting on Completing the Fertility Transition. New York: United Nations. 7 Hans Peter Kohler, personal communication, September 5, 2008.

6
make up more than 40 percent of countries with sub-replacement fertility, an increase
from 33 percent in 1995 and 14 percent in 1985.
Figure 2. Countries with replacement or lower fertility, 1985–2005
(ii) Mortality
Mortality rates—determined chiefly by child mortality and longevity—show an
improvement worldwide. Child mortality rates appear to be improving after a period of
stagnation, while more and more developing countries are experiencing gains in
longevity.
Child mortality. As with fertility decline, developing countries in the 20th century
experienced unprecedented gains in child survival. The fastest global improvements
occurred during the 1960s as a result of substantial gains in China. Between the 1960s
and 1970s, child mortality rates fell in other parts of Asia and Latin America, while sub-
Saharan Africa experienced a marked decline around 1980.
Yet, an estimated 10.8 million children still die before their fifth birthday each year.
Three out of four of these deaths occur in sub-Saharan Africa or South Asia, with 90

7
percent of the deaths occurring in 42 countries.8 Worldwide, only sixteen countries with
high child mortality are on track to meet the MDG target, which calls for a two-thirds
reduction in the mortality rate for children younger than 5 years between 2000 and 2015.
Conflict and post-conflict situations further impede progress in reducing child mortality.9
Stalled rates of decline in child mortality. The rate of child mortality decline has slowed
since around 1980 although it may now be picking up again. The slowdown occurred
both in those countries where child mortality rates have fallen to the levels of
industrialized countries, and in high mortality regions, including sub-Saharan Africa. A
few countries with high rates of HIV prevalence (such as South Africa and Zimbabwe)
actually experienced increases in child mortality rates between 1990 and 2006. However,
the number of overall child deaths caused by HIV/AIDS is small relative to the global
total,10 so this factor alone would not have a large effect on global rates. More recently,
demographic and health survey data indicate that rates of child mortality decline appear
to be accelerating compared to even two or three years ago. A partial explanation for this
is the major downward revision that has occurred in HIV-prevalence estimates, which in
turn reduces estimates of the mortality effects of mother-to-child-transmission of the
disease. More importantly, in retrospect it seems likely that demographers also
overestimated the severity of earlier slowdowns in the rate of child mortality decline.11
HIV/AIDS mortality. Globally, AIDS mortality will have a modest effect on future
world population size; indeed, no single country is expected to see a decline in population
size due to AIDS.12 UNAIDS estimates that the number of new HIV infections
8 Robert Black, Saul Morris and Jennifer Bryce, 2003. “Where and Why are 10 Million Children Dying Every Year?” Lancet, vol. 361: 2226-34. 9 See Countdown Coverage Writing Group, 2008, “Countdown to 2015” for maternal, newborn, and child survival: the 2008 report on tracking coverage of interventions, Lancet, 371: 1247-58. 10 AIDS causes more than half of child deaths in some small countries, such as Botswana and Zimbabwe. But in the 42 countries where most child deaths occur, AIDS accounts for more than 10 percent of these deaths in only three countries (see Countdown Coverage Writing Group, 2008). 11 Kenneth Hill, September 12, 2008, email communication. 12 UN Population Division, 2005. Population Challenges and Development Goals. New York: United Nations.

8
worldwide has declined from approximately 3 million in 2001 to 2.7 million in 2007.13
Data suggest that HIV incidence (the annual rate of new HIV infections among adults
aged 15–49) has already peaked in all regions of the world, including sub-Saharan Africa,
after slowing significantly since the 1990s. As Figure 3 shows, HIV prevalence in sub-
Saharan Africa also seems to be stabilizing. Globally, the total number of individuals
infected with HIV is estimated to be 33.2 million.14
Figure 3. HIV‐related estimates, global and sub‐Saharan Africa, 1990– 2007 UNAIDS, 2008. 2008 Report on the Global AIDS Epidemic. Figure 2.03
13 Given the practical difficulties of conducting HIV-incidence studies, serial HIV-prevalence over time in young women (ages 15–24) attending antenatal clinics serves as a proxy measure for incidence, providing important indications of recent epidemiological trends. 14UNAIDS, 2008. 2008 Report on the Global AIDS Epidemic. Geneva.

9
Recent estimates suggest AIDS affects the crude death rate (CDR), especially in sub-
Saharan Africa. However, even in Africa, where a steady decline in the CDR was
temporarily halted between 1985 and 2005, the net demographic effect of AIDS remains
small relative to fertility. Sub-Saharan Africa’s population is projected to grow by 1
billion between 2005 and 2050.
Longevity. During the second half of the 20th century, life expectancy at birth converged
markedly across countries, with poor countries experiencing rapid gains caused mainly
by striking improvements in child survival. Life expectancy rose an average of 23 years
in the poorest 50 percent of countries between 1960 and 2000, but only nine years in the
richest 50 percent, according to WHO (see Table 2).
Table 2. Global trends in life expectancy from birth and per capita income, 1960–2000
1960 2000
L.E.* Per
capita income
L.E.*Per
capita income
Europe & Central Asia 68 6,810 76 18,281
East Asia & Pacific 42 1,317 71 5,866
Latin Am. & the Carib. 56 3,459 70 7,161
Middle East & N. Africa 48 1,935 69 5,525
North America 70 12,380 77 32,880
South Asia 44 892 63 2,346
Sub-Saharan Africa 41 1,470 46 1,573
Poorest 50% countries in 1960 41 896 64 3,092
Richest 50% countries in 1960 65 7,195 74 18,162
World 49 2,983 67 7,236

10
*L.E. = Life expectancy. Income per capita is GDP per capita in 1996 international prices, adjusted for terms of trade (Penn World Tables 6.1). Life expectancy is life expectancy at birth (World Development Indicators, World Bank). Regional averages weighted by country population. Source: Gary S. Becker, Tomas J. Philipson, and Rodrigo R. Soares, "The Quantity of Life and the Evolution of World Inequality," American Economic Review 95, no. 1 (2005): 277-91.
(iii) International migration The movement of people across borders is the third force shaping population size, age
structure, and distribution. Since the focus of the Demography and Development Project
is on immigration from poor countries to richer ones and, to a lesser extent, to other poor
countries, this section does not discuss trends in migration patterns among more
developed countries. In 2005, approximately 60 million people migrated from a less
developed country to a more developed one, roughly the same number that migrated from
one less developed country to another less developed one.15
United States. The annual immigration rate to the United States was at its peak in the
1900s at 11.6 per 1,000 population. By the 1990s the annual immigration rate had
dropped to 4 per 1,000, while the actual number of immigrants entering the country grew
to about 1 million per year, the highest ever. The number of immigrants coming to the
United States, however, is much smaller than the number migrating to Western and
southern Europe.
Europe. Migration inflows to Western Europe began after the 1950s as unprecedented
economic growth fueled demand for labor which was met through “guest-workers” and
labor migrants, and later followed by the admission of laborers’ dependents. While
immigration flows into Europe dropped from their peak in the early 1960s, since 1985
through the present immigration flows have increased to unprecedented levels. Migration
inflows to Western Europe, almost entirely from the poor countries of Asia, the Middle
East, the former Soviet republics and to a lesser extent, Africa, are expected to increase in
15 Philip Martin and Gottfried Zurcher, 2008. “Managing Migration: The Global Challenge.” Population Bulletin, March. Population Reference Bureau, Washington, D.C.

11
the near term, with substantial effects on both the size and (ethnic) composition of the
population.16
Some slowing in the growth of immigration may appear in the first quarter of the 21st
century (compared to the last quarter of the 20th century) as sending countries experience
slowed rates of population growth and economic improvements.17 One unknown is sub-
Saharan Africa, which is yet to be the source of mass emigration experienced from other
poor regions (e.g., Asia, Latin America and the Middle East).
II. The Size and Shape of Global Population in the 21st Century
As fertility continues to decline and longevity improves, demographers see emerging in
the first decades of the 21st century a global population that will be bigger but slower
growing than in the previous century.18 The epic rates of population increase witnessed
in the 20th century that fueled fears of Malthusian scarcity have slowed and are unlikely
to recur.
(i) Global population size and growth
The size of the world population, estimated at 6.7 billion in 2007, is projected to increase
by 2.5 billion to just over 9 billion by 2050, according to the UN’s most recent medium
variant projection.19 The increase, which is equivalent to the size of the world’s
population in 1950, will occur almost entirely in the less developed regions of the world.
The population of the developed world is projected to remain constant at 1.2 billion;
without immigration, however, it is projected to decline slightly.
16 Shifts in ethnic composition have already occurred. For example, in Germany, only 0.5 percent of the population was “foreign-born” in 1870-71, rising to nearly 2 percent in 1910-11 and to 9 percent in 2000–2001. In the United States, by contrast, the percentage of the foreign-born population has actually declined modestly from just under 15 percent at the beginning of the 20th century to 11 percent at the beginning of the 21st century (Jeffrey Williamson, 2006. “Global Migration,” Finance and Development 43 3 [September]: 23-7). 17 Ibid. 18 Joel Cohen, 2005. “Human Population Grows Up,” Scientific American, Vol. 293, Issue 3. pp. 48–55. 19 UN Department of Economic and Social Affairs, Population Division, 2007. World Population Prospects: The 2006 Revision, Highlights. Working Paper No. ESA/P/WP.202.
12
The number of countries with shrinking populations is likely to grow in the first half of
the 21st century. Low rates of in-migration combined with “very low” or “lowest low”
rates of fertility necessarily lead to population decline. Today sixteen countries in
Eastern Europe and the former Soviet Union are losing population. Other countries in
Europe with “very low” or “lowest low” fertility rates, such as Spain, are able to sustain
their population size only through immigration.20
(ii) Age structure transitions
A population’s age structure is affected by the rates of change that occur across age
groups on the three measures of fertility, mortality, and immigration. The “youth bulge”
and the rapid growth of elderly populations relative to the working age population are
two key age structure transitions that will shape the first decades of the 21st century.
Youth bulge. The youth bulge is a story about numbers and rates, although the two are
often confused. Headlines drawing attention to a youth bulge refer to absolute numbers.
The number of 12–24 year olds in the world today, estimated at 1.5 billion, is the largest
youth bulge the world has ever seen—another first for the 21st century. In Asia, Latin
America, and the Caribbean, youth populations are expected to peak in size in 2010; in
Africa and South Asia they will continue to grow through 2050. The large size of today’s
youth cohorts is explained by population momentum.21 Today’s youth are the children of
the large birth cohorts born in the 1960s and 1970s (“the population boom” generation).
Although the youth who make up today’s bulge were born into smaller families than
those of their parents, the effect of fertility decline is more than offset by the very large
size of their parents’ birth cohort.22
20 Since 1998, the increases in Spanish population have been due to migration (Official Report on Spanish Recent Macroeconomics. National Economic Reform Program. Accessed at: http://www.la-moncloa.es/NR/rdonlyres/2E85E75E-E2D9-4148-B1DF-950B06696A6C/74823/Chapter_2.PDF). 21 Population momentum refers to the tendency of a population to continue to grow after replacement-level fertility has been achieved. A population that has achieved replacement or below-replacement fertility may still continue to grow for some decades because past high fertility leads to a high concentration of people in the youngest ages (Population Reference Bureau, 2003. Population Handbook. 5th edition. Washington, D.C.). 22David Lam, 2006. “The Demography of Youth in Developing Countries and its Economic Implications.” World Bank Policy Research Paper, 4022. October.

13
The annual growth rate of the youth population has been falling steadily since it peaked
in the 1970s and 1980s in most countries in the developing world. As a result, the ratio
of youth to adult population has already peaked in much of the world, including in those
countries where fertility rates are still relatively high but have declined somewhat, such
as Kenya, Nigeria, and Pakistan. In a very small number of countries where fertility has
declined recently and rapidly, the youth bulge is especially big. This is the case in Iran
where in 2005, youth accounted for more than 25 percent of the population.23
The youth bulge represents both risks and opportunities. In the same way that a baby
boom stretches the resources required for antenatal care and primary education, a surge in
the absolute number of youth creates pressure on the services used by youth—land,
education infrastructure, apprenticeships, and other entry level workforce positions. In
situations where large cohorts of youth can be productively absorbed into the labor force,
the youth bulge can create a “demographic window of opportunity” which may yield a
high volume of economic outputs relative to the “dependent” costs of a large elderly
population. Under less auspicious—and more typical—circumstances, economies are
unable to absorb large numbers of youth. Even where economic growth forecasts are
positive, they may not be high enough to absorb the forecasted labor supply.24 In these
circumstances the youth bulge threatens to exacerbate forces contributing to political,
economic, and social instability, and serve as an engine for external migration.25
Aging populations. The graying of Europe and Japan is old news. Less appreciated is
the fact that rapid fertility declines in the 1970s and 1980s have paved the way for
eventual rapid aging in middle-income countries. Emerging market countries ranging
from Brazil to India to South Korea and Turkey are facing sharp increases in their elderly
dependency ratios as members of their current large workforces begin to retire and live
unprecedentedly long lives. Rapid aging means that these countries will have relatively
23 Ragui Assad and Farzaneh Riydu-Fahimi, 2007. Youth in the Middle East and North Africa: Demographic Opportunity or Challenge? Population Reference Bureau. Washington, D.C. 24 Commission on Growth and Development, 2008. “New Global Trends,” The Growth Report: Strategies for Sustained Growth and Inclusive Development. Washington, D.C.: World Bank. May. 25 See, for example, Central Intelligence Agency, 2001. Long-Term Global Demographic Trends: Reshaping the Geopolitical Landscape. Langley, VA. July.

14
little “breathing space” to absorb and set in place the reforms needed to manage the
dramatic increases in cost associated with an aging population (for needs such as health
care, pensions, and retirement policies).
Industrialized countries should begin to see a rapid shift in their elderly dependency
ratios beginning in 2010 (the “first wave” of aging societies). Asian countries are next in
line, leading aging’s “second wave.” Among them, South Korea is projected to have the
fastest aging of any country in the world ever: by 2020 the very elderly (80 and older)
will reach percentages of the total population seen in industrialized countries today.
China and Thailand will follow Singapore and South Korea with their elderly shares
rising quickly, beginning in 2035–2040. Because of very different demographic patterns
in urban and rural China, one can expect to see a sharp increase in the share of the elderly
in urban zones beginning in 2025, with rural zones following about a decade later.
Indonesia, India, and the Philippines are now enjoying relatively large working age
populations but will see their elderly ratios accelerating beginning around 2050.26
(iii) Urban growth
For the first time in human history, the next decades will witness the emergence of an
urban majority in all regions, including sub-Saharan Africa. The UN projects that the
total urban population in the developing world, estimated at 1.97 billion in 2000, will
more than double to 3.9 billion by 2030 and swell still further to 5.3 billion in 2050. By
2030 eight out of every ten of the world’s urban residents will live in cities in Africa,
Asia, or Latin America.27
The rate of urban population growth28 in poor countries is fueled by natural increase more
than migration, and already exceeds national growth rates. Most urban growth in the 21st
century will occur in towns and cities where government services and infrastructure (such 26 Peter Heller, 2006. “Is Asia Prepared for an Aging Population?” Working Paper 06/272, Washington, D.C.: International Monetary Fund, December. 27 Alex De Sherbinin and George Martine, 2007. “Urban Population, Development and Environment Dynamics.” Policy Paper 3, Committee for International Cooperation in National Research in Demography (CICRED). Paris. 28 Not to be confused with “urbanization” or the movement of residents from rural to urban zones, which in the developing world continues at a pace that has remained relatively constant.

15
as sanitation and drinking water supplies) are typically worse than in resource-privileged
megacities. Contrary to popular perception, only 12 percent of people living in cities in
the developing world live in a megacity.29
The rapid urban transition now occurring in the poorest countries presents special
challenges for development. First, the absolute size of the increments of growth will
greatly stretch existing infrastructure. Second, most of the urban growth in the 21st
century is not being driven by expanded economic opportunities, with the result that
migrants to urban areas are unlikely to experience the increase in income historically
associated with urban migration.30 Thus urban growth will not be associated with
increases in wealth associated with previous periods of rapid urban growth, such as the
Industrial Revolution. Finally, there is real concern about the environmental impacts of
further urban growth in the face of climate change and the rapid loss of ecosystems.31
Section III. How Demographics Affect Key Development Policy Issues
Policymakers cannot afford to ignore the impact of demographic trends and indicators on
the achievement of major development goals, including poverty reduction, old-age and
health security, and provision of public services and infrastructure. This section
constitutes a “tasting menu” of demographic changes and policy options, and previews
the expert in-depth analysis forthcoming in CGD’s Demographics and Development
lecture series.
(i) Poverty and inequality
Demographic factors affect poverty levels and inequality within and among countries in
fundamental ways. At the micro level, fertility levels affect household economic well-
being; at the macro level, the “demographic opportunity” associated with the transition 29 Mark Montgomery, 2008. “The Urban Transformation of the Developing World.” Science. Vol. 319. February 8. 30 The secondary cities in the developing world where much of the urban population growth is occurring rarely see much growth in economic opportunities. This is mainly due to their failure to attract the external investment that would lead to job creation and provide the tax revenues necessary to create supportive infrastructure. (See Alex De Sherbinin and Martine, 2007.) 31 Ibid.

16
from a majority youth population to a large productive-age population influences
unemployment and economic growth rates; and globally, immigration is both a cause and
a result of differing levels of economic development. A cohesive approach to reducing
poverty and inequality requires understanding linkages to demographic change at each
level.
Fertility and poverty. In aggregate terms, we see across all developing countries over
time a strong inverse relationship between fertility and per capita income, and fertility
and life expectancy—two common indicators of well-being. We also see a positive
relationship between total fertility rates and poverty across developing countries, as
shown in Figure 5.
Figure 5.
© 2007 Population Reference Bureau
Association Between Fertility and Poverty
0
20
40
60
80
100
0 1 2 3 4 5 6 7 8
Percent of Population Living on <$2 per Day
Source: Population Reference Bureau, Population & Economic Development Linkages 2007 Data Sheet.
Total Fertility Rate
Niger
Jordan
Mongolia
Many countries experience a high fertility-poverty trap in which low incomes may
exacerbate high fertility rates and vice versa. Life expectancy is also much lower among

17
countries with very high fertility, compared to the entire group of developing countries.
Almost every country in the very high fertility category has an average life expectancy of
less than 55 years, implying again a trap wherein low life expectancy and high fertility
are inextricably linked.
These traps are plausibly caused by the poor health conditions (reflected in indicators
such as high infant and maternal mortality and inadequate public health services) and
poor living standards (poor employment opportunities, malnutrition, low rates of
educational achievement) that exist in these countries. High fertility is a common
element among them but it is virtually impossible to determine whether the poverty and
low life expectancy traps are caused by high fertility or create high fertility.
Economic growth policies in and of themselves are not guaranteed to benefit the poor
(Asian Development Bank, 2004).32 Countries stuck in the high fertility-poverty trap
need policies to help them break the cycles that create poverty and low life-expectancy
traps. There are many possible routes to breaking out of the trap, involving both
economic and population policies. These include poverty alleviation programs, improved
educational and employment opportunities, and making family planning and other health
services available. To successfully break out of the trap, however, policies must resort to
targeting the poor (for example, female-headed households in rural areas or with low
education), as targeting has been shown to yield greater benefits.
Fewer dependents, more workers, and faster growth? The period following fertility
decline offers developing countries the opportunity to benefit from what is sometimes
called a “demographic bonus” which occurs through two channels: a labor effect and a
savings effect. When a country enters a period of lower dependency, a higher proportion
of people are in their productive life years, so GDP per capita rises. This is the labor part
of the bonus. The savings component of the bonus arises because the worker cohort has
less need to support large numbers of children or (grand)parents, and can therefore put
32 Asian Development Bank, 2004. “Poverty in Asia: Measurement, Estimates, and Prospects.” Manila.

18
more of their earnings into savings rather than consumption. The macro-economy
benefits in the long run from greater savings per capita.
The demographic window of opportunity is just beginning to open in many African
countries. The different experiences of East Asia and Latin America in the 1980s and
1990s suggest that policy choices can open or close that window. Whether African and
other developing countries undergoing demographic transitions realize a “demographic
bonus” will depend in large measure on labor and other policy decisions these countries
make today and, in some cases, whether they can overcome decisions made yesterday.
Immigration and economic development of sending countries. An emerging movement
argues that it is no longer relevant to ask whether immigration contributes to
development but rather to ask how much it contributes.
Conventional measures of development hide the full contributions of immigration. Better
measures represent a key first step toward identifying the point at which migration—
which is one of the biggest forces moving people in developing countries out of
poverty—becomes a major engine for economic development.33 A proposed new metric,
“income per natural born” resident—or the mean annual income of persons born in a
given country regardless of where a person now lives—would more fully capture the
economic benefits of development for the source country. For rich countries there is
relatively little difference between income per natural and more conventional measures of
national income. The difference is pronounced, however, in countries where a high
percentage of the population migrates to work overseas, a move that often moves the
migrant out of poverty.
(ii) Public finance
Developing countries at different stages of the demographic transition have different
opportunities to prepare themselves to provide needed public services. Those at a
33 Michael Clemens and Lant Pritchett, 2007. “Is Migration Development? Global Estimates of Income per Natural.” Northeastern Universities Development Consortium Conference, Harvard University, Oct 26–27.

19
relatively early stage in which the demographic window is not expected to begin to close
until 2035–2040 (for example, Brazil, China, Malaysia, and Thailand) benefit from the
gift of time which affords them greater maneuverability to manage public expenditures.
During the next crucial years they can focus on building the human capital of tomorrow’s
workforce, retiring public debt, and restructuring pension and health care benefits so they
don’t entrap their aging work force.
Pensions. In countries where publicly financed pensions cover a large share of the
population, the impact of an aging population will have a strong effect on pension
financing. To get a sense of the potential magnitude of demographic shifts on pension
outlays, consider that through 2010 the countries of the East Asia region will spend
between 1 and 2 percent of GDP on pensions. Between 2010 and 2025, their pension
expenditures are expected to increase to 4 percent of GDP. By 2050, this figure could
rise to as much as 8 to 11 percent of GDP in countries like Korea and Taiwan that have
relatively comprehensive publicly financed pensions.34
But most people in emerging market economies are not covered by any pension benefit
whatsoever. Coverage rates vary from almost universal in South Korea to very low in
India, Mexico, and the Caribbean nations. Very few elderly people accumulate savings
during their lifetimes. Further, shrinking family size means there are fewer children
available to provide support for old people. Evidence (where available) also suggests that
wages for older workers decline relative to younger ones.35 All of this points to a need
for policies that prepare for aging populations.
Governments must therefore focus attention on financing pension deficits, containing
fiscal costs, eliminating adverse incentives associated with government guarantees, and
increasing coverage of some kind of minimum benefit, especially for the poor. In
countries dependent on remittances, governments need to devise attractive means for
34 Rakesh Mohan, 2004. “Fiscal Challenges of Population Aging: The Asian Experience.” Symposium on Global Demographic Change: Economic Implications and Policy Challenges. Jackson Hole, Wyoming. August 26–28. 35 Jackson, 2005.

20
remitters to invest their retirement savings upon their return home.36 Initial steps to
reform pension policies are underway. Many Latin American countries have already
transitioned from pay-as-you-go (PAYG) public systems to wholly or partially private
individual capitalization account systems to avoid bankrupting public coffers as their
populations age.37 Among the Asian “second wave” countries with public pension
schemes, projections suggest that without change to present policy, the increase in
payouts due as swelling numbers become eligible for these benefits without
corresponding increases in contributions will cause reserves to be exhausted by about
2015, with deficits mounting thereafter.38 In response, some of these second wave
countries are moving now to modify terms of public pension eligibility and generosity
(for example, Korea is indexing public pensions to prices rather than wages).
Health care. The 21st century will bear witness to unprecedented increases in longevity
in Asia, Latin America, and the Caribbean. As populations live longer, become
wealthier and more urban, and as the elderly grow as a relative share of the population,
we can expect health care costs to escalate. Data from industrialized countries indicate
that per capita health care expenditures for the elderly are roughly three times higher than
for the rest of the population, largely because of the kinds of illnesses—cancers, diabetes,
cardiovascular disease—to which the elderly are prone. Countries that today find it
difficult to dedicate 3 to 5 percent of GDP to health care may have to consider the
implications of spending upwards of 8 to 10 percent.39 Increases in income,
improvements in and better access to advanced medical technology, along with increased
life expectancy, will be the principal drivers behind these increases.
While the size of the working age population remains large relative to the dependent age
population, consumption of health services declines, creating space to prepare for
financing the health care needs of tomorrow’s aging population.40 For many second
36 Jamaica’s returning residents program is an example. 37 Corbo, Vittorio 2004. “Policy Challenges of Population Aging and Pension Systems in Latin America.” Symposium on Global Demographic Change: Economic Implications and Policy Challenges. Jackson Hole, WY. August 26–28.) 38 Rakesh Mohan, 2004. “Fiscal Challenges of Population Aging: The Asian Experience.” Symposium on Global Demographic Change: Economic Implications and Policy Challenges. Jackson Hole, Wyoming. August 26–28. 39 IPES, 2000. ibid p.87. 40 As a share of GDP, per capita health expenditures are at their lowest at age 32.

21
wave countries, this means putting in place regulatory mechanisms for public and private
insurance and developing health service models adaptable to an aging demographic. Of
course, for many elderly in second wave countries, longevity will mean more time
working, including working at physically demanding agricultural jobs. Factors affecting
the health of these workers today (such as tobacco consumption and access to affordable
healthcare) will affect their health and ability to continue to work productively into old
age.
Education. In Europe an aging population may lead to savings in public education
costs. But for many second wave countries, any savings arising from having fewer
children to educate are likely to be quickly consumed by investments in universal
education and in increasing the number of years of schooling children complete. Public
spending on education in many second wave countries ranges between 2 and 4 percent of
GDP. In settings where public financing is concentrated in the primary years (such as
India), and where governments provide relatively little financing for secondary and
tertiary education, one might expect to see this share fall to 1 percent as early as 2010.41
Yet, increases to productivity, the growth engine on which the success of emerging
market economies so greatly depends, will require improving the quality of education,
increasing enrollment in higher education, and placing greater emphasis on costly
technical and professional education. The net prospect for reducing public education
expenditures to partly offset the health and social security expenses of an elderly
population is thus much less certain in second wave countries than in the industrialized
world.
With an aging workforce, education is no longer merely a matter of preparing the young.
Adult workers, many poorly educated, will grow as a share of the workforce, and will
need to be re-educated to meet changing labor market needs. This will be a challenge for
Latin American and Asian second wave countries. India and Indonesia—and even
China—will need to address illiteracy among aging workers. For example, projections of
41 Rakesh Mohan, 2004. “Fiscal Challenges of Population Aging: The Asian Experience.” Symposium on Global Demographic Change: Economic Implications and Policy Challenges. Jackson Hole, Wyoming. August 26–28.

22
illiteracy rates for adults 25 years and older in 2026 in India are comparable to the levels
of illiteracy found in many Latin American countries circa 1970 (between 30 and 35
percent).42 Many of these illiterate elderly now work and will continue to work in low
paying agricultural jobs, and will not have the savings or pension resources that might
allow them to retire.
(iii) Demographic change and infrastructure needs
The kinds of transportation systems, and the number and type of schools and hospitals a
country needs, are just some of the examples of infrastructure demands which are highly
sensitive to demographic change. With fast growing populations, infrastructure needs,
like the population they support, tend to grow exponentially. Countries seldom have the
resources to expand available infrastructure to meet the needs of a population that is
growing steadily (the costs associated with “treading water”). Still more serious,
population growth compounds the challenges and costs of improving infrastructure (the
costs associated with “getting ahead”).
Yet, falling fertility and the stabilization of population numbers does not necessarily
translate into reduced infrastructure needs. Shrinking family size is typically associated
with the emergence of more but smaller households, a factor that is often overlooked in
projections of electricity and water needs in countries where a demographic transition is
underway. A recent study concluded that basic infrastructure needs stemming from the
trend toward smaller household sizes accounts for half of the increase in infrastructure
attributable to population growth.43
Two other factors will significantly impact infrastructure. Urban growth in the 21st
century will present a number of important infrastructure challenges. First, the projected
absolute size of the increments of urban growth is greater than ever before and will strain
existing infrastructure in unprecedented ways. Second, because urban growth in the 21st
42 Nicholas Eberstadt, 2006. “Growing Old the Hard Way: China, Russia, and India.” Policy Review. The Hoover Institute, Stanford University, Palo Alto, CA. 43 Amadou Diallo and Quentin Wodon, 2007. Demographic Transition toward Smaller Family Size and Basic Infrastructure Needs in Developing Countries. Economics Bulletin, Department of Economics, Vanderbilt University, Nashville.

23
century is not being driven by expanded economic opportunities, the additional resources
available to support infrastructure expansion are also not likely to be available. Finally,
the global environment today is far different than the one in which the last massive urban
transition took place, with the result that there is real concern about the impacts of further
industrial development in the face of climate change and the rapid loss of ecosystems.44
Urban planning for the 21st century will need to take into account these factors while also
building the capacity of planners in the towns and secondary cities where much of this
growth will occur.
Emerging market countries, many of which are struggling to expand their national
infrastructure to keep up with economic growth, will face in the coming decades growing
aging populations that will demand different kinds of infrastructure, ranging from seats at
bus stops to ramps on sidewalks.
(iv) Demographic Dynamics and Climate Change
Scientific and popular debate about the causes of climate change and strategies to
mitigate its effects has been relatively silent on the subject of demographic change.45
This silence can be partly explained by the focus of climate change debate on
consumption, which is highest in the slow growing or shrinking Industrial World.46
Difficulties in attributing environmental outcomes, including climate change, and the
apparent different directions of various demographic effects (e.g., aging decreases
emissions; urbanization increases them) no doubt have encouraged researchers to focus
on other factors that more directly and consistently affect climate change.
At least three demographic trends are relevant to climate change: (1) age structure
transitions and attendant changes in consumption patterns, a relevant development for
both industrialized countries as well as many populous emerging markets which by mid
44 See Alex De Sherbinin and George Martine, 2007. 45 See, for example, the scant attention given to demographic factors by the Intergovernmental Panel on Climate Change (IPCC) and in the 2007 Kyoto Protocol. 46 The greatest increases in consumption are occurring in China and India, where arguably, reduced family size combined with economic opportunity help create the middle class which is driving this consumption.
24
century will have age structures resembling those of the developed world; (2) population
movement and increases in consumption associated with urban residence; and (3) in-
place population growth, a driver of greenhouse gas emissions.
In a recent presentation hosted by the Woodrow Wilson Center’s Environmental Change
and Security Project Brian O’Neal47, whose research focuses on the effects of
demographic change expressed in consumption, indicated that approximately 15 percent
off climate change could be attributable to such population factors. New research
suggests population growth in both developed and developing nations is expected to play
a very important role in global greenhouse gas (GHGs) emissions. For developed
countries, per capita carbon emissions have stabilized or even decreased in the last two
decades. This means that emission increases in the developed world are now primarily
driven by population growth.48
Conclusion
The Center for Global Development series, Demographics and Development, explores
the impacts of demographic trends on the achievement of the major development goals
“tasted” here. Drawing on new research findings, methodological advances and the
benefit of a multidisciplinary perspective, the papers in the series should revitalize policy
discussion and debate regarding the impacts of demographic variables on key
development outcomes. The series brings new voices to the discussion as well, with the
aim of broadening discussion to encourage a more comprehensive treatment of the range
of demographic trends that will define the first decades of the 1st century.
47 O’Neill, Brian, 2008. “Population and Climate Change: Relationships, Research and Responses.” Presentation. Woodrow Wilson International Center for Scholars, Washington, DC February 20. 48 Meyerson, Frederick, 1998. Population, Carbon Emissions and Global Warming: The Forgotten Relationship at Kyoto, Population and Development Review. 24 no. 1 (Mar 1998): 115-130.