demographics quick facts about sps 309 employees 2160 students nearly 200,000 intra-district miles...
TRANSCRIPT

Sallisaw
Schools
2011-2012

Demographics
CaucasianNative Amer-icanHispanicOther Ethnic Af-filiation
42% 49%
5%4%

Quick Facts about SPS
• 309 Employees
• 2160 Students
• Nearly 200,000 Intra-District miles traveled annually.
• 11 Languages represented in the districtEnglish, Spanish, Cherokee, Laos, Romanian, HmongIndian Guajarati, Inuping, Hindi, Ukrainian, Russian
• 398,355 meals served last year.
• 70% Free and Reduced lunch RateHousehold of 4 must earn less than $29,055 to qualify

5 Major Funds
General Fund Building Fund
Child Nutrition Fund Bond/Sinking Fund
Activity Funds

General Fund Foundation and Salary Incentive
Aid
FY 10 $8,022,718.00
FY 11 $7,829,289.00
FY 12 $7,724,527.00

Funding SourcesGeneral Fund
$14,518,987.13
Local
State
Federal
16% 14%
70%
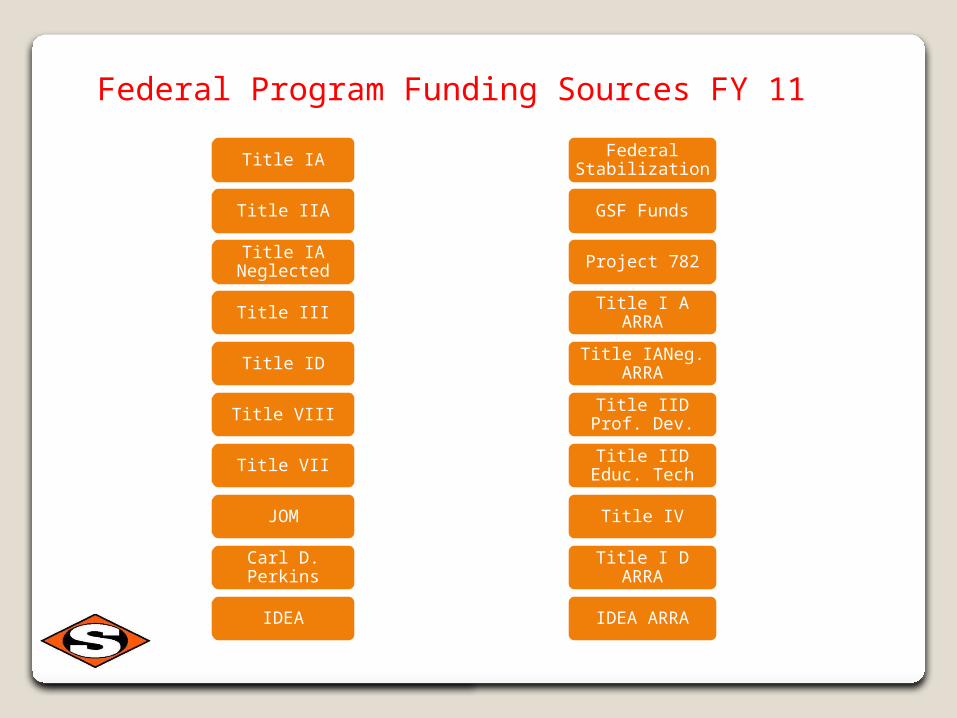
Title IA
Title IIA
Title IA Neglected
Title III
Title ID
Title VIII
Title VII
JOM
Carl D. Perkins
IDEA
Federal Program Funding Sources FY 11
Federal Stabilization
GSF Funds
Project 782
Title I A ARRA
Title IANeg. ARRA
Title IID Prof. Dev.
Title IID Educ. Tech
Title IV
Title I D ARRA
IDEA ARRA

Title IA
Title IIA
Title IA Neglected
Title III
Title ID
Title VIII
Title VII
JOM
Carl D. Perkins
IDEA
Federal Program Funding Sources FY 12

Local Funding Streams and our Building Fund
• District I-001 has a valuation of $47,873,402
• Building fund accrues 5 mills annually for Building Fund revenue
Total Building Fund receipts from local Ad-Valorem:
$239,367.01

Liberty Elementary1966

Eastside Elementary1975

Tommie Spear Middle School1962

Sallisaw High School1987

FY 11 Expenditures
Instruction
Administrative Services
Support Services76%
19%
5%
$14,459,955.41
81% of total Expenditures are in Salary
Where do the Funds Go?

.
What’s new at the Federal Level?
•Reauthorization of NCLB~ESEA


SALLISAW SCHOOLS (K-12) 1298 1346 1345 1184 1203
EASTSIDE 1365 1406 1418 1214 1242
LIBERTY 1262 1362 1391 1031 1174
TOMMIE SPEAR 1329 1383 1365 1244 1268
SALLISAW HS 1186 1267 1302 1114 1029
API Scores 2007 2008 2009 2010 2011

School Grade Span OSTP School Academic Completion Excellence K-12 District K-12 80% 10% 10% High School 9-12 80% 10% 10% TSMS 6-8 90% 10% N/A Eastside 3-5 90% 10% N/A Liberty K-3 90% 10% N/A
How is the Academic Performance Index (API) Calculated?

Sallisaw Public SchoolsAPI comparison to State Avg.
2007 2008 2009 2010
Sallisaw 1298 1346 1345 1184
State 1252 1279 1289 1092
Points Above
State Avg. 46 67 56 92

Composite-------- 20.8 State Avg. (20.7)
English------------- 21.3 Math----------------- 19.1 Reading ----------- 21.6 Science ------------ 20.5
.
Sallisaw ACT Scores


.
What’s new at the State Level?
•SB 346•HJR 1002•HB 1456•Common Core State Standards

.
Common Core State StandardsPartnership for Assessment of Readiness for
College and Careers
48 of 50 States are Participating in CCSS24 States are members of PARCC

.
What’s new locally?
oIncreased Instructional timeoEnhanced focus on literacyoNew technologyoScholarship assistance, PFL ClassoWebsite

.