demography, nest site selection, and physiological and ... · audrey derose-wilson abstract there...
TRANSCRIPT

Demography, Nest Site Selection, and Physiological and Behavioral Responses to Overflights
and other Human Activities, of Wilson’s Plover (Charadrius wilsonia) at Cape Lookout
National Seashore, North Carolina
Audrey DeRose-Wilson
Thesis submitted to the faculty of Virginia Polytechnic Institute and State University in
partial fulfillment in partial fulfillment of the requirements for the degree of
Master of Science
In
Fisheries and Wildlife
James D. Fraser
Sarah M. Karpanty
Jeffrey R. Walters
September 12, 2012
Blacksburg, VA
Keywords: behavior, Charadrius wilsonia, disturbance, habitat selection, heart rate, overflights,
reproduction, Wilson’s Plover
Copyright 2012, Audrey DeRose-Wilson

Demography, Nest Site Selection, and Physiological and Behavioral Responses to Overflights
and other Human Activities, of Wilson’s Plover (Charadrius wilsonia) at Cape Lookout
National Seashore, North Carolina
Audrey DeRose-Wilson
ABSTRACT
There is little information on demographic trends of, or threats to the Wilson’s Plover
(Charadrius wilsonia), despite concerns that habitat degradation may be causing the species to
decline. I studied Wilson’s Plover demography, nest site selection, and physiological and
behavioral responses to overflights at Cape Lookout National Seashore, North Carolina, where
the National Park Service and U.S. Marine Corps recently lowered the altitude for overflights at
tactical speeds. I monitored the responses of incubating Wilson’s Plovers to overflights and other
human activities and compared heart rate, incubation rate, and vigilance behaviors during time
periods with and without these stimuli. I compared habitat use vs. availability at the island-scale,
and nest placement relative to geomorphic features and vegetative cover, both on a local and
island-wide scale. Wilson’s Plovers increased vigilance during military rotary-wing and civilian
fixed-wing overflights, but not during military fixed-wing overflights. Plovers were vigilant
more and incubated less when researchers were present. Wilson’s Plovers selected for interdune
areas, flats and isolated dunelets on flats, and against beach and dunes. At the local scale, nests
were more likely to be near dense vegetation than random points. Mayfield nest survival was
25%, and predation caused most of the nest failure. Daily nest survival was negatively correlated
with nest age and initiation date. Nests with cameras and heart rate monitors had lower survival,
and nests with predator exclosures had

iii
higher survival. The mean number of chicks fledged per pair was 0.78.

iv
ACKNOWLEDGEMENTS
Funding for this study was provided by the United States Marine Corps in cooperation
with the National Park Service. I would like to thank Carmen Lombardo, Marine Corps Air
Station (MCAS) Cherry Point, for sponsoring and supporting my research, along with Dave
Plummer, Marine Corps Air Stations East, for extensive support. I would also like to thank
Jessica Guilianelli, James Riemer, John Greene, Edward Minchin, Kenneth Cobb, Linette King,
Robert Harvey, Carlos Garcia, and others from MCAS Cherry Point who provided radar data and
supported this project in many other ways.
I want to acknowledge Daniel Mennit, Damon Joyce and Kurt Fristrup from the National
Park Service Natural Sounds and Night Skies Division at Ft. Collins, CO, for providing
invaluable assistance with acoustic monitoring methods, calibration and analysis. I am grateful
to the National Park Service staff at Cape Lookout National Seashore, North Carolina, especially
Michael Rikard and Jon Altman, for providing the extensive logistical and field support that
made this project possible. I am especially grateful to Michael Rikard for his calm on-the-phone
troubleshooting and on-site support of the solar and generator power system in our cabin that
was definitely not designed for the power demands we put on it. I would like to thank all of the
National Park Service biotechnicians who were so generous with field support and friendship,
Aaron Griffith, Amy Westmark, Amy Preston, Aubrie Russell, Britt Brown, Felicia Nawn, Kara
Moody, Meghann Weals, Paula Daily, and Tom Fughnan.
I am indebted to my field technicians, Aubrie Russell, Grace DeRose-Wilson and Carlene
Avalone, their hard work and dedication to this project made it successful. I am fortunate to have
had the opportunity to collaberate with fellow graduate students, Matthew Hillman and Tracy
Borneman, on the overflight portion of this research. I would like to thank Ted Simons, Tracy
Borneman, and Eli Rose with the North Carolina Cooperative Fish and Wildlife Research Unit

v
and North Carolina State University, and Matt’s tern crew technicians, Gabby Dancourt,
Chellby Killheffer, Tom Gieder, and Tyler Brown. I would also like to thank Alexis Reeder,
Bennie Johnson, Erin Heller, Kristen Booher, Meryl Friedrich and Tom Gieder, who spent
endless hours extracting video and audio data for my project.
I am grateful for the mentoring, and friendship of other members of Fraser and Karpanty
labs both past and present, Daniel Catlin, Jon Cohen, Joy Felio, James Dywer, Kacy Ray, Katy
Gieder, and Zach Farris. I would like to extend special thanks to Daniel Catlin for statistical
advice, and to Joy Felio for help with MS Access and support during my first field season.
Finally, I’d like to thank my advisor Jim Fraser, and the members of my committee, Sarah
Karpanty Jeff Walters, for their advice and assistance throughout this process.

vi
TABLE OF CONTENTS
LIST OF TABLES ..................................................................................................................... viii
LIST OF FIGURES ...................................................................................................................... x
INTRODUCTION......................................................................................................................... 1
LITERATURE CITED ............................................................................................................... 3
CHAPTER ONE. Physiological and Behavioral Responses of Wilson’s Plovers (Charadrius
wilsonia) to Overflights and other Human Activities on North Core Banks, Cape Lookout
National Seashore, North Carolina ............................................................................................. 4
ABSTRACT. ............................................................................................................................... 4
INTRODUCTION ...................................................................................................................... 5
STUDY AREA ........................................................................................................................... 7
METHODS ................................................................................................................................. 8
Field Methods ......................................................................................................................... 8
Behavior and Audio Sampling .............................................................................................. 10
Analytical Methods ............................................................................................................... 12
RESULTS ................................................................................................................................. 13
DISCUSSION ........................................................................................................................... 15
Behavior ................................................................................................................................ 15
Heart Rate ............................................................................................................................. 17
Researcher Presence.............................................................................................................. 18
MANAGEMENT IMPLICATIONS ........................................................................................ 19
ACKNOWLEDGEMENTS ...................................................................................................... 21
LITERATURE CITED ............................................................................................................. 22
TABLES ................................................................................................................................... 26
FIGURES .................................................................................................................................. 30
CHAPTER TWO. Nest Site Selection of Wilson’s Plovers (Charadrius wilsonia) on North
Core Banks, Cape Lookout National Seashore, North Carolina ............................................ 39
ABSTRACT .............................................................................................................................. 39
INTRODUCTION .................................................................................................................... 40
METHODS ............................................................................................................................... 42
Study Area ............................................................................................................................ 42
Field Methods ....................................................................................................................... 42

vii
Use versus Availability ......................................................................................................... 43
Distance Analysis.................................................................................................................. 44
RESULTS ................................................................................................................................. 46
DISCUSSION ........................................................................................................................... 48
LITERATURE CITED ............................................................................................................. 51
TABLES ................................................................................................................................... 54
FIGURES .................................................................................................................................. 59
CHAPTER THREE. Demography of Wilson’s Plovers (Charadrius wilsonia) on North Core
Banks, Cape Lookout National Seashore, North Carolina ..................................................... 61
INTRODUCTION .................................................................................................................... 62
METHODS ............................................................................................................................... 63
Study Area ............................................................................................................................ 63
Analytical Methods ............................................................................................................... 66
RESULTS ................................................................................................................................. 68
Nest Survival ......................................................................................................................... 68
Chick Survival ...................................................................................................................... 69
DISCUSSION ........................................................................................................................... 70
Nest Survival ......................................................................................................................... 70
Chick Survival ...................................................................................................................... 75
LITERATURE CITED ............................................................................................................. 79
TABLES ................................................................................................................................... 85
FIGURES .................................................................................................................................. 92
CONCLUSION ........................................................................................................................... 96
LITERATURE CITED ............................................................................................................. 99
APPENDIX A. Wilson’s Plover (Charadrius wilsonia) supplemental figures for
physiological and behavioral responses to overflights, Chapter 1. ...................................... 100
APPENDIX B. Wilson’s Plover (Charadrius wilsonia) supplemental information on
distributional response to Core MOA overflights, Chapter 2. ............................................. 104

viii
LIST OF TABLES
Chapter One
Table 1. Mean proportion of time spent incubating and alert, and scanning frequency by
Wilson’s plover (Charadrius wilsonia) for 5 min before an overflight, during the overflight, and
for 5 min after the overflight for Core MOA flights, non-Core MOA military fixed-wing flights,
civilian fixed-wing flights, military and civilian rotary-wing flights, with relevant data subsets by
maximum sound pressure level, at North Core Banks, Cape Lookout National Seashore, NC,
USA, April–August 2010–2011.................................................................................................... 26
Table 2. Mean proportion of time spent incubating and alert, and scanning frequency by
Wilson’s plover (Charadrius wilsonia) when researchers were present vs. absent, at North Core
Banks, Cape Lookout National Seashore, NC, USA, April–August 2010–2011. ........................ 28
Chapter Two
Table 1. Proportion of use (Pu) vs. availability (Pa) and Bonferronized 95% confidence intervals
on proportion of use (Pu) for different substrates used by nesting Wilson’s Plovers (Charadrius
wilsonia; n=108) at Cape Lookout National Seashore, North Carolina, 2010–2011. Use was
defined as number of nests initiated in each type of substrate. Selection for (+), against (-) and no
selection (=) each substrate is shown in final column.. ................................................................ 54
Table 2. Top-ranked models (ΔAICc ≤ 2.00) from 14 single-and multi-variable logistic
regressions for an island-scale analysis of habitat characteristics at Wilson’s Plover (Charadrius
wilsonia) nest sites (n=108 nests) and random unused points (n = 100 points) on North Core
Banks, Cape Lookout National Seashore, North Carolina, 2010–2011. ...................................... 55
Table 3. Model-averaged parameter estimates and 95% confidence limits from the four top-
ranked models (ΔAICc ≤ 2.00) from 14 single-and multi-variable logistic regressions for an
island-scale analysis of habitat characteristics at Wilson’s Plover (Charadrius wilsonia) nest sites
(n=108 nests) and random unused points (n = 100 points) on north Core Banks, Cape Lookout
National Seashore, North Carolina, 2010–2011. ......................................................................... 56
Table 4. Top-ranked models (ΔAICc ≤ 2.00) from 14 single-and multi-variable logistic
regressions for a local-scale analysis of habitat characteristics at Wilson’s Plover (Charadrius
wilsonia) nest sites (n=108 nests) and random unused points (n=84 points) at sites used by
nesting Wilson’s Plovers on North Core Banks, Cape Lookout National Seashore, North
Carolina, 2010–2011. .................................................................................................................... 57
Table 5. Model-averaged parameter estimates and 95% confidence limits from the seven top-
ranked models (ΔAICc ≤ 2.00) from 14 single-and multi-variable logistic regressions for a local-
scale analysis of habitat characteristics at Wilson’s Plover (Charadrius wilsonia) nest sites
(n=108 nests) and random unused points (n =84 points) at sites used by nesting Wilson’ s
Plovers on north Core Banks, Cape Lookout National Seashore, North Carolina, 2010–2011. .. 58

ix
Chapter Three
Table 1. Demographic estimates and standard errors for Wilson’s Plovers (Charadrius wilsonia)
at Cape Lookout National Seashore in 2010 and 2011. Estimates are missing for some
parameters in 2010 because we lacked sufficient sample size (laying and incubation days), or
because we did not monitor all broods (chick hatched and fledged/pair). Sample size of nests,
chicks, and pairs used in calculating estimates in parentheses after value.. ................................. 85
Table 2. Nest fates and causes of failure for Wilson’s Plovers (Charadrius wilsonia) at Cape
Lookout National Seashore in 2010 and 2011. Failure cause was identified from camera footage
or physical signs. ........................................................................................................................... 87
Table 3. Nest predators of Wilson’s Plovers (Charadrius wilsonia) at the north and south end of
North Core Banks, Cape Lookout National Seashore in 2010 and 2011. Predators were identified
on camera and/or by physical signs. Percent represents the percentage of all nests for a year
depredated by each predator species. ............................................................................................ 88
Table 4. Top-ranked models for examination of factors affecting daily nest survival of Wilson’s
Plover (Charadrius wilsonia) nests at Cape Lookout National Seashore, North Carolina, 2010-
2011. We constructed the top model in three stages starting with time and equipment effects,
then adding vegetation effects, and finally a location effect. Model sets with 80% of model
weight and composed of models that were > 3 ΔAICc values from competing models served as
template models for following stages. The presence of an artificial egg heart rate monitor is
indicated by the variable “HR monitor”. Location distinguishes sites at the northern end of the
island from sites at the southern end of the island. K = no. of parameters.. ................................. 89
Table 5. Parameter estimates, standard error, log-odds ratios, and 95% confidence intervals from
the best model predicting Wilson’s Plovers (Charadrius wilsonia) nest survival (N=107 nests) at
Cape Lookout National Seashore, North Carolina, 2010-2011. The presence of an artificial egg
heart rate monitor is indicated by the variable “HR monitor”. Location distinguishes sites at the
northern end of the island from sites at the southern end of the island. ....................................... 90
Table 6. Top-ranked models (90% of QAICc weights) estimating resight rate (p) and apparent
daily survival rate (φ) for Wilson’s Plover (Charadrius wilsonia) chicks at Cape Lookout
National Seashore, North Carolina, 2010–2011. ......................................................................... 91

x
LIST OF FIGURES
Chapter One
Figure 1. North Core Banks, Cape Lookout National Seashore, North Carolina with 5 nesting
areas of Wilson’s plovers in 2010 and 2011 (top plate) and a detailed view of the 4 sites with the
most Wilson’s plover nests during this study; North Portsmouth Flats, South Portsmouth Flats,
Old Drum Inlet, and New Drum Inlet. .......................................................................................... 30
Figure 2. Core Military Operations Area (shaded in yellow), and adjacent airspaces, R-5306A
and W-122, at Cape Lookout National Seashore, NC. ................................................................. 31
Figure 3. Maximum equivalent average peak energy level of the loudest 1 sec interval for the
period sampled (LEQmax) of overflights (sample sizes above box plots) recorded from digital
audio recorders at Wilson’s plover (Charadrius wilsonia) at North Core Banks, Cape Lookout
National Seashore, NC 2010-2011. The boxes represent the values from the lower to upper
quartile (25th
to 75th
percentiles). The middle horizontal line represents the median, and the ends
of the vertical lines represent the maximum and minimum values. Audio data were calibrated
and post-processed using Larson Davis 831 Sound Level Meters, and A2NVSPL and Acoustic
Monitoring Toolbox software programs (Natural Sounds Program, US National Park Service). 32
Figure 4. Mean proportion of time Wilson’s plovers were incubating (out of total time possible)
pre, during, and post overflight event that occurred over North Core Banks, Cape Lookout
National Seashore, NC, 2010-2011. The numbers above symbols indicate sample size. ............ 33
Figure 5. Mean proportion of time Wilson’s plovers were alert pre, during, and post overflight
events that occurred over Cape Lookout National Seashore, NC, 2010-2011. The numbers above
symbols indicate sample size. *Indicates p < 0.05 for MRBP test among pre, during and post
samples. ......................................................................................................................................... 34
Figure 6. Mean scan frequency for Wilson’s plovers pre, during, and post overflights that
occurred at North Core Banks, Cape Lookout National Seashore, NC, 2010-2011. The numbers
above symbols indicate sample size. *Indicates p < 0.05 for MRBP test among pre, during and
post samples. ................................................................................................................................. 35
Figure 7. Mean proportion of time spent incubating and alert, and scanning frequency were not
different from pre and post samples during loud overflights (> 80dBA LEQmax) by Wilson’s
plovers at North Core Banks, Cape Lookout National Seashore NC, 2010-2011. ....................... 36
Figure 8. Proportion of frames Wilson’s plovers were incubating and alert, and scanning
frequency of Wilson’s plovers during periods when researchers were present vs. absent at a
nesting site at Cape Lookout National Seashore, NC, 2010-2011. The numbers above symbols
indicate sample size. *Indicates p < 0.05. ..................................................................................... 37
Figure 9. Heart rate was negatively correlated with ambient temperature (R2
= 0.44, p < 0.01,
RMSE =125.15, heart rate = 1119.46 – 20.71*temperature) for incubating Wilson’s plover at
North Core Banks, Cape Lookout National Seashore, NC, 2010-2011........................................ 38

xi
Chapter Two
Figure 1. North Core Banks, Cape Lookout National Seashore, North Carolina with five nesting
sites of Wilson’s Plovers (Charadrius wilsonia) in 2010 and 2011, and a detailed view of the
four largest nesting sites: North Portsmouth Flats, South Portsmouth Flats, Old Drum Inlet, and
New Drum Inlet. ........................................................................................................................... 59
Figure 2. Seventy-three habitat transect sampled at 100 m intervals on North Core Banks, Cape
Lookout National Seashore, North Carolina in May 2010. Transects were spaced 500 m apart
along the entire island, and each transect covered a cross section of the island, starting on the
beach side of the primary dunes, and running toward the sound. We recorded percent vegetative
cover and general habitat type (beach, dunes, dunelet, flat, marsh, interdune, or vegetated flat)
within a 1x1 m2 quadrat every 100 m on the transects. We ended transects when we encountered
continuous, dense (> 75% vegetative cover) vegetation.We marked each sample point with a
GPS unit (Garmin International, Olathe KS), and projected these points along with associated
habitat information on 2009 aerial imagery in ArcGIS (Environmental Systems Research
Institute, Redlands, CA) to digitize a layer of potentially suitable habitat. .................................. 60
Chapter Three
Figure 1. North Core Banks, Cape Lookout National Seashore, North Carolina with five nesting
sites of Wilson’s Plovers (Charadrius wilsonia) in 2010 and 2011, and a detailed view of the
four largest nesting sites: North Portsmouth Flats, South Portsmouth Flats, Old Drum Inlet, and
New Drum Inlet. ........................................................................................................................... 92
Figure 2. Hatch dates for Wilson’s Plover (Charadrius wilsonia) nests at Cape Lookout National
Seashore, North Carolina, 2010–2011. ......................................................................................... 93
Figure 3. Number of days for Wilson’s Plover (Charadrius wilsonia) to complete a clutch at
Cape Lookout National Seashore, North Carolina, 2010–2011. We calculated the incubation
period as the time from the laying of the final egg to the date the first chick hatched. ................ 94
Figure 4. Resight rate for Wilson’s Plover (Charadrius wilsonia) chicks at Cape Lookout
National Seashore, North Carolina, 2010–2011. .......................................................................... 95
Appendix A Figure 1. Wilson’s Plover (Charadrius wilsonia) nest bowl with eggs and Reconyx PC90 camera
in wooden box at Cape Lookout National Seashore, North Carolina. ........................................ 100
Figure 2. a) Artificial heart rate monitor egg (top center egg) in a Wilson’s Plover (Charadrius
wilsonia) nest with three real eggs at Cape Lookout National Seashore, North Carolina. b) The
digital voice recorder was attached to the artificial egg and buried in a waterproof case 1–2 m
from the nest. .............................................................................................................................. 101
Figure 3. Wilson’s Plover (Charadrius wilsonia) on nest in at Cape Lookout National Seashore,
NC, a) alert upright posture, b) alert hunkered posture, and c) relaxed posture. ........................ 102

xii
Figure 4. Spectral frequency display of a series of Wilson’s Plover (Charadrius wilsonia) heart
beats over 6 seconds; a 6 s interval is shown here so that the heart beats can be magnified and
visible, but sampling was done for three 20 s intervals pre, during, and post overflight. A single
heart beat is shown in the white oval. ......................................................................................... 103
Appendix B
Figure 1. Lines depicting all Core Military Operations Area (MOA) overflight paths as provided
to us by the U.S. Marine Corps (USMC) Cherry Point in 2010 (dark line) and 2011 (light line). A
subset of these overflights was used in the analyses as not every overflight occurred during the
active nesting period for Wilson’s Plovers, or over North Core Banks, our study area within
Cape Lookout National Seashore, NC. Lines are estimated flight paths and were constructed by
drawing a straight line between the entry and exit Core MOA coordinates provide by the USMC.
..................................................................................................................................................... 105

1
INTRODUCTION
The Wilson’s Plover (Charadrius wilsonia) is a shorebird that occurs along the Atlantic and
Pacific coasts of the Americas (Corbat and Bergstrom 2000). It is designated nationally and
regionally as a Bird of Conservation Concern by the U.S. Fish and Wildlife Service (USFWS
2008). The U.S. Shorebird Conservation Plan listed Wilson’s Plovers as a Species of High
Concern for the Southeastern Coastal-Plains Caribbean Region (Prioritization Category 4, Brown
et al. 2001). The population is estimated at 6,000 individuals in North America, however low
confidence is placed in this estimate (Corbat and Bergstrom 2000, Brown et al. 2001).
Population declines have been documented for other coastal temperate-zone breeding plovers,
such as the Piping Plover (Charadrius melodus, Cairns and McLaren 1980) and Snowy Plover
(Charadrius nivosus; Powell 2001), but there have been no broad-scale, systematic studies of
Wilson’s Plover population trends (Brown et al. 2001).
Loss of undisturbed coastal habitat has been implicated in the decline of many shorebird
populations and it is suspected that Wilson’s Plovers are also vulnerable to this habitat loss
(Foster et al. 2009). In North Carolina, only 48 km of the 480-km coastline are not exposed to a
roadway, beach driving and/or beach nourishment projects (NCWRC 2005). Even on these
undeveloped beaches, plovers are exposed to recreational motorized vehicles, pedestrians, dogs,
researchers and monitors, and aircraft traffic. Cape Lookout National Seashore (CALO) is one
of these few remaining uninhabited barrier island systems in central North Carolina and is
located about 1.5 km offshore. The island had no permanent residents during my study, but the
NPS managed guest cabins and service facilities available for use by the public. The islands were
accessible via public car/person ferries and by private vessel. Motorized vehicles, including all-
terrain vehicles (ATVs) and off-road vehicles (ORVs), were allowed to drive on the beach.

2
At CALO, the U.S. Marine Corps (USMC) and National Park Service (NPS) recently
altered human activities by agreeing to lower the permitted altitude for tactical speed (>250 kts)
operations from 3048 m (10,000 ft) to 914.4 m (3,000 ft) in the Core Military Operations Area
(Core MOA), the airspace above CALO. The floor for tactical speeds was lowered provisionally,
from May–July, 2010–2012, so that the effects on beach-nesting waterbirds could be studied.
The USMC had previously been permitted to fly at tactical speeds below 3048 m from August–
April, the nonbreeding season for CALO’s waterbirds. In addition to military aircraft using the
Core MOA airspace, other civilian and military aircraft flew below the 914 m MOA floor, and in
adjacent airspaces. When the Core MOA was not active, these aircraft could pass directly over
the island at ≥914 m altitude.
My objectives were to assess Wilson’s Plovers’ responses to military aircraft using the
Core MOA at tactical speeds, within the context of other environmental stimuli, including other
military and civilian aircraft, ORVs, ATVs, pedestrians, predators and weather events, and to
maximize the application of my data to the management needs of the National Park service and
U.S. Marine Corps. In chapter 1, I documented physiological and behavioral responses to
overflights and exposure to researchers. In chapter 2, I compared habitat characteristics between
nest sites and random-selected unused points. In chapter 3, I estimated nest survival, apparent
chick survival and productivity, and evaluated factors influencing population parameters. To
evaluate a distributional response to Core MOA overflights, I compared the distribution of
nesting Wilson’s Plovers to the distribution of Core MOA overflights in Appendix B.

3
LITERATURE CITED
Brown, S. C., C. Hickey, B. Harrington, and R. Gill. 2001. The U.S. Shorebird Conservation
Plan. Second Edition. Manomet Center for Conservation Sciences, Manomet,
Massachusetts, USA.
Cairns, W. E., and I. A. McLaren. 1980. Status of the piping plover on the east coast of North
America. Am. Birds 34:206-208.
Corbat, C. A., and P. W. Bergstrom. 2000. Wilson's Plover (Charadrius wilsonia), The Birds of
North America Online (A. Poole, Ed.). Ithaca: Cornell Lab of Ornithology, USA.
Accessed 15 March 2012.
Foster, C. R., A. F. Amos, and L. A. Fuiman. 2009. Trends in abundance of coastal birds and
human activity on a Texas barrier island over three decades. Estuaries and Coasts.
32:1079–1089.
North Carolina Wildlife Resources Commission (NCWRC). 2005. North Carolina Wildlife
Action Plan. Raleigh, North Carolina, USA
Powell, A.N. (2001) Habitat characteristics and nest success of snowy plovers associated with
California Least Tern colonies. Condor 103: 785-792
U.S. Fish and Wildlife Service (USFWS). 2008. Birds of conservation concern 2008. United
States Department of Interior, Fish and Wildlife Service, Division of Migratory Bird
Management, Arlington, Virginia. 85 pp.

4
CHAPTER ONE. Physiological and Behavioral Responses of Wilson’s Plovers (Charadrius
wilsonia) to Overflights and other Human Activities on North Core Banks, Cape Lookout
National Seashore, North Carolina
ABSTRACT.
The U.S. Marine Corps and National Park Service recently agreed to lower the altitude for
tactical speed operations from 3048 m (10,000 ft) to 914 m (3,000 ft) in the airspace above Cape
Lookout National Seashore, North Carolina. We studied the response of breeding Wilson’s
plovers to this change in aircraft traffic, within the context of other human activities, including
other overflights. We compared heart rate, incubation rate and vigilance behavior during
overflights and other human activities to time periods without those stimuli. Wilson’s plovers
increased vigilance behavior during military rotary-wing and civilian fixed-wing overflights, but
did not respond to military fixed-wing aircraft. Plovers were vigilant more and incubated less
when researchers were present. Heart rate did not change during overflights. Only 3 out of the 50
aircraft that used the lowered airspace floor during the 2 breeding seasons flew within 1.6 km of
an active Wilson’s plover nest. Therefore, we do not think that the lower altitude for tactical
speed flights, at the current level and pattern of use, impacts breeding Wilson’s plover.
KEY WORDS audio monitoring, aircraft noise, Charadrius wilsonia, disturbance, heart rate,
incubation, North Carolina, overflights, vigilance, Wilson’s plover.

5
INTRODUCTION
With a growing human population, increasing attention is being paid to the effects of human
activities, including the use of aircraft, on wildlife. Most studies of avian responses to aircraft
have been limited to raptors and waterfowl. Even within these groups, behavioral responses have
differed widely, depending on reproductive state, activity, age, exposure frequency, and species
(Kushlan 1979, Larkin 1996, Efroymson et al. 2000). Black et al. (1984) found that low-altitude
overflights by military fixed-wing aircraft caused a higher frequency of alert posture in some
species, but overall had little effect on waterbird colonies. Similarly, nesting osprey did not
exhibit behavioral responses to low-altitude military fixed-wing aircraft (Trimper 1998). Military
rotary-wing aircraft caused wintering bald eagles to flush (Stalmaster and Kaiser 1997).
Harlequin ducks responded more strongly to fixed-wing aircraft than rotary-wing aircraft
overflights (Goudie 2006), but military overflights did not alter time-activity budgets of the
wintering duck species studied by Conomy et al. (1998a). A greater percentage of Brant flocks
than Canada Geese flocks flushed during overflights, and both species flushed more during
rotary-wing overflights than fixed-wing overflights (Ward 1999).
Ability to habituate to overflights appears to also be species-specific. Conomy et al.
(1998b) found that black ducks habituated to overflights, but wood ducks did not. Red-tailed
hawks reacted more strongly to overflights immediately after they were introduced, than they did
later (Anderson et al 1986). Several studies have found that intensity of response was correlated
with lateral distance, and perhaps to a lesser degree, with altitude (Ellis 1991, Delaney 1999, and
Ward 1999).
Aircraft are a significant source of noise in remote and protected areas. As environments
free of anthropogenic noise become increasingly rare, understanding how wildlife perceive and
respond to noise stimuli is important for effective management of protected areas (Barber et al

6
2011, Lynch et al. 2011, Ortega 2012). Possible responses to noise include shifts in habitat use to
avoid noisy areas, vocalization shifts, and behavioral changes such as fleeing in response to noise
stimuli, increased vigilance, and physiological stress responses. Wildlife may perceive noise as a
signal of predation risk and increase their investment in antipredator behavior at a cost to other
activities (Frid and Dill 2002). Noise can mask vocal signals and cause behavioral changes that
divert time and energy away from foraging, or reproductive behaviors (Ortega 2012, Schroeder
et al. 2012). Physiological stress is energetically costly and can impair body condition and
decrease reproductive success (Cyr and Romero 2007, Blickley and Patricelli 2010).
At Cape Lookout National Seashore, NC (CALO, Fig. 1) the U.S. Marine Corps (USMC)
and National Park Service (NPS) agreed to lower the altitude for tactical speed operations (>250
kts) from 3048 m to 914 m in the Core Military Operations Area (Core MOA, Fig. 2), the
airspace situated over a portion of CALO. The floor for tactical speeds was lowered
provisionally, from May–July 2010–2012, so that the effects of low altitude tactical speed
military overflights on beach-nesting shorebirds could be studied. We studied the impact of
overflights and other human activities on the Wilson’s plover, one of 6 state-protected bird
species in North Carolina. The USMC already had permission to use the 914 m floor from
August–April, when shorebirds were not breeding on CALO.
Our research objectives were 1) to compare incubation and vigilance behavior during
overflights to time periods with no overflights, 2) to compare heart rate during overflights to time
periods with no overflights, and 3) to compare incubation and vigilance behavior when
researchers were present to time periods when researchers were absent.

7
STUDY AREA
Cape Lookout National Seashore (34° 23’ N, 76° 17’ W, Fig. 1) is located between Ocracoke
Island and Beaufort, NC, USA and is part of the barrier island ecosystem that extends along
much of the Atlantic seaboard from Massachusetts to Florida. The islands routinely change in
shape and number due to wind, waves and currents. During the study, CALO included the
islands of North Core Banks (NCB), South Core Banks (SCB), and Shackleford Banks (SFB),
which had about 90 km of ocean shoreline. Cape Lookout National Seashore had no permanent
residents, but NPS managed guest cabins and service facilities available for use by the public.
The islands were accessible via public car/person ferries and by private vessel. Motorized
vehicles, including all-terrain vehicles (ATVs) and off-road vehicles (ORVs), were allowed to
drive on the beach. In addition to military aircraft using the Core MOA airspace, other civilian
and military aircraft flew below the 914 m Core MOA floor, and in adjacent airspaces (R-5306A
and W-122, Fig. 2); these aircraft flew at ≥ 914 m in altitude over the islands when the Core
MOA was not active. We focused our study on NCB because this island was within the Core
MOA.
Wilson’s plovers nested at 5 sites (Fig. 1) on NCB. At the northeastern end of the island,
Wilson’s plovers nested on North Portsmouth Flats (NPF) and South Portsmouth Flats (SPF).
These flats were contiguous to each other, although habitat types used for nesting differed
between the two. At NPF plovers nested primarily on a small portion of the flat covered by an
algal mat and sparse vegetation, predominately Salicornia spp. At SPF there was very little
vegetation, and plovers nested in bare sand and shell substrates at dune edges or on the open flat.
At a third site, Kathryn-Jane (KJ), about 3.5 km southwest of SPF, Wilson’s plovers nested on
the beach, and on a small vegetated flat. At the southwestern end of the island, nests were

8
associated with 2 recently closed inlets, New Drum Inlet (NDI) and Old Drum Inlet (ODI). At
both sites plovers nested in interdune areas adjacent to flats that formed when the inlets closed.
North Portsmouth Flats, SPF, NDI and ODI were all closed to the public during the
nesting season. At these sites, plovers nested mostly behind the primary duneline, and were not
exposed to beach traffic or pedestrians. At SPF, where there was not a continuous primary
duneline, the beach was wide and vehicles usually drove along the high tide line, so passing
beach traffic was distant (usually > 250 m). At KJ, birds that nested on the beach were exposed
to beach traffic.
METHODS
Field Methods
We searched for Wilson’s plovers’ nests during the nesting season (Apr–Jul) by walking
transects through all potential plover nesting habitat on North Core Banks (Fig. 1) every 3–4
days. If we observed a territorial pair or bird exhibiting nest defense, we hid in a blind or in
vegetation and waited for the bird to resume incubation. When we located a nest, we recorded its
location using a GPS unit (Garmin International, Olathe KS) and took a photograph of the nest
and surrounding vegetation. We floated all eggs from nests found with 2 or 3 eggs to estimate
incubation stage and hatch and initiation dates (Alberico 1995, Dinsmore et al. 2002).
We deployed auto-triggered cameras (Reconyx, Inc., Holmen, WI) at every nest we
found in 2010, except at NPF, where we exclosed (Melvin et al. 2002) and deployed cameras at
every other nest because we suspected that fish crows (Corvus ossifragus) were using the
cameras as cues to find and depredate nests. In 2011, we deployed cameras at every nest we
found except we used exclosures and put cameras at every other nest at NPF and SPF, because
we observed fish crows at these sites. We visually checked nests all nests every 1–3 days.
Cameras were encased in wooden housing for protection and camouflage, and placed

9
approximately 2 m from nests (Appendix A, Fig. 1). We found that a distance of about 2 m from
the nest-site was ideal for capturing detailed images of the incubating bird for behavioral
analysis. Cameras were set to take a photo every 5 secs and powered by an external battery
(Tempest Batteries, San Jose, CA) buried in a watertight container near the nest. We changed
battery units every 5–6 days in 2010 and every 4–5 days in 2011. We calibrated cameras’
internal clocks to an atomic clock at each deployment.
We recorded ambient sound and sound levels during overflights using continuously
recording Zoom H2 digital audio recorders (Samson Technologies Corp, Hauppauge, NY).
Digital audio recording units were placed in weatherproof, wind and sand screened housing, and
mounted on a wooden stake approximately 1.5 m off the ground, ≤ 150 m from nests being
monitored with cameras. In 2010, we calibrated digital recording units to an atomic clock every
4–5 days. In addition, in 2011 we placed a wristwatch, calibrated to an atomic clock, inside the
housing of each audio recorder. The wristwatches were set to sound an alarm every day at noon
to aid in synchronizing the audio and visual data.
We built heart rate monitors by soldering a microphone (Digi-Key, Thief River Falls,
MN) to an audio cable and embedding the microphone attached to one end of the cable in a
1¼’’-long plastic egg. We painted the artificial egg to look realistic and used Parafilm® to
weatherproof the embedded microphone. We connected the artificial egg microphone to a digital
voice recorder (Olympus America, Inc., Center Valley, PA). We deployed artificial egg heart
rate monitors at approximately half the nests that received cameras (Appendix A, Fig. 2a). We
attempted to deploy a heart rate monitor at every other nest with a camera. If substrate type and
dense vegetation prohibited deployment at a nest, we deployed the unit at the next nest we found.
We sealed the digital voice recorder in a waterproof dry case and buried it 1–2 m from the nest

10
(Appendix A, Fig. 2b). We did not record heart rate continuously because recorder battery life
was 26.5 hrs and we changed batteries every 1–3 days, coincident with a nest or equipment
check.
The USMC provided us with the date, time, aircraft type, velocity, and ingress/egress
coordinates of military aircraft traversing the Core MOA during the Wilson’s plover breeding
season. In addition, we opportunistically recorded the aircraft type, time, general location (site
name or nearest mile-marker), direction and estimated altitude for all types of aircraft visible
from the study area. These aircraft included military aircraft (turbofan jets, duel and single-rotor
helicopters and turboprop transport planes) and civilian aircraft (twin and single-engine
helicopters and light-weight piston-engine planes).
Behavior and Audio Sampling
We used Audio2NVSPL Audio Converter Version 1.3877 (National Park Service Sound Lab, Ft.
Collins, CO) to convert mp3 files produced by audio recorders to text files. We then used
Acoustic Monitoring Toolbox Version 1.3877 (National Park Service Sound Lab, Ft. Collins,
CO) to view the text files as a spectrogram. We used the time and location, and direction of
travel information from the USMC, or from our field observations to track aircraft throughout
the island by finding changes in intensity identifiable as overflight noise on spectrograms of
spatially sequential audio recorders.
We used two sound metrics, maximum sound pressure level (LEQmax) and sound
exposure level (SEL). The LEQ is the equivalent average peak energy level integrated over 1
sec; LEQmax is the loudest 1 sec interval for the period sampled. Sound exposure level is the total
sound energy integrated for the duration of the sample period. We quantified LEQmax and SEL in
decibels (dB) on an A-weighted scale. The A-scale is weighted for the range of frequencies

11
humans are able to hear, and the hearing range for most birds is similar to that of humans
(Dooling 1982, Meyer 1986, Beason 2004).
We sampled camera and audio data for 5 min before an overflight (hereafter pre), for the
variable time period during which the overflight was above the ambient sound level (hereafter
during), and for 5 min after an overflight (hereafter post). Observers quantifying behavior did
not know when they were sampling an overflight or a randomly selected control time with no
overflight. We included control samples in the same pre, during, post pattern as outlined above,
to avoid sampling bias that could result if observers knew that a particular sample was collected
during an overflight.
We recorded 3 behaviors: incubation (including incubating, shading, manipulating the
eggs or nest substrate, and preening on the nest bowl), posture (alert or relaxed), and frequency
of scans. We defined alert posture for as 1) alert upright (head and neck extended above back
with feathers lying flat giving the bird a slim appearance, or 2) alert hunkered (head and tail
lowered hiding white throat and undertail markings, with feathers flat (Appendix A, Fig. 3). We
defined a scan as a horizontal change in head position from one frame to the next.
For each pre, during, or post-overflight sampling period, we recorded the total number of
frames observed and the number of frames a bird incubated or exhibited alert behavior, and
estimated the proportion of time spent in each behavior. Because scanning was an instantaneous
behavior rather than behavioral state, we compared changes between frames, using the frame just
prior to a sample period as a reference for the first frame of the sample period. We then
calculated scanning frequency by dividing scans by total frames.
We compared these 3 behavioral response variables during time periods when researchers
were present vs. absent at a nesting site. Unlike the transient overflights, researcher presence

12
typically lasted several hrs, so the pre, during, and post sampling scheme was not appropriate.
Instead, we analyzed all of the pre samples collected for overflights and compared behavior
when researchers were present to behavior when researchers were absent.
We calculated heart rate for 3 20-sec intervals. One interval was during the overflight,
and the others were 5 min before and after the overflight. In some cases we could not detect a
heartbeat, likely because the bird was not in contact with the microphone, or because the sound
of wind obscured the sound of the heartbeat. If we could not detect a heartbeat during the pre or
post sample periods, but we did detect it in the during sample, we shifted the sample earlier (for
pre) or later (for post) and sampled at the first 20-sec period of detectable heart rate we
encountered. We used camera footage to verify that the bird incubated continuously between
sample periods, so that we did not sample the heart rate of recently active birds when shifting the
pre and post samples. Heart beats were counted visually in Adobe Audition (Adobe Systems,
Inc., Mountain View, CA) by 2 independent observers (Appendix A, Fig. 4). When observer
counts differed by ≤ 5, we averaged the 2 counts for analysis. We discarded samples for which
counts differed by > 5, because we deemed the audio quality to be low.
Analytical Methods
We conducted separate analyses for each aircraft type. Because we thought the loudest flights
might be more disturbing, when sample size allowed, we conducted a separate analysis for
subsets of overflights where the LEQmax was > 80dBA. We chose to subset loud flights >80dBA
LEQmax because the upper 70dBA-80dBA range is considered annoying to humans (Pepper et al.
2003), and is presumably more disturbing to birds, as well.
We compared the proportion of time a bird spent in each behavior between pre, during,
and post-overflight time periods for each aircraft type using multi-response permutation

13
procedures for blocked data (MRBP; Blossom Version W2008.04.02, www.fort.usgs.gov,
accessed 5 May 2012). MRBP is a non-parametric permutation test that can be used in lieu of
linear models when data do not meet the assumptions of parametric tests. We used MRBP to
compare responses by group (i.e. pre, during, post) while blocking by nest. We blocked by
individual nest for all analyses, to account for possible bird-to-bird variation in response to
stimuli. When the overall MRBP test of significance among pre, during, and post-overflight
time periods for each event type was significant (p <0.05), we conducted MRBP on each pair of
groups (i.e. pre vs. during, post vs. during, and pre vs. post) to assess how the behavior differed
among the two-way comparisons.
We used multiple linear regression (SAS Institute, Inc., Cary, NC) to fit a linear model
with heart rate in beats per min as the response variable. Predictor variables were interval (pre,
during or post-overflight), LEQmax, SEL, and temperature (recorded by the nest cameras).
RESULTS
We detected 1107 overflights on spectrograms from audio data recorded during the
plover nesting seasons from April–July, 2010–2011. Many of these overflights were the result of
a single aircraft being detected on multiple recorders; based on our field records, we were able to
distinguish 745 individual overflights at 67 different nests. In addition, the USMC provided data
on 208 military aircraft using the Core MOA during the Wilson’s plover breeding season. We
detected 26 of the Core MOA overflights on at least one digital audio recorder, 11 of which were
> 3048 m. We removed 1 of the 26 audible Core MOA overflights because it was a C-130
Hercules and the sound profiles from this type of aircraft were quieter and of differing
frequencies than turbofan aircraft. This aircraft also was below tactical flight speed. Of the 25
remaining Core MOA overflights, only 1 flew within 1.6 km of nests at an altitude of ≤ 914 m,
and 2 others flew within 1.6 km of nests at an altitude of < 3048 m.

14
We recorded > 28,000 hrs of camera footage at 83 Wilson’s plover nests during the
nesting seasons in 2010 and 2011. From this footage we extracted 745 behavioral samples (each
sample consisted of a pre, during and post intervals). Blocking behavioral samples by nest
yielded 32 independent behavioral samples during Core MOA overflights, and 166 independent
behavioral samples during non-Core MOA overflights. Core MOA and non-Core MOA military
fixed-wing overflights had the highest LEQmax of all overflights detected by our recorders;
however, the median LEQmax values for military rotary-wing overflights were the loudest (Fig.
3). Military aircraft had higher median LEQmax than civilian overflights (Fig. 3).
There was no difference in time spent incubating by Wilson’s plovers between the pre,
during, and post samples for any type of overflight (p > 0.05, Table 1, Fig. 4). Plovers were alert
more during military rotary-wing overflights than in the pre-flight or post-flight periods (Table 1,
Fig. 5). Plovers scanned more during military rotary-wing overflights (Table 1, Fig. 6), and more
during the pre and during samples for civilian fixed-wing overflights (Table 1, Fig. 6). During
Core MOA overflights, plovers scanned more during the pre than post sample, but the time spent
scanning during the overflight was not different from the pre and post samples (Table 1, Fig. 6).
We found no differences in the behaviors among the pre, during, and post-overflight time
period for overflights > 80dBA (Table 1, Fig. 7). Wilson’s plovers incubated less when
researchers were present at the nesting site and were alert more while incubating with researchers
present, but there was no difference in scanning frequency when researchers were present vs.
absent (Table 2, Fig. 8).
We sampled Wilson’s plovers’ heart rate during 43 overflights at 7 different nests; no
heart rate samples were recorded during Core MOA overflights. There was no difference in
heart rate between pre, during, and post-overflight periods, nor was the heart rate related to

15
LEQmax or SEL. Heart rate was negatively correlated with temperature within the range of our
data (Fig. 9).
DISCUSSION
Behavior
Like wintering bald eagles (Stalmaster and Kaiser 1997), Wilson’s plovers exhibited the
strongest behavioral response to military rotary-wing aircraft. Because alert plovers were
typically immobile, the increase in both time spent alert and scanning frequency during rotary-
wing overflights likely subtracted cumulatively from time spent in non-vigilant activities. The
sample means for military rotary-wing overflights >80dBA showed the same trend, however, the
changes in behavior were not significant, possibly because our tests lacked power due to the
small sample size. Wilson’s plovers did not change incubation or vigilance behavior during
military fixed-wing overflights. Although we saw a significant decrease in scanning frequency in
the post sample compared to the pre sample for Core MOA overflights, it seems unlikely that
this change was a response to the overflight, as we did not see this trend with other military
fixed-wing overflights. On average, Core MOA overflights were among the most distant (altitude
and lateral distance) because USMC data provided a record of overflights that we may not have
detected in the field.
There is no clear trend in how birds respond to rotary-wing aircraft compared to fixed-
wing aircraft (Efroymson 2000). The noise from rotary-wing aircraft is fundamentally different
from that of fixed-wing aircraft because, in addition to the engine noise, the rotors cause
vibrations that propagate differently than sound pressure waves (Larkin 1991). As with most
other studies of aircraft disturbance (Conomy et al. 1998b, Trimper et al. 1998, Ward et al. 1999,
Goudie 2006), noise and visual cues were confounded in our study. The increase in scanning
frequency before and during civilian fixed-wing overflights may be because plovers were

16
responding to the aircraft itself, rather than the overflight noise. We often saw small low-altitude
aircraft before hearing them, and birds, which are thought to have higher visual acuity than
humans (Gill 2007), probably detected this type of aircraft visually before the overflight noise
reached the recording unit. Most of the civilian fixed-wing air traffic at CALO was from piston-
engine prop planes giving air tours of the National Seashore.
We do not expect that the increases in time spent alert and scanning frequency we
documented impacted demographic parameters in the population of Wilson’s plovers we studied,
especially considering the low frequency of exposure to overflights relative to other
environmental stimuli. However, the link between noise and behavioral and demographic
responses can be complex and subtle. For example, noise can disrupt communication between
mates, weakening the pair bond, and between chicks and parents, changing provisioning rates
(Habib et al. 2007, Slabbekoorn and Ripmeester 2008).
Few studies have measured both behavioral and demographic responses to overflights. A
study of raptors did not find a link between a behavioral response (flushing) and decreased
reproduction or survival (Anderson et al. 1986). However, like most ground-nesting shorebirds,
and unlike raptors, Wilson’s plovers rely primarily on secrecy and the cryptic coloration of their
eggs and body to protect their nests from predators. Thus, even a small increase in bird
movement on or near the nest may increase the risk of being detected by a predator. Ground-
nesting, cryptic shorebirds often do not flush from the nest when presented with an
environmental stimulus. For example, we photographed plovers that continued to incubate while
raccoons investigated the camera several meters away, and only flushed when the raccoon
approached the nest directly. Given that plovers respond to threats to their nest in general by

17
remaining immobile until detection seems certain, they may not incubate less due to overflights,
even if they perceive them as threatening.
Heart Rate
Measures of heart rate have been used in conjunction with behavioral monitoring as an additional
index of response to environmental stimuli (Nimon et al. 1996, Stout and Schwab 1980). The
fact that heart rate did not increase during overflights, and the lack of relationship between heart
rate and LEQmax or SEL, is further evidence that plovers did not perceive overflights as
threatening. However, we were unable to sample heart rate during the loudest overflights
because the overflight noise overwhelmed the sound of the heart beats on our recorders. Since
low-altitude Core MOA overflights rarely occurred near Wilson’s plover nests, even if they
elicited a transient heart rate response, it likely contributed little to the stress these birds face
from other, more common, environmental stimuli.
To our knowledge, this the first study to use artificial egg heart rate monitors to record
the heart rate of a species as small as the Wilson’s plover for extended periods in the field. Our
design was based on a heart rate monitor built by Arnold et al. (2011) to monitor the heart rate of
larger waterbird species. Our device cost <$5 (not including the mp3 recorder), and was simple
to construct. Wilson’s plover readily accepted the dummy egg, and sometimes continued to
incubate it after the nest was predated.
Wilson’s plover heart rate ranged from 180 to 708 beats per min. The birds we sampled
were apparently below their thermoneutral zone (i.e. the temperature range at which no energy is
expended to maintain body temperature), because heart rate was inversely correlated with
ambient temperature, indicating that plovers increased heart rate to maintain body temperature at
lower ambient temperatures. Avian temperatures are generally higher than mammalian

18
temperatures and are correlated with body mass, taxonomic group, behavior and environmental
conditions (McNab 1966). We are not aware of any literature documenting body temperature for
Wilson’s plover, but body temperature is about 40°C for the golden plover, (Krijgsveld et al.
2003), a plover of slightly larger size that breeds in the Arctic and subarctic tundra. Although we
documented ambient temperatures up to 53°C, we could not sample heart rate at these
temperatures because plovers shaded their nests to allow airflow to help cool their eggs, and our
heart rate monitors were not sensitive enough to record heart rate without direct contact.
Temperature was recorded by the Reconyx cameras, which were in contact with the sand, thus
recorded temperatures often exceeded the air temperature
Researcher Presence
For the most part, Wilsons’ Plovers nested behind the primary dune line in areas designated as
breeding bird sanctuaries by the NPS. These areas were closed to all motorized vehicles and to
pedestrians. NPS staff and researchers were allowed into these areas on foot for the purpose of
monitoring and conducting research. With the exception of 4 birds that nested on the front beach,
and 3 birds that were exposed to motorized vehicles when a roadway was opened behind the
dunes after nests were established, plovers were not regularly exposed to human activities, aside
from researchers.
Based on our observations, Wilson’s plovers were highly responsive to human presence,
although they were probably more sensitive to researcher presence than they would have been to
humans that did not approach their nests. It is not surprising that we saw a decrease in incubation
and an increase in time spent alert when researchers were present because we visited sites to
check nests and change and deploy nest monitoring equipment. We did not have information on

19
when other research teams and NPS staff were in nesting sites, so these results pertain only to
Wilson’s plover researchers.
MANAGEMENT IMPLICATIONS
Our data suggest that overflights from Core MOA aircraft, in the patterns of time, location,
altitude and frequency observed during this study, do not pose a threat to the nesting Wilson’s
plovers at Cape Lookout National Seashore. Because our sample size for overflights near the
floor of the Core MOA was limited, we were not able to directly assess the impacts of these
overflights on Wilson’s plover behavior or physiology. However, only 3 Core MOA aircraft flew
within 1.6 km of the Wilson’s plover nest during the 2-year study and the lack of exposure
suggests that, currently, the lowered floor is not detrimental to Wilson’s plovers. The fact that we
did not see changes in behavior during non-Core MOA military fixed-wing overflights further
suggests that an increase in low altitude overflights would be unlikely to cause behavioral
changes that would result in a demographic response. Low altitude rotary-wing aircraft elicited
the greatest behavioral response. Although we do not believe that the transient increase in
vigilance observed during these flights was likely to have affected survival or reproductive
success, a substantial increase in rotary-wing air traffic at Cape Lookout National Seashore
would merit further investigation.
Additionally, it appears that ongoing management by the NPS, coupled with the
distribution of nesting Wilson’s plovers on NCB, provides an adequate buffer to protect plovers
from demographic responses to humans using the beach. At present, the NPS does not close
areas to protect the Wilson’s plover nesting habitat, however, piping plover and colonial
waterbird nesting area closures protect most of the areas where Wilson’s plovers breed. Wilson’s
plovers that nested on the beach at KJ were not protected unless least terns (Sternula antillarum)
established a colony at that site, which happened in both years, although the tern colony was

20
established after Wilson’s plovers began nesting at the site in both years. The interdune area
south of Old Drum Inlet that was used by Wilson’s plovers was not closed to the public, however
beachgoers seldom used this area unless the front beach was closed due to piping plover
breeding activity, resulting in vehicle traffic being routed to a roadway behind the dunes, as
happened in 2011.

21
ACKNOWLEDGEMENTS
Funding for this study was provided by the United States Marine Corps in cooperation with the
National Park Service and the Federal Aviation Administration related to operation of the Core
Military Operations Area over Cape Lookout National Seashore. We thank Carmen Lombardo,
Marine Corps Air Station (MCAS) Cherry Point, for sponsoring and supporting this research
effort, along with D. Plummer, Marine Corps Air Stations East, for extensive support. We thank
J. Guilianelli, J. Riemer, J. Greene, E. Minchin, K. Cobb, L. King, R. Harvey, C.R. Garcia, and
others from MCAS Cherry Point who provided radar data and supported this project in many
other ways. We thank National Park Service staff at Cape Lookout National Seashore, including
M. Rikard and J. Altman for extensive logistical support and A. Westmark, A. Preston, P.
Dailey, and T. Faughnan for field support. We thank the National Park Service Natural Sounds
and Night Skies Division, Ft. Collins, CO, especially D. Mennit, D. Joyce, and K. Fristrup, for
assisting with acoustic monitoring methods and analysis. We thank T. Simons, T. Borneman,
and E. Rose with the North Carolina Cooperative Fish and Wildlife Research Unit and North
Carolina State University for their field assistance and collaboration on the larger study. We are
indebted to E. Heller, M. Friedrich, A. Russell, G. DeRose-Wilson, K. Booher, B. Johnson, A.
Reeder, and T. Gieder, who spent endless hours in the field and laboratory in support of this
project.

22
LITERATURE CITED
Alberico, J. A. R. 1995. Floating eggs to estimate incubation stage does not affect hatchability.
Wildlife Society Bulletin. 23:212–216.
Andersen, D. E., O. J. Rongstad, and W. R. Mytton, 1986. Response of nesting red-tailed hawks
to helicopter overflights. Condor. 91:296–299.
Arnold, J. M., R. Ordonez, D. A. Copeland, R. Nathan, J. M. Scornavacchi, D. J. Tyerman, and
S. A. Oswald. 2011. Simple and inexpensive devices to measure heart rates of
incubating birds. Journal of Field Ornithology. 82: 288–296
Barber, J. R., C. L Burdett, S. E. Reed, K. R Crooks, D. M. Theobald, and K. M. Fristrup. 2011.
Anthropogenic noise exposure in protected natural areas: estimating the scale of
ecological consequences. Landscape Ecology. 26: 1281–1295.
Beason, R. C. 2004. What Can Birds Hear? USDA Wildlife Services staff publication.
University of Nebraska, Lincoln, NE, USA
Black, B. B., M. W. Collopy, H. F. Percival, A. A. Tiller and P. G. Bohall. 1984. Effects of low
level military training flights on wading bird colonies in Florida. Technical Report no. 7.
Florida Cooperative Fish and Wild1ife Research Unit, School of Forest Resources and
Conservation, University of Florida, Gainesville, Florida, USA.
Blickley, J. L., and G. L. Patricelli. 2010. Impacts of anthropogenic noise on wildlife: Research
priorities for the development of standards and mitigation. Journal of International
Wildlife Law and Policy. 13:274–292.
Conomy, J. T., J. A. Collazo, J. A. Dubovsky, and W. J. Fleming. 1998a. Dabbling duck
behavior and aircraft activity in coastal North Carolina. Journal of Wildlife Management.
62:1127–1134.

23
Conomy, J. T. et al., 1998b. Do Black Ducks and Wood Ducks habituate to aircraft disturbance?
The Journal of Wildlife Management, 62: 1135–1142.
Cyr, N. E. and L. M. Romero. 2007. Chronic stress in free-living European starlings reduces
corticosterone concentrations and reproductive success. General and Comparative
Endocrinology. 151:82–89
Delaney, D. K., T. G. Grubb, P. Beier, L. L. Pater, and M. H. Reiser. 1999. Effects of helicopter
noise on Mexican Spotted Owls. Journal of Wildlife Management 63:60–76.
Dinsmore, S. J., G. C. White, and F. L. Knopf. 2002. Advanced techniques for modeling avian
nest survival. Ecology. 83:3476–3488.
Dooling, R. J. 1982. Auditory perception in birds. Pages 95–130 in Acoustic Communication in
Birds, vol. 1 (D. E. Kroodsma and E. H. Miller, Eds.). Academic Press, New York.
Efroymson, R. A., W. Hodge Rose, and G. W. I. Suter. 2000. Ecological risk assessment
framework for low-altitude overflights by fixed-wing and rotary-wing military aircraft.
Ellis, D. H., C. H. Ellis and D. P. Mindell. 1991. Raptor responses to low-level jet aircraft and
sonic booms. Environmental Pollution. 74:53–83
Frid, A., L. Dill. 2002. Human-caused disturbance stimuli as a form of predation risk.
Conservation Ecology. 6: 94–109.
Gill, F. B. 2007. Senses, brains and intelligence: vision. Pages 184–191 in Ornithology. Third
edition. WH Freeman and Company, New York, USA.
Goudie, R. I. 2006. Multivariate behavioural response of harlequin ducks to aircraft disturbance
in Labrador. Environmental Conservation. 33:28–35.
Habib, L., E. M. Bayne, and S. Boutin. 2007. Chronic industrial noise affects pairing success and
age structure of Ovenbirds Seiurus aurocapilla. Journal of Applied Ecology 44:176–184.

24
Krijgsveld, K. L., J. W. H. Reneerkens, G. D. McNett, and R. E. Ricklefs. 2003. Time budgets
and body temperature of American Golden-Plover chicks in relation to ambient
temperature. Condor. 105:268–278
Kushlan, J. A. 1979. Effects of helicopter censuses on wading bird colonies. Journal of Wildlife
Management. 43:756–760.
Larkin, R. P., 1991. Effects of military noise on wildlife: a literature review. U.S. Army Corps
of Engineers Technical Report 96/21.
Lynch, E., D. Joyce, and K. Fristrup. 2011. An assessment of noise audibility and sound levels in
U.S. National Parks. Landscape Ecology. 26:1297–1309.
McNab, B.K. 1966. An analysis of the body temperatures of birds. Condor, 68: 47–55
Melvin, S. M., L. H. MacIvor, and C. R. Griffin. 1992. Predator exclosures: A technique to
reduce predation at Piping plover nests. Wildlife Society Bulletin, 20:143–148.
Meyer, D. B. 1986. Sense organs: the avian ear and hearing. Pages 48–58 in P.D. Sturkie editor.
Avian physiology. Fourth Edition. P.D. Sturkie, Ed., Springer-Verlag, New York, New
York, USA.
Nimon, A. J., R. C. Schroter and R. K. C. Oxenham. 1996. Artificial eggs: measuring heart rate
and effects of disturbance in nesting penguins. Physiology and Behavior. 60:1019–1022.
Ortega, C. P. 2012. Effects of noise pollution on birds : A brief review of our knowledge.
Ornithological Monographs. 74:6–22
Pepper, C. B., M. A. Nascarella, and R. J. Kendall. 2003. A review of the effects of aircraft
noise on wildlife and humans, current control mechanisms, and the need for further study.
Environmental Management. 32:418–432.

25
Schroeder J., S. Nakagawa, I. R. Cleasby, T. Burke. 2012. Passerine birds breeding under
chronic noise experience reduced fitness. PLoS ONE 7: e39200.
Slabbekoorn, H., and E. A. P. Ripmeester. 2008. Birdsong and anthropogenic noise: Implications
and applications for conservation. Molecular Ecology 17:72–83.
Stalmaster, M. V., and J. L. Kaiser. 1997. Flushing responses of wintering bald eagles to military
activity. Journal of Wildlife Management. 61: 1307–1313
Stout, J. F., and E. R. Schwab. 1980. Telemetry of heart rate as a measure of the effectiveness of
dispersal inducing stimuli in seagulls. Pages 603–610 in C.J. Amlaner and D.W.
Macdonald editors. A handbook on biotelemetry and radiotracking. Oxford. Pergamon
Press.
Trimper, P. G., N. M. Standen, L. M. Lye, D. Lemon, T. E. Chubbs, and G. W. Humphries.
1998. Effects of low-level jet aircraft noise on the behaviour of nesting Osprey. Journal
of Applied Ecology. 35:122–130.
Ward, D. H., R. A. Stehn, W. P. Erickson, and D. V. Derksen. 1999. Response of fall-staging
brant and Canada Geese to aircraft overflights in south- western Alaska. Journal of
Wildlife Management. 63:373–381.

26
TABLES
Table 1. Mean proportion of time spent incubating and alert, and scanning frequency by Wilson’s plover (Charadrius wilsonia) for 5
min before an overflight, during the overflight, and for 5 min after the overflight for Core MOA flights, non-Core MOA military
fixed-wing flights, civilian fixed-wing flights, military and civilian rotary-wing flights, with relevant data subsets by maximum sound
pressure level, at North Core Banks, Cape Lookout National Seashore, NC, USA, April–August 2010–2011.
a Samples for overflight analyses were blocked by nest, such that a block for the MRBP analyses of overflight responses was the
averaged response for each nest.
All Core MOA flights 32 0.73 0.77 0.82 -0.79 0.18 30 0.04 0.04 0.02 0.74 0.75 0.53 A 0.51 AB
0.47 B -2.35 0.03
Core MOA flights >80dBA 4 0.73 0.49 0.42 -0.47 0.30 2
All non-Core MOA military fixed-wing flights 57 0.70 0.67 0.72 -1.49 0.08 49 0.01 0.02 0.02 0.44 0.59 0.56 0.59 0.56 -0.58 0.22
Non-Core MOA military fixed-wing flights >80dBA 15 0.66 0.62 0.68 -0.43 0.28 9 0.04 0.01 0.00 0.71 0.74 0.49 0.53 0.48 0.95 0.85
All civilian fixed-wing flights 50 0.63 0.65 0.68 0.02 0.41 44 0.04 0.03 0.03 0.37 0.59 0.54 A 0.57 A
0.51 B -2.63 0.02
All military rotary-wing flights 52 0.72 0.69 0.72 0.74 0.75 49 0.01 A 0.07 B
0.01 A -3.72 <0.01 0.51 A 0.60 B
0.53 A -9.64 <0.01
Military rotary-wing flights >80dBA 13 0.67 0.51 0.58 -0.19 0.35 10 0.01 0.09 0.00 -1.34 0.10 0.57 0.32 0.81 -0.28 0.31
All civilian rotary-wing flights 7 0.83 0.79 0.96 0.13 0.47 6 0.01 0.02 0.00 1.80 1.00 0.56 0.69 0.57 -0.16 0.36
Event N a Pre During Post S p Pre During
Mean proportion time incubating b MRBP e Mean proportion time alert c MRBP e
Post N a S p
Mean proportion scan frequency d MRBP e
S p
Pre During Post

27
b Mean proportion of time spent incubating, defined as sitting on or shading eggs or chicks, was calculated as the number of frames
incubating per total number of frames; ‘pre’ and ‘post’ samples were always 5-min in length, but the ‘during’ sample was variable in
length as determined by the exposure (seconds) of the nest to the event.
c Mean proportion of time spent in alert posture, defined as upright or hunkered with feathers flat, was calculated in the same manner
as above.
d Mean proportion frequency of scanning calculated in the same manner as above. Scanning was defined as a horizontal change in
head orientation between frames.
e Results of Multiresponse Blocked Permutation Procedure comparison of mean proportion time incubating between pre-, during-,
and post-event samples, where S = Pearson Type III test statistic and p = significance value of the test (alpha = 0.05). No capital
letters are shown if there was no difference between pre, during, and post proportion time incubating. When there are significant
differences, means with the same capital letter are not statistically significant among the pre, during, and post samples.

28
Table 2. Mean proportion of time spent incubating and alert, and scanning frequency by Wilson’s plover (Charadrius wilsonia) when
researchers were present vs. absent, at North Core Banks, Cape Lookout National Seashore, NC, USA, April–August 2010–2011.
a
Samples for the researcher presence analysis were blocked by nest, such that a block for the MRBP analyses of responses to
researcher presence was the averaged response for each nest.
b Mean proportion of time spent incubating, defined as sitting on or shading eggs or chicks, was calculated as the number of frames
incubating per total number of frames; ‘pre’ and ‘post’ samples were always 5-min in length, but the ‘during’ sample was variable in
length as determined by the exposure (seconds) of the nest to the event.
c Mean proportion of time spent in alert posture, defined as upright or hunkered with feathers flat, was calculated in the same manner
as above.
d Mean proportion frequency of scanning calculated in the same manner as above. Scanning was defined as a horizontal change in
head orientation between frames.
Event N a Mean S p N a Mean S p N a Mean S p
Researchers Present 47 0.46 A -12.8 <0.01 34 0.08 A -2.91 0.02 34 0.56 A -0.10 0.30
No Researchers Present 47 0.75 B 34 0.02 B 34 0.54 A
Mean proportion time incubating b MRBP e Mean proportion time alert c
MRBP e Mean scan frequency d MRBP e

29
e Results of Multiresponse Blocked Permutation Procedure comparison of mean proportion time incubating between pre-, during-,
and post-event samples, where S = Pearson Type III test statistic and p = significance value of the test (alpha = 0.05). No capital
letters are shown if there was no difference between pre, during, and post proportion time incubating. When there are significant
differences, means with the same capital letter are not statistically significant among the pre, during, and post samples.

30
FIGURES
Figure 1. North Core Banks, Cape Lookout National Seashore, North Carolina with 5 nesting
areas of Wilson’s plovers in 2010 and 2011 (top plate) and a detailed view of the 4 sites with the
most Wilson’s plover nests during this study; North Portsmouth Flats, South Portsmouth Flats,
Old Drum Inlet, and New Drum Inlet.

31
Figure 2. Core Military Operations Area (shaded in yellow), and adjacent airspaces, R-5306A
and W-122, at Cape Lookout National Seashore, NC.

32
Figure 3. Maximum equivalent average peak energy level of the loudest 1 sec interval for the
period sampled (LEQmax) of overflights (sample sizes above box plots) recorded from digital
audio recorders at Wilson’s plover (Charadrius wilsonia) at North Core Banks, Cape Lookout
National Seashore, NC 2010-2011. The boxes represent the values from the lower to upper
quartile (25th
to 75th
percentiles). The middle horizontal line represents the median, and the ends
of the vertical lines represent the maximum and minimum values. Audio data were calibrated
and post-processed using Larson Davis 831 Sound Level Meters, and A2NVSPL and Acoustic
Monitoring Toolbox software programs (Natural Sounds Program, US National Park Service).
0
10
20
30
40
50
60
70
80
90
100
Core MOA Military fixed-wing
Military rotary-wing
Civilian fixed-wing
Civilian rotary-wing
LE
Qm
ax(d
BA
)
121 450 202 325 9

33
Figure 4. Mean proportion of time Wilson’s plovers were incubating (out of total time possible)
pre, during, and post overflight event that occurred over North Core Banks, Cape Lookout
National Seashore, NC, 2010-2011. The numbers above symbols indicate sample size.
32
57 52 50
7
0.00
0.10
0.20
0.30
0.40
0.50
0.60
0.70
0.80
0.90
1.00 M
ean p
roport
ion t
ime
incu
bat
ing
Pre-flight Overflight Post-flight

34
Figure 5. Mean proportion of time Wilson’s plovers were alert pre, during, and post overflight
events that occurred over Cape Lookout National Seashore, NC, 2010-2011. The numbers above
symbols indicate sample size. *Indicates p < 0.05 for MRBP test among pre, during and post
samples.
30
49
49
44
6
0.00
0.01
0.02
0.03
0.04
0.05
0.06
0.07
0.08
0.09
0.10 M
ean p
roport
ion t
ime
aler
t
Pre-flight Overflight Post-flight
*

35
Figure 6. Mean scan frequency for Wilson’s plovers pre, during, and post overflights that
occurred at North Core Banks, Cape Lookout National Seashore, NC, 2010-2011. The numbers
above symbols indicate sample size. *Indicates p < 0.05 for MRBP test among pre, during and
post samples.
30
49 49
44
6
0.00
0.10
0.20
0.30
0.40
0.50
0.60
0.70
0.80
0.90
1.00
Mea
n f
requen
cy o
f sc
annin
g
Pre-flight Overflight Post-flight
* *
*

36
Figure 7. Mean proportion of time spent incubating and alert, and scanning frequency were not
different from pre and post samples during loud overflights (> 80dBA LEQmax) by Wilson’s
plovers at North Core Banks, Cape Lookout National Seashore NC, 2010-2011.
4 15 13
0.00
0.20
0.40
0.60
0.80
1.00
Core MOA Military
fixed-wing
Civilian
fixed-wing
Mea
n p
roport
ion t
ime
incu
bat
ing
Pre-flight
Overflight
Post-flight
9
10
0.00
0.02
0.04
0.06
0.08
0.10
Military fixed-wing Civilian fixed wing
Mea
n p
roport
ion t
ime
aler
t
Pre-flight
Overflight
Post-flight
9
10
0.00
0.20
0.40
0.60
0.80
1.00
Military fixed-wing Civilian fixed-wing
Mea
n f
requen
cy o
f sc
ans
Pre-flight
Overflight
Post-flight

37
Figure 8. Proportion of frames Wilson’s plovers were incubating and alert, and scanning
frequency of Wilson’s plovers during periods when researchers were present vs. absent at a
nesting site at Cape Lookout National Seashore, NC, 2010-2011. The numbers above symbols
indicate sample size. *Indicates p < 0.05.
47
34
34
0.00
0.10
0.20
0.30
0.40
0.50
0.60
0.70
0.80
0.90
1.00
Incubate Alert Scans
Pro
port
ion o
f fr
ames
in e
ach a
ctiv
ity
Researchers No researchers
*
*

38
Figure 9. Heart rate was negatively correlated with ambient temperature (R2
= 0.44, p < 0.01,
RMSE =125.15, heart rate = 1119.46 – 20.71*temperature) for incubating Wilson’s plover at
North Core Banks, Cape Lookout National Seashore, NC, 2010-2011.
0
100
200
300
400
500
600
700
800
20 25 30 35 40 45 50
Bea
ts p
er m
in
Temperature °C

39
CHAPTER TWO. Nest Site Selection of Wilson’s Plovers (Charadrius wilsonia) on North
Core Banks, Cape Lookout National Seashore, North Carolina
ABSTRACT.— The Wilson’s Plover (Charadrius wilsonia) is listed as a Species of Concern
throughout its breeding range in the southeastern United States. There is little information on population
trends of Wilson’s Plovers, but there is concern that, as has happened with other coastal temperate-zone
breeding plovers, habitat loss and degradation is causing the population to decline. There are few
published studies of Wilson’s Plover habitat selection, and most of the studies have focused on
characteristics of the nest microhabitat. Our objectives were 1) to compare habitat use vs.
availability on an island-wide scale for nesting Wilson’s Plovers, 2) to understand how distance
to geomorphic features and vegetative cover influenced nest-site selection on an island-scale, and
3) to understand how distance to geomorphic features and vegetative cover influenced nest-site
selection locally, in areas used by nesting Wilson’s plovers at Cape Lookout National Seashore,
North Carolina. We classified and mapped six different nesting habitats and estimated use vs.
availability. To understand how distance to geomorphic features and vegetative cover influenced
nest site selection, we compared the distance of nest points and random, unused points to
geomorphic features on an island-scale and on a local-scale at sites used for nesting. Wilson’s
Plovers selected for interdune areas, flats and isolated dunelets on flats and against beach and
dunes. Distance to geomorphic features did not influence nest-site selection at the island-scale.
At the local scale, the probability of a location being used for nesting increased as distance from
dense vegetation decreased; none of the other variables affected the probability of site being used
for nesting. Proximity to dense vegetation at this scale may be important to nest-site selection
because it provides refuge for chicks immediately after hatching, when they are most vulnerable.

40
INTRODUCTION
The Wilson’s Plover (Charadrius wilsonia) is listed as a Species of Concern throughout
its breeding range in the southeastern United States, and as a Species of High Concern in the
U.S. Shorebird Conservation Plan (Brown et al. 2001). The North American population is
estimated at 6,000 individuals, however no broad scale, systematic studies have addressed
population trends of Wilson’s Plovers, so low confidence is placed in this estimate (Corbat and
Bergstrom 2000, Brown et al. 2001). Population declines of other coastal temperate-zone
breeding plovers, such as the Piping Plover (Charadrius melodus, Cairns and McLaren 1980)
and Snowy Plover (Charadrius nivosus; Powell 2001), have been largely attributed degradation
and loss of coastal breeding habitat, and there is concern that, like these beach-nesting
shorebirds, Wilson’s Plover breeding habitat is being lost to and degraded by beach modification
projects, and coastal recreation and development. In order to manage coastal ecosystems to
minimize the impact of these activities on Wilson’s Plover breeding habitat, it is important to
understand which habitat characteristics influence nest-site selection and reproductive success.
Birds select habitat at several spatial scales (Johnson 1980, Mayor et al. 2009). At the
landscape scale, plovers select a general location (e.g. barrier island or mainland beach). They
then establish a nesting territory within a general habitat type (e.g. a beach or sandflat), and
finally they select a specific location to place their nest. Birds are thought to make choices about
habitat characteristics at each spatial scale to optimize nesting success and chick survival (Orians
and Wittenberger 1991).
Wilson’s Plovers nest in a variety of habitats on mainland beaches and barrier islands
along the Atlantic and Gulf of Mexico coasts (Corbat 1990, Bergstrom 1988). They have been
observed nesting on open sandflats and beaches, dunes, at the edges of ponds, and in sparsely
vegetated salt flats (Tomkins 1944, Bergstrom 1988, Corbat 1990, Hood 2006, Dikun 2008 and

41
Ray 2010). Most studies of Wilson’s Plovers have described general habitat types (e.g.
interdune, sandflat) used for nesting, and studied factors affecting nest site selection at the
microhabitat scale. Wilson’s Plovers often place nests near vegetation (Bergstrom 1988, Corbat
1990), and at some study sites, nests near or within vegetation were more likely to be successful
than nests placed away from vegetation (Corbat 1990, Ray 2010). Conversely, Hood (2006)
found that nests near dense clumps of vegetation had lower survival than nests in sparse
vegetation.
Wilson’s Plover nest site selection has rarely been studied at the scale of territory
placement. Dikun (2008) reported habitat selection for habitat types categorized by topography
and frequency of overwash for Wilson’s Plovers at site in South Carolina, and Hood (2006)
estimated ground cover up to 25 m from Wilson’s Plovers’ nests in Texas. Previous studies have
suggested that selection at this scale may be a function of trade-offs between areas of high flood
risk (beaches and sandflats) and dunes where risk of predation is higher (Dikun 2008, Ray 2010).
The Piping Plover, a congeneric temperate nesting plover, appeared to respond to an increase in
predation by shifting their nests away from the dunes, in a study by Burger (1987). The presence
of adequate foraging territory may also influence nesting territory placement. Piping Plovers
select nest sites close to bay side intertidal flats and ephemeral pools which have higher
invertebrate densities than the adjacent beaches (Loegering and Fraser 1995, Cohen et al. 2009).
Ray (2010) found that Wilson’s Plovers used foraging territories closer to dense vegetation and
water than expected at random, however a similar relationship has not yet been demonstrated
with Wilson’s Plover nesting territories. To understand selection at the scale of nesting territories
we used the nest location as proxy for the territory, but measured habitat characteristics beyond
the immediate nest area. Our objectives were 1) to compare habitat use vs. availability for

42
nesting Wilson’ s Plovers at the island-scale, 2) to understand how distance to geomorphic
features and vegetative cover influenced nest-site selection on an island-scale, and 3) to
understand how distance to geomorphic features and vegetative cover influenced nest-site
selection locally, in areas used by nesting Wilson’s Plovers.
METHODS
Study Area.— Cape Lookout National Seashore (CALO; 34° 23’ N, 76° 17’ W, Fig. 1) is
located between Ocracoke Island and Beaufort, NC, USA and is part of the barrier island
ecosystem that extends along much of the Atlantic seaboard from Massachusetts to Florida. The
islands routinely change in shape and number due to wind, waves and currents. During the
study, CALO included the islands of North Core Banks (NCB), South Core Banks (SCB), and
Shackleford Banks (SFB), which had about 90 km of ocean shoreline. Cape Lookout National
Seashore had no permanent residents, but NPS managed guest cabins and service facilities
available for use by the public. The islands were accessible via public car/person ferries and by
private vessel. Motorized vehicles including all-terrain vehicles (ATVs) and off-road vehicles
(ORVs) were allowed to drive on the beach.
Cape Lookout National Seashore is relatively pristine compared to other Atlantic barrier
islands, most of which are inhabited by humans and are subject to beach and dune stabilization
projects that interrupt natural processes, such as dune erosion and the formation of inlets, that
create shorebird habitat. Because natural processes are not interfered with on CALO, there may
be a broader range of habitats available to shorebirds than on barrier islands that are more
influenced by humans. We studied Wilson’s Plover nest site selection on NCB, the northern-
most of CALO’s three islands.
Field Methods.— We searched for Wilson’s Plovers’ nests during two nesting seasons
(Apr–Jul) by walking transects through all potential plover nesting habitat on North Core Banks

43
(Fig. 1) every two to three days. When we observed a territorial pair, or bird exhibiting nest
defense, we hid in a blind or vegetation and waited for the bird to resume incubation. When we
found a nest, we recorded the nest’s location using a GPS unit. After nests failed or hatched, we
returned and measured distances from the nest bowl to geomorphic features and vegetative
cover.
Use versus Availability.— To understand Wilson’s Plover nest site selection we compared
habitat use to habitat availability at the island-scale. We used ground transects and 0.3 m-
resolution digital aerial imagery collected by the United States Geological Survey in 2009 to
classify habitat as suitable or unsuitable for Wilson’s Plover nesting. In May 2010, we sampled
habitat at 100 m intervals on 73 transects, each covering a cross section of the island, starting on
the beach side of the primary dunes, and running toward the sound. Transects were spaced 500 m
apart along the entire island (Fig. 2). We recorded percent vegetative cover and general habitat
type (beach, dunes, dunelet, flat, marsh, interdune, or vegetated flat) within a 1x1 m2 quadrat
every 100 m on the transects. We ended transects when we encountered continuous, dense (>
75% vegetative cover) vegetation because we deemed densely vegetated areas to be unsuitable
for plover nesting. We marked each sample point with a GPS unit (Garmin International, Olathe
KS), and projected these points on the 2009 aerial imagery in ArcGIS (Environmental Systems
Research Institute, Redlands, CA). We used the habitat information associated with sampling
points combined with the imagery to digitize a layer of potentially suitable habitat. In addition,
we mapped the boundaries of some suitable habitats (beach, dunelet, flat, marsh, and interdune)
by driving (to delineate the beach from the intertidal zone) or walking (all other habitats) the
perimeter of each habitat type with a continuously recording GPS unit to accurately represent

44
edges and small features like dunelets (Fig. 1). We defined six potentially suitable nesting
habitats based on geomorphic structure and vegetative cover:
1. Beach: open sandy area with no vegetation between the intertidal zone and primary dune or
vegetation line.
2. Dunes: the primary duneline and smaller hind dunes bordering the marsh.
3. Dunelet: isolated dune on a flat.
4. Flat: open areas behind the primary duneline. Where the duneline was not continuous, we
defined the flat boundary as a straight line level with the dunes at either end of the flat.
5. Interdune: small sand and shell flats behind the primary dunes, interspersed with dunelets and
low, sparse vegetation.
6. Marsh: moist flat area with <75% tall clumped vegetation, primarily Spartina spp.
Unsuitable habitat consisted of the intertidal zone, marsh with ≥75% vegetative cover, and
maritime forest (Fig. 1). We calculated the area for each of the six suitable habitats across the
whole island, and considered this an estimate of the area available to nesting Wilson’s Plovers.
We calculated proportion of habitat use as the proportion of nests initiated in each habitat type.
We compared the expected use with the observed use using a chi-square test and Bonferronized
confidence intervals to determine selection for or against each habitat type (Neu et al. 1974,
Byers and Steinhorst 1984).
Distance Analysis.—To understand how distance to geomorphic features and vegetative
cover influenced nest site selection at the island and local-scales, we compared the distance of
nest points and random, unused points from dunes, the high tide line, water, and dense vegetation
at both scales. We used Hawth’s Analysis Tools for ArcGIS to generate random points

45
constrained to the area of the 6 habitats we defined as potentially suitable for Wilson’s Plover
nesting for the use vs. availability analysis.
At both nest sites and random points we measured the straight line distance to the nearest
dunes, the high tide line, continuous, dense vegetation, and water. We made most measurements
with a measuring tape, or GPS unit in the field, but measured the distance to some of the more
distant geomorphic features using the habitat maps we created in ArcGIS. Water included ponds
and mud flats, or tidal creeks that provided access to the sound. Ponds were small and brackish,
maintained by rainfall and washover events. Pond size varied throughout the season, and by year.
Tidal creeks flowed through the marsh between the flat and the sound. Mud flats extended into
the sound at the recently closed inlets. Water levels fluctuated with tide, rainfall and wind, but
these changes resulted only in meters of difference in horizontal measurements, between the high
and low measures because deep channels held some water throughout the season. We did not
include the ocean in our water measurements. The sound also was excluded from measurements
where it was bordered by shrubs and/or dense marsh vegetation because we considered it to be
inaccessible to plover broods. We measured to the nearest continuous duneline; isolated dunes
(dunelets) were not included. For high tide, we measured the distance to the wrack line
approximating the highest spring tide for the current season. Dense vegetation was defined as
>75% vegetative cover.
We used logistic regression (SAS Institute Inc., Cary, NC) to compare habitat
characteristics associated with nest-sites and unused, random sample points. We tested the fit of
the global model with a Hosmer and Lemeshow goodness-of-fit test (Hosmer and Lemeshow
1989). We examined biologically plausible models with distance to nearest dunes, high tide line,
continuous, dense vegetation, and water as explanatory variables. We included a categorical
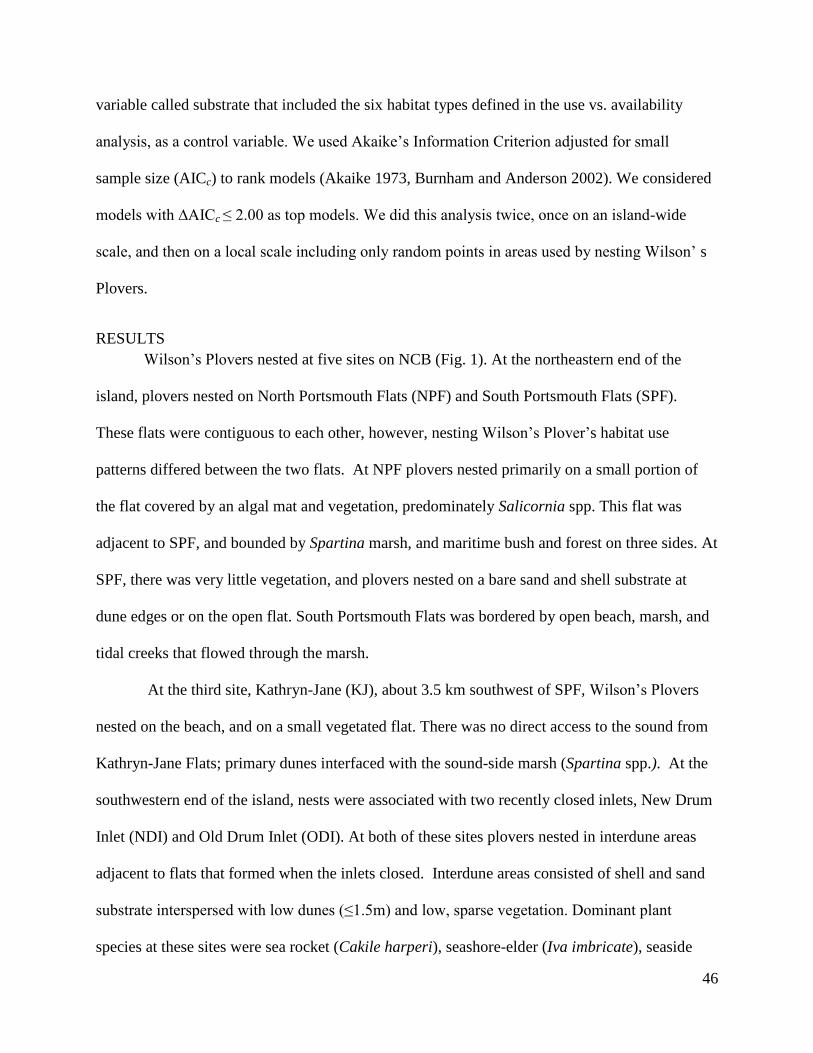
46
variable called substrate that included the six habitat types defined in the use vs. availability
analysis, as a control variable. We used Akaike’s Information Criterion adjusted for small
sample size (AICc) to rank models (Akaike 1973, Burnham and Anderson 2002). We considered
models with ∆AICc ≤ 2.00 as top models. We did this analysis twice, once on an island-wide
scale, and then on a local scale including only random points in areas used by nesting Wilson’ s
Plovers.
RESULTS
Wilson’s Plovers nested at five sites on NCB (Fig. 1). At the northeastern end of the
island, plovers nested on North Portsmouth Flats (NPF) and South Portsmouth Flats (SPF).
These flats were contiguous to each other, however, nesting Wilson’s Plover’s habitat use
patterns differed between the two flats. At NPF plovers nested primarily on a small portion of
the flat covered by an algal mat and vegetation, predominately Salicornia spp. This flat was
adjacent to SPF, and bounded by Spartina marsh, and maritime bush and forest on three sides. At
SPF, there was very little vegetation, and plovers nested on a bare sand and shell substrate at
dune edges or on the open flat. South Portsmouth Flats was bordered by open beach, marsh, and
tidal creeks that flowed through the marsh.
At the third site, Kathryn-Jane (KJ), about 3.5 km southwest of SPF, Wilson’s Plovers
nested on the beach, and on a small vegetated flat. There was no direct access to the sound from
Kathryn-Jane Flats; primary dunes interfaced with the sound-side marsh (Spartina spp.). At the
southwestern end of the island, nests were associated with two recently closed inlets, New Drum
Inlet (NDI) and Old Drum Inlet (ODI). At both of these sites plovers nested in interdune areas
adjacent to flats that formed when the inlets closed. Interdune areas consisted of shell and sand
substrate interspersed with low dunes (≤1.5m) and low, sparse vegetation. Dominant plant
species at these sites were sea rocket (Cakile harperi), seashore-elder (Iva imbricate), seaside

47
pennywort (Hydrocotyle bonariensis), marsh pinks (Sabata stellaris), seabeach evening primrose
(Oenothera humifusa), and American beach grass (Ammophila breviligulata). With the exception
of KJ and parts of ODI, all of the nesting sites were closed to the public for the entire breeding
season. The NPS closed KJ to the public when Least Terns (Sternula antillarum) began using the
site, which resulted in closures for the latter part of the breeding season in both years. The main
nesting area at ODI was south of the inlet and was not closed to the public, however beachgoers
rarely went behind the dunes where Wilson’s Plovers nested. In 2011, Wilson’s Plovers nests
were exposed to beach traffic when the NPS routed vehicles to roadway behind the dunes to
avoid driving on the beach.
We sampled habitat at 108 nests and 100 random points in 2010 and 2011. We distributed
100 random points (50 in each year) within all potentially suitable habitats. Ray (2010) never
saw broods move more than 2 km from nesting to final foraging territory, and at our site, we did
not observe Wilson’s Plovers nesting > 2 km from a pond, tidal creek, or inlet. Thus, we applied
a 2 km radius buffer to water features and excluded parts of the island that fell outside of the
buffer zone. This resulted in the exclusion of 16 random points from the narrow middle portion
of the island (Fig. 1) from the local-scale analysis. In 2011, we increased time and effort spent
searching for nests and found 72 nests, compared to only 36 in 2010. We estimated that about 40
breeding pairs used NCB in both years (see Chapter Three).
Wilson’s Plovers used interdune areas, flats and isolated dunelets on flats more than
expected based on their availability (Table 1). They used beach and dunes less than expected
based on availability. At the island-scale, distance to dense vegetation and water were in all of
the top models (Table 2). However, support was similar for the top four models, which included
the global model (Table 2). There was no evidence that distance from geomorphic features

48
affected nest placement at the island-scale, as the 95% confidence limits encompassed 1 for all
variables (Table 3). At the local scale, distance to dense vegetation was in all of the top models
(Table 4). Support was similar for the top seven models, which included the global model (Table
4). The probability of a location being used for nesting increased as distance from dense
vegetation decreased (the confidence limits did not encompass 1). The 95% confidence limits
included 1 for all other variables, indicating that distance from dunes, water and high tide line
did not affect probability of a site being used for nesting at the local-scale (Table 5).
DISCUSSION
Our findings that Wilson’s Plovers selected for interdune areas and open flats were
consistent with previous studies that have described habitat use by Wilson’s Plovers (Bergstrom
1982, Bergstrom 1988, Corbat 1990, Hood 2006, Ray 2010, and Brown and Brindock 2012).
Like Wilson’s Plovers in South Carolina, (Dikun 2008), Wilson’s Plovers on NCB selected for
interdune areas with active overwash. Nearly one quarter of all nests were in interdune habitat,
although interdune accounted for a small percentage of the total suitable habitat at our study site.
At NPF, nests were concentrated on a portion of the flat covered by an algal mat substrate and
vegetated with Salicornia spp. During the breeding seasons of both years of this study, the algal
mat was dry, but at other times of the year it was inundated. The primary nest predators at NPF
were fish crows (Corvus ossifragus; see Chapter Three) and we think that the short, but thick
Salicornia helped conceal nests from areal predators while still allowing incubating plovers to
see their surroundings. Plovers that nested in the Salicornia often raised their broods along the
edge of the Spartina marsh near their nest-site, suggesting that the Salicornia flat, Spartina
marsh border provided adequate cover and food resources, while pairs that nested on sand flats
always moved their chicks to foraging territories near water or vegetation. In 2011, subterranean
termites (Rhinotermitidae spp.) swarmed on the Salicornia flats, and broods appeared to be

49
foraging on the termites. In 2010, we did not see termite swarms, but the broods used the same
areas. The Salicornia flat and Spartina marsh interface may be a rich source of insects for
Wilson’s Plovers broods on NCB, which lacks abundant Fiddler Crabs, which are thought to be
an important food resource for breeding Wilson’s Plovers at other sites (Bergstrom 1982, Ray
2010).
At the local-scale, the probability of site being used for nesting was influenced by
distance to continuous, dense vegetation. Previous studies of nest site selection have focused on
distance to vegetation in the immediate area of the nest bowl (Hood 2006, Dikun 2008, Ray
2010), while we measured nest distance from geomorphic features and vegetative cover, which
were often several hundred meters from the nest bowl. Proximity to dense vegetation at this scale
may be important to nest site selection because it provides refuge for chicks immediately after
hatching, when they are most vulnerable. Conversely, vegetation can decrease the distance at
which incubating birds can detect predators by blocking the line of sight and by providing cover
for mammalian predators (Koivula and Ronka 1998, Amat and Masero 2004). Our results may
have been driven by nest distribution at NPF, where nearly a third of the nests occurred. Avian
predation accounted for most the nest failure at this site, so vegetation may have helped conceal
Wilson’s Plover nests and chicks, rather than predators. Strategies for hiding nests and chick may
differ for different predators, thus, nest site selection is probably highly site-specific and
dependent on habitat resources and predator community.
Predation caused most of the nest failure at NCB, while flooding posed a relatively minor
threat during this study (see Chapter Three). Most of the nesting sites were on wide parts of the
island where flooding was more often caused by rain pooling on the flat and overflowing inland
ponds, or by high tides in the sound that pushed water through tidal creeks and onto the flats,

50
than by high ocean tides. Other studies have described Wilson’s Plovers nesting at the edge of
dunes (Corbat and Bergstrom 2000, Dikun 2008, Ray 2010). While we did find some nests at the
toe of the dunes, especially in interdune areas, nests on flats were usually placed away from
dunes, in open areas or associated with isolated dunelets.
Piping Plovers and Snowy Plovers can be more productive when nesting in association
with tern colonies (Burger 1987, Powell 2001). Presumably this is because they benefit from the
defensive behaviors by the terns. However, at NCB, Wilson’s Plovers avoided the flats at NDI
and ODI where terns, primarily the Least Tern, nested. We found two Wilson’s Plover nests on
these flats. Both were initiated early in the season before the terns had established a colony. One
nest was depredated before terns arrived, and the other was abandoned after terns began to use
the flat. At SPF, Wilson’s Plovers nested in a tern colony, however nest predation was high at
this site (see Chapter Three).
Wilson’s Plovers used a variety of nesting habitats on NCB, but selected for flat, sparsely
vegetated areas that are maintained by overwash and storm events. Wilson’s Plovers on NCB
probably benefit from the fact that the NPS does not interfere with natural erosion and
depositions processes on the island, and thus they are able to use a broader range of habitats on
NCB than they would on other barrier islands or mainland beaches where beach management
may not allow for the formation of extensive flats and interdune areas. An understanding of
habitat selection on a barrier island with little human interference can help inform management
decisions about habitat modification so as to benefit the Wilson’s Plover in less pristine
environments.

51
LITERATURE CITED
Akaike, H. 1973. Information theory and an extension of the maximum likelihood principle.
Pages 267–281 in B. N. Petran and F. Csaki, editors. International symposium on
information theory. Second edition. Akademiai Kiado, Budapest, Hungary.
Amat, J. A., and J. A. Masero. 2004. Predation risk on incubating adults constrains the choice of
thermally favourable nesting sites in a plover. Animal Behaviour 67:293–300.
Bergstrom, P. W. 1982. Ecology of incubation in Wilson’s Plover (Charadrius wilsonius). Ph.D.
dissertation. University of Chicago, Chicago, Illinois, USA.
Bergstrom, P. W. 1988. Breeding biology of Wilson’s Plovers. The Wilson Bulletin. 100: 25–35.
Brown, A. C. and Brindock, K., 2011. Breeding success and nest site selection by a Caribbean
population of Wilson’s Plovers. The Wilson Journal of Ornithology. 123: 814–819.
Brown, S. C., C. Hickey, B. Harrington, and R. Gill. 2001. The U.S. Shorebird Conservation
Plan. Second Edition. Manomet Center for Conservation Sciences, Manomet,
Massachusetts, USA.
Burger, J. 1987. Physical and social determinants of nest-site selection in piping plover in New
Jersey. Condor 89: 811–818
Burnam, K. P., and D. R. Anderson. 2002. Model selection and multimodel inference: a practical
information-theoretic approach, 2nd ed. Springer- Verlag, New York.
Byers, C. R., and R. K. Steinhorst. 1984. Clarification of a technique for analysis of utilization-
availability data. Journal of Wildlife Management 48: 1050 – 1053.
Cairns, W. E., and I. A. McLaren. 1980. Status of the piping plover on the east coast of North
America. Am. Birds 34:206-208.

52
Cohen, J. B., L. M. Houghton, and J. D. Fraser. 2009. Piping plover nesting density and
reproductive success in response to storm and human-created habitat changes. Wildlife
Monographs 173.
Corbat, C. A. 1990. Nesting ecology of selected beachnesting birds in Georgia. Dissertation.
University of Georgia, Athens, USA.
Corbat, C. A., and P. W. Bergstrom. 2000. Wilson's Plover (Charadrius wilsonia), The Birds of
North America Online (A. Poole, Ed.). Ithaca: Cornell Lab of Ornithology, USA.
Accessed 15 March 2012.
Dikun, K. A. 2008. Nest-site selection of Wilson’s Plovers (Charadrius wilsonia) in South
Carolina. Thesis, Coastal Carolina University, Conway, South Carolina, USA
Hood, S. L. 2006. Nesting ecology of Snowy and Wilson’s Plovers in the lower Laguna Madre
region of Texas. Thesis, Mississippi State University, Starkville, Mississippi, USA
Hosmer, D. W. and S. Lemeshow. 2000. Applied logistic regression. Second edition. John Wiley
& Sons, Inc., New York, New York, USA
Johnson, D. H. 1980. The comparison of usage and availability measurements for evaluating
resource preference. Ecology 61:65–71
Koivula, K. and A. Ronka. 1998. Habitat deterioration and efficiency of antipredator strategy in
a meadow-breeding wader, Temminck’s Stint (Calidris temminckii). Oecologia 116:348–
355.
Loegering, J. P., and J. D. Fraser. 1995. Factors affecting Piping Plover chick survival in
different brood-rearing habitats. Journal of Wildlife Management 59:646–655.
Mayor, S. J., Schneider, D. C., Schaefer, J. A. and S. P. Mahoney. 2009. Habitat selection at
multiple scales. Ecoscience. 16:238–247.

53
Neu, C. W., C. R. Byers, and J. M. Peek. 1974. A technique for analysis of utilization-
availability data. Journal of Wildlife Management 38: 541–545.
Orains, G. H., and J. F. Wittenberger. 1991. Spatial and temporal scales in habitat selection
The American Naturalist. Supplement: Habitat Selection, 137: S29–S49
Powell, A. N. 2001. Habitat characteristics and nest success of Snowy Plovers associated with
California Least Tern colonies. Condor 103: 785–792.
Ray, K. L. 2010. Factors affecting Wilson’s Plover (Charadrius wilsonia) demography and
habitat use at Onslow Beach, Marine Corps Base Camp Lejeune, North Carolina. Thesis.
Virginia Polytechnic and State University, Blacksburg, Virginia, USA
Smith, P. W., and S. A. Smith. 1999. The breeding of
Wilson’s (Charadrius wilsonia) and Collared (Charadrius collaris) plovers in the southern
Lesser Antilles. El Pitirre 12:50–51.
Tomkins, I.R. 1944. Wilson’s Plover in its summer home. Auk 61:259–269.

54
TABLES
Table 1. Proportion of use (Pu) vs. availability (Pa) and Bonferronized 95% confidence intervals
on proportion of use (Pu) for different substrates used by nesting Wilson’s Plovers (Charadrius
wilsonia; n=108) at Cape Lookout National Seashore, North Carolina, 2010–2011. Use was
defined as number of nests initiated in each type of substrate. Selection for (+), against (-) and no
selection (=) each substrate is shown in final column.
Substrate Area (ha) P a P u Lower 95% CI Upper 95% CI Select
Beach 325.82 0.32 0.05 -0.01 0.10 -
Dunelet 1.33 0.00 0.08 0.01 0.15 +
Dunes 349.63 0.34 0.07 0.01 0.14 -
Flat 306.91 0.30 0.56 0.43 0.68 +
Marsh 22.93 0.02 0.01 -0.02 0.03 =
Interdune 10.95 0.01 0.23 0.12 0.34 +

55
Table 2. Top-ranked models (ΔAICc ≤ 2.00) from 14 single-and multi-variable logistic
regressions for an island-scale analysis of habitat characteristics at Wilson’s Plover (Charadrius
wilsonia) nest sites (n=108 nests) and random unused points (n = 100 points) on North Core
Banks, Cape Lookout National Seashore, North Carolina, 2010–2011.
a K = No. of model parameters
b AICc = Akaike’s Information Criterion corrected for sample size.
c ΔAICc = difference between any given model’s AICc and the best-fit model.
d wi = Akaike model weight based on model likelihood divided by total of all model likelihoods.
e DistDenseVeg = distance to nearest continuous, dense (75% vegetative cover) vegetation
measured in field with a tape measure or GPS unit, or in ArcGIS; DistDune= distance to the
nearest continuous duneline, isolated small dunes (dunelets) were not included; DistTide=
distance to the maximum normal high tide line for the current season; DistWater; distance to
nearest pond, tidal creek, or inlet.
Variablese K a AICc
b ΔAICc
c w i
d Model
Likelihood
HabType, DistDenseVeg, DistWater, DistDune 10 221.63 0.00 0.28 1.00
HabType, DistDenseVeg, DistWater, DistDune, DistTide(Global) 11 221.85 0.22 0.25 0.90
HabType, DistDenseVeg, DistWater 9 222.40 0.77 0.19 0.68
HabType, DistDenseVeg, DistWater, DistTide 10 222.61 0.98 0.17 0.61

56
Table 3. Model-averaged parameter estimates and 95% confidence limits from the four top-
ranked models (ΔAICc ≤ 2.00) from 14 single-and multi-variable logistic regressions for an
island-scale analysis of habitat characteristics at Wilson’s Plover (Charadrius wilsonia) nest sites
(n=108 nests) and random unused points (n = 100 points) on north Core Banks, Cape Lookout
National Seashore, North Carolina, 2010–2011.
a DistDenseVeg = distance to nearest continuous, dense (75% vegetative cover) vegetation;
DistDune= distance to the nearest continuous duneline, isolated small dunes (dunelets) were not
included; DistTide= distance to the maximum normal high tide line for the current season;
DistWater; distance to nearest pond, tidal creek, or inlet.
Variablea
Parameter
Estimate SE
Log-odds
ratio Lower 95% CL Upper 95% CL
DistDenseVeg -0.00239 0.00124 0.99761 0.99519 1.00005
DistDune 0.00060 0.00065 1.00060 0.99933 1.00187
DistTide -0.00004 0.00029 0.99996 0.99940 1.00052
DistWater -0.00068 0.00043 0.99932 0.99848 1.00016

57
Table 4. Top-ranked models (ΔAICc ≤ 2.00) from 14 single-and multi-variable logistic
regressions for a local-scale analysis of habitat characteristics at Wilson’s Plover (Charadrius
wilsonia) nest sites (n=108 nests) and random unused points (n=84 points) at sites used by
nesting Wilson’s Plovers on North Core Banks, Cape Lookout National Seashore, North
Carolina, 2010–2011.
a K = No. of model parameters
b AICc = Akaike’s Information Criterion corrected for sample size.
c ΔAICc = difference between any given model’s AICc and the best-fit model.
d wi = Akaike model weight based on model likelihood divided by total of all model likelihoods.
e DistDenseVeg = distance to nearest continuous, dense (75% vegetative cover) vegetation;
DistDune= distance to the nearest continuous duneline, isolated small dunes (dunelets) were not
included; DistTide= distance to the maximum normal high tide line for the current season;
DistWater; distance to nearest pond, tidal creek, or inlet.
Variablee K
a AICc
b ΔAICc
c w i
d Model
Likelihood
HabType, DistDenseVeg, DistWater, DistDune 10 216.63 0.00 0.19 1.00
HabType, DistDenseVeg, DistWater, DistTide, DistDune (Global) 11 216.80 0.16 0.18 0.92
HabType, DistDenseVeg, DistWater 9 217.34 0.70 0.14 0.70
HabType, DistDenseVeg, DistDune 9 217.43 0.79 0.13 0.67
HabType, DistDenseVeg, DistWater, DistTide 10 217.59 0.95 0.12 0.62
HabType, DistDenseVeg 8 218.06 1.42 0.09 0.49
HabType, DistDenseVeg, DistTide 9 218.26 1.63 0.09 0.44

58
Table 5. Model-averaged parameter estimates and 95% confidence limits from the seven top-
ranked models (ΔAICc ≤ 2.00) from 14 single-and multi-variable logistic regressions for a local-
scale analysis of habitat characteristics at Wilson’s Plover (Charadrius wilsonia) nest sites
(n=108 nests) and random unused points (n =84 points) at sites used by nesting Wilson’s plovers
on north Core Banks, Cape Lookout National Seashore, North Carolina, 2010–2011.
a DistDenseVeg = distance to nearest continuous, dense (75% vegetative cover) vegetation;
DistDune= distance to the nearest continuous duneline, isolated small dunes (dunelets) were not
included; DistTide= distance to the maximum normal high tide line for the current season;
DistWater; distance to nearest pond, tidal creek, or inlet.
Variablea
Parameter
Estimate SE
Log-odds
ratio Lower 95% CL Upper 95% CL
DistDenseVeg -0.00253 0.00127 0.99747 0.99500 0.99995
DistDune 0.00054 0.00061 1.00054 0.99936 1.00173
DistTide -0.00002 0.00026 0.99998 0.99947 1.00049
DistWater -0.00030 0.00038 0.99970 0.99896 1.00044

59
FIGURES
Figure 1. North Core Banks, Cape Lookout National Seashore, North Carolina with five nesting
sites of Wilson’s Plovers (Charadrius wilsonia) in 2010 and 2011, and a detailed view of the
four largest nesting sites: North Portsmouth Flats, South Portsmouth Flats, Old Drum Inlet, and
New Drum Inlet.

60
Figure 2. Seventy-three habitat transects sampled at 100 m intervals on North Core Banks, Cape
Lookout National Seashore, North Carolina in May 2010. Transects were spaced 500 m apart
along the entire island, and each transect covered a cross section of the island, starting on the
beach side of the primary dunes, and running toward the sound. We recorded percent vegetative
cover and general habitat type (beach, dunes, dunelet, flat, marsh, interdune, or vegetated flat)
within a 1x1 m2 quadrat every 100 m on the transects. We ended transects when we encountered
continuous, dense (> 75% vegetative cover) vegetation. We marked each sample point with a
GPS unit (Garmin International, Olathe KS), and projected these points along with associated
habitat information on 2009 aerial imagery in ArcGIS (Environmental Systems Research
Institute, Redlands, CA) to digitize a layer of potentially suitable habitat.

61
CHAPTER THREE. Demography of Wilson’s Plovers (Charadrius wilsonia) on North Core
Banks, Cape Lookout National Seashore, North Carolina
ABSTRACT.— The Wilson’s Plover has been designated nationally and regionally as a
Bird of Conservation Concern by the U.S. Fish and Wildlife Service. Population declines have
been documented for other temperate-zone breeding plovers, such as the Piping Plover
(Charadrius melodus) and Snowy Plover (Charadrius nivosus), but little demographic
information is available for the Wilson’s Plover. Estimates of productivity (chicks fledged/pair),
and annual survival rates for adults and juveniles are needed from throughout the Wilson’s
Plovers range to determine the productivity levels needed to maintain a stationary population.
Our objectives were to estimate nest survival, chick survival and productivity for a breeding
population of Wilson’s Plovers at Cape Lookout National Seashore, North Carolina. We
monitored nests with remote cameras and observer visits, and used the Mayfield method to
estimate mean overall survival, and a logistic exposure model to estimate daily survival and
relate nest age, hatch date, year, location, and equipment covariates to survival rate. We banded
and resighted chicks, and used a Cormack-Jolly-Seber model to estimate chick survival.
Mayfield nest survival was 22% and 26% in 2010 and 2011, respectively, and predation was the
leading cause of failure for both years. Fish crows (Corvus ossifragus), raccoons (Procyon lotor),
and feral cats were the primary nest predators at the northern end of the island, while raccoons
were the primary nest predator at the southern end of the island. Camera presence decreased
survival and the addition of a heart rate monitor further decreased survival. Exclosed nests had a
higher daily survival rate than nests that were not exclosed. Nests initiated later in the season and
older nests had lower survival, and nest survival was higher in 2010 than 2011. The daily
survival rate was lower for nests at the north end of the island than for nests at the southern end

62
of the island. We resighted 47 of the 100 chicks we banded as fledglings, for a minimum known
survival rate of 47%, while estimated apparent overall chick survival was 88%. Chick survival
was negatively correlated with hatch date. In addition to contributing to the sparse demographic
data available for this species, this is the first study of which we are aware to document the
effects of nest monitoring equipment on nest survival in a shorebird breeding along the Atlantic
Coast.
INTRODUCTION
The Wilson’s Plover (Charadrius wilsonia) occurs along the Atlantic and Gulf coasts of
the United States (Corbat and Bergstrom 2000). It is designated nationally and regionally as a
Bird of Conservation Concern by the U.S. Fish and Wildlife Service (USFWS, 2008). The U.S.
Shorebird Conservation Plan (Brown et al. 2001) listed Wilson’s Plovers as a Species of High
Concern for the Southeastern Coastal-Plains Caribbean Region (Prioritization Category 4, Brown
et al. 2001). The population is estimated at 6,000 individuals within the U.S., however low
confidence is placed in this estimate (Corbat and Bergstrom 2000, Brown et al. 2001).
Population declines have been documented for other temperate-zone breeding plovers, such as
the Piping Plover (Charadrius melodus) and Snowy Plover (Charadrius nivosus), but no broad-
scale, systematic studies have studied population trends of Wilson’s Plovers (Brown et al. 2001).
Estimates of productivity (chicks fledged/pair), and annual survival rates for adults and juveniles
are needed from throughout the Wilson’s Plovers range to determine the level of productivity
needed to maintain a stationary population. Several studies have estimated demographic
parameters for Wilson’s Plovers in the southern United States (Bergstrom 1982, Bergstrom 1988,
Corbat 1990 and Hood 2006), but there is little current information on Wilson’s Plover
productivity throughout its range. Ray (2010) estimated demographic parameters for a
population of about 20 breeding pairs of Wilson’s Plover in North Carolina, where the predator

63
population was controlled, thus parameter estimates from this study may not be applicable to
sites without predator control. We estimated nest survival, chick survival, and hatching and
fledging rates for a population of Wilson’s Plover on North Core Banks of Cape Lookout
National Seashore.
METHODS
Study Area.— Cape Lookout National Seashore (34° 23’ N, 76° 17’ W, Fig. 1) is located
between Ocracoke Island and Beaufort, North Carolina, USA and is part of the barrier island
ecosystem that extends along much of the Atlantic seaboard from Massachusetts to Florida. The
islands routinely change in shape and number due to wind, waves and currents. During the
study, CALO included the islands of Shackleford Banks (SFB), South Core Banks (SCB), and
North Core Banks (NCB). These islands combined had about 90 km of ocean shoreline and
averaged about 800 m in width (CALO 2008). Cape Lookout National Seashore had no
permanent residents, but NPS managed guest cabins and service facilities available for use by the
public. The islands were accessible via public car/person ferries and by private vessel. Motorized
vehicles including all-terrain vehicles (ATVs) and off-road vehicles (ORVs) were allowed to
drive on the beach. We studied Wilson’s Plovers on North Core Banks (NCB).
Cape Lookout National Seashore is relatively pristine compared to other Atlantic barrier
islands, most of which are inhabited by humans and are subject to beach and dune stabilization
projects that interrupt natural processes, such as dune erosion and the formation of inlets, that
create shorebird habitat. Because natural processes are not interfered with on CALO, there may
be a broader range of habitats available to shorebirds than on barrier islands that are more
influenced by humans.
We conducted out study on the northern-most of CALO’s three islands, NCB, where
Wilson’s Plovers nested at five sites (Fig. 1). North Portsmouth Flats (NPF) and South

64
Portsmouth Flats (SPF) were extensive flats at the northern end of the island. A third northern
site, Kathryn-Jane (KJ), was about 3.5 km south of SPL. At KJ, Wilson’s Plovers nested on the
front beach and in a small vegetated flat behind the primary dunes. At the southwestern end of
the island, nests were associated with two recently closed inlets, New Drum Inlet (NDI) and Old
Drum Inlet (ODI). At both sites, plovers nested in interdune areas adjacent to flats that formed
when the inlets closed.
Field Methods.— We searched for Wilson’s Plovers’ nests during the nesting season
(April to July) by walking transects through all potential plover nesting habitat on North Core
Banks (Fig. 1) every three to four days. If we observed a territorial pair or bird exhibiting nest
defense, we hid in a blind or vegetation and waited for the bird to resume incubation. When we
located a nest we recorded its location using a GPS unit and took a photograph of the nest cup
and surrounding substrate and vegetation. We floated all eggs from nests found with two or three
eggs to estimate incubation stage and hatch and initiation dates (Alberico 1995). We visited nests
every one to three days until failure or hatching.
We deployed auto-triggered cameras (Reconyx, Inc., Holmen, WI) at every nest we
found, except at North Portsmouth Flats, where we exclosed (Melvin et al. 2002) and deployed
cameras at every other nest because we suspected that fish crows (Corvus ossifragus) were using
the cameras to find nests. In 2011, we used exclosures and put cameras at every other nest at
NPF and SPF, because we observed fish crows at these sites. To determine if crows were using
cameras to find nests, we deployed eight experimental cameras for about 24 hours on the flat at
NPF. We placed an artificial nest with plastic eggs about 2 m in front of four of the cameras; the
other four cameras were deployed with no eggs. Cameras were encased in wooden housing for
protection and camouflage, and placed approximately 2 m from nests. Cameras were set to take a

65
photo every five secs and were powered by an external battery (Tempest Batteries, San Jose,
CA) buried in a watertight container near the nest. We visually checked all nests every one to
three days. We changed battery units every five to six days in 2010 and every four to five days in
2011.
To achieve other study objectives (see Chapter One), we deployed artificial egg heart rate
monitors at approximately half the nests that received cameras. We attempted to deploy a heart
rate monitor at every other nest with a camera. If substrate type and dense vegetation prohibited
deployment at a nest, we deployed the unit at the next nest we found. We sealed the digital voice
recorder in a waterproof dry case and buried it 1–2 m from the nest. Battery life was 26.5 hrs and
batteries were changed every one to three days, coincident with a nest or equipment check.
We considered nests to be successful if ≥1 chick hatched. We determined the fate of
nests based on camera footage, signs of flooding or predators before the predicted hatch date, or
by the presence of newly hatched chicks in the nest area. We used camera footage to determine
the failure date for abandoned nests with cameras. We deemed nests without cameras abandoned
if we did not observe adults at the nest for 72 hours. Failure dates for abandoned nests were
assigned as the first date no birds were detected at the nest, based on camera footage (six nests)
or visual observations (one nest). For both camera and non-camera nests we examined the nest-
site for tracks, eggshell fragments or other signs of the cause of failure.
After nests failed or hatched, we photographed the nest-site to record the vegetation type
within 15 cm from the center of the nest. We categorized vegetation based on structure (none,
low forb/shrub, clumped grass, or Salicornia spp.). We used the photo taken when we found the
nest to verify that vegetation structure had not changed enough to affect the categorization during
the nesting period. We used a modified vegetation density board (Higgins et al. 2005, Ray 2010)

66
to estimate horizontal vegetation density in the four cardinal directions at 10 m from the nest
bowl. In the field, we photographed the density board with a camera held at incubating Wilson’s
Plover height over the nest bowl. We then read the density board scores from the photos and
summed rectangles that were ≥ 70% obstructed by vegetation. We used the average reading
from the four cardinal directions to calculate an obstruction index (Ray, 2010).
We captured incubating adults using a drop-box or drop-door trap, and uniquely marked
each bird with a total of four plastic color bands, two on each tarsometatarsus. We captured
chicks by hand in or near the nest within a few hours of hatching and banded them with the same
scheme we used for adults. We attempted to locate broods and resight chicks and adults every
other day until fledging. In addition to targeted brood searches, we conducted resighting surveys
along established routes at the five Wilson’s Plover breeding sites once per week from April
through June, and twice per week in July and August. In addition to surveying known breeding
sites, we surveyed the north tip of the island where we frequently saw Wilson’s Plovers foraging,
but never found a nest, and other areas that looked suitable, but where we never observed
Wilson’s Plovers. These unused, but potentially suitable, sites were small enough that we could
survey the entire site from one location using a spotting scope. During surveys, we counted all
banded and un-banded adults, chicks and fledglings and recorded all nesting territories on a
hand-drawn map in order to estimate how many breeding pairs used NCB.
Analytical Methods.— To facilitate comparisons with previous studies, we used the
Mayfield method, a survival estimation method that accounts for nests that fail before detection,
and assumes constant survival over time (Mayfield 1961, 1975) to calculate an overall estimate
of nest survival. We used a logistic-exposure model (Rotella et al. 2004, Shaffer 2004) to
estimate the daily survival rate (DSR) and relate time, habitat and equipment covariates to DSR.

67
We included heart rate monitor presence, camera presence, exclosure use, initiation date, nest
age, site, year, vegetation presence and structure type within 15 cm of the nest bowl, horizontal
vegetation density, and location (north vs. south end of the island) to generate a final model set.
We constructed the top model in three stages starting with time and equipment effects, then
adding vegetation effects, and finally a location effect. Models that were > 3 ΔAICc values better
than competing models served as template models for following stages. First, we examined all
possible single and multivariable models with the following variables: heart rate monitor
presence, camera presence, exclosure use, initiation date, nest age, site, and year. Second, we
added the nest microhabitat variables: vegetation presence and structure type within 15 cm of the
nest bowl, and horizontal vegetation density. We then added a variable called location which
distinguished northern sites from southern sites, to the resulting top models to generate the final
model. We tested the fit of the global model with a Hosmer-Lemeshow goodness-of-fit test
(Hosmer and Lemeshow 1989). We used SAS (SAS Institute, Inc., Cary, NC) to fit the logistic-
exposure models, and Akaike’s Information Criterion corrected for small sample size (AICc) to
rank models (Akaike 1973, Burnham and Anderson 2003).
We used a Cormack-Jolly-Seber recapture model in program MARK (White and
Burnham 1999) to estimate chick survival and resight rates. We estimated daily survival rate
using seven encounter intervals, the first six intervals were five days long, and encompassed the
time from hatch until 30 days of age. Because we were often unable to resight chicks until after
they fledged, we counted birds as seen in the final interval if we saw them anytime after 30 days.
In addition to models where survival and resight rates varied with time, we constrained the
variation in resight rate in some models to allow for different resight rates in the first one or two
weeks, and in the final post-fledging interval. We included year, site and hatch date as individual

68
covariates. We used the quasi-likelihood Akaike’s Information Criterion corrected for small
sample size (QAICc) to rank models (Burnham and Anderson 2003). We estimated chick daily
survival from the resulting best model, and estimated apparent overall chick survival by raising
the mean daily survival estimate to the 30th
power and calculated the associated deviance using
the delta method (Powell 2007).
RESULTS
Nest Survival.— We estimated that about 40 breeding pairs used NCB in both years; the
maximum number of territorial pairs observed concurrently was 39 in 2010 and 41 in 2011. We
monitored 35 nests in 2010 and 72 nests in 2011. Nest initiation began in mid to late April, and
peak hatching lasted from late May through June in both years (Fig. 2). Clutch sized ranged from
one to three, with a median clutch size of three; we only documented five nests with two eggs,
and one nest with one egg (Table 1). We observed a laying period of four to eight days, with a
median of six days (Table 1, Fig. 3). Raw hatching success (% of nests that hatched ≥ 1 chick)
was higher than Mayfield nest survival estimates in both years (Table 1). Predation was the
leading cause of nest failure (Table 2). Fish crows, raccoons (Procyon lotor) and feral cats were
the primary nest predators at northern sites, while raccoons were the primary nest predator at
southern sites (Table 3). All eight of the experimental cameras were visited by crows within 24
hours of deployment.
In 2011, we recorded re-nests by 10 pairs that had at least one member banded at the
beginning of the breeding season. Both the male and female were banded in two pairs, and the
other eight pairs consisted of a female paired to an un-banded male (or potentially multiple un-
banded males if multiple nesting attempts took place). One banded pair stayed together for three
nesting attempts; their third nest hatched (it was exclosed). The other banded pair made two
nesting attempts and hatched their second nest (it was exclosed). Four females paired with un-

69
banded males and successfully hatched and raised a brood from their first nests (two were
exclosed and two were not). Two females made two nesting attempts with un-banded males and
successfully hatched their second nests (one exclosed, one, not). One banded female made three
unsuccessful nesting attempts at nests that were not exclosed with un-banded males, and another
banded female and un-banded male made one unsuccessful nesting attempt (not exclosed). For
this subset of nests, all exclosed nests produced ≥ one chick. This should be considered a
minimum number of re-nests as it is likely, based on the timing of the initial nests and the re-
nesting attempts we documented, that we missed some nesting attempts.
We used the top daily nest survival model to estimate parameters because it had 89% of
AICc weight, and was > 3 AICc values better than competing models (Table 4). Nest exclosures,
camera and heart rate monitor presence, initiation date, nest age, year and location (north end vs.
south end of island) affected nest survival (Table 4). Daily survival rate was lower for nests at
northern sites than nests at the southern end of the island (Table 5). Exclosed nests had a higher
DSR (Table 5). Only 4.0% (1 nest) of nests without cameras were abandoned, while 7.2% (6
nests) with cameras were abandoned, however, a Fisher exact test showed no statistically
significant relationship between camera presence and abandonment (P = 0.37). Camera presence
decreased DSR, and the addition of a heart rate monitor further decreased DSR (Table 5). Nests
initiated later in the season had lower DSR (Table 5). Nest survival decreased with nest age, and
survival was higher in 2010 than in 2011 (Table 5). Neither horizontal vegetation density nor
vegetation structure within 15 cm of the nest bowl impacted survival.
Chick Survival.— Of the 100 chicks we banded in 2010 and 2011, we resighted 47 as
fledglings, for a minimum known survival rate of 47% (Table 1). The top model four models had
90% of the QAICc weight (Table 6) and included effects of hatch date and year on apparent

70
survival, and a time effect on resight rate. We model-averaged parameters estimates across the
entire model set for resight and 5-day apparent survival rates. Estimated apparent 5-day survival
was 99.5% and overall apparent survival for a 30 day period was 88% (Table 1). Hatch date was
in the top four models, and had a negative correlation with survival, but the confidence intervals
encompassed one, (βx = –0.121, SE = 0.080, parameter estimate = 0.886, 95% CI =0.757, 1.036).
Year was in one of the top models, and the survival estimate was higher in 2010, but, again, the
confidence intervals encompassed one, (βx = 0.1152, SE = 0.142, parameter estimate = 1.220,
95% CI =0.850, 1.482). Resight rate was lowest from 11–25 days of age, and increased when
chicks began to fledge (Figure 4). Neither time nor site effects were in any of the top models
(Table 6), so we reported a single resight rate from a representative site.
DISCUSSION
Nest Survival.— The mean incubation period of 25 days observed in this study was
similar to that reported by Bergstrom (1988), Corbat (1990) and Ray (2010). Some nests at our
site hatched at 22 days while others hatched at 29 days. We calculated the incubation period
from the laying of the final egg to the date the first chick hatched, so if birds began incubating
regularly when the first egg was laid, this could result in our calculating a shorter incubation
period than actually occurred. We observed that some birds regularly incubated incomplete
clutches in nests located behind the dunes where restricted airflow increased ambient
temperatures, on sand flats where blowing sand would bury unattended eggs, and later in the
season when the weather was warmer. The mean laying period of six days that we observed was
similar to that reported by Bergstrom (1988), and our mean clutch size of 2.9 was similar to
clutch sizes reported in other studies (Bergstrom 1988, Corbat 1990, and Ray 2010).
It is possible that the higher DSR for nests in 2010 was due to changes in search effort
between the years. In 2010, we found and monitored about half the Wilson’s Plover nests, and

71
were more likely to find nests that survived for longer. In 2011 we devoted more time to nest
searching, which allowed us to find nests earlier and monitor more nests. Weather conditions
were similar for both years, with the exception of a storm surge in late May 2010 that flooded
five nests.
Mayfield nest survival in our study was lower than Mayfield nest survival at another site
in North Carolina where the predator population was controlled (44% and 46%; Ray 2010), but
close to estimates from studies in southern Texas and Georgia (23% and 27% respectively;
Bergstrom 1988, Corbat 1990). Our findings that vegetative cover type near the nest bowl did
not affect nest survival differed from previous studies in Georgia and North Carolina, which
found that nests near vegetation clumps had higher hatch success (Corbat 2006, Ray 2011), and a
study in Texas that found that nest survival was lower near clumped vegetation (Hood 2006).
Despite exclosure use at northern sites, nests at these sites had a lower DSR. The two
largest northern sites, NPF and SPF, were adjacent to maritime forest and extensive marsh,
habitats which may have supported a higher density of predators than sites at the narrower,
southern end of the island. The forest also provided nesting habitat for fish crows, which caused
most of the nest failure at NPF. In addition to the common nest predators (fish crows, raccoons,
and feral cats), we documented nests being depredated by an American Oystercatcher
(Haematopus palliatus) pair and a nutria (Myocastor coypus). In 2010, we could not identify the
cause of failure for two nests that failed before we deployed cameras at them, and in 2011 we
could not identify the cause of failure for 10 nests that failed before camera deployment, or were
not assigned a camera. It is likely that these nests were depredated since physical signs of
overwash were easy to detect, and we did not see adults defending chicks nearby.

72
Unlike Hood (2006), who found no effect of time on nest survival, at our study site, older
nests, and nests initiated later in the season had lower survival. In both years we observed that
the first wave of nest predation coincided with the beginning of the Least Tern (Sternula
antillarum) nesting season. Other studies have found that Piping Plovers and other shorebirds
benefit from nesting within colonies of birds that aggressively defend their nests (Burger 1987,
Powell 2001, Lauro and Tanacredi 2002, Nguyen et al. 2003). However, at most of our nesting
sites, Wilson’s Plovers nested adjacent to tern colonies instead of among the terns, and so may
not have benefited from colony defense. Instead, they may have experienced higher predation as
predators switched from other food sources to eggs in response the higher nest density when
terns begin nesting (Abrams and Matsuda 1996, Lecomte et al. 2008, Norbury and Heyward
2008). Wilson’s Plovers nested within a tern colony at SPF, and in both years, initial Wilson’s
Plover nest depredation at SPF coincided with the beginning of tern nesting season. This is also
when we began seeing raccoon tracks on the flats. In 2011, two pairs of Wilson’s Plovers
initiated nests in the sand and shell flats at ODI and NDI (tern colony sites in both years). The
nest at ODI was depredated before terns begin nesting, and the nest at NDI was abandoned on 15
May when terns began to arrive at the site. We recorded multiple incidences of Least Terns
harassing Wilson’s Plovers on the nests monitored by cameras at SPF, where tern nests were
sparse in comparison to other tern colonies on the island. Harassment by terns may be the reason
Wilson’s Plovers avoided nesting in higher density colonies.
Nests initiated later in the season may be more likely to be abandoned than earlier nests.
In 2010, we did not observe any abandoned nests, but in 2011, seven nests were abandoned, one
on 15 May (within a tern colony), two from 1 to 15 June, and four after 26 June. Two of these
nests were exclosed; however the birds incubated for two to three weeks within the exclosure

73
before abandoning their nests, so we do not think that the deployment of the exclosure caused
abandonment. Roche (2010) found disappearance of one of the adults was the primary reason for
nest abandonment in Piping Plovers, but we do not think that adult mortality was the cause of
abandonment in our study, because we resighted all banded birds from abandoned nests post-
abandonment. However, both members of the pair were banded only at one abandoned nest; only
one member was banded at five abandoned nests, and neither bird was banded at one abandoned
nest. Thus we were unable to verify this.
Contrary to our findings, most of the studies of the effect of camera monitoring on nest
survival have found that camera presence increased daily survival rates (Thompson et al. 1999,
Buler and Hamilton 2000, Pietz and Granfors 2000, Small 2005, Richardson et al. 2009) or had
no effect (Stake and Cimprich 2003, Coates et al. 2008, Richardson et al. 2009). These studies
were conducted on grassland and forest birds which nest in more complex environments and
have different suites of nest predators than shorebirds. The decrease in depredation rate seen in
these studies may be attributed to avoidance of nest monitoring equipment by nest predators
(mainly rodents) due to neophobia (Richardson et al. 2009). Because shorebirds nest in areas
with little to no cover, and because coastal environments may harbor more generalist predators,
an object near the nest may attract predators to the vicinity of the nest from some distance away.
We are not aware of other studies that have documented the effect of nest monitoring cameras on
nest survival in a temperate, coastal ecosystem. In a study of Arctic shorebirds, McKinnon and
Bêty (2009) found that daily survival rates of nests with cameras did not differ from nests
without cameras. Another study in the Arctic found that nests with cameras were more likely to
be depredated, however unlike McKinnon and Bêty (2009), this study did not control for the
effects of observer visits, and nests with cameras experienced more frequent visits by researchers

74
than nests without cameras, which could have accounted for the increased depredation rate (Tulp
et al. 2000). In our study, nest visit intervals were about the same for nests with and without
cameras but nests with cameras experienced a slightly longer visit interval on average (1.4 days
vs. 1.2 days).
Nest predators may habituate to novel items and even come to associate them with nests
(Johnson and Oring 2002, Murphy et al. 2003, Niehaus et al. 2004). Our experimental cameras
confirmed that fish crows were attracted to cameras. Although corvids can be deterred by human
objects (Herranz et al. 2002), increasing the density of cameras and duration of the study may
increase the likelihood that they associate cameras with nests (Lenington 1979, Richardson et al.
2009).
Monitoring nests with cameras allows for the collection of detailed behavioral data, and
limits uncertainty in assigning nest fates (Lariviere 1999, Pietz and Granfors 2000, Williams and
Bohall Wood 2002). For instance, predators may be attracted to recently depredated nests,
perhaps by egg remains or increased activity at the nest and the signs of the original predator can
be obscured by these later visitors. After depredation by another predator species, we often found
ghost crab (Ocypode quadrata) holes with eggshell in them near the nest bowl, and without
camera footage we may have assumed that ghost crabs were common nest predators, when in
fact, ghost crabs did not cause any nests to fail in our study. Ghost crabs did sometimes remove
an egg from a nest, however, plovers always retrieved these eggs and continued incubating, so
we did not attribute any depredation of nests to ghost crabs. In one case, the plover rejected an
egg from the nest after retrieving one from a ghost crab; likely it was the same egg removed by
the ghost crab, and it had been damaged. Camera monitoring may also decrease the need for
observer visits to the nest, which could lower predation risk (Bêty and Gauthier 2001). However,

75
leaving monitoring equipment near the nest can effect nest survival leading to biased
demographic estimates, an inaccurate understanding of natural causes of nest failure (Thompson
et al. 1999, Pietz and Granfors 2000, Herranz et al. 2002), and an effect on population
demography. The effects of nest monitoring equipment on nest survival probably depend on the
sensitivity of the species being monitored, habitat and predator suite, and the duration of the
study. Although camera monitoring can provide valuable information, cameras should be used
with caution, and steps such as limiting visit rate and increasing the distance of the camera from
the nest (McKinnon and Bêty 2009) should be taken to minimize effects of cameras on nest
survival. It is important that studies that place objects at nest sites document the effects of these
objects on nest survival. The use of artificial egg heart rate monitors further decreased survival
even though the recording device and cable were buried and the birds appeared to incubate
normally with the artificial egg in the nest. The possibility that the addition of the artificial egg
decreased incubation bouts or otherwise increased the incubating plover’s activity level, and
attracted predators, is something we will investigate in future analyses.
Chick Survival.— We believe that our estimate for overall, apparent survival was biased
high because our detection rate was low until the final post-fledging interval. During the first 10
days of age we detected nearly all of the chicks in the analysis at least once in order to band them
(two chicks were banded after 15 days of age). We were sometimes able to resight chicks at this
stage while they were still in the vicinity of the nest, or while moving across open areas to a final
foraging territory. For the next 20 days, we were very unlikely to resight chicks as they stayed in
dense vegetation until after fledging. After 30–35 days chicks emerged from the vegetation and
foraged in open areas, and our odds of resighting them were higher. When chicks emerged from
the vegetation, they could fly well, thus we were unable to determine the exact fledging age.

76
Although we couldn’t resight chicks during most of the brood-rearing period, we feel that we
could accurately tell if a brood was still active (≥ 1chick alive) by the parents’ defensive
behavior. If we deemed a brood active until day 30, we always re-sighted at least one fledgling
from that brood, however, we never later resighted a fledgling from any of the 11 broods that we
deemed failed prior to day 30. Chicks are most vulnerable immediately after hatching, and the
broods that failed usually did so in the first week after hatching. Although time (age) did not
affect chick survival in our analysis, this is probably because we did not detect chicks frequently
enough between hatching and fledging to tell when mortality occurred. Based on this evidence,
we believe that the raw survival rate of about 50% survival for chicks was probably closer to
reality than the 88% survival estimate from the Cormack-Jolly-Seber model. The number of
chicks hatched per pair at our site was similar to the number of chicks hatched per pair recorded
during a 2-year study by Ray (1.47 and 1.64; 2010), but our estimate of chicks fledged/pair
(0.78) was lower than Ray’s (0.88 and 1.00; 2010). It appears that throughout all parts of the
breeding cycle predation pressure was higher at our site than at Ray’s (2010), however we
speculate that plovers may be compensating for a lower nest survival rate by re-nesting more
than plovers in Ray’s (2010) study. Ray (2010) documented 17 initial nests and three re-nests in
2008, and 22 initial nests and four re-nests in 2009.
Although survival was lower for chicks with later hatch dates, this trend was not
significant in our study. The trend toward lower survival later in the season has been documented
previously in Wilson’s Plovers (Ray 2010) and other shorebirds (Moreno 1998, Arnold et al.
2006, Catlin 2011). This may be because experienced breeders arrive earlier in the season and
establish higher quality territories than the late-arriving, less experienced birds (Aebischer et al.
1996, Møller et al. 2004). Food resources may also become scarce later in the season, and

77
predation pressure may increase with an influx of juvenile predators (Loegering and Fraser 1995,
Elias et al. 2000).
Wilson’s Plovers are thought to forage primarily on fiddler crabs (Bergstrom 1988,
Corbat and Bergstrom 2000, Ray 2010). However, our study site did not have extensive fiddler
crab flats, and broods foraged primarily in dry vegetation. Several broods foraged on moist sand
or mud flats, but use of these habitat types appeared to be limited to a few broods for only part of
the brood-rearing period, despite their apparent availability. It is possible that we underestimated
the use of open foraging sites for broods because Wilson’s Plovers were extremely sensitive to
our presence and may have retreated to vegetation before we could detect them. Plovers that
nested in the Salicornia often raised their broods along the edge of the Spartina marsh near the
nest-site, suggesting that the Salicornia flat, Spartina marsh border provided adequate food
resources. In 2011, subterranean termites (Rhinotermitidae spp.) swarmed on the Salicornia flats,
and broods appeared to be foraging on the termites. In 2010, we did not see termite swarms, but
the broods used the same areas, and presumably ate other insects. Ray (2010) found that broods
thrived foraging on the front beach when a tidal anomaly inundated fiddler flats, and suggested
that Wilson’s Plover foraging strategies are flexible and adapted to the dynamic coastal
environment they inhabit.
Although predation pressure was high, Wilson’s Plovers at our site managed to produce
the same number of chicks per pair as at another site where nest failure rates were lower (Ray
2010), probably through multiple nesting attempts. However, higher chick mortality probably
decreased our fledging rate compared to Ray’s (2010). Our study expands our limited
understanding of Wilson’s Plover breeding performance, and provides an estimate of
productivity at a site that is geographically similar to Ray’s (2010), yet has a different predator

78
community, lower predation pressure, and less habitat modification by humans. Additional
studies of productivity and population dynamics throughout the Wilson’s Plovers range,
including estimates of wintering adult and juvenile survival, are needed to understand if
productivity of 0.78 is sufficient to produce a viable population in North Carolina.

79
LITERATURE CITED
Abrams, P. A., and H. Matsuda. 1996. Positive indirect effects between prey species that share
predators. Ecology 77: 610 – 616.
Aebischer, A., N. Perrin, M. Krieg, J. Studer, and D.R. Meyer. 1996. The role of territory choice,
mate choice and arrival date on breeding success in the Savi’s Warbler (Locustella
luscinioides). Journal of Avian Biology 27: 134–152.
Akaike, H. 1973. Information theory and an extension of the maximum likelihood principle.
Pages 267–281 in B. N. Petran and F. Csaki, editors. International symposium on
information theory. Second edition. Akademiai Kiado, Budapest, Hungary.
Alberico, J. A. R. 1995. Floating eggs to estimate incubation stage does not affect hatchability.
Wildlife Society Bulletin. 23:212–216.
Arnold, J. M., J. J. Hatch, and I. C. T. Nisbet. 2006. Effects of egg size, parental quality and
hatch-date on growth and survival of Common Tern (Sterna hirundo) chicks. Ibis 148:
98–105.
Bergstrom, P. W. 1982. Ecology of incubation in Wilson’s Plover (Charadrius wilsonius). Ph.D.
dissertation. University of Chicago, Chicago, Illinois, USA.
Bergstrom, P. W. 1988. Breeding biology of Wilson’s Plovers. The Wilson Bulletin. 100: 25–35.
Bêty, J., and G. Gauthier. 2001. Effects of nest visits on predator activity and predation rate in a
greater snow goose colony. Journal of Field Ornithology. 72:573–586
Brown, S. C., C. Hickey, B. Harrington, and R. Gill. 2001. The U.S. Shorebird Conservation
Plan. Second Edition. Manomet Center for Conservation Sciences, Manomet,
Massachusetts, USA.
Buler, J. J., and R. B. Hamilton. 2000. Predation of natural and artificial nests in a southern pine
forest. The Auk. 117:739–747.

80
Burger, J., 1987. Physical and social determinants of nest-site selection in Piping Plover in New
Jersey. Condor. 89:811–818.
Burnam, K. P., and D. R. Anderson. 2003. Model selection and multimodel inference: a practical
information-theoretic approach, 2nd ed. Springer-Verlag, New York.
Catlin, D. H., J. D. Fraser, J. H. Felio, and J. B. Cohen. 2011. Piping plover habitat selection and
nest success on natural, managed, and engineered sandbars. The Journal of Wildlife
Management. 75:305–310.
Coates, P. S., J. W. Connelly, and D. Delehanty. 2008. Predators of Greater Sage-Grouse nests
identified by video monitoring. Journal of Field Ornithology 79:421–428
Corbat, C. A. 1990. Nesting ecology of selected beachnesting birds in Georgia. Dissertation.
University of Georgia, Athens, USA.
Corbat, C. A., and P. W. Bergstrom. 2000. Wilson's Plover (Charadrius wilsonia), The Birds of
North America Online (A. Poole, Ed.). Ithaca: Cornell Lab of Ornithology, USA.
Accessed 15 March 2012.
Elias, S.P., J. D. Fraser, and P. A. Buckley. 2000. Piping Plover brood foraging ecology on New
York barrier islands. Journal of Wildlife Management. 64:346–354.
Herranz, J., M. Yanes, and F. Suarez. 2002. Does photo-monitoring affect nest predation?
Journal of Field Ornithology. 73:97–101
Higgins, K. F., K. J. Jenkins, G. K. Clambey, D.W. Uresek, D. E. Naugle, J. E. Norland, and W.
T. Barker. 2005. Vegetation sampling and measurement, p. 524–553 In Braun, C.E. [ed],
Techniques for wildlife investigations and management. Sixth edition. Wildlife Society,
Bethesda, MD, USA

81
Hood, S. L. 2006. Nesting ecology of Snowy and Wilson’s Plovers in the lower Laguna Madre
region of Texas. Thesis, Mississippi State University, Starkville, Mississippi, USA
Hosmer, D. W. and S. Lemeshow. 2000. Applied logistic regression. Second edition. John Wiley
and Sons, Inc., New York, New York, USA
Johnson, M., and L. W. Oring. 2002. Are nest exclosures an effective tool in plover
conservation? Waterbirds 25:184–190
Lariviere, S. 1999. Reasons why predators cannot be inferred from nest remains. Condor
101:718–721.
Lauro, B., and J. Tanacredi. 2002. An examination of predatory pressures on piping plovers
nesting at Breezy Point, New York. Waterbirds 25: 401–409.
Lecomte, N., V. Careau, G. Gauthier, and J. F. Giroux. 2008. Predator behavior and predation
risk in the heterogenous Arctic environment. Journal of Animal Ecology 77: 439–447.
Lenington, S. 1979. Predators and blackbirds: the "uncertainty principle" in field biology. Auk
96:190–192.
Loegering, J. P., and J. D. Fraser. 1995. Factors affecting Piping Plover chick survival in
different brood-rearing habitats. Journal of Wildlife Management 59:646–655.
Mayfield, H. R. 1961. Nesting success calculated from exposure. Wilson Bulletin 73:255–261.
Mayfield, H. F. 1975. Suggestions for calculating nest success. The Wilson Bulletin 87: 456–
466.
McKinnon, L., and J. Bêty, 2009. Effect of camera monitoring on survival rates of High-Arctic
shorebird nests. Journal of Field Ornithology, 80: 280–288.
Melvin, S. M., L. H. MacIvor, and C. R. Griffin. 1992. Predator exclosures: A technique to
reduce predation at Piping plover nests. Wildlife Society Bulletin, 20:143–148.

82
Møller, A. P., F. de Lope, and N. Saino. 2004. Parasitism, immunity, and arrival date in a
migratory bird, the Barn Swallow. Ecology 85: 206–219.
Moreno, J. 1998. The determination of seasonal declines in breeding success in seabirds.
Etología 6: 17–31.
Murphy, R. K., I. M. G. Michaud, D. R. C. Prescott, J. S. Ivan, B. J. Anderson, and M. L.
French-Pombier. 2003. Predation on adult piping plovers at predator exclosure cages.
Waterbirds 26:150–155.
Nguyen, L. P., E. Nol, and K. P. Abraham. 2003. Nest success and habitat selection of the
semipalmated plover on Akimiski Island, Nunavut. Wilson Bulletin 115: 285–291.
Niehaus, A. C, D. R. Ruthrauff, and B. J. McCaffery. 2004. Response of predators to western
sandpiper nest exclosures. Waterbirds. 27:79–82
Norbury, G., and R. Heyward. 2008. Predictors of clutch predation of a globally significant
avifauna in New Zealand’s braided river ecosystems. Animal Conservation 11: 17–25.
Pietz, P. J., and D. A. Granfors. 2000. Identifying predators and fates of grassland passerine nests
using miniature video cameras. Journal of Wildlife Management. 64:71–87
Powell, A. N. 2001. Habitat characteristics and nest success of Snowy Plovers associated with
California Least Tern colonies. Condor 103: 785–792.
Powell, L. A. 2007. Approximating variance of demographic parameters using the delta method:
a reference for avian biologists. Condor 109:949–954
Ray, K. L. 2010. Factors affecting Wilson’s Plover (Charadrius wilsonia) demography and
habitat use at Onslow Beach, Marine Corps Base Camp Lejeune, North Carolina. Thesis.
Virginia Polytechnic and State University, Blacksburg, Virginia, USA

83
Richardson, T.W., T. Gardali, and S. H. Jenkins. 2009. Review and meta-analysis of camera
effects on avian nest success. Journal of Wildlife Management 73:287–293.
Roche, E. A., T.W. Arnold, and F. J. Cuthbert. 2010. Apparent nest abandonment as evidence of
breeding-season mortality in Great Lakes Piping Plovers (Charadrius melodus). The Auk
127: 402–410.
Rotella, J. J., S. J. Dinsmore, and T. L. Shaffer. 2004. Modeling nest-survival data: a comparison
of recently developed methods that can be implemented in MARK and SAS. Animal
Biodiversity and Conservation 27:187–205.
Shaffer, T. L. 2004. A unified approach to analyzing nest success. Auk 121: 526–540.
Small, S. L. 2005. Mortality factors and predators of spotted towhee nests in the Sacramento
Valley, California. Journal of Field Ornithology 76: 252–258.
Stake, M. M., and D. A. Cimprich. 2003. Using video to monitor predation at black-capped vireo
nests. Condor 105:348–357.
Thompson, F. R., III, W. Dijak, and D. E. Burhans. 1999. Video identification of predators at
songbird nests in old fields. Auk 116:259–264
Tulp, I., H. Schekkerman, and M. Klaasen. 2000. Studies on breeding shorebirds at Medusa Bay,
Taimyr, in summer 2000. Alerra, Green World Research,Wageningen, The Netherlands.
U.S. Fish and Wildlife Service (USFWS). 2008. Birds of conservation concern 2008. United
States Department of Interior, Fish and Wildlife Service, Division of Migratory Bird
Management, Arlington, Virginia. 85 pp.
White, G. C. and K. P. Burnham. 1999. Program MARK: survival estimation from populations
of marked animals. Bird Study 46: S120–S138.

84
Williams, G. E., and P. Bohall Wood. 2002. Are traditional methods of determining nest
predators and nest fates reliable? An experiment with wood thrushes (Hylocichla
mustelina) using miniature video cameras. Auk. 119:1126–1132.

85
TABLES
Table 1. Demographic estimates and standard errors for Wilson’s Plovers (Charadrius wilsonia) at Cape Lookout National Seashore
in 2010 and 2011. Estimates are missing for some parameters in 2010 because we lacked sufficient sample size (laying and incubation
days), or because we did not monitor all broods (chick hatched and fledged/pair). Sample size of nests, chicks, and pairs used in
calculating estimates in parentheses after value.
a Estimates based on no. of nests not depredated during the laying period.
b Estimate based on no. of nests found with one egg and not depredated during the laying period.
c Estimate based on no. of nests we observed from the time the clutch was complete to the hatch date.
d Estimates based on total no. of nests found.
e Estimates based on total no. of nests found.
f Estimates based on no. of chicks banded.
g Estimate based on maximum no. pairs (banded and un-banded) observed holding nesting territories, and no. of chicks (banded and
un-banded) counted in all broods that we observed.
Year Clutch sizea
Laying daysb
Incubation daysc
Hatch
Successd
Mayfield nest
survivale
Chick apparent
survivalf
Chicks
hatched/pairg
Chicks
fledged/pairh
Percentage banded
chicks to fledge
2010 2.97±0.03 (35) 37% (35) 22% (35) 49% (35)
2011 2.91±0.04 (70) 6.03±0.20 (32) 24.62 ±0.58 (13) 31% (72) 26% (72) 1.8±0.02 (41) 0.78±0.02 (41) 46% (65)
Total 2.93±0.03 (105) 33% (107) 25% (107) 0.90±0.15 (100) 47% (100)

86
h Estimate based on maximum no. pairs (banded and un-banded) observed holding nesting territories, and no. of fledglings (banded
and un-banded) that we observed at near a brood territory at 30–35 days post hatching date. Hatching date was known for most
broods, but estimated based on chick age for some.

87
Table 2. Nest fates and causes of failure for Wilson’s Plovers (Charadrius wilsonia) at Cape Lookout National Seashore in 2010 and
2011. Failure cause was identified from camera footage or physical signs.
a Nests assigned an unknown fate were likely depredated since physical signs of overwash were easy to detect, and we did not see
adults defending chicks nearby. Avian predators may leave very little sign, and tracks and other signs of predators can be obscured by
wind and rain.
Year n % n % n % n % n % n %
2010 13 37% 15 43% 0 0% 4 11% 1 3% 2 6%
2011 22 31% 34 47% 7 10% 0 0% 0 0% 10 14%
Total 35 32% 49 45% 7 6% 4 4% 1 1% 12 11%
Hatched Depredated Abandoned Flooded Not viable Unknown

88
Table 3. Nest predators of Wilson’s Plovers (Charadrius wilsonia) at the north and south end of North Core Banks, Cape Lookout
National Seashore in 2010 and 2011. Predators were identified on camera and/or by physical signs. Percent represents the percentage
of all nests for a year depredated by each predator species. Other = an American Oystercatcher (Haematopus palliatus) pair and a
nutria (Myocastor coypus).
Year Location n % n % n % n % n %
North 12 34% 3 9% 3 9% 4 11% 2 6%
South 3 9% 0 0% 3 9% 0 0% 0 0%
Total 15 43% 3 9% 6 17% 4 11% 2 6%
North 24 33% 13 18% 7 10% 4 6% 0 0%
South 10 14% 1 1% 9 13% 9 13% 0 0%
Total 34 47% 14 19% 16 22% 4 6% 0 0%
49 45% 17 16% 22 31% 8 7% 2 2%
Total
Depredated
Fish Crow
( Corvus
ossifragus )
Raccoon
( Procyon
lotor ) Feral Cat Other
2010
2011
Grand Total

89
Table 4. Top-ranked models for examination of factors affecting daily nest survival of Wilson’s Plover (Charadrius wilsonia) nests at
Cape Lookout National Seashore, North Carolina, 2010-2011. We constructed the top model in three stages starting with time and
equipment effects, then adding vegetation effects, and finally a location effect. Models that were > 3 ΔAICc values better than
competing models served as template models for following stages. The presence of an artificial egg heart rate monitor is indicated by
the variable “HR monitor”. Location distinguishes sites at the northern end of the island from sites at the southern end of the island. K
= no. of parameters.
Models, by variable typeDeviance K AICc ΔAICc
Model
likelihood wi
Location effects
Exclosure, Nest age, Initiation date, Year, Camera, HR Monitor, Location 507.30 8 523.40 0.00 1.00 0.89
Microhabitat vegetation effects
Exclosure, Nest age, Initiation date, Year, Camera, HR Monitor 525.70 7 539.70 0.00 1.00 0.31
Exclosure, Nest age, Initiation date, Camera, HR Monitor 527.90 6 539.90 0.20 0.90 0.28
Exclosure, Nest age, Initiation date, Year, Camera, HR Monitor, Veg type 521.40 10 541.40 1.70 0.43 0.13
Exclosure, Initiation date, Camera, HR Monitor 532.20 5 542.30 2.60 0.27 0.08
Time and equipment effects
Exclosure, Nest age, Initiation date, Year, Camera, HR Monitor 525.70 7 539.70 0.00 1.00 0.39
Exclosure, Nest age, Initiation date, Camera, HR Monitor 527.90 6 539.90 0.20 0.90 0.35
Exclosure, Initiation date, Camera, HR Monitor 532.20 5 542.30 2.60 0.27 0.11

90
Table 5. Parameter estimates, standard error, log-odds ratios, and 95% confidence intervals from
the best model predicting Wilson’s Plovers (Charadrius wilsonia) nest survival (N=107 nests) at
Cape Lookout National Seashore, North Carolina, 2010-2011. The presence of an artificial egg
heart rate monitor is indicated by the variable “HR monitor”. Location distinguishes sites at the
northern end of the island from sites at the southern end of the island.
Intercept 6.19 0.70 NA NA NA
Camera -1.18 0.38 0.31 0.15 0.64
Exclosure 3.54 0.66 34.63 9.47 126.67
HR monitor -0.92 0.33 0.40 0.21 0.76
Initiation date -0.03 0.01 0.97 0.95 0.99
Location -1.10 0.34 0.33 0.13 0.48
Nest age -0.05 0.01 0.96 0.93 0.98
Year -0.91 0.33 0.40 1.31 4.76
Upper
95% CLEffect
Parameter
Estimate SE
Log-odds
ratio
Lower
95% CL

91
Table 6. Top-ranked models (90% of QAICc weights) estimating resight rate (p) and apparent
daily survival rate (φ) for Wilson’s Plover (Charadrius wilsonia) chicks at Cape Lookout
National Seashore, North Carolina, 2010–2011.
a Hatch = number of days after 19 May that a chick hatched, interval_2 = estimates for the first
two resight intervals are different from next three intervals, which are different from estimates
for the last interval, interval_1 = estimates for the first and last resight intervals are different
from the other four intervals, (t) time-specific variation, c-hat = 1.68.
Model a
QAIC c Δ QAIC c w i Model likelihood K Deviance
φ (hatch) p(interval_2) 297.2 0.0 0.57 1.00 5 286.8
φ (hatch) p(t) 300.2 3.0 0.13 0.22 8 283.3
φ(hatch) p(interval_1) 300.6 3.4 0.11 0.19 5 290.2
φ (hatch, yr) p(t) 300.7 3.5 0.10 0.17 9 281.6

92
FIGURES
Figure 1. North Core Banks, Cape Lookout National Seashore, North Carolina with five nesting
sites of Wilson’s Plovers (Charadrius wilsonia) in 2010 and 2011, and a detailed view of the
four largest nesting sites: North Portsmouth Flats, South Portsmouth Flats, Old Drum Inlet, and
New Drum Inlet.

93
Figure 2. Hatch dates for Wilson’s Plover (Charadrius wilsonia) nests at Cape Lookout National
Seashore, North Carolina, 2010–2011.
0
1
2
3
4
5
6
7
No. nes
ts h
atch
ed
2010
2011

94
Figure 3. Number of days for Wilson’s Plover (Charadrius wilsonia) to complete a clutch at
Cape Lookout National Seashore, North Carolina, 2010–2011. We calculated the incubation
period as the time from the laying of the final egg to the date the first chick hatched.
0
2
4
6
8
10
12
4 5 6 7 8
No. nes
ts
No. days to complete clutch

95
Figure 4. Resight rate for Wilson’s Plover (Charadrius wilsonia) chicks at Cape Lookout
National Seashore, North Carolina, 2010–2011.
0
0.1
0.2
0.3
0.4
0.5
0.6
0.7
0.8
0.9
1
1-5 days 6-10 days 11-15 days 16-20 days 21-25 days 26-30 days
Res
ight
rate
Days since hatching
Resight rate
95% CI

96
CONCLUSION
There is little peer-reviewed information available for the Wilson’s Plover. Population
estimates are uncertain and reproductive parameter estimates come from a few small-scale
studies. Range-wide surveys of potential habitat are needed to generate a better estimate of the
breeding population. Many of the Atlantic and Gulf states already conduct breeding season
window counts of shorebirds, including Wilson’s Plovers, but these data are not collected and
organized across states.
North Carolina conducts state-wide window counts of Wilson’s Plovers from 1 – 10 June
each year. During our study, we conducted the Wilson’s Plover window census on North Core
Banks (NCB), and the National Park Service (NPS) censused the rest of Cape Lookout National
Seashore; the NPS counted 22 breeding pairs on South Core Banks in both years, and 17 and 13
breeding pairs on Shackleford Banks in 2010 and 2011, respectively (Altman 2010, 2011).
Window census pair counts for NCB in years prior to our study (Altman, 2007, 2008, 2009)
counted 30-32 pairs, while we counted 36 and 41 pairs during 2010 and 2011 window counts,
respectively. In 2010, we counted 39 pairs breeding on NCB during biweekly surveys, but the
window census occurred after a storm surge in late May that caused nests to fail, so many birds
that had been paired up were single as they established new territories. While single surveys may
not produce and exact count of pairs, a coordination of window census protocols and data across
states will almost certainly produce a better population estimate than exists currently for
Wilson’s Plovers.
In addition to an accurate population estimate, adult and juvenile overwintering survival
estimates are needed to determine what reproductive output is needed for a stationary population.
To date, adult survival and juvenile wintering survival have not been reported for this species. I
banded adults in 2010 and 2011, and conducted resighting surveys from 2010 to 2012. The 2012

97
data were not available in time to include these survival estimates in my thesis, however, I plan
to do these analyses for future publications.
On NCB, we found Wilson’s Plovers nesting in interdune areas, on sand flats, flats
vegetated with Salicornia, beaches, in sparse marsh, and in small vegetated flats behind the
primary dunes. Most nests were in interdune areas on flats; nests on flats were often placed at the
edge of an isolated dunelet. North Core Banks did not have abundant fiddler crab (Uca spp.)
flats, and at the north end of the island Wilson’s Plover broods foraged in dense vegetation
around ponds and at the Spartina marsh Salicornia flat border. At the south end of the island
broods appeared to forage in dry vegetated areas. Cape Lookout National Seashore is unique
among Atlantic barrier islands in that it is not inhabited, and that the NPS does not stabilize the
beach or dunes and instead allows natural erosion and deposition processes to modify the island.
This probably results in broader range of suitable shorebird nesting habitats than are available at
other sites with more human interference.
Our study was designed to determine the effects of Core MOA overflights specifically,
but was not ideal for determining how overflight characteristics and aircraft type in general
impacted Wilson’s Plovers. In order to understand which characteristics of overflight provoke a
response, it would be necessary to record slant distances between overflights and nests, aircraft
type, velocity, direction of approach, and whether or not the aircraft passed directly over the nest.
Although we had some of these data for Core MOA overflights, they were all military fixed-
wing aircraft, and the overflights that flew near nests were mostly > 3048 m, so it was not
possible to use these overflights to compare responses to different overflight characteristics.
Ideally, a visual verification would be used to assess closest approach distance rather than
projected tracks paired with audio data. Because many factors can affect how sound travels,
visual and audio stimuli may not reach an incubating bird at the same time. To assess

98
distributional and demographic effects of overflights on plovers, an estimate of exposure
frequency for all overflights types would be necessary.
Although the Wilson’s Plover is not actively monitored or protected by the NPS, areas
used by Piping Plovers and colonial waterbirds are closed to the public during the shorebird
breeding season, and this protects most of the Wilson’s Plover breeding habitat. With the
exception of 4 pairs that nested on the front beach, and 3 pairs that were exposed to motorized
vehicles when a roadway was opened behind the dunes after nests were established, during our
study nesting Wilson’s Plovers were not exposed to human activity, aside from researchers and
NPS staff. Overall, we found no evidence that human activities were having a direct negative
effect on productivity of Wilson’s Plovers on North Core Banks. The greatest local impact on
demography appears to be from predation on nests and young. Most nest predation is by
raccoons and fish crows. The degree to which this predation may be exacerbated by human
activities (e.g. leaving garbage on the beach; Liebezeit 2009) is unknown.

99
LITERATURE CITED
Altman, J. 2007. Wilson’s Plover window census. National Park Service Report. Available
online at http://www.nps.gov/calo/parkmgmt/upload/2007-CALO-WIPL-Window-
Census.pdf
Altman, J. 2008. Wilson’s Plover window census. National Park Service Report. Available
online at http://www.nps.gov/calo/parkmgmt/upload/2008-CALO-WIPL-Window-
Census.pdf
Altman, J. 2009. Wilson’s Plover window census. National Park Service Report. Available
online at http://www.nps.gov/calo/parkmgmt/upload/2009-CALO-WIPL-Window-
Census.pdf
Altman, J. 2010. Wilson’s Plover window census. National Park Service Report. Available
online at http://www.nps.gov/calo/parkmgmt/upload/2010-CALO-WIPL-Window-
Census.pdf
Altman, J. 2011. Wilson’s Plover window census. National Park Service Report. Available
online at http://www.nps.gov/calo/parkmgmt/upload/2011-CALO-WIPL-Window-
Census.pdf
Liebezeit, J. R., S. J. Kendall, S. Brown, C. B. Johnson, P. Martin, T. L. McDonald, D. C. Payer,
C. L. Rea, B. Streever, A. M. Wildman and S. Zack. 2009. Influence of human
development and predators on nest survival of tundra birds, Arctic Coastal Plain, Alaska.
Ecological Applications 19:1628-1644.

100
APPENDIX A. Wilson’s Plover (Charadrius wilsonia) supplemental figures for
physiological and behavioral responses to overflights, Chapter 1.
Figure 1. Wilson’s Plover (Charadrius wilsonia) nest bowl with eggs and Reconyx PC90 camera
in wooden box at Cape Lookout National Seashore, North Carolina.

101
Figure 2. a) Artificial heart rate monitor egg (top center egg) in a Wilson’s Plover (Charadrius
wilsonia) nest with three real eggs at Cape Lookout National Seashore, North Carolina. b) The
digital voice recorder was attached to the artificial egg and buried in a waterproof case 1–2 m
from the nest.
a)
b)

102
Figure 3. Wilson’s Plover (Charadrius wilsonia) on nest in at Cape Lookout National Seashore,
NC, a) alert upright posture, b) alert hunkered posture, and c) relaxed posture.
b)
a)
c)

103
Figure 4. Spectral frequency display of a series of Wilson’s Plover (Charadrius wilsonia) heart
beats over 6 seconds; a 6 s interval is shown here so that the heart beats can be magnified and
visible, but sampling was done for three 20 s intervals pre, during, and post overflight. A single
heart beat is shown in the white oval.
1 heart beat

104
APPENDIX B. Wilson’s Plover (Charadrius wilsonia) supplemental information on
distributional response to Core MOA overflights, Chapter 2.
Core MOA overflights occurred at a fairly even distribution throughout our study site
(Fig. 1), therefore we lacked a reference area to compare Wilson’s Plover (Charadrius wilsonia)
nest distribution patterns with and without Core MOA overflights. Furthermore, the majority of
the overflights at our study site were not from Core MOA aircraft, and because we recorded non-
Core MOA overflights opportunistically, we lacked information on the distribution of these
overflights. If Wilson’s Plovers showed a distributional response to overflights, they would
likely respond all overflights, or the ones to which they exhibited a behavioral response (see
Chapter One), rather than Core MOA overflights.

105
Figure 1. Lines depicting all Core Military Operations Area (MOA) overflight paths as provided
to us by the U.S. Marine Corps (USMC) Cherry Point in 2010 (dark line) and 2011 (light line). A
subset of these overflights was used in the analyses as not every overflight occurred during the
active nesting period for Wilson’s Plovers, or over North Core Banks, our study area within
Cape Lookout National Seashore, NC. Lines are estimated flight paths and were constructed by
drawing a straight line between the entry and exit Core MOA coordinates provide by the USMC.