demonstration of biodegradation of dense, nonaqueous … bioremediation/dnapls... · the battelle...
TRANSCRIPT

Demonstration of Biodegradation of Dense, Nonaqueous-Phase Liquids (DNAPL) through Biostimulation and Bioaugmentation
at Launch Complex 34 in Cape Canaveral Air Force Station, Florida
Final Innovative Technology Evaluation Report
Prepared by
Battelle 505 King Avenue
Columbus, OH 43201
Prepared for
U.S. Environmental Protection Agency National Risk Management Research Laboratory
Superfund Innovative Technology Evaluation Program 26 Martin Luther King Drive
Cincinnati, OH 45268
September 30, 2004

ii
Notice
The U.S. Environmental Protection Agency has funded the research described here-under. In no event shall either the United States Government or Battelle have any responsibility or liability for any consequences of any use, misuse, inability to use, or reliance on the information contained herein. Mention of corporation names, trade names, or commercial products does not constitute endorsement or recommendation for use of specific products.

iii
Acknowledgments
The Battelle staff who worked on this project include Arun Gavaskar (Project Man-ager), Woong-Sang Yoon, Megan Gaberell, Eric Drescher, Lydia Cumming, Joel Sminchak, Jim Hicks, Bruce Buxton, Michele Morara, Thomas Wilk, and Rhonda Copley. Battelle would like to acknowledge the resources and technical support provided by several members of the project team: • Tom Holdsworth and Ron Herrmann at U.S. EPA for providing resources to
evaluate this demonstration.
• Jackie Quinn at NASA who provided technical guidance and oversight.
• Eric Hood from GeoSyntec Consultants.
• John DuPont and Scott Schroeder from DHL Analytical.
• Randy Robinson from Precision Sampling.


v
Executive Summary
The purpose of the project was to evaluate the technical and cost performance of the biostimulation and bioaugmentation technology when applied to dense, nonaqueous-phase liquid (DNAPL) contaminants in the saturated zone. This demonstration was conducted at Launch Complex 34, Cape Canaveral Air Force Station, Florida, where chlorinated volatile organic compounds (CVOCs), mainly trichloroethylene (TCE), are present in the subsurface as DNAPL. Smaller amounts of cis-1,2-dichloroethylene (DCE) and vinyl chloride (VC) also are present as a result of the natural degradation of TCE. The part of the source zone used as a test plot for the demonstration is entirely underneath the Engineering Support Building. The biostimulation and bioaugmentation project was conducted under the National Aeronautics and Space Administration (NASA) Small Business Technology Transfer Research (STTR) Program. For this project, the Small Business Concern vendor was GeoSyntec Consultants (GeoSyntec). This demonstration was independently evalu-ated by Battelle under the United States Environmental Protection Agency’s (U.S. EPA’s) Superfund Innovative Technology Evaluation (SITE) Program. A sequential process of biostimulation and bioaugmentation is a promising remedia-tion technology for enhancing the extent and rate of degradation of CVOCs. Biostim-ulation involves stimulating indigenous microbial cultures by adding nutrients (i.e., biostimulation), whereas bioaugmentation involves introducing microbial cultures that are particularly adept at degrading these contaminants into the target aquifer. The premise is that although many aquifers contain native microorganisms that can degrade CVOCs, the native microorganisms can be supplemented by specific cul-tures that enhance the degradation of chlorinated solvents. Natural microorganisms, such as Dehalococcoides ethenogenes, can be separately cultured and introduced into the aquifer to enhance the degradation rates and extent of degradation that would normally be achievable by natural attenuation or by biostimulation (addition of nutrients) alone. Bioaugmentation using specific cultures is claimed to be particularly effective in (1) degrading byproducts of reductive dehalogenation, such as cis-1,2-DCE and VC, which would otherwise accumulate in the aquifer; and (2) completing dechlorination processes to non-chlorinated products such as acetylene, ethene, ethane, and methane. This demonstration involved biostimulation followed by bioaugmentation in the same test plot. During the biostimulation phase of treatment, an electron donor (ethanol) was added to provide nutrients for indigenous microorganisms and stimulate CVOC degradation. During the bioaugmentation phase, KB-1™, a consortium of naturally occurring microorganisms known to completely dechlorinate high concentrations of TCE to ethene, was added to the test plot. At Launch Complex 34, the DNAPL source zone was not large enough to conduct a control demonstration using biostim-ulation alone for comparison. Therefore, the sequential treatment of biostimulation and bioaugmentation was evaluated at Launch Complex 34 in the same test plot.

vi
Bioaugmentation was chosen as a second treatment phase to determine if complete dechlorination of a TCE-DNAPL source zone was possible. Based on pre-demonstration groundwater and soil sampling by Battelle, a test plot was identified for biostimulation and bioaugmentation that was 20 ft long × 20 ft wide × 20 ft deep (saturated thickness). The Upper Sand Unit, where the treatment was targeted, is the shallowest part of the surficial aquifer, and extends down to a depth of 26 ft. The water table at the site occurs at about 5 to 6 ft below ground surface (bgs), thus providing about a 20-ft-thick zone of aquifer for treatment. The Upper Sand Unit is underlain by the Middle Fine-Grained Unit, which is made up of finer sand and silt, and constitutes somewhat of a hydraulic barrier to the Lower Sand Unit below. These three stratigraphic units constitute the surficial aquifer. The Lower Clay Unit forms a thin aquitard under the surficial aquifer. The bioaugmentation treatment was particularly targeted at depths of 16 to 24 ft bgs in the Upper Sand Unit, where most of the DNAPL appeared to be present. The pre-demonstration soil and ground-water characterization was done in January 2002, before the vendor began installing the treatment system. Prior to beginning the demonstration, the vendor installed a recirculating groundwater system to establish a controlled hydraulic flow field. This was done to facilitate the distribution of electron donor, simplify the placement of monitoring points, and accel-erate the degradation process to a point where it could be monitored in the reason-able timeframe allotted to this demonstration. The groundwater was recirculated from the extraction wells to the injection wells for several weeks to establish hydraulic control. During this testing and modification period (May 23 to September 12, 2002), the recirculated groundwater was passed through carbon canisters and treated prior to reinjection. CVOCs were removed from groundwater in the treatment plot during this time. Prior to beginning the biostimulation phase of the treatment, the carbon canisters were removed from the recirculating system. The electron donor (ethanol) was injected inside the plot to begin the biostimulation phase of the demonstration (October 23, 2002). Approximately 14 weeks later (February 6, 2003), the KB-1™ culture was injected in the aquifer to begin the bioaugmentation phase. Groundwater sampling was conducted in December 2002 (one month after electron donor injec-tion) and March 2003 (one month after KB-1™ culture injection). Post-demonstration soil and groundwater characterization was done in June 2003. Performance assessment activities for the biostimulation and bioaugmentation dem-onstration included pre-demonstration investigations, installation of wells, operation, monitoring, and post-treatment evaluation. Battelle conducted detailed soil and groundwater characterization activities to establish the DNAPL distribution and mass inside the test cell. The vendor conducted additional operational measurements. The objectives of the performance assessment were to: • Determine changes in total TCE (dissolved and free-phase) and DNAPL mass in
the test plot due to the biostimulation and bioaugmentation treatment;
• Determine changes in aquifer quality due to the treatment;
• Determine the fate of TCE, the primary DNAPL contaminant; and,
• Determine operating requirements and cost of the technology.
Changes in Total TCE and DNAPL Mass
Detailed pre-demonstration and post-demonstration soil sampling was the main tool for estimating changes in total TCE and DNAPL mass in the plot due to the treatment technology. In general, the eastern portion of the plot had the highest pre-demonstration TCE concentrations. TCE concentrations were higher at approximately

vii
26 ft bgs, which is at the interface between the Upper Sand Unit and Middle Fine-Grained Unit. The rest of the plot appeared to contain mostly dissolved-phase TCE. The soil sampling results were evaluated using both linear interpolation and kriging to obtain mass estimates for the entire treatment zone (i.e., Upper Sand Unit). Linear interpolation indicated that, under pre-demonstration conditions, 25.5 kg of total TCE (dissolved and free phase) was present in the Upper Sand Unit. Approxi-mately 2.6 kg of the total TCE was estimated to be DNAPL. Following the demonstra-tion, soil sampling indicated that 0.4 kg of total TCE remained in the Upper Sand Unit; the post-demonstration mass of TCE-DNAPL was estimated as 0.0 kg because no post-demonstration TCE concentrations were observed above the threshold of 300 mg/kg. Therefore, the overall decrease in TCE mass due to the treatment, as indicated by linear interpolation, was 98.5% for total TCE and >99% for DNAPL in the Upper Sand Unit. Kriging of the soil data indicated that the total TCE mass in the target zone before the biostimulation and bioaugmentation treatment ranged from 17.6 to 46.6 kg, with an average of 32.1 kg. After treatment, the total TCE mass in the plot ranged from 0.1 to 0.3 kg, with an average of 0.2 kg. The decline in TCE mass due to the biostimulation and bioaugmentation treatment ranged from 98.6 to 99.7%, with an estimated aver-age decline of 99%. Because few data points were available for DNAPL estimation, only the total TCE data were subjected to kriging. These estimated TCE mass ranges are based on an 80% confidence level and incorporate the uncertainty and spatial variability in the data. The linear interpolation estimates are within the range of the kriging estimates. These results indicate that the biostimulation and bioaugmentation treatment caused a significant decrease in total TCE and DNAPL mass in the target treatment zone. Changes in Aquifer Quality
Dissolved TCE concentrations, as measured in the monitoring wells, declined sub-stantially in the Upper Sand Unit of the demonstration area following the bioaugmenta-tion treatment. DCE levels increased following biostimulation, and then decreased after bioaugmentation. Vinyl chloride levels increased immediately after biostimulation and bioaugmentation, and then decreased during subsequent post-demonstration monitoring. Ethene concentrations increased substantially toward the end of the dem-onstration. These changes indicate sequential degradation of TCE to DCE, and ulti-mately to vinyl chloride and ethane during the demonstration. In order to verify that the DNAPL source had been substantially reduced and that the CVOC reductions observed during the demonstration could be sustained (without encountering rebound), one further round of groundwater monitoring was conducted in January 2004, almost one year after injection of the KB-1™ culture. This long-term monitoring showed further substantial reductions in TCE (to below detection), cis-1,2-DCE, and vinyl chloride. These results show that DNAPL mass was substantially removed by the treatment and that the reduced CVOC levels were sustainable. Oxidation-reduction potential (ORP) and dissolved oxygen (DO) levels decreased in the demonstration area after biostimulation began. The decreases continued through the bioaugmentation phase of the demonstration and post-demonstration sampling. These data indicate that strongly reducing anaerobic conditions were created in the Upper Sand Unit during the demonstration. Groundwater pH in the shallow wells remained relatively steady. Dissolved iron concentrations in well PA-26 in the center of the test plot generally decreased after the bioaugmentation treatment. The secondary drinking water limit

viii
for iron is 0.3 mg/L, which was exceeded in the majority of wells before, during, and after the demonstration. Chloride levels in the monitoring wells, which were already high partly due to saltwater intrusion in the aquifer, showed a slight increase over the course of the demonstration. The Waterloo Profiler® samples taken from various depths in the Upper Sand Unit also showed increases in chloride concentrations from the pre- and post-demonstration sampling events. Anaerobic reductive dechlorination of TCE, cis-1,2-DCE, and VC, which was observed in this demonstration, releases chloride from contaminant molecules and leads to increases in chloride levels in groundwater. Increases in dissolved methane, as well as decreases in sulfate concentrations, indi-cate that an increase in biological activity occurred as a result of the biostimulation and bioaugmentation treatment. Biological oxygen demand (BOD) levels in the groundwater increased, indicating an increase in the bioavailable organic matter in the aquifer, most likely due to the addition of a carbon electron donor to the recircu-lating groundwater. Total organic carbon (TOC) levels also increased, probably as a result of the carbon electron donor addition. The hydraulic conductivity of the Upper Sand Unit does not appear to have been affected by the treatment, suggesting that the addition of electron donor and KB-1™ culture did not noticeably affect the aquifer. There were no substantial changes in permeability in the test plot according to slug tests conducted in the center well before and after the demonstration. Fate of TCE/DNAPL in the Aquifer
The performance assessment indicates that biodegradation was a substantial path-way accounting for the decrease in TCE, cis-1,2-DCE, and vinyl chloride measured in the test plot. An increasing trend in dissolved ethene and chloride levels is evidence of dechlorination reactions in the aquifer. The combination of biostimulation and bio-augmentation treatments accounted for the enhanced biodegradation seen in the plot. In addition, some TCE and other VOCs were likely extracted by the recirculation system and captured by adsorption in the aboveground carbon canisters. However, an analysis of the amounts of water and TCE potentially extracted from the test plot by the recirculation system showed that biostimulation and bioaugmentation contrib-uted substantially to the TCE removal observed in the test plot, even after adjusting for any dilution due to the water recirculation system and carbon.
Operating Requirements and Cost
In general, the treatment system operated smoothly through the recirculation, bio-stimulation, and bioaugmentation phases. Relatively good hydraulic control appeared to have been maintained in the test plot, and the electron donor and KB-1™ culture were well-distributed in the target zone. The vendor reported that biofouling in the injection wells became apparent after amending the recirculating groundwater with electron donor. To mitigate the biofouling, the duration of ethanol was decreased to one concentrated dose administered daily; the injection wells were scrubbed, surged, and purged on a weekly basis to removed biofilm from the screen; and the reinjected groundwater was amended with sodium hypochlorite to inhibit microbial growth in the injection wells. It is unclear what the long-term effect of the change in electron donor dose/timing and the addition of sodium hypochlorite into the aquifer had on the micro-organisms throughout the demonstration plot. Future applications of the biostimula-tion and bioaugmentation technology may benefit from a study of optimizing electron donor dosing schedules, and establishing procedures to monitor for biofouling and treat occurrences of biofouling.

ix
A present value (PV) analysis was conducted to compare the cost of DNAPL source treatment with biostimulation and bioaugmentation to the cost of installing and operating an equivalent pump-and-treat system for a long period of time (30 years). It was assumed that the biostimulation and bioaugmentation treatment would reduce the DNAPL presence in the aquifer sufficiently for the rest of the contamination to attenuate naturally. This analysis showed that the cost of source treatment with biostimulation and bioaugmentation was lower than the PV of the costs of long-term treatment with a pump-and-treat system at this site.


xi
Contents
Executive Summary...................................................................................................... v Appendices .................................................................................................................xiv Figures........................................................................................................................ xv Tables ........................................................................................................................xvii Acronyms and Abbreviations......................................................................................xix
1. Introduction ..............................................................................................................1
1.1 Project Background .........................................................................................1 1.1.1 Project Organization.............................................................................1 1.1.2 Performance Assessment ....................................................................1 1.1.3 The SITE Program ...............................................................................1
1.2 The DNAPL Problem .......................................................................................2 1.3 Demonstration Site ..........................................................................................3 1.4 Biostimulation and Bioaugmentation Technology ...........................................3 1.5 Technology Evaluation Report Structure.........................................................6
2. Site Characterization ...............................................................................................9
2.1 Hydrogeology of the Site .................................................................................9 2.1.1 The Surficial Aquifer at Launch Complex 34........................................9 2.1.2 The Semi-Confined Aquifer at Launch Complex 34...........................14
2.2 Surface Water Bodies at the Site ..................................................................15 2.3 DNAPL Contamination in the Demonstration Plot and Vicinity .....................15 2.4 Aquifer Quality at the Site..............................................................................17
3. Technology Operation ...........................................................................................23
3.1 Biostimulation and Bioaugmentation Technology Description ......................23 3.2 Regulatory Requirements..............................................................................23 3.3 Groundwater Control System ........................................................................23 3.4 Enhanced Bioremediation by the Biostimulation and Bioaugmentation
Technology ....................................................................................................26 3.4.1 Biostimulation .....................................................................................26 3.4.2 Bioaugmentation ................................................................................27
3.5 Waste Handling and Disposal .......................................................................27
4. Performance Assessment Methodology................................................................29 4.1 Estimating Changes in TCE-DNAPL Mass ...................................................29
4.1.1 Changes in TCE-DNAPL Mass ..........................................................29 4.1.2 Linear Interpolation by Contouring.....................................................34 4.1.3 Kriging ................................................................................................34 4.1.4 Interpreting the Results of the Two Mass Removal
Estimation Methods............................................................................35 4.2 Evaluating Changes in Aquifer Quality ..........................................................35

xii
4.3 Evaluating the Fate of the TCE-DNAPL ........................................................35 4.4 Verifying Operating Requirements and Costs ...............................................36
5. Performance Assessment Results and Conclusions.............................................37
5.1 Changes in TCE-DNAPL Mass in the Plot ....................................................37 5.1.1 Qualitative Evaluation of Changes in TCE-DNAPL Distribution ........37 5.1.2 TCE-DNAPL Mass Estimation by Linear Interpolation.......................42 5.1.3 TCE Mass Estimation by Kriging........................................................42 5.1.4 Summary of Changes in the TCE-DNAPL Mass ...............................44
5.2 Evaluating Changes in Aquifer Quality ..........................................................44 5.2.1 Changes in CVOC Levels in Groundwater ........................................45 5.2.2 Changes in Aquifer Geochemistry .....................................................53 5.2.3 Changes in Hydraulic Properties of the Aquifer .................................56 5.2.4 Changes in Microbiology of the Treatment Plot .................................57 5.2.5 Summary of Changes in Aquifer Quality............................................57
5.3 Evaluating the Fate of the TCE-DNAPL Mass ..............................................58 5.3.1 Biological Reductive Dechlorination of TCE ......................................58 5.3.2 Extraction and Adsorption onto Carbon .............................................60 5.3.3 Potential for TCE-DNAPL Migration from the Treatment Plot............61 5.3.4 Summary Evaluation of the Fate of TCE-DNAPL ..............................64
5.4 Verifying Operating Requirements ................................................................64
6. Quality Assurance..................................................................................................65 6.1 QA Measures.................................................................................................65
6.1.1 Representativeness............................................................................65 6.1.2 Completeness ....................................................................................66 6.1.3 Chain of Custody................................................................................66
6.2 Field QC Measures........................................................................................66 6.2.1 Field QC for Soil Sampling.................................................................66 6.2.2 Field QC for Groundwater Sampling..................................................67
6.3 Laboratory QC Measures ..............................................................................68 6.3.1 Analytical QC for Soil Samples ..........................................................68 6.3.2 Laboratory QC for Groundwater Sampling ........................................68 6.3.3 Analytical Detection Limits .................................................................69
6.4 QA/QC Summary...........................................................................................69
7. Economic Analysis.................................................................................................71 7.1 Treatment Technology Costs ........................................................................71 7.2 Site Preparation and Waste Disposal Costs .................................................71 7.3 Site Characterization and Performance Assessment Costs..........................72 7.4 Present Value Analysis of Biostimulation and Bioaugmentation
Treatment Technology and Pump-and-Treat System Costs .........................73
8. Technology Applications Analysis .........................................................................75 8.1 Objectives ......................................................................................................75
8.1.1 Overall Protection of Human Health and the Environment ................75 8.1.2 Compliance with ARARs ....................................................................75
8.1.2.1 Comprehensive Environmental Response, Compensation, and Liability Act ..........................................76
8.1.2.2 Resource Conservation and Recovery Act .........................76 8.1.2.3 Clean Water Act ..................................................................76 8.1.2.4 Safe Drinking Water Act ......................................................76 8.1.2.5 Clean Air Act........................................................................77 8.1.2.6 Occupational Safety and Health Administration..................77
8.1.3 Long-Term Effectiveness ...................................................................77 8.1.4 Reduction of Toxicity, Mobility, or Volume through Treatment ..........77 8.1.5 Short-Term Effectiveness...................................................................78

xiii
8.1.6 Implementability .................................................................................78 8.1.7 Cost ....................................................................................................78 8.1.8 State (Support Agency) Acceptance..................................................79 8.1.9 Community Acceptance .....................................................................79
8.2 Operability......................................................................................................79 8.3 Applicable Wastes .........................................................................................79 8.4 Key Features .................................................................................................79 8.5 Availability/Transportability ............................................................................79 8.6 Materials Handling Requirements .................................................................79 8.7 Ranges of Suitable Site Characteristics ........................................................79 8.8 Limitations......................................................................................................80
9. References ............................................................................................................81

xiv
Appendices
Appendix A. Performance Assessment Methods A.1 Summary of Statistics in Biostimulation and Bioaugmentation Plot A.2 Sample Collection and Extraction Methods A.3 List of Standard Sample Collection and Analytical Methods
Appendix B. Hydrogeologic Measurements B.1 Slug Tests B.2 Well Completion Diagrams B.3 Soil Coring Logsheets
Appendix C. CVOC Measurements Table C-1a. CVOC Monitoring Results of Biostimulation and Bioaugmentation
Demonstration (µg/L) Table C-1b. CVOC Monitoring Results of Biostimulation and Bioaugmentation
Demonstration (mmole/L) Table C-2. Summary of CVOC Results in Soil for Pre-Demonstration Monitoring
in Bioaugmentation Plot Table C-3. Summary of CVOC Results in Soil for Post-Demonstration Monitoring
in Bioaugmentation Plot Table C-4. Long-Term Monitoring Results in Treatment Plot Table C-5 Monitoring Results of CVOCs and Dechlorination Products in PA-26 Table C-6 Results of Extracted Groundwater for Chloroethene and Ethene
Concentrations at the Influent Sample Port (SP-4) of Carbon Tanks
Appendix D. Inorganic and Other Aquifer Parameters Table D-1. Summary of Field Parameters in Groundwater Table D-2. Summary of Inorganic Results in Groundwater Table D-3. Other Parameter Results of Groundwater Table D-4. Results of Chloride Samples Using a Waterloo Profiler® Table D-5. Results of Dissolved Gases in Groundwater Table D-6. Result of TOC in Soil Samples Collected in Bioaugmentation Plot
Appendix E. Genetrac Analysis of Groundwater Samples from the Bioaugmentation Demonstration
Appendix F. Quality Assurance/Quality Control Information Tables F-1 to F-15
Appendix G. Economic Analysis Information Figure G-1. P&T System Costs for 100 Years Table G-1. Pump-and-Treat (P&T) System Design Basis Table G-2. Capital Investment for a P&T System Table G-3. Present Value of P&T System Costs for 30 Years of Operation Table G-4. Present Value of P&T System Costs for 100 Years of Operation

xv
Figures
Figure 1-1. Project Organization for the Biostimulation and Bioaugmentation Demonstration at Launch Complex 34 ...................................................2
Figure 1-2. Simplified Depiction of the Formation of a DNAPL Source Zone in the Subsurface........................................................................................3
Figure 1-3. Location Map of Launch Complex 34 Site..............................................4 Figure 1-4. Biostimulation and Bioaugmentation Demonstration Site Location........5 Figure 1-5. View Looking South toward Launch Complex 34, the Engineering
Support Building and Relative Location of the Demonstration Plot........6 Figure 1-6. Biodegradation Pathway for TCE Under Anaerobic Conditions .............6 Figure 2-1. Regional Hydrogeologic Cross Section through the Kennedy Space
Center Area.............................................................................................9 Figure 2-2. NW-SE Geologic Cross Section through the Biostimulation and
Bioaugmentation Plot............................................................................10 Figure 2-3. SW-NE Geologic Cross Section through the Biostimulation and
Bioaugmentation Plot............................................................................11 Figure 2-4. Water Table Elevation Map for Surficial Aquifer from June 1998.........12 Figure 2-5. Pre-Demonstration Water Levels (as elevation msl) in Shallow
Wells at Launch Complex 34 (March 2002) .........................................13 Figure 2-6. Pre-Demonstration Water Levels (as elevation msl) in Intermediate
Wells at Launch Complex 34 (March 2002) .........................................14 Figure 2-7. Pre-Demonstration Water Levels (as elevation msl) in Deep Wells
at Launch Complex 34 (March 2002) ...................................................15 Figure 2-8. Pre-Demonstration Dissolved TCE Concentrations (µg/L) in
Shallow Wells in the Treatment Plot (March 2002) ..............................18 Figure 2-9. Pre-Demonstration Dissolved DCE Concentrations (µg/L) in
Shallow Wells in the Treatment Plot (March 2002) ..............................18 Figure 2-10. Pre-Demonstration TCE Concentrations (mg/kg) in Soil in the
Upper Sand Unit approximately 20 ft bgs in the Treatment Plot and Vicinity (January 2002) .........................................................................19
Figure 2-11. Pre-Demonstration TCE Concentrations (mg/kg) in Soil in the Upper Sand Unit approximately 24 ft bgs in the Treatment Plot and Vicinity (January 2002) .........................................................................19
Figure 2-12. Vertical Cross Section through the Treatment Plot Showing Pre-Demonstration TCE Soil Concentrations (mg/kg) in the Subsurface ...20
Figure 2-13. Pre-Demonstration TCE Concentrations (mg/kg) as DNAPL in Soil in the Upper Sand Unit at Launch Complex 34 (January/February 2002).....................................................................................................20
Figure 3-1. Aboveground Water Treatment System ...............................................24 Figure 3-2. KB-1™ Dechlorinator Culture Containers.............................................27 Figure 4-1. Soil Sampling for Performance Assessment at Launch Complex 34...29 Figure 4-2. Soil Sample Collection..........................................................................30 Figure 4-3. Pre-Demonstration Soil Boring Locations (BIO-SB-1 through BIO-
SB-7) in the Treatment Plot (January/February 2002) .........................31
xvi
Figure 4-4. Post-Demonstration Soil Boring Locations (BIO-SB-202, BIO-SB-205 through BIO-SB-207, BIO-SB-210, and BIO-SB-211) in the Treatment Plot (June 2003) ..................................................................32
Figure 4-5. Indoor Vibra-Push™ Rig (LD Geoprobe® Series) Used in the Bioaugmentation Plot Inside the Engineering Support Building ...........33
Figure 4-6. Collecting and Processing Groundwater Samples Using the Waterloo Profiler® .................................................................................36
Figure 5-1. Distribution of TCE Soil Concentrations (mg/kg) as a Function of Depth (ft bgs) ........................................................................................38
Figure 5-2. Representative (a) Pre-Demonstration (January 2002) and (b) Post-Demonstration (June 2003) Horizontal Cross Sections of TCE (mg/kg) at 20 ft bgs in the Upper Sand Unit .................................40
Figure 5-3. Representative (a) Pre-Demonstration (January 2002) and (b) Post-Demonstration (June 2003) Horizontal Cross Sections of TCE (mg/kg) in soil at 24 ft bgs in the Upper Sand Unit.......................41
Figure 5-4. 3D Distribution of DNAPL in the Bioaugmentation Plot Soil Based on (a) Pre-Demonstration (January 2002) and (b) Post-Demonstration (June 2003) Characterization.......................................43
Figure 5-5. Dissolved TCE Concentrations (µg/L) during (a) Pre-Demonstration Sampling (March 2002), (b) During Biostimulation (December 2002), (c) During Bioaugmentation (March 2003), and (d) Post-Demonstration (June 2003) Sampling of Shallow Wells ......................48
Figure 5-6. Dissolved cis-1,2-DCE Concentrations (µg/L) during (a) Pre-Demonstration Sampling (March 2002), (b) During Biostimulation (December 2002), (c) During Bioaugmentation (March 2003), and (d) Post-Demonstration (June 2003) Sampling of Shallow Wells.........49
Figure 5-7. Dissolved Vinyl Chloride Concentrations (µg/L) during (a) Pre-Demonstration Sampling (March 2002), (b) During Biostimulation (December 2002), (c) During Bioaugmentation (March 2003), and (d) Post-Demonstration (June 2003) Sampling of Shallow Wells.........50
Figure 5-8. Dissolved Ethene Concentrations (µg/L) during (a) Pre-Demonstration Sampling (March 2002), (b) During Biostimulation (December 2002), (c) During Bioaugmentation (March 2003), and (d) Post-Demonstration (June 2003) Sampling of Shallow Wells.........51
Figure 5-9. Changes in Chloride Levels over Time in Monitoring Wells .................54 Figure 5-10. Waterloo Profiler® Chloride Concentration Data at Discrete Depths
Before and After the Demonstration in Two Locations Within the Plot........................................................................................................55
Figure 5-11a. Degradation Curve of TCE and Other CVOCs in PA-26 After Biostimulation and Bioaugmentation Treatment...................................59
Figure 5-11b. Degradation Curve of TCE and Ethene in PA-26 After Biostimulation and Bioaugmentation Treatment...................................59
Figure 5-12a. Water Levels Measured in Shallow Wells in the Engineering Support Building During Pre-Demonstration Characterization (March 2002).........................................................................................62
Figure 5-12b. Water Levels Measured in Shallow Wells in the Engineering Support Building During the Biostimulation and Bioaugmentation Technology Demonstration (March 2003) ............................................62
Figure 5-13a. Water Levels Measured in Intermediate Wells in the Engineering Support Building During Pre-Demonstration Characterization (March 2002).........................................................................................63
Figure 5-13b. Water Levels Measured in Intermediate Wells in the Engineering Support Building During the Biostimulation and Bioaugmentation Technology Demonstration (March 2003) ............................................63

xvii
Tables
Table 2-1. Local Hydrostratigraphy at the Launch Complex 34 Site .........................11 Table 2-2. Hydraulic Gradients and Directions in the Surficial and Semi-Confined
Aquifers.....................................................................................................13 Table 2-3. Hydrostratigraphic Units of Brevard Country, Florida...............................16 Table 3-1. In Situ Bioremediation by Biostimulation and Bioaugmentation ...............25 Table 4-1. Summary of Performance Assessment Objectives and Associated
Measurements ..........................................................................................30 Table 5-1. Estimated Total TCE and TCE-DNAPL Mass Reduction by Linear
Interpolation ..............................................................................................44 Table 5-2. Estimated Total TCE Mass Reduction by Kriging.....................................44 Table 5-3. TCE Degradation Byproducts in the Treatment Plot Before, During,
and After the Demonstration.....................................................................45 Table 5-4. Ethene Levels in Groundwater (µg/L).......................................................46 Table 5-5. Groundwater Parameters in the Treatment Plot Before and After the
Demonstration ..........................................................................................46 Table 5-6. Dissolved Ethene and Ethane Concentrations in the Treatment Plot
Before, During, and After the Demonstration ...........................................57 Table 5-7. Dissolved Methane Concentrations In and Around the Treatment Plot
Before, During, and After the Demonstration ...........................................58 Table 5-8. Additional Monitoring of Test Plot Wells in January 2004 ........................60 Table 6-1. Instruments and Calibration Acceptance Criteria Used for Field
Measurements ..........................................................................................66 Table 6-2. List of Surrogate Compounds and Their Target Recoveries for Soil
and Groundwater Analysis by the Analytical Laboratory..........................68 Table 7-1. Biostimulation and Bioaugmentation Process Treatment Cost
Summary Provided by Vendor..................................................................71 Table 7-2. Estimated Site Characterization Costs .....................................................72 Table 7-3. Estimated Performance Assessment Costs .............................................72


xix
Acronyms and Abbreviations
3D three-dimensional ACL alternate concentration limit ARAR applicable or relevant and appropriate requirement bgs below ground surface BOD biological oxygen demand CAA Clean Air Act CERCLA Comprehensive Environmental Response, Compensation, and
Liability Act CFR Code of Federal Regulations CVOC chlorinated volatile organic compound CWA Clean Water Act DCE dichloroethylene DNA deoxyribonucleic acid DNAPL dense, nonaqueous-phase liquid DO dissolved oxygen ESTCP Environmental Strategic Technology Certification Program EZVI emulsified zero-valent iron FDEP (State of) Florida Department of Environmental Protection FRTR Federal Remediation Technology Roundtable GAC granulated activated carbon gpm gallon(s) per minute HSWA Hazardous and Solid Waste Amendments ISCO in situ chemical oxidation KBr potassium bromide LCS laboratory control spike(s) LRPCD Land Remediation and Pollution Control Division MB method blank(s) MCL maximum contaminant level MS matrix spike(s) MSD matrix spike duplicate(s) msl mean sea level

xx
mV millivolts MYA million years ago NA not available; not analyzed N/A not applicable NAAQS National Ambient Air Quality Standards NaOCI sodium hypochloride NASA National Aeronautics and Space Administration ND not detected NPDES National Pollutant Discharge Elimination System O&M operation and maintenance ORD Office of Research and Development ORP oxidation-reduction potential OSHA Occupational Safety and Health Administration PCE tetrachloroethylene PCR polymerase chain reaction POTW publicly owned treatment works PV present value QA quality assurance QA/QC quality assurance/quality control QAPP Quality Assurance Project Plan QC quality control RCRA Resource Conservation and Recovery Act RFI RCRA Facility Investigation RI/FS Remedial Investigation/Feasibility Study RPD relative percent difference SARA Superfund Amendments and Reauthorization Act SDWA Safe Drinking Water Act SI/E steam injection/extraction SIP State Implementation Plan SITE Superfund Innovative Technology Evaluation (Program) STTR Small Business Technology Transfer Research (Program) TCA trichloroethane TCE trichloroethylene TDS total dissolved solids TOC total organic carbon UCF University of Central Florida UF University of Florida UIC Underground Injection Control U.S. EPA United States Environmental Protection Agency VC vinyl chloride VOA volatile organic analysis

1
1. Introduction
This report presents results from the project field demon-stration of a biostimulation and bioaugmentation tech-nology for treatment of a dense, nonaqueous-phase liquid (DNAPL) source zone at Launch Complex 34, Cape Canaveral Air Force Station, FL. 1.1 Project Background
The goal of the project was to evaluate the technical and cost performance of the biostimulation and bioaug-mentation technology when applied to a DNAPL source zone. The chlorinated volatile organic compound (CVOC) trichloroethylene (TCE) is present as a DNAPL source in the aquifer at Launch Complex 34. Smaller amounts of dissolved cis-1,2-dichloroethylene (cis-1,2-DCE) and vinyl chloride (VC) also are present in the groundwater as a result of the natural degradation of TCE. The field application of the treatment technology began at Launch Complex 34 in June 2002 and ended in February 2003. Performance assessment activities were conducted before, during, and after the field application. 1.1.1 Project Organization
This project was conducted under the National Aero-nautics and Space Administration (NASA) Small Busi-ness Technology Transfer Research (STTR) Program. The STTR Program awards contracts to small business concerns in partnership with nonprofit research institu-tions for cooperative research and development. The goal of the STTR Program is to facilitate the transfer of technology developed by a research institution through the entrepreneurship of a small business. For this pro-ject, STTR funding was awarded to vendor GeoSyntec Consultants (GeoSyntec) as the small business concern in partnership with the University of Central Florida (UCF) as the nonprofit research institution. The NASA Contracting Officer’s Technical Representative provided a project management role for NASA. Figure 1-1 sum-marizes the project organization for the demonstration. Performance assessment of this technology was
conducted by Battelle under contract to United States Environmental Protection Agency (U.S. EPA) as part of the technology demonstration. 1.1.2 Performance Assessment
The biostimulation and bioaugmentation technology demonstration is being independently evaluated under the U.S. EPA’s Superfund Innovative Technology Evalu-ation (SITE) Program. The U.S. EPA contracted Battelle to plan, conduct, and report on the detailed site characterization at Launch Complex 34 and perform an independent performance assessment for the demonstration of this technology. Battelle also was responsible for providing quality assur-ance (QA) oversight for the performance assessment activities. Before the field demonstration, Battelle pre-pared a Quality Assurance Project Plan (QAPP) that was reviewed by all project stakeholders. This QAPP was based on the general guidelines provided by the U.S. EPA’s SITE Program for test plan preparation, quality assurance, and data analysis (Battelle, 2002a). 1.1.3 The SITE Program
The performance assessment planning, field implemen-tation, and data analysis and reporting for the demon-stration followed the general guidance provided by the U.S. EPA’s SITE Program. The SITE Program was established by U.S. EPA's Office of Solid Waste and Emergency Response and the Office of Research and Development (ORD) in response to the 1986 Superfund Amendments and Reauthorization Act, which recognized a need for an "Alternative or Innovative Treatment Tech-nology Research and Demonstration Program." ORD’s National Risk Management Research Laboratory in the Land Remediation and Pollution Control Division (LRPCD), headquartered in Cincinnati, OH, administers the SITE Program. This program encourages the devel-opment and implementation of (1) innovative treatment technologies for hazardous waste site remediation, and (2) innovative monitoring and measurement tools.

2
Figure 1-1. Project Organization for the Biostimulation and Bioaugmentation Demonstration
at Launch Complex 34 In the SITE Program, a field demonstration is used to gather engineering and cost data on the innovative technology so that potential users can assess the tech-nology's applicability to a particular site. Data collected during the field demonstration are used to assess the performance of the technology, the potential need for pre- and post-processing of the waste, applicable types of wastes and waste matrices, potential operating prob-lems, and approximate capital and operating costs. U.S. EPA provides guidelines on the preparation of an Innovative Technology Evaluation Report at the end of the field demonstration. These reports evaluate all avail-able information on the technology and analyze its over-all applicability to other site characteristics, waste types, and waste matrices. Testing procedures, performance and cost data, and quality assurance and quality stand-ards also are presented. This report on the biostimula-tion and bioaugmentation technology demonstration at Launch Complex 34 is based on these general guide-lines. 1.2 The DNAPL Problem
Figure 1-2 illustrates the formation of a DNAPL source zone at a chlorinated solvent release site. When solvent is released into the ground due to previous use or dis-posal practices, it travels downward through the vadose
zone to the water table. Because many chlorinated sol-vents are denser than water, the solvent continues its downward migration through the saturated zone (assum-ing sufficient volume of solvent is involved) until it en-counters a low-permeability layer or aquitard, on which it may form a pool. During its downward migration, the sol-vent leaves a trace of residual solvent in the soil pores. Many chlorinated solvents are only sparingly soluble in water; therefore, they can persist as a separate phase for several years (or decades). This free-phase solvent is called DNAPL. DNAPL in pools often can be mobilized toward extrac-tion wells when a strong hydraulic gradient is imposed; this solvent is called mobile DNAPL. In contrast, residual DNAPL is DNAPL trapped in pores that cannot be mobi-lized toward extraction wells, regardless of the strength of the applied gradient. Residual DNAPLs form as DNAPL pools dissolve in groundwater over time, leaving behind residual DNAPL in the soil structure. At most sites DNAPL pools are rare, as DNAPL is often present in residual form. As long as DNAPL is present in the aquifer, a plume of dissolved solvent is generated. DNAPL therefore consti-tutes a secondary source that keeps replenishing the plume long after the primary source (leaking above-ground or buried drums, drain pipes, vadose zone soil,
LC34ORGAN03.CDR
NASA STTR Jacqueline Quinn
Technical Representative
Technology VendorsDavid Major, GeoSyntec - Eric Hood, GeoSyntec -
Project Director Project Manager
U.S. EPA SITE Program Tom Holdsworth -
Ron Herrmann -Task Order Manager
Task Order Manager
BattelleArun Gavaskar
Project Manager
Performance AssessmentSubcontractor
Drilling Contractor,Precision Sampling
Performance Assessment Subcontractors
Off-Site Laboratory, DHL Analytical Drilling Contractor, Precision Sampling
Project Organization

3
Figure 1-2. Simplified Depiction of the Formation of a
DNAPL Source Zone in the Subsurface etc.) has been removed. Because DNAPL persists for many decades or centuries, the resulting plume also per-sists for many years. As recently as five years ago, DNAPL sources were difficult to find and most remedial approaches focused on plume treatment or plume con-trol. In recent years, efforts to identify DNAPL sources have been successful at many chlorinated solvent-contaminated sites. The focus is now shifting from plume control to DNAPL source removal or treatment. Pump-and-treat systems have been the conventional treatment approach at DNAPL sites and these systems have proven useful as an interim remedy to control the progress of the plume beyond a property boundary or other compliance point. However, pump-and-treat sys-tems are not economical for DNAPL remediation. Pools of DNAPL that can be treated effectively by pump and treat technologies are rare. Residual DNAPL is immobile and does not migrate toward extraction wells. As with plume control, the effectiveness and cost of DNAPL remediation with pump and treat is governed by the time (decades) required for slow dissolution of the DNAPL source in the groundwater flow. An innovative approach would be useful to address the DNAPL problem. 1.3 Demonstration Site
Launch Complex 34, the site selected for this demon-stration, is located at Cape Canaveral Air Force Station, FL (see Figure 1-3). Launch Complex 34 was used as a launch site for Saturn rockets from 1960 to 1968. His-torical records and worker accounts suggest that rocket engines were cleaned on the launch pad with chlorinated organic solvents such as TCE. Other rocket parts were
cleaned on racks at the western portion of the Engineering Support Building and inside the building. Some of the solvents ran off to the surface or discharged into drain-age pits. The site was abandoned in 1968; since then, much of the site has been overgrown by vegetation, although several on-site buildings remain operational. Preliminary site characterization efforts suggested that approximately 20,600 kg (Battelle, 1999a) to 40,000 kg (Eddy-Dilek et al., 1998) of solvent could be present in the subsurface near the Engineering Support Building. Figure 1-4 is a map of the Launch Complex 34 site that shows the target DNAPL source area for this technology demonstration, located inside the Engineering Support Building. Figure 1-5 is a photograph looking south toward the biostimulation and bioaugmentation treatment plot inside the Engineering Support Building. After four other remediation technologies had been demonstrated, the remaining DNAPL source zone was not large enough to have a test/treatment plot and a control plot in which the effects of biostimulation and bioaugmentation could be differentiated from those of biostimulation alone. Therefore, one test plot was identified and both biostimulation and bioaugmentation treatments were applied sequentially in this plot. 1.4 Biostimulation and
Bioaugmentation Technology
Under anaerobic conditions, microbial reductive dechlo-rination is a well-understood degradation mechanism for tetrachloroethylene (PCE) and TCE that can lead to complete dechlorination through cis-1,2-DCE, VC, ethene, and possibly ethane. Reductive dechlorination involves the step-wise replacement of individual chlorine atoms with hydrogen atoms, where the chlorinated ethene acts as an electron acceptor while an electron donor provides energy for this process (Figure 1-6). Hydrogen is generally considered the direct electron donor for reductive dechlorination, and typically is pro-duced from the anaerobic oxidation of other carbon sub-strates, such as organic acids or alcohols (Maymo-Gatell et al., 1997). Ethanol was the electron donor used in this demomnstration. Complete reductive dechlorination of TCE to acetylene and ethene may be enhanced by the addition of a car-bon substrate, such as ethanol, into the groundwater. The carbon source then is used by indigenous micro-organisms. Some of these microbes may contribute to PCE and TCE removal. A specific subset of these micro-organisms may be dehalorespirers, which are microbes capable of using TCE and other chloroethenes as a terminal electron acceptor.

4
Figure 1-3. Location Map of Launch Complex 34 Site The addition of a carbon substrate to groundwater for the purposes of enhancing the reductive dechlorination process is known as biostimulation. At field sites where the appropriate dehalorespiring microorganisms are not present in sufficient enough amounts to promote com-plete dechlorination to ethene, it may be necessary to augment the aquifer with a consortium of microorgan-isms that has demonstrated the ability to dechlorinate chloroethenes completely in the presence of electron-donating substrate and nutrients. Adding dehalorespiring bacteria to an aquifer is known as bioaugmentation. Several indigenous bacteria have been identified that directly use chlorinated ethene compounds such as PCE and TCE as terminal electron acceptors. Some of these microorganisms seem capable of biodegrading PCE and TCE but stall at cis-1,2-DCE, whereas other microorgan-isms can biodegrade PCE, TCE, cis-1,2-DCE, and VC. Although dehalorespiring bacteria have been identified at a number of sites, the relatively common occurrence
of PCE or TCE dechlorination stalling at the formation of cis-1,2-DCE and VC (Lee et al., 1997) suggests that these microorganisms are not ubiquitous in groundwater systems. If the appropriate dehalorespiring organisms are not present, biostimulation may increase the overall activity of indigenous microorganisms to promote reduc-tive dechlorination, but the result may be an accumu-lation of daughter products such as cis-1,2-DCE or VC instead of a complete reduction to ethene. In this case, it may be an appropriate remedial strategy to augment the aquifer with a consortium of organisms known to biodegrade PCE, TCE, cis-1,2-DCE, and VC, such as Dehalococcoides ethenogenes. A number of laboratory and field studies suggest that microbial consortia containing dehalorespiring bacteria are not inhibited at high concentrations of chlorinated ethenes (Yang and McCarty, 2000; Isalou et al., 1998; Major et al., 1995). Therefore, some dehalorespiring organisms are tolerant to high concentrations of

5
Figure 1-4. Biostimulation and Bioaugmentation Demonstration Site Location
•
o ! ~5 50
APPROXIMATE So\ ! IN FEET LE
~
Bioaugmentaf ~ Plot Ion !l
DESIGNED BY
ED
DRA~ BY
OS
CHECKED BY
TL
/
/
/
/
N
1/ I
/

6
Figure 1-5. View Looking South toward Launch Complex 34, the Engineering Support Building and
Relative Location of the Demonstration Plot
Figure 1-6. Biodegradation Pathway for TCE Under Anaerobic Conditions (Source: GeoSyntec, 2003) chlorinated solvents and can be active in close proximity to DNAPL. Given sufficient microbial activity adjacent to the DNAPL source, mass transfer from the surface of free-phase DNAPL may be significantly accelerated, thereby enhancing dissolution of the DNAPL. Launch Complex 34 was chosen as a study site in part because of the presence of TCE DNAPL. Laboratory experiments conducted at UCF for NASA have demonstrated that biostimulation and bioaugmen-tation were successful at reducing TCE concentrations in soil and groundwater samples taken from Launch Com-plex 34 (GeoSyntec, 2003). In addition, the laboratory experiments included a DNA analysis of the micro-organisms present in the soil and groundwater collected from Launch Complex 34. Dehalococcoides DNA was detected in both the soil and groundwater. The presence of Dehalococcoides in the aquifer indi-cated that Launch Complex 34 was a suitable site for biostimulation. However, not all Dehalococcoides are capable of complete biodegradation of PCE through VC
to ethane or ethene. Therefore, the technology demon-stration also included a bioaugmentation component to follow biostimulation. After the biostimulation phase of the demonstration. The test plot was bioaugmented with KB-1™, a consortium of naturally occurring micro-organisms known to completely dechlorinate high concen-trations of TCE to ethene. The installation and operation of the biostimulation and bioaugmentation technology is described in Section 3. 1.5 Technology Evaluation
Report Structure
The biostimulation and bioaugmentation technology evaluation report starts with an introduction to the project organization, the DNAPL problem, the technology dem-onstrated, and the demonstration site (Section 1). The rest of the report is organized as follows: • Site Characterization (Section 2)
• Technology Operation (Section 3)

7
• Performance Assessment Methodology (Section 4)
• Performance Assessment Results and Conclusions (Section 5)
• Quality Assurance (Section 6)
• Economic Analysis (Section 7)
• Technology Applications Analysis (Section 8)
• References (Section 9).
Supporting data and other information are presented in the appendices to the report. The appendices are orga-nized as follows:
• Performance Assessment Methods (Appendix A)
• Hydrogeologic Measurements (Appendix B)
• CVOC Measurements (Appendix C)
• Inorganic and Other Aquifer Parameters (Appendix D)
• Gene-trac Analysis of Groundwater Samples from the Bioaugmentation Demonstration (Appendix E)
• Quality Assurance/Quality Control (QA/QC) Information (Appendix F)
• Economic Analysis Information (Appendix G).


9
2. Site Characterization
This section provides a summary of the hydrogeology and chemistry of the site based on the data compilation report (Battelle, 1999a), the additional site characteriza-tion report (Battelle, 1999b), and the pre-demonstration characterization report (Battelle, 1999c). 2.1 Hydrogeology of the Site
Several aquifers are present at the Launch Complex 34 area (Figure 2-1), reflecting a barrier island complex overlying coastal sediments. A surficial aquifer and a semi-confined aquifer comprise the major aquifers in the Launch Complex 34 area. The surficial aquifer extends from the water table to approximately 45 ft below ground surface (bgs) in the Launch Complex 34 area. A clay semi-confining unit (i.e., the Lower Clay Unit) separates the surficial aquifer from the underlying semi-confined aquifer. Details of the surficial aquifer are provided in Section 2.1.1. The underlying semi-confined aquifer is further described in Section 2.1.2.
2.1.1 The Surficial Aquifer at Launch Complex 34
Figures 2-2 and 2-3 are geologic cross sections, one along the northwest-southeast (NW-SE) direction across the middle of the test plot area and the other along the southwest-northeast (SW-NE) direction across the mid-dle of the bioaugmentation plot. As seen in these figures, the surficial aquifer is subclassified as having an Upper Sand Unit, a Middle Fine-Grained Unit, and a Lower Sand Unit. The Upper Sand Unit extends from ground surface to approximately 20 to 26 ft bgs and consists of unconsolidated, gray fine sand and shell fragments (see Table 2-1). The Middle Fine-Grained Unit is a layer of gray, fine-grained silty/clayey sand that exists between about 26 and 36 ft bgs. In general, this unit contains soil that is finer-grained than the Upper Sand Unit and Lower Sand Unit, and varies in thickness from about 10 to 15 ft. The Middle Fine-Grained Unit is thicker in the northern
Figure 2-1. Regional Hydrogeologic Cross Section through the Kennedy Space Center Area
(after Schmalzer and Hinkle, 1990)

10
Figure 2-2. NW-SE Geologic Cross Section through the Biostimulation and Bioaugmentation Plot portions of the test area under the Engineering Support Building and appears to become thinner in the southern and western portions of the test area. Below the Middle Fine-Grained Unit is the Lower Sand Unit, which con-sists of gray fine to medium-sized sand and shell frag-ments. The unit contains isolated fine-grained lenses of silt and/or clay. The lithologies of thin, very coarse, shell zones were encountered in several units. These zones may be important as reservoirs for DNAPL. A 1.5- to 3-ft-thick semi-confining layer exists at approxi-mately 45 ft bgs in the Launch Complex 34 area. The layer consists of greenish-gray sandy clay. The semi-confining unit was encountered in all borings across the Launch Complex 34 site, and it appears to be a perva-sive unit. However, the clay unit is fairly thin (approx-imately 1.5 ft thick) in some areas (Battelle, 2001). Site characterization data (Battelle, 1999a and 1999b; Eddy-Dilek et al., 1998) suggest that the surfaces of the Mid-dle Fine-Grained Unit and the Lower Clay Unit are somewhat uneven.
Baseline water level surveys were performed in the surfi-cial aquifer in May 1997, December 1997, June 1998, October 1998, and March 1999. Water table elevations in the surficial aquifer were between about 1 and 5 ft mean sea level (msl). In general, the surveys suggest that water levels form a radial pattern with highest eleva-tions near the Engineering Support Building. Figure 2-4 shows a water-table map from June 1998. The gradient and flow directions vary over time at the site. Table 2-2 summarizes the hydraulic gradients and their directions near the Engineering Support Building. The horizontal gradient ranged from 0.00009 to 0.0007 ft/ft. The flow direction varied from north-northeast to south-southwest. Baseline groundwater levels for the bioaugmentation project were measured in March 2002 from all monitor-ing wells in the surficial aquifer. A relatively flat hydraulic gradient was observed within the localized area of the test plot (Figures 2-5 to 2-7) (Battelle, 2003b). On a regional scale, mounding of water levels near the Engi-neering Support Building generates a radial gradient

11
Figure 2-3. SW-NE Geologic Cross Section through the Biostimulation and Bioaugmentation Plot Table 2-1. Local Hydrostratigraphy at the Launch Complex 34 Site
Hydrostratigraphic Unit Thickness
(ft) Sediment Description Aquifer Unit Description
Upper Sand Unit 20-26 Gray fine sand and shell fragments Unconfined, direct recharge from surface
Middle Fine-Grained Unit 10-15 Gray, fine-grained silty/clayey sand Low-permeability, semi-confining layer Surficial Aquifer
Lower Sand Unit 15-20 Gray fine to medium-sized sand and shell fragments Semi-confined
Lower Clay Unit (Semi-Confining Unit) 1.5-3 Greenish-gray sandy clay Thin low-permeability semi-confining unit
Semi-Confined Aquifer >40 Gray fine to medium-sized sand, clay, and shell fragments Semi-confined, brackish

12
Figure 2-4. Water Table Elevation Map for Surficial Aquifer from June 1998
1522200
1522100
1522000
1521900
1521800
1521700
1521400
1521300
152 1200
795600
GO ,. G" ,.
,0 ,. , ,~
" ,. ,. ,. IW - ' OS ~.I~1b ,.
• PZ-13
4.2
795800 796000
fiCW-H{CW-IS) t-j " 3.32
Measurement Location ID Water Table Elevation (ft)
Projection Information: Florida State Plane Coordinate System (East Zone) ,.. Contouring has been extrapolated from nearest data
796200 796400 796600
Contour line fO.02 ft interval~ Contour Line 0.10 ft interval
- - - - - Demonstration Plot Boundaries
796800 797000 797200
()Banelle 100 200 i------o;c-;-;-,-;cc:--;c:-;- c-;: __ :-:"",-------j fEET Battelle , Columbus OH
points surrounding the map area. Oak 11 / 09/ 98
Script: wlco ntour_98.sh

13
Table 2-2. Hydraulic Gradients and Directions in the Surficial and Semi-Confined Aquifers
Hydrostratigraphic Unit Sampling Date Gradient Direction
Surficial Aquifer May 1997 0.00009 SW December 1997 0.0001 SSW June 1998 0.0006 WNW October 1998 0.0007 NNE March 1999 undefined undefined
December 1997 0.0008 S Semi-Confined Aquifer June 1998 0.0005 E October 1998 0.00005 SSW
(Battelle, 1999c); the regional gradient across the test plot is relatively flat (see Figure 2-4). Probable discharge points for the aquifer include wetland areas, the Atlantic Ocean, and/or the Banana River. Water level measure-ments from deep wells screened in the Lower Sand Unit
usually are slightly higher than the water levels from the Upper Sand Unit and/or the Middle Fine-Grained Unit, which indicates that the Middle Fine-Grained Unit serves as a potential hydraulic barrier between the Upper Sand Unit and the Lower Sand Unit. The baseline slug-test results indicate that the Upper Sand Unit is more permeable than the underlying units (the Middle Fine-Grained Unit and Lower Sand Unit), with hydraulic conductivity ranging from 4.0 to 5.1 ft/day in the shallow wells at the site. The hydraulic conductivities ranged from 1.4 to 6.4 ft/day from the intermediate wells in the Middle Fine-Grained Unit. The hydraulic conduc-tivities ranged from 1.3 to 2.3 ft/day from the deep wells in the Lower Sand Unit. Porosity averaged 0.26 in the Upper Sand Unit, 0.34 in the Middle Fine-Grained Unit, 0.29 in the Lower Sand Unit, and 0.44 in the Lower Clay Unit. The bulk density of the aquifer materials averaged 1.59 g/cm3 (Battelle, 1999b). Other notable hydrologic influences at the site include drainage and recharge.
Figure 2-5. Pre-Demonstration Water Levels (as elevation msl) in Shallow Wells at Launch Complex 34
(March 2002)

14
Figure 2-6. Pre-Demonstration Water Levels (as elevation msl) in Intermediate Wells at
Launch Complex 34 (March 2002) Paved areas, vegetation, and topography affect drainage in the area. No streams exist in the site area. Engi-neered drainage at the site consists of ditches that lead to the Atlantic Ocean or swampy areas. The flow system may be influenced by local recharge events, resulting in the variation in gradients. Recharge to the surficial aqui-fer is from infiltration of precipitation through surface soils to the aquifer. Permeable soils exist from the ground surface to the water table and drainage is excel-lent. Water infiltrates directly to the water table. 2.1.2 The Semi-Confined Aquifer
at Launch Complex 34
The semi-confined aquifer underlying the Lower Clay Unit was investigated as part of another technology demonstration at Launch Complex 34 (Battelle, 2001). The semi-confined aquifer (Caloosahatchee Marl forma-tion or equivalent) is 40 to 50 ft thick or greater and is composed of silty to clayey sand and shells. Underlying
the semi-confined aquifer is the Hawthorne formation, a clayey sand-confining layer. The limestone Floridan Aqui-fer underlies the Hawthorne formation and is a major source of drinking water for much of Florida. Table 2-3 summarizes the character and water-bearing properties of the hydrostratigraphic units in the area. Water level surveys in the semi-confined aquifer were performed at various times from April 2001 to March 2002 (Battelle, 2003a). Water table elevations were measured at approximately 1 to 5 ft msl, and formed a pattern similar to the pattern formed by surficial aquifer water levels. Water level elevations from wells in the deep aquifer were measured at approximately 1 to 5 ft msl, suggest-ing that the aquifer is confined in the Launch Complex 34 area. The gradient in the semi-confined aquifer is positioned in a similar direction to the surficial aquifer. The horizontal gradient is east to northeast. The vertical gradient changes from downward to upward depending on seasons, which suggests that the Lower Clay Unit is not a fully confined unit. Recharge to the aquifer may

15
Figure 2-7. Pre-Demonstration Water Levels (as elevation msl) in Deep Wells at Launch Complex 34
(March 2002) occur by downward leakage from overlying aquifers or from direct infiltration inland where the aquifer is unconfined. Schmalzer and Hinkle (1990) suggest that saltwater intrusion may occur in intermediate aquifers such as the semi-confined aquifer. 2.2 Surface Water Bodies
at the Site
The major surface water body in the area is the Atlantic Ocean, located to the east of Launch Complex 34. To determine the effects of surface water bodies on the groundwater system, water levels were monitored in 12 piezometers for more than 50 hours for a tidal influ-ence study during Resource Conservation and Recovery Act (RCRA) Facility Investigation (RFI) activities (G&E Engineering, Inc., 1996). All the piezometers used in the study were screened in the surficial aquifer. No detectable effects from the tidal cycles were measured, suggesting that the surficial aquifer and the Atlantic Ocean are not
well connected hydraulically. However, the Atlantic Ocean and the Banana River seem to act as hydraulic barriers or sinks, as groundwater likely flows toward these sur-face water bodies and discharges into them. 2.3 DNAPL Contamination in the
Demonstration Plot and Vicinity
Figure 2-8 shows representative pre-demonstration dis-tributions of TCE in groundwater, the primary contami-nant at Launch Complex 34, in the shallow wells. Pre-demonstration distributions of TCE in the intermediate and deep wells were not available due to the limited dataset (i.e., only two wells per depth). The shallow, intermediate, and deep monitoring wells were installed during the site characterization to correspond with the hydrostratigraphic units: Upper Sand Unit, Middle Fine-Grained Unit, and Lower Sand Unit (Battelle, 2002a), respectively. The targeted unit for the biostimulation and bioaugmentation demonstration was the Upper Sand

16
Table 2-3. Hydrostratigraphic Units of Brevard Country, Florida(a)
Geologic Age Stratigraphic Unit Approximate Thickness (ft) General Lithologic Character Water-Bearing Properties
Recent (0.1 MYA-present)
Pleistocene (1.8-0.1 MYA)
Pleistocene and Recent Deposits 0-110
Fine to medium sand, coquina and sandy shell marl.
Permeability low due to small grain size, yields small quantities of water to shallow wells, principal source of water for domestic uses not supplied by municipal water systems.
Pliocene (1.8-5 MYA)
Upper Miocene and Pliocene Deposits (Caloosahatchee Marl) 20-90
Gray to greenish gray sandy shell marl, green clay, fine sand, and silty shell.
Permeability very low, acts as confining bed to artesian aquifer, produces small amount of water to wells tapping shell beds.
Miocene (5-24 MYA) Hawthorne Formation 10-300
Light green to greenish gray sandy marl, streaks of greenish clay, phosphatic radiolarian clay, black and brown phosphorite, thin beds of phosphatic sandy limestone.
Permeability generally low, may yield small quanti-ties of fresh water in recharge areas, generally permeated with water from the artesian zone. Contains relatively impermeable beds that prevent or retard upward movement of water from the underlying artesian aquifer. Basal permeable beds are considered part of the Floridan Aquifer.
Crystal River Formation 0-100 White to cream, friable, porous coquina in a soft, chalky, marine limestone.
Williston Formation 10-50 Light cream, soft, granular marine limestone, generally finer grained than the Inglis Formation, highly fossiliferous.
Oca
la G
roup
Inglis Formation 70+ Cream to creamy white, coarse granular limestone, contains abundant echinoid fragments.
Eocene (37-58 MYA)
Avon Park Limestone 285+
White to cream, purple tinted, soft, dense chalky limestone. Localized zones of altered to light brown or ashen gray, hard, porous, crystalline dolomite.
Floridan Aquifer: Permeability generally very high, yields large quantities of artesian water. Chemical quality of the water varies from one area to another and is the dominant factor controlling utilization. A large percentage of the groundwater used in Brevard County is from the artesian aquifer. The Crystal River Formation will produce large quantities of artesian water. The Inglis Formation is expected to yield more than the Williston Formation. Local dense, indurate zones in the lower part of the Avon Park Limestone restrict permeability but in general the formation will yield large quantities of water.
(a) Source: Schmalzer and Hinkle (1990). MYA = million years ago.

17
Unit and the treatment was applied only to this unit. A pre-demonstration TCE concentration in groundwater greater than the solubility level of TCE (1,100,000 µg/L = 1,100 mg/L) was measured in monitoring well PA-26 in the center of the test plot (see Figure 2-8). However, the TCE-DNAPL was not visually observed during the pre-demonstration monitoring. Substantial TCE also was detected to the north and south around the perimeter of the plot in monitoring wells PA-27S and PA-28S, respec-tively. Considerable cis-1,2-DCE was detected in the Upper Sand Unit, indicating some historical natural attenuation of TCE (see Figure 2-9). Figures 2-10 and 2-11 show representative pre-demonstration horizontal distributions of TCE in soil from the Upper Sand Unit at 20 ft bgs and 26 ft bgs, respec-tively. TCE levels were highest in the eastern portion of the test plot at both 20 and 24 ft bgs. Pre-demonstration concentrations of TCE in soil appear to be higher at 24 ft bgs than at 20 ft bgs. At both depths, TCE in soil was measured at concentrations greater than 300 mg/kg, which is indicative of DNAPL. As seen in the vertical cross section in Figure 2-12, much of the TCE was pres-ent in the Upper Sand Unit and the Middle Fine-Grained Unit. Based on the results of the pre-demonstration soil sampling, the Upper Sand Unit was chosen as the targeted zone for the demonstration because of the high concentrations of TCE present and because the hydro-stratigraphic unit contained permeable soils that would be amenable to the injections associated with biostimu-lation and bioaugmentation. The pre-demonstration soil sampling indicated that be-tween 18 and 47 kg of TCE was present in the Upper Sand Unit of the bioaugmentation plot before the demon-stration. Approximately 2.6 kg of this TCE may occur as DNAPL, based on a threshold TCE concentration of about 300 mg/kg in the soil. This threshold figure is determined as the maximum TCE concentration in the dissolved and adsorbed phases in the Launch Complex 34 soil. This figure is a conservative estimate and takes into account the minor variability in the aquifer charac-teristics, such as porosity, bulk density, and organic car-bon content. The native organic carbon content of the Launch Complex 34 soil is relatively low and the thresh-old TCE concentration is driven by the solubility of TCE in the porewater. The threshold figure was calculated as follows (U.S. EPA, 1996):
b
bdwatersat
n) (K CCρ
+ρ= (2-1)
where Csat = maximum TCE concentration in the dissolved and adsorbed phases (mg/kg)
Cwater = TCE solubility (mg/L) = 1,100 ρb = bulk density of soil (g/cm3) = 1.59 n = porosity (unitless) = 0.3 Kd = partitioning coefficient of TCE in soil
[(mg/kg)/(mg/L)], equal to (foc · Koc) = 0.057.
foc = fraction organic carbon (unitless) Koc = organic carbon partition coefficient
[(mg/kg)/(mg/L)] = 126. At concentrations below the threshold value of 300 mg/kg, the TCE was considered to be present in the dissolved phase; at or above this threshold value, the TCE was considered to be TCE-DNAPL (Battelle, 1999d). Figure 2-13 is a three-dimensional (3D) depiction of pre-demonstration concentrations of TCE as DNAPL in the soil of the Upper Sand Unit. It was created by taking TCE concentrations above the threshold value of 300 mg/kg in the Upper Sand Unit of the test plot (see Figure 2-12), and using the software program EarthVision® to create the 3D picture. The mass of TCE as DNAPL in Figure 2-13 is 2.6 kg in the Upper Sand Unit (see Section 5.1.2). 2.4 Aquifer Quality at the Site
Appendix A.3 lists the various aquifer parameters measured and the standard methods used to analyze them. Appendix D contains the results of the pre-demonstration groundwater analysis. Pre-demonstration groundwater field parameters were measured in several wells in the demonstration area in March 2002. The pH was relatively constant with depth, and ranged from 6.5 to 7.0. Prior to the treatment, dissolved oxygen (DO) lev-els were measured at 1 mg/L or less in all of the wells that were sampled, indicating that the aquifer was anaerobic. Oxidation-reduction potential (ORP) from all the sampled wells ranged from +54 to +171 millivolts (mV). The levels for total organic carbon (TOC) were relatively low and varied from 0.9 to 1.7% of dry soil weight, which indicates that microbes degrading TCE at the site used available TOC as a carbon source. Inorganic and other native groundwater parameters in the surficial aquifer were measured in March 2002 at the performance monitoring wells in the Upper Sand Unit to determine the pre-demonstration quality of the ground-water in the target area: • Total dissolved solids (TDS) concentrations
increased sharply with depth, suggesting that the water becomes more brackish with depth. The TDS levels ranged from 898 to 1,630 mg/L. Chloride concentrations ranged from 125 to 852 mg/L and increased sharply with depth, indicating some salt-water intrusion in the deeper layers. These high

18
Figure 2-8. Pre-Demonstration Dissolved TCE Concentrations (µg/L) in Shallow Wells in the Treatment Plot (March 2002)
Figure 2-9. Pre-Demonstration Dissolved DCE Concentra-tions (µg/L) in Shallow Wells in the Treatment Plot (March 2002)

19
Figure 2-10. Pre-Demonstration TCE Concentrations (mg/kg) in Soil in the Upper Sand Unit
approximately 20 ft bgs in the Treatment Plot and Vicinity (January 2002)
Figure 2-11. Pre-Demonstration TCE Concentrations (mg/kg) in Soil in the Upper Sand Unit
approximately 24 ft bgs in the Treatment Plot and Vicinity (January 2002)

20
Figure 2-12. Vertical Cross Section through the Treatment Plot Showing Pre-Demonstration TCE Soil
Concentrations (mg/kg) in the Subsurface
Figure 2-13. Pre-Demonstration TCE Concentrations (mg/kg) as DNAPL in Soil in the Upper Sand Unit
at Launch Complex 34 (January/February 2002)
21
levels of chloride made it difficult to determine the extent to which additional chloride byproducts were formed after treatment.
• Alkalinity levels ranged from 261 to 463 mg/L, and decreased with depth. Alkalinity levels were lowest in the Lower Sand Unit.
• Dissolved iron concentrations ranged from 2.7 to 31 mg/L in the groundwater, and decreased with depth. Dissolved iron concentrations in ground-water were highest in the Upper Sand Unit. Total iron concentrations were not measured for this demonstration.
• Dissolved silica concentrations ranged from 14.1 to 56.6 mg/L, and increased with depth.
• Calcium concentrations ranged from 53 to 168 mg/L, with no discernible trend with depth. Magnesium concentrations ranged from 10 to 82 mg/L, and increased with increasing depth.
• Sodium concentrations were between 32 and 362 mg/L, and increased with depth. Potassium concentrations ranged from 19 to 279 mg/L, and decreased with depth.
• The changes in microbial characteristics of the aquifer were determined by comparing the bio-logical oxygen demand (BOD) and dissolved methane gas concentrations in groundwater sam-ples collected before and after the bioaugmentation demonstration. BOD levels in the pre-demonstration groundwater samples ranged from <6.0 to <12.0 mg/L.
• TOC concentrations in groundwater ranged from 31 mg/L to 235 mg/L. Concentrations were highest in the Upper Sand Unit and Middle Fine-Grained Unit.
• Sulfate concentrations ranged from 73 mg/L to 385 mg/L, and showed an increasing trend with depth.

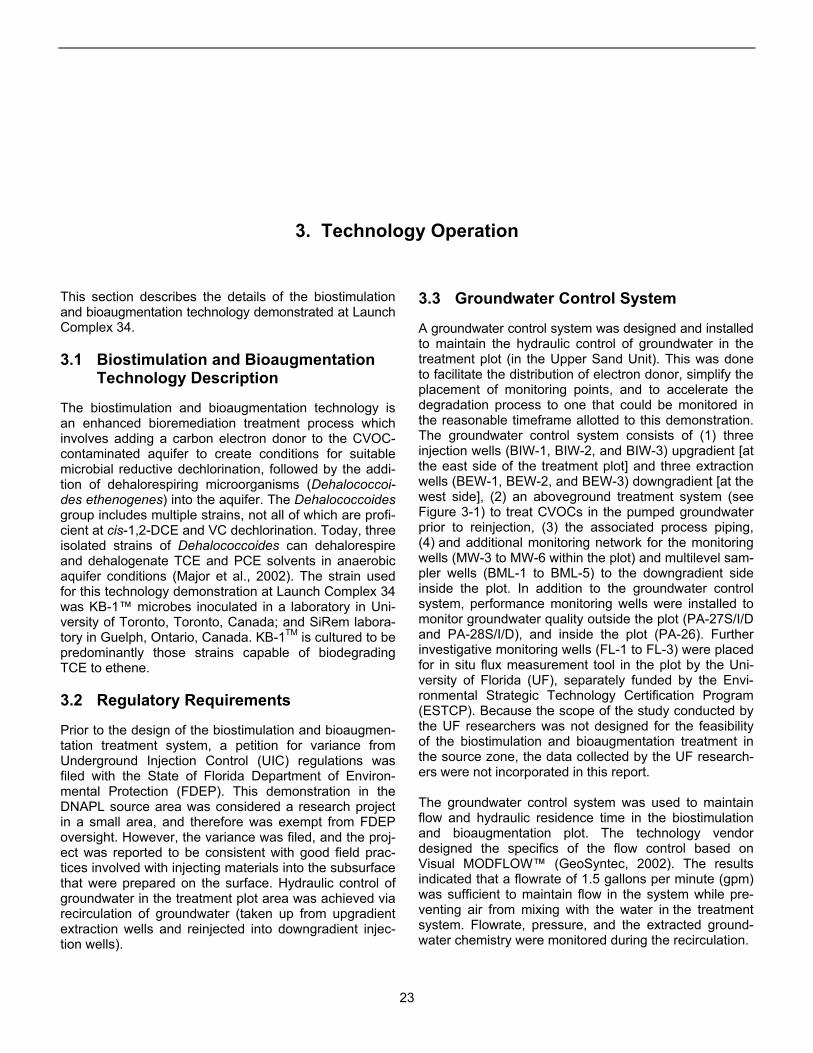
23
3. Technology Operation
This section describes the details of the biostimulation and bioaugmentation technology demonstrated at Launch Complex 34. 3.1 Biostimulation and Bioaugmentation
Technology Description
The biostimulation and bioaugmentation technology is an enhanced bioremediation treatment process which involves adding a carbon electron donor to the CVOC-contaminated aquifer to create conditions for suitable microbial reductive dechlorination, followed by the addi-tion of dehalorespiring microorganisms (Dehalococcoi-des ethenogenes) into the aquifer. The Dehalococcoides group includes multiple strains, not all of which are profi-cient at cis-1,2-DCE and VC dechlorination. Today, three isolated strains of Dehalococcoides can dehalorespire and dehalogenate TCE and PCE solvents in anaerobic aquifer conditions (Major et al., 2002). The strain used for this technology demonstration at Launch Complex 34 was KB-1™ microbes inoculated in a laboratory in Uni-versity of Toronto, Toronto, Canada; and SiRem labora-tory in Guelph, Ontario, Canada. KB-1TM is cultured to be predominantly those strains capable of biodegrading TCE to ethene. 3.2 Regulatory Requirements
Prior to the design of the biostimulation and bioaugmen-tation treatment system, a petition for variance from Underground Injection Control (UIC) regulations was filed with the State of Florida Department of Environ-mental Protection (FDEP). This demonstration in the DNAPL source area was considered a research project in a small area, and therefore was exempt from FDEP oversight. However, the variance was filed, and the proj-ect was reported to be consistent with good field prac-tices involved with injecting materials into the subsurface that were prepared on the surface. Hydraulic control of groundwater in the treatment plot area was achieved via recirculation of groundwater (taken up from upgradient extraction wells and reinjected into downgradient injec-tion wells).
3.3 Groundwater Control System
A groundwater control system was designed and installed to maintain the hydraulic control of groundwater in the treatment plot (in the Upper Sand Unit). This was done to facilitate the distribution of electron donor, simplify the placement of monitoring points, and to accelerate the degradation process to one that could be monitored in the reasonable timeframe allotted to this demonstration. The groundwater control system consists of (1) three injection wells (BIW-1, BIW-2, and BIW-3) upgradient [at the east side of the treatment plot] and three extraction wells (BEW-1, BEW-2, and BEW-3) downgradient [at the west side], (2) an aboveground treatment system (see Figure 3-1) to treat CVOCs in the pumped groundwater prior to reinjection, (3) the associated process piping, (4) and additional monitoring network for the monitoring wells (MW-3 to MW-6 within the plot) and multilevel sam-pler wells (BML-1 to BML-5) to the downgradient side inside the plot. In addition to the groundwater control system, performance monitoring wells were installed to monitor groundwater quality outside the plot (PA-27S/I/D and PA-28S/I/D), and inside the plot (PA-26). Further investigative monitoring wells (FL-1 to FL-3) were placed for in situ flux measurement tool in the plot by the Uni-versity of Florida (UF), separately funded by the Envi-ronmental Strategic Technology Certification Program (ESTCP). Because the scope of the study conducted by the UF researchers was not designed for the feasibility of the biostimulation and bioaugmentation treatment in the source zone, the data collected by the UF research-ers were not incorporated in this report. The groundwater control system was used to maintain flow and hydraulic residence time in the biostimulation and bioaugmentation plot. The technology vendor designed the specifics of the flow control based on Visual MODFLOW™ (GeoSyntec, 2002). The results indicated that a flowrate of 1.5 gallons per minute (gpm) was sufficient to maintain flow in the system while pre-venting air from mixing with the water in the treatment system. Flowrate, pressure, and the extracted ground-water chemistry were monitored during the recirculation.

24
Figure 3-1. Aboveground Water Treatment System The groundwater control system started operation on June 10, 2002 at the combined extraction rate of 1.5 gpm (each of 0.5 gpm from BEW-1 to BEW-3) and continued throughout the demonstration of the treatment pro-cesses. The control system was operated throughout the (1) baseline phase prior to biostimulation (June 10 to October 08, 2002) from BEW-1 to BEW-3, (2) the biostimulation phase (October 2002 to January 2003), and (3) the bioaugmentation phase (after the addition of Dehalococcoides in early February 2003) [see Table 3-1]. However, the recirculated groundwater was run through the carbon canisters only during the testing and modification portion of the baseline phase, from May 23 to September 12, 2002. As predicted by the vendor’s modeling results, the extraction rate was set at 1.5 gpm from the combined extraction wells (BEW-1 to BEW-3). Extraction rates were approximately 0.5 gpm from each of wells BEW-1, -2, and -3. The technology vendor frequently recorded the logs of the average groundwater extraction flowrates from various sample ports daily and water levels mea-sured using a pressure transducer (GeoSyntec, 2003). In every site visit (every other week), the following activi-ties were performed to maintain the groundwater control system: • Pressure drop across granulated activated carbon
(GAC) tank filter cartridges
• Collection of liquid samples from the effluent sampling port of the GAC tanks
• Collection of liquid samples before the reinjection into BIW-1, BIW-2, and BIW-3.
• Flowrate and pressure measurements
• Water level measurements
• Site inspection and engineering control
• Replacement of GAC tanks and filter cartridges
• Routine maintenance of the extraction pump.
Before the biostiumulation and bioaugmentation phases, the average flowrate was maintained at a total of 1.5 gpm (0.5 gpm from each extraction wellhead). During the baseline period prior to the biostimulation and bioaugmentation processes, a series of tracer tests were conducted to estimate an average groundwater velocity along the centerline of the treatment plot. The tracer test, using a concentrated potassium bromide (KBr) solution, was conducted from August 8 to 13, 2002. Groundwater was amended with a KBr solution concentration at 50 mg/L before the reinjection into the injection wells (BIW-1 to BIW-3). Groundwater was monitored from the monitoring wells along the flow path during the entire demonstration period. The observed groundwater veloc-ity was 0.75 ft/day in the treatment plot. The groundwater control system was designed to oper-ate and maintain the residence time of 32 days. Hydrau-lic control was well maintained in the treatment area of the demonstration plot (see Section 5.3.3).

25
Table 3-1. In Situ Bioremediation by Biostimulation and Bioaugmentation
Dates Activity Comments
January 10, 2001 Technology demonstration contract awarded to GeoSyntec (technology vendor). June 4 to 9, 2001 Site characterization conducted by the vendor.
October 2001 to January 7, 2002
Design/modeling of the biostimulation and bioaugmentation technology performed.
January 8, 2002 Final design report submitted to NASA.
January 14, 23, and 24, 2002
Pre-demonstration soil sampling conducted. Cores SB-1 to -4 (gap in January time due to sampling in EZVI plot)
February 4 to 6, 2002 Pre-demonstration soil sampling continued. Cores SB-5 and SB-7 February 25 to May 11,
2002 Injection/extraction wells installed by the vendor for groundwater recirculation. Multilevel chamber wells installed by the vendor for groundwater monitoring. Monitoring wells installed by the vendor for groundwater monitoring.
BIW-1 to -3, BEW-1 to -3, BML-1 to -5 (5 depths)
MW-3 to -6, FL-1 to -3
March 7, 11-12, 19-20, and 28
Performance monitoring wells installed by Battelle. PA-26, -27S/I/D, and -28S/I/D
March 25 to 30, 2002 Aboveground treatment system constructed by the vendor.
April 22 to May 30, 2002 Testing and modifications of the treatment system performed.
May 23, 2002 Recirculated groundwater passed through carbon canisters prior to reinjection.
June 10, 2002 Continuous recirculation began. Extraction rate at 0.5 gpm from each well for a total of 1.5 gpm.
August 8 to 13, 2002 Tracer test started. Reinjected groundwater was amended for 5 days with concentrated KBr to achieve the injected concentration level at 50 mg/L.
September 12, 2002 Carbon canisters removed from the recirculated groundwater system; recirculation continued.
October 23, 2002 Biostimulation Phase started:
Electron donor (ethanol) injected into injection wells BIW-1, -2, and -3 in the upgradient side of the plot.
Multiple observation wells (FL-2, BML-3, MW-6, PA-26, and MW-3 at the distances of 1, 3, 7, 15, and 17.5 ft, respectively, right to the flow direction within the treatment plot).
November 21, 2002 First observed presence of biofouling in injection well screens and treatment system:
Decrease of ethanol injection frequency.
Scrubbing, surging, and purging of each injection well.
Amending the reinjected groundwater with sodium hypochloride (NaOCl) to inhibit the microbial activity in the wells.
December 2002 Groundwater sampling during biostimulation
February 6, 2003 Bioaugmentation Phase started
March 2003 Groundwater sampling during bioaugmentation
Addition of 40 L of KB-1™ cultures into the injection wells (BIW-1 to -3).
June 17 to 21, 2003 Post-demonstration characterization (soil and groundwater) conducted. Cores SB-202, SB-205 to -207; SB-210 and -211

26
3.4 Enhanced Bioremediation by the Biostimulation and Bioaugmentation Technology
As discussed in Section 1.4, complete reductive dechlo-rination of TCE to ethene at some sites can be achieved by the sequential treatment of biostimulation and bio-augmentation processes. Biostimulation involves adding an electron donor solution of carbon substrate, such as ethanol, methanol, and/or acetate, under anaerobic aquifer conditions. Then, bioaugmentation enhances the degradation processes by adding a consortium of Dehalococcoides microbial cultures capable of degrad-ing TCE-DNAPL and any byproducts. Although biostimu-lation alone may be sufficient to cause biodegradation at some sites, it may be appropriate to bioaugment an aquifer in cases where the presence of indigenous Dehalococcoides is weak or nonexistent, or where there is historical evidence of biodegradation stalling at cis-1,2-DCE. Inside the Engineering Support Building at Launch Complex 34, the DNAPL source zone was not large enough to conduct a control demonstration using biostimulation alone. Therefore, the sequential treatment of biostimulation and bioaugmentation was evaluated in the same demonstration plot. The bioaugmentation phase of the treatment was designed to determine if the KB-1TM culture was capable of biodegrading TCE (at DNAPL concentrations) to ethene within the timeframe of this project. The design report for the biostimulation and bioaugmen-tation technology was prepared by GeoSyntec (2002) and included location maps for injection and monitoring well locations; schematics of biostimulation and bioaug-mentation phases, a groundwater recirculation system, and a hydraulic control recirculation system; and other design-related information. The treatment plot was located over an area of the DNAPL source zone inside the Engineering Support Building at Launch Complex 34. This zone was contaminated primarily with TCE and to a lesser extent with PCE and dichloroethenes (including cis-1,2-DCE and trans-1,2-DCE). Previously, four other in situ remedial technology dem-onstrations were hosted at the Launch Complex 34 DNAPL source zone: in situ chemical oxidation (ISCO), resistive heating, steam injection/extraction (SI/E), and emulsified zero-valent iron (EZVI) injection. During the SI/E demonstration, it was noted that the injected heat and steam flowed along preferential pathways through the subsurface of the DNAPL source area. Therefore, it was decided that the biostimulation and bioaugmentation technology demonstration would be performed at a loca-tion inside the Engineering Support Building south of the resistive heating plot (see Figure 1-3).
3.4.1 Biostimulation
In theory, biostimulation can be established by adding electron donor to the aquifer to provide a source of energy for microbes and stimulate reductive dechlorina-tion of TCE and intermediate byproducts. However, the biostimulation process alone may take a very long time, especially to complete the degradation of TCE byproducts. For the biostimulation phase of this demonstration, eth-anol was chosen as the electron donor. The electron donor was added using an Ismatec® multi-channel chemical metering pump to control dosage from the chemical storage vessels into the groundwater injection wells (BIW-1 to BIW-3). The biostimulation system consisted of the following components: • A chemical metering pump,
• A reservoir vessel to contain concentrated tracer and electron donor,
• Check valves to prevent groundwater in the aboveground treatment system from flowing back into the chemical reservoir vessel,
• An in-line static mixer.
Delivery of the electron donor solution into the treatment plot began on October 23, 2002. The injection concen-tration for the electron donor was daily average of 140 mg/L. This rate was based upon providing a time-weighted average concentration which was seven times in excess of the concentration required on a stoichio-metric basis to biodegrade the CVOC concentrations observed during baseline operation. The addition of the proper dosage (approximately 140 mg/L) was performed as a 1 to 2 hour pulse per day. A flow sensor located immediately upstream of the dosing equipment was used to control the dose rate of electron donor. During the biostimulation phase, groundwater was moni-tored to determine whether a proper aquifer condition was established for KB-1™ cultures to grow in the aqui-fer. In November 2002, an accumulation of biofouling was observed in monitoring well screens and treatment systems: FL-2, BML-3, MW-6, PA-26, and MW-3. As a result of the biofouling, electron donor (ethanol) was added less frequently (less than a daily addition). In order to clean out the biofouling in the monitoring wells, each impacted monitoring well was scrubbed, surged, and purged out. Then, the recirculated groundwater amended with sodium hypochloride (NaOCl) was reintro-duced into the injection wells. The NaOCl solution was

27
used to inhibit the microbial growths in the injection wells. Groundwater samples for performance assessment were collected in December 2002 during the biostimulation phase (see Table 3-1). Groundwater monitoring results are discussed in Section 5. The biostimulation phase lasted until early February 2003 prior to the addition of KB-1™ cultures. The the biostimulation phase of the technology demonstration was considered to be finished based on the vendor’s monitoring data and contractual scheduling constraints. The bioaugmentation phase began with the injection of the microbial cultures in early February 2003. 3.4.2 Bioaugmentation
In early February 2003, the microbial consortium of KB-1™ cultures was introduced into the aquifer. KB-1™ is a consortium of genetically engineered cultures from natu-rally occurring microbes, growing in a TCE-contaminated site. The cultures were isolated and inoculated by the University of Toronto, Canada and SiRem Laboratory, available through the vendor. The KB-1™ culture was shipped by an overnight carrier to the site in specially designed 20-L stainless steel vessels, as shown in Figure 3-2. The vessels were designed to preserve microbial cultures at anaerobic conditions while the containers were safe to the cultures. The vessel was pressurized with inert gas during ship-ment, and the inert gas was later used to apply the microbial cultures passively into the injection wells without any other engineering pumps. Approximately 40 L of KB-1 (biomass density of 4 × 10¹¹ to 4 × 10¹² as Dehalococcoides) was added into the upgradient injection wells (BIW-1 to BIW-3) for this demonstration. The total culture volume injected was estimated based on the laboratory bench scale con-ducted by University of Toronto (GeoSyntec, 2003). The bioaugmentation phase continued when the post-demonstration monitoring was conducted in June 2003. The post-demonstration CVOC and other aquifer quality results are discussed in Section 5. Similar to the bio-stimulation phase of the treatment, the bioaugmentation
Figure 3-2. KB-1™ Dechlorinator Culture
Containers phase ended and post-demonstration monitoring was initiated based on scheduling and contractual obligations rather than available data. However, it is likely that any KB-1TM remaining in the aquifer after the post-demonstration performance assessment monitoring would continue to biodegrade CVOCs still present in the treatment area. 3.5 Waste Handling and Disposal
Spent GAC was characterized and disposed of by the manufacturer of the GAC units. Solid waste generated during the demonstration such as gloves and sampling tubes were contained in open-top 55-gal drums specified (UN1A2/Y1.4/100) by the Department of Transportation and required by the site owner (NASA). Liquid samples were contained in closed-top 55-gal drums specified (UN1A1/Y1.4/100) and stored on site in a locked, fenced storage area until disposal by the site owner. If DNAPL was present in the extracted groundwater, the DNAPL was stored in liquid waste disposal drums with the liquid samples.


29
4. Performance Assessment Methodology
Battelle, in conjunction with the U.S. EPA SITE Program, conducted an independent performance assessment of the biostimulation and bioaugmentation demonstration at Launch Complex 34 (see Figure 4-1). The objectives and methodology for the performance assessment were outlined in a QAPP prepared before the field demonstra-tion and reviewed by all project stakeholders (Battelle, 2002a). The objectives of the performance assessment were to: • Estimate the change in total TCE and DNAPL mass
in the test plot due to the biostimulation and bioaugmentation treatment;
• Evaluate changes in aquifer quality due to the biostimulation and bioaugmentation treatment;
• Evaluate the fate of TCE due to the biostimulation and bioaugmentation treatment;
• Verify biostimulation and bioaugmentation technology operating requirements and costs.
Table 4-1 summarizes the measurements and sampling locations associated with each performance objective.
Figure 4-1. Soil Sampling for Performance
Assessment at Launch Complex 34
The performance assessment was based on results obtained from sampling activities in the targeted hydro-stratigraphic unit for the treatment technology, which was the Upper Sand Unit. Results from samples col-lected in other units (Middle Fine-Grained Unit, Lower Sand Unit) were used to evaluate the technology’s effect, if any, on vertical contaminant migration. 4.1 Estimating Changes in
TCE-DNAPL Mass
The primary objective of the performance assessment was to estimate the changes in total TCE and DNAPL mass in the target unit (i.e., the Upper Sand Unit) due to the biostimulation and bioaugmentation treatment. Total TCE includes both dissolved-phase and free-phase TCE present in the aquifer soil matrix. DNAPL refers to free-phase TCE only and is defined by the threshold TCE concentration of 300 mg/kg as calculated in Section 2.3. Soil sampling in the treatment plot was used to estimate changes in TCE-DNAPL mass before and after the demonstration. A statistical evaluation for determining whether the remediation technology removed DNAPL at a pre-determined percentage over the period of the treatment was not used for this performance assess-ment. Biostimulation and bioaugmentation are different from other, more rigorous and directly applied remedi-ation technologies. Biostimulated and bioaugmented sites require a much longer time frame for remediation, not only to determine if the microbial communities are actively established to treat the site, but also because the microbial communities may continue to treat the contaminants on site long after a technology demon-stration ends. 4.1.1 Changes in TCE-DNAPL Mass
Soil coring was chosen as the primary method for col-lecting and analyzing samples to determine changes in TCE and TCE-DNAPL mass as a result of the tech-nology. Previous soil coring, sampling, and analysis at Launch Complex 34 (Battelle, 1999b; Eddy-Dilek et al., 1998) indicated that soil sampling was a viable technique
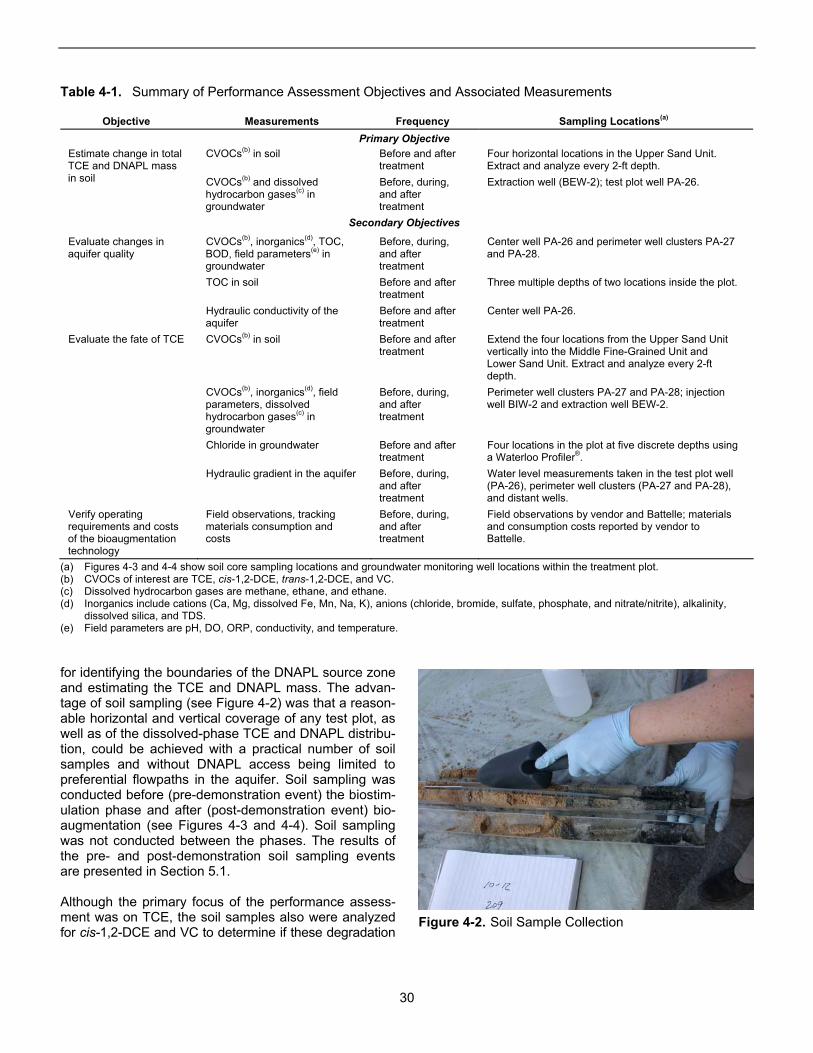
30
Table 4-1. Summary of Performance Assessment Objectives and Associated Measurements
Objective Measurements Frequency Sampling Locations(a) Primary Objective
CVOCs(b) in soil Before and after treatment
Four horizontal locations in the Upper Sand Unit. Extract and analyze every 2-ft depth.
Estimate change in total TCE and DNAPL mass in soil CVOCs(b) and dissolved
hydrocarbon gases(c) in groundwater
Before, during, and after treatment
Extraction well (BEW-2); test plot well PA-26.
Secondary Objectives
CVOCs(b), inorganics(d), TOC, BOD, field parameters(e) in groundwater
Before, during, and after treatment
Center well PA-26 and perimeter well clusters PA-27 and PA-28.
TOC in soil Before and after treatment
Three multiple depths of two locations inside the plot.
Evaluate changes in aquifer quality
Hydraulic conductivity of the aquifer
Before and after treatment
Center well PA-26.
CVOCs(b) in soil Before and after treatment
Extend the four locations from the Upper Sand Unit vertically into the Middle Fine-Grained Unit and Lower Sand Unit. Extract and analyze every 2-ft depth.
CVOCs(b), inorganics(d), field parameters, dissolved hydrocarbon gases(c) in groundwater
Before, during, and after treatment
Perimeter well clusters PA-27 and PA-28; injection well BIW-2 and extraction well BEW-2.
Chloride in groundwater Before and after treatment
Four locations in the plot at five discrete depths using a Waterloo Profiler®.
Evaluate the fate of TCE
Hydraulic gradient in the aquifer Before, during, and after treatment
Water level measurements taken in the test plot well (PA-26), perimeter well clusters (PA-27 and PA-28), and distant wells.
Verify operating requirements and costs of the bioaugmentation technology
Field observations, tracking materials consumption and costs
Before, during, and after treatment
Field observations by vendor and Battelle; materials and consumption costs reported by vendor to Battelle.
(a) Figures 4-3 and 4-4 show soil core sampling locations and groundwater monitoring well locations within the treatment plot. (b) CVOCs of interest are TCE, cis-1,2-DCE, trans-1,2-DCE, and VC. (c) Dissolved hydrocarbon gases are methane, ethane, and ethane. (d) Inorganics include cations (Ca, Mg, dissolved Fe, Mn, Na, K), anions (chloride, bromide, sulfate, phosphate, and nitrate/nitrite), alkalinity,
dissolved silica, and TDS. (e) Field parameters are pH, DO, ORP, conductivity, and temperature. for identifying the boundaries of the DNAPL source zone and estimating the TCE and DNAPL mass. The advan-tage of soil sampling (see Figure 4-2) was that a reason-able horizontal and vertical coverage of any test plot, as well as of the dissolved-phase TCE and DNAPL distribu-tion, could be achieved with a practical number of soil samples and without DNAPL access being limited to preferential flowpaths in the aquifer. Soil sampling was conducted before (pre-demonstration event) the biostim-ulation phase and after (post-demonstration event) bio-augmentation (see Figures 4-3 and 4-4). Soil sampling was not conducted between the phases. The results of the pre- and post-demonstration soil sampling events are presented in Section 5.1. Although the primary focus of the performance assess-ment was on TCE, the soil samples also were analyzed for cis-1,2-DCE and VC to determine if these degradation
Figure 4-2. Soil Sample Collection

31
Figure 4-3. Pre-Demonstration Soil Boring Locations (BIO-SB-1 through BIO-SB-7) in the Treatment
Plot (January/February 2002)
Bioaugmentation Plot Inside of PA-27 Engineering Support \ilding
S S S 5 I D
~ ~
BEW-l , @
, @ ~ BML-l S
, , (If) ,
BIO-SB-6 , @ SWP-l
MW4 ! BIW-l , BIO-SB-7
,
1\ , ,
~BML-2 , , , , , ,
@ I
~BML-3 S SPA-26
S (If) BEW-2 MW6 MW3 BIW-2
~ BML-4 ~-lS BIO-SB-l @ BEW-3 @BIO-SB-2 @ WP-2S
@ ~BML-S
BIO-SB-S S (If) MWS BIW-3
PSS S S D I 5 ~ BIO-SB-3 BIO-SB-4
@ @
Ex~lanation
!II Extraction Well (Recirculation Well) ~ ~ " • Injection Well (Recirculation Well) ~~ S Monitoring Well
• Multi-Level Monitoring Well DESIGNED BY ()Ba1telle • Soil Boring (BIO-SB-#) ED
-- Approximate Bio Plot DRA\I\.N BY Bioaugmentation Plot and Boundary OS Pre-Demonstration Soil Boring Locations
CHECKED BY LAUNCH CO MPLEX 34 - CAPE CANAVERAl , FL
SY G48201 O-EPM 1 BIOPLOT02.CDR 12103

32
Figure 4-4. Post-Demonstration Soil Boring Locations (BIO-SB-202, BIO-SB-205 through BIO-SB-207,
BIO-SB-210, and BIO-SB-211) in the Treatment Plot (June 2003)
PA-27
S S S 5 I D
~
~ l) ~
~---------------------- ------------------BEW,~ B10-5B206 @
, , B10-5B207 @@ ~ , ~ @ BIW-1 , B10-5B211 ,
B10-WP201 ,
L,\ , , , , , ,-p ,
r1 @ BEW-2
iBIW-2
B10-5B210 , , B10-5B202 @ BI0-WP202i
@ ,
@ @ ,
BEW-3 ,
F , @ B10-5B205
, ~ , ,
: BIW-3 ~-----------------
, --------------_____ J
Bioaugmentation Plot Inside of PA-28 Engineering Support Building S S S
D I 5
EXl2lanation 0 5 10
• Extraction Well (Recirculation Well) fLPPROXIMATE SCAlE
e Injection Well (Recirculation Well) IN FEET
S Monitoring Well DESIGNED BY CBalfel1e • Soil Boring (810-S8-#) JH
Approximate Bio Plot DRAW\! BY Bioaugmentation Plot and -- OS Post-Demonstration Soil Boring Locations Boundary CHECKED BY LAUNCH COMPLEX 34 CAPE CANAVERfl, FL
SY G48201 O-EPM 1 I BIOESBMAP02.CDR I 12103

33
products were accumulating in the aquifer after treat-ment due to reductive chlorination under anaerobic conditions. After considering the size of the demonstration plot (20 ft × 20 ft) and the restrictions on working inside a building, the test plot was divided into four quadrants with one borehole located in each quadrant. Initially, a systematic unaligned sampling scheme was designed for the plot. However, the size of the plot and building-related obstructions (walls, doorframes, structural pillars, etc.) limited the actual spatial locations that could be sam-pled. Many possible borehole locations were obstructed by the biostimulation and bioaugmentation injection points in the test plot. Also, an attempt was made to locate the boreholes such that the grouted boreholes produced minimal interference with the hydraulic aspects of the injection plans. As a result, sampling points were selected as near to the center of each quadrant as possible, while providing good horizontal coverage of the test plot within the level of resources available. A 2-ft vertical sampling interval from 6 to 26 ft bgs was selected. This vertical distance represents the targeted stratigraphic unit for the biostimulation and bioaugmenta-tion demonstration, which is roughly the vertical distance from the water table to the bottom of the Upper Sand Unit. The 2-ft sampling interval was chosen based on a kriging model that used preliminary information about the test plot, site characterization data, and a desire to remain consistent with the sampling interval used in pre-vious technology demonstrations at Launch Complex 34. The sample size chosen for this demonstration was 40 for both pre- and post-demonstration sampling, for a total of 80 samples in the target unit, which was the high-est number of samples that would be practical to collect for the smaller size of the test plot (20 × 20 ft) and still pro-duce an 80% confidence interval for the kriging analysis. The sample size results from four boreholes (one per quadrant) and ten 2-ft sections sampled from each borehole in the targeted stratigraphic unit between 6 and 26 ft bgs. The kriging model indicated that increasing the number of samples taken per borehole had a minimum impact on the standard error of the TCE concentration. The site characterization data indicated that the TCE concentrations varied considerably with depth, and that a 2-ft sampling interval would be sufficient in adequately capturing the variations (Battelle, 1999b). Note that each soil sample contains groundwater in the pore space. Therefore, the pre- and post-demonstration cores essentially evaluate total TCE removal from the plot. For each soil boring collected during the pre- and post-demonstration, the entire soil column from ground sur-face to the Lower Clay Unit (approximately 45 ft bgs) was sampled and analyzed in 2-ft sections. However,
only the soil samples collected from the Upper Sand Unit were considered in evaluating the treatment technology. The soil samples collected from the Middle Fine-Grained Unit and Lower Sand Unit were used to evaluate any impact the biostimulation and bioaugmentation technol-ogy may have had on the fate and transport of TCE in the lower units of the aquifer, or any impact on the water quality in the lower units of the aquifer. Soil coring, sampling, and extraction methods are described in Appendix A.2 and summarized in this sec-tion. Figure 4-5 shows the indoor rig used for soil coring
Figure 4-5. Indoor Vibra-Push™ Rig (LD Geoprobe®
Series) Used in the Bioaugmentation Plot Inside the Engineering Support Building

34
inside the Engineering Support Building. A direct Vibra-Push™ rig with a 2-inch-diameter, 4-ft-long sample bar-rel was used for coring. As soon as the sample barrel was retrieved, the 2-ft section of core was split vertically and approximately one-quarter of the core (approxi-mately 125 g of wet soil) was deposited into a predeter-mined volume (250 mL) of methanol for extraction in the field. The methanol extract was transferred into 20-mL volatile organic analysis (VOA) vials, which were shipped to a certified off-site laboratory for analysis. The sam-pling and extraction technique used at this site provided better coverage of a heterogeneously distributed con-taminant distribution as compared to the more conven-tional method of collecting and analyzing small soil samples at discrete depths, because the entire vertical depth of the soil column at the coring location could be analyzed. Preliminary site characterization had shown that the vertical variability of the TCE distribution was greater than the horizontal variability, and this sampling and extraction method allowed continuous vertical cover-age of the soil column (GeoSyntec, 2002). The efficiency of TCE recovery by this method (modified U.S. EPA Method 5035; see Appendix A.2) was evaluated through a series of tests conducted for a previous (i.e., EZVI) demonstration (Battelle, 2003b). In these tests, a surro-gate compound (1,1,1-trichloroethane [1,1,1-TCA]) was spiked into soil cores from the Launch Complex 34 aquifer, extracted, and analyzed. Replicate extractions and analysis of the spiked surrogate indicated a CVOC recovery efficiency between 84 and 113% (with an aver-age recovery of 92%), which was considered sufficiently accurate for the EZVI demonstration. Two data evaluation methods were used for estimating the change in TCE-DNAPL mass in the treatment plot: linear interpolation by contouring, and kriging. The spa-tial variability or spread of the TCE distribution in a DNAPL source zone typically is high, because small pockets of residual solvent may be distributed unevenly across the source region. The two methods address this spatial variability in different ways, and therefore the resulting mass removal estimates differ slightly. Because it is impractical to collect a sample from every single point in the biotreatment plot and obtain a true TCE mass estimate for the plot, both methods address the practical difficulty of estimating the TCE concentrations at unsampled points by interpolating (estimating) between sampled points. The objective of both methods is to use the information from a limited sample set to make an inference about the entire population (the entire plot or a stratigraphic unit). 4.1.2 Linear Interpolation by Contouring
Linear interpolation by contouring is the most straight-forward and intuitive method for estimating TCE concen-
tration or mass in the entire plot, based on a limited number of sampled points. TCE concentrations are assumed to be linearly distributed between sampled points. A software program, such as EarthVision™, has an advantage over manual calculations in that it is easier to conduct the linear interpolation in three dimensions. In contouring, the only way to address the spatial variability of the TCE distribution is to collect as large a number of samples as is practical so that good coverage of the plot is obtained; the higher the sampling density, the smaller the distances over which the data need to be interpolated. For linear interpolation by contouring, input parameters must be adjusted to accommodate various references such as geology and sample size. Between 120 and 140 total soil samples were collected from the 7 and 6 coring locations in the plot during pre-demonstration and post-demonstration sampling, respectively, which was the highest number practical within the resources of this project. The number and distribution of these sampling points were determined to obtain good representative coverage of the plot. However, only the soil concentra-tion data generated from the soil borings inside the plot boundaries were used to determine the TCE concentra-tion in soil through linear interpolation by contouring. Data from the soil borings outside the plot boundaries were used to make more accurate contour plots, such as plots in Figure 2-10 and Figure 2-11. Linear interpolation by contouring using EarthVision™ software uses the same methodology that is used for drawing water level contour maps based on water level measurements at discrete locations in a region. The only difference with this software is that the TCE concentra-tions are mapped in three dimensions to generate iso-concentration shells (i.e., volumes of soil that fall within a specified concentration range). The average TCE con-centration of each shell is multiplied by the volume of the shell (as estimated by the volumetric package in the software) and the bulk density of the soil (1.59 g/cm3) to estimate a TCE mass for each shell. The TCE mass in each region of interest (Upper Sand Unit, Middle Fine-Grained Unit, or Lower Sand Unit) is obtained by adding up the portion of the shells contained in that region. The DNAPL mass is obtained by adding up the masses in only those shells that have TCE concentrations above 300 mg/kg. Contouring provides a single mass estimate for the region of interest. 4.1.3 Kriging
Kriging is a geostatistical interpolation method that takes into consideration the spatial correlations among the TCE data in making inferences about the TCE concen-trations at unsampled points. Spatial correlation analysis determines the extent to which TCE concentrations at

35
various points in the plot are similar or different. Gener-ally, the degree to which TCE concentrations are similar or different is a function of distance and direction. Based on these correlations, kriging determines how the TCE concentrations at sampled points can be optimally weighted to infer the TCE concentrations/masses at unsampled points in the plot or the TCE mass in an entire region of interest (entire plot or stratigraphic unit). Kriging accounts for the uncertainty in each point esti-mate by calculating a standard error for the estimate. Therefore a range of TCE mass estimates is obtained instead of a single estimate; this range is defined by an average and a standard error or by a confidence interval. The confidence or level of significance required by the project objectives determines the width of this range. A level of significance of 0.2 (or 80% confidence) was determined to be necessary at the beginning of the dem-onstration (Battelle, 2002a). Only the soil concentration data generated from the soil samples taken from the Upper Sand Unit inside the plot boundaries were used to determine the range of TCE concentrations in soil by the kriging method. 4.1.4 Interpreting the Results of
the Two Mass Removal Estimation Methods
The two data evaluation methods address the spatial variability of the TCE distribution in different ways and, therefore, the resulting mass removal estimates differ slightly between the two methods. In both linear inter-polation and kriging, TCE mass removal is accounted for on an absolute basis; higher mass removal in a few high-TCE concentration portions of the plot can offset low mass removal in other portions of the plot, to esti-mate a high level of mass removal. Kriging most likely provides a more informed estimate of the TCE mass removal than contouring because it takes into account the spatial correlations in the TCE distribution and the uncertainties (error) associated with the estimates. The results in Section 5.1 show that linear interpolation was able to overcome the spatial variability to a considerable extent and provide mass estimates that were generally in agreement with the ranges provided by kriging. 4.2 Evaluating Changes in
Aquifer Quality
A secondary objective of the performance assessment was to evaluate any short-term changes in aquifer qual-ity due to the treatment. Biostimulation and bioaug-mentation affect the contaminant and, to a lesser extent,
the native aquifer characteristics. Pre- and post-demonstration measurements conducted to evaluate the short-term impacts of the technology application on the aquifer included: • CVOC measurements in the groundwater inside the
treatment plot
• Field parameter measurements (pH, DO, ORP, temperature, and conductivity) in the groundwater
• Inorganic measurements (common cations and anions) in the groundwater
• TDS and 5-day BOD
• TOC measurements in the soil
• Hydraulic conductivity of the aquifer.
These measurements were conducted in the monitoring well within the plot and in the extraction wells and perim-eter wells surrounding the plot. 4.3 Evaluating the Fate of the
TCE-DNAPL
Another secondary objective of the performance assess-ment was to evaluate the fate of TCE removed from the plot by the combined biostimulation and bioaugmenta-tion treatment. Possible pathways (or processes) for TCE removal include dehalogenation (destruction of TCE) and migration from the treatment plot (to outside the plot). Dehalogenation was determined by the pres-ence of TCE degradation products, including chloride. The amount of chloride generated during treatment was evaluated by collecting groundwater samples with a Waterloo Profiler® inside the plot (see Figure 4-6), as well as from the performance monitoring wells. These possible pathways for TCE removal were evaluated by the following measurements: • Chloride in groundwater (mineralization of CVOCs
leads to formation of chloride) and other inorganic constituents in groundwater
• Hydraulic gradients (injection of the electron donor creates gradients indicative of groundwater movement)
• Changes in dehalogenated byproducts (cis-1,2-DCE, VC, and ethenes)
• Impact on natural attenuation products (ferrous iron, methane) via the anaerobic process.

36
Figure 4-6. Collecting and Processing Groundwater Samples Using the Waterloo Profiler® 4.4 Verifying Operating Requirements
and Costs
The final secondary objective of the performance assess-ment was to verify the vendor’s operating requirements and cost for the technology application. The costs were evaluated, reported, and presented using the methodol-ogy outlined in the Federal Remediation Technologies
Roundtable report (FRTR, 1998). The vendor prepared a detailed report describing the operating requirements and costs of the biostimulation and bioaugmentation application (GeoSyntec, 2003). An operating summary based on this report is provided in Section 3. Site char-acterization costs were estimated by Battelle.

37
5. Performance Assessment Results and Conclusions
The results of the performance assessment are described in this section. 5.1 Changes in TCE-DNAPL Mass
in the Plot
Continuous soil sampling was the primary tool for esti-mating total TCE and DNAPL mass removal. Total TCE refers to both dissolved-phase and DNAPL TCE. DNAPL refers to that portion of total TCE in a soil sample that exceeds the threshold concentration of 300 mg/kg (see Section 2.3). TCE concentrations for pre-demonstration characterization from four soil cores (approximately 40 soil samples), and post-demonstration characterization from six soil cores (approximately 60 soil samples) of the Upper Sand Unit in the treatment plot were tabulated and graphed to qualitatively identify changes in the TCE-DNAPL mass distribution and the efficiency of the treatment in different parts of the plot (Section 5.1.1). In addition, TCE-DNAPL mass removal was quantified by two methods:
• Linear interpolation (Section 5.1.2) • Kriging (Section 5.1.3).
The quantitative techniques for estimating TCE-DNAPL mass removal due to the biostimulation and bioaugmen-tation treatment are described in Section 4.1; the results are described in Sections 5.1.2 through 5.1.5. 5.1.1 Qualitative Evaluation of Changes
in TCE-DNAPL Distribution
Figure 5-1(a) charts the pre-demonstration and post-demonstration TCE concentrations at four paired soil boring locations (SB-2, SB-5, SB-6, and SB-7) in the treatment plot (see Figures 4-3 and 4-4); detailed TCE results in soil samples are tabulated in Appendix C. The dashed horizontal lines in the chart indicate the depth at which the Middle Fine-Grained Unit was encoun-tered. Soil samples were collected from the groundwater table (approximately 6 ft bgs) down to the Lower Sand
Unit; however, this discussion of sampling performance assessment focuses primarily on concentrations in the Upper Sand Unit because the biostimulation and bioaug-mentation treatment focused on that specific geograph-ical stratigraphic unit. Figure 5-1(b) includes data from soil borings BIO-SB-1, BIO-SB-3, and BIO-SB-4, which were outside the plot boundaries but useful in creating more accurate contour plots, such as those seen in Fig-ure 5-2(a). The data from these three pre-demonstration cores were not used to calculate changes in TCE-DNAPL mass as a result of treatment. Figure 5-1(c) contains data from two additional post-demonstration soil borings (BIO-SB-210 and BIO-SB-211) where soil samples were collected at every 1-foot interval (where possible) in the treatment zone. These two post-demonstration borings were collected next to pre-demonstration soil borings BIO-SB-5 and BIO-SB-6 in order to supplement the data for post-demonstration calculations of changes in TCE-DNAPL mass. Because these soil borings were within the plot boundaries and corresponded to a pre-demonstration soil boring, the soil samples collected from BIO-SB-210 and BIO-SB-211 were used to calculate changes in TCE-DNAPL mass as a result of treatment. Figures 5-1(d) and 5-1(e) are graphical representations of the data contained in Figure 5-1(a) and 5-1(c). They represent the TCE soil concentrations in mg/kg at depths within the treatment plot for the pre- and post-demonstration characterization events. In the targeted Upper Sand Unit, the highest pre-demonstration TCE concentrations in soil were detected in the eastern half of the plot in soil borings BIO-SB-7 (8,327 mg/kg) and BIO-SB-5 (961 mg/kg). Following the demonstration, TCE concentrations in soil across the entire plot were markedly lower, and were often not detected or had values less than 1 mg/kg. Figures 5-2 and 5-3 show representative pre-demonstration and post-demonstration distributions of TCE in soil at two selected depths (20 and 24 ft bgs) in
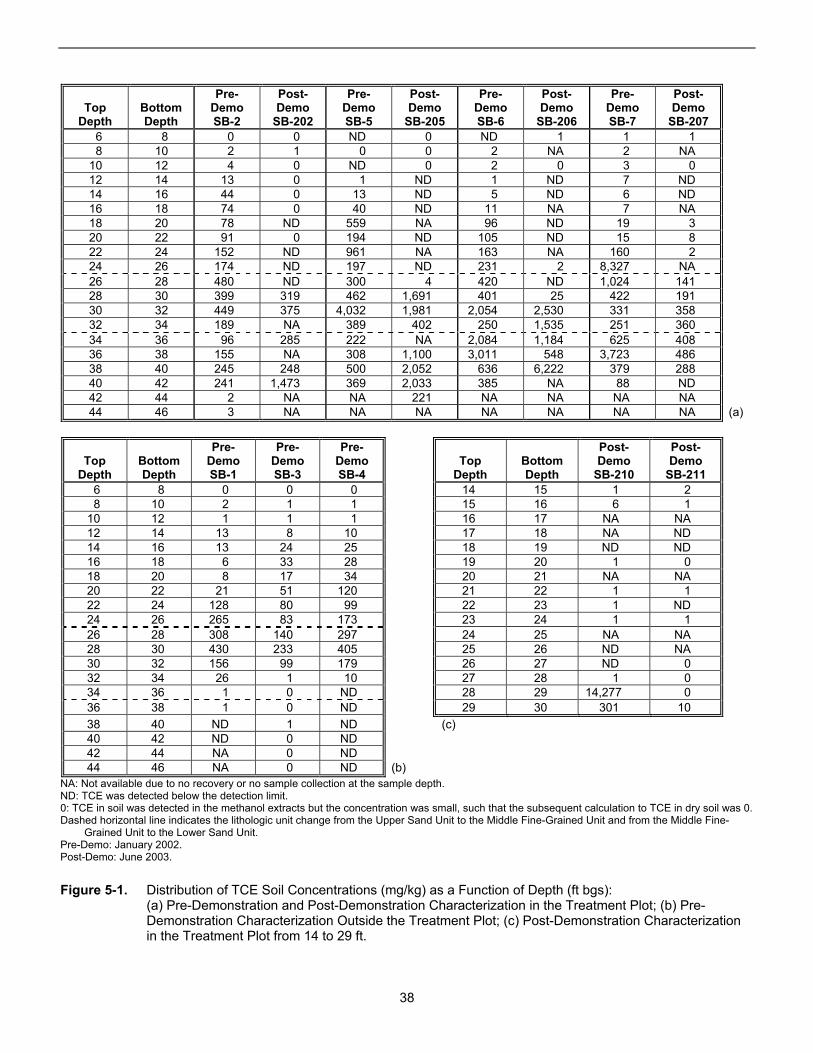
38
Top Depth
Bottom Depth
Pre-Demo SB-2
Post-Demo
SB-202
Pre-Demo SB-5
Post-Demo
SB-205
Pre-Demo SB-6
Post-Demo
SB-206
Pre-Demo SB-7
Post-Demo
SB-207
6 8 0 0 ND 0 ND 1 1 1 8 10 2 1 0 0 2 NA 2 NA
10 12 4 0 ND 0 2 0 3 0 12 14 13 0 1 ND 1 ND 7 ND 14 16 44 0 13 ND 5 ND 6 ND 16 18 74 0 40 ND 11 NA 7 NA 18 20 78 ND 559 NA 96 ND 19 3 20 22 91 0 194 ND 105 ND 15 8 22 24 152 ND 961 NA 163 NA 160 2 24 26 174 ND 197 ND 231 2 8,327 NA 26 28 480 ND 300 4 420 ND 1,024 141 28 30 399 319 462 1,691 401 25 422 191 30 32 449 375 4,032 1,981 2,054 2,530 331 358 32 34 189 NA 389 402 250 1,535 251 360 34 36 96 285 222 NA 2,084 1,184 625 408 36 38 155 NA 308 1,100 3,011 548 3,723 486 38 40 245 248 500 2,052 636 6,222 379 288 40 42 241 1,473 369 2,033 385 NA 88 ND 42 44 2 NA NA 221 NA NA NA NA 44 46 3 NA NA NA NA NA NA NA (a)
Top Depth
Bottom Depth
Pre-Demo SB-1
Pre-Demo SB-3
Pre-Demo SB-4
Top Depth
Bottom Depth
Post-Demo
SB-210
Post-Demo
SB-211 6 8 0 0 0 14 15 1 2 8 10 2 1 1 15 16 6 1
10 12 1 1 1 16 17 NA NA 12 14 13 8 10 17 18 NA ND 14 16 13 24 25 18 19 ND ND 16 18 6 33 28 19 20 1 0 18 20 8 17 34 20 21 NA NA 20 22 21 51 120 21 22 1 1 22 24 128 80 99 22 23 1 ND 24 26 265 83 173 23 24 1 1 26 28 308 140 297 24 25 NA NA 28 30 430 233 405 25 26 ND NA 30 32 156 99 179 26 27 ND 0 32 34 26 1 10 27 28 1 0 34 36 1 0 ND 28 29 14,277 0 36 38 1 0 ND 29 30 301 10 38 40 ND 1 ND (c) 40 42 ND 0 ND 42 44 NA 0 ND 44 46 NA 0 ND (b)
NA: Not available due to no recovery or no sample collection at the sample depth. ND: TCE was detected below the detection limit. 0: TCE in soil was detected in the methanol extracts but the concentration was small, such that the subsequent calculation to TCE in dry soil was 0. Dashed horizontal line indicates the lithologic unit change from the Upper Sand Unit to the Middle Fine-Grained Unit and from the Middle Fine-
Grained Unit to the Lower Sand Unit. Pre-Demo: January 2002. Post-Demo: June 2003. Figure 5-1. Distribution of TCE Soil Concentrations (mg/kg) as a Function of Depth (ft bgs):
(a) Pre-Demonstration and Post-Demonstration Characterization in the Treatment Plot; (b) Pre-Demonstration Characterization Outside the Treatment Plot; (c) Post-Demonstration Characterization in the Treatment Plot from 14 to 29 ft.

39
0
10
20
30
40
50
0.0001 0.001 0.01 0.1 1 10 100 1000 10000 100000
Pre-DemonstrationTCE Concentration (mg/kg)
Dept
h (ft
bgs
)
Upper Sand Unit
Middle Fine-grained Unit
Lower Sand Unit
(d)
0
10
20
30
40
50
0.0001 0.001 0.01 0.1 1 10 100 1000 10000 100000
Post-DemonstrationTCE Concentration (mg/kg)
Dept
h (ft
bgs
)
Upper Sand Unit
Middle Fine-grained Unit
Lower Sand Unit
(e)
Figure 5-1. (Continued) Distribution of TCE Soil Concentrations (mg/kg) as a Function of Depth (ft bgs): (d) Pre-Demonstration Characterization in the Treatment Plot; (e) Post-Demonstration Characterization in the Treatment Plot.

40
(a)
(b) Figure 5-2. Representative (a) Pre-Demonstration (January 2002) and (b) Post-Demonstration (June
2003) Horizontal Cross Sections of TCE (mg/kg) at 20 ft bgs in the Upper Sand Unit

41
(a)
(b) Figure 5-3. Representative (a) Pre-Demonstration (January 2002) and (b) Post-Demonstration (June
2003) Horizontal Cross Sections of TCE (mg/kg) in soil at 24 ft bgs in the Upper Sand Unit

42
the Upper Sand Unit of the treatment plot and surrounding aquifer. These figures illustrate the horizontal and verti-cal extent of the initial contaminant distribution, and the subsequent changes in TCE concentrations after treat-ment. The orange to red colors indicate the presence of free-phase TCE-DNAPL (based on the TCE-DNAPL threshold of 300 mg/kg, see Section 2.3). In general, the eastern portion of the plot (BIO-SB-5 and BIO-SB-6) had the highest pre-demonstration TCE concentrations based on soil samples, and the TCE concentrations in soil were higher at 24 ft bgs (Figures 5-2[a] and 5-3[a]). Post-demonstration coring indicated that the biostimulation and bioaugmentation treatment substantially reduced the concentrations of TCE in the plot at both 20 ft and 24 ft bgs (see Figures 5-2[b] and 5-3[b]). Figure 5-4 depicts 3-D distributions of TCE-DNAPL greater than 300 mg/kg as identified from the pre- and post-demonstration characterization in the treatment plot. As shown in Figure 5-4(a), TCE was present throughout the treatment plot as DNAPL. After the bio-stimulation and bioaugmentation treatment, the relatively well-distributed mass of TCE-DNAPL appeared to have declined to below the 300 mg/kg threshold in the Upper Sand Unit (see Figure 5-4[b]). This suggests that the bio-stimulation and bioaugmentation treatment was effective throughout the targeted portion of the Upper Sand Unit. In summary, a qualitative evaluation of the TCE-DNAPL changes indicates that the biostimulation and bioaug-mentation treatment significantly reduced the TCE-DNAPL mass throughout the targeted Upper Sand Unit. 5.1.2 TCE-DNAPL Mass Estimation
by Linear Interpolation
Section 4.1.2 describes the use of linear interpolation or contouring to estimate pre- and post-demonstration TCE-DNAPL masses and calculate TCE-DNAPL mass changes within the plot. In this method, EarthVision™, a 3D contouring software, is used to group the TCE con-centration distribution in the treatment plot into 3D shells (or bands) of equal concentration. The concentration in each shell is multiplied by the volume of the shell and the bulk density of the soil to arrive at the TCE mass in that shell. The masses in the individual shells are summed to arrive at a total TCE mass for the entire plot. This process is conducted separately for the pre- and post-demonstration TCE distributions in the test plot. The pre-demonstration TCE-DNAPL mass in the entire plot then can be compared with the post-demonstration mass in the entire plot to estimate the change in TCE-DNAPL mass in the plot due to the treatment. Table 5-1 presents the estimated masses of total TCE and TCE-DNAPL in the treatment plot and the three
individual stratigraphic units based on the linear interpo-lation method. Although the target depth for the bio-stimulation and bioaugmentation treatment was the Upper Sand Unit, the evaluation was performed in the entire surficial aquifer in order to examine any potential impact of vertical migration from the treatment. Under pre-demonstration conditions, soil sampling indicated the presence of 25.5 kg of total TCE (dissolved and free phase) in the Upper Sand Unit. Approximately 2.6 kg of the total TCE was estimated to be DNAPL. Following the demonstration, soil sampling indicated that 0.4 kg of total TCE remained in the Upper Sand Unit; the post-demonstration mass of TCE-DNAPL was estimated as 0.0 kg because there were no post-demonstration TCE concentrations above the threshold of 300 mg/kg. There-fore, the overall mass decrease by contouring was 98.5% of total TCE and >99% of DNAPL in the Upper Sand Unit. The biostimulation and bioaugmentation treatment is esti-mated to have removed 98.5% of total TCE and >99% of TCE-DNAPL in the target treatment zone (i.e., the Upper Sand Unit). The mass reduction percentage was not estimated in the other two stratigraphic units because biostimulation and bioaugmentation were not applied in those lower stratigraphic units. The estimated post-demonstration TCE mass in the Lower Sand Unit was higher than the pre-demonstration mass. However, because the TCE mass in the Middle Fine-Grained Unit has declined, it is unlikely that the higher post-demonstration mass in the Lower Sand Unit is attribut-able to the treatment above. 5.1.3 TCE Mass Estimation
by Kriging
Section 4.1.3 describes the use of kriging to estimate the pre- and post-demonstration TCE masses in the aquifer. Although linear interpolation estimates TCE concentra-tions of unsampled points based on the TCE measure-ments of discrete sampling point, kriging takes into account the spatial variability and uncertainty of the TCE distribution when estimating TCE concentrations (or masses) at unsampled points. As a result, kriging analy-sis results provide a range of probable values. Thus, kriging is a good method of obtaining a global estimate for the parameters of interest (such as pre- and post-demonstration TCE masses), when the parameter is heterogeneously distributed. Appendix A contains a description of the kriging model and results for the TCE distribution in the treatment plot as well as the statistics summary of the data distribution. Mass estimation by kriging was conducted to evaluate
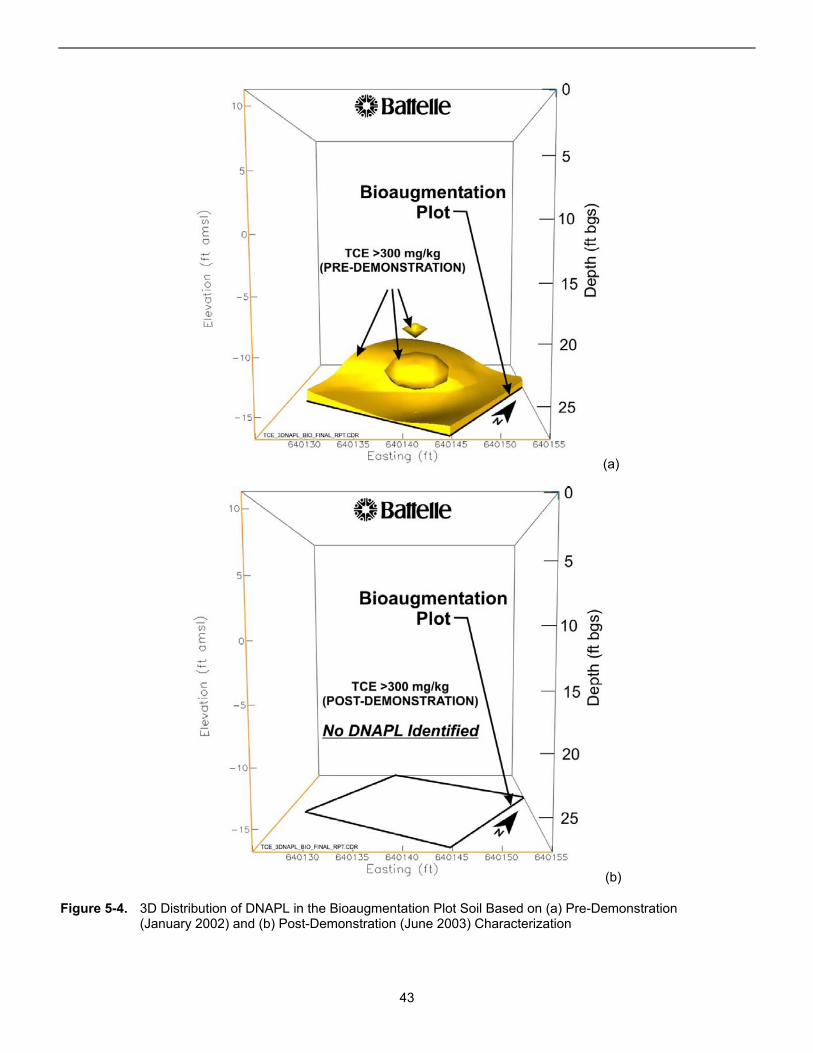
43
(a)
(b)
Figure 5-4. 3D Distribution of DNAPL in the Bioaugmentation Plot Soil Based on (a) Pre-Demonstration (January 2002) and (b) Post-Demonstration (June 2003) Characterization

44
Table 5-1. Estimated Total TCE and TCE-DNAPL Mass Reduction by Linear Interpolation
Pre-Demonstration Post-Demonstration Change in Mass (%)
Stratigraphic Unit Total TCE Mass
(kg) TCE-DNAPL Mass
(kg) Total TCE Mass
(kg) TCE-DNAPL Mass
(kg) Total TCE
TCE-DNAPL
Upper Sand Unit 25.5 2.6 0.4 0.0 98.5 >99
Middle Fine-Grained Unit 127.5 76.0 77.2 47.9 N/A N/A
Lower Sand Unit 88.6 54.7 273.5 218.8 N/A N/A N/A = not applicable. Change in mass was calculated for the targeted treatment zone only. Table 5-2. Estimated Total TCE Mass Reduction by Kriging
Pre-Demonstration
Total TCE Mass Post-Demonstration
Total TCE Mass Change in Mass
Stratigraphic Unit Average
(kg)
Lower Bound
(kg)
Upper Bound
(kg) Average
(kg)
Lower Bound
(kg)
Upper Bound
(kg) Average
(%)
Lower Bound
(%)
Upper Bound
(%)
Upper Sand Unit 32.1 17.6 46.6 0.2 0.1 0.3 98.99 98.55 99.66
the biostimulation and bioaugmentation technology per-formance in the heterogeneously distributed TCE con-tamination source in the Upper Sand Unit. Table 5-2 summarizes the total TCE mass estimates in the Upper Sand Unit calculated from kriging. The table summarizes an average and range (lower bound and maximum bound) for total TCE only. Evaluating the change in TCE-DNAPL using the kriging method was difficult due to the limited number of usable data points with TCE concentrations greater than 300 mg/kg. Thus, kriging was conducted on total TCE values only to avoid using too few data points for the mass estimates of TCE-DNAPL. In general, the pre- and post-demonstration total TCE mass ranges estimated from kriging match the total TCE mass estimate from linear interpolation. This suggests that linear interpolation was able to capture much of the variability of the TCE distribution in the plot despite the relatively small sample size. Kriging results show that the estimated decrease in TCE mass in the plot after the biostimulation and bioaugmentation treatment is between 98.6 and 99.7% (99.0% on average) for the entire data-set from the Upper Sand Unit. In this demonstration of in situ dehalogenation of TCE-DNAPL by biostimulation and bioaugmentation, the range of TCE mass estimation by kriging after the treat-ment does not overlap the TCE mass range before the treatment. This indicates that there was a significant, measurable change in TCE-DNAPL mass due to the bio-stimulation and bioaugmentation treatment.
5.1.4 Summary of Changes in the TCE-DNAPL Mass
In summary, the evaluation of TCE concentrations in soil indicates the following: • In the horizontal plane, the highest pre-
demonstration TCE contamination was in the eastern half of the treatment plot.
• In the vertical plane, the highest pre-demonstration TCE-DNAPL contamination in the Upper Sand Unit was between 24 to 26 ft bgs.
• A statistical evaluation for mass estimation by linear interpolation based on TCE in soil shows that the biostimulation and bioaugmentation treatment reduced the total TCE mass in the test plot by approximately 98.5%.
• A statistical evaluation for mass estimation by kriging of TCE concentrations in soil from pre- and post-demonstration characterization shows that the biostimulation and bioaugmentation treatment removed between 98.6 and 99.7% with the average reduction of 99.0%. This range was based on a confidence level of 80%.
5.2 Evaluating Changes in Aquifer Quality
This section describes the changes in aquifer character-istics created by the application of biostimulation and bio-augmentation at Launch Complex 34. Aquifer parameters

45
were measured by monitoring conducted before, twice during, and after the demonstration. The groundwater sampling events during the demonstration were con-ducted in December 2002, approximately one month after the electron donor was injected to begin biostimula-tion, and again in March 2003, approximately one month after the KB-1™ culture was injected to begin bioaug-mentation. Changes in aquifer characteristics were determined by comparing the differences between the pre-demonstration and post-demonstration sampling events. The affected aquifer characteristics are grouped into four subsections in this report: • Changes in CVOC levels (see Appendix C for
detailed results)
• Changes in aquifer geochemistry (see Appendix D for detailed results)
• Changes in the hydraulic properties of the aquifer (see Appendix B for detailed results)
• Changes in the aquifer biology.
Tables 5-3 and 5-4 list the concentrations of selected CVOCs and degradation byproducts in groundwater at the treatment plot, and Table 5-5 lists concentrations of various groundwater parameters that indicate aquifer quality and the impact of the biostimulation and bioaug-mentation treatment. The tables summarize the levels from pre-demonstration and post-demonstration sam-pling events. Other important organic and inorganic aqui-fer parameters are discussed in this subsection. 5.2.1 Changes in CVOC Levels
in Groundwater
CVOC levels in groundwater were monitored from wells screened in the Upper Sand Unit, Middle Fine-Grained Unit, and the Lower Sand Unit. A greater number of monitoring wells (i.e., performance assessment and multilevel wells) were screened in the Upper Sand Unit because the biostimulation and bioaugmentation treat-ment was targeted to that zone. General observations about CVOC concentrations in groundwater sampled
Table 5-3. TCE Degradation Byproducts in the Treatment Plot Before, During, and After the Demonstration
Well ID Pre-Demo During
Biostimulation During
Bioaugmentation Post-Demo Pre-DemoDuring
Biostimulation During
BioaugmentationPost-Demo
TCE (µg/L) cis-1,2-DCE (µg/L) Treatment Plot Well PA-26 1,220,000 7,460 13,800 239 31,600 94,700 19,400 780Perimeter Wells PA-27S 659,000 347,000 379,000 168,000 67,300 16,900 186,000 219,000PA-27I 565,000 690,000 906,000 1,110,000 41,300 7,030 5,430 7,820PA-27D 394,000 665,000 1,020,000 919,000 64,100 8,080 6,180 8,030PA-28S 801,000 69,200 68,200 67,500 28,100 95,100 162,000 136,000PA-28I 620,000 512,000 838,000 912,000 87,600 88,200 100,000 225,000PA-28D 79,600 89,200 46,700 4,730 169,000 178,000 98,200 179,000Injection and Extraction Wells BIW-2 105,000 117,000 93,000 <20 45,700 30,000 54,300 11,800BEW-2 111,000 5,750 79,600 227 55,600 3,360 65,400 19,800
trans-1,2-DCE (µg/L) Vinyl Chloride (µg/L) Treatment Plot Well PA-26 <1,000 350 419 436 <1,000 3,430 103,000 8,040Perimeter Wells PA-27S 300 J 320 J 420 J 822 520 100 J 28,700 52,800PA-27I 340 J 50 J <1,000 <1,000 <500 200 J 230 J <1,000PA-27D 240 J <500 <1,000 <1,000 <500 <500 <1,000 <1,000PA-28S 170 J 321 480 360 J <1,000 7,420 55,800 37,200PA-28I 280 J 270 J 290 J 820 J <500 140 J 160 J 880 JPA-28D 410 813 362 764 34 J 134 1,510 8,550Injection and Extraction Wells BIW-2 370 139 307 428 161 179 16,400 30,900BEW-2 206 24.4 409 464 325 69 17,600 44,900Well IDs: S = shallow well (Upper Sand Unit); I = intermediate well (Middle Fine-Grained Unit); D = deep well (Lower Sand Unit). BIW-2 = injection well; BEW-2 = extraction well. Pre-demonstration = March 2002; During Biostimulation = December 2002; During Bioaugmentation = March 2003; post-demonstration =
June 2003. J: Estimated value, below reporting limit.

46
Table 5-4. Ethene Levels in Groundwater (µg/L)
Pre-
Demonstration(a) During
Biostimulation(b) During
Bioaugmentation(c) Post-
Demonstration(d)
PA-26 573 30 2,310 22,900 BIW-2 7 8 368 14,000 BEW-2 29 <3 1,140 16,200 PA-27S 235 9 852 2,790 PA-28S 235 123 1,780 16,300 B-ML1 NA 430 2,600 NA B-ML2 NA <1,000 4,200 NA B-ML3 NA <1,000 5,200 NA B-ML4 NA 320 2,800 NA B-ML5 NA 650 3,000 NA MW-6 NA <200 2,800 NA ML-3 NA <200 4,800 NA FL-2 NA <200 3,100 NA
(a) March 2002; (b) March 2003; (c) December 2002; (d) June 2003. NA: Not sampled during this event. Table 5-5. Groundwater Parameters in the Treatment Plot Before and After the Demonstration
Groundwater Parameter (mg/L)
Applicable Groundwater Standard(a)
(mg/L) Aquifer Depth(b) Pre-Demonstration
(mg/L)(c) Post-Demonstration
(mg/L)(c) pH Not applicable Shallow
Intermediate Deep
6.5 to 6.7 6.8 to 6.9 6.7 to 7.0
6.4 to 6.7 7.3
7.4 to 8.1
ORP (mV)
Not applicable Shallow Intermediate
Deep
+76 to +171 +105 to +142
+54 to +89
-301 to -191 -218 to -173 -321 to -231
DO Not applicable Shallow Intermediate
Deep
0.7 to 1.0 0.8 to 1.0 0.7 to 1.0
0.2 to 0.7 0.4 to 0.7
0.7
Conductivity (mS/cm) Not applicable Shallow Intermediate
Deep
0.15 to 0.21 0.19 to 0.23 0.22 to 0.32
0.20 to 0.28 0.13 to 0.17 0.22 to 0.27
Calcium Not applicable Shallow Intermediate
Deep
109 to 140 53 to 140 59 to 168
50 to 538 44 to 74 70 to 71
Magnesium Not applicable Shallow Intermediate
Deep
10 to 18 30 to 82 29 to 73
33 to 49 63 to 105 56 to 73
Alkalinity as CaCO3 Not applicable Shallow Intermediate
Deep
390 to 463 344 to 441 261 to 262
469 to 847 375 to 396 303 to 320
Chloride 250 Shallow Intermediate
Deep
125 to 246 194 to 367 305 to 852
278 to 344 142 to 268 393 to 551
Manganese 0.05 Shallow Intermediate
Deep
0.074 to 0.213 0.091 to 0.406 0.075 to 0.088
0.195 to 1.31 0.029 to 0.198 0.034 to 0.09
Dissolved Iron 0.3 Shallow Intermediate
Deep
7.5 to 31 3.1 to 3.2 2.7 to 4.0
0.4 to 17 0.5 to 1.2
<0.1 to 1.0
Dissolved Silica Not applicable Shallow Intermediate
Deep
14.1 to 28.3 29.2 to 56.6 41.6 to 47.9
24.8 to 36.1 66.6 to 68.0 43.4 to 50.6

47
Table 5-5. Groundwater Parameters in the Treatment Plot Before and After the Demonstration (Continued)
Groundwater Parameter (mg/L)
Applicable Groundwater Standard(a)
(mg/L) Aquifer Depth(b) Pre-Demonstration
(mg/L)(c) Post-Demonstration
(mg/L)(c) TDS 500 Shallow
Intermediate Deep
898 to 1,220 1,100 to 1,120 1,350 to 1,630
1,320 to 3,060 869 to 1,000
1,200 to 1,350
BOD Not applicable Shallow Intermediate
Deep
<12.0 6.0 to 10.0 <6.0 to 7.0
38.0 to 104 8.0 to 10.0
19.0 to 41.0
TOC Not applicable Shallow Intermediate
Deep
31 to 235 65 to 180 54 to 58
140 to 1,050 8 to 10
15 to 37
Potassium Not applicable Shallow Intermediate
Deep
146 to 279 21 to 106 19 to 52
51 to 69 22 to 39 31 to 32
Sodium 160 Shallow Intermediate
Deep
32 to 58 97 to 218
180 to 362
69 to 80 52 to 256
270 to 378
Phosphate Not applicable Shallow Intermediate
Deep
<3.0 <3.0 <3.0
<0.5 to 1.2 <0.5 <0.5
Bromide Not applicable Shallow Intermediate
Deep
<2.0 <2.0
<2.0 to 25.3
<1.0 to 5.7 <1.0
<1.0 to 4.5
Total Nitrate/Nitrite as N 10 Shallow Intermediate
Deep
NA NA NA
<0.5 to 1.6 <0.5
<0.5 to 1.8
Sulfate 250 Shallow Intermediate
Deep
100 to 172 107 to 292 73.0 to 385
1.2J to <3.0 92.2 to 101 11.0 to 110
(a) State of Florida drinking water standards for inorganic contaminants (sodium, total nitrate/nitrite) and secondary drinking water standards (iron, manganese, chloride, sulfate, pH, TDS, total nitrate/nitrite)
(b) Shallow well screens are located in the Upper Sand Unit; intermediate well screens are located in the Middle Fine-Grained Unit; and deep well screens are located in the Lower Sand Unit.
(c) All reported quantities are in mg/L, except for pH, which is in log units, ORP, which is in mV, and conductivity in mS/cm. NA = Not analyzed. Bold face denotes that the level exceeds applicable groundwater standards (either Maximum contaminant level [MCL’s] or Florida cleanup standards for groundwater). from the intermediate and deep wells are made in this section of the report, but trends are hard to identify with the limited dataset available. CVOC levels in groundwater were measured in several shallow wells screened in the Upper Sand Unit, including the performance assessment wells inside the plot (PA-26) and around the perimeter of the plot (PA-27 and PA-28), in the multilevel wells along the plot edges (BML-1 through BML-4), and in extraction well BEW-2. Table 5-3 shows the changes in TCE, DCE, and VC concentra-tions in the monitoring wells screened in the Upper Sand Unit. Figures 5-5 to 5-8 show dissolved TCE, cis-1,2-DCE, VC, and ethene concentrations in the shallow wells, respectively, in the treatment plot and perimeter. Table C-1 of Appendix C tabulates the levels of TCE, cis-1,2-DCE, VC, and ethene in the groundwater in all of the
monitoring wells for the biostimulation and bioaugmenta-tion demonstration. Table C-5 of Appendix C also sum-marizes the levels of TCE, cis-1,2-DCE, VC, ethene, and chloride in the groundwater in units of mmol/L to evalu-ate a stoichiometric balance to complete dechlorination of TCE for PA-26 in the center of the treatment plot. Before the demonstration, concentrations of TCE were at or close to the solubility of TCE (1,100,000 µg/L) in the performance assessment well PA-26 in the center of the plot (Figure 5-5a). High concentrations of TCE also were detected around the perimeter of the plot in moni-toring wells PA-27S and PA-28S. Approximately one month after the electron donor was added to the plot (i.e., biostimulation), groundwater sam-pling was conducted in December 2002. The results are

48
(a) (b)
(c) (d) Figure 5-5. Dissolved TCE Concentrations (µg/L) during (a) Pre-Demonstration Sampling (March 2002),
(b) During Biostimulation (December 2002), (c) During Bioaugmentation (March 2003), and (d) Post-Demonstration (June 2003) Sampling of Shallow Wells

49
(a) (b)
(c) (d) Figure 5-6. Dissolved cis-1,2-DCE Concentrations (µg/L) during (a) Pre-Demonstration Sampling (March
2002), (b) During Biostimulation (December 2002), (c) During Bioaugmentation (March 2003), and (d) Post-Demonstration (June 2003) Sampling of Shallow Wells

50
(a) (b)
(c) (d) Figure 5-7. Dissolved Vinyl Chloride Concentrations (µg/L) during (a) Pre-Demonstration Sampling (March
2002), (b) During Biostimulation (December 2002), (c) During Bioaugmentation (March 2003), and (d) Post-Demonstration (June 2003) Sampling of Shallow Wells

51
(a) (b)
(c) (d) Figure 5-8. Dissolved Ethene Concentrations (µg/L) during (a) Pre-Demonstration Sampling (March 2002),
(b) During Biostimulation (December 2002), (c) During Bioaugmentation (March 2003), and (d) Post-Demonstration (June 2003) Sampling of Shallow Wells

52
shown in Figure 5-5(b). TCE concentrations decreased sharply throughout the plot, particularly in the center well PA-26, where concentrations decreased from a pre-demonstration level of 1,220,000 µg/L to 7,460 µg/L in December 2002. TCE concentrations also decreased in monitoring wells around the perimeter of the plot in PA-27S and PA-28S, suggesting that the microbial popu-lations were impacted by the electron donor on a scale larger than the demonstration plot. Approximately one month after the KB-1™ culture was injected into the plot (i.e., bioaugmentation), groundwater sampling was con-ducted in March 2003. The results, shown in Figure 5-5(c), indicate that TCE concentrations continued to decline over time, despite fluctuations in levels. Post-demonstration groundwater sampling conducted in June 2003 showed that a much lower level of TCE remained in groundwater sampled from within the plot. The ground-water results are in line with the TCE mass removal esti-mates generated from post-demonstration soil sampling (see Section 5.1). Table 5-3 and Figure 5-6 show the concentrations of cis-1,2-DCE over the course of the demonstration in moni-toring wells screened in the Upper Sand Unit. The concentrations of cis-1,2-DCE increased nearly 200% during the biostimulation phase from 31,600 µg/L to 94,700 µg/L in PA-26, indicating that the TCE degraded to cis-1,2-DCE (Figure 5-6b). The results of the second sampling event in March 2003 indicated that the pre-viously formed cis-1,2-DCE began to degrade during the bioaugmentation phase, from 94,700 µg/L to 19,400 µg/L in the center well PA-26 (Figure 5-6c). Post-demonstration sampling results show a continued decrease in cis-1,2-DCE to below pre-demonstration concentrations (Figure 5-6d). Table 5-3 and Figure 5-7 contain the results of vinyl chloride concentrations in groundwater in the Upper Sand Unit over the course of the demonstration. Con-centrations of vinyl chloride in the plot were less than 1,000 µg/L (Figure 5-7a) prior to the demonstration. Dur-ing the biostimulation phase, vinyl chloride concentra-tions increased from less than 1,000 µg/L to 3,430 µg/L in PA-26 (Figure 5-7b). The increase in vinyl chloride suggested that the TCE and cis-1,2-DCE were degrad-ing. After the KB-1™ injection, vinyl chloride concen-trations increased, from 3,430 µg/L to 103,000 µg/L in PA-26 (Figure 5-7c). Vinyl chloride concentrations also increased throughout the plot and beyond the plot boundaries in PA-27S and PA-28S (Figure 5-7c). Post-demonstration sampling suggested that vinyl chlo-ride itself was beginning to be removed from ground-water. Concentrations of vinyl chloride decreased from 103,000 µg/L in March 2003 to 8,040 µg/L during the post-demonstration sampling event in June 2003 (Fig-ure 5-7d). The groundwater standard for VC is 1 µg/L,
and was exceeded in the majority of the wells both before and after the demonstration. The increase and subsequent decrease in vinyl chloride concentrations suggest that the biostimulation and bioaugmentation treatment improved the degradation rate of TCE and cis-1,2-DCE. Ethene concentrations in groundwater also were mea-sured during the demonstration (Table 5-4 and Table D-5 in Appendix D). Increases in ethene concentrations in groundwater would be a line of evidence that complete dehalogenation was occurring, from TCE through cis-1,2-DCE and vinyl chloride to ethene. Figure 5-8 con-tains the contour plots of ethene for the four groundwater sampling events. Pre-demonstration ethene concentra-tions were measurable, which suggested that some his-toric natural attenuation of TCE occurred (Figure 5-8a). Concentrations of ethene in PA-26 decreased slightly after biostimulation (Figure 5-8b), and then increased significantly following the KB-1™ injection, from 30 µg/L to 2,310 µg/L (Figure 5-8c). Concentrations of ethene rose from a pre-demonstration level of 573 µg/L in performance monitoring well PA-26 to 22,900 µg/L during post-demonstration monitoring (Figure 5-8d). Ethene concentrations also increased in monitoring wells PA-27S, PA-28S, BIW-2, and BEW-2 located outside the plot boundaries (Figure 5-8d). The increase in ethene concentrations, coupled with the decrease in TCE concentration and the increase and subsequent decrease in cis-1,2-DCE and vinyl chloride concentrations, suggest that both the rate and extent of complete reductive dehalogenation were enhanced as a result of biostimulation and bioaugmentation. CVOC concentrations in groundwater sampled at inter-mediate depths in the Middle Fine-Grained Unit and greater depths in the Lower Sand Unit varied in the perimeter wells (i.e., wells PA-27I/D, PA-28I/D) during post-demonstration characterization (see Table C-1a in Appendix C). In well PA-27I, TCE concentrations increased from 565,000 µg/L to 1,110,000 µg/L, whereas cis-1,2-DCE concentrations in the same well decreased from 41,300 µg/L to 7,820 µg/L after the demonstration. Vinyl chloride concentrations did not display a clear trend, and ethene concentrations in PA-27I remained relatively constant throughout the demonstration. In the Lower Sand Unit, TCE concentrations in well PA-27D increased from 394,000 µg/L to 1,020,000 µg/L before decreasing to 919,000 µg/L during post-demonstration sampling. cis-1,2-DCE levels decreased from 64,100 µg/L to 8,030 µg/L after the demonstration, and vinyl chloride results showed concentrations less than 1 mg/L, sug-gesting that the treatment did not impact a reductive dechlorination in the Middle Fine-Grained Unit and the Lower Sand Unit. Ethene concentrations in PA-27D

53
decreased from 370 µg/L to 70 µg/L after the demonstra-tion. Outside the southern edge of the plot in well PA-28, TCE concentrations increased from 620,000 µg/L to 912,000 µg/L at intermediate depths (i.e., well PA-28I), and cis-1,2-DCE concentrations also increased from 87,600 µg/L to 225,000 µg/L. At deep depths, TCE concentrations decreased from 79,600 µg/L in well PA-28D to 4,730 µg/L after the demonstration, and cis-1,2-DCE levels decreased slightly from 169,000 µg/L to 98,200 µg/L in March 2003 before rising again to an approximate pre-demonstration concentration of 179,000 µg/L. Vinyl chloride concentrations in PA-28D increased from less than 1,000 µg/L to 8,500 µg/L after the demonstration, whereas ethene decreased from 338 µg/L to 37 µg/L. The increase in TCE concentrations observed in ground-water sampled from the perimeter monitoring wells indicates that some redistribution of TCE may have occurred in the aquifer. The groundwater dataset from the Middle Fine-Grained Unit and the Lower Sand Unit is too limited to determine if CVOCs migrated downward as a result of the biostimulation and bioaugmentation treat-ment. Soil data indicate that TCE-DNAPL existed in con-centrations above the threshold limit (300 mg/kg) in the Middle Fine-Grained Unit and the Lower Sand Unit during both pre-demonstration and post-demonstration soil characterization. The fluctuations in groundwater TCE concentrations during the demonstration may be due to continued equilibration of TCE concentrations around the existing TCE-DNAPL mass in the Middle Fine-Grained Unit and the Lower Sand Unit, following well installation. 5.2.2 Changes in Aquifer
Geochemistry
Among the field parameter measurements (tabulated in Table 5-5 and Table D-1 in Appendix D) conducted in the affected aquifer before, during, and after the demon-stration, the following trends were observed: • Groundwater pH in the shallow wells fluctuated in
a relatively narrow range over the course of the demonstration. In the performance assessment well PA-26, pH increased from 6.6 during pre-demonstration sampling to 8.0 in March 2003, before decreasing to 6.5 during post-demonstration sampling (see Table D-1 in Appendix D).
• ORP decreased in the center of the test plot (i.e., well PA-26) from +90 mV before the demonstration, to −111 mV following biostimulation, and to −157 mV following bioaugmentation (see Table D-1 in Appendix D). ORP continued to decrease after
the demonstration to −245 mV during post-demonstration sampling. The drop in ORP is indicative of reducing conditions created in the plot immediately after the addition of electron donor to the recirculating system (i.e., biostimulation). The same trend was observed in all of the perimeter wells (i.e., PA-27S/I/D and PA-28S/I/D), indicating that progressively stronger reducing conditions were created first by biostimulation and then by bioaugmentation.
• DO decreased from a maximum of 0.9 mg/L in the center well PA-26 before the demonstration to 0.3 mg/L after the demonstration. In the shallow perimeter wells PA-27S and PA-28S, DO concen-trations in general decreased over the course of the demonstration. A similar decreasing trend in dissolved oxygen concentrations was observed in the intermediate and deep wells (see Table D-1 in Appendix D). Following the demonstration, there was a slight increase in dissolved oxygen levels, but in general the aquifer remained relatively anaerobic through the demonstration.
Due to the limitations of measuring DO with a flowthrough cell, groundwater with DO levels below 1.0 mg/L is considered anaerobic. All three hydro-logic units of the shallow aquifer (i.e., the Upper Sand Unit, Middle Fine-Grained Unit, and Lower Sand Unit) were anaerobic for the duration of the demonstration.
• Conductivity in the Upper Sand Unit increased from approximately 0.2 mS/cm before the demonstration to a maximum of 2.5 mS/cm during the demonstra-tion (see Table D-1 in Appendix D). The increase is attributed to a buildup of dissolved ions formed from the mineralization of organic matter and CVOCs.
Other groundwater measurements indicative of aquifer quality included inorganic ions, BOD, and TOC (see Appendix D). The results of these measurements are as follows: • Chloride levels were already relatively high in the
aquifer before the demonstration (in PA-26, PA-27, and PA-28). In PA-26 (see Figure 5-9), chloride levels decreased slightly from 246 mg/L to 172 mg/L before increasing to 311 mg/L during post-demonstration sampling. As seen in Fig-ure 5-9, a similar trend, i.e., first a slight decrease followed by a measurable increase during post-demonstration sampling, can be seen in the other shallow monitoring wells (i.e., PA-27S, PA-28S, BIW-2, and BEW-2). Although the high initial con-centration of chloride present in the treatment plot account for some variability in the data, the overall

54
0
50
100
150
200
250
300
350
400
1-Fe
b-02
2-Ap
r-02
1-Ju
n-02
31-J
ul-0
2
29-S
ep-0
2
28-N
ov-0
2
27-J
an-0
3
28-M
ar-0
3
27-M
ay-0
3
26-J
ul-0
3
Time (months)
Chl
orid
e C
once
ntra
tion
(mg/
L)
PA-26PA-27SPA-28SBIW-2BEW-2
Recirculation Begins
Ethanol Injection
KB-1 Added
GW Sampling Event 1
Pre-Demo Sampling
Post-Demo Sampling
GW Sampling Event 2
Figure 5-9. Changes in Chloride Levels over Time in Monitoring Wells
increasing trend in chloride suggests that reductive dechlorination was contributing to chloride formation.
At intermediate and deep depths, chloride levels remained relatively stable, indicating that the bio-stimulation and bioaugmentation treatment did not significantly affect chloride levels at these depths. The secondary MCL for chloride in drinking water is 250 mg/L, which was exceeded in PA-26 in the center of the plot both before and after the demonstration.
Chloride concentrations also were measured using a Waterloo Profiler® in two locations in the test plot at various depths before and after the demonstra-tion. The pre-demonstration boring locations are shown in Figure 4-3 as BIO-WP-1 and BIO-WP-2 in the northwest and southeast quadrants, respec-tively. The post-demonstration boring locations are shown in Figure 4-4 as BIO-WP-201 and BIO-WP-202. The pre- and post-demonstration boring locations were chosen in close proximity in order to be able to compare the results. However, the depths at which the chloride samples were collected varied slightly. The results are shown in Table D-4 (in Appendix D) and are illustrated in Figure 5-10. In Figure 5-10a, the pre- and post-demonstration results for BIO-WP-1 and BIO-WP-201 in the northwest quadrant of the test plot show that chloride concentrations in the Upper Sand Unit increased following the demonstration. Chloride
concentrations decreased in the Middle Fine-Grained Unit and Lower Sand Unit. The same trend can be seen in Figure 5-10b, where the Waterloo Profiler® data were collected in the south-east quadrant at discrete depths in each hydro-stratigraphic unit.
Although the dataset is limited, the Waterloo Profiler® data collected at discrete depths provide better support for reductive dechlorination of TCE occurring inside the test plot in the Upper Sand Unit than the depth-averaged data from the monitoring wells.
• Dissolved iron concentrations in well PA-26 in the center of the test plot decreased from 30.9 mg/L to 2.7 mg/L during the demonstration before increas-ing to 8.1 mg/L after the demonstration. The pre-demonstration concentration of 30.9 mg/L in PA-26 is unusually high compared to other shallow wells around the plot and may be suspect. In general, iron concentrations increased following the treat-ment, indicating the creation of reducing conditions conducive to dechlorination.
Similar decreases followed by increases also were observed in the shallow wells around the perimeter of the plot (i.e., PA-27S and PA-28S). Dissolved iron concentrations at intermediate and deep depths decreased during the demonstration and remained low during post-demonstration

55
Waterloo Profiler Results (Paired Locations WP-1 and WP-201)
0
5
10
15
20
25
30
35
40
450 100 200 300 400 500 600 700 800 900
Chloride Concentration (mg/L)
Dep
th (f
t bgs
) Pre-demonstrationWP-1
Post-demonstrationWP-201Middle Fine-Grained
Unit
Lower Sand Unit
Upper Sand
(a)
Waterloo Profiler Results (Paired Locations WP-2 and WP-201)
0
5
10
15
20
25
30
35
40
450 100 200 300 400 500 600 700 800 900
Chloride Concentration (mg/L)
Dep
th (f
t bgs
)
Pre-demonstration WP-2
Post-demonstration WP-202
Middle Fine-Grained Unit
Lower Sand Unit
Upper Sand Unit
(b)
Figure 5-10. Waterloo Profiler® Chloride Concentration Data at Discrete Depths Before and After the Demonstration in Two Locations Within the Plot

56
characterization. The secondary drinking water limit for iron is 0.3 mg/L, which was exceeded before, during and after the demonstration.
• Calcium levels measured in the shallow center well (PA-26) of the test plot increased from 140 mg/L to 321 mg/L over the course of the demonstration before dropping to 50.1 mg/L during post-demonstration sampling. In the injection and extraction wells BIW-2 and BEW-2, calcium con-centrations increased almost 4 times between pre- and post-demonstration. Calcium concentrations also increased in the perimeter wells PA-27S and PA-28S. In the intermediate and deep wells, calcium concentrations remained relatively steady or decreased slightly. On the other hand, magnesium and alkalinity levels increased in groundwater over the course of the demonstration. Alkalinity levels in PA-26 first decreased slightly from 463 mg/L to 310 mg/L, and then rose substan-tially to 847 mg/L during post-demonstration sam-pling. The same trend was observed for alkalinity levels in BIW-2, BEW-2, PA-27S and PA-28S.
• Sulfate levels in PA-26 decreased substantially from 172 mg/L to <3 mg/L over the course of the demonstration. Sulfate levels in the perimeter wells followed this same decreasing trend. At deeper depths, sulfate levels declined slightly. Sulfate concentrations in the Upper Sand Unit may have begun to decrease immediately following the addition of electron donor into the subsurface due to an increase in a sulfate-reducing microbial organism population, which mediated electron transfer reactions that reduced sulfate.
• Potassium levels decreased over the course of the demonstration in PA-26. Similar significant decreases were observed in the shallow wells BIW-2 and BEW-2, and the perimeter wells PA27S and PA-28S.
• Manganese levels in well PA-26 decreased from 0.18 mg/L before the demonstration to 0.11 mg/L during the demonstration. In general, manganese concentrations in the perimeter wells decreased during the demonstration and then rose slightly during post-demonstration characterization. Mn2+ is not a health hazard, but there is a secondary drinking water standard because manganese can cause discoloration of the water at concentrations greater than 0.05 mg/L. Manganese levels exceeded the drinking water standard both before and after the demonstration. The increase in manganese may be indicative of reducing condi-tions that generate the soluble species Mn(II).
• TDS levels increased over the course of the demonstration. In PA-26, TDS rose from 1,220 mg/L to 3,000 mg/L after the demonstration possibly due to the introduction of recirculated groundwater. Similar increases were seen in the other shallow wells PA-27S, PA-28S, BIW-2, and BEW-2. TDS levels remained relatively stable or decreased slightly at deeper depths. A secondary drinking water standard of 500 mg/L for TDS was exceeded both before and after the demonstration.
• TOC concentrations increased significantly in the majority of the shallow monitoring wells after the demonstration. In PA-26, TOC concentrations increased from 76 mg/L to 1,050 mg/L. In the shallow perimeter wells (PA-27S and PA-28S), TOC levels increased from 95 mg/L and 235 mg/L to 140 mg/L and 684 mg/L, respectively. TOC levels rose in BIW-2 from 31 mg/L to 572 mg/L, and in BEW-2 from 59 mg/L to 384 mg/L. The increase in TOC concentrations is most likely due to the addition of a carbon electron donor into the Upper Sand Unit. At deeper depths, TOC concentrations decreased in groundwater collected from the intermediate and deep wells.
• BOD levels in well PA-26 increased from 12 mg/L to 38 mg/L after the demonstration. Similar increases were seen in the injection and extraction wells (BIW-2 and BEW-2), where BOD levels increased from less than 6.0 mg/L to 104 mg/L and 99 mg/L, respectively. Similar increases were observed in the shallow perimeter wells PA-27S and PA-28S. BOD levels remained fairly stable at deeper depths. The rise in BOD levels indicates that the carbon electron donor was well distributed throughout the Upper Sand Unit.
5.2.3 Changes in Hydraulic Properties of the Aquifer
Slug tests were performed in well PA-26 in the center of the treatment plot before and after the demonstration to assess any effects on aquifer quality caused by the reme-diation technology. The remediation system was applied to just the Upper Sand Unit, so slug tests were only performed in the shallow performance monitoring well in the center of the plot (PA-26) (see Appendix B). Pre-demonstration hydraulic conductivity averaged 22 ft/day (0.0079 cm/sec) in well PA-23. Post-demonstration hydraulic conductivity averaged 32.3 ft/day (0.011 cm/sec). There was no substantial difference in the hydraulic con-ductivity due to the biostimulation and bioaugmentation treatment.

57
5.2.4 Changes in Microbiology of the Treatment Plot
Polymerase chain reaction (PCR) analysis indicates that groundwater sampled from PA-26 before the demon-stration (March 2002) showed a weak detection for Dehalococcoides (see Appendix E). After the demon-stration, the PCR analysis on groundwater collected from PA-26 showed a clear, positive, very high band intensity result, which indicates that Dehalococcoides increased as a result of the demonstration. However, it is not clear from the PCR analysis how much of the increase in Dehalococcoides is a result of biostimulating the existing colony versus the addition of KB-1™ during bioaugmentation. The Dehalococcoides group includes multiple strains, not all of which are proficient at cis-1,2-DCE and VC dechlorination. KB-1TM is cultured to be predominantly those strains capable of biodegrading TCE to ethene. Table 5-6 shows that ethene levels increased during the demonstrations in wells inside and on the perimeter of the plot. The considerable rise in ethene levels in the plot indicates that the dechlorination of the chlorinated VOCs was substantially complete. The increasing trend in chloride levels supplements this finding. Increases in methane concentrations (see Table 5-7) also can support the theory of increased microbial activity from the microorganisms in the Upper Sand Unit beneath the test plot. As the Dehalococcoides microorganisms use inorganic chemicals as electron acceptors, methane byproduct gas is produced. Methane concentrations in PA-26 increased steadily from a pre-demonstration concentration of 0.004 mg/L to 0.014 mg/L during the bio-stimulation phase; and to 0.023 mg/L during the bio-augmentation phase. The methane concentration during post-demonstration sampling in PA-26 was 0.14 mg/L, an
approximately 40-fold increase over pre-demonstration levels (see Table D-5 in Appendix D). Methane con-centrations also increased in extraction well BEW-2 and in injection well BIW-2, from 0.008 mg/L and 0.016 mg/L respectively, to 0.21 mg/L and 0.14 mg/L, respectively, after the demonstration. 5.2.5 Summary of Changes in
Aquifer Quality
In summary, the following changes in the aquifer occurred after application of the biostimulation and bio-augmentation technology: • TCE concentrations in groundwater declined sub-
stantially in the Upper Sand Unit of the demon-stration area following the biostimulation and bioaugmentation treatment. cis-1,2-DCE levels increased during the biostimulation phase and then decreased during the bioaugmentation phase. Vinyl chloride levels increased following biostimulation, increased again following bioaugmentation, and then decreased toward the end of the demonstra-tion. These changes indicate sequential degrada-tion of TCE to cis-1,2-DCE, and ultimately to vinyl chloride and ethene.
• ORP and DO levels decreased in the demonstration area after biostimulation began. The decreases continued through the bioaugmentation phase of the demonstration and post-demonstration sam-pling. These data indicate that strongly reducing anaerobic conditions were created in the Upper Sand Unit during the demonstration. Groundwater pH in the shallow wells remained relatively steady.
• Dissolved iron concentrations in well PA-26 in the center of the test plot generally increased after the
Table 5-6. Dissolved Ethene and Ethane Concentrations in the Treatment Plot Before, During,
and After the Demonstration
Ethane (mg/L) Ethene (mg/L)
Well ID Pre-Demo During
Biostimulation During
Bioaugmentation Post-Demo Pre-DemoDuring
Biostimulation During
Bioaugmentation Post-Demo Treatment Plot Well
PA-26 0.025 <0.002 0.002 0.002 0.573 0.030 2.31 22.9 Injection and Extraction Wells
BIW-2 0.019 <0.002 <0.002 0.001 0.007 0.008 0.368 14.0 BEW-2 0.008 <0.002 0.004 0.016 0.029 <0.003 1.14 16.2
BIW-2 = injection well; BEW-2 = extraction well. Pre-demonstration = March 2002; during biostimulation = December 2002; during bioaugmentation = March 2003; post-demonstration = June 2003.

58
Table 5-7. Dissolved Methane Concentrations In and Around the Treatment Plot Before, During, and After the Demonstration
Methane (mg/L)
Well ID Pre-Demonstration During
Biostimulation During
Bioaugmentation Post-Demonstration Treatment Plot Well
PA-26 0.004 0.014 0.023 0.137 Treatment Plot Perimeter Wells
PA-27S 0.007 0.044 0.023 0.013 PA-27I 0.002 0.021 0.023 0.015 PA-27D 0.006 0.013 0.018 0.005 PA-28S 0.031 0.014 0.032 0.036 PA-28I 0.023 0.067 0.103 0.069 PA-28D 0.008 0.016 0.018 0.013
Injection and Extraction Wells BIW-2 0.016 0.014 0.014 0.137 BEW-2 0.008 0.011 0.028 0.214 BIW-2 = injection well; BEW-2 = extraction well. Pre-demonstration = March 2002; during biostimulation = December 2002; during bioaugmentation
= March 2003; post-demonstration = June 2003.
treatment. The secondary drinking water limit for iron, 0.3 mg/L, was exceeded in the majority of wells before, during, and after the demonstration.
• Chloride levels in the monitoring wells, which were already high due to saltwater intrusion in the aqui-fer, first decreased and then increased over the course of the demonstration. The Waterloo Profiler® samples taken from various depths in the Upper Sand Unit also show increases in chloride concentrations from the pre- and post-demonstration sampling events. Chloride increases may indicate reductive dechlorination of the TCE, which was supported by the increase and subse-quent decrease in cis-1,2-DCE and VC observed during post-demonstration characterization.
• Increases in dissolved methane, as well as decreases in sulfate concentrations, indicate that an increase in biological activity occurred as a result of the biostimulation and bioaugmentation treatment. BOD levels in the groundwater increased, indicating that the bioavailable organic matter in the aquifer increased, most likely due to the addition of a carbon electron donor to the recirculating ground-water. TOC levels also increased, probably as a result of the carbon electron donor addition.
• Ethene concentrations increased substantially in the groundwater, consistent with reductive dechlorination of CVOCs, including the byproducts cis-1,2-DCE and VC.
• Hydraulic conductivity of the Upper Sand Unit does not appear to have been affected by the biostimu-lation and bioaugmentation treatment, suggesting that the addition of electron donor and KB-1™
culture did not plug the aquifer. There were no substantial changes in permeability in the test plot, according to slug tests conducted in the center well before and after the demonstration.
5.3 Evaluating the Fate of the TCE-DNAPL Mass
Determining the fate of the TCE-DNAPL mass following treatment involved an examination of three potential pathways: microbial reductive dechlorination of TCE, extraction and adsorption on carbon, and migration from the plot to the surrounding regions. 5.3.1 Biological Reductive
Dechlorination of TCE
The performance assessment of the biostimulation and bioaugmentation technology demonstration indicates that biological reduction of TCE was a substantial pathway of TCE removal from the treatment plot. Many of the changes noticed in the aquifer and dis-cussed in Section 5.2 indicate that biostimulation and bioaugmentation caused a decline in concentrations of TCE and, eventually, cis-1,2-DCE and vinyl chloride. TCE levels decreased following biostimulation, but cis-1,2-DCE and vinyl chloride increased (Table 5-3). After bioaugmentation, cis-1,2-DCE and vinyl chloride levels increased, but then declined considerably by the time the plot was sampled in June 2003 (Figure 5-11a). To account for the large difference in scale in Figure 5-11a, TCE and ethene concentrations were plotted separately in Figure 5-11b. Towards the end of this treatment period, both ethene (Table 5-6) and methane (Table 5-7)

59
0
20,000
40,000
60,000
80,000
100,000
120,000
Pre-Demo Post-Electron DonorAddition
Post-KB-1 Addition Post-Demo Long-term
Oth
er C
VOC
s (µ
g/L)
0
200,000
400,000
600,000
800,000
1,000,000
1,200,000
1,400,000
TCE
(µg/
L)
cis-1,2-DCEtrans-1,2-DCEVinyl chlorideTCE
Figure 5-11a. Degradation Curve of TCE and Other CVOCs in PA-26 After Biostimulation and
Bioaugmentation Treatment
0
5,000
10,000
15,000
20,000
25,000
Pre-Demo Post-Electron DonorAddition
Post-KB-1 Addition Post-Demo Long-term
Ethe
ne (µ
g/L)
0
200,000
400,000
600,000
800,000
1,000,000
1,200,000
1,400,000
TCE
( µg/
L)
EtheneTCE
Figure 5-11b. Degradation Curve of TCE and Ethene in PA-26 After Biostimulation and
Bioaugmentation Treatment

60
levels rose sharply, indicating that the dechlorination was substantially complete. An increasing trend in chloride supplements the evi-dence of TCE, DCE, and vinyl chloride mineralization (Figure 5-9). Other groundwater parameter trends, such as a decline in sulfate and an increase in dissolved iron, indicate that the reducing conditions necessary to facili-tate anaerobic reductive dechlorination were generated in the treated aquifer. As many of these trends started late in the demon-stration, an additional confirmatory sampling event was conducted in January 2004. The data from this limited sampling of wells PA-26 and MW-6 inside the test plot are shown in Table 5-8 (and Table C-4 in Appendix C). These additional data indicate that many of the observed trends continued for several months after the treatment. TCE, DCE, and vinyl chloride levels continued to decline considerably (Figure 5-11a). Dissolved iron levels con-tinued to increase and sulfate concentrations remained below detection. Ethene levels declined (Figure 5-11b), but methane levels rose considerably. Dehalococcoides were detected weakly in groundwater from well PA-26 before the demonstration and very strongly after the demonstration (see Appendix E). How-ever, it is not clear from the genetic analysis how much of the increase in Dehalococcoides is a result of biostim-ulating the indigenous colony as opposed to the addition
of KB-1™ during bioaugmentation. The significant pres-ence of these microorganisms provided strong evidence that Dehalococcoides survived in an area with known TCE-DNAPL mass and participated in removing the DNAPL from the Upper Sand Unit. Because of the limited size of the DNAPL source area at Launch Complex 34, no control plot (with biostimulation only) was available that would allow a careful differen-tiation between the combined effect of the biostimulation and bioaugmentation treatments (as currently imple-mented) and the effect of biostimulation alone (without the addition of KB-1™). However, the biostimulation-bioaugmentation combination worked well, as evidenced by the decline in TCE, generation and eventual decline of byproducts (cis-1,2-DCE and vinyl chloride), and a fairly noticeable increase in chloride levels. 5.3.2 Extraction and Adsorption
onto Carbon
To stabilize flow and maintain hydraulic control in the test plot during the biostimulation and bioaugmentation treatments, a continuous recirculation system was main-tained through three injection and three extraction wells. During testing and modification of the treatment system (see Table 3-1), and prior to the biostimulation phase (i.e., before electron donor was injected), the extracted water was run through carbon canisters before re-injection.
Table 5-8. Additional Monitoring of Test Plot Wells in January 2004
Analyte Well MW-6 Well PA-26 CVOCs (µg/L)
TCE <10 <10 cis-1,2-DCE 35.6 62.4 trans-1,2-DCE 104 143 Vinyl Chloride 875 161
Dissolved Hydrocarbon Gases (mg/L) Methane 4.83 4.36 Ethane 0.00377 <0.002 Ethene 7.07 4.38
Inorganics (mg/L) Calcium 731 1,050 Iron 18.8 22.8 Magnesium 46.3 55.3 Manganese 0.255 1.44 Potassium 50.9 62.4 Sodium 72.2 78 Alkalinity 1,090 1,550
Anions (mg/L) Bromide 0.67 J <1 Chloride 406 389 Nitrate (NO3) 2.3 3.42 Phosphate <0.5 <0.5 Sulfate <3 <3
Others (mg/L) TDS 3,730 4,980
Note: Groundwater monitoring was conducted on January 22, 2004, approximately one year after the bioaugmentation phase of the demonstration began.

61
The vendor analyzed the extracted water before and after its passage through the carbon, and the measure-ments indicate that TCE, cis-1,2-DCE, and vinyl chloride were present in the influent to the carbon, but so was ethene. Using these data, approximately 140 kg of TCE was estimated to have been removed by recirculating groundwater through the carbon canisters (Table C-6, Appendix C). A substantial portion of this TCE mass may have been extracted with groundwater drawn from the surrounding aquifer. The effective TCE mass removed only from the test plot can be calculated using an estimated flowrate into the treatment plot. Qtest plot = q A (5-1) = v θ A (5-2) where Qtest plot = flowrate (volume/unit time)
q = specific discharge = v θ v = groundwater velocity (ft/day) = 0.75 ft/day
(based on the results of tracer tests conducted by the vendor)
θ = porosity (unitless) = 0.3 A = cross-sectional area (ft2) = 20 ft × 10 ft Qtest plot = 0.2 gpm.
These calculations indicate that groundwater flowed from the injection wells to the extraction wells through the plot (and through the carbon canisters) at a rate of 0.2 gpm. However, groundwater was being extracted at 1.5 gpm through the recirculation system, so ground-water from outside the test plot must have been extracted at a flowrate of 1.3 gpm. It is estimated that only 16% of the total flow extracted by the groundwater recirculation system came from inside the test plot : Ratio = Qtest plot / Qrecirculation rate (5-3) where Qrecirculation rate = average 1.5 gpm Ratio = 16%. It is difficult to use this ratio to estimate the respective contributions of TCE from inside and outside the test plot to the total TCE (140 kg) extracted and captured on the carbon canisters. This is because over the time period of the demonstration, the groundwater inside the test plot became progressively cleaner, whereas the groundwater outside the test plot remained highly contaminated (see Table 5-3). If the TCE concentrations inside and outside the test plot had been the same throughout the demon-stration, then a maximum of 22.4 kg of TCE (16% of the total TCE) captured on the carbon would have come from inside the test plot. However, the actual contribu-tion of the test plot to the TCE mass on the carbon is probably much less than 22.4 kg.
A better way of understanding how the recirculation sys-tem and the carbon canisters contributed to the removal of TCE is to examine the number of pore volumes of groundwater extracted from the test plot. Based on the extraction rate of 1.5 gpm, an estimated 2 pore volumes of water were removed from the test plot and replaced with 2 pore volumes of carbon-treated water. (This is a conservative estimate, because the treated water injected back into the plot probably mixed with the con-taminated water from the surrounding aquifer, and also because the carbon canisters were not used throughout the demonstration). If the only factor causing TCE con-centrations in the test plot to decline was dilution due to the recirculation system, then the TCE concentration would have declined from approximately 1,100,000 µg/L (i.e., 1,100 mg/L, the saturation concentration) before the demonstration to approximately 176,000 µg/L after the demonstration, thereby representing an approxi-mately 84% decline based on first-order decay driven by 2 pore volume changes. However, the actual TCE concentration in groundwater extracted from the test plot declined to 239 µg/L immediately after the demonstra-tion, and to <10 µg/L several months later. At a mini-mum, the decline from 176,000 µg/L to <10 µg/L can be attributed to the biostimulation and bioaugmentation treatment. Therefore, despite any dilution of TCE due to the recirculation system, the biostimulation and bioaug-mentation likely contributed substantially to the treat-ment of CVOCs inside the test plot. 5.3.3 Potential for TCE-DNAPL Migration
from the Treatment Plot
The following measurements or observations were used to evaluate the potential for TCE-DNAPL migration to the surrounding aquifer: • Hydraulic gradient in the aquifer • TCE measurements in perimeter wells. Pre-demonstration measurements of water levels in the Upper Sand Unit showed a minimal gradient in the area of the demonstration plot and a slight depression to the east of the plot (see Figure 5-12a). During the demon-stration, the recirculation system appeared to produce a gradient across the bioaugmentation plot from the north-west to the southeast, but the gradient appeared to reach a steady elevation on the eastern edge of the plot. The slightly elevated gradient across the Upper Sand Unit would have limited the potential for TCE-DNAPL migration from the Upper Sand Unit (see Figure 5-12b). Water level maps of the Middle Fine-Grained Unit before and during the demonstration were prepared using water level measurements from wells around the treatment plot (Figures 5-13a and 5-13b). During the demonstra-tion, a weak gradient appears to have developed in the

62
Figure 5-12a. Water Levels Measured in Shallow Wells in the Engineering Support Building During Pre-
Demonstration Characterization (March 2002)
Figure 5-12b. Water Levels Measured in Shallow Wells in the Engineering Support Building During the
Biostimulation and Bioaugmentation Technology Demonstration (March 2003)

63
Figure 5-13a. Water Levels Measured in Intermediate Wells in the Engineering Support Building During
Pre-Demonstration Characterization (March 2002)
Figure 5-13b. Water Levels Measured in Intermediate Wells in the Engineering Support Building During
the Biostimulation and Bioaugmentation Technology Demonstration (March 2003)

64
Middle Fine-Grained Unit, which mirrors the northwest to southwest gradient seen in the Upper Sand Unit (see Figure 5-13b). TCE and other CVOC concentrations in perimeter wells were monitored for evidence of TCE-DNAPL migration outside the boundaries of the treatment plot. In well PA-27S, which is outside the northern edge of the plot and in the Upper Sand Unit, dissolved TCE concentrations decreased from 659,000 µg/L to 347,000 µg/L during the demonstration, and then to 168,000 µg/L after the dem-onstration (see Table 5-3). A similar decrease in TCE was observed in PA-28S along the southern perimeter of the plot, where TCE concentrations decreased signifi-cantly from 801,000 µg/L before the demonstration to 68,200 µg/L during the demonstration, and then to 67,500 µg/L after the demonstration (see Table 5-3). The substantial decrease suggests that TCE-DNAPL did not migrate outside the plot boundaries on the northern and southern edges of the plot as a result of the demon-stration. The effects of the biostimulation and bioaug-mentation were experienced beyond the boundaries of the plot (possibly due to migration of electron donor and/or KB-1™ culture). The potential for vertical TCE-DNAPL migration as a result of the biostimulation and bioaugmentation tech-nology was evaluated using soil and groundwater sam-ples collected from the Middle Fine-Grained Unit and Lower Sand Unit during post-demonstration characteri-zation (Figure 5-1). There was no noticeable increase in TCE levels in the soil samples collected after the demon-stration in the Middle Fine-Grained Unit and Lower Sand Unit. The monitoring well data in Table 5-3 indicate a noticeable increase in TCE levels in perimeter wells PA-27I and PA-27D. This cluster of wells is located on the north side of the plot. The exact reasons for this increase are unclear, but it may be related to continued equili-bration of TCE in these wells after their construction. 5.3.4 Summary Evaluation of the Fate
of TCE-DNAPL
In summary, the performance assessment indicates that biodegradation was a significant pathway accounting for a substantial portion of the decrease in TCE, cis-DCE, and vinyl chloride measured in the test plot. The combination of biostimulation and bioaugmentation improved the rate and extent of biodegradation in the plot. In addition, some TCE and other VOCs appear to have been extracted by
the recirculation system and captured by adsorption in the aboveground carbon canisters. There is no indication that any significant amount of TCE-DNAPL migrated out-side the test plot due to the treatment demonstration. 5.4 Verifying Operating
Requirements
Section 3 describes the field operations for the biostim-ulation and bioaugmentation technology demonstration at Launch Complex 34. Overall, two operational factors need to be improved: (1) hydraulic control by recircu-lation prior to, during, and after each phase of treatment; and (2) biofouling of the injection wells. An artificial hydraulic gradient in the Upper Sand Unit was created by using three injection wells at the western edge of the plot (BIW-1, BIW-2, and BIW-3) and three extraction wells along the eastern edge of the plot (BEW-1, BEW-2, and BEW-3) to establish continuous recirculation in a rather flat aquifer and at a low flowrate. The recirculation system appeared to help effectively distribute the electron donor and KB-1™ throughout the Upper Sand Unit. However, as described in Section 3.3, water extracted from the downgradient extraction wells was not run through the carbon unit at all times. The recirculated groundwater was run through the carbon units from May 23 to September 12, 2002 during testing and modification of the treatment system (see Table 3-1). The carbon tanks were removed from the recirculation system prior to initiating the biostimulation phase (i.e., before electron donor was injected). Second, the vendor reported that biofouling in the injec-tion wells became apparent after amending the recirculat-ing groundwater with electron donor (GeoSyntec, 2003). To mitigate the biofouling, the addition of ethanol was decreased to one concentrated dose administered daily; the injection wells were scrubbed, surged, and purged on a weekly basis to remove biofilm from the screen; and the reinjected groundwater was amended with sodium hypochlorite to inhibit microbial growth. It is unclear what the long-term effect of the change in electron donor dose/timing and the addition of sodium hypochlorite into the aquifer had on the microorganisms throughout the demonstration plot. Future applications of the biostimu-lation and bioaugmentation technology may benefit from a study of optimizing electron donor dosing schedules, and establishing procedures to monitor for biofouling and treat occurrences of biofouling during the demonstration.

65
6. Quality Assurance
A QAPP (Battelle, 2002a) prepared before the demon-stration outlined the performance assessment methodol-ogy and the quality assurance measures to be taken during the demonstration. The results of the field and laboratory QA for the critical soil and groundwater CVOC (primary) measurements and groundwater field param-eter (secondary) measurements are described in this section. The results of the QA measurements for both soil and groundwater sampling events are described in Appendix F. The focus of the QA measures is on the critical TCE measurement in soil and groundwater, for which, in some cases, special sampling and analytical methods were used. For other measurements (chloride, calcium, etc.), standard sampling and analytical methods were used to ensure data quality. 6.1 QA Measures
This section describes the data quality in terms of repre-sentativeness and completeness of the sampling and analysis conducted for the technology performance assessment. Chain-of-custody procedures also are described. 6.1.1 Representativeness
Representativeness is a measure that evaluates how closely the sampling and analysis represents the true value of the measured parameters in the target matrices. The critical parameter in this demonstration is TCE concentration in soil. The following steps were taken to achieve representativeness of the soil samples: • Statistical design for determining the number and
distribution of soil samples in the 20-ft × 20-ft treatment plot, based on the horizontal and vertical variability observed during a preliminary characteri-zation event (see Section 4.1). Four locations (one in each cell of a 2 × 2 grid in the plot) were cored before and after the demonstration. Each contin-uous core was collected and sampled in 2-ft sections from the ground surface to the aquitard.
During post-demonstration characterization, two additional locations were cored within the plot boundaries and soil samples were collected at 1-ft intervals from 12 ft to 30 ft bgs, which is predomi-nantly within the targeted Upper Sand Unit. At the 80% confidence level, the reduction of TCE mass between the pre- and post-demonstration was considered to be achieved very well by the biostimulation and bioaugmentation technology.
• Continuous sampling of the soil column at each coring location enabled the sampling design to address the vertical variability in the TCE distribu-tion. By extracting and analyzing the complete 2-ft depth in each sampled interval, essentially every vertical depth was sampled.
• Use of appropriate modifications to the standard methods for sampling and analysis of soil. To increase the representativeness of the soil sam-pling, the sampling and extraction procedures in U.S. EPA Method 5035 were modified so that an entire vertical section of each 2-ft core could be sampled and extracted, instead of the 5-g aliquots specified in the standard method (see Section 4.1). This was done to maximize the capture of TCE-DNAPL in the entire soil column at each coring location.
Steps taken to achieve representativeness of the ground-water samples included: • Installation and sampling of one well in the center of
the treatment plot and two clusters of performance monitoring wells outside the plot. The well in the center was screened at the target depth in the Upper Sand Unit. Each performance well cluster consisted of three wells screened in the three strati-graphic units — Upper Sand Unit, Middle Fine-Grained Unit, and Lower Sand Unit.
• Use of standard methods for sampling and analysis. Disposable tubing was used to collect samples from all monitoring wells to avoid any persistence of TCE

66
in the sample tubing after sampling wells with high TCE-DNAPL levels.
6.1.2 Completeness
All the regular samples planned in the QAPP were col-lected and analyzed, with the exception of a duplicate sample during pre-demonstration groundwater sampling and method blanks spiked with 1,1,1-TCA during post-demonstration soil sampling. All the quality control (QC) samples planned in the QAPP were collected and analyzed, except for the equipment rinsate blanks during soil coring. Equipment rinsate blanks as planned in the QAPP were collected and analyzed during the pre- or post-demonstration soil sampling events. Based on the preliminary speed of the soil coring, one rinsate blank per day was thought to be sufficient to obtain a ratio of one blank per 20 samples (5%). One rinsate blank per core was determined to be the optimum collection frequency. 6.1.3 Chain of Custody
Chain-of-custody forms were used to track each batch of samples collected in the field and were sent to the off-site analytical laboratory. Copies of the chain-of-custody records can be found in Appendix F. Chain-of-custody seals were affixed to each shipment of samples to ensure that only laboratory personnel accessed the samples during transit. Upon arrival at the laboratory, the laboratory verified that the samples were received in good condition, and the temperature blank sample sent with each shipment was measured to ensure that the required temperature was maintained during transit. Each sample received then was checked against the chain-of-custody form, and any discrepancies were brought to the attention of field personnel. 6.2 Field QC Measures
The field QC checks included calibration of field instru-ments, field blanks (5% of regular samples), field dupli-cates (5% of regular samples), and trip blanks; the results of these QC checks are discussed in this section.
Table 6-1 summarizes the instruments used for field groundwater measurements (pH, ORP, DO, tempera-ture, water levels, and conductivity) and the associated calibration criteria. Instruments were calibrated at the beginning and end of the sampling period on each day. The field instruments were always within the acceptance criteria during the demonstration. 6.2.1 Field QC for Soil Sampling
As an overall determination of the extraction and ana-lytical efficiency of the soil sampling, the modified U.S. EPA Method 5035 methanol extraction procedure was evaluated in a previous demonstration at Launch Com-plex 34 by spiking a known amount of TCE into soil samples from the Launch Complex 34 aquifer. Replicate samples from the spiked soil were extracted and ana-lyzed; the results are listed in Appendix F (Table F-1). For the five replicate soil samples, the TCE spike recov-eries were in the range of 72 to 86%, which fell within the acceptable range (70-130%) for quality assurance of the extraction and analysis procedure. The results demonstrate that a majority of the TCE was primarily extracted during the first extraction, and that diminishing returns were provided by the second and third extrac-tions (Battelle, 2002b). Based on these results, the extraction procedure defined for subsequent soil sam-pling events and subsequent demonstrations at Launch Complex 34 involved extracting one time only from the soil before sending the methanol samples to the off-site laboratory for analysis. A more detailed evaluation of the soil extraction effi-ciency was conducted in the field during a previous steam injection/extraction technology demonstration at Launch Complex 34 by spiking a surrogate compound (1,1,1-TCA) directly into the intact soil cores retrieved in a sleeve (Battelle, 2002b). The injection volume of 1,1,1-TCA was approximately 10 µL. The spiked soil samples were handled in the same manner as the remaining soil samples during the extraction procedure. Extraction efficiencies for the experiment ranged from 84 to 113%. The results of the experiment were compared to the results of the post-demonstration soil characterization, where soil samples also were spiked with 1,1,1-TCA. Of
Table 6-1. Instruments and Calibration Acceptance Criteria Used for Field Measurements
Instrument Measurement Acceptance Criteria YSI Meter Model 6820 pH 3 point, ±20% difference YSI Meter Model 6820 ORP 1 point, ±20% difference YSI Meter Model 6820 Conductivity 1 point, ±20% difference YSI Meter Model 6820 Dissolved Oxygen 1 point, ±20% difference YSI Meter Model 6820 Temperature 1 point, ±20% difference OHaus Weight Balance Soil – Dry/Wet Weight 3 point, ±20% difference Hermit Water Level Indicator Water Levels ±0.01 ft

67
the 13 soil samples spiked with 1,1,1-TCA during the steam injection demonstration at Launch Complex 34, 12 soil samples were within the acceptable range of precision for the post-demonstration soil sampling, cal-culated as the relative percent difference (RPD), where RPD is less than 30%. The results indicate that the methanol extraction procedure used in the field is suit-able for recovering CVOCs. For the bioaugmentation demonstration, a similar evaluation was used to com-pare the extraction efficiencies. Soil samples and blank methanol samples were spiked with equal amounts of 1,1,1-TCA. During pre-demonstration characterization, all seven of the samples were within the acceptable range of precision (i.e., RPD), where RPD is less than 30% (see Table F-2). During post-demonstration char-acterization, an error occurred during field sampling, and the corresponding methanol blanks spiked with 1,1,1-TCA were not able to be included in Table F-2. However, given the consistent results of this procedure during previous demonstrations at Launch Complex 34, the methanol extraction procedure used in the field remains suitable for recovering CVOCs. During the biostimulation and bioaugmentation pre- and post-demonstration sampling events, duplicate soil sam-ples were collected in the field and analyzed for TCE to evaluate sampling precision. Duplicate soil samples were collected by splitting each 2-ft soil core vertically in half and subsequently collecting approximately 250 g of soil into two separate containers, marked as SB#-Depth# and SB#-Depth#-DUP. Appendix F (Table F-3) shows the result of the field soil duplicate analysis and the precision, calculated as the RPD for the duplicate soil cores, which were collected before and after the demonstration. The precision of the field duplicate sam-ples was generally within the acceptable range (RPD <30%) for the demonstration, indicating that the sam-pling procedure was representative of the soil column at the coring location. The RPD for two of the duplicate soil samples from the pre-demonstration sampling was greater than 30%. This indicated that the repeatability of some of the pre-demonstration soil samples was outside targeted acceptance criteria. However, given the hetero-geneous nature of the contaminant distribution, a large RPD is expected on occasion. The RPDs for two of the duplicate soil samples from the post-demonstration sam-pling were greater than 30%. The reason for the higher RPD calculated in the two post-demonstration soil samples is that TCE concentrations were low (often near or below the detection limit). For example, the RPD between duplicate samples, one of which is below detec-tion and the other is slightly above detection, tends to be high. In general, though, the variability in the two vertical halves of each 2-ft core was in a reasonable range, given the typically heterogeneous nature of the DNAPL distribution.
Field blanks for the soil sampling consisted of rinsate blank samples and methanol blank samples. The rinsate blank samples were collected approximately once per drilling borehole, or approximately once per 20 soil samples, to evaluate the decontamination efficiency of the sampling equipment used to collect each soil sam-ple. Decontamination between samples consisted of a four-step process where the sampling equipment was washed with soapy water, rinsed in distilled water to remove soap and debris, then rinsed a second time with distilled water, and finally rinsed with methanol. The rinsate blank samples were collected by pouring distilled water over the equipment after the equipment had been processed through the routine decontamination proce-dure. As seen in Appendix F (Table F-4), TCE levels in the rinsate blanks were below detection (<1.0 µg/L) for all but two of the nine rinsate blanks collected, indicating that the decontamination procedure was helping control carryover of CVOCs between samples. Methanol blank samples were collected in the field at the rate of one per soil boring, or approximately every 20 samples (5%), to evaluate the soil extraction process. The results are listed in Appendix F (Table F-5). Only one of the pre-demonstration methanol blanks had a TCE concentration that was slightly above the targeted detection limit of 100 µg/L of TCE in methanol. However, the TCE concentration in this one methanol blank was below 10% of the concentration in the associated batch of soil samples. All of the post-demonstration methanol blanks were below detection. Trip blanks were sent with every sample shipment, both soil and groundwater, to the off-site analytical laboratory. The results are discussed in Section 6.2.2. 6.2.2 Field QC for Groundwater
Sampling
QC checks for groundwater sampling included field dup-licates (5%), field blanks (5%), and trip blanks. Field duplicate samples were collected once per sampling event, or approximately once per eight to ten wells sampled, with the exception of the pre-demonstration groundwater sampling event. A duplicate groundwater sample was not collected during this event. Appendix F (Table F-6) contains the analysis of the field duplicate groundwater samples that were collected twice during and after the demonstration. The RPD (precision) calcu-lated for these samples met the QA/QC target criteria of RPD <30% for the two duplicate samples collected dur-ing the demonstration. The RPD was exceeded for the samples collected during post-demonstration sampling, most likely because differences in low TCE concen-trations can have a large effect on the RPD calculation.
68
In previous demonstrations carried out at Launch Com-plex 34, decontamination of the sample tubing between groundwater samples initially consisted of a detergent rinse and two distilled water rinses. However, the results from these earlier demonstrations revealed that, despite the most thorough decontamination, rinsate blanks con-tained elevated levels of TCE, especially following the sampling of wells containing TCE levels near or greater than its solubility (1,100 mg/L); this indicated that some free-phase solvent may have been drawn into the tubing. When TCE levels in such rinsate blanks refused to go down, even when a methanol rinse was added to the decontamination procedure, a decision was made to switch to disposable Teflon® tubing. All groundwater sampling events conducted for the bioaugmentation demonstration used disposable Teflon® tubing. Each new piece of tubing was used for sampling each well once and then discarded, despite the associated costs. TCE levels in the rinsate blanks (Appendix F, Table F-7) were below the targeted detection limit (3.0 µg/L) throughout the demonstration. Trip blanks supplied by the off-site laboratory were included for CVOC analysis with every sample shipment sent to the laboratory. TCE levels in trip blank samples were below the QA/QC target level of 3 µg/L for all of the 18 trip blanks analyzed for the demonstration (Appen-dix F, Table F-8). 6.3 Laboratory QC Measures
The off-site analytical laboratories performed QA/QC checks consisting of 5% matrix spikes (MS) and matrix spike duplicates (MSD). MS and MSD were used to cal-culate analytical accuracy (percent recovery) and preci-sion (RPD between MS and MSD). Laboratory control spikes (LCS) and method blanks (MB) also were ana-lyzed with every batch of samples. 6.3.1 Analytical QC for Soil Samples
Analytical accuracy for the soil samples (methanol extracts) was generally within acceptance limits for TCE (70-130%) for the pre- and post-demonstration period (Appendix F, Tables F-9 and F-10). Matrix spike recov-eries were outside this range for three of the MS/MSD samples conducted during the pre-demonstration sampling period, and three during the post-demonstration period. The spike recovery was outside of the control limits due to either very high or very low (i.e., near detection limit) concentrations of TCE present in the reference sample. No corrective actions were required and sample results were not adversely affected by the MS/MSD spike recoveries that were outside the control limits. The precision between MS and MSD was
always within acceptance limits (RPD <30%), with the exception of one post-demonstration MS/MSD sample. Laboratory control spike recoveries for all pre- and post-demonstration samples were within the acceptance cri-teria (Appendix F, Table F-11). Method blanks were below the target level of 3.0 µg/L for TCE for all 37 method blanks analyzed during pre- and post-demonstration sampling. (Appendix F, Table F-12). The laboratory conducted surrogate spikes in 5% of the total number of methanol extracts prepared from the soil samples for CVOC analysis. Table 6-2 lists the surrogate compounds used by the laboratory to perform the QA/ QC checks. Surrogate recoveries were within the speci-fied acceptance limits.
Table 6-2. List of Surrogate Compounds and Their Target Recoveries for Soil and Groundwater Analysis by the Analytical Laboratory
Target Recovery for Soil
(Methanol Extracts)
Target Recovery for Groundwater
Surrogate Compound (%) (%) Dibromofluoromethane 65-135 75-125 1,2-Dichloroethane – d4 52-149 62-139 Toluene – d8 65-135 75-125 Bromofluorobenzene 65-135 75-125 6.3.2 Laboratory QC for
Groundwater Sampling
Pre- and post-demonstration MS and MSD results for groundwater are listed in Appendix F (Table F-13). The MS and MSD recoveries (75 to 125%) were generally within acceptance criteria. The only exceptions were one MS/MSD sample set during pre-demonstration ground-water sampling and one MS/MSD sample set during post-demonstration groundwater sampling. The spike recovery was outside of the control limits due to either very high or very low (i.e., near detection limit) concen-trations of TCE present in the reference sample. No cor-rective actions were required and sample results were not adversely affected by the MS/MSD spike recoveries that were outside the control limits. The precision for all of the MS/MSD samples met the QA/QC criteria of RPD <20%. Recoveries for LCS samples were always within the acceptance range of 75-125% (Appendix F, Table F-14). Method blanks (Appendix F, Table F-15) for the ground-water samples were always below the targeted 3.0 µg/L detection limit.

69
6.3.3 Analytical Detection Limits
Detection limits for TCE in groundwater and in the meth-anol extracts from soil generally were met. The detection limits most affected were those for cis-1,2-DCE and VC, due to the masking effect of high levels of TCE. The laboratories verified and reported that analytical instru-mentation calibrations were within an acceptable range on the days of the analyses. The detection limit of the BOD analysis was higher than expected in one pre-demonstration sample (12 mg/L) due to laboratory error, but was met for the other samples. 6.4 QA/QC Summary
Given the challenges posed by the typically heterogene-ous TCE distribution in a DNAPL source zone, the col-lected data were an acceptable representation of the TCE distribution in the Launch Complex 34 aquifer before, during, and after the demonstration. • Four spatially distributed locations were sampled
within the plot to adequately capture the horizontal variability in the TCE distribution. The continuous sampling of the soil at each coring location ensured that the vertical variability of the TCE distribution
was captured. Sampling and analytical procedures were appropriately modified to address the expected variability. Standard sampling and analysis methods were used for all other measure-ments to ensure that data were comparable between sampling events.
• Accuracy and precision of the soil and groundwater measurements were generally in the acceptable range for the field sampling and laboratory analysis. In the few instances that QC data were outside the targeted range, the reason was generally interfer-ence from extremely low (near detection) or extremely high levels of TCE in the sample that caused higher deviation in the precision (repeat-ability) of the data.
• The masking effect of high TCE levels on other CVOCs and the need for sample dilution as a result caused detection limits for TCE to rise in certain instances. However, because the surrogate recov-eries were all within acceptable range, the rise in detection limits did not interfere with reporting acceptable CVOC concentrations.
• Rinsate blanks associated with the soil and ground-water samples generally had acceptably low or undetected levels of TCE.


71
7. Economic Analysis
The cost estimation for the biostimulation and bioaug-mentation technology application involves the following three major components: • Application cost of electron donor and micro-
organisms (KB-1™) at the demonstration site. These costs include material procurement and material production. Costs of the technology application at Launch Complex 34 were tracked by the technology vendor.
• Site preparation and waste disposal costs, which were incurred by the owner.
• Site characterization and performance assessment costs. Battelle estimated these costs based on the site characterization and performance assessment that was generally based on U.S. EPA’s SITE Program guidelines.
An economic analysis for an innovative technology gen-erally is based on a comparison of the cost of the inno-vative technology with a conventional alternative. In this section, the economic analysis involves a comparison of the bioaugmentation treatment cost with the cost of a conventional pump-and-treat system. 7.1 Treatment Technology
Costs
The costs of the biostimulation and bioaugmentation treatment technology were tracked and reported by the vendor. Table 7-1 summarizes the cost breakdown for the treatment. The total cost of the demonstration incurred by the vendor was approximately $370,000. This total includes the design, microcosm laboratory studies, baseline characterization, biostimulation and bioaugmentation processes, process monitoring, and reporting costs incurred by the vendor. The total does not include the costs of either waste disposal by the site owner National Aeronautics and Space Administration (NASA), or site characterization, which was conducted by other organizations (Remedial Investigation/Feasibil-ity Study [RI/FS] by NASA, preliminary characterization by Westinghouse Savannah River Company, and detailed characterization by Battelle).
Table 7-1. Biostimulation and Bioaugmentation Process Treatment Cost Summary Provided by Vendor
Cost Item Actual Cost
($) Percentage
(%)
Design and submittals 24,714 6
Microcosm Lab Studies 10,000 3
Baseline Characterization 23,510 6
Design and Construction of Treatment System
108,403 28
Biostimulation processes 82,293 21
Bioaugmentation processes 12,752 3
Performance monitoring and post-treatment characterization
82,293 21
Data evaluation and reporting 25,000 6
Subtotal 370,226 93
Site preparation and waste disposal(a) 25,000 6
Total Cost 392,226 100 (a) Costs incurred by the site owner. Source: GeoSyntec, 2004. 7.2 Site Preparation and Waste
Disposal Costs
Actual costs incurred by the site owner, NASA, for site preparation and waste disposal can be estimated based on the support received from the site owner. NASA had prepared and cleared the site for the technology demonstration. This includes removal of tiles inside the Engineering Support Building, surveying of the plot boundaries, establishment of utilities (water and elec-tricity for the system operation), and disposal of waste generated during the site preparation and performance monitoring. Although waste generation was minimal for this demonstration due to use of the nonintrusive direct-push rig and the nature of the in situ technology, minimal waste was contained and stored for proper disposal by NASA. The total cost for all these activities was esti-mated at approximately $25,000 (Table 7-1).

72
7.3 Site Characterization and Performance Assessment Costs
This section describes two categories of costs: • Site characterization costs. These are the costs
that a site would incur in an effort to bridge the gap between the general site information in an RI/FS or RFI report and the more detailed information required for DNAPL source delineation and remedi-ation technology design. This cost component is perhaps the most reflective of the type of costs incurred when a site of the size and geology of Launch Complex 34 undergoes site characteriza-tion in preparation for remediation. Presuming that groundwater monitoring and plume delineation at a site indicates the presence of DNAPL, these site characterization costs are incurred in an effort to define the boundaries of the DNAPL source zone, obtain an order-of-magnitude estimate of the DNAPL mass present, and define the local hydro-geology and geochemistry of the DNAPL source zone.
• Performance assessment costs. These are primarily demonstration-related costs. Most of these costs were incurred in an effort to further delineate the portion of the DNAPL source con-tained in the Engineering Support Building and the treatment plot and determine the TCE-DNAPL mass reduction achieved by the biostimulation and bioaugmentation treatment processes. Only a fraction of these costs would be incurred during full-scale deployment of this technology; depending on the site-specific regulatory requirements, only the costs related to determining compliance with cleanup criteria would be incurred in a full-scale deployment.
Table 7-2 summarizes the costs incurred by Battelle for the February 1999 site characterization at Launch Com-plex 34. The February 1999 site characterization event was a suitable combination of soil coring and ground-water sampling and analysis for organics and inorganics, and hydraulic testing (water levels and slug tests) that may be expected to bridge the gap between the RI/FS or RFI data usually available at a site and the typical data needs for DNAPL source delineation and remediation design. Table 7-3 summarizes performance assessment costs incurred by Battelle for the biostimulation and bioaug-mentation technology demonstration.
Table 7-2. Estimated Site Characterization Costs
Activity Cost Site Characterization Work Plan
• Additional characterization to delineate DNAPL source
• Collect hydrogeologic and geochemical data for technology design
$25,000
Site Characterization • Drilling – soil coring and well installation
(12 continuous soil cores to 45 ft bgs; installation of 24 monitoring wells)
• Soil and groundwater sampling (36 monitoring wells; 300 soil samples collection and field extraction)
• Laboratory analysis (organic and inorganic analysis)
• Field measurements (water quality; hydraulic testing)
$160,000
Data Analysis and Site Characterization Report $65,000Total $ 250,000
Table 7-3. Estimated Performance Assessment Costs
Activity Cost Pre-Demonstration Assessment
• Drilling – 7 continuous soil cores; installation of 7 monitoring wells
• Soil and groundwater sampling for TCE-DNAPL boundary and mass estimation (9 monitoring wells; collection and field extraction of 80 soil samples)
• Laboratory analysis (organic and inorganic analysis)• Field measurements (water quality; hydraulic
testing)
$100,000
Demonstration Assessment • Groundwater sampling (monitoring wells in and
around the bioaugmentation plot) • Laboratory analysis (organic and inorganic analysis)• Field measurements (water quality; hydraulic
testing; bioaugmentation plot and perimeter wells)
$50,000
Post-Demonstration Assessment • Drilling – 6 continuous soil cores (4 soil cores for
every 2-ft interval from the water table to the above semi-confining layer; 2 soil cores for every 1-ft interval in the Upper Sand Unit [the target treatment depths; approximately 110 soil core samples)
• Soil and groundwater sampling (9 monitoring wells; collection and field extraction of 160 soil samples – approximately 80 from the intermediate soil coring event, and 80 from the post-demonstration characterization)
• Laboratory analysis (organic and inorganic analysis)• Field measurements (water quality; hydraulic
testing)
$100,000
Total $250,000

73
7.4 Present Value Analysis of Biostimulation and Bioaugmentation Treatment Technology and Pump-and-Treat System Costs
DNAPL, especially of the magnitude present at Launch Complex 34, is likely to persist in the aquifer for several decades or centuries. The resulting groundwater con-tamination and plume also will persist for several dec-ades. The conventional approach to this type of contami-nation has been the use of pump-and-treat systems that extract and treat the groundwater above ground. This conventional technology is basically a plume control technology and would have to be implemented as long as groundwater contamination exists. The biostimulation and bioaugmentation treatment process is an innovative in situ technology that may be comparable to the conventional pump-and-treat approach. The economic analysis therefore compares the costs of these two alternatives. Because a pump-and-treat system would have to be operated for the next several decades, the life-cycle cost of this long-term treatment has to be calculated and compared with the cost of the biostimulation and bio-augmentation treatment technology, a short-term treat-ment. The present value (PV) of a long-term pump-and-treat application is calculated as described in Appen-dix G. The PV analysis is conducted over a 30-year period, as is typical for long-term remediation programs at Superfund sites. Site characterization and perform-ance (compliance) assessment costs are assumed to be the same for both alternatives and are not included in this analysis. For the purpose of comparison, it is assumed that a pump-and-treat system would have to treat the plume emanating from a DNAPL source. However, the demon-stration was limited to a plot that was 20 ft wide × 20 ft long × 20 ft deep. For a more realistic cost comparison, the remediation site is assumed to be spatially twice as big (40 ft wide × 40 ft long × 20 ft deep). Recent research (Pankow and Cherry, 1996) indicates that the most effi-cient pump-and-treat system for source containment would capture all the groundwater flowing through the DNAPL source region. For the 40-ft-long × 40-ft-wide × 20-ft-deep (Upper Sand Unit) DNAPL source region at Launch Complex 34, a single extraction well pumping at 2 gpm is assumed to be sufficient to contain the source in an aquifer where the hydraulic gradient (and therefore, the groundwater flow velocity) is extremely low. This type of minimal containment pumping ensures that the source
is contained without needing to extract and treat ground-water from cleaner surrounding regions, as would be the case in more aggressive conventional pump-and-treat systems. The extracted groundwater is treated with an air stripper, polishing carbon (liquid phase), and a cata-lytic oxidation unit (for air effluent). As shown in Tables G-1 and G-2 of Appendix G, the total capital investment for an equivalent pump-and-treat system would be approximately $161,000, and would be followed by an annual operation and maintenance (O&M) cost of $57,000 (including quarterly monitoring). Periodic maintenance requirements (replacements of pumps, etc.) would raise the O&M cost every five years to $70,000 and every 10 years to $99,000. A discount rate (real rate of return) of 2.9%, based on the current recommendation for government projects, was used to calculate the PV. The PV of the pump-and-treat costs over 30 years is estimated to be $1,393,000. An equivalent treatment cost for full-scale deployment of the combination of the biostimulation and bioaugmenta-tion treatment processes in a source area approximately the same size as the one for the pump-and-treat system would be at least $500,000. This estimate is based on a total biostimulation and bioaugmentation process treat-ment ($392,000 [see Table 7-1] incurred for the dem-onstration). The assumed dimension to be treated is approximately twice the size of the current demonstra-tion plot. An equal number (8) of injection wells could be used for the injection, and twice as much of the electron donor and KB-1™ could be used in the source treatment, although two additional volumes of waste would be generated. Additional costs of approximately $110,000 would be necessary for the additional electron donor for the biostimulation and KB-1™ for the bioaug-mentation ($82,000 times two), and waste disposal cost ($25,000 times two) based on the demonstration cost in Table 7-1. Therefore, if the TCE remaining after the bio-stimulation and bioaugmentation treatment was allowed to attenuate naturally, the total treatment cost with the biostimulation and bioaugmentation technology would be approximately $500,000. One major assumption is that the DNAPL source has been substantially removed after the first application of biostimulation and bioaugmenta-tion. At least at the Launch Complex 34 site, the per-formance assessment indicated that this was the case. If multiple biostimulation or bioaugmenation treatments are required, the total costs could be higher. Another assumption is that the full-scale deployment of the bio-stimulation and bioaugmentation treatment processes would entail design, equipment, and deployment similar to that done during the demonstration.

74
Therefore, the biostimulation and bioaugmentation treat-ment technology costs less than an equivalent pump-and-treat system, when the aquifer environment is right. An investment in the biostimulation and bioaugmentation treatment has a lower PV than the long-term investment in a pump-and-treat system. The up-front capital invest-ment incurred for the biostimulation and bioaugmentation process may by recovered after the seventh year (see Table G-3 in Appendix G), when the PV of the pump-and-treat system surpasses the cost of the biostimula-tion and bioaugmentation treatment. In addition to a lower PV or life-cycle cost, there may be other tangible and intangible economic benefits to using a source remediation technology. For example, the eco-nomic analysis in Appendix G assumes that the pump-and-treat system is operational at all times over the next 30 years or more, with most of the annual expense associated with operation and routine (scheduled) main-tenance. Experience with pump-and-treat systems at several sites has shown that downtime associated with
pump-and-treat systems is fairly high (as much as 50% downtime reported from some sites). This may nega-tively impact both maintenance requirements (tangible cost) and the integrity of plume containment (intangible cost) with the pump-and-treat alternative. Another factor to consider is that although the economic analysis for long-term remediation programs typically is conducted for a 30-year period, the DNAPL source and therefore the pump-and-treat requirement may persist for many more years or decades. This situation would lead to concomitantly higher remediation costs for the pump-and-treat or plume containment option (without source removal). As seen in Appendix G, the PV of a pump-and-treat system operated for 100 years would be $2,179,000. Even if the DNAPL source is only partially removed by the biostimulation and bioaugmentation treatment, and natural attenuation is insufficient to meet downgradient cleanup goals, it is anticipated that the reduced DNAPL source leads to a reduction in the size and timeframe for a pump-and-treat system.

75
8. Technology Applications Analysis
This section evaluates the general applicability of the biostimulation and bioaugmentation technology to sites with contaminated groundwater and soil. The analysis is based on the results and lessons learned from the dem-onstration, as well as general information available about the technology and its application at other sites. 8.1 Objectives
This section evaluates the biostimulation and bioaug-mentation technology against the nine evaluation criteria used for detailed analysis of remedial alternatives in feasi-bility studies under the Comprehensive Environmental Response, Compensation, and Liability Act (CERCLA). Much of the discussion in this section applies to DNAPL source removal in general and the biostimulation and bioaugmentation technology in particular. 8.1.1 Overall Protection of Human Health
and the Environment
Biostimulation and bioaugmentation treatment is protec-tive of human health and the environment in both the short and long term. Because DNAPL acts as a second-ary source that can contaminate an aquifer for decades or centuries, DNAPL source removal or mitigation con-siderably reduces the duration over which the source is active. Even if DNAPL mass removal is not 100%, the resulting long-term weakening of the plume and the reduced duration over which the DNAPL source con-tributes to the plume reduces the threat to potential receptors.
8.1.2 Compliance with ARARs
This section describes the technology performance ver-sus applicable or relevant and appropriate requirements (ARARs). Compliance with location-, action-, and chemical-specific ARARs should be determined on a site-specific basis. Location-specific ARARs may apply during a remediation project if the technology has the potential to affect resources in and around the site
location. Examples of resources that fall under location-specific ARARs include cultural resources, biological resources, flood plains and wetlands, hydrologic resources, and critical habitat. In general, the design of the biostimulation and bioaugmentation technology is flexible enough that location-specific ARARs could be met. Action-specific ARARs correspond to waste discharge requirements associated with the technology, such as discharging to the air or hazardous waste generation, management, and disposal. In general, action-specific ARARs could be met with the biostimulation and bioaug-mentation technology. One advantage of the biostimu-lation and bioaugmentation technology is the potential for the electron donor to be injected without the accom-panying recirculating groundwater system. The recircu-lating system produces groundwater that must be treated prior to reinjection according to the requirements of RCRA 3020(b). Further testing of the biostimulation and bioaugmentation technology is necessary to opti-mize injection strategies in the absence of a recirculating groundwater system. Chemical-specific ARARs are generally health- or risk-based numerical values or methodologies applied to site-specific conditions that result in the establishment of a cleanup level. Compliance with chemical-specific ARARs depends on the efficiency of the biostimulation and bioaugmentation process at the site and the cleanup goals agreed on by various stakeholders. In general, reasonable DNAPL mass removal goals are more achiev-able and should lead to eventual and earlier compliance with long-term groundwater cleanup goals. Achieving short-term groundwater cleanup goals (e.g., federal or state maximum contaminant levels [MCLs]), especially in the DNAPL source zone, is more difficult because vari-ous studies (Pankow and Cherry, 1996) have shown that almost 100% DNAPL mass removal may be required before a significant change in groundwater concentra-tions is observed. However, removal of DNAPL, even if most of the removal takes place from the more accessi-ble pores, probably would result in a weakened plume

76
that may allow risk-based cleanup goals to be met in the downgradient aquifer. The specific federal environmental regulations that are potentially impacted by remediation of a DNAPL source with the biostimulation and bioaugmentation technology are described below. 8.1.2.1 Comprehensive Environmental
Response, Compensation, and Liability Act
CERCLA, as amended by the Superfund Amendment and Reauthorization Act (SARA), provides for federal authority to respond to releases or potential releases of any hazardous substance into the environment, as well as to releases of pollutants or contaminants that may present an imminent or significant danger to public health and welfare or the environment. Remedial alter-natives that significantly reduce the volume, toxicity, or mobility of hazardous materials and that provide long-term protection are preferred. Selected remedies also must be cost-effective and protective of human health and the environment. The biostimulation and bioaug-mentation technology meets several of these criteria relating to a preferred alternative. Biostimulation and bioaugmentation reduces the toxicity of chlorinated contaminants by converting them into potentially non-toxic forms. For example, at Launch Complex 34, as described in Section 5.3.1, increases in ethene and chloride concentrations in groundwater collected during post-demonstration characterization indicate that some portion of the TCE was converted into nontoxic forms by the biostimulation and bioaugmentation treatment. This elimination of solvent hazard is permanent and leads to a considerable reduction in the time it takes for the DNAPL source to deplete fully. Although aquifer hetero-geneities and technology limitations often result in less than 100% (complete) removal of the contaminant and elevated levels of dissolved solvent may persist in the groundwater over the short term, there is faster and eventual elimination of groundwater contamination in the long term. Section 7.4 shows that biostimulation and bio-augmentation technology is cost-effective compared with the conventional alternative of long-term pump and treat. 8.1.2.2 Resource Conservation
and Recovery Act
RCRA, as amended by the Hazardous and Solid Waste Amendments (HSWA) of 1984, regulates management and disposal of municipal and industrial solid wastes. The U.S. EPA and RCRA-authorized states (listed in 40 CFR Part 272) implement and enforce RCRA and state regulations. Generally, RCRA does not apply to in situ groundwater treatment because the contaminated groundwater may not be considered hazardous waste
while it is still in the aquifer. The contaminated ground-water becomes regulated if it is extracted from the ground, as would happen with the conventional alterna-tive of pump and treat. At Launch Complex 34, the recirculation system used to enable hydraulic control of the test plot and enhance the distribution of electron donor and KB-1™ made it necessary to treat the extracted groundwater prior to reinjection. However, the carbon units being used to treat groundwater extracted from the treatment plot were removed from the system approximately two months before the electron donor addition because of severe biofouling in the carbon units. Compliance with RCRA regulations would need to be evaluated at similar sites, and under similar circum-stances, if RCRA were to be invoked as an ARAR. 8.1.2.3 Clean Water Act
The CWA is designed to restore and maintain the chem-ical, physical, and biological quality of navigable surface waters by establishing federal, state, and local discharge standards. The CWA may apply if groundwater extrac-tion is conducted in conjunction with biostimulation and bioaugmentation, and the resulting water stream needs to be treated and discharged to a surface water body or a publicly owned treatment works (POTW). On-site dis-charges to a surface water body must meet National Pollutant Discharge Elimination System (NPDES) require-ments; consequently, an NPDES permit may be needed under the NPDES requirements. Off-site discharges to a surface water body must meet NPDES limits and require an NPDES permit. Discharge to a POTW, even if it is through an on-site sewer, is considered an off-site activ-ity and requires an NPDES permit. Sometimes, soil or groundwater monitoring may lead to small amounts of purge and decontamination water wastes that may be subject to CWA requirements. Micropurging was one measure implemented at Launch Complex 34 to mini-mize such wastes during site characterization and tech-nology performance assessment. 8.1.2.4 Safe Drinking Water Act
The SDWA, as amended in 1986, requires U.S. EPA to establish regulations to protect human health from con-taminants in drinking water. The legislation authorizes national drinking water standards and a joint federal-state system for ensuring compliance with these stand-ards. The SDWA also regulates underground injection of fluids through the UIC Program and includes sole-source aquifer and wellhead protection programs. A UIC variance was obtained from FDEP to inject the electron donor and KB-1™ culture into the aquifer during this demonstration. The National Primary Drinking Water Standards are found at 40 CFR Parts 141 through 149. The health-based SDWA primary standards (e.g., MCLs) are the most

77
critical to meet; SDWA secondary standards (e.g., for iron, chloride, or TDS) are based on other factors, such as aesthetics (discoloration) or odor. The MCLs based on these standards generally apply as cleanup stand-ards for water that is, or potentially could be, used for a drinking water supply. In some cases, such as when multiple contaminants are present, alternate concentra-tion limits (ACLs) may be used. CERCLA and RCRA standards and guidance are used in establishing ACLs. In addition, some states may set more stringent stand-ards for specific contaminants. For example, the feder-ally mandated MCL for VC is 2 µg/L, whereas the State of Florida drinking water standard is 1 µg/L. In such instances, the more stringent standard is usually the cleanup goal. Although the long-term goal of DNAPL source zone treatment is to meet applicable drinking water standards or other risk-based groundwater cleanup goals agreed on between site owners and regulatory authorities, the short-term objective of a source remediation technology such as biostimulation and bioaugmentation is to remove DNAPL mass. Because technology, site, and economic limitations may limit DNAPL mass removal to less than 100%, it may not always be possible to meet ground-water cleanup targets in the source region in the short term. Depending on other factors, such as the distance of the compliance point (e.g., property boundary, at which groundwater cleanup targets have to be met) from the source (as negotiated between the site owner and regulators), the degree of weakening of the plume due to DNAPL source treatment, and the degree of natural attenuation in the aquifer, it may be possible to meet groundwater cleanup targets at the compliance point in the short term. DNAPL mass removal will always lead to faster attainment of groundwater cleanup goals in the long term, as compared to the condition in which no source removal action is taken. 8.1.2.5 Clean Air Act
The CAA and the 1990 amendments establish primary and secondary ambient air quality standards for protec-tion of public health, as well as emission limitations for certain hazardous pollutants. Permitting requirements under CAA are administered by each state as part of State Implementation Plans (SIPs) developed to bring each state in compliance with National Ambient Air Qual-ity Standards (NAAQS). Unlike pump-and-treat systems, which often generate air emissions (when an air stripper is used), and unlike other source removal technologies that use thermal energy (e.g., steam injection or resistive heating) or result in exo-thermic reactions (e.g., oxidation with Fenton’s reagent),
the potential for atmospheric releases is absent when using biostimulation and bioaugmentation. 8.1.2.6 Occupational Safety and
Health Administration
CERCLA remedial actions and RCRA corrective actions must be carried out in accordance with OSHA require-ments detailed in 20 CFR Parts 1900 through 1926, especially Part 1910.120, which provide for the health and safety of workers at hazardous waste sites. On-site construction activities at Superfund or RCRA corrective action sites must be performed in accordance with Part 1926 of RCRA, which provides safety and health regu-lations for construction sites. State OSHA requirements, which may be significantly stricter than federal stand-ards, also must be met. The health and safety aspects of biostimulation and bio-augmentation are minimal. The main working hazards encountered during the demonstration were operating heavy equipment (e.g., drill rig) and handling the electron donor and KB-1™ mixture. These hazards were dealt with by using trained personnel and appropriate personal pro-tective equipment. Level D personal protective equip-ment generally was sufficient during implementation. All operating and sampling personnel were required to have completed the 40-hour Hazardous Waste Operations training course and 8-hour refresher courses. 8.1.3 Long-Term Effectiveness
The biostimulation and bioaugmentation technology leads to removal of TCE-DNAPL mass and therefore perma-nent removal of contamination from the aquifer. Although dissolved solvent concentrations may rebound in the short term when groundwater flow redistributes through the treated source zone containing DNAPL remnants, depletion of the source through dissolution will continue in the long term, and will lead to eventual and earlier compliance with groundwater cleanup goals. 8.1.4 Reduction of Toxicity, Mobility, or
Volume through Treatment
The biostimulation and bioaugmentation technology affects treatment by reducing the volume and toxicity of contamination through the dehalogenation process, which results in potentially nontoxic compounds such as chlo-ride, ethene, or ethane. Multiple injections of electron donor may be necessary to bring about complete dehalo-genation and prevent accumulation of degradation byproducts, such as VC. The mobility of the contaminant is not affected by the biostimulation and bioaugmenta-tion treatment.

78
8.1.5 Short-Term Effectiveness
The short-term effectiveness of the biostimulation and bioaugmentation technology depends on a number of factors. If the short-term goal is to remove as much DNAPL mass as possible, this goal can be achieved. If the short-term goal is to reduce dissolved contaminant levels in the source zone, achievement of this goal will depend on the hydrogeology and DNAPL distribution in the treated region. As seen in Section 5.2.1, TCE levels declined sharply in some monitoring wells and in some multilevel chamber wells. Geologic heterogeneities, pref-erential flowpaths, and localized permeability changes that determine flow in the treated region may lead to such variability in post-treatment groundwater levels of contamination. As discussed in Section 8.1.2.4, the chances of DNAPL mass removal resulting in reduced contaminant levels at a compliance point downgradient from the source is more likely in the short term. In the long term, DNAPL mass removal will always shorten the time period required to bring the entire affected aquifer in compliance with applicable standards. If necessary, multiple injections of electron donor may be needed to promote complete dehalogenation to ethane or ethene and prevent the accumulation of degradation byproducts, such as VC. 8.1.6 Implementability
The implementability criterion addresses the technical and administrative feasibility of implementing the bio-stimulation and bioaugmentation technology and the availability of various services and materials required during its implementation. The technical feasibility of implementing the technology is based on factors such as construction and operation, reliability of the technology, the ease of undertaking additional remedial action, and monitoring considerations. For the biostimulation and bioaugmentation technology, constructing and operating the equipment associated with the recirculating system is fairly straightforward in theory. Technical difficulties that may be encountered include problems with biofouling and predicting the influence of the microbial community. Most likely, these technical difficulties can be overcome with advance planning and careful monitoring and without seriously affecting the reliability of the technology. The administrative feasibility of implementing the bio-stimulation and bioaugmentation technology at Launch Complex 34 was straightforward. A site-specific UIC variance was obtained by the vendor from FDEP to inject the electron donor. Because the Engineering
Support Building at Launch Complex 34 was abandoned and in a remote location, the site was accessible for the equipment and supplies needed to conduct the demon-stration without interfering with the surrounding commun-ity. Adequate storage capacity and disposal services for the waste generated during well installation, soil sam-pling, and groundwater sampling also were available at the Engineering Support Building. The electron donor was commercially available through various vendors. The KB-1™ culture is not readily available from a wide variety of vendors, and may require special transport and handling procedures. At Launch Complex 34, aboveground wastes were gen-erated during the demonstration due to the hydraulic controls required to contain the plot. The groundwater extracted from the plot required treatment before being reinjected into the aquifer. Although the groundwater was treated using a common, commercially available technology (i.e., granular activated carbon), the com-plexity of the operation increased to some degree as a result. 8.1.7 Cost
As described in Section 7.4, the cost of the biostimula-tion and bioaugmentation treatment is competitive with the life-cycle cost of traditional pump-and-treat technolo-gies (over a 30-year period of comparison). The cost comparison becomes even more favorable for source remediation in general and biostimulation and bioaug-mentation in particular when other tangible and intangi-ble factors are taken into account. For example, a DNAPL source, such as the one at Launch Complex 34, is likely to persist much longer than 30 years (the normal evalu-ation time for long-term remedies), thus necessitating continued costs for pump and treat into the distant future (perhaps 100 years or more). Annual O&M costs also do not take into account the nonroutine maintenance costs associated with the large amount of downtime typically experienced by site owners with pump-and-treat systems. Factors that may increase the cost of the biostimulation and bioaugmentation application are: • Operating requirements associated with any
contamination under a building
• Need for additional hydraulic control (e.g., with extraction wells) and any associated need to treat and dispose/reinject extracted fluids.
• Need for a special strain of microorganisms capable of surviving in the presence of DNAPL.

79
8.1.8 State (Support Agency) Acceptance
Because of the technical limitations and costs of conven-tional approaches to DNAPL remediation, state environ-mental agencies (or support agencies in the case of State-led sites) have shown growing acceptance of innovative technologies. The demonstration at Launch Complex 34 provided evidence that biostimulation and bioaugmentation may be effective in the reductive dehalo-genation of chlorinated solvents. 8.1.9 Community Acceptance
The biostimulation and bioaugmentation technology’s low profile, limited space requirements, absence of air emissions, absence of waste storage, handling, and off-site transportation requirements, low noise levels, and ability to reduce short- and long-term risks posed by DNAPL contamination are expected to promote local community acceptance. 8.2 Operability
Unlike a pump-and-treat system that may involve contin-uous long-term operation by trained operators for the next 30 or 100 years, a source remediation technology is a short-term application. The field application of bioaug-mentation in the 20-ft × 20-ft plot at Launch Complex 34 only took a few months to complete. The remediation generally is done as a turnkey project by multiple ven-dors, who will design, build, and operate the bioaugmen-tation system. Site characterization, site preparation (utilities, etc.), monitoring, and any waste disposal often are conducted by the site owner. Other factors affecting the operability of the biostimula-tion and bioaugmenation technology include the com-mercial availability of the supplies and the availability of the necessary equipment and specialists. The KB-1™ culture is available from a small number of commercial vendors. The electron donor is widely available commer-cially. Handling of the electron donor and KB-1™ culture requires minimal health and safety measures. Although the use of bioremediation in the reductive dechlorination of solvents has been known for many years, adding a microorganism capable of thriving in the presence of DNAPL in an aquifer is a new application. 8.3 Applicable Wastes
The biostimulation and bioaugmentation technology was designed for remediation of aquifers contaminated with
chlorinated solvents. Source zones consisting of PCE and TCE in DNAPL form, as well as dissolved cis-1,2-DCE and VC, can be addressed. The biostimulation and bio-augmentation technology can be implemented in source zones present in saturated conditions, but may not be effective in the vadose zone because of the anaerobic conditions required by the microorganisms. 8.4 Key Features
The following are some of the key features of biostimula-tion and bioaugmentation that make the technology attrac-tive for DNAPL source zone and groundwater treatment: • In situ application
• Potential for injection-only mode at some sites that prevents the generation of aboveground wastes, which would require additional treatment or handling
• Potentially nontoxic byproducts
• Relatively fast field application time
• Electron donor and microorganisms are distributed in the aquifer through both advection and diffusion, thus achieving better contact with contaminants
• At many sites, a one-time application has the poten-tial to reduce a DNAPL source to the point where either natural attenuation is sufficient to address a weakened plume or pump and treat can be applied over a shorter duration in the future.
8.5 Availability/Transportability
The electron donor used to biostimulate the natural aqui-fer conditions is available commercially from a variety of vendors. The KB-1™ culture is available commercially but from a limited number of vendors. The KB-1™ culture was transported in a stainless steel culture vessel and pres-surized with an inert gas to maintain strict anaerobic conditions. 8.6 Materials Handling Requirements
The electron donor did not require any special handling. The KB-1™ microbial consortium requires strict anaero-bic conditions, and must be handled carefully so as not to introduce oxygen into the system. 8.7 Ranges of Suitable
Site Characteristics
The following factors should be considered when deter-mining the suitability of a site for the biostimulation and

80
bioaugmentation application. None of these factors necessarily eliminate the technology from consideration. Rather, these are factors that may make the application less or more economical: • Type of contaminants. Contaminants should be
amenable to reductive dehalogenation. The types of contaminants most suited for this technology are chlorinated hydrocarbons.
• Site geology. The electron donor and KB-1™ culture can be distributed more effectively in sandy soils. Silts or clays can make the application more difficult. Aquifer heterogeneities and preferential flowpaths may make it difficult to evenly distribute the electron donor and KB-1™ culture. DNAPL source zones in fractured bedrock also may pose a challenge.
• Regulatory acceptance. Regulatory acceptance is important for this application because of the rela-tively new application of bioremediation for DNAPL source zone treatment. In addition, a UIC permit or variance may be required. Hydraulic control require-ments and economics at some sites may necessi-tate extraction, treatment, and reinjection of the groundwater. A reinjection permit will be required.
• Site accessibility. Sites that have no aboveground structures and fewer utilities are easier to remediate with biostimulation and bioaugmentation. The presence of buildings or a network of utilities can make the application more difficult because of the need for injection wells.
8.8 Limitations
The biostimulation and bioaugmentation technology has the following limitations:
• Not all types of contaminants are amenable to reductive transformation.
• Currently, the KB-1™ culture is not widely available commercially and requires special handling to maintain a strict anaerobic environment.
• Byproducts of reduction may make biostimulation and bioaugmentation unsuitable for application in a region very close to a receptor. Certain byproducts (such as chloride) are subject to secondary, nonhealth-based drinking water standards, and require sufficient time and distance to dissipate.
• Aquifer heterogeneities can make the application of biostimulation and bioaugmentation more difficult, necessitating more complex application schemes, greater amounts of electron donor, longer injection times, and/or multiple injections. The treatment may not be suitable in tight aquifer materials, such as clay or silt.
• At some sites, multiple injections of electron donor or KB-1™ culture may be necessary to prevent the accumulation of degradation products, such as VC.
• Some sites may require greater hydraulic control to minimize the spread of contaminants. This may necessitate the use of extraction, aboveground treatment, and disposal/reinjection of groundwater.
• Biofouling may be an issue in both the injection wells and the aboveground system used to treat extracted groundwater, if applicable.

81
9. References
Battelle. 1999a. Hydrogeologic and Chemical Data Com-pilation, Interagency DNAPL Consortium Remedi-ation Demonstration Project, Launch Complex 34, Cape Canaveral Air Station, Florida. Prepared for Interagency DNAPL Consortium.
Battelle. 1999b. Interim Report: Performance Assess-ment Site Characterization for the Interagency DNAPL Consortium, Launch Complex 34, Cape Canaveral Air Station, Florida. Prepared for Inter-agency DNAPL Consortium.
Battelle. 1999c. Pre-Demonstration Assessment of the Treatment Plots at Launch Complex 34, Cape Canaveral, Florida. Prepared for Air Force Research Laboratory and Interagency DNAPL Consortium. September 13.
Battelle. 1999d. Performance Assessment Site Charac-terization for the Interagency DNAPL Consortium, Launch Complex 34, Cape Canaveral Air Station, Florida. Prepared for the Air Force Research Laboratory, United States Air Force, Tyndall AFB, Florida. July 20.
Battelle. 2001. Seventh Interim Report on the IDC Dem-onstration at Launch Complex 34, Cape Canaveral Air Station. Prepared for the Interagency DNAPL Consortium. August 15.
Battelle. 2002a. Quality Assurance Project Plan: Per-formance Evaluation of Biodegradation of Dense Non-Aqueous Phase Liquids Through Bioaugmen-tation at Launch Complex 34, Cape Canaveral, Florida. Prepared for U.S. EPA Superfund Inno-vative Technology Evaluation Program. June 14.
Battelle. 2002b. Draft Final Innovative Evaluation Report. Demonstration of Steam Injection Treatment of DNAPL Source Zone at Launch Complex 34 in Cape Canaveral Air Station, Florida. Prepared for the Interagency DNAPL Consortium, August 20.
Battelle. 2003a. Final Innovative Evaluation Report. Demonstration of Resistive Heating Treatment of
DNAPL Source Zone at Launch Complex 34 in Cape Canaveral Air Force Station, Florida. Prepared for the Interagency DNAPL Consortium. February 19.
Battelle, 2003b. Draft Final Report on Demonstration of In Situ Dehalogenation of NAPL through Injection of Emulsified Zero-Valent Iron at Launch Complex 34 in Cape Canaveral Air Force Station, FLorida. Pre-pared for U.S. EPA Superfund Innovative Technol-ogy Evaluation Program. September 17.
Eddy-Dilek, C., B. Riha, D. Jackson, and J. Consort. 1998. DNAPL Source Zone Characterization of Launch Complex 34, Cape Canaveral Air Station, Florida. Prepared for Interagency DNAPL Consor-tium by Westinghouse Savannah River Company and MSE Technology Applications, Inc.
FRTR, see Federal Remediation Technologies Round-table.
Federal Remediation Technologies Roundtable. 1998. Guide to Documenting and Managing Cost and Per-formance Information for Remediation Projects, revised. EPA/542/B-98/007. Prepared by the Mem-ber Agencies of the FRTR. October.
G&E Engineering, Inc. 1996. RCRA RFI Work Plan for Launch Complex 34, Cape Canaveral Air Station, Brevard County, Florida. Prepared for NASA Envi-ronmental Program Office.
GeoSyntec. 2002. 100% Draft Design Report Perform-ance Evaluation of Dehalogenation of Dense Non-Aqueous Phase Liquids, (DNAPLs) Using Emulsified Zero-Valent Iron Launch Complex 34, Cape Canaveral, Florida. Prepared for National Aeronau-tics and Space Administration. January.
GeoSyntec. 2003. Performance Evaluation of Dehalo-genation of Dense Non-Aqueous Phase Liquids (DNAPLs) Using Emulsified Zero-Valent Iron Launch Complex 34, Cape Canaveral, Florida. Prepared for National Aeronautics and Space Administration. March 14.

82
Geosyntec. 2004. Email from Eric Hood, GeoSyntec, to Arun Gavaskar, Battelle. January.
Isalou, M., B.E. Sleep, and S.N. Liss. 1998. “Biodegra-dation of High Concentrations of Tetrachloroethene in a Continuous Flow Column System.” Environ-mental Science and Technology, 32(22): 3579-3585.
Lee, M.D., S.A. Bledsoe, S.M. Solek, D.E. Ellis, and R.J. Buchanan. 1997. “Bioaugmentation with Anaerobic Enrichment Culture Completely Degrades Tetra-chloroethene in Column Studies.” In: B.C. Alleman and A. Leeson (eds.), In Situ and On Site Bio-remediation, Vol. 3. Battelle Press, Columbus, OH.
Major, D.W., E.E. Cox, E. Edwards, and P.W. Hare. 1995. “Intrinsic Dechlorination of Trichloroethene to Ethene in a Bedrock Aquifer.” In: R.E. Hinchee, J.T. Wilson, and D.C. Downey (eds.), Intrinsic Bioremedi-ation. Battelle Press, Columbus, OH.
Major, D.W., M.L. McMaster, E.E. Cox, E.A. Edwards, S.M. Dworatzek, E.R. Hendrickson, M.G. Starr, J.A. Payne, and L.W. Buonamici. 2002. “Field Demon-stration of Successful Bioaugmentation to Achieve Dechlorination of Tetrachloroethene to Ethene.” Environ. Sci. Technol., 36(23): 5106-5116.
Maymo-Gatell, X., J.M Gossett, and S.H. Zinder. 1997. “Dehalococcous Ethenogenes Strain 195: Ethene Production From Halogenated Aliphatics.” In: B.C. Alleman and A. Leeson (eds.), In Situ and On Site Bioremediation, Vol. 3. Battelle Press, Columbus, OH.
Pankow, J., and J. Cherry. 1996. Dense Chlorinated Sol-vents and Other DNAPLs in Groundwater: History, Behavior, and Remediation. Waterloo Press, Portland, OR.
Schmalzer, P.A., and G.A. Hinkle. 1990. Geology, Geo-hydrology and Soils of the Kennedy Space Center: A Review. NASA Kennedy Space Center, FL.
United States Environmental Protection Agency. 1996. Soil Screening Guidance: Technical Background Document. EPA/540/R-95/128. Office of Solid Waste and Emergency Response, Washington, DC.
U.S. EPA, see United States Environmental Protection Agency.
Yang, Y., and P.L. McCarty. 2000. “Biologically Enhanced Dissolution of Tetrachloroethene DNAPL.” Env. Sci. and Technol., 34(14): 2979-2984.