demonstration/validation of incremental sampling...
TRANSCRIPT
Office of the
Assistant Secretary
of the Army
(Installations and
Environment)
DoD Executive Agent
Demonstration/Validation of Incremental Sampling at
Two Diverse Military Ranges and Development
of an Incremental Sampling Tool
Diane Roote, NDCEE/CTC
The NDCEE is operated by:
Office of the
Assistant Secretary
of the Army
(Installations and
Environment)
Technology Transition – Supporting DoD Readiness, Sustainability, and the Warfighter

E2S2 - June 2010E2S2 – June 20102National Defense Center for Energy and Environment
Objectives/Goals
• Reduce uncertainty in site chemical characterization of
military ranges by:
– Demonstrating a reliable soil sampling strategy to accurately
characterize contaminant concentrations in spatially extreme and
heterogeneous conditions
– Decreasing potential for missed hot spot characterization
– Decreasing sampling costs compared to discrete sampling
• Additionally, assessment of:
– “Scoop off the top” subsampling error
– Variance among laboratory triplicates
– Two different grinding techniques in the laboratory
– Analytical results for different detectors after separation
E2S2 - June 2010E2S2 – June 20103National Defense Center for Energy and Environment
Why is Sampling Conducted
at DoD Ranges?
• Major potential problem of migration of energetic compounds off
range in aqueous solution
– Contamination of underground drinking water aquifers (MMR - range
closed by EPA)
– Contamination of surface water bodies
• Ecological risk assessments
– Eagle River Flats impact range (Ft. Richardson) closed due to water
fowl poisoning with white phosphorus
• DoD Directive 4715.11 establishes requirement for each DoD
component to assess environmental impacts of munitions use on
operational ranges
• MMRP program – For pre-9/30/2002 non-operational, non-permitted
sites under DERP
E2S2 - June 2010E2S2 – June 20104National Defense Center for Energy and Environment
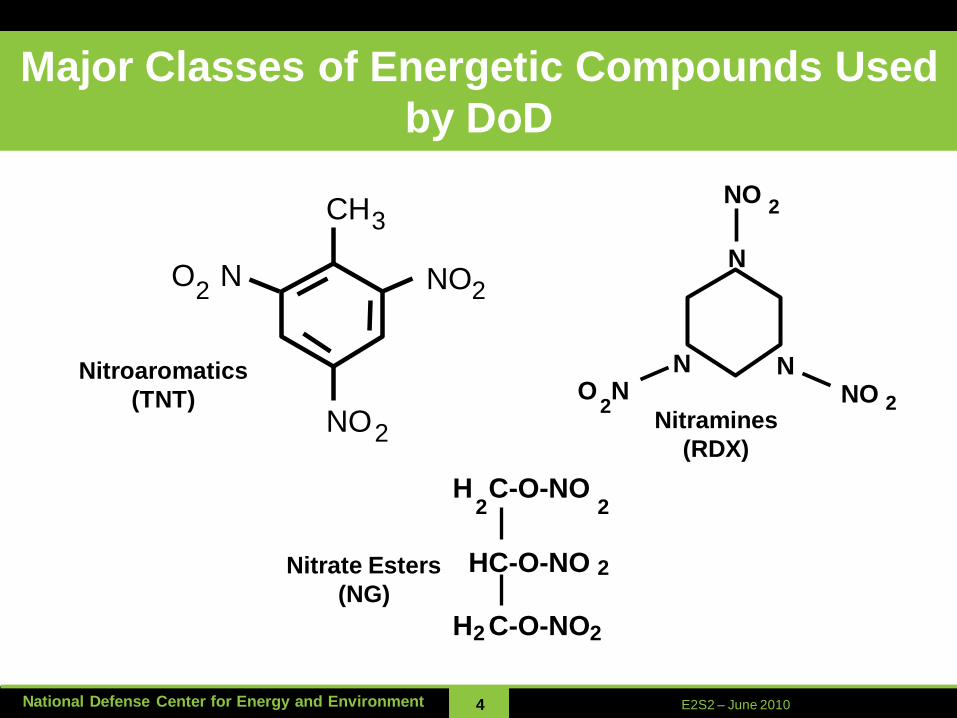
Major Classes of Energetic Compounds Used
by DoD
Nitroaromatics
(TNT)NO2
O N2
CH3
NO2
Nitramines
(RDX)
NO 2
N N
N
O N2
NO2
Nitrate Esters
(NG)
H C-O-NO
HC-O-NO
H C-O-NO
22
2 2
2
E2S2 - June 2010E2S2 – June 20105National Defense Center for Energy and Environment
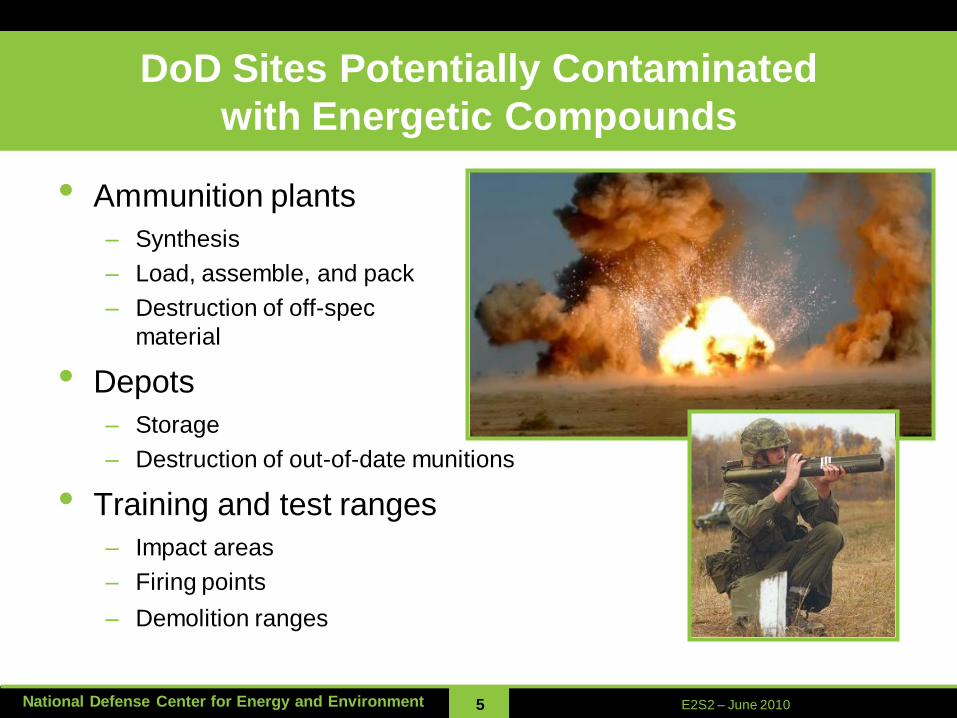
DoD Sites Potentially Contaminated
with Energetic Compounds
• Ammunition plants
– Synthesis
– Load, assemble, and pack
– Destruction of off-spec
material
• Depots
– Storage
– Destruction of out-of-date munitions
• Training and test ranges
– Impact areas
– Firing points
– Demolition ranges
E2S2 - June 2010E2S2 – June 20106National Defense Center for Energy and Environment
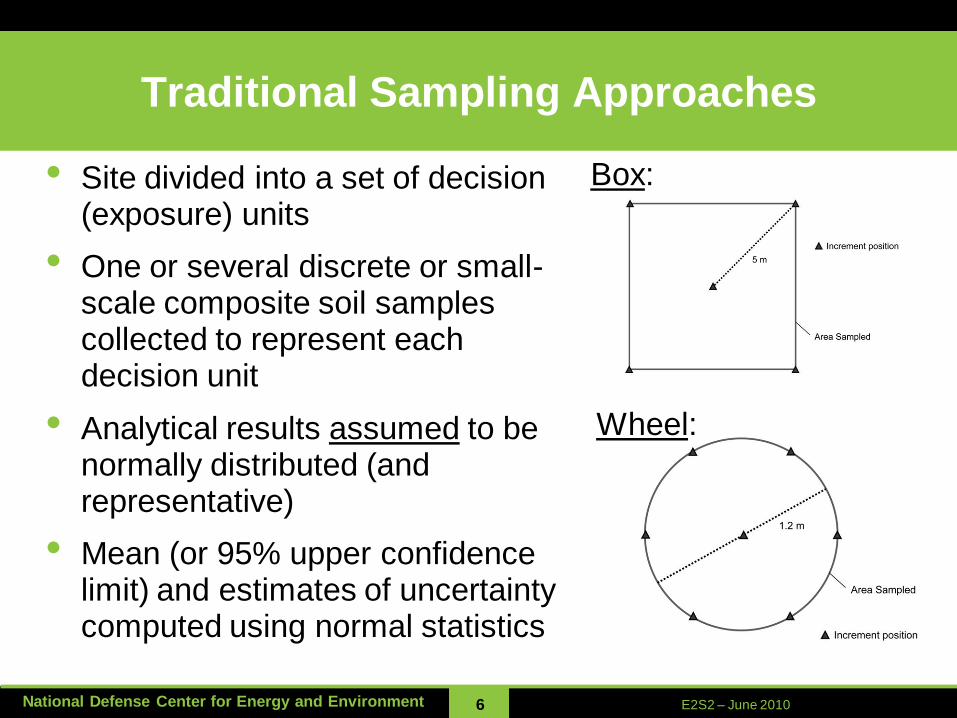
Traditional Sampling Approaches
• Site divided into a set of decision (exposure) units
• One or several discrete or small-scale composite soil samples collected to represent each decision unit
• Analytical results assumed to be normally distributed (and representative)
• Mean (or 95% upper confidence limit) and estimates of uncertainty computed using normal statistics
Box:
Wheel:

E2S2 - June 2010E2S2 – June 20107National Defense Center for Energy and Environment
Energetics Residue Deposition
Firing points - particles
and fibers of propellant
with nitroglycerin (NG)
and dinitrotoluene (DNT)
w/in nitrocellulose matrix
→
←Impact areas - particles
of explosives deposited
from low-order (partial)
detonations
E2S2 - June 2010E2S2 – June 20108National Defense Center for Energy and Environment
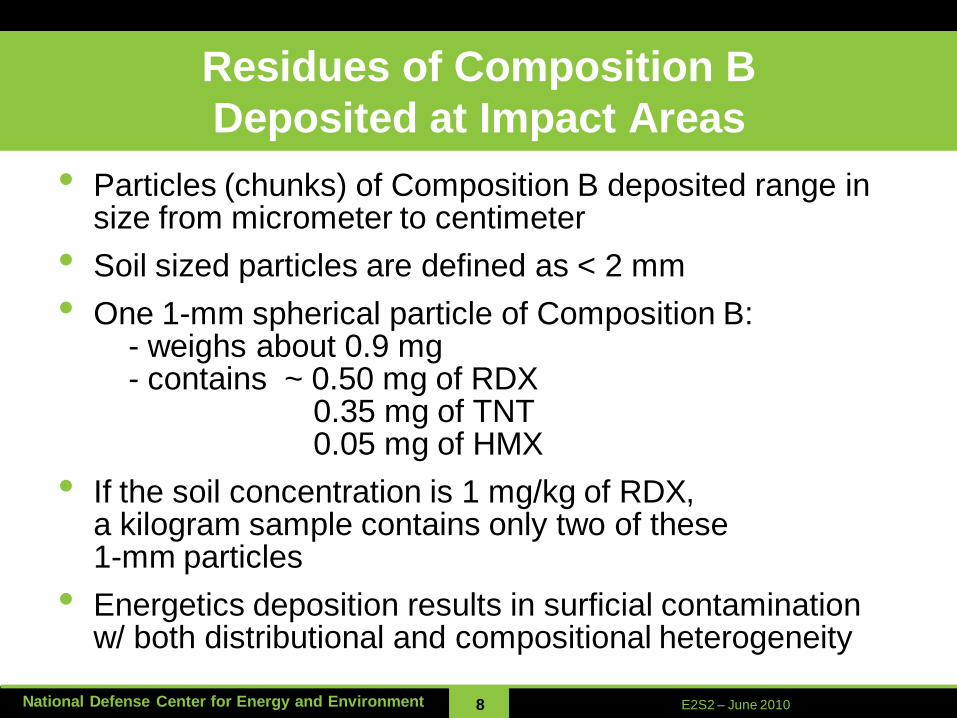
Residues of Composition B
Deposited at Impact Areas
• Particles (chunks) of Composition B deposited range in size from micrometer to centimeter
• Soil sized particles are defined as < 2 mm
• One 1-mm spherical particle of Composition B:- weighs about 0.9 mg - contains ~ 0.50 mg of RDX
0.35 mg of TNT 0.05 mg of HMX
• If the soil concentration is 1 mg/kg of RDX, a kilogram sample contains only two of these 1-mm particles
• Energetics deposition results in surficial contamination w/ both distributional and compositional heterogeneity
E2S2 - June 2010E2S2 – June 20109National Defense Center for Energy and Environment
Representativeness:Often the Missing Element in QA
• Does the sample collected and shipped to the laboratory adequately represent the exposure area?
• Does the portion of the sample that is used for extraction/digestion adequately represent the sample arriving at the laboratory?
• CRREL research on energetic compounds in soil at training ranges addressed these questions. Method 8330B including MULTI INCREMENT® sampling (MIS) field sampling protocol is the result of this research.
• This project provided an independent demonstration/validation of MIS compared to traditional field sampling protocols for energetics

E2S2 - June 2010E2S2 – June 201010National Defense Center for Energy and Environment
What is MULTI INCREMENT®
Sampling (MIS)?• Technique of combining many increments of soil from a
number of points within exposure area
• Developed by Enviro Stat (Trademarked term “MULTI
INCREMENT®”); Researched by CRREL for surface soil
sampling at ranges for energetic compounds
• Differs from typical composite in two ways:
– Number of increments (grabs) much greater (30 minimum)
– Entire area of interest (decision unit, exposure area) is
represented by each sample
• MIS theory is to mitigate single sample variability that results
from:
– discrete (single point) sampling
– composite sampling with limited increments and/or small areal
extent of coverage
E2S2 - June 2010E2S2 – June 201011National Defense Center for Energy and Environment
More on MULTI INCREMENT®
Soil Sampling
• Balance between number of increments collected, volume
of each increment, and depth of sample should result in
about 1 to 2 kg of total sample size sent to lab
• Helps address both compositional and distributional
heterogeneity
• Normalizes distribution
• This project demonstrated MIS validity compared to the
discrete, box, and wheel techniques for a single decision
unit at two diverse military ranges by assessing
reproducibility (variance) of replicates

E2S2 - June 2010E2S2 – June 201012National Defense Center for Energy and Environment
Pattern of MULTI INCREMENT® sample collection
using systematic-random sampling design

E2S2 - June 2010E2S2 – June 201013National Defense Center for Energy and Environment
Tools for MULTI INCREMENT® Sampling
E2S2 - June 2010E2S2 – June 201014National Defense Center for Energy and Environment
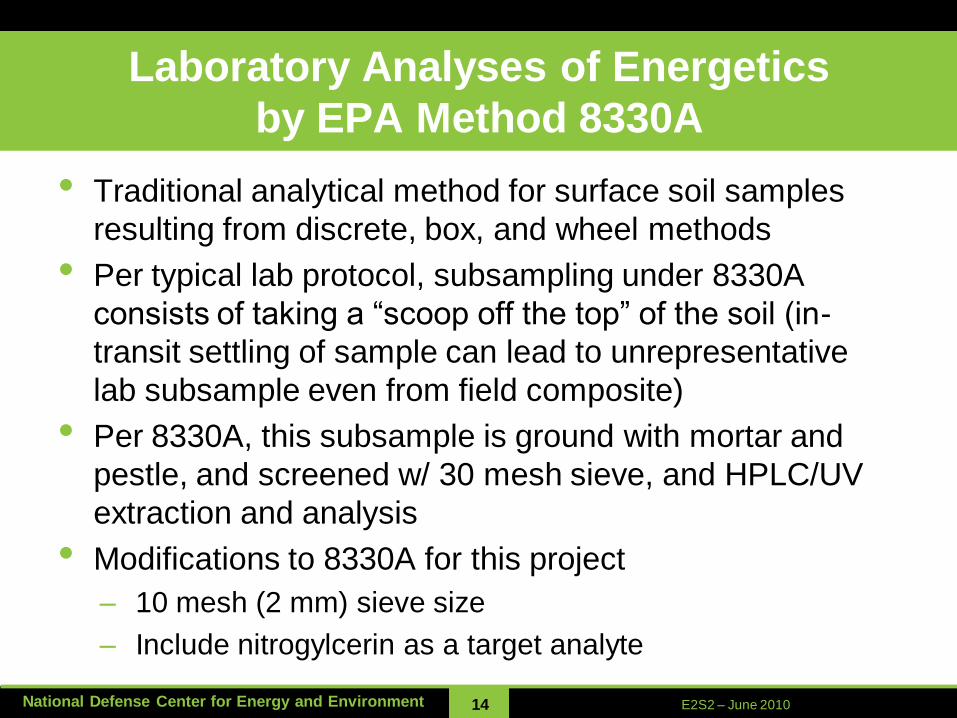
Laboratory Analyses of Energetics
by EPA Method 8330A
• Traditional analytical method for surface soil samples
resulting from discrete, box, and wheel methods
• Per typical lab protocol, subsampling under 8330A
consists of taking a “scoop off the top” of the soil (in-
transit settling of sample can lead to unrepresentative
lab subsample even from field composite)
• Per 8330A, this subsample is ground with mortar and
pestle, and screened w/ 30 mesh sieve, and HPLC/UV
extraction and analysis
• Modifications to 8330A for this project
– 10 mesh (2 mm) sieve size
– Include nitrogylcerin as a target analyte
E2S2 - June 2010E2S2 – June 201015National Defense Center for Energy and Environment
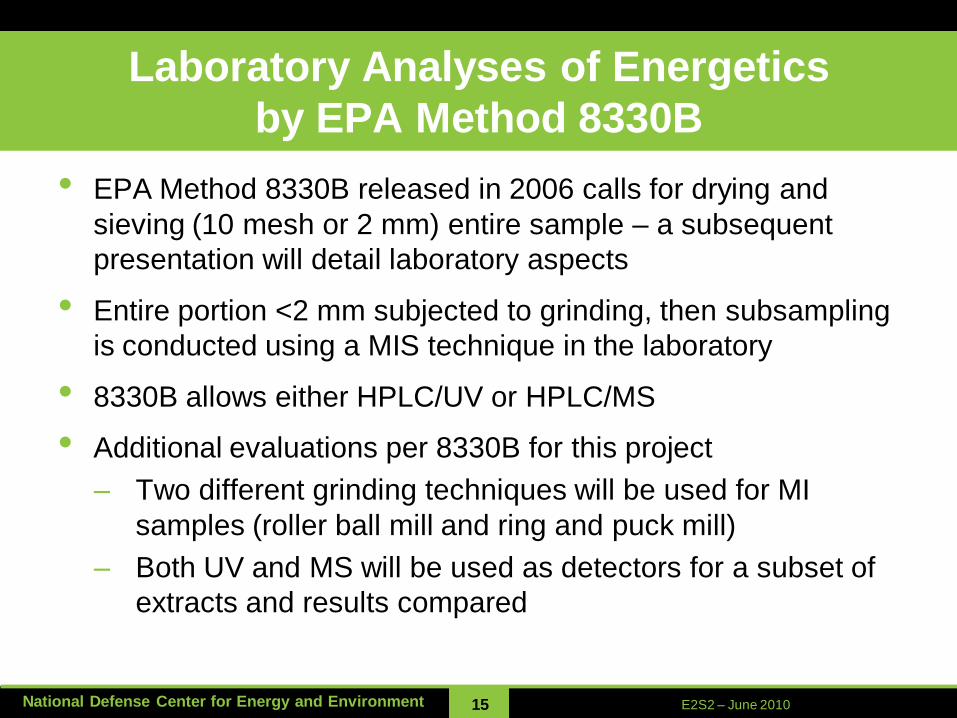
Laboratory Analyses of Energetics
by EPA Method 8330B
• EPA Method 8330B released in 2006 calls for drying and
sieving (10 mesh or 2 mm) entire sample – a subsequent
presentation will detail laboratory aspects
• Entire portion <2 mm subjected to grinding, then subsampling
is conducted using a MIS technique in the laboratory
• 8330B allows either HPLC/UV or HPLC/MS
• Additional evaluations per 8330B for this project
– Two different grinding techniques will be used for MI
samples (roller ball mill and ring and puck mill)
– Both UV and MS will be used as detectors for a subset of
extracts and results compared

E2S2 - June 2010E2S2 – June 201016National Defense Center for Energy and Environment
Project Completion
• Government approved Field Sampling and Laboratory Sampling
and Analysis Plans
• Draft Final Report submitted to Government
• Field sampling at Red Rio Bombing Range, Live Drop Area,
Holloman AFB completed March 2009
– Impact area - arid bombing range, dry sandy soils, particles
• Field sampling at Range 59, Fort Lewis completed July 2009
– Firing points - humid firing range, well-drained soils, propellant site
• TestAmerica Laboratories, Inc., Denver, CO analyzed samples
– All lab managers and bench chemists trained on project requirements
– 4 discrete; 4 box; 4 wheel; 4 MIS for roller ball mill; 4 MIS for ring and
puck mill for analysis
– QA samples include two soil blanks and two aqueous equipment blanks
E2S2 - June 2010E2S2 – June 201017National Defense Center for Energy and Environment
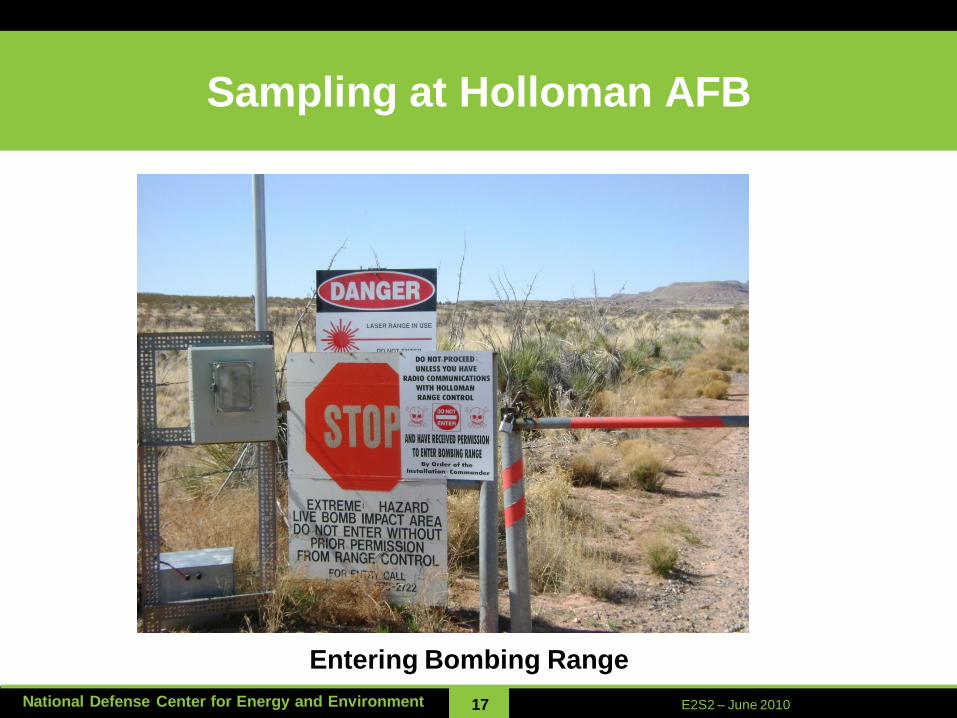
Sampling at Holloman AFB
Entering Bombing Range
E2S2 - June 2010E2S2 – June 201018National Defense Center for Energy and Environment
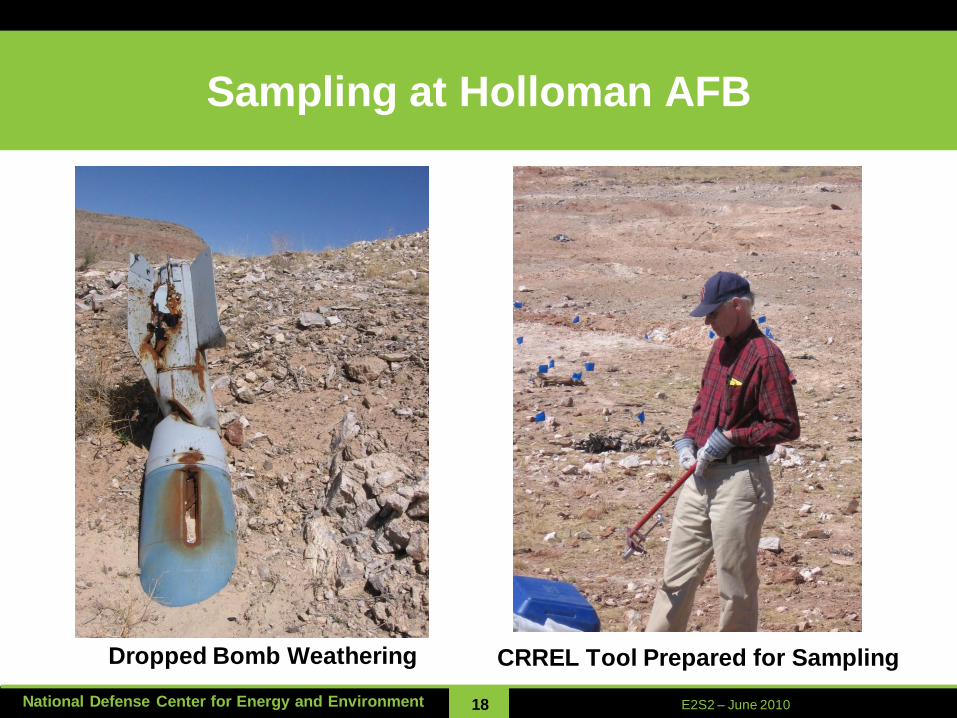
Sampling at Holloman AFB
Dropped Bomb Weathering CRREL Tool Prepared for Sampling
E2S2 - June 2010E2S2 – June 201019National Defense Center for Energy and Environment
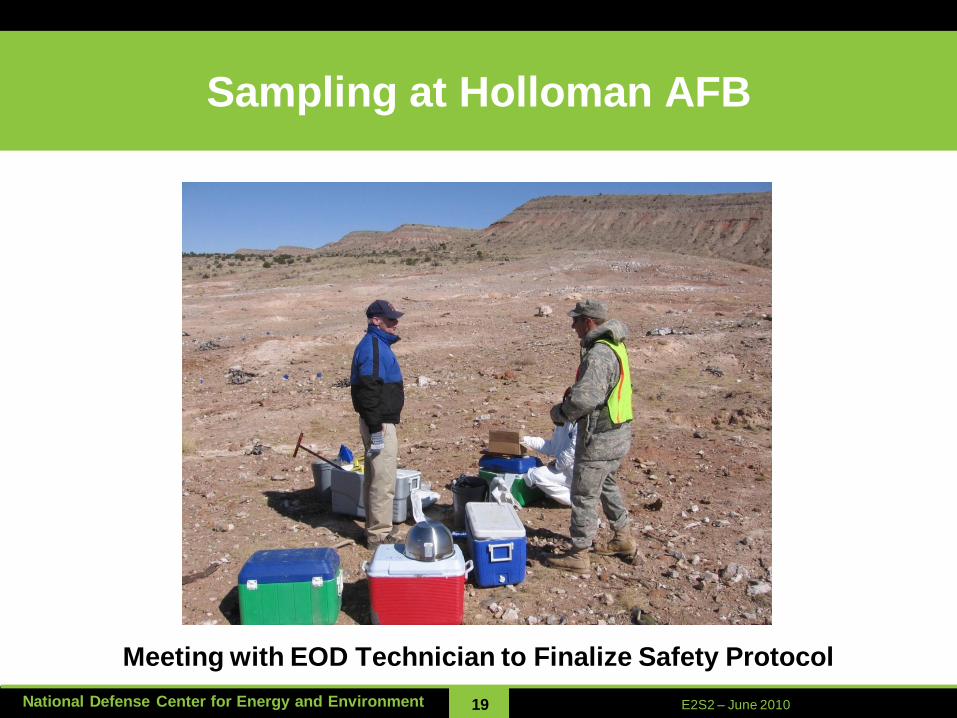
Sampling at Holloman AFB
Meeting with EOD Technician to Finalize Safety Protocol
E2S2 - June 2010E2S2 – June 201020National Defense Center for Energy and Environment
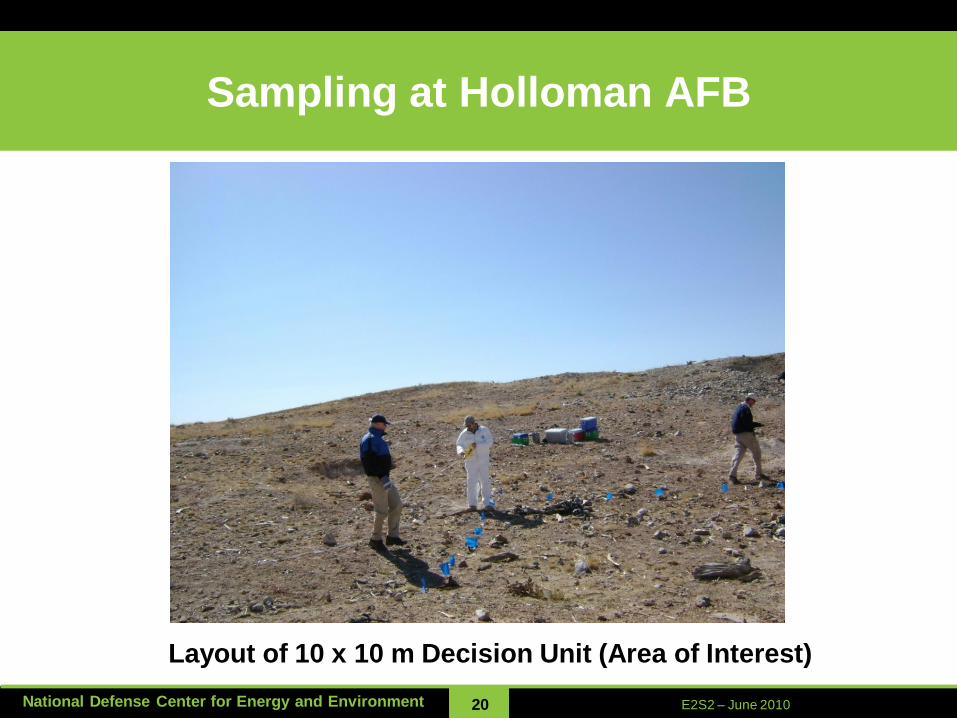
Sampling at Holloman AFB
Layout of 10 x 10 m Decision Unit (Area of Interest)

E2S2 - June 2010E2S2 – June 201021National Defense Center for Energy and Environment
Sampling at Holloman AFB
Conducting MULTI INCREMENT® Sampling (100 increments/hour)
E2S2 - June 2010E2S2 – June 201022National Defense Center for Energy and Environment
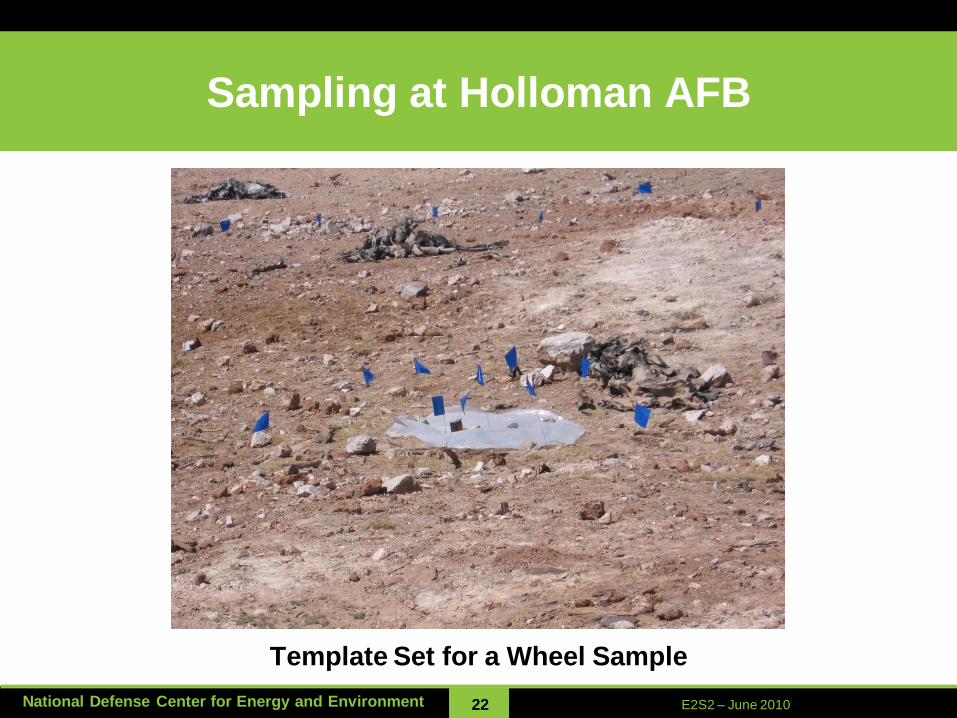
Sampling at Holloman AFB
Template Set for a Wheel Sample
E2S2 - June 2010E2S2 – June 201023National Defense Center for Energy and Environment
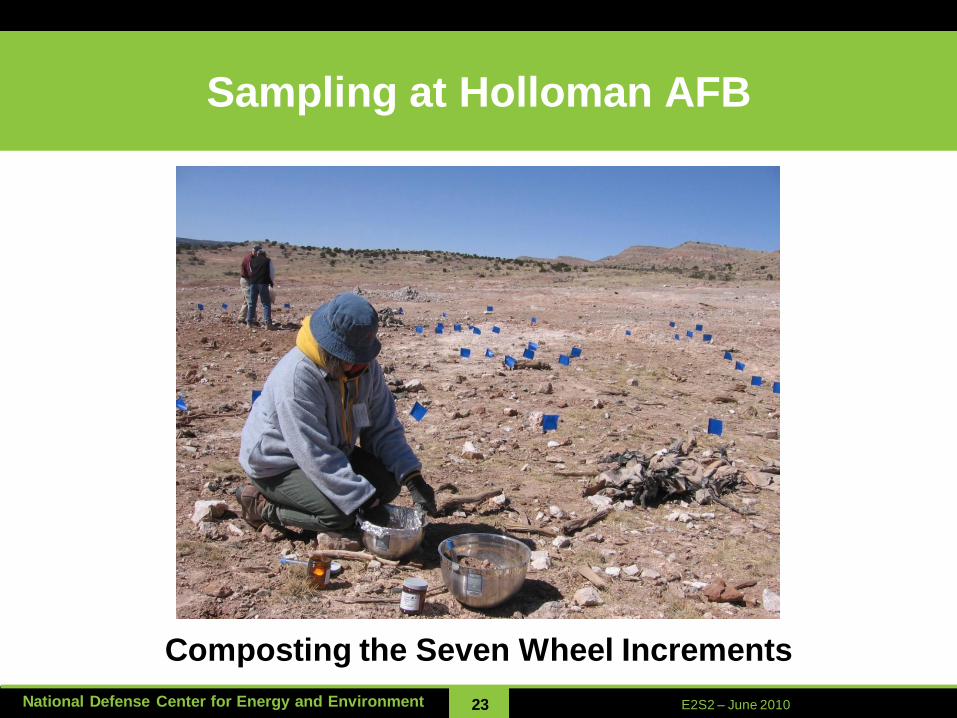
Sampling at Holloman AFB
Composting the Seven Wheel Increments
E2S2 - June 2010E2S2 – June 201024National Defense Center for Energy and Environment
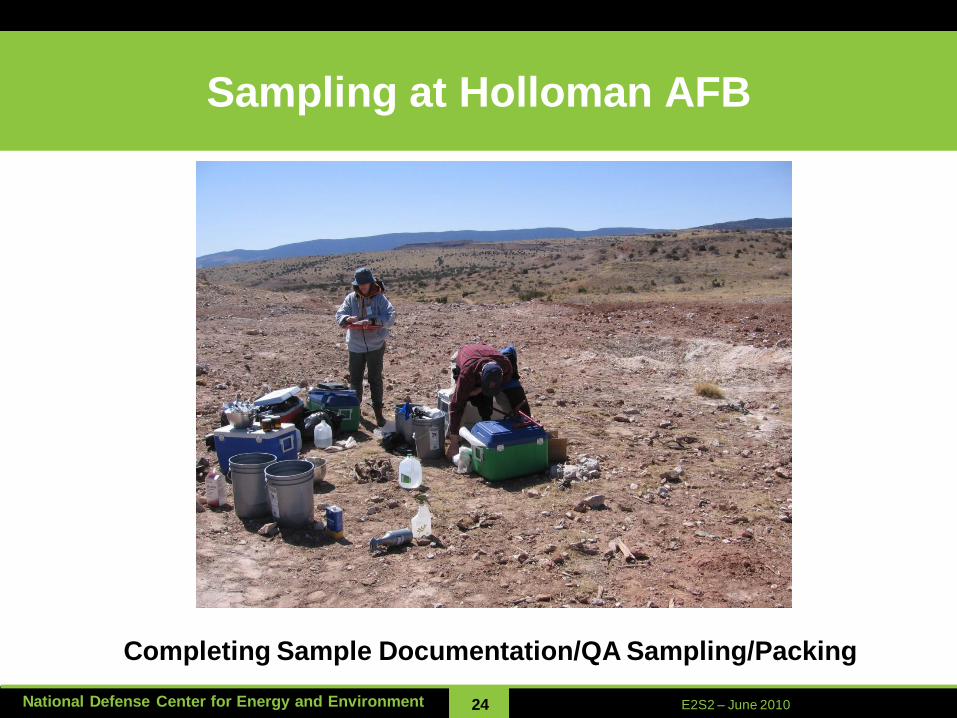
Sampling at Holloman AFB
Completing Sample Documentation/QA Sampling/Packing
E2S2 - June 2010E2S2 – June 201025National Defense Center for Energy and Environment
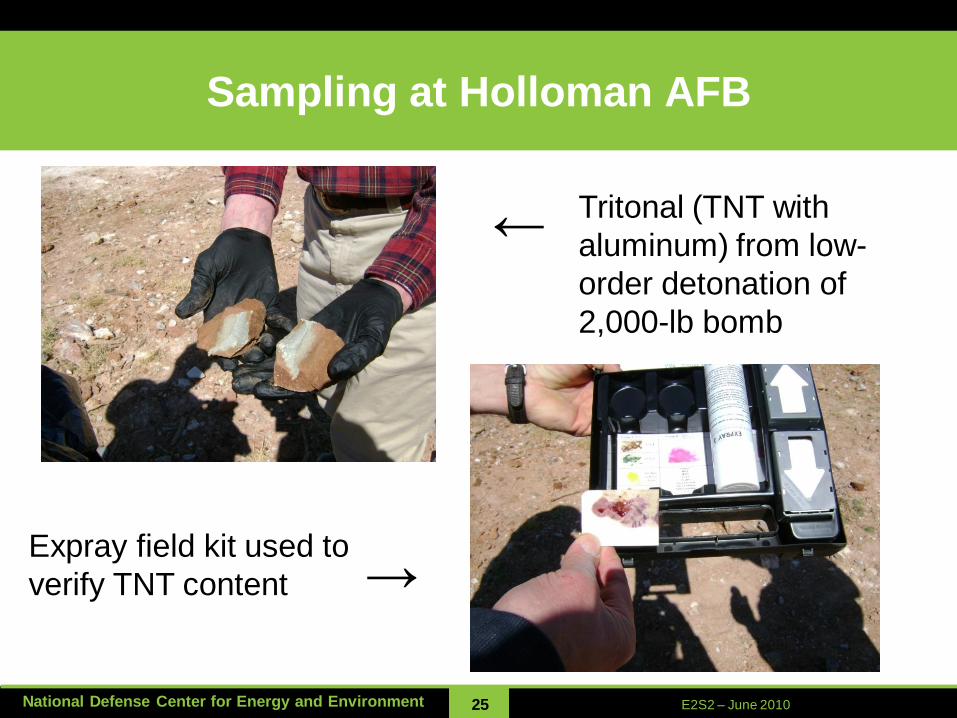
Sampling at Holloman AFB
Tritonal (TNT with
aluminum) from low-
order detonation of
2,000-lb bomb
←
Expray field kit used to
verify TNT content →
E2S2 - June 2010E2S2 – June 201026National Defense Center for Energy and Environment
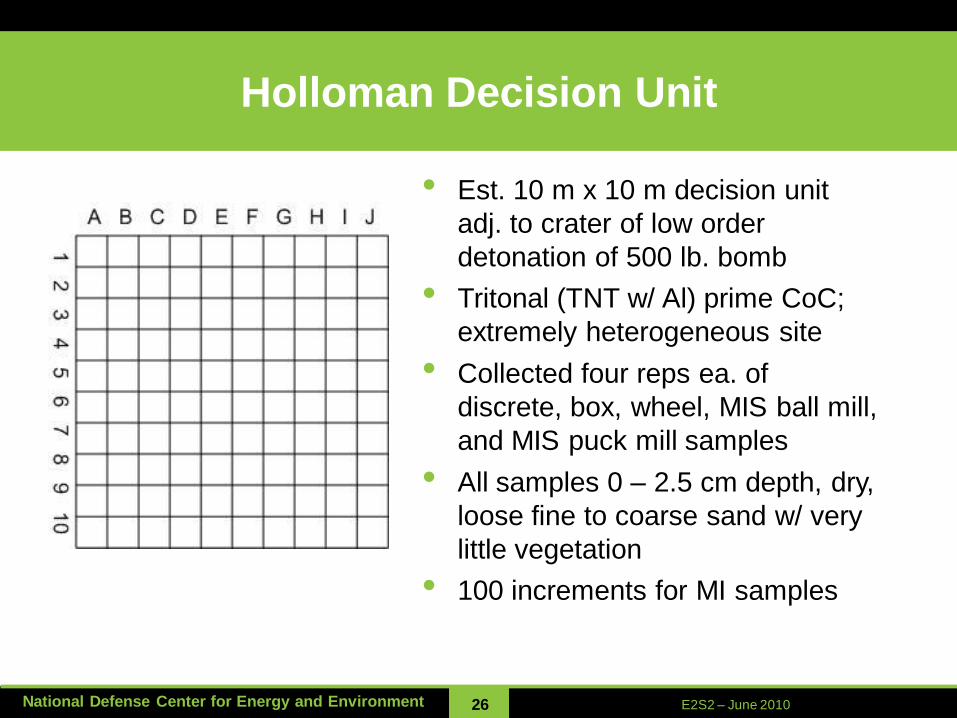
Holloman Decision Unit
• Est. 10 m x 10 m decision unit
adj. to crater of low order
detonation of 500 lb. bomb
• Tritonal (TNT w/ Al) prime CoC;
extremely heterogeneous site
• Collected four reps ea. of
discrete, box, wheel, MIS ball mill,
and MIS puck mill samples
• All samples 0 – 2.5 cm depth, dry,
loose fine to coarse sand w/ very
little vegetation
• 100 increments for MI samples
E2S2 - June 2010E2S2 – June 201027National Defense Center for Energy and Environment
Data Evaluation
• True mean is unknowable; Assess representativeness by
“reproducibility”, indicated by variance of data in like groups
• Calculate Mean and Standard Deviation of each like data group
• Calculate % Relative Standard Deviation (% RSD) of each like
data group; Compare % RSDs (e.g. data resulting from “scoop
off the top” vs. “in-lab MIS procedure”) % RSD = (s*100)/m
• The lower the % RSD for a like data group, the better quality the
data in terms of reproducibility, therefore representativeness
• Calculate Relative Percent Difference (RPD) to compare two
values (e.g. subsample to bulk sample) RPD = ABS(A-B)/m*100
E2S2 - June 2010E2S2 – June 201028National Defense Center for Energy and Environment
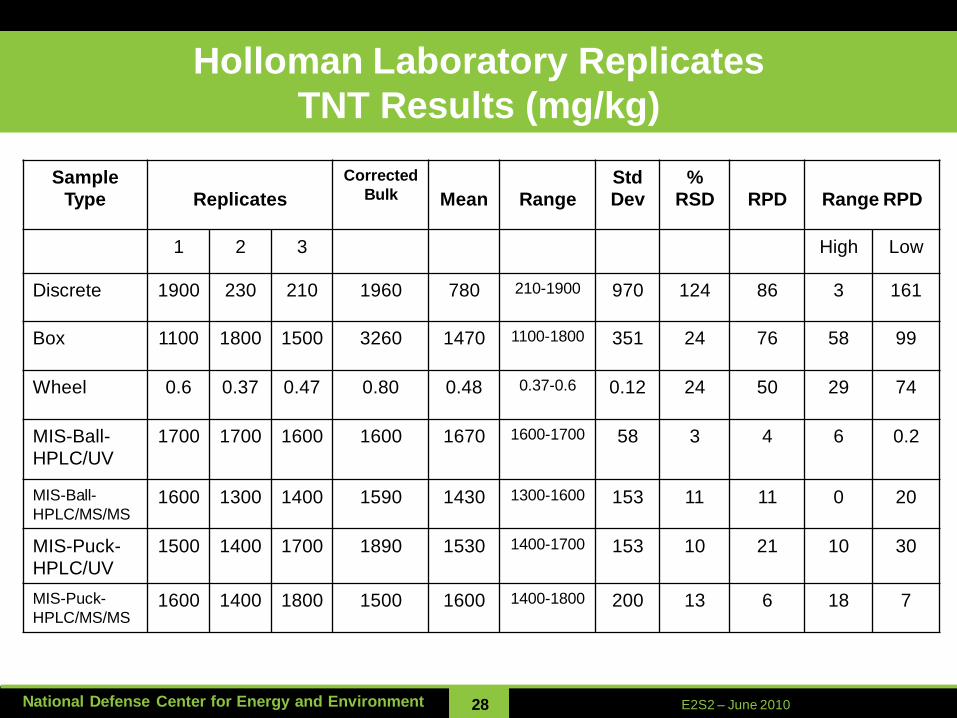
Holloman Laboratory Replicates
TNT Results (mg/kg)
Sample
Type Replicates
Corrected
Bulk Mean Range
Std
Dev
%
RSD RPD Range RPD
1 2 3 High Low
Discrete 1900 230 210 1960 780 210-1900 970 124 86 3 161
Box 1100 1800 1500 3260 1470 1100-1800 351 24 76 58 99
Wheel 0.6 0.37 0.47 0.80 0.48 0.37-0.6 0.12 24 50 29 74
MIS-Ball-
HPLC/UV
1700 1700 1600 1600 1670 1600-1700 58 3 4 6 0.2
MIS-Ball-
HPLC/MS/MS1600 1300 1400 1590 1430 1300-1600 153 11 11 0 20
MIS-Puck-
HPLC/UV
1500 1400 1700 1890 1530 1400-1700 153 10 21 10 30
MIS-Puck-
HPLC/MS/MS1600 1400 1800 1500 1600 1400-1800 200 13 6 18 7
E2S2 - June 2010E2S2 – June 201029National Defense Center for Energy and Environment
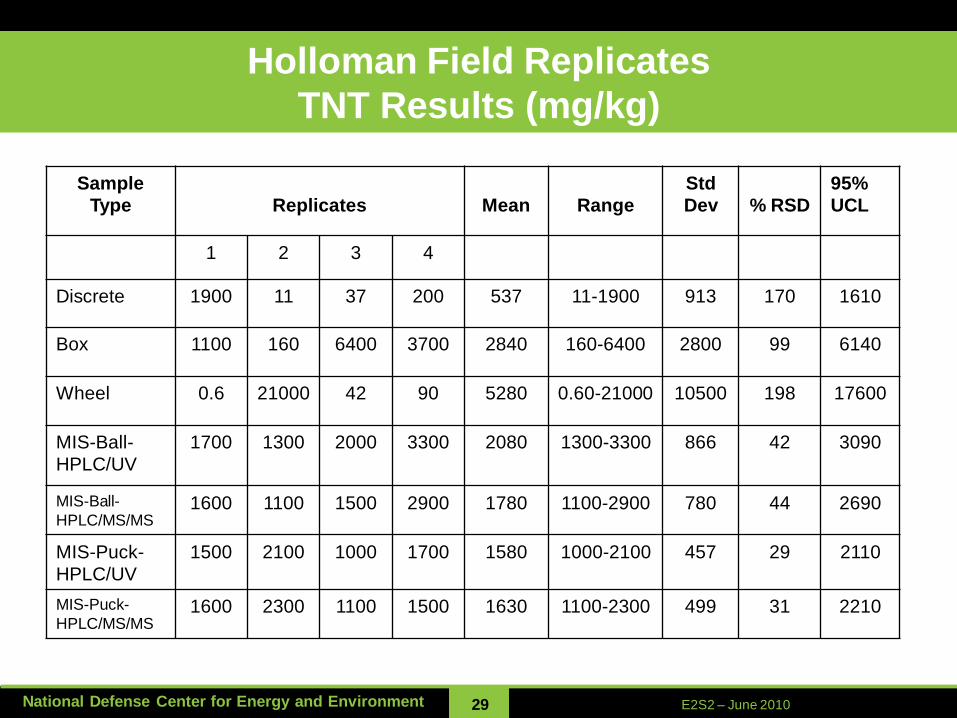
Holloman Field Replicates
TNT Results (mg/kg)
Sample
Type Replicates Mean Range
Std
Dev % RSD
95%
UCL
1 2 3 4
Discrete 1900 11 37 200 537 11-1900 913 170 1610
Box 1100 160 6400 3700 2840 160-6400 2800 99 6140
Wheel 0.6 21000 42 90 5280 0.60-21000 10500 198 17600
MIS-Ball-
HPLC/UV
1700 1300 2000 3300 2080 1300-3300 866 42 3090
MIS-Ball-
HPLC/MS/MS1600 1100 1500 2900 1780 1100-2900 780 44 2690
MIS-Puck-
HPLC/UV
1500 2100 1000 1700 1580 1000-2100 457 29 2110
MIS-Puck-
HPLC/MS/MS1600 2300 1100 1500 1630 1100-2300 499 31 2210
E2S2 - June 2010E2S2 – June 201030National Defense Center for Energy and Environment
Project Conclusions – Holloman AFB
• Heterogeneous distribution of TNT in arid, sandy soils; 100-
increment MIS compared to discrete, box, wheel
• Compared to traditional sampling methods, MIS provided:
– Better reproducibility of laboratory replicates
– A more representative subsample than scoop off the top
– Better reproducibility of field replicates
• On ring and puck mill vs. roller ball mill grinding and
detection by UV vs. MS/MS:
– Differences between grinding methods were not observed at this
site; project-specific determinations necessary
– UV provided slightly better reproducibility than MS/MS; MS/MS
may be preferred for some projects for reasons such as
detection limits/better resolution
E2S2 - June 2010E2S2 – June 201031National Defense Center for Energy and Environment
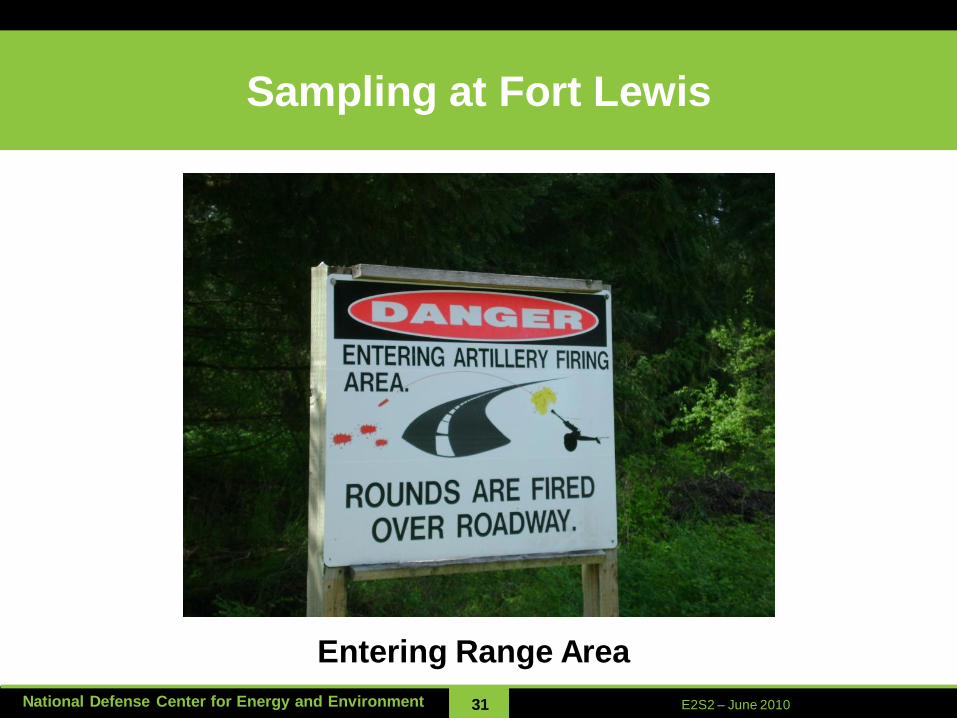
Sampling at Fort Lewis
Entering Range Area
E2S2 - June 2010E2S2 – June 201032National Defense Center for Energy and Environment
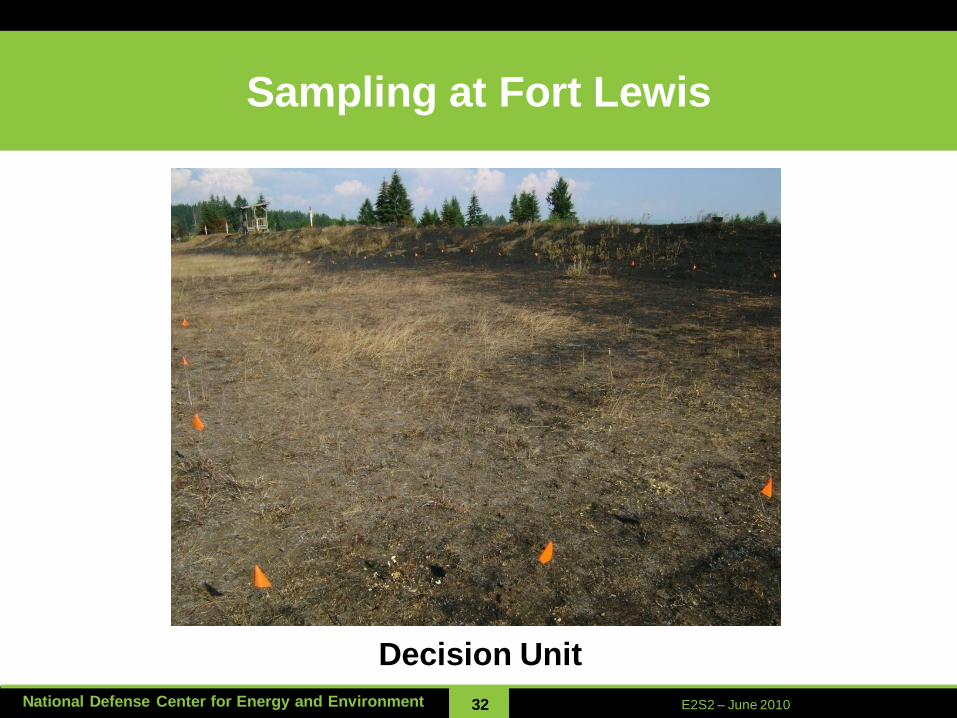
Sampling at Fort Lewis
Decision Unit

E2S2 - June 2010E2S2 – June 201033National Defense Center for Energy and Environment
Sampling at Fort Lewis
Core from CRREL MIS Tool
E2S2 - June 2010E2S2 – June 201034National Defense Center for Energy and Environment
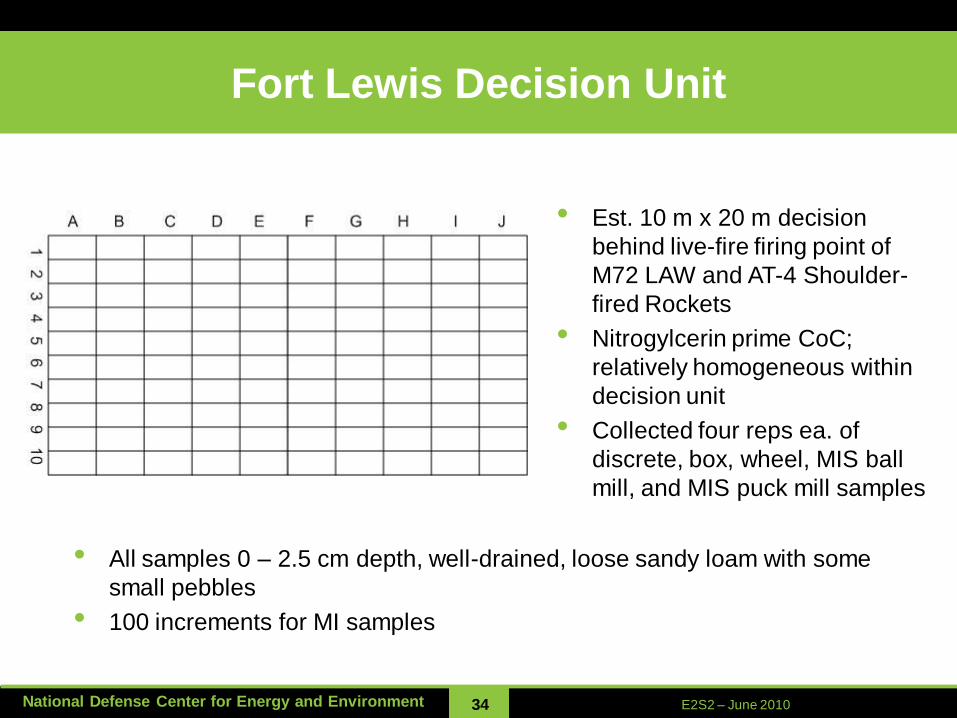
Fort Lewis Decision Unit
• Est. 10 m x 20 m decision
behind live-fire firing point of
M72 LAW and AT-4 Shoulder-
fired Rockets
• Nitrogylcerin prime CoC;
relatively homogeneous within
decision unit
• Collected four reps ea. of
discrete, box, wheel, MIS ball
mill, and MIS puck mill samples
• All samples 0 – 2.5 cm depth, well-drained, loose sandy loam with some
small pebbles
• 100 increments for MI samples
E2S2 - June 2010E2S2 – June 201035National Defense Center for Energy and Environment
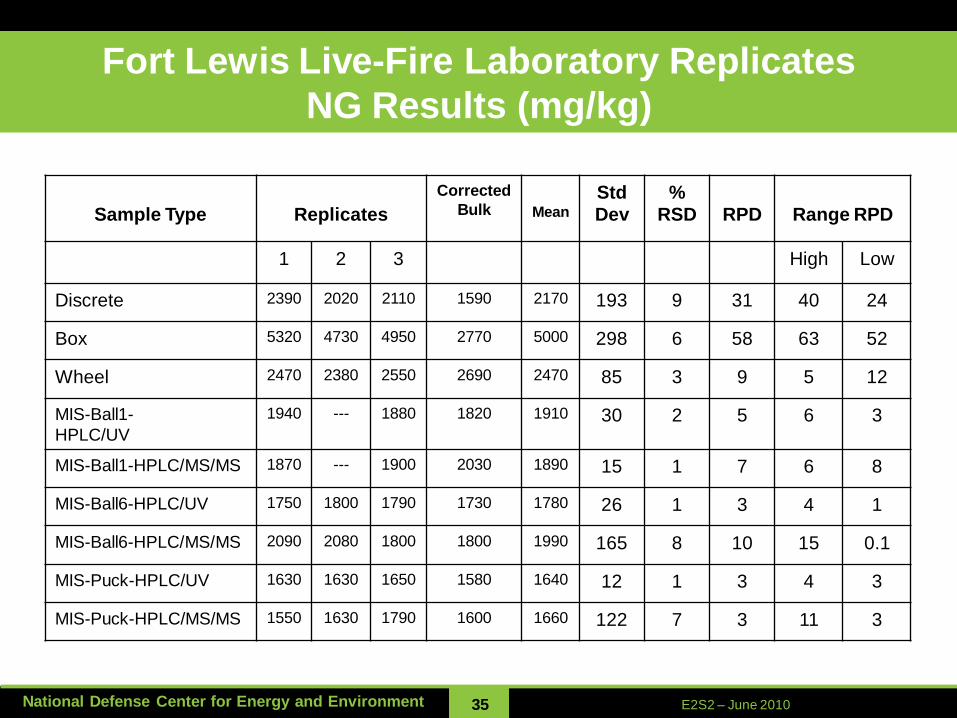
Fort Lewis Live-Fire Laboratory Replicates
NG Results (mg/kg)
Sample Type Replicates
Corrected
Bulk Mean
Std
Dev
%
RSD RPD Range RPD
1 2 3 High Low
Discrete 2390 2020 2110 1590 2170 193 9 31 40 24
Box 5320 4730 4950 2770 5000 298 6 58 63 52
Wheel 2470 2380 2550 2690 2470 85 3 9 5 12
MIS-Ball1-
HPLC/UV
1940 --- 1880 1820 1910 30 2 5 6 3
MIS-Ball1-HPLC/MS/MS 1870 --- 1900 2030 1890 15 1 7 6 8
MIS-Ball6-HPLC/UV 1750 1800 1790 1730 1780 26 1 3 4 1
MIS-Ball6-HPLC/MS/MS 2090 2080 1800 1800 1990 165 8 10 15 0.1
MIS-Puck-HPLC/UV 1630 1630 1650 1580 1640 12 1 3 4 3
MIS-Puck-HPLC/MS/MS 1550 1630 1790 1600 1660 122 7 3 11 3

E2S2 - June 2010E2S2 – June 201036National Defense Center for Energy and Environment
Fort Lewis Live-Fire Field Replicates
NG Results (mg/kg)
Sample
Type Replicates Mean Range
Std
Dev
%
RSD
95%
UCL
1 2 3 4 5
Discrete 2390 1900 1550 6360 --- 3050 1550-6360 2230 73 5680
Box 5320 1520 4200 5120 --- 4040 1520-5320 1750 43 6100
Wheel 2470 3490 1800 2400 --- 2540 1800-3490 701 28 3370
MIS-Ball-
HPLC/UV1940 1690 1660 1800 1750 1770 1660-1940 110 6 1880
MIS-Ball-
HPLC/MS/MS1870 1760 1440 1700 2090 1770 1440-2090 238 13 2020
MIS-Puck-
HPLC/UV1630 1890 1990 1950 --- 1870 1630-1990 162 9 2060
MIS-Puck-
HPLC/MS/MS1550 1970 2140 2120 --- 1950 1550-2140 274 14 2400
E2S2 - June 2010E2S2 – June 201037National Defense Center for Energy and Environment
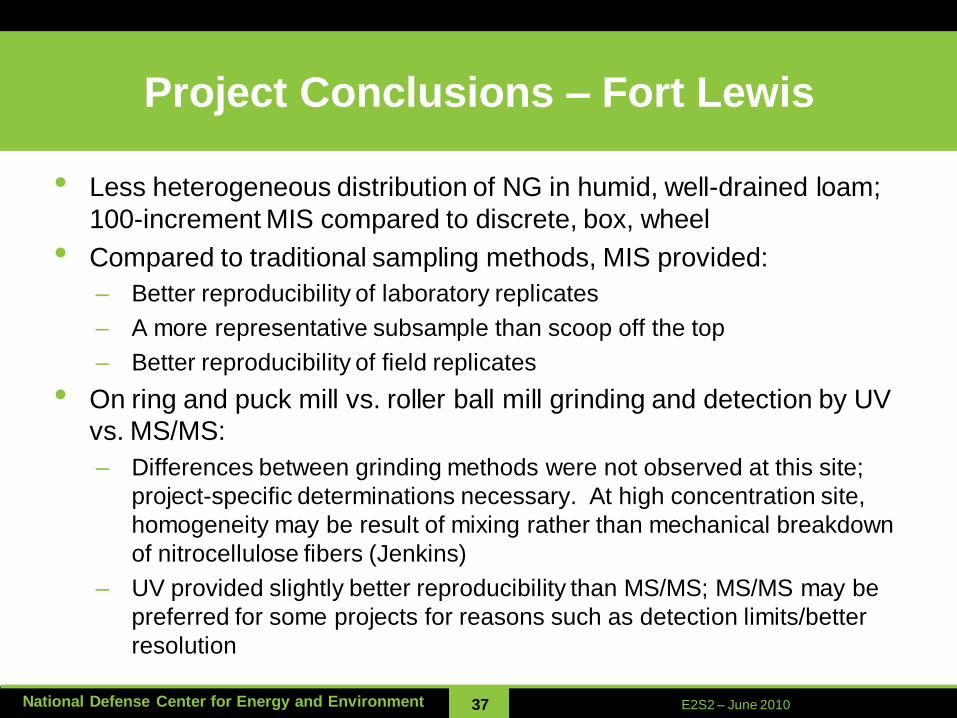
Project Conclusions – Fort Lewis
• Less heterogeneous distribution of NG in humid, well-drained loam;
100-increment MIS compared to discrete, box, wheel
• Compared to traditional sampling methods, MIS provided:
– Better reproducibility of laboratory replicates
– A more representative subsample than scoop off the top
– Better reproducibility of field replicates
• On ring and puck mill vs. roller ball mill grinding and detection by UV
vs. MS/MS:
– Differences between grinding methods were not observed at this site;
project-specific determinations necessary. At high concentration site,
homogeneity may be result of mixing rather than mechanical breakdown
of nitrocellulose fibers (Jenkins)
– UV provided slightly better reproducibility than MS/MS; MS/MS may be
preferred for some projects for reasons such as detection limits/better
resolution

E2S2 - June 2010E2S2 – June 201038National Defense Center for Energy and Environment
Cost Benefit Analysis Assumptions
• DQO Goal of mean soil concentration in a decision unit
• Equivalent Data Assumptions (to one MIS sample)
– 30 discrete samples
– 15 box samples and 15 wheel samples
• One-time Event (Operation & Maintenance not applicable;
Travel differences negligible; Mobilization to site not included)
• Surface soils (2.5 cm depth)
• Field QC (two field duplicates (discrete); one field duplicate
(box, wheel, MIS)
• Lab QC (MS/MSD for all; LCS for MIS)
• Analytical by HPLC/UV ($150/sample for all, plus $100 prep
for each MIS sample)

E2S2 - June 2010E2S2 – June 201039National Defense Center for Energy and Environment
Cost Benefit Analysis
*Assumes purchase of an IS pogo-stick style sampler
Expense 30 Discrete 15 Box or
Wheel
One 30-
increment
MIS
Labor ($75/hr) 8 hrs
$600
12 hrs
$900
4 hrs
$300
Method-Specific Equipment* $125 $150 $1300
Misc. Equipment $100 $100 $100
Shipping $400 $175 $100
Laboratory Analysis $5,250 $2,850 $1,350
Cost to characterize one
decision unit
$6,475 $4,175 $3,150
Cost to characterize ten
decision units
$62,725 $39,500 $18,900
E2S2 - June 2010E2S2 – June 201040National Defense Center for Energy and Environment
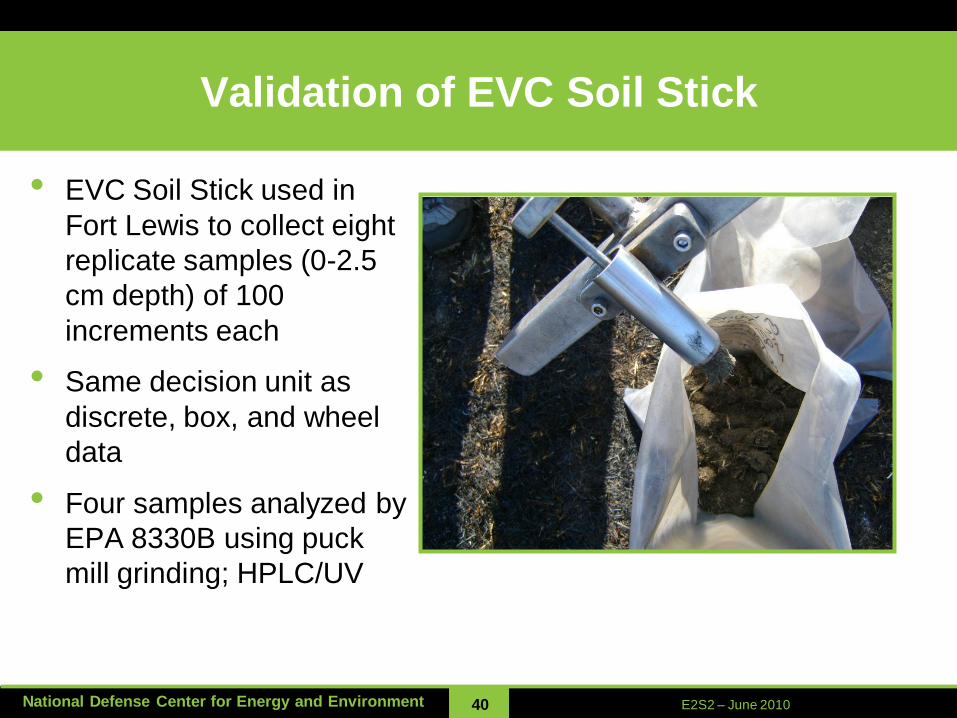
Validation of EVC Soil Stick
• EVC Soil Stick used in
Fort Lewis to collect eight
replicate samples (0-2.5
cm depth) of 100
increments each
• Same decision unit as
discrete, box, and wheel
data
• Four samples analyzed by
EPA 8330B using puck
mill grinding; HPLC/UV
E2S2 - June 2010E2S2 – June 201041National Defense Center for Energy and Environment
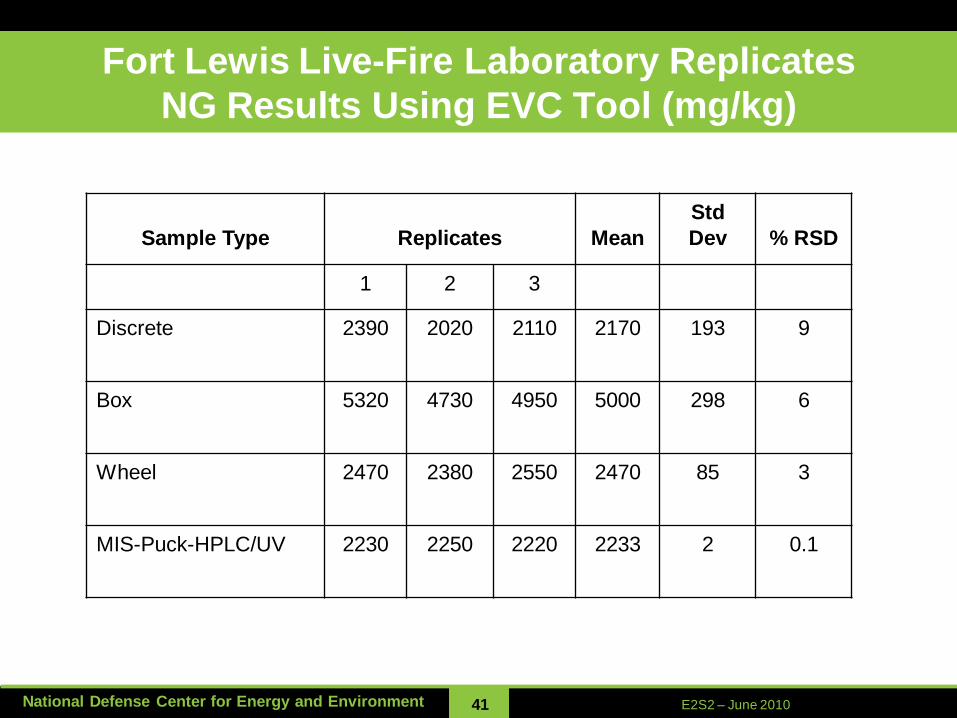
Fort Lewis Live-Fire Laboratory Replicates
NG Results Using EVC Tool (mg/kg)
Sample Type Replicates Mean
Std
Dev % RSD
1 2 3
Discrete 2390 2020 2110 2170 193 9
Box 5320 4730 4950 5000 298 6
Wheel 2470 2380 2550 2470 85 3
MIS-Puck-HPLC/UV 2230 2250 2220 2233 2 0.1
E2S2 - June 2010E2S2 – June 201042National Defense Center for Energy and Environment
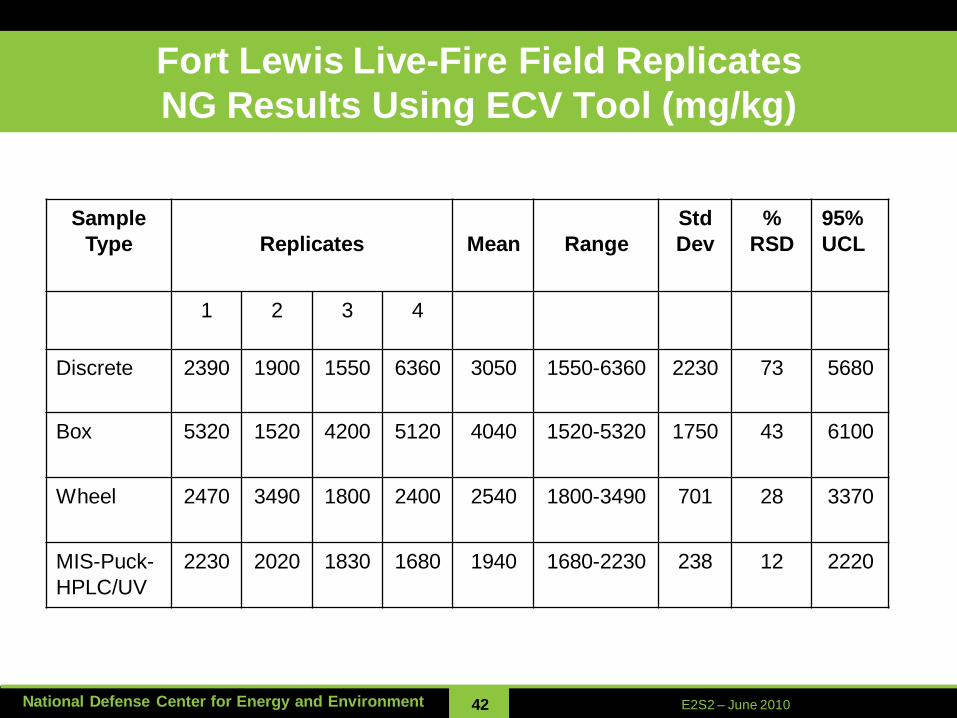
Fort Lewis Live-Fire Field Replicates
NG Results Using ECV Tool (mg/kg)
Sample
Type Replicates Mean Range
Std
Dev
%
RSD
95%
UCL
1 2 3 4
Discrete 2390 1900 1550 6360 3050 1550-6360 2230 73 5680
Box 5320 1520 4200 5120 4040 1520-5320 1750 43 6100
Wheel 2470 3490 1800 2400 2540 1800-3490 701 28 3370
MIS-Puck-
HPLC/UV
2230 2020 1830 1680 1940 1680-2230 238 12 2220
E2S2 - June 2010E2S2 – June 201043National Defense Center for Energy and Environment
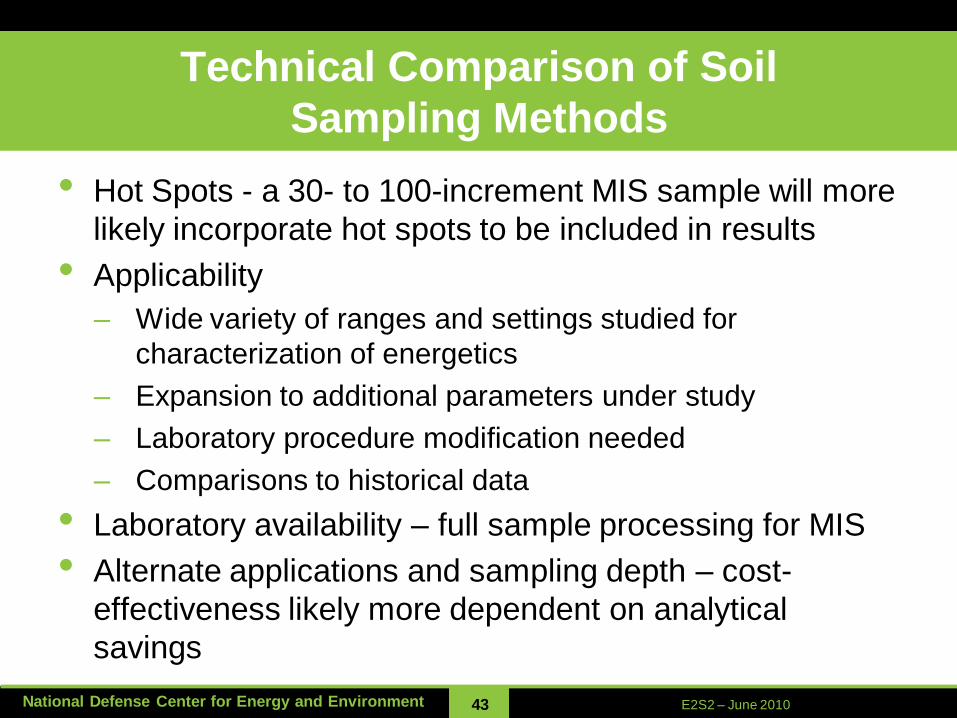
Technical Comparison of Soil
Sampling Methods
• Hot Spots - a 30- to 100-increment MIS sample will more
likely incorporate hot spots to be included in results
• Applicability
– Wide variety of ranges and settings studied for
characterization of energetics
– Expansion to additional parameters under study
– Laboratory procedure modification needed
– Comparisons to historical data
• Laboratory availability – full sample processing for MIS
• Alternate applications and sampling depth – cost-
effectiveness likely more dependent on analytical
savings

E2S2 - June 2010E2S2 – June 201044National Defense Center for Energy and Environment
Multi Increment Sampling Status
• Regulatory status and conditions of acceptance
– Many states have accepted use of MIS; Some require it
• Mr. Alan Hewitt, formerly of U.S. ACE, ERDC-CRREL,
Completed Cost and Benefit report focusing on MIS for
ranges in ESTCP-funded project
• U.S. ACE, ERDC-CRREL, SERDP-funded project to
evaluate expansion of MIS to metals contamination at
ranges just beginning
• Interstate Technology and Regulatory Council (ITRC)
work group on Multi Increment Sampling evaluating MIS
for expanded use

E2S2 - June 2010E2S2 – June 201045National Defense Center for Energy and Environment
Multi Increment Sampling Benefits
• Time for MIS increment collection in field same or less
than traditional methods
• Fewer MI samples needed for equivalent data variability
compared to discrete or box or wheel
• Accepted as most representative sampling technique for
surface soil sampling for energetics residues at military
ranges
• Studies underway to expand MIS for use with additional
contaminants and depths/applications (SERDP– metals
at ranges; ITRC MIS Team – theory; DOE – mixed
contaminants pre- and post-removal of soils)

E2S2 - June 2010E2S2 – June 201046National Defense Center for Energy and Environment
NDCEE Technical MonitorName: Dr. Mark Chappell
Organization: US ACE ERDC-EL
E-mail: [email protected]
Phone Number: (601) 634-2802
NDCEE Project Manager
Name: Mr. Charles Tomljanovic
Organization: CTC/NDCEE
E-Mail: [email protected]
Phone Number: (814) 269-6834
This work was funded through the Office of the Assistant Secretary of the Army (Installations
and Environment) and conducted under contract W74V8H-04-D-0005 Task 527 A3. The
views, opinions, and/or findings contained in this paper are those of the author(s) and should
not be construed as an official Department of the Army position, policy, or decision unless so
designated by other official documentation.
Points of Contact
DoD Executive Agent
Office of the
Assistant Secretary
of the Army
(Installations and
Environment)
www.ndcee.ctc.com