demystifying system mapping - the natural step …...-- luc hoebeke, making systems work better,...
TRANSCRIPT

Demystifying System Mapping
Steve Williams, Constructive Public Engagement Kelly Hawke Baxter, Social Innovation Consultant TNS Accelerate, Toronto, ON – June 6, 2014

Agenda
! Introductions and getting started
! What is systems mapping? Why is it useful?
! Different kinds of systems maps
! Systems mapping building blocks
! Case study: Housing in the GTA
! Debrief
! Wrap up and resources

Definitions: What is a System?
! “An interconnected set of elements that is coherently organized in a way that achieves something.” (Meadows, 2008)
! “A structured set of objects and/or attributes together with the relationships between them’. The constitutive elements of a system are, therefore, its elements, the relationships between these elements, and the system boundary that distinguishes between what does and does not belong to the set. (Vandenbroeck, Goossens, Clemens, 2007)

Definitions: Systems Mapping
! Loosely used term to denote the activity of conceptually representing a system
! Conveys elements, relationships and interconnections
! Shows how different elements influence each other and how changes in one might affect others
! Different kinds: eg. causal loop diagrams, stakeholder/network maps, value chain maps

Remember…
! “Never confuse a model with the complex reality underneath.” -- Luc Hoebeke, Making Systems Work Better, 1994
! “All models are wrong, but some are useful.” -- George E. P. Box
! “None of us see the system. We see our own part based on our own background and history. And we all think we see the most crucial part.” -- Peter Senge, Accelerate 2014

Why System Mapping?

Why Map Systems? 1. To make sense of complexity
! Better see and understand system ! Clarify relationships between system components ! Challenge assumptions and mental models ! Identify root causes ! Understand feedback loops and patterns ! Identify knowledge gaps
2. To engage stakeholders ! Communicate complexity ! Co-create shared understanding of the system ! Challenge assumptions ! Understand how we fit into the system ! Understand who else is in the system and how we relate to them

Why Map Systems?
3. To identify opportunities to intervene in the system ! Leverage points
! Feedback loops
! Policy and Innovation options
! Possible future scenarios
! Restructure the system

Examples of System Mapping

Making Sense of Complexity: Supply chain for a cup of tea
Source: NESTA 2013
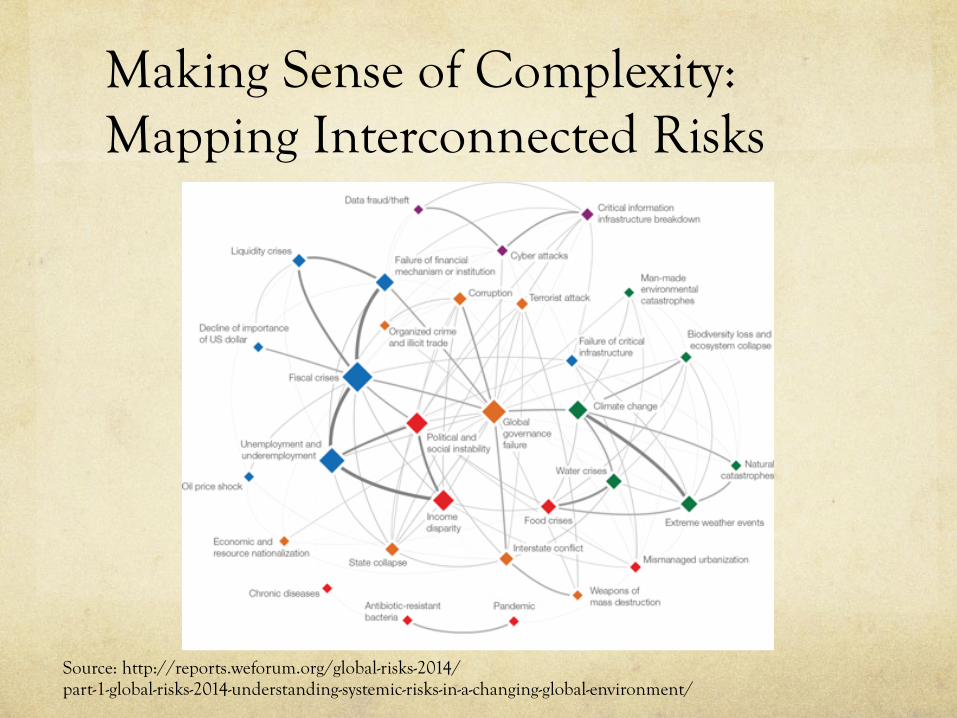
Making Sense of Complexity: Mapping Interconnected Risks
Source: http://reports.weforum.org/global-risks-2014/ part-1-global-risks-2014-understanding-systemic-risks-in-a-changing-global-environment/

Engaging Stakeholders: Ring of Fire Resource Development
Source: http://insightmaker.com/insight/3624
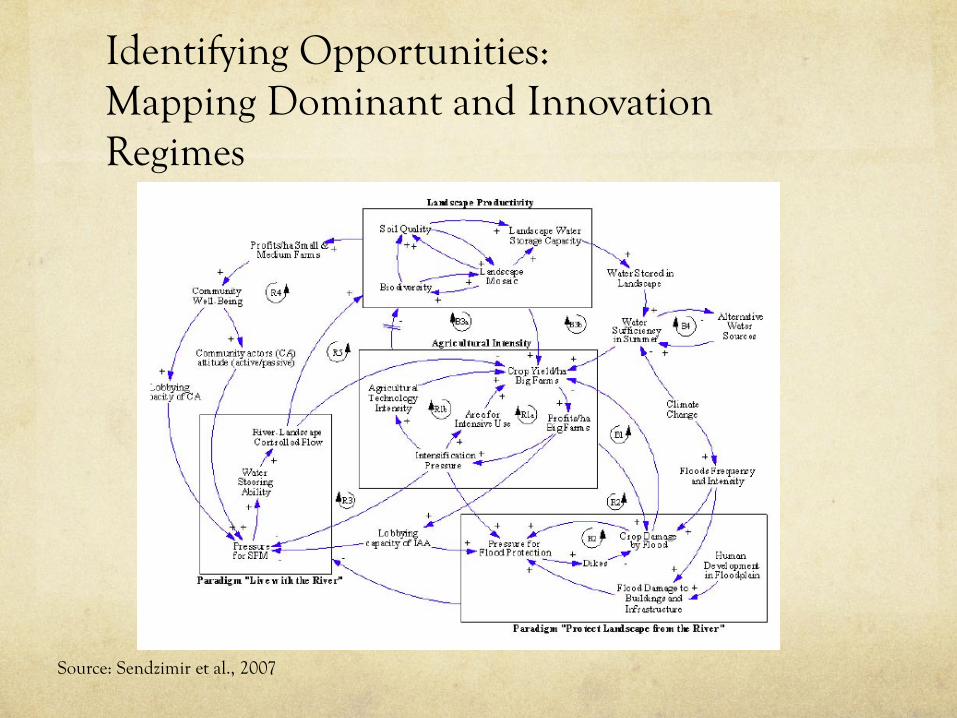
Identifying Opportunities: Mapping Dominant and Innovation Regimes
Source: Sendzimir et al., 2007

System Mapping Building Blocks

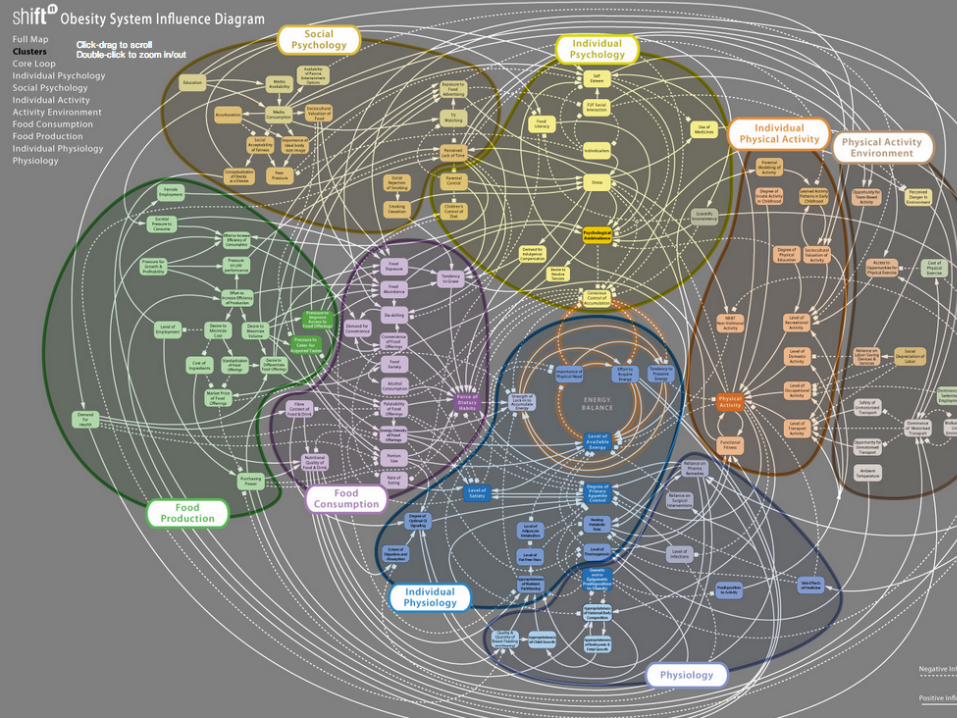
Back to our System Definition
! The obesity system, therefore, is pragmatically defined here as the sum of all the relevant factors and their interdependencies that determine the condition of obesity for an individual or a group of people.

Elements/Factors/Variables
! Prime building blocks
! They are quantifiable and either increase or decrease
! Use terms like amount of, level of degree of

Examples of factors in obesity

Interconnections

Relationships
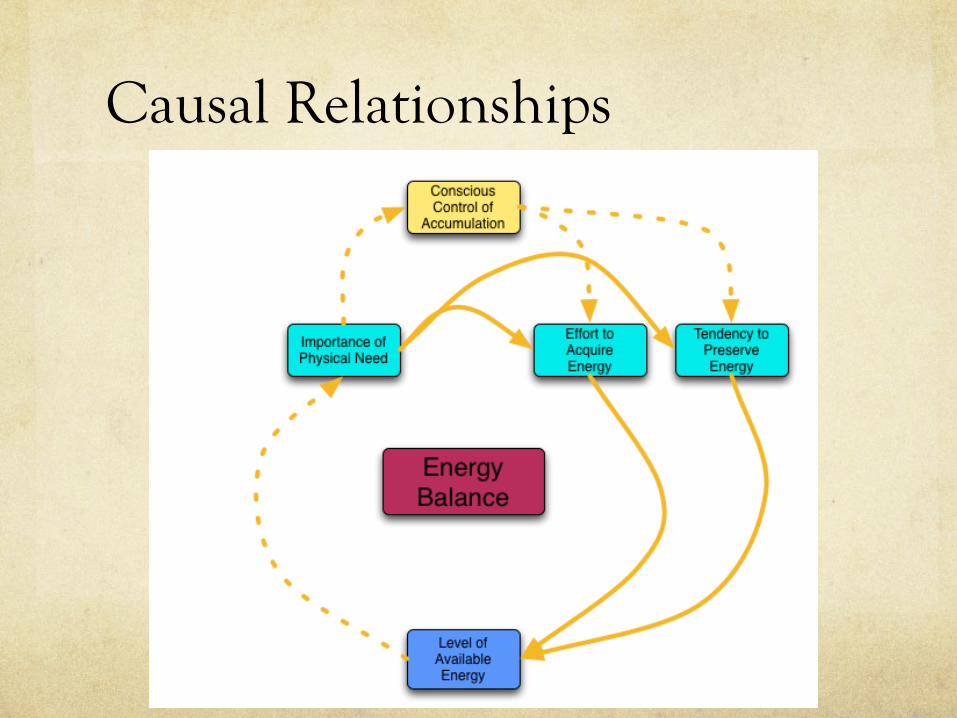
Causal Relationships

Scale
! Individual Obesity
! Group Obesity
! Country wide obesity

Scale: Mapping Obesity in the UK


Case Study Housing system in the Greater Toronto Hamilton Area
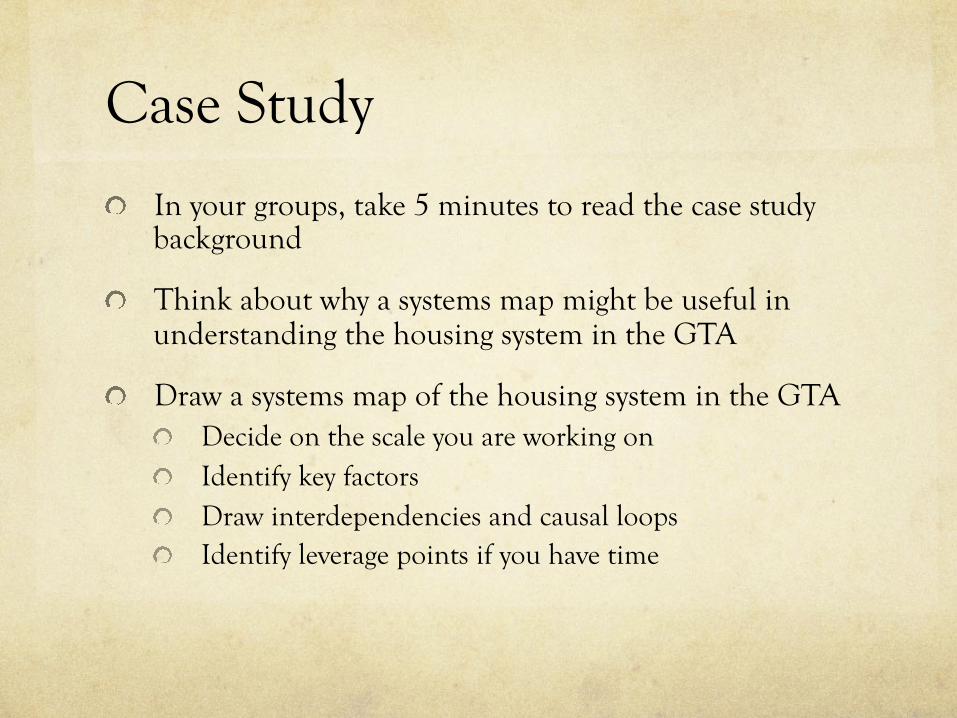
Case Study
! In your groups, take 5 minutes to read the case study background
! Think about why a systems map might be useful in understanding the housing system in the GTA
! Draw a systems map of the housing system in the GTA ! Decide on the scale you are working on ! Identify key factors ! Draw interdependencies and causal loops ! Identify leverage points if you have time

Debrief

If you want to learn more … ! Kanter, Beth. System Mapping for Non-Profits
! Bloom, P and Dees, G (2007) Cultivate your Ecosystem. Stanford Social Innovation Review (Winter 2008).
! Meadows, Donella (2008) Thinking in Systems: A Primer. Chelsea Green Publishing Co.
! Mulgan, G.; Leadbeater, C. (2013) Systems Innovation Discussion Paper. NESTA.
! Vandenbroeck, P; Goossens, J.; Clemens, M. (2007) Tackling Obesities: Future Choices – Building the Obesity Systems Map. UK Government Office for Science.
! Waddell, S.; Allee, V., Ritchie-Dunham, J. (2009) Seeing Complexity Clearly through Mapping for More Effective Strategies. Networking Action Working Paper #1.
! Insight Maker: www.insightmaker.com
! CMapTools: cmap.ihmc.us/

Thank you!
! Steve Williams, Constructive Public Engagement [email protected] @constructive
! Kelly Hawke Baxter, Social Innovation Consultant, The Natural Step Canada [email protected]