demystifying the big data phenomenon for strategic leadership data_sam... · demystifying the big...
TRANSCRIPT
Demystifying the Big Data Phenomenonfor Strategic Leadership
Society for Advancement of Management2016 International Business Conference
Arlington, VA April 7 – 10th
LauraAnn Migliore, Ph.D. Faculty, University of Phoenix
School of Advanced Studies (SAS)[email protected]
and
Ravi Chinta, Ph.D.Department Head of Business Administration
Auburn University at [email protected]
About This Presentation
• This presentation explains the concept of Big Data using Machine Learning practices as a viable approach to finding new ways to gain insights and add value.
• The objective is to demystify the Big Data phenomena through the lens of data as a currency for monetization using a strategic leadership perspective to advance management, inspire innovation, and influence positive change
• This presentation discusses research data from more than 100 C-level retail executives and uses anecdotal evidence to integrate company examples to demonstrate empirically the link between investments in digital technologies for Big Data analytics to improve performance and create new value for customers
Outline
• Problem Statement & Research Opportunities
• Literature Review
• Methodology & Data Analysis
• Limitations of the Research
• Discussions, Recommendations, & Conclusions
Problem Statement & Research Opportunities
• To date, there is limited research on digital leadership understanding to apply IT capabilities effectively for purposes of achieving competitive advantage using Big Data and Machine Learning practices.
• There are many professional news-media sources (e.g. case reports, white papers, and magazine articles) to help increase leadership awareness about advanced-computing technologies (McKinsey & Company, 2014)
• Few peer-reviewed journal articles on the leadership dimension of digital thinking and learning to achieve success with Big Data and Machine Learning practices
DIGITAL AWARENESS vs. DIGITAL UNDERSTANDING
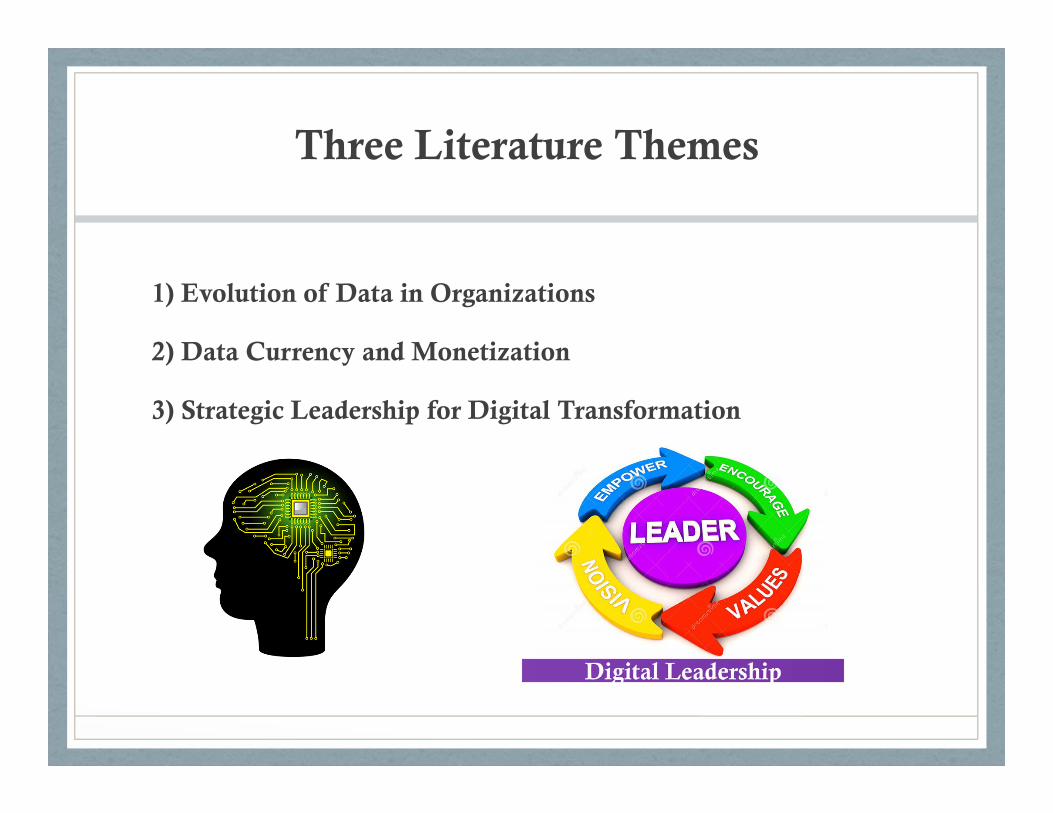
Three Literature Themes
1) Evolution of Data in Organizations
2) Data Currency and Monetization
3) Strategic Leadership for Digital Transformation
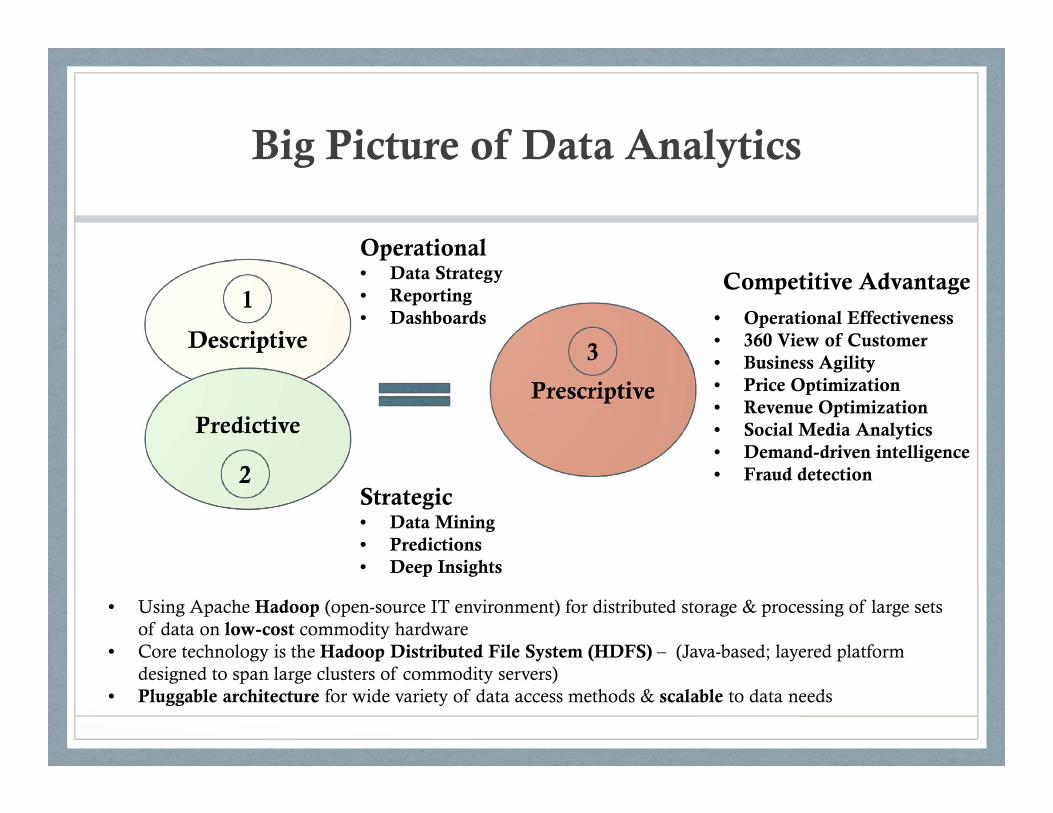
Big Picture of Data Analytics
Competitive Advantage
• Operational Effectiveness• 360 View of Customer• Business Agility• Price Optimization• Revenue Optimization• Social Media Analytics• Demand-driven intelligence• Fraud detection
Operational• Data Strategy• Reporting• Dashboards
Strategic• Data Mining• Predictions• Deep Insights
• Using Apache Hadoop (open-source IT environment) for distributed storage & processing of large sets of data on low-cost commodity hardware
• Core technology is the Hadoop Distributed File System (HDFS) – (Java-based; layered platform designed to span large clusters of commodity servers)
• Pluggable architecture for wide variety of data access methods & scalable to data needs
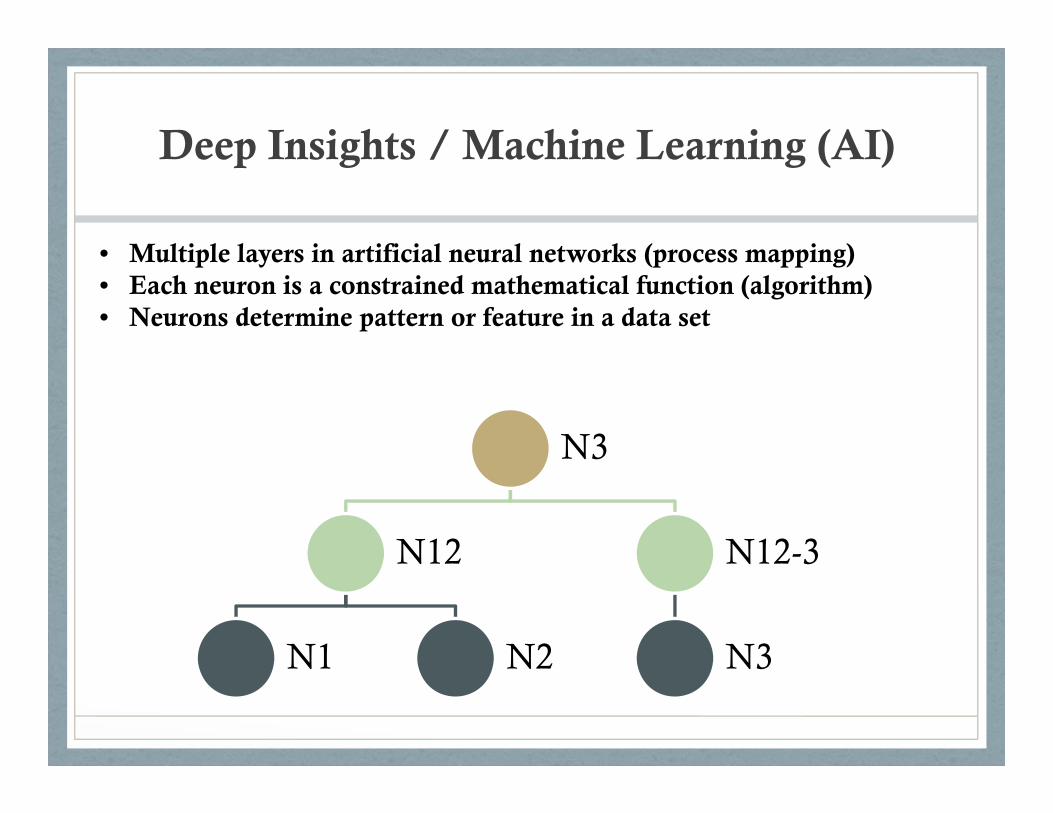
Deep Insights / Machine Learning (AI)
N3
N12
N1 N2
N12-3
N3
• Multiple layers in artificial neural networks (process mapping)• Each neuron is a constrained mathematical function (algorithm)• Neurons determine pattern or feature in a data set
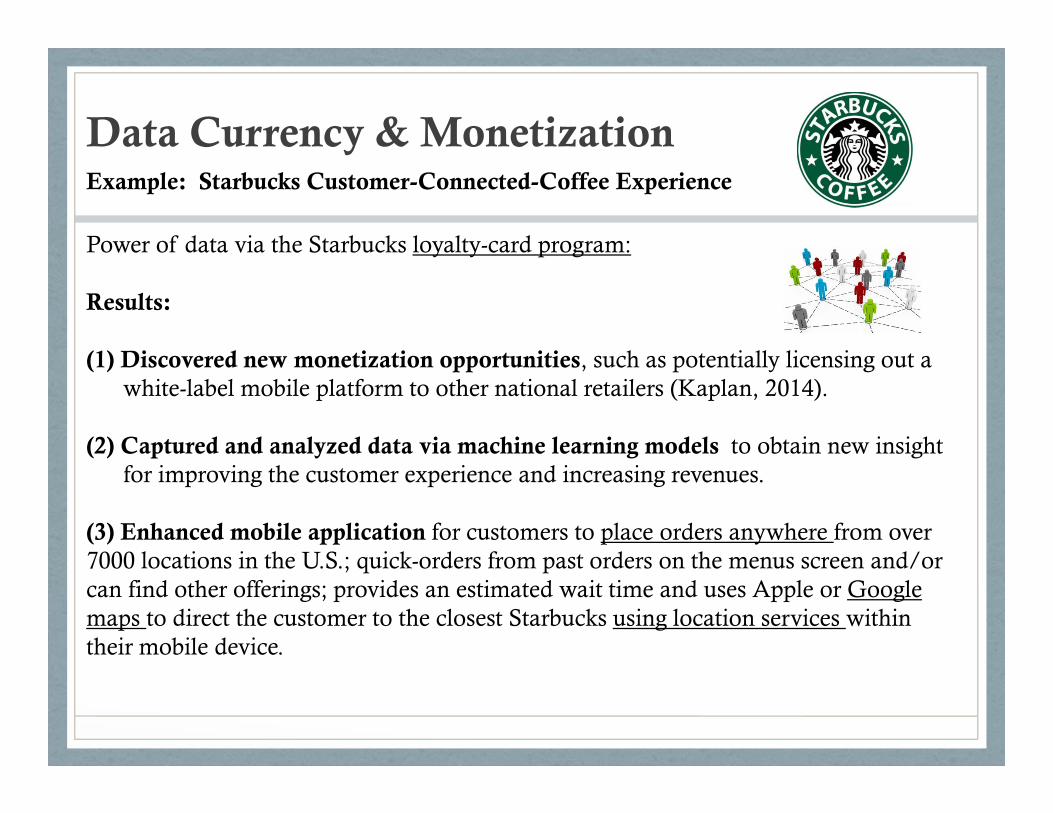
Data Currency & Monetization
Power of data via the Starbucks loyalty-card program:
Results:
(1) Discovered new monetization opportunities, such as potentially licensing out a white-label mobile platform to other national retailers (Kaplan, 2014).
(2) Captured and analyzed data via machine learning models to obtain new insightfor improving the customer experience and increasing revenues.
(3) Enhanced mobile application for customers to place orders anywhere from over 7000 locations in the U.S.; quick-orders from past orders on the menus screen and/or can find other offerings; provides an estimated wait time and uses Apple or Google maps to direct the customer to the closest Starbucks using location services within their mobile device.
Example: Starbucks Customer-Connected-Coffee Experience
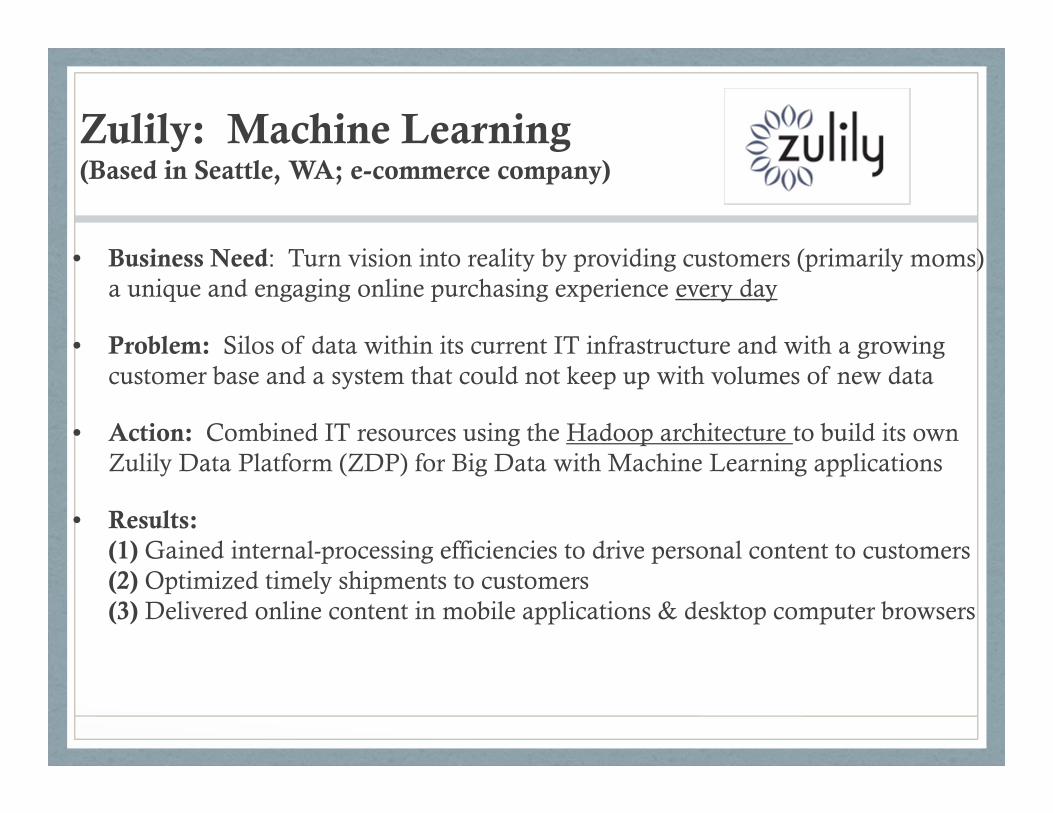
Zulily: Machine Learning(Based in Seattle, WA; e-commerce company)
• Business Need: Turn vision into reality by providing customers (primarily moms) a unique and engaging online purchasing experience every day
• Problem: Silos of data within its current IT infrastructure and with a growing customer base and a system that could not keep up with volumes of new data
• Action: Combined IT resources using the Hadoop architecture to build its own Zulily Data Platform (ZDP) for Big Data with Machine Learning applications
• Results: (1) Gained internal-processing efficiencies to drive personal content to customers(2) Optimized timely shipments to customers(3) Delivered online content in mobile applications & desktop computer browsers
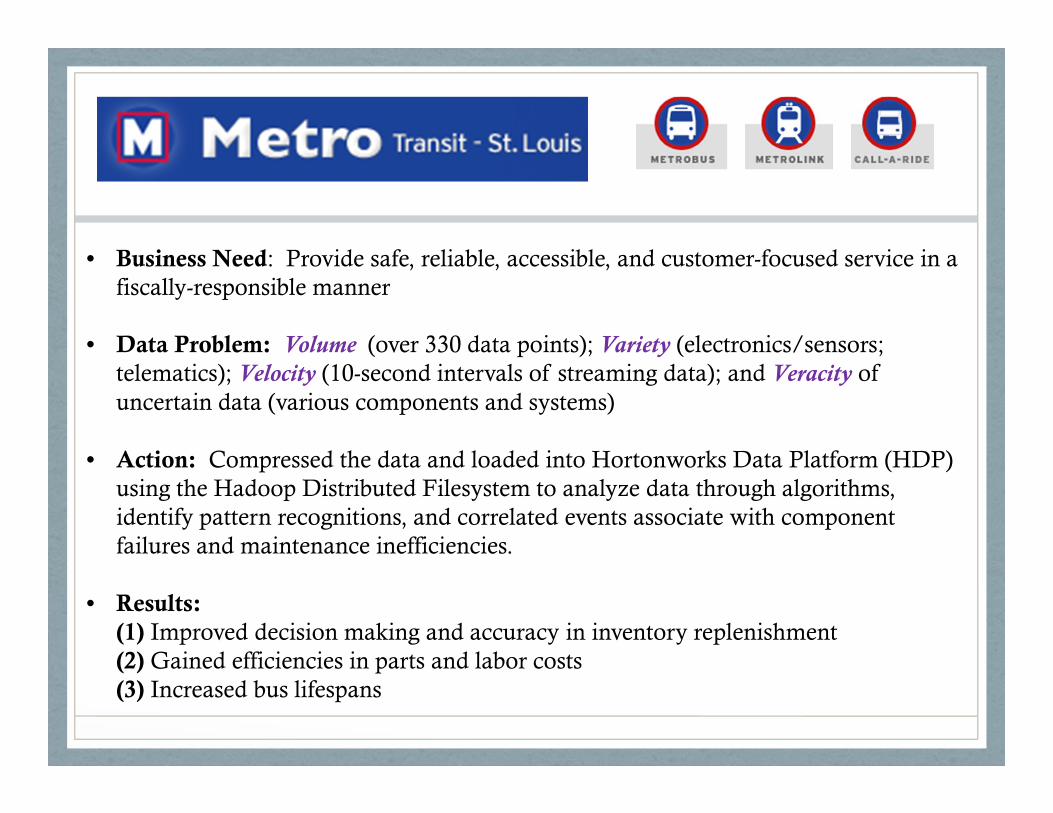
• Business Need: Provide safe, reliable, accessible, and customer-focused service in a fiscally-responsible manner
• Data Problem: Volume (over 330 data points); Variety (electronics/sensors; telematics); Velocity (10-second intervals of streaming data); and Veracity of uncertain data (various components and systems)
• Action: Compressed the data and loaded into Hortonworks Data Platform (HDP) using the Hadoop Distributed Filesystem to analyze data through algorithms, identify pattern recognitions, and correlated events associate with component failures and maintenance inefficiencies.
• Results: (1) Improved decision making and accuracy in inventory replenishment(2) Gained efficiencies in parts and labor costs(3) Increased bus lifespans
Methodology & Data Analysis
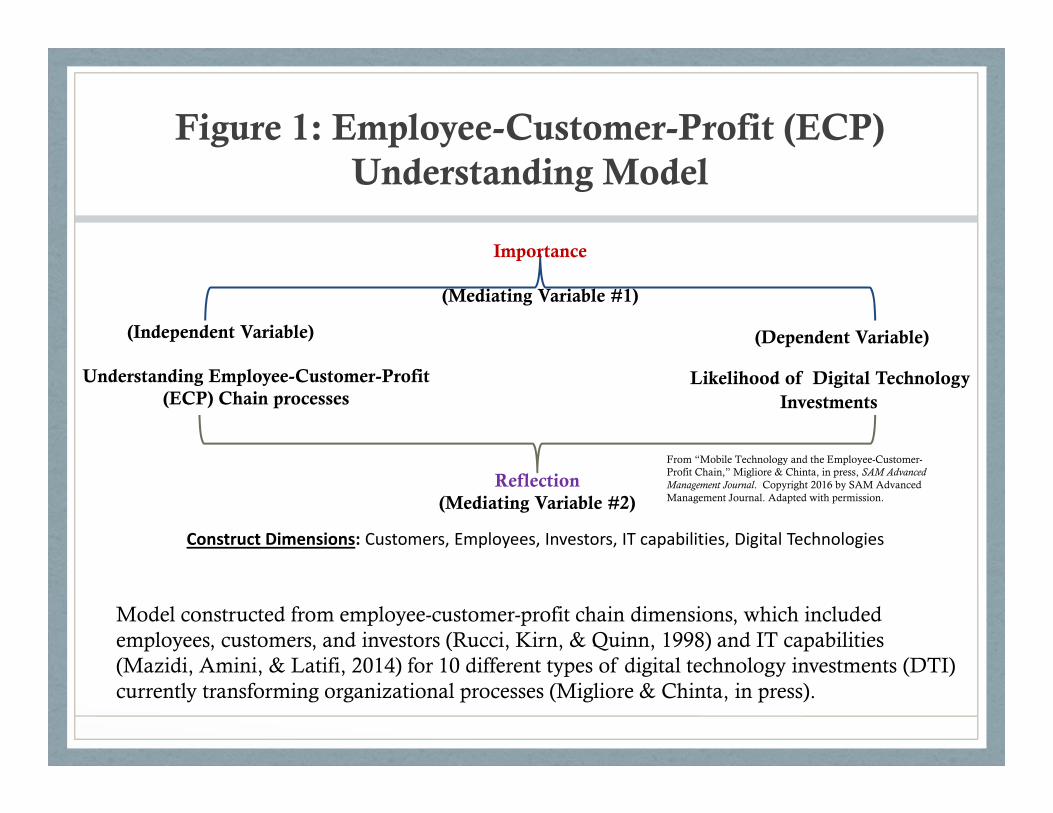
Figure 1: Employee-Customer-Profit (ECP) Understanding Model
Model constructed from employee-customer-profit chain dimensions, which included employees, customers, and investors (Rucci, Kirn, & Quinn, 1998) and IT capabilities (Mazidi, Amini, & Latifi, 2014) for 10 different types of digital technology investments (DTI) currently transforming organizational processes (Migliore & Chinta, in press).
Likelihood of Digital Technology Investments
Reflection(Mediating Variable #2)
Understanding Employee-Customer-Profit (ECP) Chain processes
Construct Dimensions: Customers, Employees, Investors, IT capabilities, Digital Technologies
Importance
(Mediating Variable #1)
(Independent Variable) (Dependent Variable)
From “Mobile Technology and the Employee-Customer-Profit Chain,” Migliore & Chinta, in press, SAM Advanced Management Journal. Copyright 2016 by SAM Advanced Management Journal. Adapted with permission.
Population, Sample, & Data Collection
• U.S. retail C-level executives (CEOs, CIOs, CTOs, etc.)
• Data collected through reliable and validated online-panel samples using a third-party reputable vendor, who has specialization in digital technologies for online market research
• The sample (N = 107) is generalized to U.S. retail firms having at least 50 employees on payroll and in business for at least five years (Migliore & Chinta, in press)
• Respondents were currently employed C-level executives with one of the following job-position titles:
OwnerChief Executive Officer (CEO)PresidentChief Information Officer (CIO)Chief Technology Officer (CTO)
Population, Sample, & Data Collection
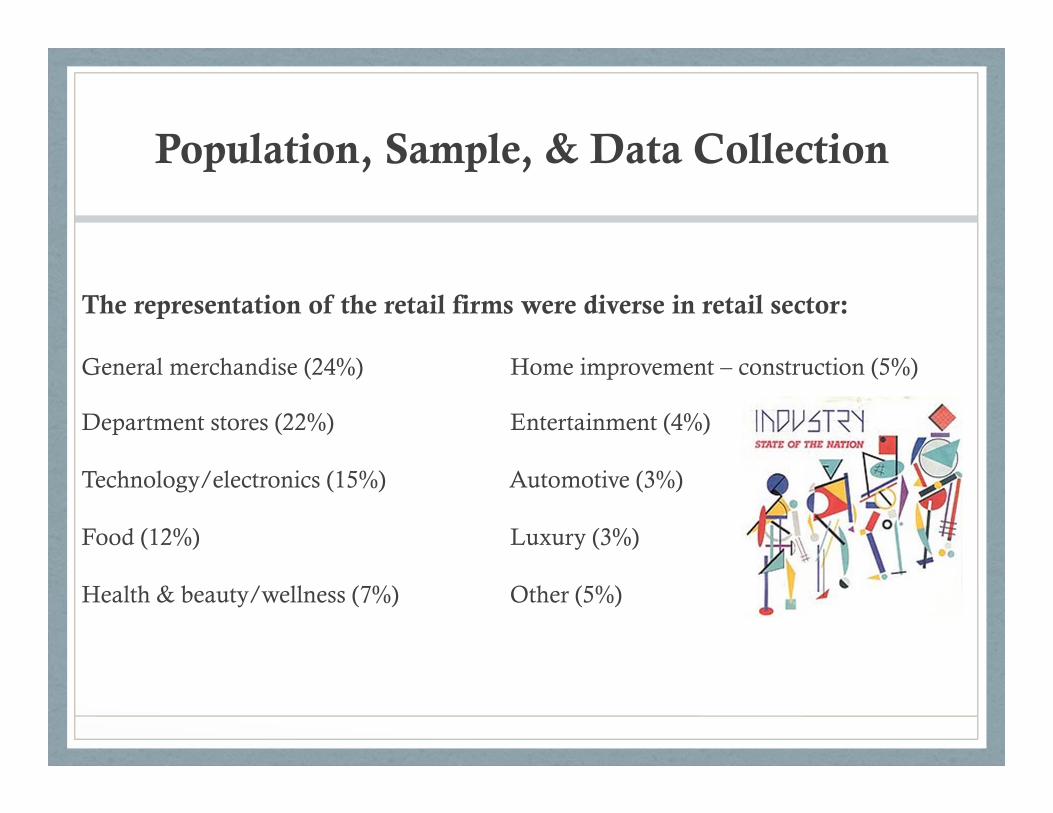
The representation of the retail firms were diverse in retail sector:
General merchandise (24%) Home improvement – construction (5%)
Department stores (22%) Entertainment (4%)
Technology/electronics (15%) Automotive (3%)
Food (12%) Luxury (3%)
Health & beauty/wellness (7%) Other (5%)
Data Analysis – Key Findings
• The unit of analysis is at the firm level
• Data analysis resulted in seven regression models to predict 10 different types of digital technology investments (DTI)
• The 10 Digital Technology Investments (DTI) included:
Data Analytics Enterprise application architectureMobile Device Application CybersecurityMobile Commerce (Wallets) Data architectureCrypto-Currency Acceptance SMART facilities – energy management systems Cloud and Distributed Computing Connected Car (wireless mobile)
Data Analysis – Key Findings
Data analytics and Connected Car showed statistical significance
According to Migliore & Chinta (in press):
“Data analytics showed significance when using Pearson’s test (r = .198 | .041 sig.), but fell just outside the range of significance when using Kendall Tau (T = .159 | .058). However, connected car showed significance using both: Pearson’s test (r = -.275 | .004 sig.) and Kendall Tau (T = -.189 | .018 sig.). The time frame for data analytics mean was 2.35, which from the survey translates into “need now or within current year” and the connected car mean was 2.95, which from the survey translates into “one to two years.” (p. 23)

Hardware & Software Purchases for Digital Initiatives
• The key predictor is understanding IT capabilities, which was extracted via factor analysis using dimensions of the employee-customer-profit (ECP) chain model and the different data sources that C-level executives use to reflect upon to gain understanding –reflection is a mediating variable in the model
• The data sources for understanding IT capabilities included the following from Migliore & Chinta, in press:
Information technology auditsTechnical consultationsTechnical training classesTrade industry or Professional ConferencesRisk assessmentConversations with employees, customers, suppliers, investors and peersPersonal observationsGut-felt intuition
Core Tenets

One important finding of the Migliore & Chinta (in press) study is the mediating role of the C-level leader’s focus, which include importance and frequency of reflection.
Here is where thinking preferences for what is considered important for improving financial performance is revealed in the frequency of reflection upon key data sources to obtain understanding about their firm’s ECP chain, IT capabilities, and ability to create value for competitive advantage.
These findings align with the leadership-thinking preferences and readiness to develop digital competencies for the digital age (DeBoer, Bothma, & Olwagen, 2012).
Core Tenets
Hardware & Software Purchases for Digital Initiatives
Model Summary & Coefficients
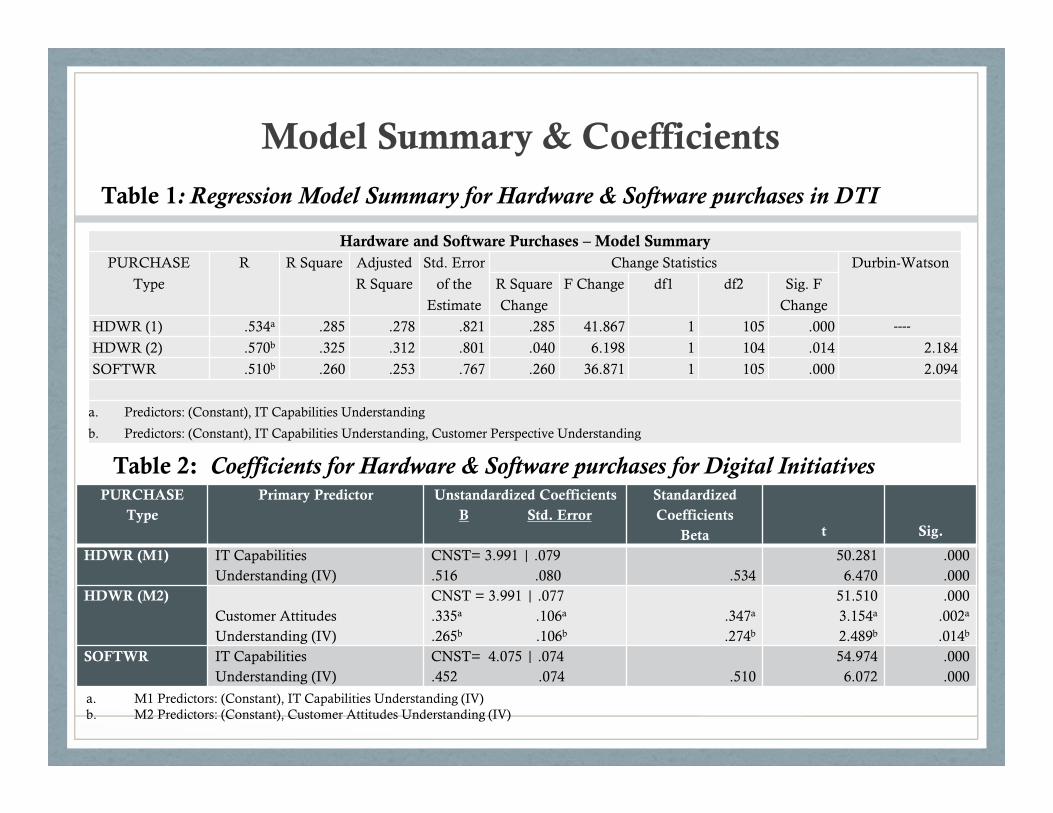
Table 1: Regression Model Summary for Hardware & Software purchases in DTI
Table 2: Coefficients for Hardware & Software purchases for Digital Initiatives
Hardware and Software Purchases – Model SummaryPURCHASE
Type
R R Square Adjusted
R Square
Std. Error
of the
Estimate
Change Statistics Durbin-Watson
R Square
Change
F Change df1 df2 Sig. F
Change
HDWR (1) .534a .285 .278 .821 .285 41.867 1 105 .000 ----
HDWR (2) .570b .325 .312 .801 .040 6.198 1 104 .014 2.184
SOFTWR .510b .260 .253 .767 .260 36.871 1 105 .000 2.094
a. Predictors: (Constant), IT Capabilities Understanding
b. Predictors: (Constant), IT Capabilities Understanding, Customer Perspective Understanding
PURCHASEType
Primary Predictor Unstandardized CoefficientsB Std. Error
StandardizedCoefficients
Beta t Sig.
HDWR (M1) IT CapabilitiesUnderstanding (IV)
CNST= 3.991 | .079.516 .080 .534
50.2816.470
.000
.000HDWR (M2)
Customer Attitudes Understanding (IV)
CNST = 3.991 | .077.335a .106a
.265b .106b
.347a
.274b
51.5103.154a
2.489b
.000.002a
.014b
SOFTWR IT CapabilitiesUnderstanding (IV)
CNST= 4.075 | .074.452 .074 .510
54.9746.072
.000
.000
a. M1 Predictors: (Constant), IT Capabilities Understanding (IV)b. M2 Predictors: (Constant), Customer Attitudes Understanding (IV)
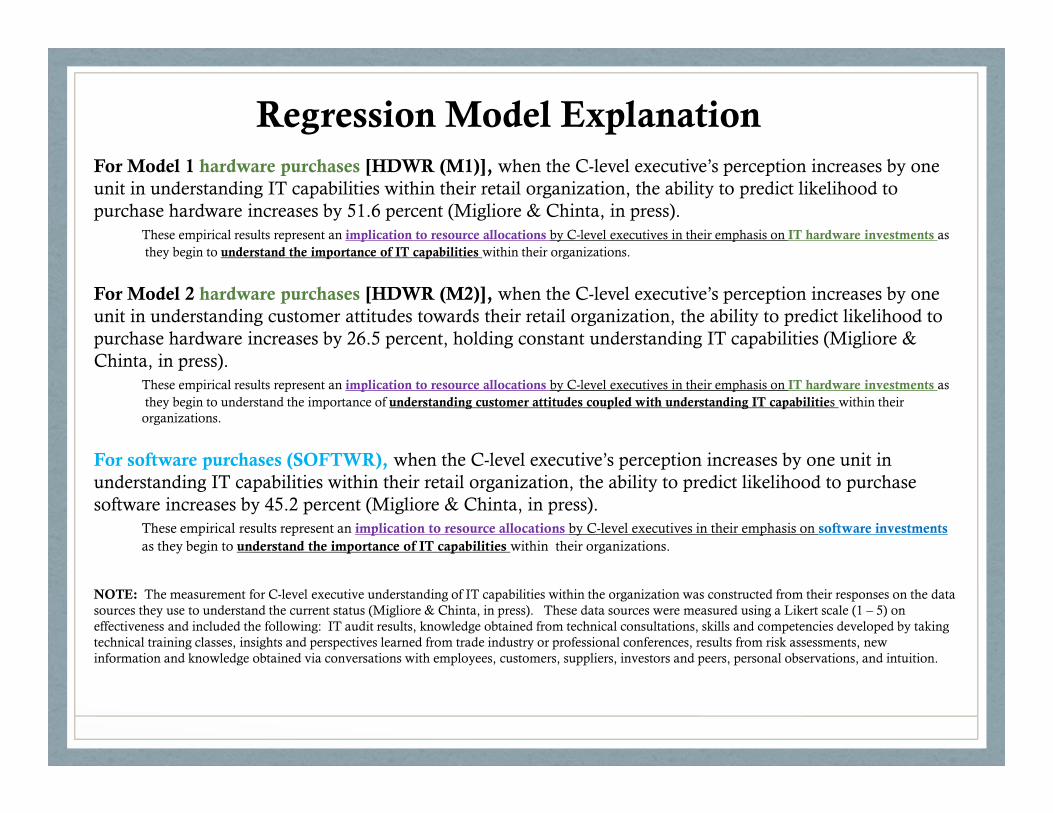
For Model 1 hardware purchases [HDWR (M1)], when the C-level executive’s perception increases by one unit in understanding IT capabilities within their retail organization, the ability to predict likelihood to purchase hardware increases by 51.6 percent (Migliore & Chinta, in press).
These empirical results represent an implication to resource allocations by C-level executives in their emphasis on IT hardware investments asthey begin to understand the importance of IT capabilities within their organizations.
For Model 2 hardware purchases [HDWR (M2)], when the C-level executive’s perception increases by one unit in understanding customer attitudes towards their retail organization, the ability to predict likelihood to purchase hardware increases by 26.5 percent, holding constant understanding IT capabilities (Migliore & Chinta, in press).
These empirical results represent an implication to resource allocations by C-level executives in their emphasis on IT hardware investments asthey begin to understand the importance of understanding customer attitudes coupled with understanding IT capabilities within their organizations.
For software purchases (SOFTWR), when the C-level executive’s perception increases by one unit in understanding IT capabilities within their retail organization, the ability to predict likelihood to purchase software increases by 45.2 percent (Migliore & Chinta, in press).
These empirical results represent an implication to resource allocations by C-level executives in their emphasis on software investmentsas they begin to understand the importance of IT capabilities within their organizations.
NOTE: The measurement for C-level executive understanding of IT capabilities within the organization was constructed from their responses on the data sources they use to understand the current status (Migliore & Chinta, in press). These data sources were measured using a Likert scale (1 – 5) on effectiveness and included the following: IT audit results, knowledge obtained from technical consultations, skills and competencies developed by taking technical training classes, insights and perspectives learned from trade industry or professional conferences, results from risk assessments, new information and knowledge obtained via conversations with employees, customers, suppliers, investors and peers, personal observations, and intuition.
Regression Model Explanation
Limitations of the Research
• The primary limitation in this study is self-reported responses used to construct the variables within the model (Figure 1)
• Next, the construct for the independent variable (understanding the ECP Chain) is C-level executive perception of understanding and not an actual test to measure and compare respondent scores to a set standard of what constitutes understanding of ECP
• Another limitation is the timing of the data collection, which occurred in late 2014. Since that time, the term and meaning of Big Data has continued to evolve among executive leader understanding to include Machine Learning Practices, as explained in this presentation
• For the phenomenon studied (executive’s understanding of ECP chain upon digital technology investments) there are many other variables that are not in our research frame and thus, may limit our generalization in sample size (107) to the greater U.S. retail population, even though our online-panel sample represented the characteristics of the greater U.S. retail population
Discussion Items
• The results of the Migliore & Chinta (in press) study show a sample of U.S. C-level retail executives whose perception of understanding, based upon focus of reflection and level of importance in IT capabilities, will lead to the likely investment in hardware and software purchases for digital technology initiatives (DTI)
• Only data analytics and connected vehicle showed statistical significance among the 10 DTIs; however, with the ongoing evolution of understanding IT capabilities, it is anticipated executive leaders will lean more towards cloud-distributed computing and find cost and processing efficiencies with the Hadoop architecture
• Data is like currency that can be used to create new value in customer experiences, increasing revenues through new monetization opportunities – data brokering industry and personal information to increase precision in predicting revenue and/or cost impact
• Leaders need digital competencies to understand how to translate meaning of data into action
8 Recommendations
To achieve strategic objectives aligned to your organization’s vision and mission statements, we recommend looking through the lens of learning and discovery when approaching Big Data and Machine Learning practices:
1. Be willing to explore the opportunity in the context of the problem and what it could mean for your organization by aligning it with a value-creating strategy.
2. Remain open to how Big Data/Machine Learning can improve the quality ofyour data.
3. Test assumptions to identify where gaps in data may be.
4. Gain clarity among the data science team and other key stakeholders by askingquestions to address most critical business problem(s).

8 Recommendations (cont.)
5. Exchange perspectives by having meaningful dialogue with data science teams and other key stakeholders
6. Structure the solution to identify the best data design and select the mostappropriate algorithm(s) for addressing the problem(s)
7. Open the channels of feedback to remove any silos and/or barriers to keepcommunications loop flowing
8. Execute appropriate actions and capture lessons learned to teach others andbuild digital competencies within the organization
Conclusion
• The key to demystifying the Big Data phenomena is to see it through the lens of revenue and profit, where data is a currency to be monetized for creating new value
• The strategic leadership implications include improved productivity, collaboration, and innovation via the combination of IT resources and capabilities within cloud-distributed environments
• These IT capabilities are made possible through stacked technology platforms like Hadoop and through use of Machine Learning algorithms to boost competitive advantage for those organizations who understand its potential and power in applying IT capabilities
For Additional Information and/or Questions
For more information on the Migliore & Chinta (in press) study, see the article, “Mobile Technology and the Employee Customer Profit (ECP) Chain” in the 2016 Winter Issue (81), Volume 1 of the SAM Advanced Management Journal (Pages 52-69).
Primary Contact: Dr. LauraAnn [email protected]
References
• Barghini, T. (July/August, 2015). Big Data: The future is now. Global Finance, 29(7), p. 17-19.
• Baur, C., and Wee, D. (June 2015). Manufacturing’s next act. McKinsey & CompanyRetrieved from http://www.mckinsey.com/insights/manufacturing/manufacturings_next_act
• Business Insider (2012). The Digital 100: The world’s most valuable private tech companies. Retrieved at http://www.businessinsider.com/2012-digital-100.
• DeBoer, A.L., Bothma,T.J.D., and Olwagen, J. (2012). Library leadership: Innovative options fordesigning training programmes to build leadership competencies in the digital age. SouthAfrican Journal of Libraries and Information Science, 78(2), 88-101.
• Green, F. (2012). Employee Involvement, Technology and Evolution in Jobs Skills: A Task-BasedAnalysis, Industrial and LaborRelations Review, Vol. 65, No. 1, pp. 35-66.
• Hortonworks (2016). Metro Transit of St. Louis using Hadoop.Retrieved from http://hortonworks.com/customer/metro-transit-of-st-louis/
• Hortonworks (2016). Zulily does Hadoop.Retrieved from http://hortonworks.com/customer/zulily/
• Informa Telecoms & Media (2012). Understanding today’s smartphone user: Demystifying data usage trends on cellular & Wi-Fi networks.White paper. Mobidia.
• Kaplan, D.A. (June, 2014). Starbucks: The art of endless transformation. Inc. Magazine.Retrieved at http://www.inc.com/magazine/201406/david-kaplan/howard-schultz-reinvents-starbucks-constantly.html
References (continued)
• Karlgaard, R. (March 2015). A bold look at Moore’s Law. Forbes Magazine. Retrieved from http://www.forbes.com/sites/richkarlgaard/2015/03/04/a-bold-look-at-moores-law/
• Manyika, J., Chui, M., Brown, B., Bughin, J., Dobbs, R., Roxburgh, C., and Byers, A. H. (2011). Big data: The next frontier for innovation, competition, and productivity. McKinsey Global Institute. Retrieved from http://www.mckinsey.com/insights/business_technology/big_data_the_next_frontier_for_innovation
• Mazidi, A.R.K., Amini, A., and Latifi, M. (2014). The impact of information technology capability on firm performance; a focus on employee-customer profit chain. Iranian Journal of Management 7(1), p. 95-120.
• McAfee, A., Brynjolfsson, E., Davenport, T. H., Patil, D. J., and Barton, D. (2012). Big data: The management revolution. Harvard Business Review, 90(10), 61-67.
• McKinsey & Company (2014). McKinsey global survey results: The digital tipping point. McKinsey & Company. Retrieved at http://www.mckinsey.com/insights/mgi.aspx
• Migliore, L.A. and Chinta, R. (in press). Mobile technology and the Employee-Customer-Profit Chain. SAM Advanced Management Journal, Winter 2016 81(1).
• Migliore, L.A. and Hubbard, H. (2016, January). Fast learning & leading in all things digital. Paper presented at the 2016 Clute International Academic Business Conference, Orlando FL. http://www.screencast.com/t/K8mbntw21MI
References (continued)
• Morris, J. and Lavandera, E. (2012). Why big companies buy, sell your data. CNNRetrieved at http://www.cnn.com/2012/08/23/tech/web/big-data-acxiom/
• Nanry, J., Narayanan, S. and Rassey, L. (March 2015). Digitizing the value chain. MckinseyQuarterly. Retrieved from http://www.mckinsey.com/insights/manufacturing/digitizing_the_value_chain
• OECD, 2013. OECD Skills Outlook 2013: First Results from the Survey of Adult Skills. Organization for Economic Cooperation and Development.
Porter, M.E., and Hepplemann, J.E. (October, 2015). How smart, connected products are transforming companies. Harvard Business Review.
Provost, F. and Fawcett, T. (2013). Data Science For Business: What you need to know about data mining and data-analytic thinking. O’Reilly: Sebastopol, CA.
• Pyle, D., and Jose, C.S. (June 2015). An executive’s guide to machine learning. McKinseyQuarterly. Retrieved from http://www.mckinsey.com/insights/high_tech_telecoms_internet/an_executives_guide_to_machine_learning
• Rucci, A.J., Kirn, S.P., and Quinn, R.T. (1998). The employee-customer-profit chain at Sears. Harvard Business Review 76(1), 83–97.
• Tech Target (2016). Data broker. What is.com. Retrieved from http://whatis.techtarget.com/definition/data-broker-information-broker
• Tummarello, K. (May 31, 2014). How data brokers are striking gold. The Hill. Retrieved from http://thehill.com/policy/technology/207809-how-data-brokers-are-striking-gold
• White, T. (2015). Hadoop: The definitive guide; storage and analysis at Internet scale.O’Reilly: Sebastopal, CA

Detailed Discussion Slides
Evolution of Data in Organizations
• Costs of traditional mainframe systems have dropped dramatically with distributed cloud-computing systems (Karlgaard, 2015)
• Significant rise in smartphone adoption and global Internet access
• Expanding universe of data creation in the online
In 2014, the global quantity of information was doubling every eight months.
In 2015, it was doubling every four months.
By 2020, the world will have a quadrillion times more information than it has now.
Source: Chief Executive.Net | March/April 2016
Data Currency & Monetization
The data-brokering business generates over $300 billion dollars per year; employs 3-million employees (Morris & Lavandera, 2012).
Data brokers collect personal information about consumers and sells that information to other organizations -- may be referred to as database marketers or consumer data analytics firms.
Data types: your name, phone number, residence, buying habits, interests, etc.
Data collection: courthouse records, mortgages, voter registration information, website cookies, loyalty card programs, social media platforms, retailer records including credit and debit card purchases, and/or information voluntarily shared online by consumers – surveys, sweepstakes entries, and warranty registrations.
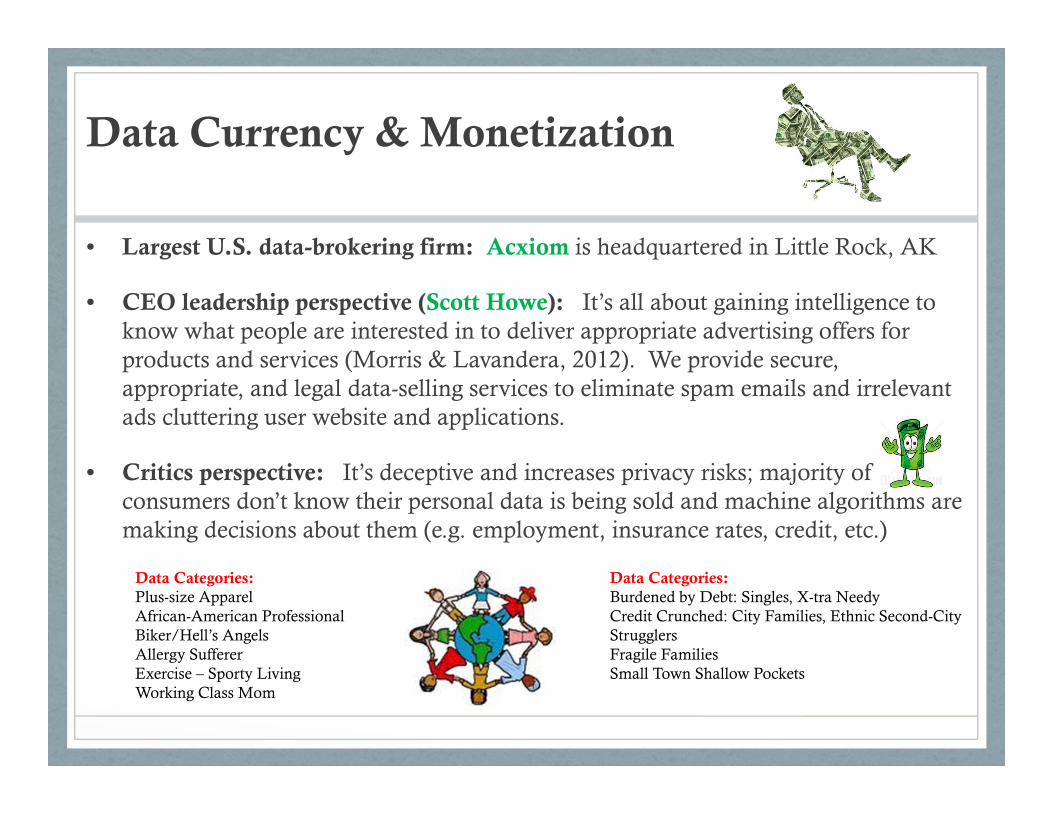
• Largest U.S. data-brokering firm: Acxiom is headquartered in Little Rock, AK
• CEO leadership perspective (Scott Howe): It’s all about gaining intelligence to know what people are interested in to deliver appropriate advertising offers for products and services (Morris & Lavandera, 2012). We provide secure, appropriate, and legal data-selling services to eliminate spam emails and irrelevant ads cluttering user website and applications.
• Critics perspective: It’s deceptive and increases privacy risks; majority of consumers don’t know their personal data is being sold and machine algorithms are making decisions about them (e.g. employment, insurance rates, credit, etc.)
Data Currency & Monetization
Data Categories: Plus-size ApparelAfrican-American ProfessionalBiker/Hell’s AngelsAllergy SuffererExercise – Sporty LivingWorking Class Mom
Data Categories: Burdened by Debt: Singles, X-tra NeedyCredit Crunched: City Families, Ethnic Second-City StrugglersFragile FamiliesSmall Town Shallow Pockets
Strategic Leadership for Digital Transformation
• Today, mass amounts of historical data (structured and unstructured)can be ingested into systems where a program (artificial intelligence) learns from the data using an algorithm to evaluate the data and create a model to predict future occurrences
• Examples include: Forecasting demand of sales, personalizing content, flagging suspicious transactions, detecting fraudulent orders, and filtering reviews, etc.
• Effective digital leaders will be known by the questions they ask – human in the loop to guide and direct the algorithms
• How likely is a customer to purchase a particular product based on past behavior?
• Does the algorithm need to be adjusted?
• How does the algorithm interact with other algorithms?