denial and punishment in the north caucasus: evaluating
TRANSCRIPT
Denial and Punishment in the North Caucasus: Evaluating the Effectiveness of Coercive Counter-Insurgency
CitationToft, Monica Duffy, and Yuri Zhukov. 2012. Denial and punishment in the north Caucasus: evaluating the effectiveness of coercive counter-insurgency. Journal of Peace Research 49(6): 785–800.
Published Versiondoi:10.1177/0022343312448389
Permanent linkhttp://nrs.harvard.edu/urn-3:HUL.InstRepos:11878769
Terms of UseThis article was downloaded from Harvard University’s DASH repository, and is made available under the terms and conditions applicable to Other Posted Material, as set forth at http://nrs.harvard.edu/urn-3:HUL.InstRepos:dash.current.terms-of-use#LAA
Share Your StoryThe Harvard community has made this article openly available.Please share how this access benefits you. Submit a story .
Accessibility

Supplemental Appendix:“Denial and Punishment in the North Caucasus”
Monica Duffy Toft and Yuri M. Zhukov
6 December 2011
Contents
1 Conflict Diffusion Literature List 2
2 The Epidemic Model 52.1 Proof of the stability of equilibrium solutions . . . . . . . . . . . . . . . . . . . . . . 52.2 Derivation of empirical R0 statistic . . . . . . . . . . . . . . . . . . . . . . . . . . . . 62.3 Empirical model: Markov Chain with spatial spline . . . . . . . . . . . . . . . . . . . 6
3 North Caucasus Violence Dataset 83.1 Automated event coding . . . . . . . . . . . . . . . . . . . . . . . . . . . . . . . . . . 83.2 Event coding rules . . . . . . . . . . . . . . . . . . . . . . . . . . . . . . . . . . . . . 93.3 Reliability of automated event coding . . . . . . . . . . . . . . . . . . . . . . . . . . . 11
4 Road Network Data and Dynamic Spatial Weights Matrix 13
5 Coding Rules for Aggregated Data 145.1 Geographic locations and dates . . . . . . . . . . . . . . . . . . . . . . . . . . . . . . 145.2 Conflict dynamics . . . . . . . . . . . . . . . . . . . . . . . . . . . . . . . . . . . . . . 145.3 Control variables . . . . . . . . . . . . . . . . . . . . . . . . . . . . . . . . . . . . . . 155.4 Interactions (pre-coded for transitional model) . . . . . . . . . . . . . . . . . . . . . . 16
6 Summary Statistics 18
7 Additional Regression Results 25
1

1 Conflict Diffusion Literature List
Tables 1-3 show a list of 90 most widely-cited articles on conflict diffusion, mentioned in Footnote 1of the manuscript. To be included, the articles had to be published in a major peer-reviewed politicalscience journal between 1980 and 2011 and listed in the Web of Science, Social Science CitationIndex and/or Google Scholar. For each article, we indicate its level of analysis (cross-national orsubnational) and the type of conflict analyzed (interstate war, civil war and insurgency, terrorism,revolutions and protests). The list excludes disaggregated studies of conflict, which do not directlyaddress the question of how violence spreads (e.g. Kalyvas 2006, Lyall 2009).
Of the 90 articles, 77 are on the cross-national level and only indirectly address the dynamics ofstate responses to insurgency. Of 13 subnational studies on the list, 7 disaggregate conflict events bycombatant (Saxton 2005; Saxton and Benson 2008; Townsley et al. 2008; O’Loughlin and Witmer2011; O’Loughlin et al. 2010a, b, O’Loughlin et al. 2011). None explores state coercion directly.
Table 1: Conflict Diffusion Literature (part 1 of 3)
Year Article Level of Analysis Type of Conflict2011 De Groot (2011) Cross-National Ethnic Conflict2011 Kathman (2011) Cross-National Civil War and Insurgency2011 Murdie and Bhasin (2011) Cross-National Revolutions and Protests2011 O’Loughlin et al. (2011) Sub-National Civil War and Insurgency2011 O’Loughlin and Witmer (2011) Sub-National Civil War and Insurgency2011 Rasler and Thompson (2011) Cross-National Interstate War2011 Schutte and Weidmann (2011) Sub-National Civil War and Insurgency2011 Vasquez et al. (2011) Cross-National Interstate War2010 Braithwaite (2010b) Cross-National Civil War and Insurgency2010 Braithwaite (2010a) Cross-National Interstate War2010 Bunce and Wolchik (2010) Cross-National Revolutions and Protests2010 Kathman (2010) Cross-National Civil War and Insurgency2010 Neumayer and Plumper (2010) Cross-National Terrorism2010 O’Loughlin et al. (2010)a Sub-National Civil War and Insurgency2010 O’Loughlin et al. (2010)b Sub-National Civil War and Insurgency2010 Raleigh et al. (2010) Sub-National Civil War and Insurgency2010 Reed and Chiba (2010) Cross-National Interstate War2010 Weidmann and Toft (2010) Sub-National Civil War and Insurgency2010 Weidmann and Ward (2010) Sub-National Civil War and Insurgency2010 Weyland (2010) Cross-National Revolutions and Protests2009 Cederman et al. (2009) Cross-National Ethnic Conflict2009 Cederman et al. (2009) Cross-National Ethnic Conflict2009 Gartzke and Jo (2009) Cross-National Interstate War2009 Raleigh and Hegre (2009) Sub-National Civil War and Insurgency2009 Weidmann (2009) Cross-National Ethnic Conflict2009 Weyland (2009) Cross-National Revolutions and Protests2009 Wimmer et al. (2009) Cross-National Ethnic Conflict
2

Table 2: Conflict Diffusion Literature (part 2 of 3)
Year Article Level of Analysis Type of Conflict2008 Buhaug and Gleditsch (2008) Cross-National Civil War and Insurgency2008 De Soysa and Neumayer (2008) Cross-National Civil War and Insurgency2008 Forsberg (2008) Cross-National Ethnic Conflict2008 Iqbal and Starr (2008) Cross-National Civil War and Insurgency2008 Salehyan (2008b) Cross-National Civil War and Insurgency2008 Salehyan (2008a) Cross-National Civil War and Insurgency2008 Saxton and Benson (2008) Cross-National Revolutions and Protests2008 Townsley et al. (2008) Sub-National Civil War and Insurgency2008 Urdal (2008) Sub-National Civil War and Insurgency2008 Way (2008) Cross-National Revolutions and Protests2007 Beissinger (2007) Cross-National Revolutions and Protests2007 Braithwaite and Li (2007) Cross-National Terrorism2007 Gleditsch (2007) Cross-National Civil War and Insurgency2007 Ward et al. (2007) Cross-National Interstate War2007 Ward and Hoff (2007) Cross-National Interstate War2006 Beck et al. (2006) Cross-National Interstate War2006 Braithwaite (2006) Cross-National Interstate War2006 Braumoeller (2006) Cross-National Interstate War2006 Dorussen (2006) Cross-National Interstate War2006 Furlong et al. (2006) Cross-National Interstate War2006 Hegre and Sambanis (2006) Cross-National Civil War and Insurgency2006 Salehyan and Gleditsch (2006) Cross-National Civil War and Insurgency2005 Braithwaite (2005) Cross-National Interstate War2005 Saxton (2005) Sub-National Revolutions and Protests2005 Senese (2005) Cross-National Interstate War2005 Starr (2005) Cross-National Interstate War2005 Starr and Thomas (2005) Cross-National Interstate War2005 Tir (2005) Cross-National Interstate War2004 Fox (2004) Cross-National Ethnic Conflict2003 Furlong and Gleditsch (2003) Cross-National Interstate War2003 Leeds (2003b) Cross-National Interstate War2003 Leeds (2003a) Cross-National Interstate War2003 Starr (2003) Cross-National Interstate War
3

Table 3: Conflict Diffusion Literature (part 3 of 3)
Year Article Level of Analysis Type of Conflict2002 Hammarstrom and Heldt (2002) Cross-National Interstate War2002 Starr (2002) Cross-National Interstate War2002 Starr and Thomas (2002) Cross-National Interstate War2002 Ward and Gleditsch (2002) Cross-National Interstate War2001 Cederman (2001) Cross-National Interstate War2001 Gleditsch and Ward (2001) Cross-National Interstate War2001 Hegre et al. (2001) Cross-National Civil War and Insurgency2001 Oneal and Russett (2001) Cross-National Interstate War2000 Bonneuil and Auriat (2000) Cross-National Revolutions and Protests2000 Gleditsch and Ward (2000) Cross-National Interstate War2000 Rasler and Thompson (2000) Cross-National Interstate War1999 Reising (1999) Cross-National Revolutions and Protests1998 Dudley and Miller (1998) Cross-National Revolutions and Protests1998 Enterline (1998a) Cross-National Interstate War1998 Enterline (1998b) Cross-National Interstate War1998 Kadera (1998) Cross-National Civil War and Insurgency1998 Simowitz (1998) Cross-National Interstate War1998 Simowitz and Sheffer (1998) Cross-National Interstate War1998 Starr and Siverson (1998) Cross-National Interstate War1997 Raknerud and Hegre (1997) Cross-National Interstate War1995 Carment and James (1995) Cross-National Ethnic Conflict1994 Hammarstrom (1994) Cross-National Interstate War1993 Gurr (1993) Cross-National Civil War and Insurgency1991 O’Loughlin and Anselin (1991) Cross-National Interstate War1990 Most and Starr (1990) Cross-National Interstate War1990 Siverson and Starr (1990) Cross-National Interstate War1985 Starr and Most (1985) Cross-National Interstate War1983 Starr and Most (1983) Cross-National Interstate War1982 Bremer (1982) Cross-National Interstate War1980 Most and Starr (1980) Cross-National Interstate War
4

2 The Epidemic Model
2.1 Proof of the stability of equilibrium solutions
Recall that the epidemic model of conflict diffusion and containment is represented by the followingsystem of differential equations:
V = (β − d)V C − (α+ p)V (1)
C = −(β − d)V C + (α+ p)V (2)
where
• V = proportion of units experiencing insurgent violence at t,
• C = proportion of units experiencing no violence at t,
• V , C = time derivatives of V,C,
• β = rate of transmissibility in the absence of denial,
• α = rate of recovery in the absence of punishment,
• d = offsetting impact of denial on transmissibility,
• p = offsetting impact of punishment on recovery.
The system can be solved for the following equilibria
(non-violent equilibrium) Veq = 0 Ceq = 1 (3)
(violent equilibrium) Veq = 1− α+ p
β − dCeq =
α+ p
β − d(4)
The Jacobian matrix of the system is
J =
(−(α+ p) + (β − d)C (β − d)V(α+ p)− (β − d)C −(β − d)V
)(5)
We also define the basic reproduction number R0
R0 =β − dα+ p
(6)
The equilibria in (3, 4) are neutrally stable if det(J) ≥ 0 and tr(J) ≤ 0, when J is evaluated atthe corresponding equilibrium values of V and C. The stability condition holds for the non-violentequilibrium as long as α + p > β − d (or R0 < 1), and for the violent equilibrium as long asα+ p < β − d (or R0 > 1).
5
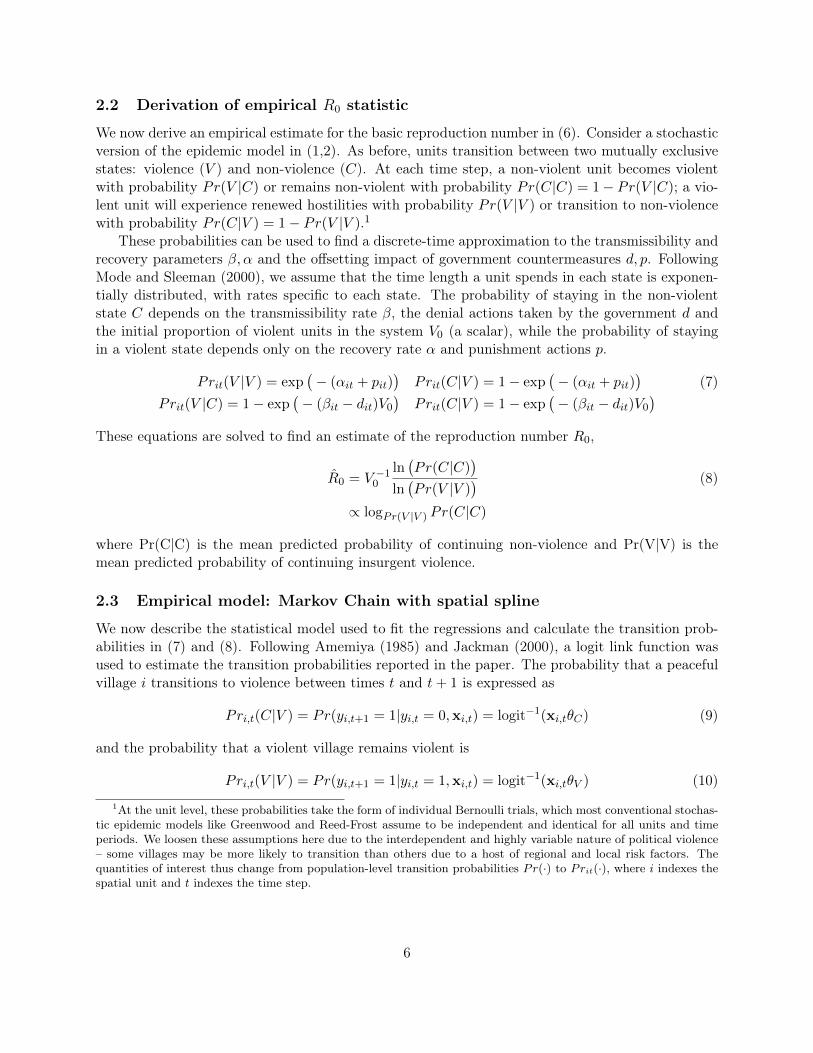
2.2 Derivation of empirical R0 statistic
We now derive an empirical estimate for the basic reproduction number in (6). Consider a stochasticversion of the epidemic model in (1,2). As before, units transition between two mutually exclusivestates: violence (V ) and non-violence (C). At each time step, a non-violent unit becomes violentwith probability Pr(V |C) or remains non-violent with probability Pr(C|C) = 1− Pr(V |C); a vio-lent unit will experience renewed hostilities with probability Pr(V |V ) or transition to non-violencewith probability Pr(C|V ) = 1− Pr(V |V ).1
These probabilities can be used to find a discrete-time approximation to the transmissibility andrecovery parameters β, α and the offsetting impact of government countermeasures d, p. FollowingMode and Sleeman (2000), we assume that the time length a unit spends in each state is exponen-tially distributed, with rates specific to each state. The probability of staying in the non-violentstate C depends on the transmissibility rate β, the denial actions taken by the government d andthe initial proportion of violent units in the system V0 (a scalar), while the probability of stayingin a violent state depends only on the recovery rate α and punishment actions p.
Prit(V |V ) = exp(− (αit + pit)
)Prit(C|V ) = 1− exp
(− (αit + pit)
)(7)
Prit(V |C) = 1− exp(− (βit − dit)V0
)Prit(C|V ) = 1− exp
(− (βit − dit)V0
)These equations are solved to find an estimate of the reproduction number R0,
R0 = V −10
ln(Pr(C|C)
)ln(Pr(V |V )
) (8)
∝ logPr(V |V ) Pr(C|C)
where Pr(C|C) is the mean predicted probability of continuing non-violence and Pr(V|V) is themean predicted probability of continuing insurgent violence.
2.3 Empirical model: Markov Chain with spatial spline
We now describe the statistical model used to fit the regressions and calculate the transition prob-abilities in (7) and (8). Following Amemiya (1985) and Jackman (2000), a logit link function wasused to estimate the transition probabilities reported in the paper. The probability that a peacefulvillage i transitions to violence between times t and t+ 1 is expressed as
Pri,t(C|V ) = Pr(yi,t+1 = 1|yi,t = 0,xi,t) = logit−1(xi,tθC) (9)
and the probability that a violent village remains violent is
Pri,t(V |V ) = Pr(yi,t+1 = 1|yi,t = 1,xi,t) = logit−1(xi,tθV ) (10)
1At the unit level, these probabilities take the form of individual Bernoulli trials, which most conventional stochas-tic epidemic models like Greenwood and Reed-Frost assume to be independent and identical for all units and timeperiods. We loosen these assumptions here due to the interdependent and highly variable nature of political violence– some villages may be more likely to transition than others due to a host of regional and local risk factors. Thequantities of interest thus change from population-level transition probabilities Pr(·) to Prit(·), where i indexes thespatial unit and t indexes the time step.
6

where yi,t = 1 indicates that location i is experiencing insurgent violence at time t, and yi,t = 0otherwise. θC and θV are sets of regression coefficients that capture the conditional effects of thecovariates x under the two possible current states. These equations are reduced to
Pri,t(V ) = Pr(yi,t+1 = 1|xi,t) = logit−1(xi,tθC + yi,txi,tγ) (11)
where θV = θC+γ. Finally, the expression in (5) is used as the parametric portion of a GAM model
Pri,t(V ) = logit−1(xi,tθC + yi,txi,tγ + f(Longi,Lati)
)(12)
where f(Longi,Lati) is a thin-plate regression spline of the geographic coordinates of village i.GAMs assume that the mean of the dependent variable (E[Yi,t] = µi,t) depends on an additive
predictor through a link function g(µi,t), and that the linear predictor can include parametric modelcomponents and an unknown nonparametric smooth function f():
E[Yi,t] = µi,t = g−1(X∗′i,tβ + f(Longi,Lati)
)(13)
where X∗i,t is the i, tth row of the model matrix for the strictly parametric model components, andf(Longi,Lati) is a thin-plate regression spline of the geographic coordinates of village i.
Thin-plate splines (Duchon, 1977; Wood, 2003) estimate f by minimizing
||y − f ||+ λJmd(f) (14)
where y is a vector of yi’s, f = |f(x1), . . . , f(xn)|′, x is an n × d matrix of predictors (in thiscase, longitude and latitude), ||.|| is the Euclidean norm, λ is a smoothing parameter, and Jmd is a“wiggliness penalty” for f , defined as
Jmd =
∫. . .
∫Rd
∑ν1+···+νd=m
m!
ν1! . . . νd!
(∂mf
∂xν11 . . . ∂xνdd
)2
dx1 . . . dxd (15)
where m is the order of differentiation, satisfying 2m > d. In the two predictor case, the wigglinesspenalty becomes
J22 =
∫ ∫ ( ∂2f
∂Long2)2
+ 2( ∂2f
∂Long2∂Lat2)2
+( ∂2f
∂Lat2)2dLongdLat (16)
When λ = 0, the expression in (2) can be treated as a pure regression spline. When λ 6= 0, theexpression becomes a penalized regression spline. λ also governs the model degrees of freedom, andcan be selected with criteria like generalized cross-validation or the Akaike information criterion(AIC).
The advantage of thin-plate regression splines is that they avoid the knot placement problems ofconventional regression spline modeling, thus reducing the subjectivity of the model fitting process.They also nest smooths of lower rank within smooths of higher rank. GAM models can be estimatedin R using the mgcv package developed by Simon Wood. See Wood (2006) for a detailed discussionof this class of models.
7
3 North Caucasus Violence Dataset
We use a new dataset of violent incidents in the Russian North Caucasus. The panel dataset is basedon monthly observations across 7,584 municipalities in the seven autonomous republics of the NorthCaucasus, and two adjacent regions (oblasts).2 The sample of villages and towns is universal, encom-passing all populated places within these regions, as listed in the National Geospatial-IntelligenceAgency’s GEOnet Names Server (GNS). For each month between July 2000 and December 2008, theincidence and number of violent events in each village were measured through automated text min-ing of the independent Memorial Group’s “Hronika nasiliya [Chronicle of Violence]” event summaries(Memorial, 2009). Fuzzy string matching was used to geocode these violent events to the munici-palities in sample, so as to account for alternate spellings in Russian and a host of local languages.The dataset includes micro-level information on the dates, geographic coordinates, participants, andcasualties of episodes of political violence and other forms of unrest distributed across these villagesand towns. To capture the connective topology of the study region, a dynamic network datasetwas created, with individual villages as the units (or nodes, in network analysis terms), and roaddistances as the connections (or edges) between them. The following appendix provides a descrip-tion of the data collection strategy, coding rules, dynamic road network estimation, aggregation andsummary statistics.
3.1 Automated event coding
A few words are in order about the data collection strategy and selection criteria used in supportof our analysis. Since the original Memorial data are in raw text format, automated text analysiswas used to mine the Memorial timeline for the dates, locations, actors involved, casualty tolls, andtypes of incidents. The data extraction strategy we employed differs from traditional automatedapproaches in several ways. First, dictionary-based event coding algorithms typically use parsingtechniques or pattern recognition to code incidents in a “who-does-what-to-whom” format, of whichcategory typologies like VRA and TABARI are prime examples (Schrodt and Gerner, 1994; Schrodt,2001; Gerner et al., 2002; King and Lowe, 2003; Shellman, 2008). We opted for a somewhat simplerapproach based on Boolean association rules and indexing algorithms (Han and Kamber 2001, 230-236; Kim et al. 2001). While not appropriate for all applications, this approach is far more efficientfor data-mining highly structured event summaries of the sort that comprise the Memorial timeline– where all entries are of approximately the same length (1-2 sentences) and content (date, location,what happenned, who was involved). Second, while various studies have shown that reliance on asingle news source in events data analysis can mask important inferences and differences in mediareporting, most previous uses of events data have relied on only one news source (Reeves et al.,2006; Davenport and Stam, 2006; Davenport and Ball, 2002). The advantage of Memorial’s eventsummaries is that they compile daily reports from international news wires, Russian state and localnewspapers, news websites, radio and television broadcasts, and independent reporters, permittinga diverse approach to corpus building which reduces the risk of reporting bias.3
2In alphabetical order, the republics are Adygea, Chechnya, Dagestan, Ingushetia, Kabardino-Balkaria,Karachaevo-Cherkessiya, and North Ossetia. The two oblasts are Krasnodar Kray and Stavropol Kray. The datasetincludes 7,584 villages ×102 months = 773,568 village-month observations.
3A natural concern with this, like all disaggregated events datasets, is that media are more likely to report incidentslocated in accessible areas (Raleigh and Hegre, 2009, 234). This problem is addressed somewhat by Memorial’s relianceon reports from human rights observers and local independent sources – who benefit from greater access to isolatedareas than mass media organization with relatively few local ties.
8

From these raw data, the Text Mining (tm) package in the R statistical language was used toassemble a corpus of 38,789 text documents, perform natural language processing (removing wordorder and Russian stop words) and create a document-term matrix (Feinerer, 2008; Feinerer et al.,2008). Two custom dictionaries were used to code events and automatically georeference themagainst the U.S. National Geospatial Intelligence Agency’s database of 7,584 municipalities (i.e.cities, towns, villages, and populated places) in the seven North Caucasus Republics (Dagestan,Chechnya, Ingushetia, North Ossetia, Kabardino-Balkaria, Karachaevo-Cherkesiya, Adygea) andtwo adjacent majority Russian regions (Stavropol’skiy Kray and Krasnodarskiy Kray).
Of the 38,789 records in Memorial’s timeline, 9,953 were reports of a historical nature, pressstatements, and other entries not addressing specific incidents of violence or their geographicallocations. Of the remaining 28,836, we were able to geocode 73% at the municipality level, 6%at the rayon (district) level and 21% at the oblast (province) level. In all, 21,050 unique eventswere geocoded for 7,584 municipalities between January 2000 and September 2009, representingas close to a universal sample of state and nonstate violence in Russia as open sources currentlypermit – compared with just 925 Russian events for the entire post-Soviet period in the GlobalTerrorism Database (LaFree and Dugan, 2007) and 14,177 events in the North Caucasus datacollected by ? and O’Loughlin et al. (2011). The near-universal coverage of the data permits a“whole” network design, with boundary specification defined only by the administrative borders ofthe nine southern Russian regions. Because the Memorial event summaries are updated both inreal time and retroactively, we narrowed the period of observation to the months for which thejournalistic record is relatively complete: July 2000 - December 2008.
3.2 Event coding rules
Insurgent violence: Event must involve at least one of the following actors: nonstate armedgroups (NVF), defined by Russian law as any armed group, militia, guerilla or terrorist orga-nization, formed outside the frameworks of existing laws and operating outside the commandand control structure of the Russian state; and at least one of the following actions: terroristattack, hostage-taking, firefight, bombing, ambush, hit and run attack. Definition does notinclude events initiated by government forces and non-political acts of violence – such as thoseresulting from unambiguously criminal activity like burglary and armed robbery.
Example: V noq~ na 29 i�n� v s. Elistan�i Vedenskogo raiona Qeqen-skoi Respubliki voxel otr�d boevikov do 70 qelovek. Oni obstrel�limesto dislokacii roty batal~ona �g, a tak �e mesto dislokacii POMposelkovogo otdela milicii, kotoryi sostoit iz sotrudnikov milicii,prikomandirovannyh iz drugih regionov RF. Boeviki ubili voditel�glavy administracii Vedenskogo raiona, mestnogo �itel�. Ego vyveliiz doma i zastrelili na ulice. Tak�e byla obstrel�na maxina s sotrud-nikami batal~ona �g, kotorye ehali iz s. Agixbatoi v s. Elistan�i.V rezultate pogib sotrudnik batal~ona. K utru boeviki uxli iz sela.
Translation: On the night of 29 July a detachment of up to 70 insurgents enteredthe village of Elistanzhi, Venedo district, Chechen Republic. They opened fire onthe positions of a company of the “Yug" Battalion, as well as the positions of themunicipal police department, which consists of police officers dispatched from other
9
regions of the Russian Federation. The insurgents killed the driver of the head ofVedeno District, a local resident. He was taken from his home and shot on thestreet. A car with “Yug” Battalion personnel also came under fire, as it was drivingfrom Agishbatoy village to Elistanzhi. As a result one serviceman was killed. Bymorning the insurgents had left the village. [Event ID: 34117; Date: 20080629]
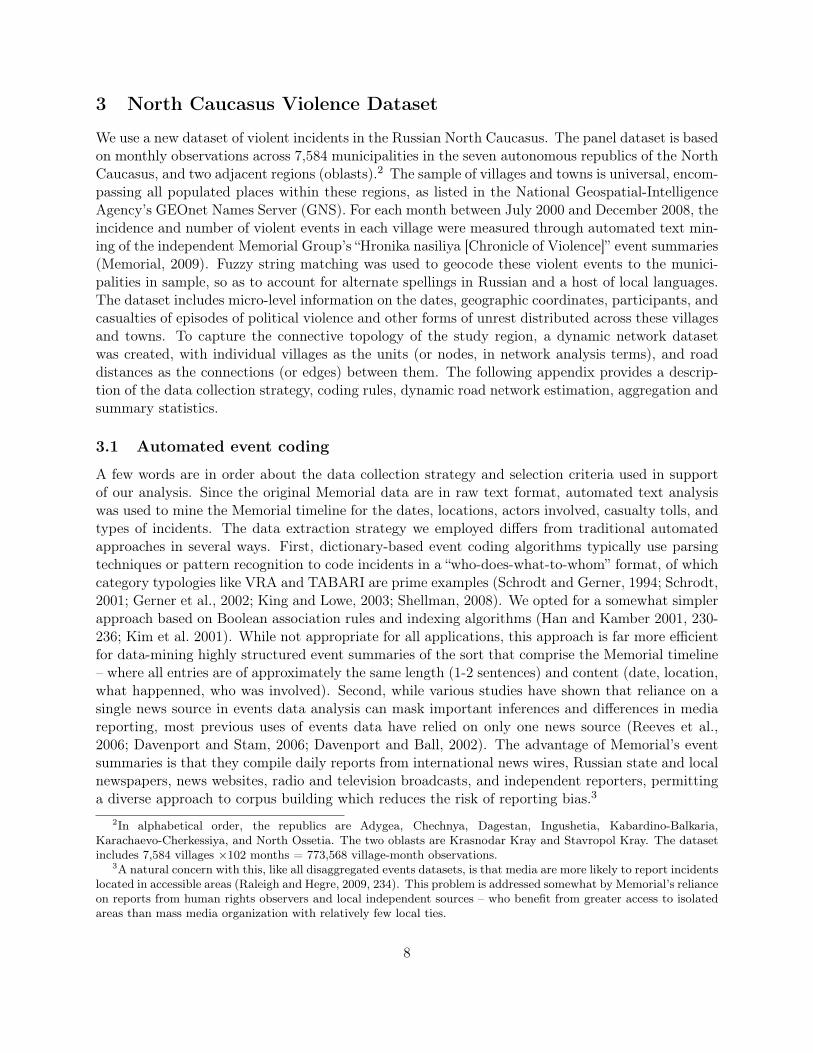
Kinetic Operations (punishment): Event must involve at least one of the following actors:Russian Armed Forces, Federal Security Services, Special Forces, Ministry of Internal Affairs,local police, local administration, federal administration; and at least one of the followingactions: search and destroy missions, artillery strikes, air strikes, raids, any incidents of gov-ernment violence that took place as part of a “counterterrorist operation” (KTO), definedin Russian law as a “combination of special-purpose combat operations and other measuresinvolving military hardware, weapons and special means to prevent terrorist acts, neutral-ize terrorists, provide physical security to persons and facilities, as well as to minimize theconsequences of terrorist actions.”
Example: 5 fevral� posle 9.00 po s. Alhan-Kala Groznenskogo raionananesen artilleriiskii udar. S razliqnoi stepen~� intensivnosti snar�dyrvalis~ na territorii naselennogo punkta ne menee dvuh qasov. V rezul~tateartobstrela raneny xest~ qelovek. V vostoqnoi qasti sela, neposred-stvenno primyka�xhei k g. Groznomu, byli povre�deny bolee des�tidomov.
Translation: On 5 February after 9:00 an artillery strike was carried out on thevillage Alkhan-Kala, Groznenskiy district. With varying degrees of intensity, muni-tions continued to explode over the population center for no less than two hours. Asa result of the artillery strike, six people were wounded. In the eastern section of thevillage, immediately adjacent to the city of Grozny, over ten homes were damaged.[Event ID: 1075; Date: 20010205]
Cordon Operations (denial): Event must involve at least one of the following actors: RussianArmed Forces, Federal Security Services, Special Forces, Ministry of Internal Affairs, localpolice, local administration, federal administration; and at least one of the following ac-tions: efforts to physically disrupt lines of communication connecting a municipality to otherlocations in the region. This definition goes beyond routine road obstructions like vehiclecheckpoints; it includes only larger-scale operations such as government efforts to establish acordon around a whole village or town.
Example: Gruppa boevikov blokirovana v gorode Dagestanskie Ogni, soob-wil operativnyi de�urnyi MVD respubliki.
Translation: A group of insurgents is blocked in the city of Dagestanskie Ogni,according to the republican Interior Ministry’s operations duty officer. [Event ID:31428; Date: 20080327]
Cordon and Search Operations (denial + punishment): At the event level, the “Kinetic”and “Cordon” variables were coded in a mutually exclusive way from, such that no denial event
10

included an action where local kinetic operations were reported to have also taken place. Ifboth types of events were observed, the resulting interaction between the two strategy choiceswas called denial + punishment.
Example: Mnogoqislenna� gruppirovka silovyh struktur, vkl�qa� voen-noslu�awih Ministerstva oborony, blokirovala st. Voznesenovska�Malgobekskogo raiona Respubliki Inguxeti�. V stanice naqalas~ zaqistka.
Translation: A large grouping of security forces, including personnel from the Min-istry of Defense, has blocked the village of Voznesenovskaya, Malgobek district,Republic of Ingushetia. A mop-up operation has begun in the village. [Event ID:23472; Date: 20070422]
3.3 Reliability of automated event coding
The reliability of content analysis as a data collection method can be separated into three compo-nents: (1) consistency, (2) replicability, and (3) accuracy (Weber, 1990, 17). While previous eventsdatasets for the North Caucasus have relied on hand-coding of newspaper articles and incident re-ports (Lyall, 2009, 2010), there are several advantages to the automated approach employed here.Foremost among these advantages are consistency and replicability – both of which will be criticalif the epidemic model is to be meaningfully extended to other cases. Hand-coded event data collec-tion is extremely labor-intensive, involving months of tedious and painstaking work by large teamsof undergraduate research assistants (King and Lowe, 2003, 618). Even with experienced codersfollowing well-defined tasks and classification rules, inter-coder reliability can be notoriously low(Mikhaylov and Benoit, 2008). Humans have limited working memories and tend to rely on heuris-tics, resulting in informal, subjective and ad hoc decisions, not to mention broader risks associatedwith fatigue, inattention and prior knowledge of hypotheses (Grimmer and King, 2009, 4-5).
Automated coding is no panacea; it also requires a deep working knowledge of the subject mat-ter in the construction of coding rules, and a considerable – though nowhere near as onerous –time investment in data collection, pre-processing and programming. Once these coding rules areestablished, however, the consistency of machine coding becomes 100% since the program is exe-cuting a fixed algorithm (Schrodt and Gerner, 1994). The replicability of the codings across twoor more machines – given the same set of rules, actor/action dictionary and corpus of texts – issimilarly high. Further, automated coding is not subject to errors induced by the context of anevent, political or cultural biases, fatigue or boredom.
Automated coding methods have been shown to produce results at least as accurate as handcoding but with complete consistency, replicability and more randomness in the errors (Schrodtand Gerner, 1994; King and Lowe, 2003). Whereas bias in the errors can create bias in the results,randomness in errors will tend to attenuate the results, not improve them. The Boolean matchingapproach uses in this paper capitalizes on the highly structured form of the coded texts – short,two-three sentence incident reports, which have a limited vocabulary and narrow substantive focus.Methods like TABARI and VRA Reader assume little to no structure in the text, thereby openingthemselves to additional sources of error. If the assumptions about the nature of the texts arecorrect, the Boolean matching approach is likely not only to match the coding accuracy of TABARIand VRA Reader but actually exceed it.
The most common types of inaccurate codings in automated events extraction (i.e.: incorrect
11
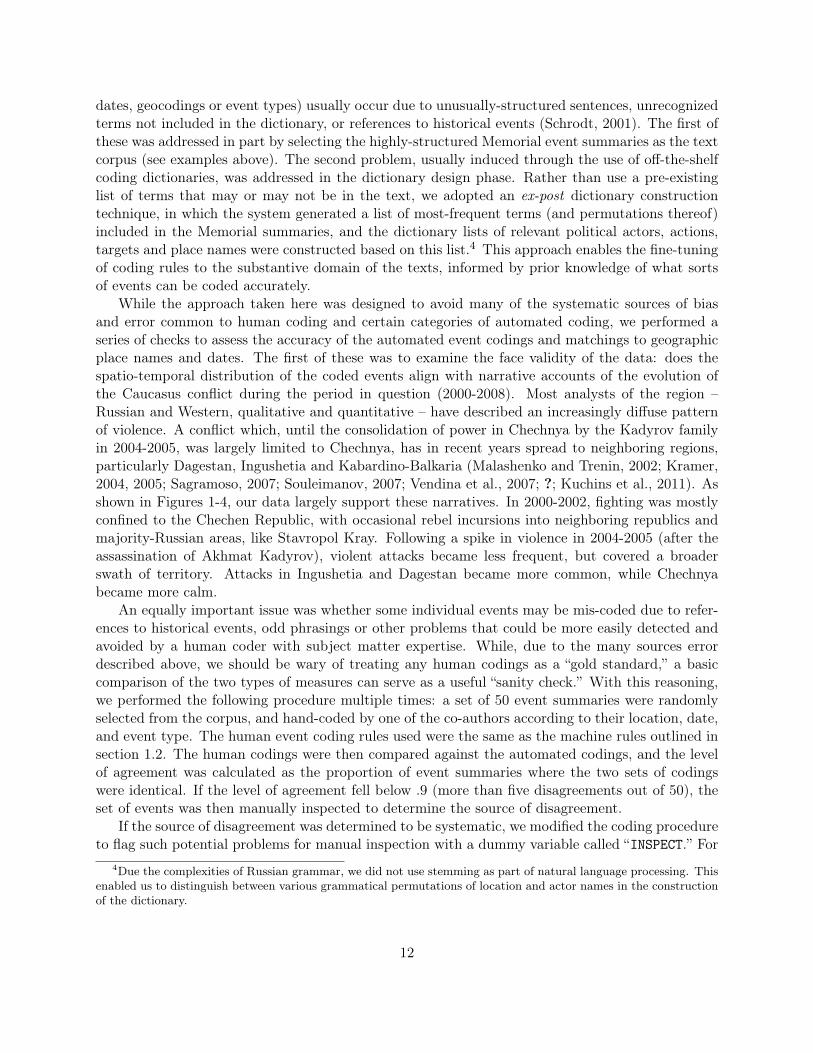
dates, geocodings or event types) usually occur due to unusually-structured sentences, unrecognizedterms not included in the dictionary, or references to historical events (Schrodt, 2001). The first ofthese was addressed in part by selecting the highly-structured Memorial event summaries as the textcorpus (see examples above). The second problem, usually induced through the use of off-the-shelfcoding dictionaries, was addressed in the dictionary design phase. Rather than use a pre-existinglist of terms that may or may not be in the text, we adopted an ex-post dictionary constructiontechnique, in which the system generated a list of most-frequent terms (and permutations thereof)included in the Memorial summaries, and the dictionary lists of relevant political actors, actions,targets and place names were constructed based on this list.4 This approach enables the fine-tuningof coding rules to the substantive domain of the texts, informed by prior knowledge of what sortsof events can be coded accurately.
While the approach taken here was designed to avoid many of the systematic sources of biasand error common to human coding and certain categories of automated coding, we performed aseries of checks to assess the accuracy of the automated event codings and matchings to geographicplace names and dates. The first of these was to examine the face validity of the data: does thespatio-temporal distribution of the coded events align with narrative accounts of the evolution ofthe Caucasus conflict during the period in question (2000-2008). Most analysts of the region –Russian and Western, qualitative and quantitative – have described an increasingly diffuse patternof violence. A conflict which, until the consolidation of power in Chechnya by the Kadyrov familyin 2004-2005, was largely limited to Chechnya, has in recent years spread to neighboring regions,particularly Dagestan, Ingushetia and Kabardino-Balkaria (Malashenko and Trenin, 2002; Kramer,2004, 2005; Sagramoso, 2007; Souleimanov, 2007; Vendina et al., 2007; ?; Kuchins et al., 2011). Asshown in Figures 1-4, our data largely support these narratives. In 2000-2002, fighting was mostlyconfined to the Chechen Republic, with occasional rebel incursions into neighboring republics andmajority-Russian areas, like Stavropol Kray. Following a spike in violence in 2004-2005 (after theassassination of Akhmat Kadyrov), violent attacks became less frequent, but covered a broaderswath of territory. Attacks in Ingushetia and Dagestan became more common, while Chechnyabecame more calm.
An equally important issue was whether some individual events may be mis-coded due to refer-ences to historical events, odd phrasings or other problems that could be more easily detected andavoided by a human coder with subject matter expertise. While, due to the many sources errordescribed above, we should be wary of treating any human codings as a “gold standard,” a basiccomparison of the two types of measures can serve as a useful “sanity check.” With this reasoning,we performed the following procedure multiple times: a set of 50 event summaries were randomlyselected from the corpus, and hand-coded by one of the co-authors according to their location, date,and event type. The human event coding rules used were the same as the machine rules outlined insection 1.2. The human codings were then compared against the automated codings, and the levelof agreement was calculated as the proportion of event summaries where the two sets of codingswere identical. If the level of agreement fell below .9 (more than five disagreements out of 50), theset of events was then manually inspected to determine the source of disagreement.
If the source of disagreement was determined to be systematic, we modified the coding procedureto flag such potential problems for manual inspection with a dummy variable called “INSPECT.” For
4Due the complexities of Russian grammar, we did not use stemming as part of natural language processing. Thisenabled us to distinguish between various grammatical permutations of location and actor names in the constructionof the dictionary.
12

instance, in the case of miscodings of paramilitary units’ home bases as locations of events – asin “Novgorodskiy OMON” – we set INSPECT=1 if a location name was followed or preceded by aterm representing a political actor in an event summary.5 To address historical references directly,we set INSPECT=1 if more than one date, month or year was mentioned in a summary, or if morethan one location was mentioned in a summary. This procedure also helped us distinguish betweencases where event summaries included references to multiple simultaneous events (e.g. “air strikeswere carried out on March 13 in villages A, B and C”), as opposed to event summaries that madereferences to a single current event and one or more historical events (e.g. “an air strike was carriedout on May 15 in village A. This operation marks the first series of air strikes in the area sinceMarch 13.”) The goal here was to minimize the risk of double-counts and false positives, whileavoiding false negatives that would result from mistaking multiple events for historical references.
We then performed a manual inspection of all cases where INSPECT=1 (originally, 24% of theevents), and corrected the codings by hand where deemed necessary. We then selected another 50event summaries at random, and repeated the entire procedure (a total of 7 times) until the levelof agreement exceeded .9 for three consecutive sets of 50. Only after we became convinced that theaccuracy of individual event codings approached those of a human subject matter expert (>.9), didwe aggregate the events to the level of village-month as described in detail below.
4 Road Network Data and Dynamic Spatial Weights Matrix
To model the spread of insurgent violence as a network process, and to formally account for roadobstructions and other denial actions in the connective structure of the conflict zone, we measuredthe accessibility between populated places with a time-variant origin-destination (OD) matrix Dt,in which entries dijt are geodesic (i.e.: shortest length in kilometers, if more than one route can betaken) path distances between places i and j along the local network of roads.6 The resulting spatialweights matrix was also dynamic (time-variant): if a denial action was reported at municipality iat time t (BLOCKit = 1), we modified the matrix to reflect that location’s temporary inaccessibilitydue to road obstructions – effectively treating the municipality as a geographic isolate with noroad connections heading in or out. To account for the difficulty experienced by insurgents, asthey attempt to break through the government cordon and expand operations to other towns, theresulting matrix cells dijt were then assigned the maximum road distance in the region.
OD matrices have been the subject of a vast literature in urban planning and transportationengineering,7 but have not – to our knowledge – been widely used in political geography, despitethe many advantages of network relative to Euclidean distance. Although the calculation of roadnetwork distances is far more computationally intensive than their planar counterparts, OD matricescan be estimated with Python scripts, Java programs or ArcGIS extensions (Steenberghen et al.,2009). For these data, we used a geoprocessing script which relies on ArcMap’s Network Analystengine.8 The result is a dense 7, 584 × 7, 584 matrix, with 57,517,056 shortest-path road distances
5This procedure was performed through string operations on the original text, rather than the “bag of words”representation of the text following the removal of stop words and the discarding of word order.
6Geospatial data on the road network in the Caucasus, as well as other spatial data of interest (population density,elevation, land cover), were taken from the U.S. Geological Survey’s Global GIS Database (Hearn et al., 2005)
7See Cherkassky et al. (1996); Zhan and Noon (1998)8In OD matrix estimation, villages located beyond 5 km of a major road were initially treated as isolates. In these
cases, we calculated the Euclidean distance to the nearest municipality accessible by road, and used the sum of thisstatistic and the nearest-on-road-village’s distance data as the off-road municipality’s road distance data.
13
between villages.Valued network data are often dichotomized for ease of interpretation (by distinguishing between
neighbors and non-neighbors) and computational efficiency (the valued matrix is over 3GB in size).However, dichotomization also risks the loss of potentially important information (Thomas andBlitzstein, 2009). Because the epidemiological model assumes continuous measures of networkdistance, we avoided the use of dichotomizing cutpoints and preserved the continuous distancedata. A visual representation of the road network structure is provided in Figure 5.
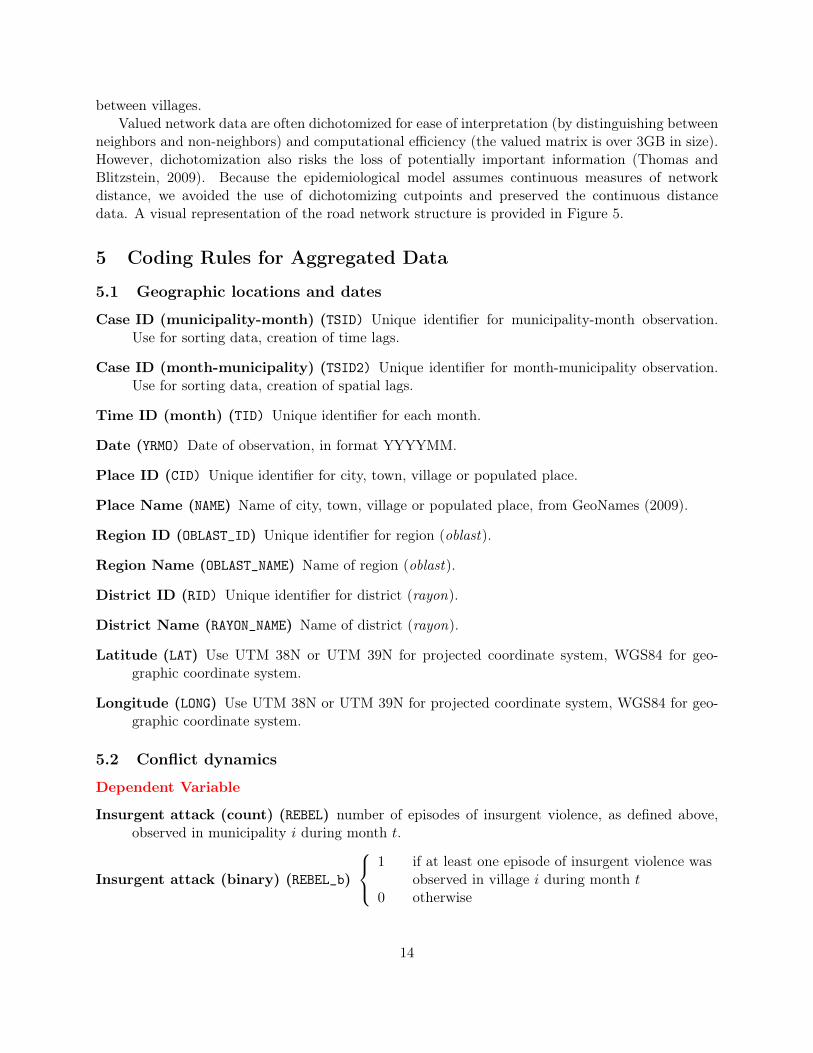
5 Coding Rules for Aggregated Data
5.1 Geographic locations and dates
Case ID (municipality-month) (TSID) Unique identifier for municipality-month observation.Use for sorting data, creation of time lags.
Case ID (month-municipality) (TSID2) Unique identifier for month-municipality observation.Use for sorting data, creation of spatial lags.
Time ID (month) (TID) Unique identifier for each month.
Date (YRMO) Date of observation, in format YYYYMM.
Place ID (CID) Unique identifier for city, town, village or populated place.
Place Name (NAME) Name of city, town, village or populated place, from GeoNames (2009).
Region ID (OBLAST_ID) Unique identifier for region (oblast).
Region Name (OBLAST_NAME) Name of region (oblast).
District ID (RID) Unique identifier for district (rayon).
District Name (RAYON_NAME) Name of district (rayon).
Latitude (LAT) Use UTM 38N or UTM 39N for projected coordinate system, WGS84 for geo-graphic coordinate system.
Longitude (LONG) Use UTM 38N or UTM 39N for projected coordinate system, WGS84 for geo-graphic coordinate system.
5.2 Conflict dynamics
Dependent Variable
Insurgent attack (count) (REBEL) number of episodes of insurgent violence, as defined above,observed in municipality i during month t.
Insurgent attack (binary) (REBEL_b)
1 if at least one episode of insurgent violence was
observed in village i during month t0 otherwise
14

Insurgent attack (count, time lagged) (L_REBEL) number of episodes of insurgent violence, asdefined above, observed in municipality i during month t− 1.
Insurgent attack (binary, time lagged) (L_REBEL_b)
1 if at least one episode of insurgent violence
was observed in village i during month t− 10 otherwise
Punishment Actions
Kinetic operations (count) (SPETZ) number of government-initiated kinetic operations, as de-fined above, observed in municipality i during month t.
Kinetic operations (binary) (SPETZ_b)
1 if at least one kinetic operation was
observed in village i during month t0 otherwise
Kinetic operations (count, time lagged) (L_SPETZ) number of government-initiated kinetic op-erations, as defined above, observed in municipality i during month t− 1.
Kinetic operations (binary, time lagged) (L_SPETZ_b)
1 if at least one kinetic operation was
observed in village i during month t− 10 otherwise
Denial Actions
Cordon operations (count) (BLOCK) number of government-initiated cordon operations, as de-fined above, observed in municipality i during month t.
Cordon operations (binary) (BLOCK_b)
1 if at least one cordon operation was
observed in village i during month t0 otherwise
Cordon operations (count, time lagged) (L_BLOCK) number of government-initiated cordon op-erations, as defined above, observed in municipality i during month t− 1.
Cordon operations (binary, time lagged) (L_BLOCK_b)
1 if at least one cordon operation was
observed in village i during month t− 10 otherwise
Distance to nearest recent insurgent attack (log) (ln_NEAR) natural logarithm ofmin(wiInsurgent Violencej 6=i,t−1), where wi is a vector of road distances between village i andall other villages j. Where a denial action (L_BLOCK_b) was reported, we modified the matrixW to reflect that location’s temporary inaccessibility due to road obstructions – effectivelytreating the municipality as a geographic isolate with no road connections heading in or out.
5.3 Control variables
Population density (POP) Population per square kilometer.
Elevation (ELEVATION) In meters. Sea level = 0.
15
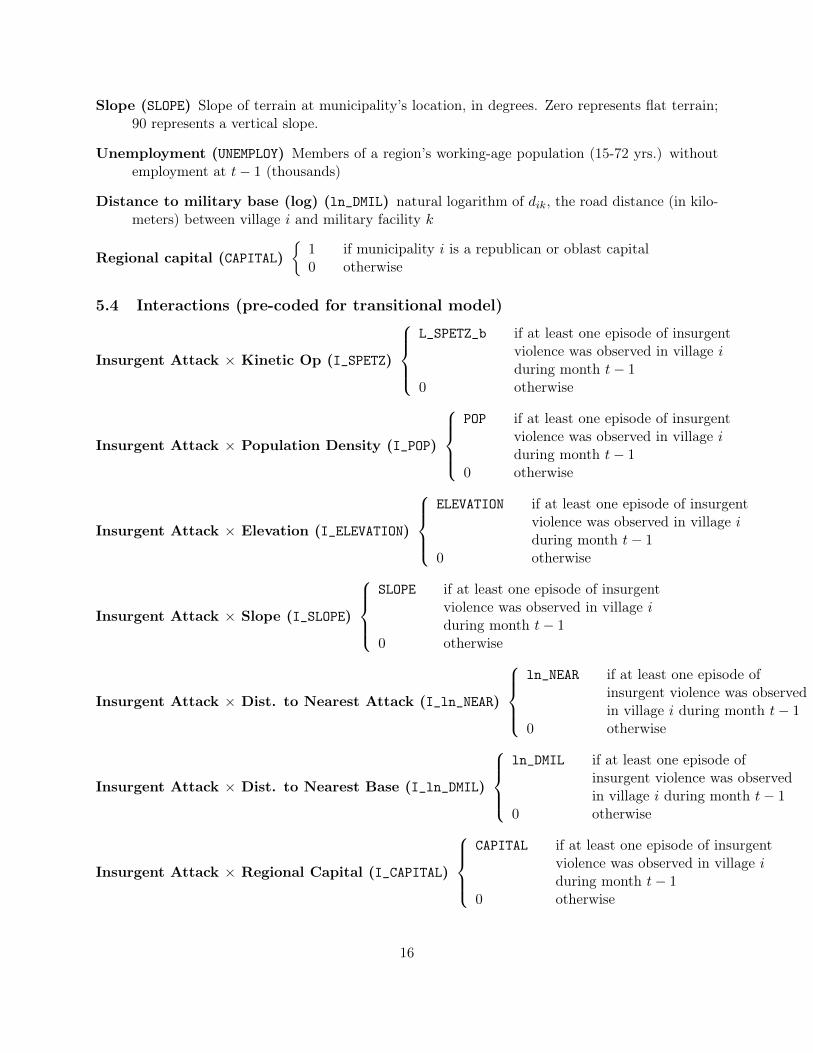
Slope (SLOPE) Slope of terrain at municipality’s location, in degrees. Zero represents flat terrain;90 represents a vertical slope.
Unemployment (UNEMPLOY) Members of a region’s working-age population (15-72 yrs.) withoutemployment at t− 1 (thousands)
Distance to military base (log) (ln_DMIL) natural logarithm of dik, the road distance (in kilo-meters) between village i and military facility k
Regional capital (CAPITAL){
1 if municipality i is a republican or oblast capital0 otherwise
5.4 Interactions (pre-coded for transitional model)
Insurgent Attack × Kinetic Op (I_SPETZ)
L_SPETZ_b if at least one episode of insurgent
violence was observed in village iduring month t− 1
0 otherwise
Insurgent Attack × Population Density (I_POP)
POP if at least one episode of insurgent
violence was observed in village iduring month t− 1
0 otherwise
Insurgent Attack × Elevation (I_ELEVATION)
ELEVATION if at least one episode of insurgent
violence was observed in village iduring month t− 1
0 otherwise
Insurgent Attack × Slope (I_SLOPE)
SLOPE if at least one episode of insurgent
violence was observed in village iduring month t− 1
0 otherwise
Insurgent Attack × Dist. to Nearest Attack (I_ln_NEAR)
ln_NEAR if at least one episode of
insurgent violence was observedin village i during month t− 1
0 otherwise
Insurgent Attack × Dist. to Nearest Base (I_ln_DMIL)
ln_DMIL if at least one episode of
insurgent violence was observedin village i during month t− 1
0 otherwise
Insurgent Attack × Regional Capital (I_CAPITAL)
CAPITAL if at least one episode of insurgent
violence was observed in village iduring month t− 1
0 otherwise
16

Insurgent Attack × Unemployment I_L_UNEMPLOY)
L_UNEMPLOY if at least one episode of insurgent
violence was observed in village iduring month t− 1
0 otherwise
17

6 Summary Statistics
Table 4: Summary statistics for aggregated data (village-month level) and list of sources
Variable Description Variable Name Min Median Mean Max SourceInsurgent Attack (count) REBEL 0 0 0.0041 46 GeoNames (2009); Memorial (2009)
Insurgent Attack (count, time lagged) L_REBEL 0 0 0.0042 46 GeoNames (2009); Memorial (2009)Insurgent Attack (binary) REBEL_b 0 0 0.0023 1 GeoNames (2009); Memorial (2009)
Insurgent Attack (binary, time lagged) L_REBEL_b 0 0 0.0024 1 GeoNames (2009); Memorial (2009)Kinetic Operations (count) SPETZ 0 0 0.0019 31 GeoNames (2009); Memorial (2009)
Kinetic Operations (count, time lagged) L_SPETZ 0 0 0.0020 31 GeoNames (2009); Memorial (2009)Kinetic Operations (binary) SPETZ_b 0 0 0.0011 1 GeoNames (2009); Memorial (2009)
Kinetic Operations (binary, time lagged) L_SPETZ_b 0 0 0.0011 1 GeoNames (2009); Memorial (2009)Blocking (count) BLOCK 0 0 0.0004 5 GeoNames (2009); Memorial (2009)
Blocking (count, time lagged) L_BLOCK 0 0 0.0004 5 GeoNames (2009); Memorial (2009)Blocking (binary) BLOCK_b 0 0 0.0004 1 GeoNames (2009); Memorial (2009)
Blocking (binary, time lagged) L_BLOCK_b 0 0 0.0004 1 GeoNames (2009); Memorial (2009)Population Density POP 0 13 166.3 25181 GeoNames (2009); Hearn et al. (2005)
Elevation ELEVATION -31 239 523.1 2818 GeoNames (2009); Hearn et al. (2005)Slope SLOPE 0 1.1604 3.6733 40.0156 GeoNames (2009); Hearn et al. (2005)
Unemployment UNEMPLOY 1.9 24.9 52.18 376.5 GeoNames (2009); Goskomstat (2009)Unemployment (time lagged) L_UNEMPLOY 1.9 24.6 52.08 376.5 GeoNames (2009); Goskomstat (2009)
Road Distance to Nearest Attack (log) ln_NEAR 0 5.024 4.97 7.139 GeoNames (2009); Goskomstat (2009)Distance to Nearest Military Base (log) ln_DMIL 0.0065 4.0343 3.8717 5.3435 GeoNames (2009); Janko (2009); Hearn et al. (2005)
Regional Capital CAPITAL 0 0 0.0012 1 GeoNames (2009)Insurgent Attack × Kinetic Op I_SPETZ 0 0 0.0004 1 GeoNames (2009); Memorial (2009)
Insurgent Attack × Population Density I_POP 0 0 3.39 11576 GeoNames (2009); Memorial (2009)Insurgent Attack × Elevation I_ELEVATION -27 0 0.8217 2146 GeoNames (2009); Hearn et al. (2005)
Insurgent Attack × Slope I_SLOPE 0 0 0.0053 24.18 GeoNames (2009); Hearn et al. (2005)Insurgent Attack × Dist. to Nearest Attack I_ln_NEAR 0 0 0.0010 7.139 GeoNames (2009); Hearn et al. (2005)Insurgent Attack × Dist. to Nearest Base I_ln_DMIL 0 0 0.0075 5.17 GeoNames (2009); Janko (2009); Hearn et al. (2005)
Insurgent Attack × Regional Capital I_CAPITAL 0 0 0.0002 1 GeoNames (2009); Memorial (2009)Insurgent Attack × Unemployment I_L_UNEMPLOY 0 0 0.4038 376.5 GeoNames (2009); Memorial (2009); Goskomstat (2009)
18
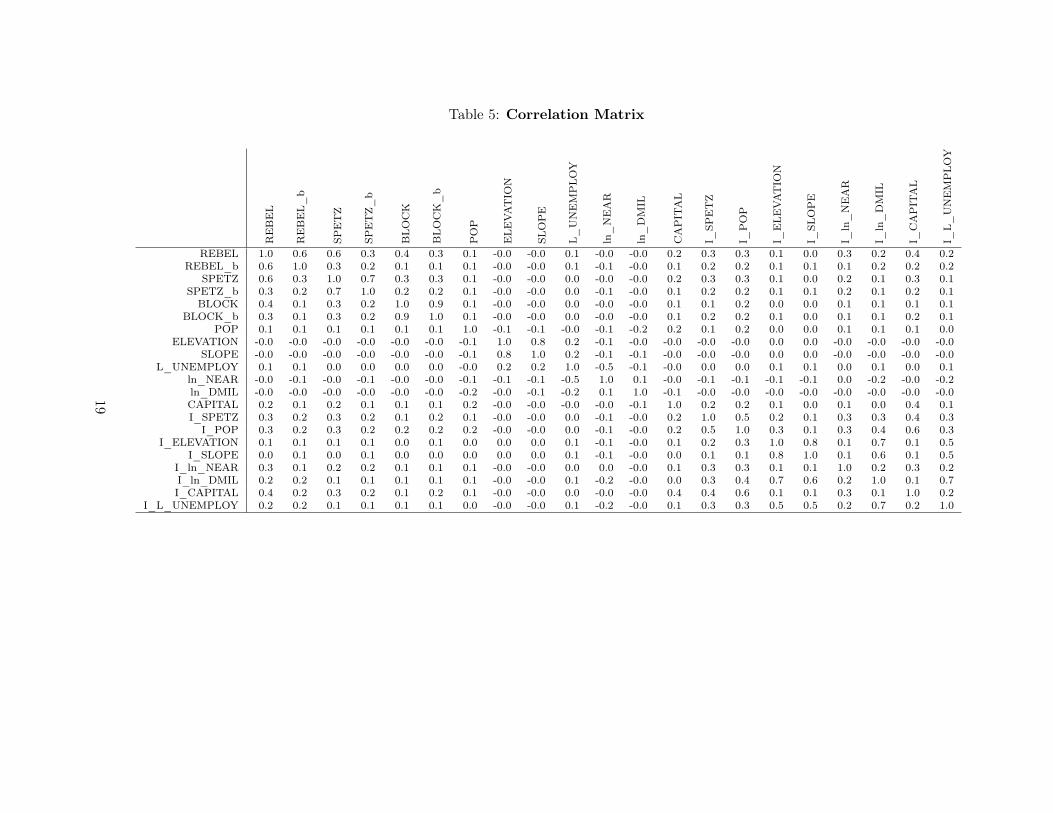
Table 5: Correlation Matrix
REBEL
REBEL_b
SPETZ
SPETZ_b
BLOCK
BLOCK_b
POP
ELEVATIO
N
SLOPE
L_UNEMPLOY
ln_NEAR
ln_DMIL
CAPITAL
I_SP
ETZ
I_POP
I_ELEVATIO
N
I_SL
OPE
I_ln_NEAR
I_ln_DMIL
I_CAPITAL
I_L_UNEMPLOY
REBEL 1.0 0.6 0.6 0.3 0.4 0.3 0.1 -0.0 -0.0 0.1 -0.0 -0.0 0.2 0.3 0.3 0.1 0.0 0.3 0.2 0.4 0.2REBEL_b 0.6 1.0 0.3 0.2 0.1 0.1 0.1 -0.0 -0.0 0.1 -0.1 -0.0 0.1 0.2 0.2 0.1 0.1 0.1 0.2 0.2 0.2
SPETZ 0.6 0.3 1.0 0.7 0.3 0.3 0.1 -0.0 -0.0 0.0 -0.0 -0.0 0.2 0.3 0.3 0.1 0.0 0.2 0.1 0.3 0.1SPETZ_b 0.3 0.2 0.7 1.0 0.2 0.2 0.1 -0.0 -0.0 0.0 -0.1 -0.0 0.1 0.2 0.2 0.1 0.1 0.2 0.1 0.2 0.1BLOCK 0.4 0.1 0.3 0.2 1.0 0.9 0.1 -0.0 -0.0 0.0 -0.0 -0.0 0.1 0.1 0.2 0.0 0.0 0.1 0.1 0.1 0.1
BLOCK_b 0.3 0.1 0.3 0.2 0.9 1.0 0.1 -0.0 -0.0 0.0 -0.0 -0.0 0.1 0.2 0.2 0.1 0.0 0.1 0.1 0.2 0.1POP 0.1 0.1 0.1 0.1 0.1 0.1 1.0 -0.1 -0.1 -0.0 -0.1 -0.2 0.2 0.1 0.2 0.0 0.0 0.1 0.1 0.1 0.0
ELEVATION -0.0 -0.0 -0.0 -0.0 -0.0 -0.0 -0.1 1.0 0.8 0.2 -0.1 -0.0 -0.0 -0.0 -0.0 0.0 0.0 -0.0 -0.0 -0.0 -0.0SLOPE -0.0 -0.0 -0.0 -0.0 -0.0 -0.0 -0.1 0.8 1.0 0.2 -0.1 -0.1 -0.0 -0.0 -0.0 0.0 0.0 -0.0 -0.0 -0.0 -0.0
L_UNEMPLOY 0.1 0.1 0.0 0.0 0.0 0.0 -0.0 0.2 0.2 1.0 -0.5 -0.1 -0.0 0.0 0.0 0.1 0.1 0.0 0.1 0.0 0.1ln_NEAR -0.0 -0.1 -0.0 -0.1 -0.0 -0.0 -0.1 -0.1 -0.1 -0.5 1.0 0.1 -0.0 -0.1 -0.1 -0.1 -0.1 0.0 -0.2 -0.0 -0.2ln_DMIL -0.0 -0.0 -0.0 -0.0 -0.0 -0.0 -0.2 -0.0 -0.1 -0.2 0.1 1.0 -0.1 -0.0 -0.0 -0.0 -0.0 -0.0 -0.0 -0.0 -0.0CAPITAL 0.2 0.1 0.2 0.1 0.1 0.1 0.2 -0.0 -0.0 -0.0 -0.0 -0.1 1.0 0.2 0.2 0.1 0.0 0.1 0.0 0.4 0.1I_SPETZ 0.3 0.2 0.3 0.2 0.1 0.2 0.1 -0.0 -0.0 0.0 -0.1 -0.0 0.2 1.0 0.5 0.2 0.1 0.3 0.3 0.4 0.3
I_POP 0.3 0.2 0.3 0.2 0.2 0.2 0.2 -0.0 -0.0 0.0 -0.1 -0.0 0.2 0.5 1.0 0.3 0.1 0.3 0.4 0.6 0.3I_ELEVATION 0.1 0.1 0.1 0.1 0.0 0.1 0.0 0.0 0.0 0.1 -0.1 -0.0 0.1 0.2 0.3 1.0 0.8 0.1 0.7 0.1 0.5
I_SLOPE 0.0 0.1 0.0 0.1 0.0 0.0 0.0 0.0 0.0 0.1 -0.1 -0.0 0.0 0.1 0.1 0.8 1.0 0.1 0.6 0.1 0.5I_ln_NEAR 0.3 0.1 0.2 0.2 0.1 0.1 0.1 -0.0 -0.0 0.0 0.0 -0.0 0.1 0.3 0.3 0.1 0.1 1.0 0.2 0.3 0.2I_ln_DMIL 0.2 0.2 0.1 0.1 0.1 0.1 0.1 -0.0 -0.0 0.1 -0.2 -0.0 0.0 0.3 0.4 0.7 0.6 0.2 1.0 0.1 0.7I_CAPITAL 0.4 0.2 0.3 0.2 0.1 0.2 0.1 -0.0 -0.0 0.0 -0.0 -0.0 0.4 0.4 0.6 0.1 0.1 0.3 0.1 1.0 0.2
I_L_UNEMPLOY 0.2 0.2 0.1 0.1 0.1 0.1 0.0 -0.0 -0.0 0.1 -0.2 -0.0 0.1 0.3 0.3 0.5 0.5 0.2 0.7 0.2 1.0
19

Figure 1: Spatio-temporal distribution of dependent variable (insurgent attacks), July 2000 - Dec 2002
20

Figure 2: Spatio-temporal distribution of dependent variable (insurgent attacks), Jan 2003 - Jun 2005
21
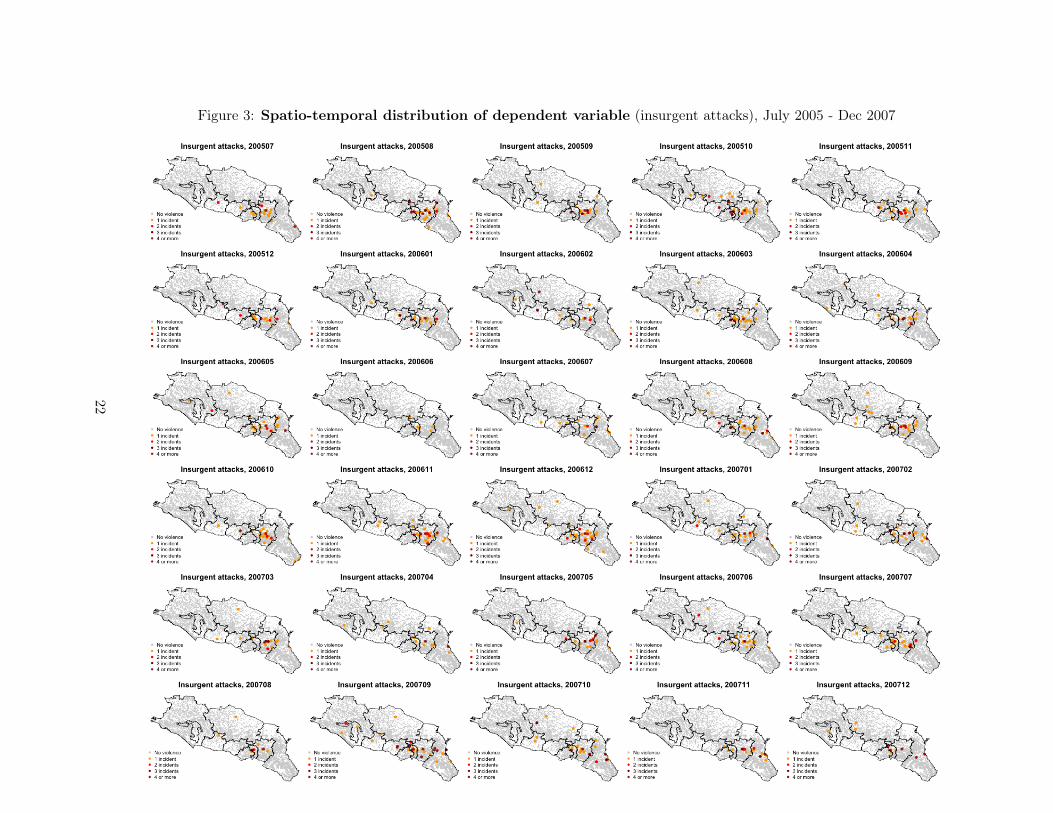
Figure 3: Spatio-temporal distribution of dependent variable (insurgent attacks), July 2005 - Dec 2007
22

Figure 4: Spatio-temporal distribution of dependent variable (insurgent attacks), Jan 2008 - Dec 2008
23

Figure 5: Road Network
Road NetworkMunicipalities
24

7 Additional Regression Results
Table 6 reports regression results for four additional model, with identical specifications as in Models 1-4 in the manuscript, apartfrom the substitution of slope (in degrees) for elevation (in meters). Results for the slope variable are consistent with those forelevation: new insurgent violence is more likely in villages in flat, accessible terrain, but the effect is negligible for recurring violence.Results for all other variables are nearly identical to those in Models 1-4.
Table 6: Markov transition models (estimated with GAM logit). Dependent variable: incidence of insurgent violence in villagei at time t (Vit.
Model 5 Model 6 Model 7 Model 8φC φV φC φV φC φV φC φV
Intercept -9.4101 -7.2378 -6.3059 -4.9666 -6.4671 -5.4243 -7.0321 -4.6796(0.9516)*** (0.9509)*** (0.3376)*** (0.3856)*** (0.3268)*** (0.389)*** (0.3739)*** (0.4812)***
Punishment ActionsKinetic Ops (t− 1) 2.4298 0.7901 2.4132 0.7877 2.3917 0.6427 2.7761 0.5421
(0.1427)*** (0.1641)*** (0.1435)*** (0.1636)*** (0.1444)*** (0.1706)*** (0.1627)*** (0.1976)**Denial ActionsRoad Distance to -0.1459 0.0527 -0.1307 0.0513 -0.1415 0.0341 -0.0968 0.08Nearest Attack (t− 1) (0.0253)*** (0.0386) (0.0251)*** (0.0385) (0.0253)*** (0.041) (0.0315)** (0.044)ControlsPopulation Density 4e-04 3e-04 3e-04 3e-04 3e-04 2e-04 3e-04 2e-04
(2e-05)*** (2e-05)*** (2e-05)*** (2e-05)*** (2e-05)*** (2e-05)*** (2e-05)*** (2e-05)***Slope -0.0868 0.0036 -0.0719 0.0168 -0.0696 0.0222 -0.0843 -0.0587
(0.012)*** (0.0264) (0.0117)*** (0.0253) (0.0118)*** (0.0255) (0.0132)*** (0.0392)Road Distance to Nearest Mil. Base -0.3746 -0.116 -0.3037 0.0359 -0.2979 0.0042
(0.0373)*** (0.0692) (0.0396)*** (0.076) (0.0438)*** (0.0811)Regional Capital 1.7649 1.6118 1.8155 1.4349
(0.2074)*** (0.2964)*** (0.2154)*** (0.3063)***Unemployment (t− 1) 0.0034 -3e-04
(5e-04)*** (7e-04)Spatial Spline f(Long, Lat) EDF: 28.77, χ2: 1218.16*** EDF: 26.52, χ2: 961.12*** EDF: 26.37, χ2: 1138.65*** EDF: 26.73, χ2: 472.09***N 688,315 (in-sample) 688,315 (in-sample) 688,315 (in-sample) 666,529 (in-sample)
77,356 (out-of-sample) 77,356 (out-of-sample) 77,356 (out-of-sample) 77,356 (out-of-sample)AIC 15,426.50 15,343.97 15,257.1 12,960.76AUC 0.932 (in-sample) 0.933 (in-sample) 0.934 (in-sample) 0.932 (in-sample)
0.932 (out-of-sample) 0.934 (out-of-sample) 0.934 (out-of-sample) 0.914 (out-of-sample)Significance levels: *p < .05, **p < .01, ***p < .001.
25

ReferencesAmemiya, T. (1985). Advanced Econometrics. Cambridge, MA: Harvard University Press.
Beck, N., K. S. Gleditsch, and K. Beardsley (2006). Space Is More than Geography: Using Spatial Econometrics inthe Study of Political Economy. International Studies Quarterly 50.
Beissinger, M. R. (2007). Structure and Example in Modular Political Phenomena: The Diffusion of Bull-dozer/Rose/Orange/Tulip Revolutions. Perspectives on Politics 5 (02), 259–276.
Bonneuil, N. and N. Auriat (2000). Fifty years of ethnic conflict and cohesion: 1945-94. Journal of Peace Re-search 37 (5), 563–581.
Braithwaite, A. (2005). Location, location, locationÉidentifying hot spots of international conflict. InternationalInteractions 31 (3), 251–273.
Braithwaite, A. (2006). The geographic spread of militarized disputes. Journal of Peace Research 43 (5), 507–522.
Braithwaite, A. (2010a). MIDLOC: Introducing the Militarized Interstate Dispute Location dataset. Journal of PeaceResearch 47 (1), 91–98.
Braithwaite, A. (2010b). Resisting infection: How state capacity conditions conflict contagion. Journal of PeaceResearch 47 (3).
Braithwaite, A. and Q. Li (2007). Transnational terrorism hot spots: Identification and impact evaluation. ConflictManagement and Peace Science 24 (4), 281–296.
Braumoeller, B. F. (2006). Explaining variance; or, stuck in a moment we can’t get out of. Political Analysis 14 (3),268–290.
Bremer, S. A. (1982). The contagiousness of coercion: The spread of serious international disputes, 1900Ð1976.International Interactions 9 (1), 29–55.
Buhaug, H. and K. S. Gleditsch (2008). Contagion or confusion? Why conflicts cluster in space. International StudiesQuarterly 52 (2).
Bunce, V. J. and S. L. Wolchik (2010). Defeating Dictators: Electoral Change and Stability in Competitive Author-itarian Regimes. World Politics 62 (1), 43–86.
Carment, D. and P. James (1995). Internal constraints and interstate ethnic conflict. Journal of Conflict Resolu-tion 39 (1), 82–109.
Cederman, L., L. Girardin, and K. S. Gleditsch (2009). Ethno-Nationalist Triads: Assessing the Influence of KinGroups on Civil Wars. World Politics 61, 403–437.
Cederman, L.-E. (2001). Modeling the democratic peace as a kantian selection process. Journal of Conflict Resolu-tion 45 (4), 470–502.
Cederman, L.-E., H. Buhaug, and J. K. Rod (2009). Ethno-Nationalist Dyads and Civil War. Journal of ConflictResolution 53 (4), 496–525.
Cherkassky, B., A. Goldberg, and T. Radzik (1996, 31 May). Shortest paths algorithms: Theory and experimentalevaluation. Mathematical Programming 73 (2), 129–174.
Davenport, C. and P. Ball (2002). Views to a Kill: Exploring the Implications of Source Selection in the Case ofGuatemalan State Terror, 1977-1995. Journal of Conflict Resolution 46, 427–450.
Davenport, C. and A. Stam (2006). Rashomon goes to Rwanda: Alternative Accounts of Political Violence and TheirImplications for Policy and Analysis.
26
De Groot, O. J. (2011). Culture, Contiguity and Conflict: On the Measurement of Ethnolinguistic Effects in SpatialSpillovers. Journal of Development Studies 47 (3), 436–454.
De Soysa, I. and E. Neumayer (2008). Disarming Fears of Diversity: Ethnic Heterogeneity and State Militarization,1988-2002. Journal of Peace Research 45 (4), 497–518.
Dorussen, H. (2006). Heterogeneous trade interests and conflict. Journal of Conflict Resolution 50 (1), 87–107.
Duchon, J. (1977). Construction Theory of Functions of Several Variables, Chapter Splines minimizing rotation-invariant semi-norms in Solobev spaces. Berlin: Springer.
Dudley, R. and R. A. Miller (1998). Group rebellion in the 1980s. Journal of Conflict Resolution 42 (1), 77–96.
Enterline, A. J. (1998a). Regime changes and interstate conflict, 1816-1992. Political Research Quarterly 51 (2),385–409.
Enterline, A. J. (1998b). Regime changes, neighborhoods, and interstate conflict, 1816-1992. Journal of ConflictResolution 42 (6), 804–829.
Feinerer, I. (2008, October). An introduction to text mining in R. R News 8 (2).
Feinerer, I., K. Hornik, and D. Meyer (2008, March). Text mining infrastructure in R. Journal of StatisticalSoftware 25 (5).
Forsberg, E. (2008). Polarization and ethnic conflict in a widened strategic setting. Journal of Peace Research 45 (2),283–300.
Fox, J. (2004). The rise of religious nationalism and conflict: Ethnic conflict and revolutionary wars, 1945-2001.Journal of Peace Research 41 (6), 715–731.
Furlong, K. and N. P. Gleditsch (2003). The boundary dataset. Conflict Management and Peace Science 20 (1),93–117.
Furlong, K., N. Petter Gleditsch, and H. Hegre (2006). Geographic opportunity and neomalthusian willingness:Boundaries, shared rivers, and conflict. International Interactions 32 (1), 79–108.
Gartzke, E. and D.-J. Jo (2009). Bargaining, Nuclear Proliferation, and Interstate Disputes. Journal of ConflictResolution 53 (2), 209–233.
GeoNames (2009). NGA GEOnet Names Server. U.S. National Geospatial Intelligence Agency.
Gerner, D. J., P. A. Schrodt, O. Yilmaz, and R. Abu-Jabr (2002). The Creation of CAMEO (Conflict And MediationEvent Observations): An Event Data Framework For A Post Cold War World. Presented at the 2002 AnnualMeeting of the American Political Science Association, 29 August – 1 September.
Gleditsch, K. S. (2007). Transnational dimensions of civil war. Journal of Peace Research 44 (3), 293–309.
Gleditsch, K. S. and M. D. Ward (2000). War and peace in space and time: The role of democratization. InternationalStudies Quarterly 44 (1), 1–29.
Gleditsch, K. S. and M. D. Ward (2001). Measuring space: A minimum-distance database and applications tointernational studies. Journal of Peace Research 38 (6), 739–758.
Goskomstat (2009). Trud i zanyatost’ v Rossii [Labor and employment in Russia]. Moscow: Russian Federal Serviceof State Statistics.
Grimmer, J. and G. King (2009). Quantitative Discovery from Qualitative Information: A General-Purpose DocumentClustering Methodology.
Gurr, T. R. (1993). Why minorities rebel: A global analysis of communal mobilization and conflict since 1945.International Political Science Review 14 (2), 161–201.
27
Hammarstrom, M. (1994). The diffusion of military conflict: Central and south-east europe in 1919-20 and 1991-92.Journal of Peace Research 31 (3), 263–280.
Hammarstrom, M. and B. Heldt (2002). The Diffusion Of Military Intervention: Testing A Network Position Ap-proach. International Interactions 28, 355–377.
Han, J. and M. Kamber (2001). Data Mining: Concepts and Techniques. Morgan Kaufmann Publishers.
Hearn, P., T. Hare, P. Schruben, D. Sherrill, C. LaMar, and P. Tsushima (2005). Global GIS: North Eurasia. U.S.Geological Survey & American Geological Institute.
Hegre, H., T. Ellingsen, S. Gates, and N. P. Gleditsch (2001). Toward a democratic civil peace? democracy, politicalchange, and civil war, 1816Ð1992. American Political Science Review 95 (01), 33–48.
Hegre, H. and N. Sambanis (2006). Sensitivity analysis of empirical results on civil war onset. Journal of ConflictResolution 50 (4), 508–535.
Iqbal, Z. and H. Starr (2008). Bad Neighbors: Failed States and Their Consequences. Conflict Management andPeace Science 25 (4), 315–331.
Jackman, S. (2000). In and Out of War and Peace: Transitional Models of International Conflict.
Janko, E. (2009, September). Severo-kavkazskij voennyj okrug [North Caucasus Military District]. warfare.ru.
Kadera, K. M. (1998). Transmission, Barriers, and Constraints: A Dynamic Model of the Spread of War. The Journalof Conflict Resolution 42 (3), 367–387.
Kalyvas, S. (2006). The Logic of Violence in Civil War. Cambridge.
Kathman, J. (2011). Civil War Diffusion and Regional Motivations for Intervention. Journal of Conflict Resolu-tion July.
Kathman, J. D. (2010). Civil War Contagion and Neighboring Interventions. International Studies Quarterly 54 (4),989–1012.
Kim, W., A. Aronson, and W. Wilbur (2001). Automatic MeSH term assignment and quality assessment. Proceedingsof the AMIA Symposium (319-23).
King, G. and W. Lowe (2003). An Automated Information Extraction Tool for International Conflict Data withPerformance as Good as Human Coders: A Rare Events Evaluation Design. International Organization 57, 617–642.
Kramer, M. (2004). The Perils of Counterinsurgency: Russia’s War in Chechnya. International Security 29 (3).
Kramer, M. (2005). Guerrilla Warfare, Counterinsurgency and Terrorism in the North Caucasus: The MilitaryDimension of the Russian-Chechen Conflict. Europe-Asia Studies 57 (2).
Kuchins, A. C., S. Markedonov, and M. Malarkey (2011). The North Caucasus: Russia’s Volatile Frontier. Washing-ton, DC: Center for Strategic and International Studies.
LaFree, G. and L. Dugan (2007). Introducing the Global Terrorism Database. Terrorism and Political Violence 19,181–204.
Leeds, B. A. (2003a). Alliance reliability in times of war: Explaining state decisions to violate treaties. InternationalOrganization 57 (04), 801–827.
Leeds, B. A. (2003b). Do alliances deter aggression? the influence of military alliances on the initiation of militarizedinterstate disputes. American Journal of Political Science 47 (3), 427–439.
Lyall, J. (2009). Does Indiscriminate Violence Incite Insurgent Attacks? Evidence from Chechnya. Journal of ConflictResolution 53 (2).
28
Lyall, J. (2010). Are Coethnics More Effective Counterinsurgents? Evidence from the Second Chechen War. AmericanPolitical Science Review .
Malashenko, A. and D. Trenin (2002). Vremya Yuga: Rossiya v Chechnye, Chechnya v Rossii [Time of the South:Russia in Chechnya, Chechnya in Russia]. Moscow: Gendalf.
Memorial (2009). Hronika nasilija [Chronicle of Violence]. Memorial Group, Moscow.
Mikhaylov, Slava, M. L. and K. Benoit (2008). Coder Reliability and Misclassification in Comparative ManifestoProject Codings. Paper presented at the Midwest Political Science Association, Chicago.
Mode, C. J. and C. K. Sleeman (2000). Stochastic Processes in Epidemiology. HIV/AIDS, Other Infectious Diseasesand Computers. Singapore: World Scientific.
Most, B. A. and H. Starr (1980). Diffusion, reinforcement, geopolitics, and the spread of war. The American PoliticalScience Review 74 (4), 932–946.
Most, B. A. and H. Starr (1990). Theoretical and logical issues in the study of international diffusion. Journal ofTheoretical Politics 2 (4), 391–412.
Murdie, A. and T. Bhasin (2011). Aiding and Abetting? Human Rights INGOs and Domestic Anti-GovernmentProtest. Journal of Conflict Resolution 55 (2), 163–191.
Neumayer, E. and T. Plumper (2010). Galton’s problem and contagion in international terrorism along civilizationallines. Conflict Management and Peace Science 27 (4), 308–325.
O’Loughlin, J. and L. Anselin (1991). Bringing geography back to the study of international relations: Spatialdependence and regional context in Africa, 1966Ð1978. International Interactions 17 (1), 29–61.
O’Loughlin, J., E. Holland, and F. Witmer (2011). The Changing Geography of Violence in the North Caucasusof Russia, 1999-2011: Regional Trends and Local Dynamics in Dagestan, Ingushetia and Kabardino-Balkaria.Eurasian Geography and Economics 52 (5).
O’Loughlin, J. and F. Witmer (2011). The Localized Geographies of Violence in the North Caucasus of Russia,1999-2007. Annals, Association of American Geographers 101 (1).
O’Loughlin, J., F. D. W. Witmer, and A. M. Linke (2010). The Afghanistan-Pakistan Wars, 2008-2009: Micro-geographies, Conflict Diffusion, and Clusters of Violence. Eurasian Geography and Economics 51 (4).
O’Loughlin, J., F. D. W. Witmer, A. M. Linke, and N. Thorwardson (2010). Peering into the fog of war: Thegeography of the wikileaks afghanistan war logs, 2004-2009. Eurasian Geography and Economics 51 (4).
Oneal, J. R. and B. Russett (2001). Clear and clean: The fixed effects of the liberal peace. International Organiza-tion 55 (02), 469–485.
Raknerud, A. and H. Hegre (1997). The hazard of war: Reassessing the evidence for the democratic peace. Journalof Peace Research 34 (4), 385–404.
Raleigh, C. and H. Hegre (2009). Population size, concentration, and civil war. A geographically disaggregatedanalysis. Political Geography 28.
Raleigh, C., A. Linke, H. Hegre, and J. Karlsen (2010). Introducing ACLED: An Armed Conflict Location and EventDataset. Journal of Peace Research 47 (5), 651–660.
Rasler, K. and W. R. Thompson (2000). Explaining rivalry escalation to war: Space, position, and contiguity in themajor power subsystem. International Studies Quarterly 44 (3), 503–530.
Rasler, K. and W. R. Thompson (2011). Borders, Rivalry, Democracy, and Conflict in the European Region, 1816-1994. Conflict Management and Peace Science 28, 280–305.
29

Reed, W. and D. Chiba (2010). Decomposing the Relationship Between Contiguity and Militarized Conflict. AmericanJournal of Political Science 54 (1), 61–73.
Reeves, A. M., S. M. Shellman, and B. M. Stewart (2006). Media Generated Data: The Effects of Source Bias onEvent Data Analysis. In Presented at the International Studies Association annual convention.
Reising, U. K. H. (1999). United in opposition? Journal of Conflict Resolution 43 (3), 317–342.
Sagramoso, D. (2007). Violence and conflict in the Russian North Caucasus. International Affairs 83 (4), 681–705.
Salehyan, I. (2008a). No Shelter Here: Rebel Sanctuaries and International Conflict. The Journal of Politics 70 (01),54–66.
Salehyan, I. (2008b). The Externalities of Civil Strife: Refugees as a Source of International Conflict. AmericanJournal of Political Science 52 (4), 787–801.
Salehyan, I. and K. S. Gleditsch (2006). Refugees and the spread of civil war. International Organization 60 (02),335–366.
Saxton, G. and M. Benson (2008). Means, motives and opportunities in ethno-nationalist mobilization. InternationalInteractions 34 (1), 53–83.
Saxton, G. D. (2005). Repression, Grievances, Mobilization, and Rebellion: A New Test of GurrÕs Model of Eth-nopolitical Rebellion. International Interactions 31 (1), 87–116.
Schrodt, P. A. (2001). Automated Coding of International Event Data Using Sparse Parsing Techniques. In Presentedat the International Studies Association, Chicago.
Schrodt, P. A. and D. J. Gerner (1994). Validity assessment of a machine-coded event data set for the Middle East,1982-1992. American Journal of Political Science 38, 825–854.
Schutte, S. and N. B. Weidmann (2011). Diffusion patterns of violence in civil wars. Political Geography 30 (3), 143– 152.
Senese, P. D. (2005). Territory, contiguity, and international conflict: Assessing a new joint explanation. AmericanJournal of Political Science 49 (4), 769–779.
Shellman, S. M. (2008). Coding Disaggregated Intrastate Conflict: Machine Processing the Behavior of SubstateActors over Time and Space. Political Analysis 16 (4).
Simowitz, R. (1998). Evaluating conflict research on the diffusion of war. Journal of Peace Research 35 (2), 211–230.
Simowitz, R. and M. C. Sheffer (1998). Cumulation, Evaluation and the Research Process: A Response to Starr &Siverson. Journal of Peace Research 35 (2), 238–244.
Siverson, R. M. and H. Starr (1990). Opportunity, Willingness, and the Diffusion of War. The American PoliticalScience Review 84 (1), 47–67.
Souleimanov, E. (2007). Endless war: the Russian-Chechen conflict in perspective. Frankfurt am Main: Peter Lang.
Starr, H. (2002). Opportunity, willingness and geographic information systems (gis): reconceptualizing borders ininternational relations. Political Geography 21 (2), 243–261.
Starr, H. (2003). The power of place and the future of spatial analysis in the study of conflict. Conflict Managementand Peace Science 20 (1), 1–20.
Starr, H. (2005). Territory, proximity, and spatiality: The geography of international conflict1. International StudiesReview 7 (3), 387–406.
Starr, H. and B. A. Most (1983). Contagion and border effects on contemporary african conflict. Comparative PoliticalStudies 16 (1), 92–117.
30
Starr, H. and B. A. Most (1985). The forms and processes of war diffusion. Comparative Political Studies 18 (2),206–227.
Starr, H. and R. M. Siverson (1998). Cumulation, Evaluation and the Research Process: Investigating the Diffusionof Conflict. Journal of Peace Research 35 (2), 231–237.
Starr, H. and D. G. Thomas (2005). The nature of borders and international conflict: Revisiting hypotheses onterritory. International Studies Quarterly 49 (1), 123–140.
Starr, H. and G. Thomas (2002). The ’nature’ of contiguous borders: Ease of interaction, salience, and the analysisof crisis. International Interactions 28 (3), 213–235.
Steenberghen, T., K. Aerts, and I. Thomas (2009). Spatial clustering of events on a network. Journal of TransportGeography .
Thomas, A. C. and J. K. Blitzstein (2009, 24 October). The Thresholding Problem: Uncertainties Due to Di-chotomization of Valued Ties.
Tir, J. (2005). Dividing countries to promote peace: Prospects for long-term success of partitions. Journal of PeaceResearch 42 (5), 545–562.
Townsley, M., S. Johnson, and J. H. Ratcliffe (2008). Space Time Dynamics of Insurgent Activity in Iraq. SecurityJournal 21 (3), 139–146.
Urdal, H. (2008). Population, Resources, and Political Violence: A Subnational Study of India, 1956 - 2002. Journalof Conflict Resolution 52 (4).
Vasquez, J. A., P. F. Diehl, C. Flint, J. Scheffran, S.-H. Chi, and T. J. Rider (2011). The ConflictSpace of Cataclysm:The International System and the Spread of War 1914-1917. Foreign Policy Analysis 7 (143-168).
Vendina, O. I., V. S. Belozerov, and A. Gustafson (2007). The Wars in Chechnya and Their Effects on NeighboringRegions. Eurasian Geography and Economics 48 (2).
Ward, M. D. and K. S. Gleditsch (2002). Location, location, location: An mcmc approach to modeling the spatialcontext of war and peace. Political Analysis 10 (3), 244–260.
Ward, M. D. and P. D. Hoff (2007). Persistent patterns of international commerce. Journal of Peace Research 44 (2),157–175.
Ward, M. D., R. M. Siverson, and X. Cao (2007). Disputes, Democracies, and Dependencies: A Reexamination ofthe Kantian Peace. American Journal of Political Science 51 (3), 583–601.
Way, L. (2008). The Real Causes of the Color Revolutions. Journal of Democracy 19 (3), 55–69.
Weber, R. P. (1990). Basic Content Analysis (2nd ed.). Newbury Park, CA: Sage Publications.
Weidmann, N. (2009). Geography as Motivation and Opportunity: Group Concentration and Ethnic Conflict. Journalof Conflict Resolution 53 (4), 526–543.
Weidmann, N. and M. D. Ward (2010). Predicting Conflict in Space and Time. Journal of Conflict Resolution 54 (6).
Weidmann, N. B. and M. D. Toft (2010). Promises and Pitfalls in the Spatial Prediction of Ethnic Violence: AComment. Conflict Management and Peace Science.
Weyland, K. (2009). The diffusion of revolution: ‘1848’ in Europe and Latin America. International Organization 63,391–423.
Weyland, K. (2010). The Diffusion of Regime Contention in European Democratization, 1830-1940 . ComparativePolitical Studies 43 (8/9), 1148–1176.
31

Wimmer, A., L.-E. Cederman, and B. Min (2009). Ethnic Politics and Armed Conflict: A Configurational Analysisof a New Global Data Set. American Sociological Review 74 (2), 316–337.
Wood, S. N. (2003). Thin plate regression splines. Journal of the Royal Statistical Society, Series B 65 (1), 95–114.
Wood, S. N. (2006). Generalized Additive Models: An Introduction with R. Boca Raton, FL: Chapman and Hall.
Zhan, F. and C. Noon (1998, Feb). Shortest path algorithms: An evaluation using real road networks. TransportationScience 32 (1), 65–73.
32