denmark 2002 review - .net framework
TRANSCRIPT

I N T E R N AT I O N A L E N E R GY AG E N C Y
EnergyPoliciesof IEA
Countries
Denmark 2002 Review
prepaDenmark 2/04/02 15:19 Page 1

I N T E R N AT I O N A L E N E R GY AG E N C Y
EnergyPoliciesof IEA
Countries
Denmark 2002 Review

© OECD/IEA, 2002
Applications for permission to reproduce or translate all or part of this publication should be made to:Head of Publications Service, OECD/IEA
2, rue André-Pascal, 75775 Paris cedex 16, Franceor
9, rue de la Fédération, 75739 Paris Cedex 15, France.
INTERNATIONAL ENERGY AGENCY9, rue de la Fédération,
75739 Paris, cedex 15, France
The International Energy Agency (IEA) is anautonomous body which was established inNovember 1974 within the framework of theOrganisation for Economic Co-operation andDevelopment (OECD) to implement an inter-national energy programme.
It carries out a comprehensive programme ofenergy co-operation among twenty-six* of theOECD’s thirty Member countries. The basic aimsof the IEA are:
• to maintain and improve systems for copingwith oil supply disruptions;
• to promote rational energy policies in a globalcontext through co-operative relations with non-member countries, industry and internationalorganisations;
• to operate a permanent information system onthe international oil market;
• to improve the world’s energy supply anddemand structure by developing alternativeenergy sources and increasing the efficiency ofenergy use;
• to assist in the integration of environmental andenergy policies.
* IEA Member countries: Australia, Austria,Belgium, Canada, the Czech Republic, Denmark,Finland, France, Germany, Greece, Hungary, Ireland,Italy, Japan, the Republic of Korea, Luxembourg,the Netherlands, New Zealand, Norway, Portugal,Spain, Sweden, Switzerland, Turkey, the UnitedKingdom, the United States. The EuropeanCommission also takes part in the work of the IEA.
ORGANISATION FOR ECONOMIC CO-OPERATION
AND DEVELOPMENT
Pursuant to Article 1 of the Convention signed inParis on 14th December 1960, and which cameinto force on 30th September 1961, the Organisationfor Economic Co-operation and Development(OECD) shall promote policies designed:
• to achieve the highest sustainable economicgrowth and employment and a rising standardof living in Member countries, while maintainingfinancial stability, and thus to contribute to thedevelopment of the world economy;
• to contribute to sound economic expansion inMember as well as non-member countries in theprocess of economic development; and
• to contribute to the expansion of world tradeon a multilateral, non-discriminatory basis inaccordance with international obligations.
The original Member countries of the OECD areAustria, Belgium, Canada, Denmark, France,Germany, Greece, Iceland, Ireland, Italy,Luxembourg, the Netherlands, Norway, Portugal,Spain, Sweden, Switzerland, Turkey, the UnitedKingdom and the United States. The followingcountries became Members subsequentlythrough accession at the dates indicatedhereafter: Japan (28th April 1964), Finland(28th January 1969), Australia (7th June 1971),New Zealand (29th May 1973), Mexico (18thMay 1994), the Czech Republic (21st December1995), Hungary (7th May 1996), Poland (22ndNovember 1996), the Republic of Korea (12thDecember 1996) and Slovakia (28th September2000). The Commission of the EuropeanCommunities takes part in the work of the OECD(Article 13 of the OECD Convention).

TABLE OF CONTENTS
SUMMARY OF CONCLUSIONS AND RECOMMENDATIONS . . . . . . 5
ORGANISATION OF THE REVIEW . . . . . . . . . . . . . . . . . . . . . . . . . . . . . . 9
ENERGY MARKET AND ENERGY POLICY . . . . . . . . . . . . . . . . . . . . . . . . 11
ENERGY AND THE ENVIRONMENT . . . . . . . . . . . . . . . . . . . . . . . . . . . . . 37
ENERGY EFFICIENCY AND RENEWABLES . . . . . . . . . . . . . . . . . . . . . . . 53
FOSSIL FUELS . . . . . . . . . . . . . . . . . . . . . . . . . . . . . . . . . . . . . . . . . . . . . . . . . 69
ELECTRICITY AND HEAT . . . . . . . . . . . . . . . . . . . . . . . . . . . . . . . . . . . . . . . . 95
ENERGY RESEARCH AND DEVELOPMENT . . . . . . . . . . . . . . . . . . . . . . . 117
ANNEX: ENERGY BALANCES AND KEY STATISTICAL DATA . . . . . . . . . 123
ANNEX: INTERNATIONAL ENERGY AGENCY “SHARED GOALS” . . . 127
ANNEX: GLOSSARY AND LIST OF ABBREVIATIONS . . . . . . . . . . . . . . . 129C
B
A
8
7
6
5
4
3
2
1
3

Tables and Figures
TABLES1. Effective Carbon Tax Rates, 1996 to 2002 . . . . . . . . . . . . . . . . . . . . . . . . . . . . 312. Energy Tax Rates, 1998 to 2002 . . . . . . . . . . . . . . . . . . . . . . . . . . . . . . . . . . . . 323. Sulphur Taxes, 1996 to 2000 and After . . . . . . . . . . . . . . . . . . . . . . . . . . . . . . 334. Emissions Trends for Individual Greenhouse Gases, 1990 to 2008-2012 . . . 435. Energy Efficiency Targets to 2005 . . . . . . . . . . . . . . . . . . . . . . . . . . . . . . . . . . . . 536. Domestic Biomass Potential . . . . . . . . . . . . . . . . . . . . . . . . . . . . . . . . . . . . . . . . . . 627. Natural Gas Customers Eligible for Competition, 1 August 2001 . . . . . . . 908. Eligible Electricity Consumers in Denmark . . . . . . . . . . . . . . . . . . . . . . . . . . . . 114
FIGURES1. Total Final Consumption by Source, 1973 to 2010 . . . . . . . . . . . . . . . . . . 132. Total Final Consumption by Sector, 1973 to 2010 . . . . . . . . . . . . . . . . . . . 143. Final Consumption by Sector and by Source, 1973 to 2010 . . . . . . . 154. Energy Intensity in Denmark and in Other Selected IEA Countries,
1973 to 2010 . . . . . . . . . . . . . . . . . . . . . . . . . . . . . . . . . . . . . . . . . . . . . . . . . . . 165. Energy Intensity by Sector in Denmark and in Other Selected
IEA Countries, 1973 to 2010 . . . . . . . . . . . . . . . . . . . . . . . . . . . . . . . . . . . . . . 176. Energy Production by Source, 1973 to 2010 . . . . . . . . . . . . . . . . . . . . . . . . 197. Total Primary Energy Supply, 1973 to 2010 . . . . . . . . . . . . . . . . . . . . . . . . 198. Total Primary Energy Supply in IEA Countries, 2000 . . . . . . . . . . . . . . . . . 209. Structure of the Danish Energy Agency . . . . . . . . . . . . . . . . . . . . . . . . . . . . . 26
10. CO2 Emissions by Fuel, 1973 to 1999 . . . . . . . . . . . . . . . . . . . . . . . . . . . . . 4111. CO2 Emissions by Sector, 1973 to 1999 . . . . . . . . . . . . . . . . . . . . . . . . . . . . 4112. Sectoral Greenhouse Gas Emissions Trends, 2008 to 2012 . . . . . . . . . . . 4313. Coal Consumption by Sector, 1973 to 2010 . . . . . . . . . . . . . . . . . . . . . . . . 6914. Danish Hydrocarbons Licence Area and Production Facilities . . . . . . . . . 7215. Oil and Gas Pipelines in Denmark, 2000 . . . . . . . . . . . . . . . . . . . . . . . . . . . 7516. Final Consumption of Oil by Sector, 1973 to 2010 . . . . . . . . . . . . . . . . . . 7917. OECD Gasoline Prices and Taxes, 1st Quarter 2001 . . . . . . . . . . . . . . . . . 8018. OECD Automotive Diesel Prices and Taxes, 1st Quarter 2001 . . . . . . . . 8119. Natural Gas Prices in Denmark and in Other Selected IEA Countries,
1984 to 2000 . . . . . . . . . . . . . . . . . . . . . . . . . . . . . . . . . . . . . . . . . . . . . . . . . . . 8420. Natural Gas Prices in IEA Countries, 2000 . . . . . . . . . . . . . . . . . . . . . . . . . 8521. Natural Gas Consumption, 1973 to 2010 . . . . . . . . . . . . . . . . . . . . . . . . . . 8722. Electricity Consumption by Sector, 1973 to 2010 . . . . . . . . . . . . . . . . . . . . 9723. Electricity Prices in IEA Countries, 2000 . . . . . . . . . . . . . . . . . . . . . . . . . . . . 9824. Electricity Generation by Source, 1973 to 2010 . . . . . . . . . . . . . . . . . . . . . 9925. CHP Plants, District Heating Plants and Industrial Autoproducers
in Denmark, 2000 . . . . . . . . . . . . . . . . . . . . . . . . . . . . . . . . . . . . . . . . . . . . . . . . 10126. Wind Turbines in Denmark, 2000 . . . . . . . . . . . . . . . . . . . . . . . . . . . . . . . . . . 104
4

1
SUMMARY OF CONCLUSIONSAND RECOMMENDATIONS
SUMMARYThroughout the last few decades, Danish energy policy has been stronglyinfluenced by environmental policy objectives. Until November 2001, oneminister was responsible for both energy and environmental policy. Denmark alsohas many policy goals that are inspired by both energy and environmentalconsiderations. The country promotes energy efficiency, renewables andcombined heat and power production (CHP). It has set itself the target ofproducing 20% of its electricity from renewables. Denmark also has severalgreenhouse gas targets. Among them there is the Kyoto commitment to reducegreenhouse gas emissions (six gases) by 21% in the first budget period 2008-2012,compared to 1990. There is also the stringent national commitment to reduce CO2
emissions by 20% by 2005, compared to 1988. Denmark's Parliament approvedratification of the Kyoto Protocol on 30 May 2001.
If these energy policies are measured against their objectives, Denmark has beenvery successful. Denmark has the highest share of electricity generatedin combined heat and power plants in the world, as well as with one of thelargest district heating systems. In 2000, 12.6% of electricity generation was fromwind turbines, also the highest of any nation. According to government forecasts,Denmark will come very close to meeting its multiple CO2 and greenhousegas emissions commitments, provided a national system of tradable CO2 quotasfor power plants remains in place. The system was introduced on 1 January 2001to render climate change abatement in the power industry market-compatible.The quota system will be in force provisionally until full retail competitionbecomes effective in 2003. Should the quota system lapse without replacement,electricity exports could soar after 2003, and national CO2 emissions could fallshort of the Kyoto target by more than 19%. The report recommends that adecision about the future of the quota system be taken as soon as possible.
The decisive step towards full liberalisation of the Danish power industry wastaken in 1999, when the Electricity Supply Act was adopted. Since 1 April 2000,final customers of 10 GWh or more per year have been eligible to choose theirelectricity supplier in the free market. On 1 January 2001 the threshold waslowered to 1 GWh. On 1 January 2003, all final consumers will become eligible.Electricity generation, ownership of the transmission grid, operation of the grid,distribution and electricity supply must each be organised in separate legalentities. Electricity market reform in Denmark goes beyond the requirements ofthe EU directive.
5

However, the government requires CHP and wind energy to be given priorityin dispatching. Therefore, only about 60% to 65% of the power market is governed bycompetitive price signals. This “priority” dispatch requirement causes excess generationduring certain periods, a situation which may lead to losses for utilities. The Danishgovernment should encourage more trade, competition and interconnection, and adaptenvironmental policies to the realities of the power market.
In the gas market, Denmark has opted for more restrictive provisions, in line with theminimum requirements of the EU Gas Directive. Since 10 August 2000,30% of the markethas been open to competition. This will increase to 38% in 2003 and 43% in 2008. TheDanish government also reserves the right to deny access of some potential competitorsto the gas grid if such access would cause serious financial difficulties for the state-ownednatural gas pipeline company DONG. This right is permitted under a derogation in thedirective. Originally, the Natural Gas Supply Act of 2000 provided for negotiated thirdparty access,but this was changed to regulated third party access in October 2001. From2003 onwards,network operation and gas trading activities will have to be separated.
Between July 1999 and July 2000,DONG acquired two of the five Danish gas distributionand supply companies, and also the right to supply the largest customers of two others.This consolidation was carried out partly in response to the high indebtedness of theDanish gas sector. But it means that DONG now directly controls nearly 95% of the Danishgas market.The Danish Competition Authority has taken note of this strong dominantposition. The government should prevent DONG from becoming a monopoly supplieralong the entire gas chain. It should create incentives for new suppliers, foreign anddomestic, to enter the Danish market. The new government has decided that the gasmarket should be fully competitive by 2004 and that DONG should be privatised at a timeto be determined in the future.
RECOMMENDATIONS
The Government of Denmark should:
Energy Market and Energy Policy■■ Review the existing policy measures with a view to developing more cost-
effective policies. Government interventions should be analysed on a
6
Disclaimer
The review visit on which this report is based took place in October 2001, beforethe new Danish government took office in November 2001.Most of the drafting ofthis report was completed before the details of the new government’s policy wereknown. For this reason, the report reviews exclusively the policies of the previousgovernment.Where policy changes became known before the publication, they arementioned briefly in the body of the report.

continuing basis for cost-effectiveness and should be prioritised accordingly.Market-oriented approaches should receive priority.
■■ Ensure that both domestic and international policies are adequately assessed inorder to meet environmental objectives cost-effectively.
■■ Further review the tax and subsidy system with a view to reducing itscomplexity and administrative costs.
■■ Work to reconcile free market rules and environmental policies to send the rightinvestment signals to the market; in particular, develop as soon as possible a market-based successor mechanism to the CO2 quota system for the period after 2003.
Energy and the Environment■■ Finish the assessment of the economic implications of basing climate change policy
almost exclusively on domestic mitigation strategies. In particular, consider theadvantages that the Kyoto mechanisms and the extension of the quota/tradingsystem to other sectors may offer in closing the remaining emissions gap.
■■ Decide urgently the fate of the CO2 quota system for the electricity sectorbeyond 2003; determine the quota levels; reassess the low penalty for non-compliance; and determine whether international trading and credits can beincorporated.
■■ Make further adjustments to the car registration fee and pursue road pricing andother cost-effective policy instruments in the transport sector.
Energy Efficiency and Renewables■■ Continue to review the performance of existing energy efficiency programmes
with a view to developing market-based and more cost-effective policies. Loanpayback schemes could substitute for outright subsidies in some cases.
■■ Continue to place time limits on subsidy schemes, particularly on those to boostmarket penetration of new energy-efficient technologies.
■■ Improve the transparency of the costs and trade implications of the variousrenewables support measures, in particular “priority” production.
■■ Investigate the consequences of greater penetration of imported biomass interms of CO2-neutrality, cost, and Denmark’s security of supply objectives.
■■ Take steps to move to market-based policies as soon as possible, including theintroduction of the green certificates programme, or some other instrument tooffset the costs of current subsidies for renewable energy. In the transitory period,subsidies need to be reduced further to reflect current market conditions for windenergy and CHP.
7

Fossil Fuels■■ Review the hydrocarbon tax to eliminate distortions in upstream investment and
to establish a clear and simple upstream taxation system.
■■ Facilitate effective competition in the Danish gas market by preventing DONGfrom becoming a monopoly supplier along the entire gas chain. The CompetitionAuthority should monitor DONG’s behaviour closely.
■■ Create incentives for new suppliers to enter the Danish market.
Electricity and Heat■■ Strive to increase competition by:
• Working towards further opening of Denmark’s interconnection with othercountries for competitive power trade, especially spot purchases.
• Encouraging the removal of internal bottlenecks in the transmission systemand striving for a similar approach in Nordel.
• Encouraging more market-oriented behaviour among power companies, andespecially among small distribution and supply companies.
• Encouraging the transformation of consumer co-operatives into commercialcompanies, and facilitating the privatisation of municipal utilities.
■■ Through the Competition Authority,monitor the electricity market and deal withabuses rapidly.
■■ Continue to adapt the environmental policies aimed at the power industry to therealities of competition.
Energy Research and Development■■ Complete a comprehensive energy research strategy covering the full spectrum
of innovation, and domestic and international programming.
■■ Clarify responsibilities and improve the co-ordination between the Danish EnergyAgency and the electricity system operators that administer the Public ServiceObligation. This also applies to the electricity end-use R&D requirement.
8

2
ORGANISATION OF THE REVIEW
REVIEW TEAMAn IEA review team visited Denmark in October 2001 to review the country'senergy policies. This report was drafted on the basis of information receivedduring, prior to and after the visit, including the Danish government's officialresponse to the IEA's 2001 policy questionnaire and the views expressed by variousparties during the visit. The team greatly appreciated the openness and co-operation shown by everyone it met.
The members of the team were:
Miklós PoósTeam LeaderMinistry of Economic AffairsHungary
Ove FlatakerPolicy ExpertMinistry of Petroleum and Energy Norway
Virginie SchwarzPolicy ExpertMinistry of Economic Affairs, Finance and IndustryFrance
Bryan CookPolicy ExpertNatural Resources CanadaCanada
Johannes EnzmannEU ObserverCommission of the European Communities
Shigetaka SekiIEA Secretariat
Kristi VaranguIEA Secretariat
Gudrun LammersIEA Secretariat
9

ORGANISATIONS VISITEDThe Danish Energy Agency (then part of the Ministry of Environment and Energy)The Ministry of TransportationThe Ministry of TaxationThe Danish Energy Regulatory AuthorityThe Danish Competition Authority
Dansk Olie og Naturgas (DONG)Dansk EnergiElforElkraftElsamEltra Energi E2Mærsk Oil and Gas
The Danish Consumer CouncilThe Danish Forum of Electricity TradersThe Danish Wind Industry AssociationThe Federation of Danish IndustriesThe Danish Technological InstituteThe Institute of Local Government Studies (AKF)Risø National Laboratory
The Council for Sustainable DevelopmentThe Economic Council of the Labour MovementThe Danish Organisation for Renewable Energy (OVE)GreenpeaceWorld-Wide Fund for Nature (WWF)
10

3
ENERGY MARKET AND ENERGY POLICY
ENERGY MARKETThe Kingdom of Denmark is a country of 5.3 million people with a landarea of about 43 000 square kilometres in the north of Europe, betweenthe North Sea and the Baltic Sea. Population growth is far below 1% (2001estimate: 0.3%). About 85% of the population lives in cities. The largest citiesare the capital Copenhagen (København) (1.78 million inhabitants inCopenhagen and surrounding regions), Århus (280 000), Odense (180 000) andAalborg (160 000).
The country comprises the peninsula of Jutland (Jylland) to the west, theislands Zealand (Sjælland) and Funen (Fyn) to the east and hundreds of smallerislands. The world’s largest island Greenland (2 175 600 square kilometres) ispart of Denmark’s national territory but became self-governing following areferendum in 1979. The same administrative solution applies to the FaeroeIslands in the northern Atlantic. Denmark has been a member of the EuropeanUnion and its predecessors since January 1973. But in 1982 Greenlanders votedto leave the European Communities. Greenland’s withdrawal was completedin 1985.
Denmark has a mild oceanic climate with limited temperature variation (40-yearmean temperature in February –0.4°, in July 16.6°C) and low altitude: Denmark’shighest altitude is 170 metres. Land use is primarily agricultural (64%), and built-up areas occupy about 15%. The remainder is forest (10%) and naturalareas.
The country comprises 14 counties (amtskommuner) and 275 municipalities(kommuner). Social concerns are a priority for Danes, and there are extensivegovernment welfare measures. Economic, energy and environmental policyis often the result of agreements between the largest political parties inthe Parliament.
Since 1993 Denmark has had three centre-left coalitions led by social democrats.This changed in November 2001, when a new government was elected. The newgovernment is a coalition of liberals and conservatives, led by the liberals. Thepolitical situation has changed since the new liberal-conservative coalition tookover. It is too early to report any detailed policy changes, but it is clear that thegovernment’s overall priorities will change. The new government is unlikely toreverse past policies entirely, as large parts of Danish energy policy are based onjoint political agreements across the parliamentary spectrum. However, thechange of government will entail shifts in the relative weight of policyobjectives. For example, the new government has already split the Ministry of
11

Environment and Energy into two ministries, one for economic and businessaffairs, including the energy sector, and one for the environment. Moreover, thegovernment has stated that energy policy will focus more on economicefficiency, market-based solutions and international approaches to environmentalissues, and lower energy prices for industry. It should be noted that this reportwas prepared and drafted before the change of government. Therefore it focuseson the previous government's policies except when it expressly refers to thenew government.
The Danish economy is characterised by high-tech agriculture, modern industryand high dependence on foreign trade. Denmark is a net exporter of foodand energy and has both a balance of payments and a budget surplus. Denmarkmeets, and even exceeds, the economic convergence criteria for participatingin the third phase of the European Monetary Union (EMU), but in a referendumheld in September 2000, the electorate reconfirmed its decision not to join theeuro zone. However, the Danish crown (DKK) remains pegged to the euro (€)1.
The labour force is 2.9 million. In 1999, unemployment was 5.3%, downfrom 8.25% in 1996. Inflation was 2.9% in 2000 and GDP growth 2.8%.Principal industries are food processing, machinery and equipment, textilesand clothing, chemical products, electronics, construction, furniture and otherwood products and shipbuilding. In 2000, agriculture, forestry and fisheryaccounted for 3.8% of GDP, industry 25% and services, including governmentservices, 72%. The main export commodities are machinery and instruments,meat and meat products, dairy products, fish, chemicals, furniture and windturbines. Denmark’s principal trading partners are the European Union (66.5%),Norway (5.8%), and the United States (5.4%).
ENERGY DEMANDTotal final consumption (TFC) of energy was 15.24 million tonnes of oilequivalent (Mtoe) in 2000. As can be seen in Figure 1, this was somewhat lowerthan consumption in 1973 (16.15 Mtoe) and also below the two other demandpeaks in 1979 and 1996. Danish energy consumption contracted very sharplyafter the 1973 and 1979 oil crises. Demand development in the 1980s showedno clear trend. However, Denmark experienced nearly a decade ofuninterrupted economic growth in the 1990s, which led to TFC growth of 11%between 1990 and 1999. The small demand peak in 1996 was largely due toexceptionally cold weather. Energy demand showed negative growth of 2.6%between 1999 and 2000.
12
1. One Danish crown (DKK) comprises 100 øre. In 2000, one Danish crown averaged US$ 0.123 and€ 0.134228.

Oil accounts for about one-half of energy consumption, and more than half the oilis used for transport. The share of heat in TFC is unusually high at 15.3%. Thereason for this is Denmark’s vast use of district heating. District heating (DH) waspromoted after 1979 through the national Heat Supply Act. This included anational heat plan and the possibility for local governments to mandate connectionto the district heating network for new and existing buildings. Most of the densely-populated areas of the country are now covered by the district heating network,andin 1981, more than 50% of all heating installations in Danish households useddistrict heat, up from one-third in 1981. In total, 2.33 Mtoe of district heat weredelivered to Danish households and businesses in 2000 (2.87 Mtoe in 1998according to Danish statistics); this represents an increase of 27% over 1990 and isone of the highest amounts in the world.
A large and increasing portion of the district heat is produced through combinedheat and power production (CHP). Between 1980 and 1998, the portion of heating-only plants declined from 55% to 13%; the remainder was CHP or other forms of waste heat. In fact, with about half of electricity generation from CHP plants, Denmark has the highest CHP share in power generation in the world. Theuse of CHP combined with district heating is and has long been Denmark’s main instrument to limit primary energy use and its environmental effects,and has benefited from strong government support. More detail is provided inChapter 7.
13
Mto
e
Oil
Gas
Renewables
Coal
Heat
Electricity
0
2
4
6
8
10
12
14
16
18
1975 1980 1985 1990 1995 2000 2005 2010
Figure 1Total Final Consumption by Source, 1973 to 2010
Sources: Energy Balances of OECD Countries, IEA/OECD Paris, 2001, and country submission.

Denmark’s industrial structure, which is oriented towards light industry andespecially towards services, is reflected in the comparatively low industrial share of21% in total final energy consumption. Whereas residential energy demand wasresponsible for most of the demand fluctuations of the past 25 years, energydemand for transport has shown steady growth almost unaffected by past pricefluctuations and policy measures. In 2000,TFC for transport was 4.8 Mtoe, or 31%,very close to the European average.
Total final energy consumption is expected to increase slightly until 2010,but is notexpected to exceed its absolute peak of almost 17 Mtoe in 1979. The Danishgovernment expects primary energy demand to change very little over the nextdecade and to remain slightly below its 1988 value at 19.1 Mtoe2.
14
Mto
e
Industry
Residential
Transport
Other*
0
2
4
6
8
10
12
14
16
18
1975 1980 1985 1990 1995 2000 2005 2010
Figure 2Total Final Consumption by Sector, 1973 to 2010
* includes commercial, public service and agricultural sectors.Sources: Energy Balances of OECD Countries, IEA/OECD Paris, 2001, and country submission.
2. The IEA produces its own set of data for each Member country. However, these IEA data arenot based on an independent IEA data collection or modelling exercise. They are based onstatistics submitted annually by Member governments, which are then adjusted to IEAdefinitions to render them internationally comparable. Owing to definitional discrepancies,national and IEA data can nevertheless differ significantly. The IEA’s World Energy Model is aregional model that does not yield results for individual countries. This report uses IEA dataunless otherwise indicated.

15
Mto
eM
toe
Mto
e
Industry Sector
Residential/Commercial Sector
Transport Sector
OilGasRenewablesCoalHeatElectricity
OilGasRenewablesCoalHeatElectricity
OilElectricity
0
0.5
1.0
1.5
2.0
2.5
3.0
3.5
4.0
4.5
1975 1980 1985 1990 1995 200 2005 2010
0
2
4
6
8
10
1975 1980 1985 1990 1995 2000 2005 2010
0
1
2
3
4
5
6
1975 1980 1985 1990 1995 2000 2005 2010
Figure 3Final Consumption by Sector and by Source, 1973 to 2010
Sources: Energy Balances of OECD Countries, IEA/OECD Paris, 2001, and country submission.
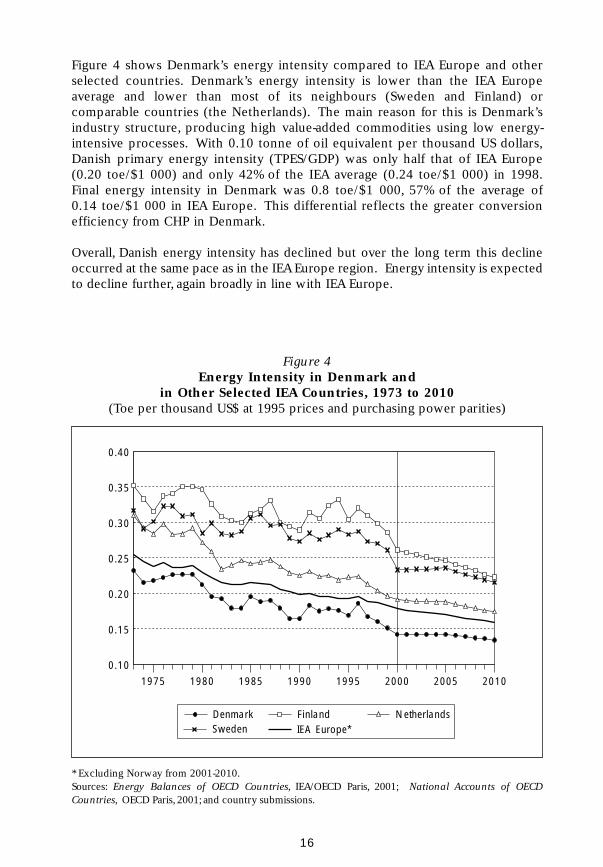
Figure 4 shows Denmark’s energy intensity compared to IEA Europe and otherselected countries. Denmark’s energy intensity is lower than the IEA Europeaverage and lower than most of its neighbours (Sweden and Finland) orcomparable countries (the Netherlands). The main reason for this is Denmark’sindustry structure, producing high value-added commodities using low energy-intensive processes. With 0.10 tonne of oil equivalent per thousand US dollars,Danish primary energy intensity (TPES/GDP) was only half that of IEA Europe(0.20 toe/$1 000) and only 42% of the IEA average (0.24 toe/$1 000) in 1998.Final energy intensity in Denmark was 0.8 toe/$1 000, 57% of the average of0.14 toe/$1 000 in IEA Europe. This differential reflects the greater conversionefficiency from CHP in Denmark.
Overall, Danish energy intensity has declined but over the long term this declineoccurred at the same pace as in the IEA Europe region. Energy intensity is expectedto decline further, again broadly in line with IEA Europe.
16
Denmark Finland NetherlandsSweden IEA Europe*
0.10
0.15
0.20
0.25
0.30
0.35
0.40
1975 1980 1985 1990 1995 2000 2005 2010
Figure 4Energy Intensity in Denmark and
in Other Selected IEA Countries, 1973 to 2010(Toe per thousand US$ at 1995 prices and purchasing power parities)
* Excluding Norway from 2001-2010.Sources: Energy Balances of OECD Countries, IEA/OECD Paris, 2001; National Accounts of OECDCountries, OECD Paris, 2001; and country submissions.

17
DenmarkFinlandNetherlandsSwedenIEA Europe*
Industry Sector
Residential/Commercial Sector
Transport Sector
0
0.02
0.04
0.06
0.08
0.10
0.12
0.14
0.04
0.06
0.08
0.10
0.12
0.14
0.16
1975 1980 1985 1990 1995 2000 2005 2010
1975 1980 1985 1990 1995 2000 2005 2010
0.020
0.025
0.030
0.035
0.040
0.045
0.050
1975 1980 1985 1990 1995 2000 2005 2010
Figure 5Energy Intensity by Sector in Denmark and
in Other Selected IEA Countries, 1973 to 2010(Toe per thousand US$ at 1995 prices and purchasing power parities)
* Excluding Norway from 2000-2001.Sources: Energy Balances of OECD Countries, IEA/OECD Paris, 2001; National Accounts of OECDCountries, OECD Paris, 2001; and country submissions.

Energy SupplyOverviewDenmark has fossil energy resources, as well as uranium at Kvanefjeld in south-westGreenland. The uranium resources are significant – with more than 40 000 tonnes ofestimated reserves, Denmark ranks third in Western Europe, behind France but aheadof Spain. However, the Danish resources are low-grade and far from commercial atpresent uranium prices. Moreover, there are environmental issues that would need tobe resolved, and as part of the 1979 home rule system, the government of Greenlandhas a right of veto regarding the exploitation of such resources.
In the second half of the 1960s, Denmark discovered oil and gas on its continentalshelf in the North Sea. The first finds were the Anna (1966, now named Kraka), Cora(1968, now Tyra), Bent (now Roar), Dan (1971) and Gorm fields. The reserves aremuch smaller than those of the Netherlands,but Denmark’s smaller population entailssmaller domestic demand. Thus, Denmark achieved self-sufficiency in oil and gas in1991 and in energy for the first time in modern history in 1997. This situation iscurrently expected to last until 2006.
Oil production from the Dan field began in 1972, but was disappointing. Thereforea number of years elapsed before the next oil fields, located in the same geologicalformations, came on stream. The Gorm field eventually started production in 1981,and the Skjold field in 1982. Gas production from the Tyra field began only in 1984.
In the following years, oil and gas production expanded rapidly. In 2000, the countryproduced 18.26 Mtoe of oil, more than twice its domestic total primary energy supply(TPES) of oil, and 7.41 Mtoe of natural gas, 66% more than its gas TPES of 4.46 Mtoe.Denmark exports crude oil to surrounding European countries, especially tothe Netherlands (3.6 million tonnes in 2000), Sweden (3.5 million tonnes) Finland(2.2 million tonnes,and the United Kingdom (1.7 million tonnes). Small amounts of gasare exported to Germany (2.3 bcm in 2000) and Sweden (0.8 bcm). In addition,Denmark produces 1.65 Mtoe of combustible renewables and 0.46 Mtoe of wind energy.
The only major energy resource that Denmark has to import entirely is coal. In2000, net coal imports amounted to 3.78 Mtoe. In that year, Denmark imported itscoal mainly from South Africa, Poland, Colombia and Russia, and smaller quantitiesfrom a range of other countries. Despite these coal imports, the country was 142%self-sufficient in energy in 2000.
However, the picture was not always as favourable as it is today. In 1973,oil accountedfor 88.7% of TPES. Consequently, the Danish economy was severely affected duringboth oil crises. This gave rise to government intervention in the energy market inorder to reduce oil demand and TPES as a whole, through various types of energyefficiency measures and the development of combined heat and power production andrenewables.
Consequently, the share of oil in TPES nearly halved between 1973 and 2001, whenit stood at 45.8%. Danish energy supply has changed from being based on oil to a
18

19
Mto
e
Oil
Gas
Other*
0
5
10
15
20
25
30
1975 1980 1985 1990 1995 2000 2005 2010
Figure 6Energy Production by Source, 1973 to 2010
* Other includes solar, tide, wave and ambient heat used in heat pumps.Sources: Energy Balances of OECD Countries, IEA/OECD Paris, 2001, and country submission.
Mto
e
Oil
Gas
Coal
Other*
0
5
10
15
20
25
30
1975 1980 1985 1990 1995 2000 2005 2010
Figure 7Total Primary Energy Supply, 1973 to 2010
* Other includes solar, tide, wave and ambient heat used in heat pumps.Sources: Energy Balances of OECD Countries, IEA/OECD Paris, 2001, and country submission.

20
0% 20% 40% 60% 80% 100%
Coal Oil Gas
Hydro Nuclear Other*
CombustibleRenewables
SwedenNorwayFrance
SwitzerlandFinland
New ZealandCanadaAustria
BelgiumSpainJapan
HungaryKorea
GermanyUnited States
TurkeyUnited KingdomCzech Republic
DenmarkPortugal
AustraliaGreece
ItalyNetherlands
IrelandLuxembourg
Figure 8Total Primary Energy Supply in IEA Countries, 2000
* Other includes solar, tide, wave and ambient heat used in heat pumps.Source: Energy Balances of OECD Countries, IEA/OECD Paris, 2001.

mix of oil, coal, gas and renewables. Coal was phased in quickly after 1973 toreplace oil, but its share dropped substantially after 1995 owing to substitutionpolicies in the power industry because of its environmental impact. In 2000, theshare of coal stood at 20.3% of TPES and this share is expected to rise again slowlyin future. Gas accounted for 22.7% of TPES, and renewables for almost 11%. Theproportion of coal is close to the IEA average (21% in 2000), and the proportion ofnatural gas is very close to the IEA Europe average (22.8% in 2000). Gas use hasrisen as it has substituted for coal in power generation and especially in CHP.
Further change is under way, as can bee seen from Figures 6 and 7. First, 2000 isexpected to mark the peak for Danish oil production. Resources are expected tobecome exhausted rapidly and total energy production to be halved to about 1990levels. Natural gas production is currently expected to peak in 2005. However, thehigh oil and gas prices of the last two years have led to significant explorationefforts and have resulted in new finds (see Chapter 6).
Simultaneously, the government had ambitious plans to develop renewable energyresources, reflected in the steady increase of renewables. Denmark had more than1 500 MW of wind turbine capacity installed in 1998, and almost 10% of its powergeneration was from wind. According to Danish statistics, installed wind powercapacity was more than 2 400 MW in 2000, and wind generation corresponded to12.6% of electricity demand. This is the highest share in any IEA country. Theprevious government intended to increase this portion even further. Natural gasuse is expected to grow steadily, with gas imports necessarily rising after theanticipated gas production peak in 2005.
ENERGY POLICY
Energy Policy ObjectivesLike other IEA Member countries, the Danish government tries to strike a balancebetween the three objectives of free and open energy markets, security of energysupply and environmental protection. At times, the particular weight that Danishvoters and governments attached to each of these objectives has differed somewhatfrom most other Member countries.
Denmark was very hard hit by the first and second oil crises: in 1973, imported oilaccounted for 88.7% of the country’s TPES. Denmark saw itself as extremelyvulnerable to external shocks, and conservation of primary energy became thepriority objective in Danish energy policy. At that time, oil and gas had beendiscovered in the Danish sector of the North Sea, but development of the reserveswas not advanced enough to change this situation.
Denmark’s first energy plan, Danish Energy Policy, was established in 1976.Its main goal was to render Denmark independent of imported oil and to build upenergy preparedness in case of a supply failure. For the sake of clarity, only the
21

most important plans and policy documents are mentioned in this chapter. One ofthe measures suggested in the 1976 plan was the country’s massive programme ofdistrict heating and combined heat and power production. This measure was putinto practice as of 1979. Under ideal circumstances,CHP can more than double theamount of useful energy extracted from each unit of primary energy.
Whereas Danish gas production began in 1984, extending available supplies,several follow-up documents had the objective of reducing primary energydemand. In the earlier documents, the main concern was security of supply aswell as limiting the outflow of national resources for energy imports. Over time,environmental considerations gained importance among Danish energy policygoals, and now have high priority3. The Danish Parliament adopted a fundamentaldecision against nuclear power in 1985.
The Energy 2000 (Energi 2000) plan of 1990 contained a national commitmentto reduce Danish CO2 emissions by 20% by 2005, compared to 1988 levels4. Thisis still one of Denmark’s main policy objectives in energy and environmentalpolicy. The plan contained ambitious programmes to expand the use ofrenewables, especially wind, to achieve sustainable development and reduceCO2 emissions. Denmark also has some long-term objectives, notably halvingCO2 emissions by 2030, and reducing SO2 and NOx emissions by 30% and 45%,respectively, compared to 1988. This target was confirmed and maintained in thefourth energy action plan, Energy 21 (Energi 21), approved by the Parliament inApril 1996. The plan sets a very ambitious target for renewable energy sources:the share of renewables is to rise from 8% of Danish energy consumption in 1996to 30% in 2025.
Under the 1997 Kyoto Protocol and the European Union’s internal burden-sharingagreement of 17 June 1988, Denmark is committed to reducing greenhouse gasemissions (six gases) by 21% in the first budget period 2008-2012, compared to the1990 adjusted baseline5. Denmark's Parliament approved ratification of the KyotoProtocol on 30 May 2001. However, Denmark's actual ratification of the Treaty willtake place along with that of other European Union member states at an unspecifiedlater date. To summarise, Denmark has two greenhouse gas targets:
22
3. For this reason, some overlap between this section and Chapters 4 and 5 is unavoidable.This chaptercontains a broad overview. Denmark’s targets for the abatement of greenhouse gas emissions arediscussed in detail in Chapter 4.Energy efficiency measures and support policies for renewables arediscussed in Chapter 5.
4. Corrected for net electricity exports.The CO2 data exclude Danish electricity generation for export.The largely fossil-fuelled Danish power industry acts as “hydro-firming” capacity for the largelyhydro-based Nordic market.When rainfall in the Nordic countries is low, Denmark exports its fossilelectricity. The government considers the emissions thus generated as caused by foreign, notDanish, demand and therefore excludes them from its national calculations.
5. 1990 was an exceptionally wet year, which reduced domestic (fossil) electricity generation andcaused large hydro-based imports from Sweden and Norway.For this reason,Denmark is pressing foradjustments in its baseline to normalised values.

■ The national commitment to reduce CO2 emissions by 20% by 2005, comparedto 1988.
■ The Kyoto commitment to reduce greenhouse gas emissions (six gases) by 21%in the first budget period 2008-2012, compared to 1990.
In June 1999, a forecast for energy consumption and carbon dioxide emissions until2012 was published in the report Follow-up on Energy 21:Status of Energy Planning.A 16.4% reduction in carbon dioxide emissions was forecast for the period 1988to 2005. On this basis, the national objective would not be fulfilled. As a result,a follow-up document to Energy 21 was issued in March 2000 under the nameClimate 2012 (Klima 2012). This document outlines the steps needed to meet thegovernment’s obligations. These steps include:
■ Submitting a new action plan for the transport sector. In May 1990,a first TransportSector Action Plan had already been adopted, advocating stabilisation of CO2
emissions from the transport sector by 2005 and a 25% reduction by 2030,compared to 1988 levels. In the light of the fast and persistent actual growth of thetransport sector,the government realised that the earlier objectives were unrealistic.
■ Updating the 1996 action plan Energy 21.
■ Establishing a programme for analysis, development and testing of the Kyotomechanisms.
■ Analysing and assessing greenhouse gas reduction potentials in the agriculturalsector.
■ Determining future regulation of industrial greenhouse gases.
The new action plan for reducing CO2 emissions in the transport sector wassubmitted by the government in April 2001. The action plan announces newobjectives and measures, including:
■ A 7% reduction in CO2 emissions from the transport sector by 2010 compared tothe reference scenario. Thus, CO2 emissions in 2010 would be 22% above their1988 level.
■ A 25 % reduction of CO2 emissions from the transport sector in 2030 comparedto 1988 levels.
To strengthen energy conservation efforts, a new Energy Savings Act (Act No. 450 of31 May 2000) was adopted in May 2000. This act is a framework law that lays downrules for the co-ordination and prioritisation of savings efforts in all sectors; concreteobjectives and measures are currently being elaborated.
As a result of the reinforced efforts, an emissions forecast published by the Danishgovernment in April 2001 appears to confirm that the national objective of reducing
23

CO2 emissions from Danish energy consumption by 20% by 2005 can be met.According to preliminary figures published by the government, CO2 emissions in2000 were 11% below their 1988 values.
The new forecast presents a less certain picture for the longer term. Denmarkwould fall short of its Kyoto Protocol commitment by 2% to 3% in the first budgetperiod 2008 to 2012 if all current policy measures were retained and all anticipatedpolicy measures were introduced. However, one of Denmark’s CO2 controlmeasures, the CO2 quota system for electricity generation, is currently underdiscussion. The CO2 quota system is a system of individual CO2 permits for powerplants that was introduced on 1 January 2001 to apply the government’s climatechange policies to the power industry in a market-compatible manner. The permitsare tradable in principle, although so far limited trading has taken place. The quotasystem will be in force provisionally until 2003. Should the quota system fade awaywithout replacement, electricity exports could soar after 2003 and national CO2
emissions would fall short of the Kyoto target by more than 19%.
Energy market liberalisation became an important policy objective in Denmark as of1996 under the European Union’s Electricity and Gas Directives. The transitiontowards competition began with a 1996 amendment to the former ElectricitySupply Act and the ensuing opening of the power market for consumers over100 GWh annual consumption on 1 April 2000. As of 1 January 2001, consumersof one GWh or more are free to choose their supplier, and as of 1 January 2003,competition will extend to all consumers. In December 1999, a new ElectricitySupply Act (Law no. 375 of 2 June 1999) came into force. This, together withseveral agreements between Denmark’s political parties, forms the basis forcompetition in the Danish power market.
Liberalisation of the gas market under the new Natural Gas Supply Act followed on1 July 2000 with the opening of the gas market for consumers of more than350 million cubic metres (mcm) of natural gas per year. This corresponded to 30%of the Danish gas market in 2000. The opening will be extended to 38% of themarket in 2003 and to 43% in 2008. Power plants and the largest of the small-scaleCHP plants and industrial enterprises will be among the eligible consumers, but notthe regional distribution companies. According to a reform follow-up agreementamong political parties concluded in March 2000, the gas infrastructure is to remainin public ownership. The new government announced in early 2002 that full retailcompetition was to be introduced to the Danish gas market in 2004 and that thestate-owned gas transmission company DONG was to be privatised at a time to bedetermined in the future.
Energy Policy InstitutionsUntil recently, Denmark was the only IEA country that combined energy andenvironmental affairs in the same ministry. The Ministry of Environment andEnergy had been created in autumn 1994 through the merger of two separate
24

ministries. It was responsible for the development and implementation of energyand environmental policy and research and development in these areas for Denmarkas a whole. With the change of government in 2001, that ministry was split into aministry responsible for industry and energy and a separate ministry for theenvironment. Regional and local authorities continue to have a large degree ofresponsibility for energy administration and co-operate closely.
Aside from the Minister’s Department, the ministry had three agencies in charge oflegislation, implementation and monitoring of policy: the Danish Energy Agency(Energistyrelsen,DEA), the Danish Environmental Protection Agency and the DanishForest and Nature Agency. In addition, it comprised three research agencies thatgather and process the information upon which Danish environmental policy isbased. Furthermore, the ministry co-operated with three independent appealsboards for energy tax policy, environmental policy and nature protection. Overall,the ministry employed 3 000 people, of which more than 1 000 work in the stateforests and 150 in the central office. Following the change of government, aboutone-quarter of the Danish Energy Agency’s staff were made redundant.
The Danish Energy Agency continues to be the key institution for development andimplementation of energy legislation and policy. The agency was founded in 1976to implement the objectives of Denmark’s first energy plan. It had 16 divisions asset out in Figure 9. These divisions mirrored its traditional areas of responsibility:
■ Overall planning of power, heat and natural gas through the Electricity SupplyAct, the Heat Supply Act and the Natural Gas Supply Act.
■ Surveillance of oil and gas exploration and production. The agency regulates theexploitation of the Danish subsoil under the Subsoil Act, prepares andimplements licensing rounds, and issues licences for exploration and productionof oil and gas. It implements legislation concerning offshore installations,pipelines, storage of natural gas, and the continental shelf.
■ Promoting technological development and utilisation of renewable energysources such as wind energy,solar heating,biomass and wave energy, through theDevelopment Programme for Renewable Energy.
■ Promoting energy efficiency through energy conservation campaigns, appliancelabelling and various subsidy schemes. This includes administration of a schemelaunched in 1997 to energy-label all buildings, to undertake systematic energyauditing and management of most public institutions, and to provide subsidies forconversion of electrical heating in areas where heat or natural gas networks areavailable. The subsidies are in many cases granted through the Electricity SavingFund, founded in 1997 to enhance the efficiency and reach of energy conservationefforts. The Danish Energy Agency sets the general conditions for this fund.
■ Negotiating voluntary agreements for investment in energy efficiency programmeswith energy-intensive industries, in return for rebates on the carbon tax. The agencycan also pay subsidies for specific projects in the framework of this programme.
25

26
SecretariatLaw of Seasand Faeroes
PublicRelations
Promotion of DanishEnergy Technology
and Know-how
Division 1Personnel and Service
Division 2Budget Economy
Information Technology
Division 5Energy Data, Statistics,
Transportation and EmergencyPreparedness
Division 6Electricity Supply
Division 9Energy Consumption and
Conservation, Chemical Industry,Trade and Services
Division 10Exploration and Production
Division 13Bilateral Co-operation
Division 14EU and International Energy
Division 3Energy Consumption
and Conservation, Privateand Public Buildings
Division 4Energy Consumptionand Conservation,Industry in General
Division 7Heat Supply,
Natural Gas Project and DONG
Division 8Renewable Energy
Division 11Oil and Gas Safety
Division 12Energy Planning
Division 15Research and Development
Division 16Energy Consumptionand Conservation,
Food Industry and Agriculture
ManagementDirector-General
Deputy Directors-General (2)
Figure 9Structure of the Danish Energy Agency
Source: Danish Energy Agency.
■ Administering the Energy Research Programme to fund research anddevelopment in a number of fields, including further recovery of oil and naturalgas, combustion and gasification of biomass, development of large-scale, low-noise wind turbines, and fuel cell and superconductor research.
■ Representing Denmark in international discussions on energy policy within theUN, the OECD, the IEA, the EU and the Nordic Council of Ministers. Theagency continues to participate in international negotiations on climatechange. It also seeks to promote exports of know-how and energy technologyby Danish companies on a commercial basis. By means of various supportand development assistance programmes, the agency contributes to thetransfer of technology to countries in Central and Eastern Europe and to thedeveloping countries.
The role of the Danish Environmental Protection Agency is to administerenvironmental legislation designed to protect air, water and soil as well as “goodliving conditions” for people, animals and nature. Its authority is based on theEnvironmental Protection Act, which lays down the fundamental objectives, themeans by which to meet these objectives and the administrative principles bywhich the agency works. The act is a framework, containing no concreterecommendations on quality requirements or threshold values. It is supplementedby guidelines and regulations issued by the Ministry of Environment and Energy andthe Danish Environmental Protection Agency.
Following introduction of competition into the electricity and gas industriesin 1998 and 1999, respectively, an Energy Regulatory Authority (Energitilsynet)was established as part of the Danish Competition Authority. The regulatorsupervises network tariffs and electricity, heat and natural gas prices for variousconsumer groups.
Energy Taxes and SubsidiesTaxation of energy products has a long history in Denmark, dating back to thefirst tax on petrol introduced in 1917. Taxation was extended to cover other oilproducts and electricity in 1977, and coal in 1982. Gas was also temporarilytaxed but at very low rates. As of 1980, taxation of a large and growing numberof products throughout the economy was motivated in part by environmentalconsiderations and a striving to save resources, especially energy. In 1986, oilproduct taxes were raised substantially to compensate for the fall in oil prices.
In 1991, energy taxes were reformed into an energy and carbon tax, designed toreflect the country’s environmental concerns. A large share of the tax revenueswas used for energy conservation and efficiency measures. This tax system cameinto effect in 1992 and has been expanded since then. The environmentalapproach towards taxation received renewed impetus in 1994, when Denmarkembarked upon a “green” tax reform, shifting the tax burden away from incomeand towards resource use and environmentally harmful activities. This tax reform
27

was put into practice between 1994 and 1998. As a result, a number ofenvironmental taxes were introduced, e.g. on water, waste water, the useof plastic and paper bags, etc. Energy taxes were raised progressively, particularlyon coal and electricity consumption, leading to an average increase in taxationon heating and power of 30% from 1994 to 1998. The main consequence ofthis reform was that households paid lower income taxes and higherenvironmental taxes.
The “green” tax reform of 1991 had left the tax burden on businesses and industryunchanged. This was to change through another reform of the tax systemundertaken between 1996 and 2000, based on the policy document Green TaxPackage 1995. The goal was to increase energy conservation in businesses andindustry. The main features were higher carbon dioxide taxation, introduction ofa substantial tax on natural gas, differentiation of the energy and carbon taxesaccording to energy use, and phase-in of a sulphur tax. The tax structure hasremained unchanged since, but the tax rates have increased. These taxes aredescribed in more detail below.
In line with the principles of “green” tax reform, the government transfers alarge part of the additional tax revenues from the Green Tax Package 1995 backto companies through reduced taxation on labour, special subsidies for smallcompanies, and subsidies for energy efficiency measures. The EuropeanCommission approved these subsidies in 1995. The largest part of the revenuere-transfer occurs through reductions in employers’ labour marketcontributions. 1997 was the first year for such reductions; they amounted to0.11% of companies’ total contributions. By 2000, they had reached theirplateau level of 0.53% of those contributions or about DKK 2 billion. AnotherDKK 200 million were transferred back in 2000 through reduced employers’contributions to a supplementary labour market pension called ATP. Thiscorresponds to an annual reduction of DKK 159 per full-time employee. Smallbusinesses with limited payrolls received re-transfer in the form ofreimbursement of administrative costs of DKK 295 million in 2000, up fromDKK 180 million in 1996.
Finally, DKK 1.8 billion was set aside to be spent on energy efficiency subsidiesfor the period 1996 to 2000. Earlier tax reform in 1993 had already made itpossible for businesses to obtain subsidies for energy efficiency investment. Butunder the Green Tax Package 1995 the funding was extended significantly.Generally speaking, the subsidy can amount to up to 30% of the investment, butfor small- and medium-sized enterprises (SMEs) it can go up to 40%. SMEs aredefined as having no more than 250 employees and a turnover up to €40 millionor a balance sheet of up to €27 million.
Eligible investment projects must lead to increased energy efficiency, or reducedCO2 or SO2 emissions, or must be of developmental character. The DanishEnergy Agency has established a list of 40 standard solutions for energy efficiencyimprovements and determines which projects qualify as developmental projects.The latter can receive subsidies of up to 100% in certain exceptional cases.
28

Companies can also suggest individual solutions. They are eligible for support iftheir payback time ranges between two and nine years, and if they save morethan 0.15 kg of CO2 per Danish crown invested. To discourage free-riding, highlyprofitable investment projects are excluded from support.
Between 1996 and 1999, the annual spending from the subsidy budget rosefrom DKK 366 million to 575 million. It is estimated that the entire budgetwill be spent as anticipated. The total number of applications for supportrose from 2 800 in 1996 to 7 000 in 2000. Standard solutions dominated with4 000 applications, followed by individual projects (2 500) and developmentaland other projects (500).
In an evaluation carried out in 20006, the government estimated that the totaladditional tax revenue from the Green Tax Package 1995 will amount toDKK 3.495 billion in 2000. The amount transferred back in the same year wasestimated to total DKK 3.830 billion. This sum takes into account that old CO2
taxes from before 1996 were abolished, reducing the overall tax burden byDKK 1.060 billion. Following this calculation, the Green Tax Package 1995 resultsin a net decrease of the overall tax burden by DKK 335 million. It was estimatedthat the CO2 emissions from Danish industry in 2005 will be reduced by 4 milliontonnes below their 1988 values, largely thanks to the effects of the tax package.
Following a parliamentary decision in 1998, energy taxes were to continue risingafter the end of the phase-in period of the Green Tax Package 1995. The so-called“Whitsun” package for the period 1998 to 2002 foresees further rises as specifiedin Tables 1 to 3. Households’ energy taxes on stationary fuel use, for example, roseby 15% to 25% between 1998 and 2000, as did petrol taxation.
CO2 TaxThe standard carbon tax rate in force since 1996 amounts to DKK 100 per tonneof CO2. As the net carbon emissions from fuel combustion differ, the standardtax rate varies between DKK 9.6 per GJ (DKK 402 per tonne of oil equivalent,toe) for coal, DKK 7.9 per GJ (DKK 331 per toe) for fuel oil, DKK 5.6 perGJ (DKK 235 per toe) for natural gas and 0 for combustible renewables.The rate for electricity was set at DKK 27.8 per GJ (DKK 1 164 per toe or 10 øreper kWh).
The CO2 tax applies to almost all energy users, including industry. Fuels for electricitygeneration are exempt, but domestic electricity consumption is taxed. For industry,the CO2 tax is differentiated according to two principles: the process the energy isused for and whether or not the company has entered into a voluntary agreement toapply energy efficiency measures. Table 1 details the rates of the carbon tax between
29
6. Danish Energy Agency:Green Taxes for Trade and Industry – Description and Evaluation,Copenhagen,June 2000.

1996 and 2002. The proposal for higher tax rates in 2002 was made by the previousgovernment;the new government has stated that it will not put this raise into practice.Companies first pay carbon taxes at the basic rate but can obtain reimbursementdown to the rate given in Table 1 if they meet the required criteria. In Danishterminology this is also sometimes referred to as a tax subsidy.
The differentiation between “heavy” and “light” industrial processes was introducedto protect energy-intensive companies that need to maintain national or internationalcompetitiveness. A production unit of a company is defined as a “heavy” industrialprocess if its tax burden would amount to more than 3% of its value-added or morethan 1% of its sales value applying the “light process”tax rate. Danish tax law defines35 specific processes as energy-intensive,covering one-third of industrial energy use.The category of “light” industrial processes includes fixed lights, office machines,refrigeration and air-conditioning.
Since Denmark’s industrial structure is based mainly on light industry and services,companies producing 90% of gross added value are responsible for half of thecountry’s CO2 emissions. The other half stems from energy-intensive firmsproducing about 10% of gross added value.
All industrial companies can conclude voluntary agreements. Since the agreementscover individual production processes, a single company can conclude severalagreements, both “heavy” and “light”. Collective agreements, for example with anindustrial association, where standards are set for all the enterprises in the group,are also possible.
In order to conclude an agreement, companies must submit an energy auditprepared by an independent certified consultant. On the basis of this audit, theymust develop an action plan containing a commitment to invest in energy-efficient equipment and to implement energy management. Energy-efficientinvestments with payback times up to four years must be accepted ifrecommended by the audit. The company can dispute the audit or proposealternative measures to achieve equivalent CO2 results. Following this, thecompanies sign three-year agreements with the government and are guaranteeda partial reimbursement of carbon taxes, provided the obligations in the actionplan are fulfilled. The companies must submit regular reports to the DanishEnergy Agency. If the reports are found to be lacking, the Agency can cancel theagreement and require that the company pay back the tax subsidy.
At end 1998, 101 individual voluntary agreements were active. The average paybackperiod for recommended energy investments was about two years. In early 1999,three group agreements had been signed, covering 129 companies, most of themgreenhouse growers. This brought the total number of companies with voluntaryagreements to 230. The agreements signed in early 1999 covered a combined energydemand of some 1.12 million tonnes of oil equivalent or 6% of Denmark’s TPES in 1999.In 1998, companies with voluntary agreements were able to reduce their combinedenergy and carbon tax burden by DKK 70 million. The Danish government estimatesthat the number of firms with agreements reached 370 in 2000.
30

As shown in Table 1, the differential between the tax rate with and withoutvoluntary agreement grew very significantly between 1996 and 2000, from DKK 2to DKK 22 per tonne of CO2 in the case of “heavy” processes. This has contributedgreatly to the increasing success of these agreements. Large companies concludedagreements early on,whereas smaller companies began doing so only more recently.Most of the agreements are for “heavy”processes. In 1998, there were only 30 agree-ments for “light” processes. Of these, 27 were with companies that also had a“heavy” process agreement in place.
Energy TaxesAll energy taxes under the Green Tax Package 1995 were phased in by 2002. Thesole exception, the new tax on natural gas,was to be phased in more gradually, risingslowly until 2009. The high oil prices and the resulting increased profitability of thenatural gas companies led the government to review its decision and to raise naturalgas taxation to the full plateau level already in 2002. From 1 January 2001 theenergy tax rate on natural gas corresponded to the tax level on oil products (basedon the energy content).
The energy tax is differentiated even more than the CO2 tax, different tax ratesapplying both for different energy products and for different uses of the sameproduct. For the sake of clarity, Table 2 details a selection of energy tax rates forthe period 1998 to 2009. Fuels for electricity generation are exempt from the tax,as it applies as an output tax on electricity.
31
Table 1Effective Carbon Tax Rates, 1996 to 2002
DKK per tonne of CO2
1996 1997 1998 1999 2000 Proposal (2002)
Basic rate
Industrial space heating 100 100 100 100 100 135.70
“Light” industrial processes
Basic rate 50 60 70 80 90 135.70
With voluntary agreement 50 50 50 58 68 105.30
Resulting tax subsidy 0 10 20 22 22 29.70
“Heavy” industrial processes
Basic rate 5 10 15 20 25 33.75
With voluntary agreement 3 3 3 3 3 4.05
Resulting tax subsidy 2 7 12 17 22 29.70
Source: Ministry of Taxation.

32
Table 2Energy Tax Rates, 1998 to 2002
Unit 1998 1999 2000 2001 2002 to
2009
Coal DKK/toe 1 717 1 884 1 968 2 051 2 135
Natural gas DKK/toe 1 549 1 549 1 675 2 052 2 136
DKK/m3 1.47 1.47 1.58 1.94 2.02
Oil products:
Automotive diesel DKK/toe 2 429 2 429 2 429 2 429 2 429
Fuel oil 1 968 1 968 2 010 2 051 2 093
Electricity:
For heating Øre/kWh 40 42 47 49 50
Other 46 48 54 55 57
Waste:
For CHP 838 1 131 1 131 1 131 1 131
For district heating DKK/toe 1 047 1 298 1 298 1 298 1 298
Heat from waste 0 209 335 419 544
Other combustible renewables DKK/toe 0 0 0 0 0
Source: Ministry of Taxation.
Sulphur TaxThe third major element of the Green Tax Package 1995 is the sulphurtax. Denmark is committed to sulphur emissions limits under severalinternational agreements concluded in the framework of the United NationsEconomic Commission for Europe (UNECE), and under the EU directive onlarge combustion plants. For several years now, Denmark has overcomplied with the agreements.
However, to encourage further shift from sulphur-rich to sulphur-poor fuels incombustion processes, e.g. from high-sulphur to low-sulphur coal or to natural gas,the sulphur tax of DKK 10 per kg SO2 was phased in over the period 1996 to 2000.The tax is differentiated only according to the sulphur content of fuels, not energyuses. Fuels used for electricity generation were exempt from the tax until the endof 1999,but the tax rate for electricity was calculated according to individual powerplants’sulphur quotas. As a special concession, the 1996 rate will apply to coal usedin certain highly energy-consuming boilers and furnaces for a maximum transitionperiod of 20 years.

CRITIQUEProtection of the environment is very important to Danish voters and in the policiesof their governments. The environment has never been the only important energypolicy issue in Denmark, but throughout the 1990s environmental considerationsaffected most aspects of energy policy and came close to being an overridingobjective. For this reason, the discussion in the preceding section has focused onDenmark’s various environmentally-inspired objectives. The following chapterswill discuss similar issues in greater depth, as they permeate the entire range ofenergy policies. This discussion necessarily focuses on the priorities and policies ofthe previous government. The new government has announced that it will focusmore on cost efficiency, market solutions and lower energy prices for industry.
If the energy policies of the last ten or fifteen years are measured against theirobjectives,Danish energy policy has been very successful. The country has built upthe world’s largest CHP district heating system,has the highest share of wind powerconnected to the power grid of any nation and will come very close to meeting itsmultiple CO2 and greenhouse gas emissions commitments, provided the CO2 quotasystem remains in place.
For the sake of this high degree of environmental protection and energy conservation,the Danish electorate has accepted major restrictions on their freedom of choicecompared to other wealthy democratic countries, such as the national heat plan thatprescribes for certain parts of the country which heating energy citizens have to use.These restrictions are self-imposed through a democratic process,and the governmentis therefore fully justified in pursuing this path as long as the electorate accepts it.This does not necessarily mean that there is unanimous acceptance of theserestrictions throughout the country. However, for decades it has meant that thosewho may have found the burden of such measures excessive were a minority.
33
Table 3Sulphur Taxes, 1996 to 2000 and After
SO2 % Unit 1996 1997 1998 1999 2000+
Fuel oil 0.5 DKK/tonne 20 40 60 80 100
Fuel oil 1.0 DKK/tonne 120 140 160 180 200
Gas oil 0.1 DKK/tonne 8 8 8 8 17
Coal 0.6 DKK/tonne 58 70 83 95 108
Electricity – Øre/kWh 0.9 0.9 0.9 1.3 0
Straw* > 0.05 DKK/tonne 0 0 4 12 20
* For boilers with a capacity over 1 000 kW. The rates are for 100% dry straw.
Source: Danish Energy Agency.

It is important to note that the environment is not the only policy objective thatranks high in the views of Danish voters. Security of supply also plays a very strongrole and was in fact the main motivation for the far-reaching policies that were putin place after the two oil crises. The aim of these policies was to save as muchprimary energy as possible. They were very effective but came at high cost, botheconomic and in terms of freedom of choice. Although environmental motivationscertainly already played a role, it was the perception of tremendous importdependence and vulnerability to shocks from the outside that made Danes acceptthis cost.
The fact that Denmark has now become self-sufficient in energy supply has helpedreduce this vulnerability. Once developed, the Danish oil and gas reserves providedgreater security of supply for Denmark, but they are much too small to have anyeffect on regional security of supply comparable to, say, the Dutch Groningen field.
Once the security of supply threat subsided, the notion that permanent and stronggovernment intervention to alter market results was acceptable,necessary and evenbeneficial had already taken strong root in Denmark. From there, it was a small, andlogical, step to address the environmental threat that then emerged with a similarset of policy tools. Support for energy conservation and substitution of renewablesfor fossil energies were seen as effective responses to environmental challenges. Itis also important to understand that the outgoing Danish government consideredclimate change as the single most important challenge of the twenty-first century.For those with this view, it is simply a matter of consistency that this issue shouldenjoy priority over most other policy considerations.
Moreover, Danish energy and environmental policy has long attempted to serveas an example to other countries. To do this, Denmark initiated domesticenvironmental measures even if they were comparatively costly. The samemeasures might have had the same impact at lesser cost if carried out elsewhere.An example is a programme that provided significant support for solar energy in thepast. Solar energy is clearly less competitive in Denmark than it is in SouthernEurope. In a European market for renewables, such as is envisaged by the EuropeanUnion, investment would move to the most competitive resource. But the Danishpeople have the political will to carry out such programmes, and have long fearedthat political will may be lacking in other countries. A majority of Danes appearconvinced that their economy is robust enough to bear the extra costs. Therefore,Denmark has decided to go as far as possible in implementing such programmes, ifonly to demonstrate that they are feasible.
Whether the Danish experience of the last one or two decades really is applicableelsewhere is questionable, however. Few other countries have electorates thatwould accept similar government intervention in private decisions, unlessenvironmental damage becomes much more visible. Danish support policies havehowever been successful enough to act as a positive example for like-mindedcountries. The support from the Danish government has spurred development inwind turbine technology that has led to very significant reductions in the cost ofwind power generation. But the costs of conventional power generation technology
34

have also come down thanks to the introduction of competition, as well astechnological advances such as the aero-derivative gas turbine. Despite theimpressive cost reductions achieved,wind turbines still require substantial subsidies.
Serving as an effective example to a wider audience might require further efforts.These would have to focus on demonstrating that a high degree of environmentalprotection is possible at moderate extra cost7 and in a fully market-basedenvironment. Otherwise,appreciation of Denmark’s experience could be restrictedto a limited group of countries with similar characteristics.
Denmark should focus its attention on achieving greenhouse gas abatement atminimal cost by investing where the marginal cost of emissions abatement islowest, including abroad. The Danish government is conscious of this and isseeking international co-operation. It co-operates with and supports the BalticStates on environmental issues. This action could and should be expanded infuture. In the absence of an operational international framework for such co-operation, Denmark continues to rely heavily on its domestically-oriented efforts.Denmark should continue pressing for rapid establishment of clear internationalrules for the flexibility instruments under the Kyoto Protocol. Both Denmark andthe international community could benefit if Denmark focused more of its attentionon international greenhouse abatement efforts.
Over time, the government has also adjusted its environmental policy to rely moreon market-compatible instruments. The most important example is the “green” taxreform. This is a welcome move. Shifting away from income and corporate taxes,and towards taxes on energy and resource use and polluting activities is in principlemore economically efficient than regulation. The government has also madeattempts to increase the cost-effectiveness of support measures. But in Denmark,asin like-minded countries, the largest energy users, energy-intensive industries, mustbe exempted or partially exempted from energy and carbon taxation to protecttheir international competitiveness, in the absence of an internationalenvironmental framework. This provides another reason why Denmark shouldwork towards an international solution.
Denmark was not among the front runners of energy market liberalisation, and theimpetus for market opening clearly had to come from the European Union. Butonce power market opening had been decided upon, Denmark implemented thereforms without major delays. The country will go beyond the current EU minimaof market opening in the electricity market with full retail opening in 2003. Theintroduction of competition into the gas market is proceeding at a noticeably slowerpace in order not to destabilise the current compromise between market andenvironmental policy. The previous government made it clear that in its view theenvironment and energy security would remain priority objectives. The new
35
7. In principle, the cost of avoiding environmental damage should not exceed the cost of the damage,or externality. Whereas this principle is widely accepted, the uncertainty surrounding the size ofexternalities is such that this principle alone does not allow generally accepted optimal protectionlevels to be established.

government appears to attribute greater importance to free markets. Some of thepast national achievements are incompatible with the more competitive marketplace. Chapter 7 discusses the difficulties that the high share of intermittent windcapacity creates for Jutland’s power grid, and the problems of integrating thesefactors into market prices. Nevertheless, the previous Danish government insistedthat existing national programmes have to be maintained as long as there is nointernational or at least European framework for similar policies.
But if past achievements are to be maintained, more work lies ahead. Once thepower market is fully open in 2003, the current system of CO2 quotas will need tobe renewed, and new quotas set. The current uncertainty about the future of theCO2 quota system and the introduction of a green certificates system has alreadydampened investment. Therefore, the government should develop the frameworkfor its future interventions as quickly as possible.
In the longer run, all existing and future policies and programmes should bereviewed with respect to their market-compatibility and cost-effectiveness. Thesystem of energy taxes and subsidies, for example, is complex. The complexityarises because the government has tried to adapt the systems to a multitude ofcriteria, notably environmental effectiveness, social and political acceptability,international competitiveness of companies,and revenue neutrality. Simplicity doesnot seem to rank high among these criteria. It has also been standard procedure toraise tax rates every time the government’s emissions projections show thatemissions might overshoot the corresponding target, which adds to the complexity.In the medium term, following a period of stability, the energy tax system wouldbenefit from an overhaul to reduce its complexity and administrative burden.
RECOMMENDATIONS
The Government of Denmark should:
■■ Review the existing policy measures with a view to developing more cost-effective policies. Government interventions should be analysed on acontinuing basis for cost-effectiveness and should be prioritised accordingly.Market-oriented approaches should receive priority.
■■ Ensure that both domestic and international policies are adequately assessed inorder to meet environmental objectives cost-effectively.
■■ Further review the tax and subsidy system with a view to reducing itscomplexity and administrative costs.
■■ Work to reconcile free market rules and environmental policies to send the rightinvestment signals to the market; in particular,develop as soon as possible a market-based successor mechanism to the CO2 quota system for the period after 2003.
36

4
ENERGY AND THE ENVIRONMENT
CLIMATE CHANGE
BackgroundDanish energy policies are based on a principle of sustainable development:balancing the economy, environment and security of supply. Energy andenvironment are strongly linked in Danish policy-making and the reduction of CO2
emissions is a main objective. For this reason,a number of the chapters in this booktouch upon climate change policies in the energy sector. In particular, the chapterson electricity and renewable energy and efficiency, as well as the section on theenergy/CO2 taxation system in Chapter 3,describe important policies that Denmarkhas instituted in order to reduce greenhouse gas emissions, both on the supply sideand the demand side. This chapter should thus be read in conjunction withChapters 3, 5 and 7 in order to fully understand the breadth of Danish energy/climate change policy.
Denmark has taken the climate change challenge very seriously and has set a seriesof targets through significant policy initiatives and legislation. In 1988, the Danishgovernment presented its Plan of Action on Environment and Development as afollow-up to the recommendations set out in the report from the World Commissionon Environment and Development, the Brundtland Report, and in the UnitedNations’ Environmental Perspective to the Year 2000. This action plan set thetargets to be reached and the initiatives to be implemented in all sectors in order toobtain sustainable development.
The energy action plan, Energy 2000, followed in 1990 based on a politicalagreement of 20 March 1990. It introduced the goal of sustainable development inthe energy sector and formulated the national objective of a 20% reduction in CO2
emissions by 2005 compared to 1988. Energy 2000 focused on savings in energyconsumption, increased efficiency of the supply system, conversion to cleanersources of energy, and research and development. Action in these areas has beenfollowed up by political agreements and legislation.
The Energy 2000 – Follow-up of 1993 contained a review of trends and policiestogether with a number of other initiatives. The energy action plan, Energy 21,approved by the Danish Parliament in April 1996, deals with international marketconditions and long-term environmental issues as the overall challenges to the energysector. The major environmental challenge is to achieve convergence of emissions ofindustrialised countries at a globally sustainable level. The plan sets out the frameworkfor a number of initiatives focusing especially on reducing the requirements forresources and on the impact of the energy sector on the environment.
In March 2000, the government presented Climate 2012 – Status and Perspectivesfor Denmark’s Climate Policy,which offered a complete overview of Danish climate
37

policy and laid the required groundwork for Parliament to decide on Denmark'sratification of the Kyoto Protocol. To fulfil its national and international obligations,the government would:
■ Update the 1996 energy action plan, Energy 21.
■ Submit an action plan for the transport sector.
■ Establish a programme for analysis, development and testing of the Kyotomechanisms.
■ Determine future regulation of industrial greenhouse gases.
■ Submit analysis and assessments of greenhouse gas reduction potentials in theagricultural sector.
On 29 May 2001, a new political agreement was reached on natural gas and energysavings. In this agreement special attention is paid to energy savings in the publicsector and product taxes. The purpose of product taxes is to influence the marketin order to increase the market share of the most energy-efficient products.
On 30 May 2001, Denmark's Parliament gave the go-ahead by a sizeable majority forthe government to ratify the 1997 Kyoto Protocol on global warming. Denmark'sactual ratification of the Treaty will take place along with that of other EuropeanUnion member states, anticipated in advance of the World Summit on SustainableDevelopment to take place in Johannesburg in September 2002.
Climate Change CommitmentsIn summary, Denmark has made a commitment to fulfil four national andinternational greenhouse gas emission targets:
■ A national commitment to reduce its greenhouse gas emissions by 5% by 2000 ascompared to 1990 levels.
■ A national target to reduce total Danish CO2 emissions by 20% by 2005 from1988 levels.
■ A commitment to reduce its greenhouse gas8 emissions by 21% from 1990 levelsover the period 2008-2012. This is the Danish contribution to helping achieve
38
8. The Kyoto commitment entails a combined reduction of six greenhouse gases:carbon dioxide (CO2);methane (CH4);nitrous oxide (N2O);hydrofluorocarbons (HFCs);perfluorocarbons (PFCs);and sulfurhexafluoride (SF6), which are converted to CO2 equivalent on the basis of their contributions to thegreenhouse effect, i.e. global warming potentials. The base year for CO2, CH4 and N2O is 1990, and1995 for HFCs, PFCs, and SF6.

the European Union’s international commitment to an overall reduction ofgreenhouse gases by 8% under the Kyoto Protocol adopted in December 1997.The political agreement on the internal redistribution of the total commitment iscommonly referred to as the EU Burden-Sharing Agreement.
■ Denmark has also set a longer-term target to halve its CO2 emissions before 2030,on the condition that international efforts in technological development anddesign of market conditions and mechanisms are further developed.
It is important to note that Denmark uses as its reference level for the 1990 baseyear 76.4 million tonnes of CO2 equivalent (thus its Kyoto commitment would entaila reduction of emissions to an average of 60.4 million tonnes of CO2 equivalent).This number has been adjusted to account for annual differences in electricity trade.The variations in year-to-year electricity trade are primarily due to changes inprecipitation in Norway and Sweden, which rely about 100% and 50% respectivelyon hydropower. Denmark is thus a net exporter of electricity in dry years and a netimporter in wet years. As 1990 was a wet year, Denmark imported more electricitythan in an average year. Consequently, its thermal electricity production was lower,leading to reduced CO2 emissions.
Denmark’s Kyoto commitment based on an adjusted 1990 base year represents areduction of 21% by 2008-2012. When compared to a non-adjusted 1990 base year,further reductions would have to be achieved at a level of approximately 5 milliontonnes of CO2 equivalent or about a further 7%.
Historical Greenhouse Gas Emissions Trends The total sectoral contributions of greenhouse gas emissions in 1997 were:46% from the energy sector; 18% from agriculture; 16% from the transport sector;12% from trade and industry; 6% from households; and less than 2% from waste.
CO2 is the most significant greenhouse gas, representing about 77% of total Danishemissions in 2000. The main source of CO2 emissions from Denmark is the use offossil fuels. The only other source of CO2 is from processing minerals in theproduction of cement, burned limestone and yellow bricks, and from the use oforganic solvents.
Carbon dioxide emissions by fuel and by sector, using IEA data, are illustrated inFigures 10 and 11. In 1999, 53.64 million tonnes of CO2 in Denmark originatedfrom fuel combustion. Of these emissions, 24.99 million tonnes are from thecombustion of oil, 18.40 million tonnes are from the combustion of coal, and10.25 million tonnes from the combustion of natural gas. There has been asignificant shift over the period 1990 to 1999. With the reduction of electricityproduced from coal generation, the contribution of coal to emissions has fallencommensurately by more than 22% over the period) and the contribution of naturalgas has risen (by close to 150%).
39

On a sectoral basis in 1999, electricity and heat production resulted in 46.3% oftotal energy sector emissions, transport contributed 23.4%, manufacturingindustries and construction contributed 9.5%, the residential sector 8.7%and other energy industries 4.1%. Here again there have been some interestingresults over the period from 1990. Both the residential and the manufacturingindustries/construction sector reduced emissions over the period (by 17.2%and 5.5% respectively). This reflects the reduced importance of direct fueluse, which has largely been replaced by electricity in homes and industry,increased energy efficiency and the shift in economic activity from heavyindustry to services. There has been a significant increase in emissions from thetransport sector and in particular from road transport, where emissions increasedby over 20% between 1990 and 1999 as a result of growing demand for mobility.This trend is consistent with other OECD countries (where overall transportemissions grew by 19%).
The 5.3% increase in Danish CO2 emissions from fuel combustion over theperiod 1990 to 1999 should be seen in light of a total increase of 12.4% in totalprimary energy supply (TPES) and a 22.1% increase in GDP. CO2 intensity ofGDP (kg CO2 per 1995 US$)9 thus showed a significant drop of 10.0% whileCO2 intensity of energy supply (kg CO2 per TJ) also fell over the period by4.6%. This partial decoupling of energy use from CO2 emissions and of GDPfrom CO2 can be attributed to a number of factors. Energy saving in end usesand economic growth that has taken place in “energy-light” activities havecontributed to the fall in energy intensity, which has contributed to the fallin CO2 emissions. During the 1990s, the expansion of CHP and the increaseduse of natural gas resulted in increased efficiency from the production ofelectricity and district heating. The increased use of natural gas and renewableenergy has also reduced the average CO2 content in primary energyconsumption in Denmark.
Overall CO2 emissions levels peaked in 1996, and have been falling consistentlysince then. This can be attributed to the significant policy measures undertaken bythe Danish government, and in particular to measures reducing the contribution ofcoal in electricity generation. On the other hand, CO2 per capita actually rose by3.5% owing to a relatively low population growth of 3.6% from 1990 to 1999.Denmark maintained a lower than OECD average CO2 per capita in 1999(10.01 tonnes of CO2 per capita versus 12.07 tonnes of CO2 per capita) but its CO2
per capita is significantly higher than its Nordic neighbours Sweden (5.44 tonnes ofCO2/capita) and Norway (8.32 tonnes of CO2/capita). This is due to Denmark’s stillsignificant share of coal in its generating mix whereas Sweden and Norway relyheavily on hydroelectric power.
40
9. Ratios are based on the Reference Approach.

41
Mill
ion
tonn
es o
f CO
2
Gas
Oil
Coal
0
10
20
30
40
50
60
70
80
1975 1980 1985 1990 1995
Figure 10CO2 Emissions by Fuel, 1973 to 1999
Source: CO2 Emissions from Fuel Combustion, IEA/OECD Paris, 2001.
Other
Residential
Manuf. Ind.& Construction
Transport
Other EnergyIndustries
Public Elec.& Heat
Mill
ion
tonn
es o
f CO
2
1975 1980 1985 1990 19950
10
20
30
40
50
60
70
80
Figure 11CO2 Emissions by Sector, 1973 to 1999
Source: CO2 Emissions from Fuel Combustion, IEA/OECD Paris, 2001.

Methane (CH4) emissions represent about 9% of Danish greenhouse gas emissions.The main part of methane emissions originates from animals in the agriculturalsector. The second largest emitter is landfills. The CH4 from energy combustion hasincreased since the introduction of decentralised power plants using gas engines,which do not combust all the natural gas. There are also some emissions from oiland gas extraction, gas networks leakage, refineries and coal storage. CH4 emissionsfrom all sources other than agriculture and landfills represented about 15% of thetotal methane emissions in 2000, the majority from energy-related activities.
Nitrous oxide (N2O) emissions represent 13% of greenhouse gas emissions. Themajor part of this originates from agricultural soils. Although there are someemissions from power plants and road transport (where emissions are forecast toincrease with the introduction of 3-way catalytic converters on gasoline cars), theagricultural sector is again the main source, representing about 91% of N2Oemissions in 2000.
The three industrial gases are: perfluorocarbons (PFCs), which are by-products ofaluminium smelting and uranium enrichment; sulphur hexafluoride (SF6), which islargely used in heavy industry to insulate high-voltage equipment and in themanufacturing of cable-cooling systems; and hydrofluorocarbons (HFCs), which arelargely used in refrigeration and semi-conductor manufacturing. The totalcontribution of these gases in Denmark is anticipated to be below 1 million tonnesof CO2 equivalent by 2010, remaining steady at about 1% of Danish greenhouse gasemissions over the period from 2000.
Future Greenhouse Gas Emissions Trends Preliminary figures for 2000 showed that overall CO2 emissions in Denmark havebeen reduced by 11% since 1988, and that the country is on track to meeting its2005 commitments for a 20% CO2 reduction with initiatives already launched10.
In Climate 2012 published in 2000, Denmark estimated that it will achieve areduction of 16.6% of CO2 (to 63.6 million tonnes of CO2) by 2008-2012 withexisting policies and measures. A further 3.2 million tonnes of CO2 would need tobe reduced to meet the Danish target of 21% (adjusted) for the period.
Based on updated and consolidated projections prepared in connection with theratification legislation for the Kyoto Protocol, total Danish emissions of greenhousegases are now projected to be reduced to 18.6% below 1990 levels during 2008-12(to 62.2 million tonnes of CO2). The projection is based on the adjusted 1990baseline, and on policies and measures already implemented and adopted.
42
10. This total is only for CO2 and is calculated somewhat differently from the formula used for the KyotoProtocol target which includes six greenhouse gases.The Danish national target also includes emissionsfrom international transport (aviation and marine bunkers are excluded from Kyoto numbers). Itexcludes emissions from cement, lime and yellow brick production and from flaring, and plastics inincinerated waste as well as removal by sinks: all these are included in the Kyoto calculations.

Denmark’s expected gap has thus been reduced since the estimate in Climate 2012,and now stands at 1.8 million tonnes of CO2 (adjusted). Along with initiativesalready enacted, this forecast incorporates proposals for an action plan to reduceammonia evaporation from agriculture. Among other assumptions, it presumes thatthe quota system for electricity generation will be continued after 2003,and that thebiomass action plan (for use of 1.4 million tonnes of biomass) and the plan forconstruction of 750 MW of new offshore wind turbines will be fulfilled by 2008.
43
Mt C
O2
Waste
Household
Industry
Agriculture
Transport
Energy Generation
0
20
40
60
80
1990 2008-2012
Figure 12Sectoral Greenhouse Gas Emissions Trends, 2008 to 2012
Source: Proposal for a Parliamentary Resolution on Ratification of the Kyoto Protocol to the UnitedNations Framework Convention on Climate Change. Submitted on 25 April 2001.
Table 4Emissions Trends for Individual Greenhouse Gases, 1990 to 2008-2012
Million tonnes of CO2 equivalent
1990/95 1990/95 % 2008-2012 2008-2012 % 1990 to
2008-2012 %
CO2 59.3 78 47.8 77 - 19
Methane 5.9 8 4.9 8 - 17
Nitrous oxide 11.0 14 8.6 14 - 22
Industrial gases 0.2 0.3 0.9 1 238
Total 76.4 100 62.2 100 - 18.6
Objective 64.4 - 21
Shortfall 1.8 2.4
Source: Proposal for a Parliamentary Resolution on Ratification of the Kyoto Protocol to the UnitedNations Framework Convention on Climate Change. Submitted on 25 April 2001.

Abatement Programmes and InstitutionsDenmark developed numerous sectoral plans in the 1990s to limit greenhouse gasemissions. Some of these were in the agriculture sector,which is not addressed in thisreport. Others,such as energy conservation measures for industry and households andrenewable energy development, are addressed in other chapters. The followingexamines some of the most recent initiatives proposed and implemented by Denmark:market mechanisms, including domestic emissions trading and the Kyoto mechanisms;international initiatives; and initiatives in the transport sector.
Market MechanismsThe Danish CO2 emissions trading system for the period 2000-2003 was adopted bythe Parliament in 1999 (Act on CO2 Quotas for Electricity Production). The launch ofthe programme was delayed one year to 1 January 2001, because of delays inapprovals required at the EU level. The EU concerns about the original proposal,which grandfathered the CO2 allowances, were accommodated by giving allowancesfree of charge to existing domestic and foreign producers and to new entrants to thesystem. Denmark will reserve quotas on a non-discriminatory basis for possible newproducers should such companies initiate production before the end of 2003.
The power companies receive a free permit that comprises a share of their historicemissions for the period 1994-1998. The overall cap for CO2 emissions was set at22 million tonnes in 2001, 21 million tonnes in 2002 and 20 million tonnes in 2003. Togive some perspective on the “tightness” of the cap, the 2003 level represents 76% of the 1994-1998 level of emissions. However, that was a period of higher than average emissions owing to increased electricity exports. The legal entities that receiveemission allowances are the large power producers – those with historical emissions over 100 000 tonnes of CO2 per year. Power producers with annual emissions below100 000 tonnes of CO2 are exempted from the system. The programme excludesproducers relying totally on renewable energy. Thus, of the approximately500 producers, only eight are in the scheme (representing over 90% of total emissions).The market is dominated by the country’s two main electricity producers,Energi E2 A/Sand Elsam A/S,which were allocated 18 754 000 tonnes of the 22 million tonnes for 2001.
The emission allowances are tradable, and trading will be done on a bilateral basisrather than setting up an independent trading market at this time under the assumptionthat there would be limited trading in the initial phases. Unused emission allowancescan be accumulated (banked) and used in following years although the act alsoestablishes a saving limit below the legally binding cap. This saving limit is set at20 million tonnes and only reductions below this level can be banked. As the act doesnot fix the quota after 2003, in principle the allowances saved cannot be used after2003 unless new rules are established. If the electricity producer exceeds the CO2
emission allowance, taking into account traded CO2 allowances and banked CO2, hemust pay a fixed penalty of DKK 40 (about $5 or €6) per tonne of excess CO2.
If the quota system is not continued after 2003, Denmark estimates that it willexceed its Kyoto commitment by 14.8 million tonnes of CO2. The act also leaves
44

open the possibility for Danish electricity producers to participate in futureinternational trading systems and for crediting of reductions achieved through JointImplementation and the Clean Development Mechanism.
International InitiativesIn addition to its efforts under the Baltic Sea Region Energy Co-operation initiative,Denmark continues to administer a number of support programmes for thedevelopment of energy sectors in Central and Eastern Europe. These programmesfocus strongly on achieving environmental improvements in the energy sector. Theareas of activity include cleaner fuels, effective energy production and supply, end-use energy savings, and institutional development and training.
The Ministry of Foreign Affairs (DANIDA) is responsible for Danish development aid,although special environmental aid is administered by the environment and energyministries. The energy element of this has been a focus in about nine developingcountries. Denmark’s environmental assistance focuses on countries in South-EastAsia and Southern Africa. Energy assistance is designed to contribute to thecountries’ fulfilment of international conventions, and in particular the climate anddesertification conventions.
Transport SectorDenmark established a target to stabilise emissions from the transport sector at the1988 level by 2005 in the 1990 Transport Action Plan for Environment andDevelopment. The target for 2030 was to reduce emissions by 25%. Based on a re-evaluation of targets, policies and measures (including a cost evaluation) and thefact that emissions from the sector continued to rise – they were about 14% higherin 1999 than in 1988 – Denmark proposed additional measures in a March 2000report entitled Limitation of CO2 Emissions from the Transport Sector –Possibilities, Policies and Measures. Without new initiatives, it was estimated thatCO2 emissions would be 27% higher in 2005 and 31% higher in 2010 than in 1988.Policies have not been successful in halting the upward trend in transportemissions, owing in part to higher than anticipated economic growth andcommensurate increases in transport needs.
On 1 January 2000, the registration fee (purchase tax) for cars was changed in orderto provide more incentive to purchase new, more energy-efficient vehicles. Theregistration tax for fuel-efficient gasoline cars consuming less than 4 litres/100 kmhas been reduced, as has the registration tax for diesel cars consuming lessthan 3.6 litres/100 km. The reduction in the registration tax varies from 1/6 to4/6 of the existing fee. In connection with this decision, the range of diesel carsqualifying for the annual “green owner fee” has also been expanded. On 1 January2000, another four categories qualified for the green owner fee, and the lowest taxcategory is now for diesel cars which consume less than 3.1 litres/100 km11.
45
11. The VW Lupo 1.2 litre diesel is an example of such a car.

In April 2001, the Danish government published a new action plan for reducing CO2 inthe transport sector, drawing on earlier recommendations. The targets were revisedsignificantly downward. CO2 emissions are now to be reduced by 7% in 2010 belowbusiness-as-usual trends (representing an actual increase in emissions of 22% over 1988levels or 19% over 1990 levels). The 2030 target remained as established earlier – 25%below actual 1988 levels. The two main strategies in the action plan are increasedenergy and transport efficiency. The first strategy is being implemented through:
■ A feasibility study on promotion of environment-friendly transport technologythrough adaptation of the tax system.
■ An information campaign about new cars’ energy efficiency to supplement theenergy labelling on new cars in place since April 2000.
■ Eco-driving and enforcement of speed limits.
The second strategy is to be implemented through information programmes,including promotion of public transport, bicycling and environment-friendly freighttransport, and other pilot projects.
The rise in energy consumption has been greatest for road traffic and aviation. Thegovernment estimates that the new measures in the action plan, when implemented,will allow the achievement of the 7% reduction from business-as-usual by 2010.Another new initiative also mentioned in the action plan is a proposal to develop anational road pricing scheme with the main objective of reducing motor traffic inmajor Danish cities. DKK 7 million will be allocated annually from 2001 to 2003 forthe promotion of road pricing projects to prepare the way for the political decision onthe pricing system. One element of these projects will be to investigate the effects ofroad pricing on carbon dioxide levels. It should be noted that the new liberal-conservative government has accepted the objectives in the action plan but is stillconsidering the proposed measures for implementation.
OTHER ENVIRONMENTAL ISSUESAt regional and local levels,emissions of sulphur dioxide (SO2) from the combustionof fossil fuels and nitrogen oxides (NOx) from power plants and transport alsocreate significant problems if not addressed adequately. Denmark has been highlysuccessful in reducing these emissions.
The UNECE SO2 target of an 80% reduction between 1980 and 2000 was adoptedby Denmark and the target was reached by 1998. Total SO2 emissions fromelectricity and district heating production decreased by about 60% between 1994and 1999 (from 95 600 tonnes to 37 800 tonnes) mainly owing to the introductionof more efficient desulphurisation plants and the conversion from coal and oil tofuels with a lower sulphur content such as natural gas and renewable energy. AnSO2 tax was introduced in 1996.
46

The UNECE NOx Protocol,which set a voluntary target of a 30% reduction by 1998,was almost fulfilled by Denmark, which reduced its emissions by 28% by 1998.Total NOx emissions from electricity and district heating production have fallensubstantially: about 38% between 1994 and 1999 (from 88 500 to 54 500 tonnes).This is primarily due to the introduction of low NOx burners or de-NOx plants inpower stations.
The policy instruments used by Denmark to achieve these reductions include theestablishment of quotas for power plants with a production capacity of more than25 MW. The size of the quotas is fixed so that Denmark as a whole can meet thenational quota under the UNECE Convention. Note that, as with CO2 emissions,Denmark adjusts its SO2 and NOx baselines to take into account electricity trade.The Danish government adopted goals to lower emissions of SO2 by about 30% andNOx by 45% by 2010 compared to 1989 levels.
The Danish government has also developed a national strategy for sustainabledevelopment. The strategy attaches high importance to the challenge of climatechange. It focuses on:
■ Breaking the correlation between economic growth and growth in resourceconsumption and environmental pressure (“decoupling”).
■ Investigating integration of the environment into sectoral policy-making,including energy.
■ Establishing sustainable development indicators.
■ Ensuring co-ordination between Danish and international sustainable developmentinitiatives.
The draft strategy had been opened to consultation with stakeholders until 1 May 2001and the final strategy was expected by end 2001.
GREENLAND AND THE FAEROE ISLANDSDenmark’s commitments under the Kyoto Protocol apply to the entire Kingdom ofDenmark. Neither Greenland nor the Faeroe Islands are members of the EU. TheFaeroe Islands Home Rule government has announced that it does not accede tohaving the Kyoto Protocol enter into force in its jurisdiction. Consequently,Denmark’s ratification will include a geographic reservation regarding the FaeroeIslands. Greenland’s Parliament has not yet adopted a position on the issue,but wasexpected to in the autumn of 2001. Greenland’s emissions of CO2 correspond toabout 1% of Danish emissions. If Greenland wishes to accede to the ratification,Denmark will be committed to an 8% reduction in greenhouse gases in Greenlandfrom 1990 levels over the Kyoto commitment period. If Greenland does notaccede, a reservation similar to that of the Faeroe Islands will be required.
47

CRITIQUEDenmark now projects meeting its domestic CO2 target in 2005 with measuresalready in place. For the first time, the target appears clearly achievable. Inaddition, the government believes the basis exists for meeting Denmark’s Kyototarget within the framework of policies implemented and under consideration. Theexisting gap is forecast to be only 2-3% (adjusted) by 2008-2012. The monitoring ofresults achieved and the country’s past willingness to introduce new measuresreinforce the likelihood of this positive outcome. Nevertheless, a number ofimportant issues remain to be resolved.
The 1990 baseline adjustment for CO2 emissions remains an issue because ofincompatibility with the international norms established to inventory emissions. Itis Denmark’s prerogative to calculate its emissions inventory in this manner fordomestic purposes, but this adjustment is problematic in an internationalframework. The Danish Parliament has agreed to a 21% reduction of greenhousegases under the EU burden-sharing agreement conditional upon using the 1990adjusted baseline, which is a premise not yet accepted by the EU. Given Denmark’sApril 2001 parliamentary resolution, it cannot legally ratify the Protocol unless it isallowed the adjusted 21% reduction (the real unadjusted reduction is closer to 28%from actual 1990 emissions levels). The EU as a whole cannot ratify the KyotoProtocol without ratification by all of its members. Hence, some politicalcompromise must be attained between Denmark and the other EU member statesfor ratification to occur.
Transportation emissions continue to grow, and meeting emissions targets in thissector remains difficult despite the fact that the government’s transportationsector target was adjusted significantly downward in 2001 from a goal ofstabilising emissions at 1988 levels by 2005 (an absolute reduction) to a 7%reduction from business-as-usual (an actual increase of 19% over 1990 levels) by2008-2012. Apart from taxation, policies in place in this sector appear to bemainly voluntary agreements and information campaigns. The reductionsforecast will be hard to achieve using current measures. Denmark is studyingvarious tax policy options (review to be completed in about two years). Othershort-term measures which could bring significant reductions should beconsidered, e.g., encouraging inherently clean fuels such as compressed naturalgas (CNG) and liquefied petroleum gas (LPG), which have multiple environmentalbenefits, especially for bus and taxi fleets. Car registration fees are still very highalthough they have been adjusted. The main objective of the registration fee is toreduce the fleet and encourage more fuel-efficient vehicles. However, the feediscourages car owners from purchasing new vehicles and encourages them touse a car for many years. To accelerate fleet renewal, the registration fee shouldbe further adjusted. There is also a need for a long-term transport strategy, whichmay offer effective reduction opportunities from technology advancements, e.g. inhybrid-electric and hydrogen-powered vehicles.
The burden of CO2 emissions reductions falls more strongly on the electricity sectorthan in the previous IEA review, when measures in the transport sector were
48

expected to be more significant. Plans for greenhouse gas reductions in non-energysectors such as agriculture are still under development and the cost-effectiveness ofthese measures versus continued burdening of a single sector (energy andparticularly electricity) needs to be addressed more completely. The Danish EnergyAgency (DEA) is currently analysing and comparing costs of various mitigationinstruments, for all greenhouse gas emissions and in several sectors.
In fact, the cost-effectiveness of existing and planned measures has been difficult topinpoint. For example, in Climate 2012 it is noted that the costs of climate changeinitiatives in the energy area were evaluated as averaging DKK 100 to 800 per tonneof CO2 in 1999 (US$ 10 to 100 per tonne). The Kyoto ratification documents note that the average socio-economic cost to address the 1.8 million tonnes gap would be about DKK 300/tonne of CO2 equivalent, corresponding to aboutDKK 500 million per year. Preliminary estimates of analysis of future measuresrange from a low of DKK 82/tonne of CO2 equivalent for the electricity sector CO2
quota scheme to DKK 296/tonne for offshore wind and DKK 2 038/tonne for taxesimposed in the transport sector. It is not clear which figures are the most accurateor on what assumptions they were based. Consequently, the Danish government’sefforts to assess and report in a readily understandable format will make cost-benefitassessment and hence policy-making more transparent.
Given that many other IEA Member countries still have a long way to go towardsmeeting their own Kyoto objectives, the mitigation successes of the Danishgovernment are worth further analysis. It is also important for domestic policy-making to have a better grasp of the costs associated with historical policies, inorder to assess whether any modifications in approach should be made. Forexample, it is difficult to determine exact costs and benefits associated with theaggressive wind penetration policies (discussed further in Chapter 5). An overallconcern regarding the Danish policy approach is that environmental objectives areso central to energy policy that more economic solutions or impacts on fair tradeand other economic activities may not have been assessed as completely as theyshould have been. It is possible that a more balanced and economically effectiveapproach could be found to meet the fundamental policy objective of sustainabledevelopment.
The Danish government has stated that it is open to the use of the Kyotomechanisms – emissions trading, joint implementation (JI) and the cleandevelopment mechanism (CDM) as a supplement to domestic actions – if thesemechanisms result in real emissions reductions and once clearer internationalframeworks are established. Denmark was one of the first countries to implementa domestic emissions trading system by initiating the quota system for the electricitysector. But there are considerable uncertainties associated with the future of thisprogramme as rules for the post-2003 period have yet to be established. Thegovernment should consider reaffirming its future policies as soon as possible.Furthermore, as similar trading systems have not yet been established inneighbouring countries,Danish power companies are considering new investmentsabroad where electricity sector emission caps have not yet been established. Morestudy is needed on the implications of the quota system for future investment and
49

trade patterns. In addition, Denmark needs to continue to work closely with othergovernments in the region for a good understanding of evolving emissions tradingprogrammes in those countries and in the context of the potential EU trading scheme.
Denmark’s forecasts show that significant exports of electricity could take placeafter 2003 should the CO2 quota system for electricity production not be continued.Rather than facing a 2-3% gap in meeting its Kyoto objectives, Denmark wouldinstead face a shortfall of more than 19% in 2008-2012 (exceeding its target by 14.8million tonnes). Thus, the importance of the quota system for the overall Danishclimate change programme should not be underestimated. Denmark also needs toconsider whether some elements of the existing programme, such as the relativelylow penalty for non-compliance, will need to be adjusted after 2003.
Furthermore, the uncertainties associated with the postponement of the GreenCertificates programme (discussed in more detail in Chapter 5) compound thechallenges faced by the electricity industry in Denmark. It is important to co-ordinate goals and instruments in order to achieve the desired economic andmitigation results. It is commendable that after the initial decision,Denmark movedquickly to develop programmes to implement market instruments for the electricityindustry. However, implementation has often been postponed. This has beenparticularly troubling with respect to the renewable energy certificates programme,which will be an important complement to the cap and trade (quota) system.When combined with the “priority” purchasing system12 and continued renewableenergy subsidisation, the quota system cannot operate as effectively as it could in afully integrated market. This reduces the economic advantages that couldpotentially accrue from the domestic trading market.
Denmark has been slower to embrace and assess the cost-effective potential of JI(emissions reduction projects implemented jointly with those countries withquantitative emission targets under the Protocol) and CDM (emissions reductionprojects in countries without quantitative reduction targets), but is nowbeginning to take some proactive steps in this direction. The government isworking with regional governments on developing the Baltic region as a testingground for JI. This latter initiative arose within the inter-governmental Baltic SeaRegion Energy Co-operation (BASREC) forum. Energy ministers of the regionhave concluded that a regional approach may make an effective contribution toclimate change mitigation. The initiative will also contribute to enhancedunderstanding in the region regarding the Kyoto mechanisms, and developexperience on operational aspects through a trading simulation. A team ofconsultants has also been contracted to produce a “manual” for domestic JI andCDM project developers and suggestions for the necessary administrativeprocedures for these investments.
50
12. The priority system requires that renewables and CHP must be dispatched first, regardless of theirprice. In other words, when the wind blows and the wind turbines generate electricity, the networkutility has to purchase this electricity even if it has to take cheaper fossil-fired power plants off thegrid as a consequence.

Nevertheless, questions remain concerning Danish views regarding to what extent(and how) to use the Kyoto mechanisms in meeting Denmark’s Kyoto target. Theinitiation of a study on this topic is welcome. The market value of traded tonnes isby no means certain. However,many analyses have shown that there are significantopportunities for low-cost reductions through CDM and JI projects, as well asthrough international emissions trading. Denmark should consider using thesemarket mechanisms towards meeting any shortfalls as additional domestic measuresare likely to be more expensive. It will be necessary to move in a timely manner toimplement the consultants’ recommendations on administrative procedures for thisto occur. The use of these mechanisms would add another policy tool to the Danishportfolio. With current policies and measures focused so heavily on domesticinterventions such as taxation and regulation, there is a risk of consumer saturationand resistance. A glimpse of this consumer resistance to high fuel prices wasrevealed by demonstrations calling for gasoline price reductions when oil pricessurged in 2000.
The production of oil and gas accounts for 3% of Danish CO2 emissions. Accordingto Danish figures,overall flaring will decrease by 2010. However,evidence from theproduction side does not necessarily support this assumption,particularly if reserveadditions of small-field production continue. It will be important to continuemonitoring emissions from flaring to ensure that all means are taken to minimisethis activity.
RECOMMENDATIONS
The Government of Denmark should:
■■ Finish the assessment of the economic implications of basing climate changepolicy almost exclusively on domestic mitigation strategies. In particular,consider the advantages that the Kyoto mechanisms and the extension of thequota/trading system to other sectors may offer in closing the remainingemissions gap.
■■ Decide urgently the fate of the CO2 quota system for the electricity sectorbeyond 2003; determine the quota levels; reassess the low penalty for non-compliance; and determine whether international trading and credits can beincorporated.
■■ Make further adjustments to the car registration fee and pursue road pricing andother cost-effective policy instruments in the transport sector.
51


5
ENERGY EFFICIENCY AND RENEWABLES
ENERGY EFFICIENCY
BackgroundOne of the targets contained in Energy 21 was the improvement of energy intensity(defined as final energy consumption in the end-use sector per unit of GNP) by20% by 2005 in relation to 1994 figures. The June 1999 follow-up of Energy 21projected that energy intensity would improve by 25% in 2005 and by 34% by 2012,more than fulfilling the established targets.
On average, Denmark is examining ways to reduce final consumption by an averageof 0.5% per year. Sectoral targets were proposed in a September 2000 report of the DEA entitled Promotion of Energy Savings. The savings target of 2.1 milliontonnes of CO2 is 3.5% of the total Danish national objective to reduce CO2 emissionsby 20% by 2005 from 1988 levels.
Table 5Energy Efficiency Targets to 2005
Sector Energy Energy CO2 Energy Result
Consumption Conservation Reduction Conservation in 2005
in 1988 Target PJ 1000 tonnes Target % PJ
Households 188 8 940 - 4 176
Poblic service 26 2 330 - 8 24
Commercial sector 50 3 490 - 5 55
Industry 154 2 380 - 1 164
Total excluding transport 418 15 2 140 - 3 419
Source: Promotion of Energy Savings, DEA Copenhagen, September 2000.
In 1997, the Danish Electricity Saving Trust (Act on the Danish Energy Saving Trust,27 December 1996) was established with the primary goal of supporting thesubstitution of electrical heating by district heating or heating by natural gas inhouseholds and the public sector. The trust is managed by an independent boardthat comprises representatives of consumer interest groups and utilities, as well asexperts in energy savings and economics. The fund has been financed since 1998by a fixed amount of DKK 0.006 per kWh sold, levied on the electricity
53

consumption of households and public institutions. Through instruments such assubsidies, procurement strategies, agreements and demonstration projects,the trust influences pricing of energy-efficient appliances. For example, “BuyA-products” is a campaign for energy-efficient lights and electrical householdappliances and the establishment of buyers’ clubs to facilitate purchasing. It isexpected that trust activities will result in total savings of 600-700 GWh by 2005,or about 600 000 tonnes of CO2.
As the first step in strengthening energy-saving initiatives necessary to reach long-term energy and environment policy targets, the Danish government passed a newact in May 2000 concerning the promotion of energy conservation – The EnergySaving Act. The act provides the overall framework for co-ordination and prioritygiven to both centralised and decentralised savings initiatives for all sectors, actorsand measures. It enables the appointment of local energy conservation committeesto co-ordinate local efforts to save energy, and establishes new initiatives for energyconservation in the public sector. The act complements requirements for energysavings in the Electricity Supply Act, the Natural Gas Supply and Energy Savings Bill,and amendments to the Heat Supply Act.
The Natural Gas Supply and Energy Savings Agreement of 29 May 2001 sets out anaction programme for the promotion of energy savings until 2005. The centralelements include:
■ Establishment of energy savings targets in 2005 for individual sectors, includingthe public sector, private trade and service, households and manufacturing.
■ Introduction of product taxes that promote the sale of more energy-efficientproducts.
■ Translation of state energy-saving initiatives, including subsidy schemes, intoframework programmes for which tenders are invited.
■ Expansion of the activities of the Electricity Saving Trust to develop purchaseagreements and other schemes to promote energy-efficient electric appliances.
■ Strengthening efforts in the public sector, including green energy accounts andprocurement policies, and negotiation with municipalities to develop similarprogrammes.
■ Utilisation of the remaining funds from the Electricity Saving Fund for energysavings in the business sector.
■ Implementation of measures by natural gas and district heat producers topromote energy savings.
This political agreement also stipulates that other economic incentives for energysavings will be discussed with a view to adoption prior to the Energy Saving Reviewin September 2002.
54

The following sections highlight some of the major programmes established toincrease supply-side efficiency, for energy saving and increased end-user efficiency,and for demand-side fuel substitution. Transport sector initiatives are dealt withmore broadly in Chapter 4.
Residential/Commercial SectorInitiatives to reduce energy consumption include attempts to induce behaviouralchanges, increasing efficiency of appliances and buildings, and integrating energy-awareness into consumer decision-making.
Building CodesNew building codes entered into force for large buildings in 1996 and smallbuildings in 1998. These codes reduce net heating demand by 25%, to about70 kWh per square metre per year. The codes also set limits on electricityconsumption for ventilation and will require low-temperature heating systems inorder to increase the efficiency of various heat supply systems, such as districtheating systems, condensing boilers, solar energy and heat pumps. A furtherreduction of net heating demand to 45 kWh per square metre is planned for around2005. Buildings are already being built to this standard through the combination ofpassive solar techniques, insulation and coated glazing.
Energy Labelling for BuildingsA mandatory labelling scheme for small buildings (less than 1 500 m2) wasimplemented in January 1997 and refined in 1998 following an independent auditdescribing energy conditions and recommending possible energy-saving measuresin building shells and heating equipment. All residential and public buildings, andbuildings used for trade and private service, are to have a label prior to sale.Although the scheme is mandatory, only around 50% of buildings sold have a label.The largest group of labelled buildings is single family homes. From 40 000 to50 000 buildings are labelled every year.
The mandatory scheme for large buildings came into effect in 1997-1998. All buildingswith a surface of more than 1 500 m2, except industrial buildings and those with verylow energy consumption,must register their consumption of heat,electricity and waterevery month. Once a year, a consultant performs an audit which includes an EnergyLabel (rating energy consumption relative to comparable buildings) and an Energy Plan(recommending long-term and short-term saving measures).
The schemes for small and large buildings were independently evaluated in 2000-2001, with the conclusion that a large potential remains for profitable investmentsfor energy efficiency in existing buildings. Only 45% of labelled houses actuallyhad invested in heat-saving measures. The scheme for large buildings operates wellfor those who participate, but about half of the buildings did not fulfil the
55

requirements. Lack of awareness of the existence of the schemes contributed tonon-participation. The DEA has developed an action plan to improve theimplementation of both schemes as well as further measures.
SubsidiesPensioners with low incomes and relatively high bills for heating can obtainsubsidies of up to 50% of the investment costs (to a maximum US$ 3 600 perdwelling) for energy-saving measures. Since its institution in 1993, the yearlybudget for this scheme has been DKK 40-70 million, representing grants to about5 000 houses per year.
Conversion from electric to district heat or natural gas heating requires substantialinvestments in buildings for the installation of central heating systems. Subsidieshave been initiated to overcome this barrier to conversion. Houses constructedbefore 1950 that are situated in district heating areas are eligible for subsidiesfor installation of central heating and hot tap water. The purpose is to use excessheat at the central CHP plants efficiently. About 50% of qualifying houses hadbeen converted by 1997. Subsidies may be applied for until the end of 2002. Totalfunds for subsidies amount to DKK 1 300 million and the plan is expected to save100-150 thousand tonnes of CO2.
The Danish Electricity Saving Trust has also made agreements with more than200 district heating companies using CHP and biomass to convert electricallyheated dwellings to collective district heating systems. Local information activitiesare also eligible for DKK 50-60 million in subsidies annually. During the period to2007, 50 000 dwellings are expected to be converted (although the potential is90 000), resulting in reductions of 555 000 tonnes of CO2.
Since 1997, subsidies can be provided for the development of more effectiveproducts, their marketing and installation. The DEA determines the product, on thebasis of saving potential and a study of barriers for its implementation. The subsidyis typically limited to a few years. Energy-efficient windows, efficient gas and oilboilers, demonstration products in public buildings and environment-friendlyinsulation products have received support.
In 1998, Denmark introduced a specific programme to promote energy-efficientwindows in households and the public sector. The programme has supported thedevelopment and marketing of new and energy-efficient products, and resulted inan energy labelling system for windows. From 1998 to 2000, the DEA initiatedprojects amounting to DKK 25-30 million. The market share for energy-efficientwindows has increased to about 60%. The government anticipates that the annualenergy saving will reduce CO2 emissions by about 150 000 tonnes by 2005.
Subsidies for energy-efficient boilers fuelled by natural gas in private houses wereprovided from 1999 to 2001. A subsidy of DKK 2 500 was given to increase the marketshare of boilers with an annual efficiency of more than 95%. Figures indicate that themarket share of these boilers increased from below 10% to about 50%.
56

Subsidies to promote efficient oil-fired boilers through labelling and promotionstarted in 2000 and are expected to run to 2003. The goal is to increase the current10-15% market share for efficient boilers and encourage replacement of the oldestand least efficient boilers.
Other InitiativesThere are numerous additional programmes to improve energy efficiency forconsumers. Some of the more recently implemented include:
■ Mandatory annual inspections of 700 000 small oil burners, with chimney heatloss reduced as a result from 19% to 12-13%.
■ Efficiency standards for refrigerators/freezers effective in 1999, bringingefficiency improvements of 15% compared to 1992.
■ The “energy arrows” programme to inform consumers of the electricityconsumption of various appliances, and to facilitate comparisons betweencompeting products. The programme was developed by the utilities withgovernment support, as a complement to EU-wide labelling directives.
Public SectorTotal energy consumption in this sector has remained relatively constant since1996. However, consumption per m2 has decreased by about 10% for overall heatand electricity. Since 1992, energy management, annual reporting of energyconsumption, and efforts to undertake efficiency improvements have beenmandatory. Until eliminated in 1999, a grant scheme for financing energy-savingmeasures ($1.4 million/year) and a special tax of 10% on government institutions’energy expenses were in place. New agreements with public organisations areunder negotiation, with priority given to green accounts, energy management andbuying policies.
Industry, Trade and Services SectorsThe primary instrument for improving energy efficiency in the industry, trade andservices sectors has been the Green Tax Package, which entered into force inJanuary 1996. The package had three elements consisting of an energy tax, a CO2
tax and an SO2 tax,which are discussed in more detail in Chapter 3. The taxes werepart of a larger tax scheme where revenue is used to lower taxes on labour andincome. It is worth noting that enterprises with specific energy-intensive activitiesor with an energy tax exceeding 3% of value added can reduce their tax ratethrough a voluntary energy saving agreement. The enterprise must commit toimplementing the energy efficiency investments resulting from their independently
57

certified energy management. By 2001, more than 300 enterprises accounting forabout 60% of total energy consumption by industry (VAT-registered companies) hadconcluded an agreement with DEA. The Green Tax Package also contained anumber of reimbursement programmes for the industry, private trade and servicessectors. There are three main categories:
■ Investment grants for energy-saving measures in enterprises. The grants are forup to 30% of the initial outlay on projects with payback periods between twoand nine years.
■ Reductions in labour taxes and employers’ contributions to the AdditionalLabour Market Pension Fund.
■ Funds for small and medium-sized enterprises, which only benefit to a limitedextent from the reduced employers’ contribution.
From 1996 to 2000, subsidies for investments in energy efficiency amounted toDKK 1.8 billion. About 80% of the subsidies went to the energy-intensiveindustries. From 2000 onward, an additional DKK 175 million/year has beenallocated to the subsidy scheme, but the scheme is now open only to industry(excluding agriculture and the trade and services sector). It provides grants forthree areas: investments in energy savings or efficient equipment, use ofconsultants, and information about energy savings. In 2001 efforts in trade andservices will focus on a strategy to develop, market, purchase and use moreenergy-efficient products. The emphasis will be on lighting, cooling equipment,ventilation, office equipment and buildings. Each year an action plan isformulated and different categories of products are given priority. For industry,the main focus in 2001 was on energy management, energy-efficient design,development of energy-efficient technology, standardised solutions and projectsin selected industry subsectors.
The tax, subsidy and voluntary agreements package was evaluated in 2000. Theconclusion was that reductions of CO2 had met forecasts – in 1995 it was estimatedthat the package would reduce emissions by 3.9% versus an actual reduction of3.8%. Sulphur reductions were better than expected (34 000 tonnes versus32 000 tonnes anticipated). The evaluation resulted in the following assessments:
■ The green taxation system for agriculture, trade and industry is an appropriateinstrument for attaining the environmental objective, is economically effective,and takes international competitiveness into account.
■ The administrative costs related to the voluntary agreement scheme aretoo high.
The voluntary agreements were consequently adjusted in 1999 by replacing themandatory audits with a requirement to implement an independently certifiedenergy management system. The certifying body controls compliance with theagreement, thus reducing administrative costs.
58

International InitiativesUnder the BASREC initiative of Baltic energy ministers, a working group on energyefficiency (including CHP and district heating) was formed – the Baltic EnergyEfficiency Group (BEEG). The BEEG assesses energy efficiency options and potentialswith a focus on CHP and district heating, and includes assessment of technologies,financing and legislation. The BEEG in 2000 focused on new financial instruments,co-ordination and follow-up on activities taken by other international institutions andorganisations, and development of CHP. In its May 2001 report, the working groupconcluded that: the establishment of a financial clearinghouse was essential; thepotential for CHP is significant; and the creation of a common regulatory frameworkfor district heating in the region would support its development.
RENEWABLESIn order for Denmark to meet its climate change commitments, renewable energy –in particular wind energy – will play an important role. Renewable energyrepresented 10% of Danish energy consumption in 1999. The Danish goal is toincrease this to 12-14% by 2005 and to 35% by 2030. This will entail expandingrenewables’ share of total consumption by about 1% per year from 2005 onward.
The law promoting green energy consumption entered into force in 2000. Allrenewable electricity has priority access to the grid (“priority production”). Underthe new electricity legislation, the share of electricity generated from renewablesources is expected to rise to 20% by the end of 2003. In order to promote theuse of renewable energy, subsidies are available for installation of solar heating,biomass-fuelled burners and heat pumps.
Green Certificates ProgrammeA number of IEA countries, including Denmark, are planning to introduce a tradablerenewable energy certificate programme to support the development of alternativeenergy sources in more competitive electricity markets. In 1999, the DanishParliament agreed under the Electricity Reform Agreement to implement a nationalrenewable energy quota system for electricity generation using a green certificatesscheme. This reform would result in the termination of the existing fixed tariff schemefor electricity from renewable energy. That tariff averages DKK 0.60 per kWh.
Under the new system, feed-in prices would be used and a minimum fixed pricewould be guaranteed for renewable electricity. Green certificates would be issuedto producers of electricity and consumers would be required to buy 20% of theirelectricity from renewable energy suppliers by 2003. The renewable energyobligation would apply to all electricity consumers, but they could turn to theirelectricity suppliers to meet this obligation. System operating companies (Elkraftand Eltra) will thus redeem certificates at the regulator, testifying that they have metthe mandated percentage output from renewable energy sources. These sources
59

include wind power, and electricity generated from biomass and biogas. Largehydro and waste incineration plants are excluded because of the non-profitrequirements on companies owned by municipalities. Conditions for includingexisting biomass have yet to be determined.
Turbine owners signing contracts for new installations starting on 1 January 2000 untilthe start of the renewable energy certificate market (RECM) will receive a fixedminimum price (DKK 0.33) for approximately the first ten years after installation, andmarket prices afterwards. In addition to the fixed minimum price, they will receiveDKK 0.1/kWh (before the start of the RECM) or a green certificate with a dedicatedminimum price of DKK 0.1 and a maximum of DKK 0.27 (after the start of the RECM).At most, renewable energy generators would obtain the equivalent of the fixed priceapplied earlier (DKK 0.33 + DKK 0.27 = DKK 0.6 per kWh). If consumers do not fulfiltheir quotas, they will have to pay a tax of DKK 0.27 per kWh.
Not all renewable energy sources will be issued certificates at the outset. Wind plantsinstalled before 2000 will receive a fixed feed-in price and a subsidy depending on ageand full-load hours, and will access the certificate system after 2003 when they haveoperated for ten years. The transitional arrangements – which included the exemptionfor “existing”turbines, i.e. those which had planning permits and had been ordered by1999 – resulted in a significant surge in installed wind capacity in 1999. Plans currentlycall for the Danish green certificate market to come into effect by 2003. However,concerns have been raised by NGOs as well as the Danish wind energy industry aboutsome of the elements proposed under the existing terms of reference: the system isseen as too complex; other countries are adopting different systems that may not becompatible with the Danish system; the renewables market in Denmark is too small;and the introduction of green certificates for large offshore wind production willdistort the market. On the basis of these concerns,the new government is consideringa further postponement of the renewable energy certificates programme.
Wind PowerThe expansion of wind power is a central element in Danish energy policies.Government-supported wind power development dates back to the 1970s. At thattime,the primary support mechanism for wind power was adopted by the Parliament:power utilities had to buy wind power offered to them from privately-owned windturbines at a purchasing price roughly equivalent to 85% of the retail price ofelectricity. From about 1979 to 1989,the government also had a programme of capitalgrants for the installation of wind turbines. Since about the mid-1980s, thegovernment had the objective of raising the share of wind power in total powergeneration to 10%; this objective was met and exceeded in the year 2000.
The number of new onshore locations for wind turbines is limited as there arealready many onshore wind sites and the visual impact of wind turbines on thelandscape is becoming an issue. Wind turbines are also becoming larger and moredifficult to site. Capacity on land will thus increase by renovating existing windturbines as well as by decommissioning and replacing old smaller turbines by new
60

larger units, and not by any significant new developments. Denmark also has somesmall household wind turbines, producing electricity for heat and power. A largenumber of the wind turbines that were installed early are small and have outdatedtechnology. These are viewed as supplementary to the general development ofwind power. In order to encourage the installation of larger, more efficient windturbines, when the existing unit is scrapped, the owner of the turbine can purchaseshares in a new collectively-owned wind turbine producing three times theelectricity generated by the dismantled turbine.
The government’s target under the1996 Energy 21 programme is for wind to supply45% of electricity consumption by 2030. This requires 5 500 MW of capacity. Anintermediate target of installing 1 500 MW of onshore wind capacity by 2005was already met in 1999. Total capacity for 2001 has been estimated to be close to2 500 MW; of this, 50 MW is offshore in three small pilot projects.
The major part of wind power expansion will be offshore. The Danish governmenthas targeted 750 MW to be supplied by offshore wind farms by 2008. The 750 MWare expected to be installed in five large wind farms which together will produce8% of Denmark’s electricity consumption (8 800 TJ), and represent an annual savingof up to 2.1 million tonnes of CO2 or 3% of total CO2 emissions in Denmark. Theobjective is to investigate the technical, financial and environmental aspects ofoffshore wind energy. All five wind farms had planning permit as of August 2001.
The Danish power companies are in the final phase of planning for the first of thetwo large-scale farms which are the first step in this large-scale demonstrationproject. In 2000,the power company Elsam applied for final permission to establisha wind farm 14 km offshore at Horns Reef in the North Sea. Construction of thisfirst project of 160 MW is planned for in 2002. In eastern Denmark, the powercompany SEAS on behalf of Energi E2 has received final permission to establish afarm at Rødsand, 10 km from the coast of Lolland. The latter wind farm is expectedto consist of 64-96 turbines – in 8 rows of 8-12 turbines – with a combined total of150 MW. The farm will produce about 500 GWh annually, corresponding to theannual consumption of 110 000 homes. The annual environmental returns areestimated at 302 000 tonnes of CO2, 490 tonnes of SO2 and 440 tonnes of NOx, onthe assumption that wind power will replace coal-fired power generation. TheRødsand turbines are expected to be erected in summer 2003. Meanwhile, the newDanish government has annulled the obligation on power suppliers to construct theoffshore wind farms. As a consequence, the two least advanced offshore windprojects were cancelled.
The most recent cost estimates available for offshore wind power were included inthe document Action Plan for Offshore Wind Turbines (1997), in which costs forthe demonstration projects are estimated at DKK 0.35-0.38/kWh (based on 20-yeardepreciation and 5% interest per annum). While the competitiveness of offshorewind production is progressing, Denmark still provides considerable subsidies forthe production of electricity from wind power. An installation subsidy of 30%of total project costs was granted to wind turbines from 1979 to 1989, resulting ina total of 2 567 turbines receiving subsidies of DKK 275.72 million (at current
61

prices). Direct production subsidies have continued; all existing turbines are paidDKK 0.6 per kWh for a specified number of full-load hours.
To encourage replacement of the small, old wind turbines by large, modern turbines,windmills existing before 1 January 2003 are paid a subsidy of DKK 0.43 per kWh forat least a ten-year period. In addition, DKK 0.17/kWh is paid for a specific number offull-load hours. Consequently, existing windmills will not enter the green certificatesmarket until after they have operated for ten years. New wind turbines will beguaranteed a fixed settlement price of DKK 0.33 per kWh for the first 22 000 full-loadhours, corresponding to about ten years of production. When these hours have beenused up, the remaining electricity produced by the wind turbine is to be settled at“market price”, although a further premium of DKK 0.10 per kWh is added to themarket price. The premium will be replaced by green certificates for electricityproduction once the green market for renewable energy comes into effect.
The utilities are required by law to connect private wind turbines to the grid and toreceive and pay for wind-generated electricity. Figures provided by the DanishAssociation of Wind Turbine Manufacturers show that Denmark’s wind powerindustry posted a turnover of about DKK 13 billion (€1.5 million) for 2000, a 4%increase over 1999. Danish manufacturers and their international subsidiariesmaintained their 50% world market share (rising to about 65% when joint venturesare included). This raised the total output of Danish wind power technologyto 2 875 MW. Danish wind turbine production was down 5% from 1999 levels, at2 140 MW,although this is attributed to statistics-keeping changes. Germany remainsthe leading market for Danish wind turbine manufacturers. The Danish wind turbineindustry is regarded in the country as an important strategic exporting industry.
BiomassThe Danish government established a target for construction of combined heat andpower plants to be fired with domestic fuels like straw, wood, waste, biogas andnatural gas. The goal was to reach an installed capacity of 450 MW by 1995. Thefollowing are estimates of domestic biomass potential.
Table 6Domestic Biomass Potential
Biomass Fuel Approximate Biomass Potential (PJ/year)
Straw 42
Wood and wood chips 8
Waste from wood industry 8
Biogas 31
Municipal solid waste 30
Total 119
Source: DEA.
62
The Biomass Agreement of June 1993 implies that by the year 2000 electric utilitiesmust incorporate the use of 1.2 million tonnes of straw and 0.2 million tonnes ofwood (total about 20 000 TJ) annually. This was amended by the supplementaryagreement of 1 July 1997. Implementation of the agreement has been difficult andhas taken longer than planned.
The Biomass (political) Agreement of March 2000 (along with the Electricity ReformAgreement) provides the framework for future electricity supply from this fuel source.On the basis of this agreement, the target is to be reached by 2004 and two or threelarge biomass plants are to be established by the end of 2005. Over a ten-yearproduction period,a minimum price (settlement price) of DKK 0.33 per kWh is to beestablished as well as a minimum price of DKK 0.10 for green certificates. Individualplants will receive a further negotiated permanent supplement. A tendering processis to be used to ensure that more than the initial two or three plants are constructed.Electricity from biomass-based plants is currently settled at a price of about DKK 0.60per kWh. This will continue to apply until further notice.
In addition to the use of biomass in large-scale power plants, other programmes havebeen established to support private initiatives for biomass-fired heating plants. Theseprogrammes support the extension of biomass to district heating areas and areas notserved by the collective supply system. For example, regional subsidies were offered(until 1 November 2001),for up to 21% of costs of installations in households,and 26%for installations in companies, for a total cost of about DKK 25 million/year. CurrentlyDenmark has 50 heating plants operating on wood chips, 25 on wood pellets and75 straw-fired plants.
Denmark anticipates submitting proposals for assessing the further economicsituation of biomass-based electricity production for consideration in the autumn of2001. The most recent assessment provided for the parliamentary ratification processfor the Kyoto Protocol shows biomass use at about 0.6 million tonnes or just underhalf the target,which is now assumed to be attained by 2005 (1.4 million tonnes targetfirst established for 2000).
Solar EnergyIn 1998, The Solar Action Plan 1998-2000 was developed by the Solar EnergyCommittee,which advises the DEA on development and use of solar energy systems inDenmark. Energy 21 set out objectives of 15 000 individual photovoltaics, as well ascollective solar heating systems covering one million m2. The sum of DKK 57 millionper year was set aside in the 1995-1997 plan in the form of a basic subsidy, a standardsubsidy and funds from the Development Programme for Renewable Energy.
To increase the numbers of large solar heating systems, for example in publicbuildings, and in connection with biomass-fired district heating systems, Denmarkprovides a subsidy. The cost of this initiative was about DKK 6 million annuallybetween 1998 and 2000. In addition, Denmark provides subsidies up to 30% of the
63

cost of investment for solar heating systems for household heating outside areaswith district heating. This amounted to approximately DKK 20-25 million duringthe period 1998 to 2000,plus subsidies of about DKK 2 million/year for informationcampaigns.
To promote the use of solar cell systems, Denmark provided about DKK 6 millionannually from 1998 to 2000 from the DEA,and DKK 40 million/year from electricitycompanies to subsidise demonstration projects and installations. Three hundredsystems were installed in 2000, representing electricity production of 600 MWh peryear (2.2 TJ). Denmark has also implemented and enforced an act requiring solarheating be used in any new public buildings.
GeothermalDenmark began investigating geothermal energy projects in 1984 in the Danishtown of Thisted. A small geothermal plant was constructed as a co-operative effortbetween the engineering company Houe and Olsen and DONG A/S. Since then,considerable effort has focused on investigating opportunities in Central andEastern Europe, where Danish environmental assistance has provided US$ 7 millionin support for geothermal projects valued at more than US$ 150 million in fourcountries – Poland, Lithuania, Slovakia and the Czech Republic.
Recently the Danish government has also started to investigate further the potential fordomestic geothermal energy, although there is currently only the one demonstrationplant mentioned above. The Danish Parliament appropriated US$ 2.3 million in 2000 aspart of its Energy 21 action plan for this effort. DKK 10 million were allocated in both2000 and 2001 for the promotion and utilisation of geothermal heat. Reservoirs forsuitable geothermal exploitation are assumed so far to exist under 12 large Danish townsand cities, including Copenhagen. Geothermal Corporation in Greater Copenhagen hasreceived a subsidy to carry out preliminary seismic investigations with a view toassessing the potential for exploiting geothermal heat in the area. The corporation hasbeen granted an exclusive concession for recovery of geothermal energy in the area. Ifthe planned trial drilling shows positive results, some heating in Copenhagen may beprovided by geothermal as soon as 2004.
CRITIQUE
Energy EfficiencyIn December 2000, Denmark produced a report entitled Energy Efficiency inDenmark - An Analysis Based on the OEDYSSEE Data Base from the SAVE Project -Cross-Country Comparison on Energy Efficiency Indicators, Phase 6. This reportshows recent energy efficiency trends in final energy consumption, assessing macrolevel energy efficiency trends, as well as disaggregated trends within sectors. At themacro level from 1988 to 1999, primary (gross) and final energy intensities fell byabout 13% and 12% respectively.
64

Denmark has made great strides towards decoupling energy demand growth andeconomic growth in many sectors. However, there seems to be a moderatingtrend in some sectors, and room for further improvement remains. In the periodfrom 1988 to 1999, energy intensity in Danish industry increased by about 1.5%,although this can be split into a strong increase in the first five-year period offsetby a strong decrease in the second. Whether this can be attributed to theintroduction of the Green Tax Package or simply to the business cycle, is notevident. A similar pattern can be shown for the manufacturing sector – a strongincrease in energy intensity of 7.5% from 1998 to 1993 and a decline of 12.5%from 1993 to 1999.
In the tertiary sector (wholesale and retail trade, private and public services),from 1988 to 1999, energy intensity (after climate adjustments) shows asignificant reduction of 16.5%. In the household sector, after significant declinesin unit energy consumption per dwelling after the second oil price shock,the trend tapered off. Between 1987 and 1999 the decline was only 2%. A maindriver of energy consumption in households is the number of dwellings orthe number of heated square metres. From 1990 to 1999, these increases wereabout 5% and 7% respectively. Although the relative size of houses did notchange appreciably over the period, the average size of a single family house(131 m2) and an apartment (75 m2) remains relatively high in Denmark vis-à-visthe European average.
In terms of policy instruments, Denmark continues to rely heavily on a system oftaxation/tax exemptions and subsidies to improve energy efficiency. Whensome subsidies are phased out, others are introduced to replace them. The stillcomplex subsidy arrangements to achieve energy efficiency objectives should beexamined further. Other policy tools that could be less distorting, more cost-effective and less cumbersome – such as loan payback schemes or third partyfinancing – should be given further consideration. Such measures would placeless of a burden on government finances – since consumers must pay back themoney they receive from the government – and would induce the marketplayers, such as financial institutions, to shoulder some of the administrativerequirements. In some successful examples, the contractor pays the initial costsof the investment and the customer pays him from the energy (and consequentfinancial) savings attained through the investment over a number of years.
Nevertheless, a positive step has been the introduction of phasing-out provisionsfor a number of the subsidy programmes. This time-limited support should beimplemented more broadly. Such action would ensure, for example, that oncepenetration of a more costly, yet more energy-efficient product has reached areasonable level, market price competition can take over. Otherwise the subsidycould block market penetration of other, possibly better, technical options (alwaysa risk when supporting one technology over another).
The introduction of a large amount of combined heat and power productionimproved the conversion efficiency of primary energy,and was a major contributingfactor in the reduction in primary energy intensity over the period.
65

RenewablesDenmark has a very strong objective of promoting renewable energy and CHP. Thegovernment’s objective is to increase the contribution of renewable energy toelectricity production to 50% by 2025 (35% of fuel share by 2030). This is anambitious target. Renewable energies have increased their share in energy supply,particularly in electricity generation, in the past years thanks to strong incentivesgiven by the government through favourable pricing and a priority for renewablesin power production. The penetration of wind power has been greater thananticipated and targets have been surpassed. This has in part been because the costof wind generation has fallen. But the subsidy reduction has not kept pace,resulting in even more generous subsidisation of wind power.
On the other hand, biomass targets have not been met (0.6 million tonnes in 2000compared to a target of 1.4 million tonnes). This is primarily because theintroduction of large-scale CHP has been slower than anticipated. District heatingplants have been slow to convert to CHP production based on straw, chips and thelike owing to technical and financial obstacles. A number of demonstration plantsshow that the technical problems are close to resolution, but financial obstaclesremain, for example, owing to uncertainty with respect to payments for heat andelectricity deliveries. Similar obstacles apply for greenfield projects based onbiofuels. It is also anticipated that Danish power companies will rely more onimported wood pellets as domestic supply has not been adequate. Hence, one ofthe original objectives of the biomass policy – to provide secure domesticrenewable energy – seems to be in question.
“Priority” production13 reduces the market opening for retail competitionsubstantially as wind power plants will only enter the market when ten years old.There are no actual plans to remove the prioritisation of small-scale CHP plants.“Priority” production has consequences in the electricity sector overall, but alsospecifically in the renewables industry. It seems to “over-stimulate” renewableenergy, and a reduction of subsidies should be considered. The rules seemcomplicated and unclear.
The government would be well advised to develop a long-term vision as to whattypes of renewable energies should be developed and what policy instrumentsshould be used. These instruments should be brought into existence. By furtherinvestigating other renewable energy sources besides wind power, Denmark canseek opportunities to diversify its renewable electricity production. The pastpolicy of large subsidies for renewables needs further cost-benefit analysis. The fullcost to society of this policy should be made more transparent to ensure realagreement of the public.
66
13. CHP plants and wind turbines enjoy “priority dispatch” in Denmark. This means that the powersuppliers must buy their production whenever they produce, even if this means that cheaper fossilgenerating plants have to be taken off the grid.

The Danish Energy Agency has begun taking steps towards a more market-orientedand transparent policy approach. Further analysis could also confirm whethersome producers are getting excessive benefits from this system (e.g. large CHP).Alternatives for more market-based solutions should be tried, including tenderingprocedures for offshore wind units (at least once, to reveal their costs) orreimbursable loans, as part of a policy mix for this sector. Whatever the decision, itis important to provide some planning security to investors.
There is considerable uncertainty as to the future of the proposed renewable energycertificates programme. However, the political initiative taken to consider movingaway from the current subsidy scheme for renewable energies to a more market-oriented approach is laudable and should be encouraged, even if the currentproposals require some modifications before being implemented. The introductionof the green certificates system should be made compatible with the systems usedby potential trading partners and the EU.
RECOMMENDATIONS
The Government of Denmark should:
■■ Continue to review the performance of existing energy efficiency programmeswith a view to developing market-based and more cost-effective policies. Loanpayback schemes could substitute for outright subsidies in some cases.
■■ Continue to place time limits on subsidy schemes, particularly on those to boostmarket penetration of new energy-efficient technologies.
■■ Improve the transparency of the costs and trade implications of the variousrenewables support measures, in particular “priority” production.
■■ Investigate the consequences of greater penetration of imported biomass interms of CO2-neutrality, cost, and Denmark’s security of supply objectives.
■■ Take steps to move to market-based policies as soon as possible, including theintroduction of the green certificates programme, or some other instrument tooffset the costs of current subsidies for renewable energy. In the transitoryperiod, subsidies need to be reduced further to reflect current market conditionsfor wind energy and CHP.
67

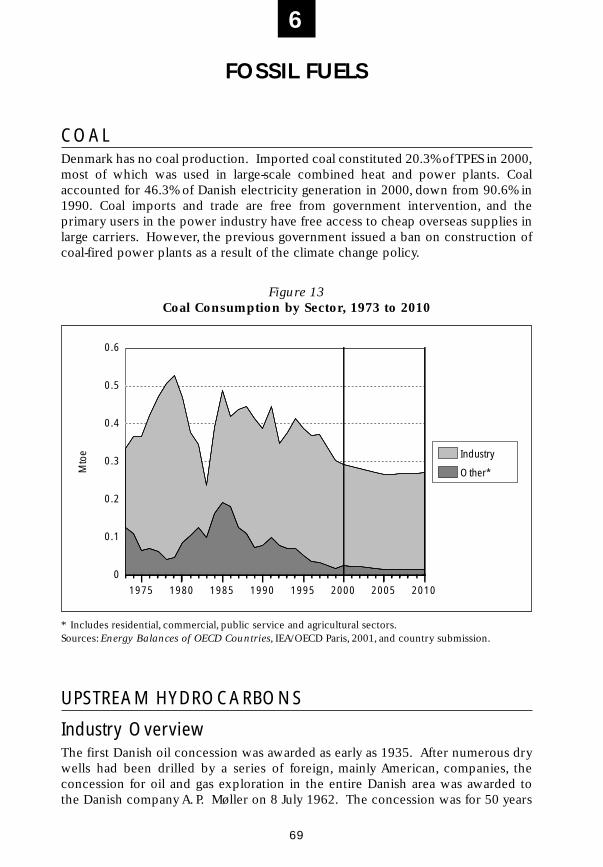
6
FOSSIL FUELS
COALDenmark has no coal production. Imported coal constituted 20.3% of TPES in 2000,most of which was used in large-scale combined heat and power plants. Coalaccounted for 46.3% of Danish electricity generation in 2000, down from 90.6% in1990. Coal imports and trade are free from government intervention, and theprimary users in the power industry have free access to cheap overseas supplies inlarge carriers. However, the previous government issued a ban on construction ofcoal-fired power plants as a result of the climate change policy.
UPSTREAM HYDROCARBONS
Industry OverviewThe first Danish oil concession was awarded as early as 1935. After numerous drywells had been drilled by a series of foreign, mainly American, companies, theconcession for oil and gas exploration in the entire Danish area was awarded tothe Danish company A. P. Møller on 8 July 1962. The concession was for 50 years
69
Mto
e Industry
Other*
0
0.1
0.2
0.3
0.4
0.5
0.6
1975 1980 1985 1990 1995 2000 2005 2010
Figure 13Coal Consumption by Sector, 1973 to 2010
* Includes residential, commercial, public service and agricultural sectors.Sources: Energy Balances of OECD Countries, IEA/OECD Paris, 2001, and country submission.

with an initial exploration period of ten years to make discoveries and startproduction. In the same year, A. P. Møller and the American company Gulffounded Dansk Undergrunds Consortium (DUC). Shell joined shortly afterwards.When the concession was extended to the continental shelf and thus to the Danishpart of the North Sea, Chevron and Texaco joined DUC. Gulf withdrew from theconsortium in 1974; Chevron in 1986. Today, DUC comprises Mærsk Olie og GasA/S, a company established in 1962 as part of the A. P. Møller group,plus Shell andTexaco. Mærsk is the operator and holds 39% of DUC’s shares; Shell holds 46% andTexaco 15%.
DUC discovered the first oil field in the North Sea in 1966 in a field later named theKraka field. Gas was discovered in 1968. The somewhat larger Dan field wasdiscovered in 1971, and in July 1972 production commenced from this field204 kilometres off the Danish west coast. The Dan field was the first oil field in theNorth Sea with production from permanent facilities. Between 1980 and 1982, theGorm and Skjold fields were developed. After the Dan field, these are the mostimportant Danish oil fields. In the 1980s, DUC relinquished large concession areas.These were subsequently licensed out to other companies. Other firms have beenactive in exploration since 1984 and in production since 1998. Additional fieldshave been discovered and brought on stream since, including the Lulita field in 1998and most recently the Halfdan field, discovered in early 1999 and producing sinceMarch 2000.
In 1972, the Danish government established Dansk Naturgas A/S, which becameDansk Olie og Naturgas A/S (DONG) only one year later. DONG is a fully state-owned company with the primary responsibility for pipeline transportation of oiland gas. Following a 1979 parliamentary resolution to introduce natural gas toDenmark, DONG was granted the sole right to import, transport, store and sellnatural gas in Denmark. In the same year, DONG signed the first long-term contractwith DUC for the delivery of 55 billion cubic metres of natural gas over 25 years,beginning 1 October 1984 from DUC’s Tyra field in the North Sea.
The offshore pipeline systems for oil and gas were completed before 1 October1984, and DONG began delivering gas that year to the first Danish distributioncompany,as well as to the German companies Ruhrgas and BEB. Exports to Swedenbegan one year later. Development of the Danish gas market had begun in thesouth of Jutland with the establishment of the first distribution company in 1979and with deliveries from Ruhrgas as of 1982.
Until 1998 DUC was the sole producer of oil and gas in Denmark. Three new fieldshave come on stream since, and these were developed by other, mainly private,investors. On 1 January 2001, 11 companies received and sold oil and gas fromDanish fields. Among them were the foreign private producers Shell, Texaco,Amerada Hess, Statoil, Enterprise & Philips, and the Danish private companiesDenerco, Danoil and LD Energi, and DONG. In 2000, companies other than DUCaccounted for slightly more than one-fifth of Danish oil production and just under10% of Danish gas sales.
70

Exploration and ProductionThe Danish Energy Agency (DEA) produces annual assessments of Danish oil andgas reserves. On 1 January 2000, Denmark’s total oil reserves were estimated at206.3 Mtoe. The assessment published by the DEA on 1 January 2001 showed anincrease in oil reserves of 26% over the 2000 estimate to 259.1 Mtoe of oil. For mostof the 1990s, oil reserves were estimated at around 170 Mtoe, remaining fairlyconstant. In 1999, reserve estimates were increased by 22% over the 1998 level.The 2001 assessment is the highest estimate for Danish oil resources to date, as wellas the highest upward adjustment of Danish reserves.
The increase is attributable mainly to a write-up of reserves in the new Halfdan field.More precisely, it is largely due to the discovery of a new type of accumulationwhere hydrocarbons extend over large areas between existing fields, whereasprevious discoveries had been accumulated in “bulges” in the subsoil. Explorationfor such accumulations is expected to intensify in light of their great potential. InMarch 2001,Mærsk submitted a plan for a major further development of the Halfdanoil field, one of the new types of accumulation. The reserves of several other fieldshave also been reassessed. Gas reserves were estimated to be 135.6 Mtoe in 2000and 137.5 Mtoe in 2001.
The outlook for the years to come is optimistic in a number of areas, includinghydrocarbon exploration. The oil potential in the Danish part of the North Sea, theproduction potential in structures as yet unexplored and the potential in using newtechnology represent an additional resource potential over the above reserveestimates of 87 to 130 Mtoe of oil for the next ten-year period.
The Minister of Environment and Energy grants licences for exploration andproduction of hydrocarbons in licensing rounds, the first of which was held in 1984.The most recent fifth licensing round was announced on 19 September 1997 with adeadline for applications of 27 January 1998. As in the fourth licensing round in1994/95, the area offered for licensing comprised all unlicensed areas in the CentralGraben with adjoining areas in the Danish part of the North Sea. The Danish EnergyAgency received 19 applications from 17 companies. In comparison, the number ofapplications submitted in the fourth licensing round was 12. Seventeen licences forexploration and production of oil and gas were granted on 15 June 1998. No date hasbeen set for the next licensing round, but it is not expected before 2003.
The high oil price level during 2000 strongly affected oil and gas activities. The oilcompanies’ earnings increased significantly, and so did the incentive to invest infurther exploration and production. Exploration activity was high in 2000 owing todrilling operations initiated by the licensees from the fifth licensing round. Two ofthe seven exploration wells drilled during the year encountered new oil depositsoutside the Central Graben. The Danish Energy Agency expects drilling activities tocontinue at the same high level in 2001. Another consequence of the high oil pricelevel is record-high revenue for the State in the form of taxes and fees from the oil-producing companies. If this trend in the oil and gas sector is sustained, Denmarkexpects to be self-sufficient in oil and gas for many years to come.
71

72
Figure 14Danish Hydrocarbons Licence Area and Production Facilities
Source: Danish Energy Agency.

Since 1997, the Danish government has had a special “open door”procedure in placeto facilitate exploration (east of 6°15' East, see Figure 14). Under sections 5 and 13 ofthe Subsoil Act, companies can file applications for exploration and productionlicences for this area every year,and the licences are awarded successively. Under thisprocedure, licences are generally granted for an exploration term of six years, with aright to a 30-year extension for fields where production is initiated. The “open door”procedure has attracted much interest. In September 2000, two new applicationswere submitted, by the Minijos Nafta group and the Sterling group, respectively. On5 March 2001, the then Minister for Environment and Energy granted each of the twoapplicants a licence for exploration and production.
Mærsk Olie og Gas A/S,Amerada Hess ApS and Statoil Efterforskning og ProduktionA/S are operators responsible for the actual production of oil and gas from the NorthSea fields. In addition to these operator companies, a number of other companiesparticipate in the individual licences. Each company controls a share of the oil andgas produced that corresponds to its percentage share in the licence concerned.
Danish oil production increased throughout the last years. As a result of a sustainedhigh level of development activities in the North Sea, the year 2000 set anotherrecord for oil and gas production with 18.3 Mtoe taken together, corresponding toan average production rate of about 364 000 barrels of oil per day. This is 22%above 1999 levels. Natural gas production amounted to 7.4 Mtoe in 2000; 6.7 Mtoeof this were supplied to DONG.
Despite this rise, the increased estimate of oil reserves means that the resources-to-production ratio (R/P ratio) remains at 14, i.e. oil production is calculated tobe sustainable at the 2000 level for the next 14 years. The R/P ratio has droppedfrom 28 to 14 since 1990. The declining R/P ratio is mainly attributable to sharplyincreasing production which tripled during this period. If the reserves had notbeen reassessed since 1990, the depletion caused by production would havereduced reserves in 2001 to a mere 37.3 Mtoe. The R/P ratio for these reserveswould have meant that production at the 2000 level could be sustained for onlytwo years.
Over the past ten years,expected recovery has increased on average at the same rateas production. The increased recovery is attributable to a large degree to improvedrecovery methods such as horizontal drilling, gas re-injection, dry gas recycling andwater injection.
In autumn 2000 a well-head platform was installed in the Halfdan field, followed bythe start-up of production. The Halfdan platform is the 42nd platform installed inthe Danish part of the North Sea. At the beginning of 2001, oil and/or gas wereproduced from a total of 16 Danish fields. In 2000, 17 wells were drilled in theproducing fields. Fourteen of these were production wells.
The estimated value of total Danish oil and gas production rose to aboutDKK 32.9 billion in 2000, DKK 28.5 billion for oil, and DKK 4.4 billion for gas.This represents a 96% increase over 1999. The increase is chiefly due to oil
73

prices and the dollar exchange rate, which were much higher than in 1999, butalso to the higher production rates. In 1999, the value of oil production had beenDKK 14.3 billion, while the value of gas production was estimated at DKK 2.5 billion.
Trade and TransportationDONG A/S owns all well-to-shore gathering pipelines for oil and gas in Denmark.There are also pipelines running between fields, and these are owned by othercompanies. Since 1984 DONG A/S has participated in exploration, and since 1998it has been an oil and gas producer. Through several subsidiaries, it engages in oiland gas transportation, trading and sales in Germany and Sweden. Establishedoriginally in 1972, DONG’s corporate structure today is as follows (April 2000):
■ DONG A/S is the group holding responsible for overall group management.
■ DONG Naturgas A/S (formerly DANGAS) is a 100% owned subsidiary responsiblefor transportation of and trade in natural gas.
■ DONG Efterforskning og Produktion A/S (DONG E&P) is a full subsidiary, whosemain task is exploration and production of oil and gas14.
■ DONG Olierør A/S, another full subsidiary, carries out pipeline transportation ofcrude oil and condensates.
■ DONG Grønland A/S (100%) and Nunaoil (50%) are responsible for explorationin Greenland.
■ DANGAS GmbH,100% owned by DONG A/S,transports natural gas to and from Germany.
■ Vattenfall Naturgas A. B. trades and transports natural gas in Sweden. DONG A/Sholds a 10% stake.
DONG Olierør owns and operates the crude oil pipeline running from the offshoreGorm field to the crude oil pump station in Filsø, where the oil is landed, and onto the crude oil terminal in Fredericia. When the oil transport system went intooperation in 1984, its capacity was 60 000 barrels per day. This had increased to330 000 barrels per day in 2000. The oil from the new fields in the North Sea, Siriand Syd Arne (South Arne), is not transported via the pipeline but by tanker directlyfrom the production platform.
DONG Naturgas gathers the North Sea gas at the Gorm, Syd Arne and Harald fieldsand transports it via two offshore pipelines to the natural gas treatment plant inNybro. The northern pipeline connecting the Syd Arne and Harald fields with
74
14. The functions of DONG’s former operating subsidiary Dansk Operatørselskab I/S (DANOP) and of itsformer exploration,production and engineering subsidiary Dansk Olie og Gasproduktion A/S (DOPAS)have been fully integrated into DONG E&P.

75
Figure 15Oil and Gas Pipelines in Denmark, 2000
Source: DONG.

Nybro – called the Syd Arne pipeline – was completed only recently. It was initiatedin 1997 and began operating in 1999. Under normal circumstances, this pipelineonly carries gas from Syd Arne. But as it is linked with the Harald field, that in turnis linked to the Tyra field, gas from the Tyra platform can be brought to shore evenif the Tyra pipeline is interrupted. From Nybro, high-pressure pipelines run toZealand and on to Malmö in Sweden, and to the north of Jutland and Germany.DONG Naturgas had a statutory monopoly on gas imports until this was repealed in1994 as a first step to prepare for competition.
DONG Naturgas has two natural gas storage facilities, one at Lille Torup near Viborgin Jutland, and one at Stenlille in Zealand. The Lille Torup and Stenlille storagefacilities provide an extraction capacity of 410 million cubic metres and 400 mcm,respectively. A modification of the Stenlille facility has improved DONG Naturgas’sability to meet its short-term objective of supplying customers with gas in case offailing gas supplies from the North Sea on very cold winter days. The company hasalso adopted a long-term gas supply policy that makes allowance for accidents thatmay interrupt the gas supplies carried ashore through the pipeline from the Tyrafield for up to 30 days. With a total extraction volume of 810 mcm from storage andits long-term gas purchase agreements concluded with DUC, DONG Naturgasbelieves it is able to meet its long-term objective. To increase security of supply forfixed customers, DONG has also concluded interruptible gas sales contracts withlarge customers, in particular power plants and large industrial companies. Inreturn for holding stocks of coal or oil that they can switch to, these companies gettheir natural gas at a discount.
Since gas sales began in 1984, Danish natural gas has been supplied under gassales contracts between DUC and DONG Naturgas. DONG Naturgas has threelong-term gas purchase agreements with DUC. The first contract was concludedin 1979 for total deliveries of 55 bcm between 1984 and 2009. A second contractfor 38 bcm runs from 1989 to 2012. The first two contracts were take-or-payagreements on fixed volumes. The third is a variable open-ended agreementconcluded in 1993. These three contracts taken together result in annualdeliveries from DUC to DONG of 7.5 bcm. Since other companies beganproducing oil and gas in the North Sea in 1998, DONG Naturgas started buyinggas from the Statoil’s Lulita field and, as of 1999, from the Amerada Hess group’sSyd Arne field. DONG Naturgas takes up all gas available in the Danish section ofthe North Sea.
In 2000, DONG sold 4.07 bcm of gas in Denmark and exported 3.04 bcm. Since1984, DONG has exported gas to Ruhrgas and BEB in Germany. The quantities arearound 2 bcm to 2.5 bcm; occasionally, Ruhrgas purchases extra supplies at shortterm. About 0.8 bcm to 1 bcm is sold in Sweden via Vattenfall Naturgas.
DONG has plans to expand exports in future. A supply contract with Poland wasconcluded in July 2001. Under this contract, DONG will sell 2 bcm per yearbetween 2004 and 2012 to the Polish state-owned oil and gas company POGC.These supplies require the construction of a dedicated pipeline (BalticPipe) to runthrough the Baltic Sea from Rødvig in Zealand to Niechorze in Poland. DONG and
76

POGC also signed an agreement establishing a joint consortium to construct thispipeline. DONG will hold two-thirds of its shares. The sale of natural gas to Polandis conditional on a new contract for additional volumes between DONG and DUC.
As of 2008, Norway is to supply an additional 5 bcm of gas per year to Polandthrough the same pipeline. This requires linking up the Danish and the Norwegiansystems. Two routes are under discussion: a link-up with the existing Europipe thatruns from Kårstø in Norway to Emden in Germany, or a dedicated pipeline to runthrough the Kattegat and Skagerrak straits.
DONG also contemplates construction of a pipeline to the UK, running from theSyd Arne platform either to the Murdoch or Trent platforms or to the Roughplatform. The gas would be landed in Theddlethorpe, Bacton or Easington,respectively. DONG sees the UK link-up as the only realistic option to sell its gas ifa significant share of its home market should break away owing to competition.
Government Intervention in the Upstream MarketGovernment intervention in the upstream hydrocarbons market takes the form ofmandatory participation of DONG in exploration, field development andproduction, mandatory payment for DONG’s offshore oil pipeline (even if it is notused), and taxation and royalties.
Mandatory participation of DONG in exploration, field development andproduction. DONG Exploration and Production A/S (previously named DOPAS) isautomatically granted a share in all licences for hydrocarbons exploration andproduction awarded to oil companies. The share is generally 20%. DONG’smandatory participation has been a standard requirement since the fourth licensinground held in 1995, as well as under the open-door procedure. The obligatoryparticipation applies for all exploration and production concessions except licencesgranted before 1986.
DONG participates on the same terms as the other companies in each joint venture.The company must pay its share of expenses in its licences on the same terms asthe other licensees, receives the corresponding share of the profits and pays taxesand fees to the State at the current rates. No royalty is due. The main objective ofstate participation in the licences is to secure the State a share in the proceeds fromoil and gas recovery.
The Danish government believes that this form of state participation does notinfluence the profitability of a given project, but only the size of the financial result,since the companies’ exploration, investment and operating costs are reduced bythe same share as their income. In some cases, DONG has supplemented this shareon commercial terms by purchasing additional licence shares. DONG participatesin the production from the new fields not under DUC’s control, i.e. the Siri field,the Syd Arne field and the Lulita field.
77

Mandatory payment for the offshore oil pipeline. According to Denmark’sOil Pipeline Act, all Danish oil producers in the North Sea had to use DONG’s oilpipeline from the Gorm field to Fredericia. For this, all users were required to paya fee to DONG Olierør. This fee includes a profit element of 5% of the value of thecrude oil transported. DONG transfers 95% of the revenue from that profit elementto the government. The Oil Pipeline Act was amended in June 1997 to take intoaccount that new operators were going to be allowed to produce oil in Denmark,and that they might not wish to use the pipeline. The amendment granted anexemption from the obligation to connect to and use the pipeline. As noted in thepreceding section, the companies producing oil from the new Siri and Syd Arnefields have indeed chosen to ship their oil by tanker directly from the productionplatform. However, the amendment stipulated that those parties are still required topay a fee to the State amounting to 5% of the value of their crude oil andcondensate. This fee is paid on the production from the Syd Arne and Siri fields.Hence, whereas the requirement to use, and pay for, DONG’s crude oil pipeline mayhave originally been a measure to ensure the economic viability of this heavyinvestment (compared to the small Danish market), it is now merely a tax on oilrevenue, and acknowledged as such by the government.
Taxation and royalties. Taxation of oil and gas production consists of thefollowing elements: corporate tax, hydrocarbon tax, and royalties.
■ Oil and gas producers pay corporate tax like all other Danish companies.However, the government has put a “one-way ring-fence” around hydrocarbonactivities to ensure that losses from other activities cannot underminethe tax base. On 1 January 2001, Danish corporate tax was lowered from32% to 30%.
■ The hydrocarbon tax was introduced through a Parliamentary Act in 1982with the aim of taxing windfall profits, for example as a result of high oilprices. In the case of new investment, an uplift of 25% per year is deductiblefrom the hydrocarbon tax base for a maximum of ten years. The Danishgovernment believes that this provides a strong incentive to reinvest infurther exploration and development when prices are high, but reducesexploration during low-price periods, and thus ensures increased and betteruse of the hydrocarbon resource. The hydrocarbon tax only became payablefor a few years during the first half of the 1980s, with total revenue amountingto approximately DKK 870 million in 2000 prices. Motivated by the fact thatthe recent high oil prices have not resulted in hydrocarbon tax payment, acommittee headed by the Ministry of Taxation reviewed the currenthydrocarbon tax in 2000 and concluded that the present form of taxation maydistort the oil companies’ incentive to invest. Subsequently, the ministryappointed a committee that is to lay the groundwork for introducing a newhydrocarbon tax system for future licences. The committee was to havecompleted its work by October 2001.
■ The conditions for royalty payments vary depending on the licensing round.Under the terms of A. P. Møller’s Sole Concession of 1962, royalty is payable
78

on the basis of production. The royalty is 8.5% of the value of oil andgas produced, after deducting the cost of transporting the oil to land(including the oil pipeline tariff). In licences attributed during the secondlicensing round of 1986, the royalty is levied on a sliding scale, dependingon the level of production. In addition, the Statoil group is to pay royaltybased on the size of the production attributable to its share of the Lulita field.No royalty is payable for licences awarded in the third and subsequentlicensing rounds.
DOWNSTREAM OILThere are two refineries in Denmark. Both are owned by foreign companies, oneby Shell and one by Statoil. Refining and marketing of oil products are competitiveactivities. Until 1985, Denmark regulated oil prices. Since then, governmentsurveillance has been reduced to the requirement to communicate price changes tothe Competition Council. Most oil companies’ prices differ little and mirror theRotterdam quotations. A few small companies, covering about 10% of the totalretail market, offer lower prices.
79
Mto
e
Industry
Residential
Transport
Other*
0
5
10
15
1975 1980 1985 1990 1995 2000 2005 2010
Figure 16Final Consumption of Oil by Sector, 1973 to 2010
* Includes commercial, public service and agricultural sectors.Sources: Energy Balances of OECD Countries, IEA/OECD Paris, 2001, and country submission.

80
US$/litre
Tax Component
0 0.25 0.75 1.250.5 1
71.1% Norway
72% Germany
67.9% Belgium
74.4% United Kingdom
46.2% Portugal
68% Finland
62.2% Austria
66.1% Italy68.1% Denmark
67.4% Sweden
53.6% Ireland
71.7% France
69.1% Netherlands
54.3% Australia
42.5% New Zealand
54.9% Japan
22.6% United States42.2% Canada
55.7% Czech Republic
13% Mexico
57.7% Luxembourg
61.8% Switzerland
62.4% Poland
59.4% Spain
61.3% Hungary
54.7% Greece
56% Slovak Republic
60.3% Turkey
Figure 17OECD Gasoline Prices and Taxes, 1st Quarter 2001
Note: Data not available for Korea.Source: Energy Prices and Taxes, IEA/OECD Paris, 2001.

81
US$/litre
Tax Component
0 0.2 0.4 0.6 0.8 1 1.2
55.5% Austria
50.8% Portugal
60.7% Italy
64.4% Norway
61% Switzerland54.5% Sweden
58.8% Denmark
56% Netherlands
63.2% France63.8% Germany
41.7% Japan
52.2% Spain
51% Luxembourg
51.7% Czech Republic
55.3% Poland
50.6% Australia31.6% United States
11.7% New Zealand
52.8% Greece
54.3% Belgium
54.9% Finland
45.7% Ireland
74% United Kingdom
54.5% Mexico
58.2% Slovak Republic
Figure 18OECD Automotive Diesel Prices and Taxes, 1st Quarter 2001
Note: Data not available for Canada, Hungary, Korea and Turkey.Source: Energy Prices and Taxes, IEA/OECD Paris, 2001.

EMERGENCY PREPAREDNESSDenmark has the following wide-ranging statutory powers for implementation ofemergency response measures:
■ The Supply Measures Act 1986, which authorises the Minister for Economic andBusiness Affairs to stipulate provisions about the use, distribution, priceequalisation and location of Denmark’s stocks of energy commodities in case ofa supply disruption. Such measures presuppose that they are endorsed by theParliament’s Standing Committee on Energy.
■ The Act on Reporting and Selling Obligations 1975, which authorises theMinister for Economic and Business Affairs to stipulate provisions orderingcompanies producing or importing hydrocarbons to sell such hydrocarbons inorder to fulfil Denmark’s international sharing obligations.
■ The Act on Compulsory Stocks of Mineral Oil and Mineral Oil Products 2000,which authorises the Minister for Economic and Business Affairs to stipulateprovisions about compulsory stock obligations and reporting obligations forcompanies producing or importing hydrocarbons.
■ The Act on Civil Emergency Preparedness 1992,which contains general provisionsabout civil emergency preparedness matters.
The Danish National Energy Emergency Sharing Organisation (NESO) consists ofstaff from the Danish Energy Authority in the Ministry of Economic and BusinessAffairs. Although there are no specific staffing plans, the NESO can be flexibly andquickly expanded in co-operation with experts from the oil industry.
Denmark maintains a high level of emergency oil stocks, the majority of which isheld by the FDO (the Association of Danish Oil Reserve Stocks) on behalf of the oilcompanies. Thus, the FDO is the cornerstone of the Danish stockholding system.The FDO is an association of almost all oil companies in Denmark and is owned bythese companies. The Danish Energy Authority has a member on the Board ofDirectors of the FDO, but it is not in a controlling position as to its operations.
Apart from crude oil stocks and some other stocks held for flexibility, thecomposition of FDO stocks reflects the market product mix. In addition, somecommercial stocks would be available in case of a supply disruption. The stockobligation for oil companies was lowered from 90 days to 81 days of consumptionas of 1 July 1999, in accordance with EU Directive 98/93/EC.
Emergency oil stocks held in excess of international obligations can be released by aspecific decision by the Danish government lowering the oil companies’ compulsorystock obligations, thereby making these quantities available to the market. In this way,Denmark would be able to participate in a co-ordinated stockdraw in a flexible mannerunder conditions where the IEA’s Co-ordinated Emergency Response Measures applyor in situations triggered under the International Energy Program.
82

The Supply Measures Act 1986 is regarded as the basis for implementing, ifnecessary, demand restraint measures tailored to the specific supply disruptionsituation. Such demand restraint measures could be decided by the Minister forEconomic and Business Affairs and will presuppose that they are endorsed by theParliament’s Standing Committee on Energy.
NATURAL GAS
Distribution and RetailingDenmark has five regional distribution companies that carry out local supply taskswithin delimited geographical areas. These gas distributors are Naturgas Syd (NGS)in southern Jutland and North Schleswig, Naturgas Sjælland (NGSJ) in western andsouthern Zealand, Naturgas Fyn (NGF) in Funen, Hovedstadsregionens Naturgas(HNG) in the area surrounding Copenhagen, and Naturgas Midt-Nord (NGMN) inthe central and northern parts of Jutland. The city of Copenhagen and themunicipality of Frederiksberg also have gas networks. From the beginning of gassupply in Denmark in 1984, the five distributors bought gas from DONG and sold itto end-users. DONG Naturgas supplied large-scale CHP plants and natural gascustomers in Copenhagen and Frederiksberg directly.
The regional gas distribution companies are non-profit organisations owned by themunicipalities they supply. Denmark has a long-standing tradition of organisingregional and local infrastructure industries as consumer co-operatives or communalundertakings that do not have the right to retain profits for future investments.Prices can only reflect “justified” costs, as determined by the Price Commission. Ifprofits are made, they have to be paid back to the consumers in the following year.This makes it impossible to form capital in the company or to raise equity.
Based on pre-existing distribution grids for city gas, the Danish governmentencouraged the construction of the gas distribution infrastructure under this modelover a short period in the early 1980s, driven by considerations of security ofsupply after the oil crises. But the restrictions on the commercial operation ofthe companies meant that the capital for the development of the gas system hadto be raised by loans. These loans were guaranteed by their community owners.Consequently, the gas distribution companies are heavily indebted. Thegovernment financed reimbursement of the debts through regulated gas prices forultimate consumers and preferential tax treatment for natural gas in relation to oil,effectively amounting to a large subsidy.
The relationship between DONG Naturgas and the regional gas companies wasregulated by a contract that became known as the “4 June Agreement” after itsconclusion on 4 June 1987. Under this agreement, DONG Naturgas had anobligation to supply the companies with gas up to 2.6 bcm. In 1998, DONGNaturgas signed an agreement with the five distributors to supply them withadditional quantities of gas beyond the “4 June Agreement”.
83

To prepare the introduction of competition required under the EU Gas Directiveand address the debt problem, negotiations took place in 1999 between thegovernment, the regional gas distribution companies and DONG Naturgas about thefuture structure of the gas sector and future state aid.
On 23 June 1999, the government concluded an agreement with Naturgas Midt-Nord(NGMN) and Hovedstadsregionens Naturgas (HNG), the two largest regional gasdistribution companies in Denmark. The agreement provided that the two regionalcompanies form a closely co-operating entity. This co-operation is expected to lead tojoint reduction of the companies’debts,allowing the companies to pay back their debtsat the same rate and become free of debt at the same time. The agreement will alsoconstitute the framework for closer operational co-operation to minimise costs. As aconsequence of this agreement, DONG Naturgas, HNG and NGMN signed a newcontract on the delivery and transportation of natural gas, which came into force on1 July 2000. Under this contract, DONG Naturgas acquired the right to sell to largerindustrial consumers and small-scale CHP plants in HNG’s and NGMN’s geographicalareas directly. The “4 June Agreement” no longer applies to the two regionalcompanies. On 1 July 1999,DONG acquired the regional distributor Naturgas Syd andthus gained direct access to 58 000 customers in southern Jutland. As DONG has thefinancial power to redeem the distributor’s debt,the take-over and the new agreementseffectively solved the most serious part of the debt problem in the Danish gas sector.
84
Denmark Finland Netherlands
US$
/10E
7 k
cal G
CV
0
200
400
600
800
1984 1986 1988 1990 1992 1994 1996 1998 2000
Figure 19Natural Gas Prices in Denmark and
in Other Selected IEA Countries, 1984 to 2000Household Sector
Source: Energy Prices and Taxes, IEA/OECD Paris, 2001.

85
US$/10E7 kcal GCV
US$/10E7 kcal GCV
Industry Sector
Household Sector
Note: Tax information is not available for Canada and the United States. Data not available for Australia, Belgium, Italy, Korea, Norway, Portugal and Sweden.
Note: Tax information is not available for Canada and the United States. Data not available for Australia, Austria, Belgium, Denmark, Italy, Korea, Luxembourg, Norway, Portugal and Sweden.
Tax component
Tax component
Czech Republic
United States
SwitzerlandGreece
Japan
Canada
Spain
France
Ireland
HungaryUnited Kingdom
Germany
Turkey
Netherlands
Finland
New Zealand
0 50 100 150 200 250 300 350 400 450 500
GreeceLuxembourg
Czech Republic
HungaryFinland
Spain
Japan
Netherlands
Austria
New ZealandUnited States
Turkey
Germany
France
Denmark
Switzerland
Ireland
United Kingdom
Canada
0 200 400 600 800 1000 1200 1400
Figure 20Natural Gas Prices in IEA Countries, 2000
Source: Energy Prices and Taxes, IEA/OECD Paris, 2001.

The agreement of 23 June 1999 expressly invited two remaining (the smallest)regional gas distribution companies Naturgas Fyn (NGF) and Naturgas Sjælland(NGSJ) to join the agreement on the same terms as HNG and NGMN. But NGFexpressed no wish to join the agreement and the gas supply contract. However,DONG Naturgas informed NGF that the “4 June Agreement” and the old supplyagreement built on it were to lapse as from 1 July 2000. Parliament decided toincrease the energy tax on natural gas to the same level as oil products (based ontheir respective carbon content) as from that date, thereby effectively ending the taxsubsidies for gas. On 1 July 2000, the new Natural Gas Supply Act also becameeffective (see next section on Gas Market Reform), introducing partial opening tocompetition into the gas industry. NGF does not acknowledge the lapse of theJune 4 Agreement. The agreement is a private law issue, and steps have been takento resolve the dispute between the parties definitively.
On 31 January 2000, DONG acquired the former municipally-owned distributorNaturgas Sjælland. The two acquisitions burden DONG with a debt portfolio ofDKK 7.2 billion, but DONG can amortise the debt. The government believes thatHNG, NGMN and NGF will be able to repay their debt by 2014. As a consequenceof the two take-overs, DONG now supplies 75% of the Danish gas market directly,and the remainder through the three municipally-owned distribution companiesHNG, NGMN and NGF. HNG and NGMN each account for 10% of the Danishmarket. As DONG has acquired the right to supply the largest customers in theirsupply areas through the agreements of 23 June 1999 and 1 July 2000, it hasacquired a strong dominating position in the Danish gas market. NGF with 5%market share is the only supply company that is independent of DONG to date. TheDanish Competition Authority has taken note of DONG’s dominating position.
Natural Gas DemandNatural gas sales in the Danish domestic market were 4.07 bcm in 2000,down just under2% compared to 1999. Residential and commercial consumers took 0.9 bcm, industrialconsumers 1.1 bcm,CHP and district heating plants 1.3 bcm and power generators 0.7bcm in 2000. The Danish gas market is very small compared to that of other Europeancountries, amounting to 4% of the UK market and 5% of the German market.
The development of gas demand has been subject to mixed incentives over the pastyears. On the one hand, natural gas as a domestic and environmentally relativelyadvantageous energy resource had been favoured in power generation and especiallyin CHP for a long time, and had been subject to relatively low taxation. On the otherhand, the heat market was tightly regulated through the national Heat Plan, therebyrestricting the market for gas to predefined geographical areas.
The outlook for gas demand is mixed and will depend in particular on gas sales to large-scale CHP plants. This in turn depends on the development of the competitive gas andelectricity market. Including anticipated exports to Germany,Sweden and Poland,salesof Danish natural gas are expected to grow to 8 bcm to 10 bcm per year to 2004.
86

Gas Market ReformGas market reform in Denmark was initiated through the EU Gas Directive(98/30/EC), adopted on 22 June 1998 and in force since 10 August 1998. EuropeanUnion member states had to transpose the directive, i.e. adapt their laws,regulations and administrative provisions to the new rules, two years after the entryinto force of the directive, i.e. on 10 August 2000. The Danish governmentpresented draft legislation to Parliament on 29 March 2000. The Natural Gas SupplyAct was adopted on 31 May 2000 and entered into force on 1 July 2000.
According to the Gas Directive, at least all gas-fired power generators, irrespective oftheir annual consumption,and other final customers consuming more than 25 millioncubic metres (mcm) per year had to be made eligible for competition as from August2000. The eligibility threshold must gradually be lowered to 15 and 5 mcm by 2003and 2008, respectively. The minimum share of competition in the market required bythe directive was 20% as from 10 August 2000, increasing to 33% by 2008.
However, the Gas Directive allows member states to introduce ceilings on marketopening. This is possible in exceptional circumstances, for example in case ofsafety or security of supply risks. In order to “safeguard the balance” of theelectricity market, member states may introduce a threshold for the eligibility ofcombined heat and power (CHP) producers. As power generators,CHP plants of all
87
Mto
e
Industry
Residential
Other*
0
0.5
1.0
1.5
2.0
2.5
1975 1980 1985 1990 1995 2000 2005 2010
Figure 21Natural Gas Consumption, 1973 to 2010
* Includes commercial, public service and agricultural sectors.Sources: Energy Balances of OECD Countries, IEA/OECD Paris, 2001, and country submission.

sizes would normally be eligible for competition. Under this provision, a size limitcan be introduced for combined heat and power producers at the general level ofeligibility. This derogation was originally laid down by the EU Council of Ministersin accordance with Denmark’s wishes and following submission to the DanishParliament (Folketing). Finally, more restrictive thresholds can also be used if theconsumption-based levels result in a market opening exceeding 30% in the firstphase, 38% in the second phase and 43% in the third phase. Member states maythen limit market opening “in a balanced manner” to this ceiling level.
Denmark intends to make use of these more restrictive provisions. Therefore, theNatural Gas Supply Act provides for market opening of 30% on 10 August 2000,increasing to 38% in 2003 and 43% by 2008. This means that currently, consumersusing a minimum of 35 million cubic metres (instead of 25 mcm) per year are free tochoose their suppliers. The 35 mcm threshold also applies for CHP plants. Allelectricity generating plants and the largest of the small-scale CHP plants andindustrial enterprises have or will gain market access. Regional and local gasdistribution companies will not be granted market access15, as this would mean thatpublicly-owned companies would enter into direct competition with each other.The Danish government believes that this is inappropriate because of the largepublic investments and the considerable state subsidies that the sector has received.
There is a further derogation in the Gas Directive that allows denial of grid accessunder certain circumstances. The introduction of competition in gas can lead tothe loss of market share for incumbent suppliers. But gas supply companies haveoften purchased large volumes of gas under “take-or-pay”contracts – i.e. long-termcontracts under which buyers guarantee to pay for a large proportion of thecontract volume even if they cannot sell the gas. Since competition is expectedto lead to falling gas prices, this could give rise to serious financial difficulties forgas companies having entered into take-or-pay obligations at higher prices.
If a natural gas company encounters serious economic and financial difficultiesbecause of its take-or-pay commitments, the Gas Directive permits access to thenetwork be refused temporarily as a last resort, thereby protecting the market of asupplier. The gas company in question must send an application containing allrelevant information to the government or the regulatory agency, which must notifythe European Commission. The commission can amend or withdraw the temporaryrestriction of access. The Danish government believes that the “balanced” marketopening will suffice to resolve the problem of the long-term take-or-pay agreementsthat the state-owned company DONG has vis-à-vis DUC and others, but reserves theright to use this instrument and is developing detailed procedures for this case.
Under the Natural Gas Supply Act of July 2000,a licensing system was introduced. Thissystem introduces licences for four different activities in the gas business:transportation,
88
15. The Gas Directive provides that member countries can decide themselves whether gas distributioncompanies are among the eligible consumers or not. If they are not made eligible, they still have tobe allowed to shop for gas in the competitive market to the extent that they themselves have eligiblecustomers that they might lose.

distribution, storage and supply to ultimate consumers without access to competition(captive consumers). All other activities are free. DONG and the regional companieswill be granted licences for the grid services and supply that they provide at present.
The law provided for negotiated access to the transmission network, includingupstream pipelines, and regulated access to the distribution network. Access to thehigh-pressure transportation grid was to occur under published commercial conditionsset by the pipeline owner on the basis of objective and non-discriminatory criteria. Aregulatory agency (Energy Regulatory Authority, Energitilsynet)16 was established tomonitor access to the transportation grid, sanction abuses and settle disputes. Theregulator’s task is to supervise and regulate the parts of the natural gas industry notexposed to competition,ensure fair and non-discriminatory conditions for consumers,and prevent cross-subsidisation between companies. Eligible consumers have thepossibility to appeal to the Energy Regulatory Authority if they are denied access, or ifthey find that the prices and conditions for access discriminate against them.
The regulator is an autonomous body within the Danish Competition Authority,appointed by the Minister of Environment and Energy and assisted by the DanishEnergy Agency. In cases of disagreement, its decisions can be referred to an EnergyComplaints Board (Energiklagenævnet). The Minister for Environment and Energywill lay down rules to ensure that disputes can be settled quickly.
Negotiated access to storage was required where such access is technically necessaryfor efficient access to the system. The principal commercial conditions for access tostorage must be published. Access to gas distribution was to occur on the basis ofregulated uniform (“postage stamp”) pipeline tariffs. These distribution tariffs and end-user prices to captive customers were subject to price cap regulation by the regulator.
The trading and network functions of integrated gas companies had to be separatedby “Chinese Walls”. Internal accounts were to be unbundled and a documentedsystem of administrative procedures put in place to ensure that commerciallysensitive information was not abused.
The Natural Gas Supply Act contained a number of “public service”obligations. Themost important ones provided that the transmission companies were responsiblefor security of supply, and that distributors must connect consumers to the gas gridand offer them consultancy services on energy conservation.
The adoption and entry into force of the Natural Gas Supply Act were preceded andfollowed by a number of agreements between political parties and between gascompanies. As a result of several of these agreements, an amendment to the NaturalGas Supply Act was adopted by the Danish Parliament on 1 June 2001. According tothis amendment, the regulated cap on retail prices is to be revoked, and the accessconditions to the transmission pipelines are to be changed to regulated access tointroduce greater transparency. Regulated access became effective as of 1 October 2001.
89
16. See also the section on Electricity Market Reform in Chapter 7.

Gas companies will now be obliged to form separate subsidiaries for network andtrade activities from 1 January 2003. Consequently, DONG will have to createseparate companies for the operation of the transmission network and storage ofgas, the operation of the distribution network, and the supply of gas to the captivecustomers. The same will apply for the regional companies with regard tooperation of the distribution network and supply of captive customers. Theamended law now also contains a provision that allows simple insertion of furthermarket opening if decided at the EU level.
The law contains no provisions for privatisation, and the various agreements amongparties showed broad consensus that the gas infrastructure should remain in publicownership. Public ownership of the gas infrastructure was seen as a guarantee thatsecurity of supply, the environment and consumer protection will continue to betaken into account. However, the new government that took office in November2001 decided that the Danish gas market will be opened to full retail competitionby 2004, and that DONG will be privatised at some stage in the future.
Denmark has 14 gas users that consume more than 35 mcm and that have been eligiblefor competition since July 2001. These are listed in Table 7. All of them are DONG’scustomers. Numbers 1 to 6, all of them power generators, had long-term take-or-paycontracts with DONG that were to expire in 2020, but they have not been bound bythem since the onset of competition. So far, none of them has switched suppliers.
90
Table 7Natural Gas Customers Eligible for Competition, 1 August 2001
No. Company Consumption (mcm)
1 Fynsværket 223
2 Skærbækværket 174
3 Svanemølleværket 173
4 Avedøreværket 135
5 H. C. Ørstedværket 108
6 Herningværket 87
7 Hillerød K/V 87
8 Silkeborg K/V 83
9 Dansk Salt 58
10 Viborg K/V 58
11 Helsongør K/V 53
12 Cheminova Agro 46
13 Hjørring K/V 38
14 Hartmann Emballage 36
Total 1 356
Source: DONG.

CRITIQUE
Upstream HydrocarbonsDenmark has the good fortune to have discovered its own oil and gas in the NorthSea, and this has been very beneficial for the Danish economy. Since the mid-1980s, oil and gas production has gradually eroded the pre-existing deficit in thecountry’s trade balance, which became a DKK 293 million surplus in 1995 and aDKK 5.3 billion surplus in 2000. The government’s revenues have also benefitedgreatly from oil and gas taxation. It should be noted, though, that Denmark’sresources are much too small to have any major effect on security of supply in thesurrounding countries: Denmark’s entire known gas reserves would only besufficient to supply the UK gas market for little more than one year. But Denmarkis a small country and its resources are large enough to make the country self-sufficient. In the light of these positive effects, the government’s main objectivefor oil and gas exploration is to locate as many new reserves as possible and toensure an extension of the current situation.
In recent years, there have been many successes in this area. Intenseexploration and development activities have led to new discoveries, increasedresource estimates, the coming on stream of new fields and high levels ofproduction. The main factor behind these successes is certainly the high oilprice, as this provides the necessary incentive to look for and produce oil andgas from the technically relatively difficult formations in the North Sea. The“open door” procedure of attributing hydrocarbons concessions is a flexibleinstrument which has certainly contributed to the success of Danishgovernment policies regarding exploration.
On the other hand, upstream taxation appears somewhat piecemeal. The previousDanish government introduced the hydrocarbons tax with the objective of taxingaway “windfall” profits and contributing to the generation of stable, predictablegovernment revenues from upstream activities. “Windfall” taxation of this kindwould not receive unanimous support in many countries. But even measuredagainst its own objective, it does not appear to perform well. It was only paid in theearly 1980s17. To reach its goal of ensuring a stable take, the government soughtother means, such as the crude oil “pipeline fee”. This “fee” is due even if thepipeline is not used – it is simply another upstream tax. Another way of generatinggovernment oil revenue is DONG’s participation in all licences. The hydrocarbonstax may have skewed investment, probably towards excessive investment. Thegovernment is aware of this and work has begun to review the tax. This workshould be continued. Its ultimate objective should be to establish a resourcetaxation system that is both simple and effective.
91
17. This may be due to the fact that the tax was designed on the basis of assumptions that did notmaterialise.When the tax was introduced in 1982, the interest rate was close to 20%, the inflationrate nearly 10% and significant further oil price increases were expected. Instead, the oil price felland interest and inflation rates have been significantly lower.

Natural GasThe Danish gas industry has had to go through major change to adapt to the newrequirements of openness and competition. The industry was not built upaccording to market principles, but rather induced by the government’s desire toreplace coal and oil (hence the name “natural gas project”). Owing to the rush asmuch as to Danish traditions, this led to the establishment of deeply indebted non-profit distribution companies and large tax subsidies to enable the gas companiesto pay back their loans. Under usual commercial conditions,capital for such a majorproject would have been raised by a combination of equity and loans. The initialinvestor would have been able to sell all or part of his stake in the gas companies.None of this was possible in Denmark. Had the development of a European marketnot occurred, the distribution companies would eventually have repaid the loans,supported by tax subsidies, although this would have taken a very long time. Theymight have been able to continue operating as non-profit companies in a restrictedmarket afterwards.
But in a competitive regime, the companies would be regarded as insolvent inconventional commercial terms, and unable to compete or take advantage ofchanging market circumstances,because of their restricted capital base. The last IEAin-depth review predicted that these asset-rich but low-equity companies would betargets for take-overs. It suggested industry restructuring and ownership changes toallow the gas distributors to trade their way out of debt. In the event, bothhappened. The largest part of the problem was solved through the acquisition ofNGS and NGSJ by DONG,and the agreement by which DONG obtained access to thelargest customers of HGN and NGMN in return for taking over some of their debt.Even under these improved circumstances, HGN, NGMN and NGF will take until2014 to pay off their heavy initial investment. In principle, these developmentsrepresent the first (major) steps towards a solution of the debt problem over time.
But this solution comes at a high cost. By acquiring the two distributors and thelargest clients of two others,DONG has attained a degree of dominance in gas retailingthat could be called a quasi-monopoly. To be sure, all statutory monopoly rights havebeen abolished. DONG no longer has any monopoly rights in gas transportation ortrading and third party access to upstream pipelines is even permitted. But DONG isstill the only player in those areas. It participates in all new upstream licences. Long-term contractual arrangements remain in place between the various players. With thesituation so heavily skewed in favour of DONG, it is not surprising that so far nocompetitive entry into the Danish gas market has occurred.
Denmark has opted for the minimum amount of market opening allowed under EUlegislation, but the recent amendments to the Natural Gas Supply Act show that theneed to move to greater market opening is clearly understood and accepted.However, the government considered it a priority to bring the debt problem closer toa solution by letting DONG take care of a large part of it. It is understandable that thegovernment had a large incentive to solve the problem this way, especially as it hadfew options. But the last remaining independent parts of the market should beencouraged to remain independent. DONG should be closely monitored by the
92

Competition Authority to prevent it from becoming a monopoly supplier along theentire gas chain. The government should ensure that the policy and regulatoryenvironment does not deter new entrants. Rather,the government might find it usefulto reflect on how the regulatory system could create incentives for such entry. Thedecision of the new government to introduce full retail competition and to privatiseDONG will help promote competition and is therefore commended.
RECOMMENDATIONS
The Government of Denmark should:
■■ Review the hydrocarbon tax to eliminate distortions in upstream investment andto establish a clear and simple upstream taxation system.
■■ Facilitate effective competition in the Danish gas market by preventing DONGfrom becoming a monopoly supplier along the entire gas chain. TheCompetition Authority should monitor DONG’s behaviour closely.
■■ Create incentives for new suppliers to enter the Danish market.
93

7
ELECTRICITY AND HEAT
INDUSTRY OVERVIEWThe Danish power industry was not developed on the basis of private,profit-orientedcompanies but in the form of municipal non-profit organisations (in towns) andconsumer co-operatives (in the countryside). A process of concentration followed,especially in generation, but up to the early 1990s, there were still 12 power-generating companies owning 18 power plants and 119 local power distributors.Among the distributors, 53 were municipal enterprises, 54 were consumer co-operatives, ten were private foundations and only two were private-law commercialcompanies. As in the gas industry, the local electricity distributors are non-profitenterprises. Any cost reduction or profit they might achieve must be passed on totheir owners in the form of reduced prices.
Both producers and distributors had clearly delimited supply areas, but theproducers co-operated in two larger organisations, the association Elsam I/S (Detjysk-fynske elsamarbejde I/S) and the co-operative Elkraft A.m.b.A. Elsam wasresponsible for Denmark’s western regions Jutland and Funen; Elkraft coveredthe parts east of the Great Belt including Zealand, the island Lolland and thesmaller western islands. In general, the distribution companies within a regionare owners of the regional power company. Elsam and Elkraft were owned bythe regional power companies, as well as directly by some municipalities andpower distributors. The transmission grid (> 30 kV) was owned by 28 powercompanies, including all 12 generators.
Elsam and Elkraft were responsible for planning, load dispatching, operation of thetransmission grid and international connections. Denmark does not have a uniform,nationwide transmission grid. Elsam operated the transmission grid in Jutland andFunen, which is synchronously interconnected with the UCTE transmission gridsystem18 via Germany and linked to Sweden and Norway via direct current (DC) seacables. Elkraft covered Zealand and its nearby islands in the east, and issynchronously interconnected across the Sound (Øresund) with Sweden. BothElsam and Elkraft were members of Nordel, the organisation for the interconnectedNordic countries comprising Denmark, Finland, Norway and Sweden19. The Danish
95
18. The Union for the Co-ordination of Transmission of Electricity (UCTE) co-ordinates the interests oftransmission system operators in 20 European countries.Their common objective is to guarantee thesecurity of operation of the interconnected power system.
19. Nordel is in charge of the operation of the Nordic grid. Its primary aim is the establishment of thenecessary framework for an efficient and harmonised Nordic electricity market.

island of Bornholm is connected with Elkraft’s system only via Sweden. There is nodirect interconnection between the areas of Elsam and Elkraft. A possible futureconnection of the two areas across the Great Belt (Store Bælt) via a direct current(DC) sea cable has been under discussion since a parliamentary resolution passedin 1992, but no progress has been made to date.
Government oversight of the economic aspects of electricity supply was longseen as unnecessary. Public ownership and organisation as consumer co-operatives were assumed to guarantee efficient operation of the sector. For thisreason, legislation relating to the power industry was adopted only in 1976. TheElectricity Supply Act (Act No. 54 of 25 February 1976) gave the Minister ofEconomic Affairs and later the Energy and Environment Minister the power tolicense all operators of more than 25 MW of generating capacity and 100 kV gridcapacity.
Vast powers to intervene in the power industry and the energy market at largewere given to the minister and local governments under the Heat Supply Act(Act no. 258 of 8 June 1978). Under this law, the minister designed a nationalheat plan, which determined the priority energy to be used for space heating forindividual parts of the country. The objective was to create and extend themarket for heat from combined heat and power generation (CHP) in order to saveprimary energy. Since the early 1980s, all new power plants have been CHPplants; no electricity-only plant has been granted a licence. The municipalitiesparticipated in the elaboration of the heat plan and had far-reaching rights toenforce it. They could, for example, mandate the connection of new and existingbuildings to the district heating network and collect monies for the constructionof new heating plants. They could also prohibit the use of certain types of energyfor heating purposes, e.g. electric heating. A ban against electric heating waseffectively put in place in 1995.
The transition towards competition began in 1996 with amendments to theElectricity Supply Act of 1976. The definitive move towards competition was takenin 1999 with the adoption of the new Electricity Supply Act (Act No. 375 of 2 June1999), as well as a number of amendments, political agreements and secondarylegislation built upon this act. The 12 “centralised” power-generating companiesthat still existed in the early 1990s had merged to form eight companies by 1997. Following further mergers,only two large power-generating companies wereleft in 2001, Elsam A/S in western Denmark and Energi E2 in the east. Thetransmission grid in Jutland and Funen is owned and operated by the newtransmission company Eltra. In Zealand and the interconnected islands, ElkraftSystem and Elkraft Transmission are responsible for system operation, andownership and maintenance of the transmission grid, respectively. Regrouping andmergers have also reduced the number of distributors. At the end of 1999, therewere 88 local distribution companies, of which 38 were municipal companies,36 were co-operatives, 11 were private foundations, one was a partnership and onewas a joint-stock company.
96
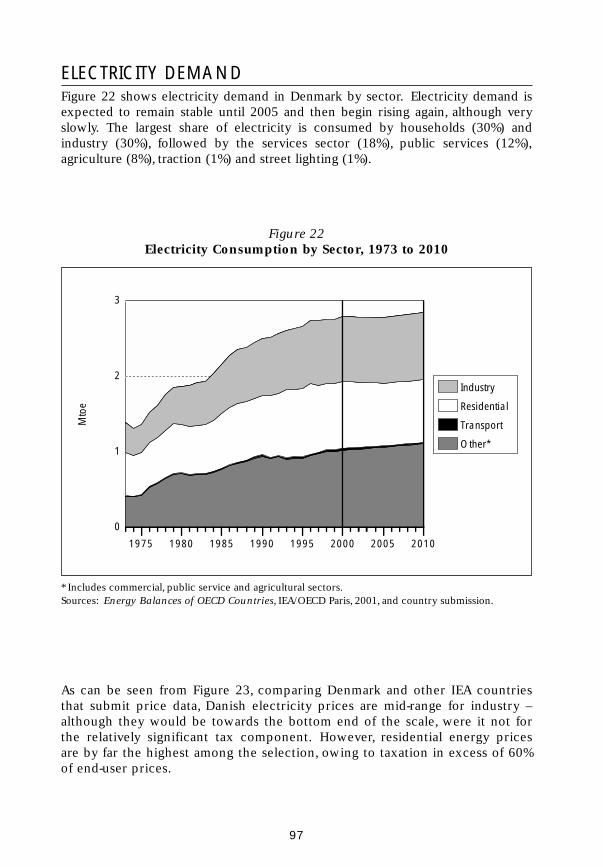
ELECTRICITY DEMANDFigure 22 shows electricity demand in Denmark by sector. Electricity demand isexpected to remain stable until 2005 and then begin rising again, although veryslowly. The largest share of electricity is consumed by households (30%) andindustry (30%), followed by the services sector (18%), public services (12%),agriculture (8%), traction (1%) and street lighting (1%).
As can be seen from Figure 23, comparing Denmark and other IEA countriesthat submit price data, Danish electricity prices are mid-range for industry –although they would be towards the bottom end of the scale, were it not forthe relatively significant tax component. However, residential energy pricesare by far the highest among the selection, owing to taxation in excess of 60%of end-user prices.
97
Mto
e
Industry
Residential
Transport
Other*
0
1
2
3
1975 1980 1985 1990 1995 2000 2005 2010
Figure 22Electricity Consumption by Sector, 1973 to 2010
* Includes commercial, public service and agricultural sectors.Sources: Energy Balances of OECD Countries, IEA/OECD Paris, 2001, and country submission.

98
US$/kWh
US$/kWh
Industry Sector
Household Sector
Note: Price excluding tax for the United States. Tax information not available for Korea. Data not available for Australia, Belgium, Canada, Greece, Spain and Sweden.
Note: Price excluding tax for the United States. Tax information not available for Korea. Data not available for Australia, Austria, Belgium, Canada, Germany, Greece, Japan, Luxembourg, Norway, Spain and Sweden.
Tax component
Tax component
Switzerland
Italy
KoreaDenmark
New Zealand
FinlandCzech Republic
United StatesHungary
Ireland
Netherlands
United Kingdom
France
Portugal
Turkey
0 0.01 0.02 0.03 0.04 0.05 0.06 0.07 0.08 0.09 0.10
DenmarkJapan
Netherlands
United States
United Kingdom
Portugal
Finland
Korea
LuxembourgIreland
Czech RepublicNorway
HungaryNew Zealand
Turkey
France
Austria
Italy
Switzerland
Germany
0 0.05 0.10 0.15 0.20 0.25
Figure 23Electricity Prices in IEA Countries, 2000
Source: Energy Prices and Taxes, IEA/OECD Paris, 2001.

ELECTRICITY PRODUCTION
OverviewDenmark’s electricity supply industry has gone through several drastic changes inits fuel choice in the last three decades. In 1973, the power industry was heavilydependent upon oil, which accounted for 64% of its output. By 1980, the high oilprices and the government’s efforts had already led to substantial replacement of oilby coal and in 1990, Denmark had one of the highest coal shares in powergeneration in the IEA,with just over 90%. Coal has since been substituted by naturalgas, again assisted by government policies under the “natural gas project”. In 2000,total gross electricity production was 3.09 Mtoe or 35.97 TWh. Coal still had thelion’s share with 46.3%, followed by natural gas (24.9%), oil (11.8%), wind (11.7%),and combustible renewables. The share of wind energy in the Danish system is thehighest in the world, and, again, the result of strong support by the government. Inaccordance with a parliamentary decision adopted in 1985,Denmark has no nuclearpower plant and does not intend to develop nuclear power.
As can be seen from Figure 24, Danish power generation is hugely variable in contrastto the country’s relatively smooth demand growth. The reason for this is Denmark’sclose trade relationship with the Nordic countries. Denmark acts as “hydro-firming”system for the Nordic system:Nordel is strongly hydro-based and exports large amountsof electricity in wet years, but purchases fossil-generated electricity from Denmarkduring dry years.
99
TWh
Oil
Gas
Coal
Other*
Hydro
0
10
20
30
40
50
60
1975 1980 1985 1990 1995 2000 2005 2010
Figure 24Electricity Generation by Source, 1973 to 2010
* Other includes solar, tide, wave and ambient heat used in heat pumps.Sources: Energy Balances of OECD Countries, IEA/OECD Paris, 2000, and country submission.

According to Danish statistics,electricity production from the country’s 19 “central”power stations amounted to 21.2 TWh or 62% of the total in 2000. Hundredsof local CHP plants contributed 8.5 TWh or 25%, wind 4.4 TWh or 13%, andhydropower the very small remainder of 0.029 TWh. Total installed capacity was8 257 MW of “central” power plant capacity, 2 372 MW of local CHP, 2 418 MWof wind turbines and 10 MW of hydro.
District Heating and CHPDistrict heat is supplied by some 400 district heating companies, and today accountsfor approximately 50% of Denmark’s heat demand, compared to 30% in 1980. Mostof the companies produce and supply the heat, but some purchase heat from one ofthe “central” power plants. The average connection rate in district heating areas is82% and is still increasing. The district heating network supplies heat not only tolarge consumers, apartment blocks and institutions but also to a large extent tomodern single family houses. Danish district heating companies are owned either bythe municipalities, particularly in the major cities, or by local consumer co-operativesor foundations. In 1996 average distribution losses were 20%.
In 1980, 68% of district heat production was from oil, 18% was from coal and14% was from renewables. Natural gas was phased in from the beginning ofdomestic gas production in 1984, and coal began to substitute for oil. In 1999,35% of district heat production was from renewables,28% from gas,30% from coaland 7% from oil.
In 1999, almost 80% of all district heat was produced from CHP plants, up from justunder 40% in 1980. Almost 50% of electricity generation was from CHP in 1999,compared to just under 20% in 1980. Twelve of the 14 largest power stations inDenmark deliver all or part of their surplus heat to a district heating network.Nearly all large-scale power plants are located close to major cities. This and thefact that 80% of the population lives in urban areas allowed the combineddevelopment of district heating and CHP. The conditions for industrial CHP wereless favourable as Danish industry is dominated by small and medium-sizedcompanies with relatively low energy demand.
The first steps in the development of CHP were taken in Copenhagen at thebeginning of the twentieth century. In 1904 the first CHP plant was commissioned,supplying heat and electricity to a hospital. By the mid-1930s the Copenhagendistrict heating network was well established, even though heating was to a largeextent still provided by coal-fired boilers or small individual coal-fired burners. Thefirst plant specifically designed for CHP was commissioned in 1934. The heatplanning process, initiated in 1979, aimed to increase the share of co-generation inthe district heating supply system and to promote natural gas. Through the heatplan, the cities were divided into areas suitable for district heating and areas moresuited for individual supply of natural gas. The heat plan shielded district heatingfrom inter-fuel competition from natural gas and electric heating.
100

101
GERMANY
SWEDEN
NORWAY
North
Sea
North
Sea
Centralised public electricity plant
Decentralised public CHP-plant
Small-scale hydro
Autoproducer CHP0 50 100
Km
Bornholm
Figure 25CHP Plants, District Heating Plants and Industrial Autoproducers
in Denmark, 2000
Source: Danish Energy Agency.

Today, ten major cities have city-wide district heating systems where almost all ofthe heat (95 to 98%) is produced in large coal-fired or gas-fired CHP plants andwaste incineration plants,with a number of small oil-fired or gas-fired heat-only unitsfor peak-load and emergency. Since the early 1980s, no new power plants havebeen commissioned unless provided with the ability to perform CHP and to supplyheat to the district heating networks. This was motivated by environmentalconcerns and the wish to encourage energy efficiency. Construction of newelectricity-generating capacity must be justified by the need for new heatproduction capacity.
In addition to the large-scale CHP and district heating units, a large number of small-scale CHP plants exist. In Denmark,“small-scale”CHP designates CHP plants outsidethe centrally supplied areas, i.e. the larger agglomerations. The largest small-scaleCHP plant has an installed electric capacity of 99 MW. However, most of the plantsrange between capacities of 0.5 to 10 MW and supply heat to small communitiesand institutional buildings. Often the plants consist of more than one CHP unit.Small-scale CHP plants not connected to a district heating network rarely exceed anelectric-capacity of 1 MW. Small-scale CHP plants are laid out to cover at least 90%of the local heat demand. The electricity generated is sold to the public grid.Power utilities are obliged to purchase the electricity from these plants. The mainfuels used in small-scale CHP are natural gas and waste,and, to a lesser extent,biogasand other biomass.
Small-scale CHP received government support through a 1986 parliamentarydecision, adopted by the power utilities, to establish 450 MWe of small-scale CHPusing indigenous fuels (natural gas,waste,biogas or biomass). The first phase of theprogramme covered 80 to 100 MW of demonstration plants; these were toexperiment with a wide range of technologies and plant configurations. Inconnection with the presentation of the Energy 2000 plan in 1990, a moreambitious programme for small-scale CHP was put forward. To accelerate theestablishment of small-scale CHP, a state subsidy was introduced in 1992 for powerproduction from waste incineration, natural gas and renewables used in small CHPplants. The subsidy originally amounted to 10 øre per kWh but has been reducedto 7 øre per kWh, except for plants smaller than 3 MW.
The development of small-scale CHP peaked in 1994-1995. About 80% of theinstalled capacity (< 25 MW) is based on natural gas boilers, 16.5% are gasturbines and 3.5% are biogas-fired boilers. Most of the installed gas boilers havean electric capacity in the range of 0.5 to 4 MWe whereas gas turbine unitstypically range in capacity from 4 to 25 MWe. There are more than 60 biogas-fuelled CHP plants, supplying heat to either the local district heating network orsupplying a single farm. The electricity is fed into the national grid. The totalinstalled electric capacity is now approximately 20 MW with only a few facilitieslarger than 1 MW.
The feed-in tariffs for local CHP equal the purchasing utility's own long-termmarginal cost (avoided cost). Danish electricity feed-in tariffs are based on a three-tier tariff system, with tariffs reflecting electricity demand patterns (low, medium
102

and high tariff periods). The resulting heat price from small-scale CHP is verysensitive to variations in the gas price, but less sensitive to changes in interest ratesand investment costs. As a result of the support measures, the capacity of local CHPwas 3.4 times as high in 2000 as it was in 1993, whereas “central” power capacityremained stable20.
Industrial CHP is used in industries with high demand for process heat, especiallythe petrochemical, wood and paper industries. The food industry and greenhousescan also use low-pressure steam or hot water from CHP. In 1990, Denmark hadabout 20 industrial CHP plants, mainly coal or oil-based boiler or steam turbineunits. However, the penetration of industrial CHP in Denmark remained low before1992, largely owing to the low energy intensity of the Danish industrial sectorcompared to industry in neighbouring countries.
In 1992, an industrial CHP programme was launched. Its objective was to realisethe potential for industrial CHP, which was estimated at an additional 400 MW.Under the programme, investment subsidies were introduced for industrial energyefficiency measures, as was a bonus system for electricity production from gas andbiomass in combined heat and power production.
Following the introduction of the first “green” tax package in 1991, industrialcompanies could obtain state grants of up to 30% of investment costs in energyefficiency, including CHP. This provision is still in force. In special cases, small andmedium-sized enterprises can obtain 40% coverage of the investment of industrialCHP plants from the government. However, a time limit of six years has now beenset for the subsidy to industrial plants.
As a consequence of the support measures, the number of industrial auto-producers rose to more than 100 by 1997. The total potential for industrial CHPwas reassessed in 1995 to be 750 MW. In 2000, installed capacity was more than300 MW and electricity production from industrial CHP was about 8% of totalpower generation. Industrial CHP is almost exclusively based on natural gas, but afew biomass-fuelled plants have been commissioned.
The government plans to develop CHP further in future. The Energy 21 programmeof 1996 set a number of CHP-related targets for the long run (to 2030), which arestill in force:
■ The bulk of future heat and electricity consumption is to be covered by CHP.
■ Individual gas-based heating systems are to be converted to CHP-based districtheating.
103
20. Taking into account retirement of old plants and the start-up of approximately 1 340 MW ofnew capacity to replace them between 1997 and 2001, including the 540 MW Avedøre-2 plantin 2001.

104
Bornholm
0 50 100
Km
GERMANY
SWEDEN
NORWAY
North
Sea
North
Sea
Wind turbine
Capacity ultimo 2000: 2417 MW
Number of wind turbines ultimo 2000: 6200
Figure 26Wind Turbines in Denmark, 2000
Source: Danish Energy Agency.

105
■ Industrial CHP and mini-CHP are to be developed to a total capacity of 1 400 MWor approximately 10% of total public electricity-generating capacity in 2000.
■ Coal use in power plants is to be phased out.
■ Electricity from renewable energy sources, excluding large hydro and electricityfrom waste, is to account for 20% of power generation by 2003 and 79% by 2030.
Wind PowerDenmark has about 5 700 individual wind turbines installed on its territory. With12.6% of total gross power generation, Denmark has the highest wind share of anycountry. Denmark alone accounts for half the world’s wind power generation, andDanish wind energy technology is exported to some 40 countries, includingGermany, Spain, the United States, Italy and Sweden.
Unlike in other countries, e.g. in California, Danish wind turbines are not in largeclusters or wind farms, but are often scattered individually across the landscape.More than 80% of the turbines are owned by individual farmers or wind energy co-operatives. Some 150 000 Danish families own wind turbines or shares in wind co-operatives. The development of wind capacity was particularly rapid between1993 and 2000,when installed wind turbine capacity quintupled to 2 417 MW. Thisdevelopment is the result of vigorous government support. Figure 26 shows thelocation of wind turbines in Denmark. The government’s objectives and supportmeasures are discussed in detail in Chapter 5.
ELECTRCITY MARKET REFORMAs energy market operation and environmental objectives are very closelyintertwined, electricity market reform in Denmark necessarily relates to bothareas. In fact, the complete set of legislative changes comprises five new acts,adopted by the Danish Parliament on 28 May 1999. The most importantprovisions of these acts will be discussed in the three following sections. Thefive acts are:
■ The Electricity Supply Act (Act No. 375).
■ The Act on CO2 Quotas for Electricity Production (Act No. 376).
■ The Act to Amend the Act on Subsidies for Electricity Production (Act No. 377).
■ The Act to Amend the Act on the Utilisation of Renewable Energy Sources (ActNo. 378).
■ The Bill to Amend the Heat Supply Act (Bill No. 379).

Reform ProcessReform of the Electricity Supply ActIn Denmark, the transition towards a more market-based approach was first initiatedby the adoption of an amendment to the former Electricity Supply Act by theParliament in May 1996. The purpose of the amendment was to introducecompetition in Denmark while ensuring that the electricity industry would fulfil theobligations of the Danish government, in particular those relating to protection ofthe environment. The amendment entered into force on 1 January 1998. The mainparts of the EU Electricity Directive were included in the Electricity Supply Actthrough this change. On 11 February 1999, the Ministry of Environment and Energyissued a decree to ensure that all electricity-generating companies could negotiatenetwork access to purchase or sell electricity. This decree entered into force on19 February 1999, and with these two actions, the Danish power market wasgoverned by legislation technically compatible with the EU directive.
However, the electricity supply companies and the government saw a need to furtheradapt the Danish power industry, and therefore a new Electricity Supply Act wasadopted (Act No. 375 of 2 June 1999) that entered into force on 30 December 1999.This act reflects an agreement reached on 3 March 1999 between the Danishgovernment and the large majority of the political parties represented in the DanishParliament concerning the future regulation of the electricity sector. An addendum tothis agreement on the conditions for introducing competition in the electricity sectorwas concluded between the political parties on 17 November 1999. The ElectricitySupply Act was amended accordingly by Parliament on 17 December 1999 (ActNo. 1100 of 29 December 1999). Most of this legislation has been approved by theEU Commission; approval of the final elements was to be given in spring 2002.
Under these various pieces of legislation and agreements, distribution companiesand final consumers with a site-specific annual electricity consumption above100 GWh per consumption site have been eligible for competition since 1 January 1998.The market share of the final 100 GWh consumers equalled about 5% of the totalelectricity consumption in Denmark at the time. By including distributors withannual sales above 100 GWh, about 90% of the market was opened to competition,although not at retail level. The eligibility thresholds are being reduced gradually.Since 1 April 2000, final customers consuming 10 GWh or more per year have beeneligible. On 1 January 2001 the threshold was lowered to 1 GWh. On 1 January 2003,all final consumers will become eligible. Hence, the market opening in Denmarkgoes beyond the requirements of the EU directive.
The Electricity Supply Act provides that electricity generation, ownership of thetransmission grid, operation of the transmission grid, distribution and supply mustall be organised in separate legal entities. Activities not related to electricity mayonly be carried out via independent companies organised as limited liabilitycompanies, and are thus unbundled. Municipal supply companies need not createseparate companies for power generation through waste incineration, nor for gridactivities. But if all activities are undertaken in one company, it must haveunbundled accounts.
106

The Electricity Supply Act allows the minister responsible for energy to derogatefrom the obligation to install separate legal entities. The minister can:
■ Allow joint ownership and operation of the transmission grid. Unbundling ofthe company’s accounts is still required.
■ Allow joint ownership of the transmission grid and the distribution network,provided the company in question is not involved in the operation of thetransmission grid. Unbundling of the company’s accounts is required.
The amendment to the Electricity Supply Act (Act No. 1100 of 29 December 1999)entitles the minister, before unbundling is undertaken, to permit appreciation of thevalue of the electricity grid compared to the present book value. The reason for thisis that the market value is considered to be much higher than the book value. Thelow book value is due to the provisions in the former Electricity Supply Act, whichallowed for advance depreciation of up to 75% of the grid investment. Theappreciation allows the grid companies to raise loans with security in the grid, andthen inject the capital in the generating companies in order to give them a financiallysound start. This capital injection was considered necessary due to the weakeconomic performance of the production companies. The ultimate cause of thisweak performance was the non-profit obligation of the former Electricity Supply Act.The Agreement of 17 November 1999 between the government and the parties madethis option conditional on merger of Denmark’s eight generating companies into twocompanies, one in the western part of Denmark and one in the eastern part.
An independent regulator, the Energy Regulatory Authority (Energitilsynet) wasestablished to replace the former Electricity Price Committee (Elprisudvalget). Theauthority regulates network tariffs, as well as end-user prices in the non-competitivesegment of the market. The Energy Regulatory Authority is appointed by the ministerresponsible for energy. The members must be independent of the energy sector andmust represent expertise in the fields of law, economics, technology, environment,business and consumer interests. The Danish Competition Authority and the DanishEnergy Agency give secretarial support to the Energy Regulatory Authority. Marketparticipants can appeal against the regulatory authority’s decisions to the EnergyComplaints Board,which is also the instance of appeal for decisions taken by the minister.
The Energy Regulatory Authority has seven members, all appointed by the ministerresponsible for energy. The natural gas and heat supply acts provide the legal bases forthe regulator. The regulator can initiate investigations, as can consumers, companiesand public authorities. Its decisions can be taken to the courts, including the DanishHigh Court.
The main regulatory instruments of the Energy Regulatory Authority arebenchmarking of the individual companies against each other, demands to reducecost, and rate-of-return regulation. The regulator controls certain cost componentsof the network companies according to efficiency requirements and an allowed rateof return on capital is applied. Taken together with an estimate of the company’stransmission volumes, this yields a maximum allowable income for the regulated
107

companies. This revenue cap is published at the beginning of the year duringwhich it applies. In 2000, Denmark’s transmission companies had a revenue cap ofDKK 1 405 million, using a 7% rate of return. The distribution companies wereallowed to earn DKK 3 900 million, also with a 7% rate of return.
Reform of the Heat Supply ActThe government also intends to amend the Heat Supply Act. Competition will notbe introduced to the heat supply sector, but the goal of the amendment is to ensurethe continued development of an economic, efficient and environmentallysustainable heat sector with a high degree of quality and security of supply
Competition is excluded from the heat market because the infrastructure in thepublic heat supply plants does not constitute a physically connected grid. Also,local authorities in Denmark have already planned and invested in specific supplysystems on the basis of overall environmental and economic considerations. Thusthe present non-profit principle is retained,while allowing public heat supply plantsto include necessary costs in their prices.
The new element is that the district heating sector will be regulated usingbenchmarking as in the electricity and natural gas sectors. Through this procedure,a revenue cap will be set for each heat plant. If a plant can keep its costs below thecap, it will make a profit. The profit may be set aside or paid back to consumers.An individual price ceiling for heat supplies will be established for waste-fireddistrict heating and CHP plants to avoid transferral of the costs of waste disposal toheat consumers. To retain the non-commercial ownership of the district heatinggrid, consumers will have a pre-emptive right to purchase the district heating gridif it is not already consumer-owned. Similarly, the local authorities will receive apre-emptive purchase right to the consumer-owned grid.
The district heating networks that are not locally owned by the consumers or localauthorities are to be unbundled into separate companies. Moreover, the consumersand/or the local authorities are to have a controlling interest in the heat networkcompany. If a supply plant owned by a local authority is sold, any profit is to bereimbursed back to the consumers or deducted from the general state subsidy tothe local authority.
Reform of Government InterventionAs the more competitive operation of the electricity supply industry will graduallyeliminate the scope for command-and-control intervention,the Danish government hasadapted its environmental legislation concerning the power industry. Following arethe most important government interventions in the liberalised power industry.
CO2 quota system. CO2 emissions from electricity generation are regulated througha CO2 quota system (tradable emission permits)21. Existing electricity producers
108
21. For more detail, see Chapter 4.

receive permits in proportion to their historical emissions, but new entrants willobtain permits at no cost. The CO2 Quota Act came into force on 1 January 2001 andwill be in force provisionally until 2003. The political parties have begun negotiationson the quotas to apply after 2003. The new government has announced its intentionto extend the CO2 quota system beyond 2003. The act was approved by the EUCommission in April 2000. No trading in Danish quotas has yet taken place, althoughenquiries have been made.
CHP, district heating and renewables. The Electricity Supply Act itself containsobligations concerning combined heat and power/district heating and renewables.These obligations have been approved by the European Commission. They are:
■ An obligation for electricity enterprises to purchase the electricity from small-scalecombined heat and power plants and renewable-generated electricity at fixed prices.The final consumers are subsequently obliged to purchase their proportional part ofthis electricity, thus covering the costs for the electricity companies.
■ An obligation to purchase electricity from other CHP plants supplying districtheat, to the extent that the electricity cannot be sold at cost-covering prices. Asabove, final consumers are subsequently obliged to purchase their proportionalpart of this electricity.
■ An obligation for all consumers to buy renewable (“green”) energy certificates22
as a way of giving financial support to producers of electricity from renewableenergy sources. It has been decided to postpone this system until 2002.Until then, the current system continues, as set out in the first obligationabove.
Biomass. On the basis of an agreement dating back to 22 March 2000, biomass isto be used as input fuel at several large power plants. This includes supplementaryfiring with straw at the Studstrup plant, pure straw-firing at the Amager plant andfiring with wood chips at the Avedøre and Herning plants. In addition to this, a finaldecision is to be taken before the end of 2004 on burning a further 150 000 tonnesof straw annually. The government has decided that biomass should also fall underthe new system of “green” certificates.
Market Outcomes Following the ReformsGeneration The introduction of competition has had a strong impact on the generating side ofthe Danish power industry. Whereas in 1998, Denmark had eight major powergenerators, only two were left in 2001, Elsam A/S in the western part of Denmarkand Energi E2 east of the Great Belt.
109
22. See Chapter 5 for a discussion of the certificates system for renewables.

Among the various agreements that formed part of the deregulation process inDenmark, two agreements had particular importance for the industry’s structure.These two were the agreement of 28 October 1999 between the government and thepower utilities and the agreement adopted on 17 November 1999 by the politicalparties as an amendment to the new Electricity Supply Act. Both agreements wereconcluded with the intention of allowing power utilities to restructure to the extentnecessary and prepare for competition. On the basis of these agreements, the sixpower utilities in the western part of Denmark commenced negotiations to form onecompany. The new, merged company Elsam A/S was formed on 22 June 2000 withretrospective application as from 1 January 2000. All values and obligations of themerged firms were transferred to the new company on that occasion. The agreementbetween the government and the power utilities runs for four years until the end of2003 when Elsam A/S will operate under ordinary market conditions. The sharecapital of Elsam A/S is DKK 2.0 billion. Elsam’s shares were distributed among theelectricity distributors that owned Elsam’s predecessor companies in proportion tothe value of the firms before the merger.
Elsam is currently undergoing a restructuring process, and is reviewing its positionon the Danish power market. As part of this process, Elsam has decided todiscontinue its business of selling electricity to final customers in the western partof Denmark. Elsam’s end-customer contracts were transferred to Helia A/S, at thatpoint owned by Elsam and the Swedish company Öresundskraft AB. Elsam hasmeanwhile sold its stake in Helia. The company is now concentrating its efforts onexpanding its trade in electricity on the wholesale market. Elsam’s new customersare trading companies or other players in the market selling to end customers.
Elsam owns and operates 3 491 MW of “central”power plant capacity and has 166 MWof wind capacity and 267 MW of local units in addition. Once established,Elsam foundthat it had excess generation. This is brought about by the continued expansion ofrenewable energy facilities. It results in an elevated need to export electricity, inparticular during winter nights, when CHP plants run to capacity owing to the highheat demand,but when electricity demand is comparatively low. According to Elsam’sestimates, the excess totals about 2.5 TWh per year. This non-controllableoverproduction is sold on the wholesale power market at a price far below the priceElsam pays for production. Elsam is trying to identify solutions to the problem so thatthe electricity can find a domestic use, for instance to produce heat.
The other newly formed electricity-generating company is Energi E2. Energi E2 wasformed from a merger of the two pre-existing power utilities in Zealand and Lollandin 1999. The company owns and operates 4 100 MW of capacity in Denmark andowns 200 MW of hydropower in Sweden. Like Elsam, Energi E2 is owned by themunicipalities and distribution companies that owned its predecessors.
Transmission and TradeDenmark has 166 750 km of high-voltage lines, of which 6 050 km are 400 to132 kV. As noted above, the Danish transmission system is operated by two separategrid companies,Eltra and Elkraft Transmission. They were formed as a consequence
110
of the Electricity Supply Act (Act No. 486) of 1 January 1998 and the EU ElectricityDirective. Both Eltra and Elkraft benefit from a natural monopoly position asowners and operators of public infrastructure facilities, and have been granted long-term concessions issued by the Danish Minister for Environment and Energy underthe Danish Electricity Supply Act of 31 May 1999. Their systems are not directlyinterconnected. But since both are connected to the Nordic market, indirect powerexchanges are possible. A cable connecting both Danish systems has been underdiscussion for a long time, but no firm plans exist to construct it.
Eltra is the owner and operator of the high-voltage transmission grid and thetransmission system operator in the western Danish electricity system. Eltra isjointly owned by 48 western Danish grid companies which, in turn, are owned bylocal authorities or consumer co-operatives in Jutland and on Funen. The companywas founded on 13 November 1997. On 1 January 1998, Eltra took over I/S Elsam'stransmission networks and its activities and responsibilities regarding the network.On 1 January 2000, Eltra became a limited liability co-operative with the previouspartners as members.
Eltra plans, engineers, constructs and maintains the primary (400 kV) high-voltagenetwork that forms the backbone of the system. Eltra is also responsible for theoverall security of supply in Jutland and on Funen. Eltra bears the responsibility fordeveloping environmentally benign electricity generation and incorporating it intothe system. Eltra is currently undertaking an effort to reconstruct and restructure theJutland-Funen transmission network as a whole. One reason for this is that there is aninternal transmission bottleneck in Jutland. This bottleneck has existed for years butmust be removed owing to the greater amount of power trade from competition.
The ever-increasing local electricity production from wind turbines and localcombined heat and power units also places special requirements on the strength ofthe network. The CHP plants are not subject to central load dispatching and are runaccording to their heat load, not electricity requirements. In winter, this means thatall CHP plants must be dispatched first, regardless of their location on the grid – ortheir price that is fixed at above-market rates. Wind is an intermittent resource butalso enjoys this “priority”23 dispatch. End-users are obliged to buy “priority”production from their local grid company. Eltra has only one generator on its gridthat is not prioritised and can be dispatched according to its price bids. Theportion of “priority” electricity generation in Jutland amounts to 40%. Therefore, itis often necessary to transport large amounts of electricity over long distances.
As a consequence, Eltra has had to reinforce the 400 kV network in the middleand eastern parts of Jutland and on Funen. Major progress was made in 2000,when the construction of a new 400 kV connection between the power stationVendsysselværket (Aalborg) and Trige (Aarhus) was approved, but some furtherlines must still be constructed before the Eltra service area is sufficiently secured.
111
23. The priority system requires that renewables and CHP must be dispatched first,regardless of their price.Inother words, when the wind blows and the wind turbines generate electricity, the network utility has topurchase this electricity even if it has to take cheaper fossil-fired power plants off the grid as a consequence.

The oldest part of the network must be also be renovated and upgraded tomaintain and/or increase transmission capacity.
Eltra operates the synchronous interconnection of the Danish system with Germany(1 200 MW maximum capacity) and the DC sea cables to Sweden (Konti-Skan,600 MW) and Norway (Skagerrak cable, 1 000 MW). When the market was firstopened for competition, the Skagerrak cable to Norway and the interconnection toGermany were largely tied up by old supply contracts and not available forcompetitive spot trading. Imports from NordPool were limited by grid congestion.
Meanwhile, the entire transmission capacity to Sweden and Norway was madeavailable for spot trading with NordPool. As noted above, power exchanges withthe Nordic system depend to a large degree upon the relative prices of hydro-basedgeneration versus fossil generation that are, in turn, heavily influenced by rainfall inNorway and Sweden. Therefore, the trade volumes are highly variable. In 2000, theEltra region imported 4.488 TWh (net) from Norway and 0.365 TWh from Sweden,and exported 5.152 TWh (net) to Germany. The transmission capacity across theDanish-German border is administered in co-operation with the German gridcompany E.ON Netz in annual, monthly and daily auctions of capacity. Registeredmarket players can make reservations for trade across the border.
Elkraft Transmission is the owner and operator of the high-voltage (400 kV)transmission grid in the eastern part of Denmark, including the island of Bornholm.It owns and operates the interconnections of that area with Germany and Sweden.Elkraft System is the system operator. Both companies were created on 1 January2000 out of Elkraft A.m.b.A. Elkraft Transmission and Elkraft System are owned byten eastern Danish grid companies, which, in turn, are also majority-owned by localauthorities or consumer co-operatives. The owners are Nesanet A/S, the gridsubsidiary of Denmark’s largest distribution and supply company, CopenhagenEnergy; SEAS Transmission A/S; NVE Net A/S; Frederiksberg Elnet A/S; HillerødElforsyning; Helsingør Elforsyning; Roskilde Netvirksomhed; Nykøbing SjællandsEl-Net and SKE-Net A/S. In principle, Elkraft System functions independently fromcommercial interests, including its owners and Elkraft Transmission. But itsorganisation is shared with Elkraft Transmission.
Elkraft System is responsible for both short-term and long-term security of supply inthe main electricity supply system and for system development within theframework set by the government. Elkraft also has a significant share of “priority”production from wind turbines and other renewables, as well as small-scale CHPplants. For the winter season 2001/02, a share of 35% to 37% “priority” productionwas expected on Elkraft System’s grid.
Elkraft’s interconnection with Sweden is located in Helsingør and consists of fourAC links – two 400 kV cable connections (established in 1973 and 1985 respectively)and two 132 kV cable connections (established during the period 1951 to 1964)with a total capacity of some 1 900 MW. The link with Sweden also serves as aconnection with the Nordic grid. Bornholm is linked to southern Sweden by a60 kV cable with a transmission capacity of 60 MW. The link with Germany,Kontek,
112

is a 400 kV DC interconnection with a transmission capacity of 600 MW. Theconnection was established in 1995 in co-operation with VEAG of Germany. ElkraftTransmission owns the Danish AC/DC converter station at Køge and the DC cablefrom Denmark to the German coast. The Elkraft System area imported 1.382 TWh(net) from Sweden in 2000, and exported 0.444 TWh to Germany.
Thus, Denmark is relatively strongly interconnected with its neighbouring countries,with combined interconnector capacity about level with peak-load. However, trade isless than this favourable situation may suggest, largely because of bottlenecks insideDenmark (especially in Jutland) and in southern Sweden. Also, Sweden levies aborder tariff of 2 øre per kWh. This is regarded as a real impediment to electricitytrade with NordPool by Danish utilities, who have demanded its abolition. For thisreason, most of the trade between the Eltra area and the Nordic market occursthrough the Skagerrak line linking the western part of Denmark and Norway.
Distribution and SupplyThe number of local distribution and supply companies in Denmark has been inslow decline for more than a decade. At the end of 1999, there were 88 distributorsleft. The concentration process, which is encouraged by the government becauseit increases the economic efficiency of the companies, is set to accelerate in thecoming years.
NESA is the largest power distribution company in Denmark and also the only oneorganised as a joint stock company – although the majority stock is owned by themunicipality of Gentofte. Other shareholders include the County of Copenhagenand Vattenfall AB. NESA’s supply area includes northern Zealand, the municipalitiesin the Roskilde area and most of the municipalities of Greater Copenhagen. NESA'selectricity grid supplies a total of around 533 000 connections, of which about469 000 are residential units. The rest are business enterprises, shops, schools, etc.
Restructuring is taking place in electricity retailing. In 2000, 13 local distributorsformed separate companies for electricity trading and supply, another 62 establishedseven joint supply companies, and only 13 did neither. NESA has announced anaggressive strategy to acquire smaller vendors throughout Denmark in an effort tobecome a national rather than a regional supplier. The ultimate objective for NESA isto have no fewer than one million customers, or twice the current number. At thesame time,major suppliers in the neighbouring counties are preparing to gain marketaccess. The Swedish utility Vattenfall, which is among the five largest powercompanies in Europe, has declared its intention to acquire 20% of the Danish market.
DemandTable 8 shows the number of consumers who have or will become eligible forcompetition. Of those who were eligible in 2000,86% actually changed their powersupplier. This share is very high in comparison with most other IEA countries,where in the first years following the introduction of competition only a smallminority switched.
113

CRITIQUE The Danish power industry as it exists today has been shaped by relatively heavygovernment intervention for decades. Much of this intervention occurred with theaim of saving primary energy, promoting energy efficiency, enhancing security ofsupply and, above all, protecting the environment from emissions of a heavily fossilfuels-based power industry. Achieving the high degrees of energy conservation andenvironmental protection desired in Denmark required very significant alteration ofmarket results, and very far-reaching intervention. Such intervention cannot occurwithout significant cost.
Altering market results, even at high cost, is perfectly legitimate if it is desired bythe electorate of a democratic country, and if that electorate is well informedabout the choices involved. It should also be free of adverse effects oninternational trade, or at least not put trading partners at a disadvantage. Theseconditions are met in Denmark.
Liberalisation of the Danish power industry was initiated by the European Union,but Denmark embraced the principles of liberalisation rapidly, and has gone beyondEU requirements in terms of market opening. This meant that a large adaptationeffort had to be made. First, liberalisation required revision of some of the morecommand-and-control type measures that had so far been used. With theintroduction of the CO2 quota system and the planned move towards a renewablescertificate system, the Danish government has accomplished a significant part ofthat work. The remaining dirigiste measures certainly affect the attractiveness ofthe Danish power industry to investors but do not constitute trade barriers per se.
Nevertheless, liberalisation has starkly exposed the cost of the past and presentenvironmental policies. There is excess production of electricity. The excessproduction is from “priority” power plants that cannot be dispatched according topower market prices. The part of the market that is governed by price signals is60% in western Denmark and about 63% to 65% in eastern Denmark. The excessproduction is either wind energy, which is intermittent, or it is combined heat andpower, which is driven by the heat load, not the electricity spot market. Generatorshave a certain leverage to shift the production of their plants towards electricity, or
114
Table 8Eligible Electricity Consumers in Denmark
Date Eltra Supply Area Elkraft Supply Area Total
1 January 1998 2 4 6
1 April 2000 130 76 206
1 January 2001 1 482 762 2 244
1 January 2003 1 600 000 1 400 000 3 000 000
Source: Dansk Energi.

towards heat. But generally speaking, if the plant runs at full regime, it will producemuch electricity and much heat simultaneously. Cold, windy winter nights, whenwind generation and heat production are high but power demand is relatively low,lead to vast excess generation. The utilities must sell this generation at a very lowprice. In fact, in a market functioning in such situations, the price might have tobecome negative – the generator might have to pay somebody to get rid of the excesselectricity. But Danish utilities have to buy this generation at the long-term marginalcost of a new power plant, with the corresponding effect on their profitability.
“Priority” production also results in a considerable amount of uncertainty forelectricity producers, traders and consumers because of the complexity of the“priority” system. In fact, very large amounts of intermittent or non-dispatchablegeneration cause external costs, and these have to be factored into energy prices inthe same manner as environmental externalities.
The current situation is not sustainable in the long run, and the government willhave to find solutions to this problem. Greater trade in the Nordic market and withGermany might help, but it will not entirely solve the issue, particularly as furtherexpansion of the wind and CHP capacity is planned. Technical solutions, such asturning the excess electricity into heat, are under consideration. The governmentmight even have to consider giving up its ban on electrical heating. Thegovernment has set up a working group to propose sensible uses for this over-production. Rapid and effective solutions are needed if the planned environmentalpolicies are to be implemented, while protecting Danish generators frombankruptcy. Also, the benefit that ultimate consumers will gain from powerderegulation – notably lower prices – will be limited, as electricity prices are higherthan they could be owing to the need to finance renewables and CHP,and taxes willhave to remain high so as to limit electricity demand.
Like the Danish gas industry,the electricity supply industry bears the marks of its earlyorganisation in the form of consumer co-operatives and small municipal utilities.These organisational forms may have been appropriate when electricity was new. Butat the beginning of the third millennium, the power industry has become very large,and operates under a more or less competitive regime in most IEA countries – and invirtually all countries surrounding Denmark. Today, power companies must be ableto draw on all options open to commercial companies, or risk collapse. The currentownership structure and the restrictive regulations appear to limit power companies’ability to make use of the business opportunities provided by liberalisation. Theseinclude asset sales and equity injections and the possibility to set aside profits forfurther investment. The ownership structure of electricity distribution and supplyshould be adapted to the new market environment. The amendment to theElectricity Supply Act shows that the government and the majority of the parties andmarket participants are aware of these issues. A gradual process of restructuring thatwill eventually eliminate part of the problem has been set in motion. Whether this issufficient or whether bolder government action is needed remains to be seen.
Apart from reconciling electricity deregulation and a very high degree of environmentalprotection, the Danish electricity market has made significant progress. By opting for
115

legal unbundling rather than accounting unbundling in most cases, Denmark has gonebeyond the requirements of the EU Electricity Directive. The existing interconnectionswith the surrounding countries are gradually being opened up for competitive trade,andwholesale power prices in Denmark show comparatively little variation from NordPoolspot prices, except during needle peaks. The number of power generators, suppliersand transmission companies has decreased through mergers. Considering the largenumber of companies in a very small market, this probably entailed large cost savings.Most companies were far below their optimal size,especially in distribution and supply.
That said, it is important not to let this development go too far. There is a large degreeof vertical integration through ownership ties going from municipalities to distributorsto generators and the transmission companies, and there are now only two largegenerators left. While this was necessary to put the Danish power industry on acommercial footing, competition from abroad is vitally important. The governmentshould work towards further opening of the interconnections and removal of theSwedish border tariff for electricity. The wholesale market needs continuingmonitoring and evaluation by the authorities and the reduction of infrastructurebottlenecks within Denmark. According to the most recent information, the twotransmission companies are already undertaking such work. There also should be a co-ordinated approach to the removal of bottlenecks in the Nordic transmission system.
RECOMMENDATIONS
The Government of Denmark should:
■■ Strive to increase competition by:• Working towards further opening of Denmark’s interconnection with other
countries for competitive power trade, especially spot purchases.• Encouraging the removal of internal bottlenecks in the transmission system
and striving for a similar approach in Nordel.• Encouraging more market-oriented behaviour among power companies, and
especially among small distribution and supply companies.• Encouraging the transformation of consumer co-operatives into commercial
companies, and facilitating the privatisation of municipal utilities.
■■ Through the Competition Authority,monitor the electricity market and deal withabuses rapidly.
■■ Continue to adapt the environmental policies aimed at the power industry to therealities of competition.
116

8
ENERGY RESEARCH AND DEVELOPMENT
PRIORITIES, INSTITUTIONS AND FUNDING The overall objective of the Danish Energy Research Programme (ERP) is to contributeto the realisation of Danish energy policy goals. These goals are laid down in the 1996Energy 21 programme and follow from Denmark's commitment to reduce itsemissions of greenhouse gases. Priority areas of energy R&D were also laid down inthe Energy 21 programme. They still apply and include as major points:
■ Renewable energy technologies. Special emphasis is given to wind energy andbiomass, and in particular to the new areas of offshore wind turbines andcombined heat and power production based on biomass.
■ Energy conservation and increased energy efficiency. This includes both energy-efficient technologies and research on the interaction between behaviour,lifestyles and energy consumption.
■ Integrated technologies and systems. The focus of this programme is to optimiseenergy systems with complex consumption and supply structures by usingcontrol technologies, methods of process optimisation, etc.
The priorities of publicly-funded R&D are decided by the Danish Energy Agency onthe basis of advice from the Advisory Council of Energy Research (ACER). For eachpriority area, an advisory subcommittee is appointed to provide detailed input toDEA and ACER. These subcommittees take an active part in the evaluation ofproject proposals and make recommendations concerning their support to theDEA. Members of the subcommittees are persons from companies, researchinstitutions and universities.
Funding for energy research activities is provided mainly by the ERP and theDanish Development Programme on Renewable Energy (DPRE). Publicly-fundedresearch is carried out at the Risø National Laboratory, at the technical universitiesand technological institutes, and by private companies. Following liberalisation ofthe electricity market in 1999-2000, development of technology for electricityproduction and distribution is now financed in part by a fee on electricity salesunder the Public Service Obligation (PSO) arrangement, in place of direct fundingby the utilities. Although the funding of the ERP has remained static and is forecastto decline in 2002 to DKK 100 million, other project funding mechanisms are nowavailable, including the Public Service Obligation (DKK 100 million), the electricityend use R&D requirement (DKK 20 million) and specific initiatives to supportshort-term projects in hydrogen, wave energy, photovoltaics and electricalinsulation materials.
The various funding possibilities are evaluated on a regular basis. To mention one,the effects of ERP have been assessed in an evaluation of the overall programme.
117

Furthermore, questionnaires have been sent to ERP project leaders finalisingprojects in the years 1999 and 2000 to assess the utilisation of results. In somecases, evaluations of specific priority areas are carried out. An evaluation for oiland gas was carried out recently. An evaluation of the development programmefor renewable energy was also completed recently, as was an evaluation of thehydrogen programme.
The budget for the hydrogen programme in 1997-2000 was DKK 20 million. Anadditional DKK 41.5 million has so far been allocated for 2001-2004. Theprogramme has been dedicated to practically-oriented R&D and technologydemonstration projects with some emphasis on the transportation sector. Theprogramme focuses exclusively on hydrogen produced from renewable energysources and on the integration of hydrogen technology in renewable energysystems. The evaluation of the hydrogen programme for the period 1997-2000yielded the following results:
■ The programme was found to be unique in its approach compared to otherinternational hydrogen programmes because of its practical approach and itsexclusive orientation towards utilisation of renewables.
■ Nevertheless, practical results were found lacking for some projects owing toproblems with delivery of the appropriate ”practically-oriented” equipment.
■ The programme stimulated Danish enterprises to get involved in thedevelopment of different components for hydrogen systems.
■ More comprehensive information regarding the results of the programme andscenarios for possible future large-scale renewable energy systems/hydrogenenergy systems were recommended to improve private-sector involvement inhydrogen technology.
■ Full-scale demonstration projects were still expected to be expensive. TheDanish programme was considered valuable in stimulating internationaltechnology co-operation in the development of hydrogen systems.
■ The assessment of the development project part of the DPRE with focus onthe period 1996-2000 identified a range of projects where good resultshad been achieved and found that the total DPRE budget was sufficient toensure support for a large number of qualified projects. But it also stated aneed to strengthen the co-ordination with other (including new) R&Dprogrammes – i.e. the ERP and PSO programmes. According to theassessment, full integration of the ERP and the DPRE should maintain theunique characteristics of the DPRE.
The Energy Research Programme (ERP) finances R&D in energy priority areas. Atpresent there are six priority areas: oil and gas; environment-friendly production ofpower and heat; wind energy; energy efficiency in buildings; energy efficiency inindustrial processes; and social science projects.
118

Projects outside these priority areas may be funded if they are found to be of specialimportance. DPRE typically finances smaller development and demonstrationprojects concerning renewable energy. Priority areas are biomass, wind energy,solar heating, photovoltaics and heat pumps.
Additional funding has been channelled to specific priority areas in recent years.These include development and demonstration of hydrogen technology, integrationof photovoltaics in buildings, wave energy, etc. Subsidies available for energyconservation initiatives in industry can also be used to fund development anddemonstration projects in industry (called UD projects).
A small Public Service Obligation fee levied on electricity production is used tofinance R&D in biomass and wind energy. Fuel cells, wave energy, and theintegration of photovoltaics in buildings are also supported under the PSO scheme.These activities are R&D projects initiated and carried out by the transmissionsystem operators responsible for the operation of the power transmission grid. Theprojects must involve technologies that aim at environmentally benign powerproduction. To discourage free riding, the technology must not be commerciallyviable without such support. The companies are allowed to finance their costs bylevying a fee on electricity consumption.
Private companies carry out R&D in a number of areas (e.g. oil and gas, fuel cells,superconductors, and wind energy) and also take an active part in the ERP. Allresearch programmes and projects except those initiated by private companies andby transmission system operators are administrated and co-ordinated by the DanishEnergy Agency. The transmission companies Eltra and Elkraft System administer thePSO-financed programmes. However, their priorities and actual project fundinghave to be approved by the DEA.
DETAILED ENERGY R&D ACTIVITIES
Energy Efficiency and Fuel UseR&D in this category is supported by the ERP in the priority areas of energyefficiency in buildings, energy efficiency in industrial processes and “energy andsociety”. Development and demonstration are supported under the scheme forsubsidies to energy conservation initiatives in industry (UD projects). R&D iscarried out at the public research institute for buildings (SBI), at the technologicalinstitutes and by private companies.
Fossil FuelsR&D in this category is supported by the ERP under the priority area oil and gas.Furthermore, R&D is carried out by the Danish geological research institute GEUSand private oil companies. There is no research on coal, as Denmark has decidedthat for environmental reasons there will be no new coal-fired power plants.
119

Renewable EnergyR&D in this category is supported by the ERP under the priority areas ofenvironmentally benign production of power and heat, and wind energy. Theseefforts are co-ordinated with the funding of activities under DPRE. This type ofproject is also subsidised by the PSO fee. In addition,DPRE supports demonstrationof heat pumps. Further initiatives involve demonstration of wave energy, hydrogenprojects and the integration of photovoltaics in buildings.
Nuclear Fission and Fusion Various parliamentary decisions and pieces of legislation have established thatnuclear fission will not be used for power production in Denmark. Thegovernment has recently decided to shut down the nuclear fission researchfacilities at Risø National Laboratory. However, Risø National Laboratorycontinues to participate in international collaboration on nuclear fusion in thecontext of the EU.
OtherR&D in fuel cells is subsidised under the ERP and PSO programmes whereas R&Din superconductors is subsidised only under the ERP. In future, research onelectricity system technologies, distribution and grid interconnection may besubsidised under the ERP.
CRITIQUE The ERP was reviewed in 1997 in the course of the IEA’s last in-depth review, andagain in 1998 by an international team brought together by the IEA. There has sincebeen evident progress in implementing the findings and recommendations, inparticular of the 1998 IEA review. The structure of the ERP has been revised. Amore limited number of programme areas have been selected for future governmentsupport: six priority areas matching the key goals of Danish energy policy nowreceive funding. Administration of the ERP and DPRE programmes has beenmerged into a division for renewable energy and energy research within the DanishEnergy Agency.
There is a well-defined co-ordination and allocation structure linking the PublicResearch Council of the Ministry of Environment and Energy with the AdvisoryCouncil of Energy Research (ACER) and six committees of professionals overseeingproject review and funding. Membership from government, industry and researchcommunities is balanced, and guidelines are in place to address conflicts of interest.Collaboration with industry has been strengthened with a view to concentrating onlong-term development. A long-term strategy for future activities is underpreparation. Despite this very positive development, further attention could bepaid to:
120

■ Completing a comprehensive energy research policy and strategy to focusresearch on priority areas and take full advantage of domestic and internationalprogramming.
■ Road-mapping in areas of strategic energy importance and industrialdevelopment potential.
■ Inter-agency co-ordination, co-financing and communication.
■ Fully integrating the ERP and the Development Programme on Renewable Energy(DPRE).
■ Enhancing the commercialisation of resulting technology, which should includemore active engagement of the Ministry of Economic and Business Affairs.
■ Applying more rigorous stage-gating (go/no go project tracking process) toindividual projects.
■ Implementing a results-based management system which measures and monitorsoutputs, outcomes and impacts of project investments.
■ Avoiding duplication of commercial activities, notably in the wind industry.
Denmark has long had world-class technology in wind turbines, coal and biomasscombustion, especially in CHP plants, and in district heating. Although the ERPfunding is secured in principle, there are signs that the country’s ability to maintainthis position may decline in future as a result of changes in the energy market andin energy policy. For example,Denmark has decided not to build any new coal-firedpower plants and hence not to spend money on coal R&D. As a consequence,Denmark’s leading role in this area is likely to erode, and there will be no domestictechnical capacity to re-power or retrofit coal plants as a contingency option.
In response, the Ministry of Information Technology and Research has launched aninitiative to develop and finance centres of excellence linking education, research,industry and facilities and equipment renewal. This is to be encouraged, and directrepresentation of that ministry on ACER could develop positive synergies.
The oil and gas industries have well-funded in-house and collaborative programmesthat are adequate to meet the needs for technological advances that are already builtinto forecasts of reserves and production. Government funding in the ERP and theGeological Survey (GEUS) could focus on developing independent information forpolicy and regulatory purposes. The Danish Natural Gas Technology Centre is wellstructured to address technology for end use of natural gas.
With electricity restructuring, there has been a decline in R&D investment byelectricity producers, who now focus on near-term commercial and operationalissues. The funds raised through the PSO can be used to carry out research onelectricity production issues, such as the production of heat and electricity from
121

municipal wastes and biomass. Roles, responsibilities, identification of priorities,co-ordination and communication should be clarified and improved between theelectricity system operators administering the PSO and the Danish Energy Agency.This applies similarly to the electricity end-use R&D requirement. Given theexpected importance of biomass in Denmark’s energy future,ACER could considerfocusing on biomass gasification as a potentially cleaner, more flexible and efficientoption for CHP.
Denmark’s industrial sector is dominated by small and medium-sized enterpriseswith insufficient resources to develop energy-efficient, low-CO2 technology whileremaining competitive. The strengthened requirement for cost-sharing by industryand the ERP is already enhancing the probability of commercialisation.Nevertheless, a strategy to address this problem more comprehensively would bebeneficial. Targeted consortia of companies, banks, universities, and governmentagencies may be one approach, focused initially on enabling technologies such asprocess integration with short-term paybacks to develop confidence and a positivetrack record.
Denmark is encouraged to continue its successful record of taking full advantage ofinternational research programmes in the EU and collaboration through the IEA.The development of a co-ordinated national climate change research programmewith strong linkages to the ERP and other Danish energy R&D funding mechanismsis also encouraged.
RECOMMENDATIONS
The Government of Denmark should:
■■ Complete a comprehensive energy research strategy covering the full spectrumof innovation, and domestic and international programming.
■■ Clarify responsibilities and improve the co-ordination between the DanishEnergy Agency and the electricity system operators that administer the PublicService Obligation. This also applies to the electricity end-use R&Drequirement.
122

A
123
ANNEX
ENERGY BALANCES AND KEY STATISTICAL DATA
Unit: Mtoe
SUPPLY
1973 1990 1998 1999 2005 2010 2020
TOTAL PRODUCTION 0.40 9.68 20.19 23.64 22.93 12.22 ..Coal – – – – – – ..Oil 0.07 5.81 11.66 14.86 11.70 5.49 ..Gas – 2.74 6.76 6.94 8.58 3.80 ..Comb. Renewables & Wastes1 0.33 1.08 1.51 1.58 2.07 2.15 ..Nuclear – – – – – – ..Hydro 0.00 0.00 0.00 0.00 – – ..Geothermal – 0.00 0.00 0.00 – 0.00 ..Solar/Wind/Other2 – 0.06 0.25 0.27 0.59 0.77 ..
TOTAL NET IMPORTS3 19.85 8.01 0.18 –4.62 –1.99 9.54 ..Coal Exports 0.04 0.03 0.10 0.12 .. .. ..
Imports 1.91 6.23 4.87 4.30 4.50 5.46 ..Net Imports 1.87 6.20 4.77 4.18 4.50 5.46 ..
Oil Exports 2.89 5.37 11.69 15.32 0.96 5.52 ..Imports 21.58 8.46 11.35 10.55 .. .. ..Bunkers 0.69 0.96 1.40 1.31 1.51 1.51 ..Net Imports 18.00 2.13 –1.74 –6.08 –2.47 4.00 ..
Gas Exports – 0.93 2.51 2.55 3.14 1.55 ..Imports – – – – – – ..Net Imports – –0.93 –2.51 –2.55 –3.14 1.55 ..
Electricity Exports 0.11 0.42 0.65 0.65 0.88 1.48 ..Imports 0.09 1.03 0.28 0.45 .. .. ..Net Imports –0.02 0.61 –0.37 –0.20 –0.88 –1.48 ..
TOTAL STOCK CHANGES –0.44 0.17 0.49 1.05 – – ..
TOTAL SUPPLY (TPES) 19.81 17.85 20.86 20.07 20.95 21.76 ..Coal 1.93 6.07 5.67 4.64 4.50 5.46 ..Oil 17.57 8.26 9.55 9.33 9.23 9.50 ..Gas – 1.79 4.22 4.42 5.44 5.35 ..Comb. Renewables & Wastes1 0.33 1.08 1.53 1.60 2.07 2.15 ..Nuclear – – – – – – ..Hydro 0.00 0.00 0.00 0.00 – – ..Geothermal – 0.00 0.00 0.00 – 0.00 ..Solar/Wind/Other2 – 0.06 0.26 0.27 0.59 0.78 ..Electricity Trade4 –0.02 0.61 –0.37 –0.20 –0.88 –1.48 ..
Shares (%)Coal 9.7 34.0 27.2 23.1 21.5 25.1 ..Oil 88.7 46.2 45.8 46.5 44.1 43.6 ..Gas – 10.0 20.2 22.0 26.0 24.6 ..Comb. Renewables & Wastes 1.7 6.0 7.3 8.0 9.9 9.9 ..Nuclear – – – – – – ..Hydro – – – – – – ..Geothermal – – – – – – ..Solar/Wind/Other – 0.3 1.2 1.4 2.8 3.6 ..Electricity Trade –0.1 3.4 –1.8 –1.0 –4.2 –6.8 ..
0 is negligible, – is nil, .. is not availablePlease note: TPES for a given year strongly depends on the amount of net import of electricity, which may vary substantially from year to year.Forecast data for 2005 and 2010 are based on the 1999 submission.

124
Unit: Mtoe
DEMAND
FINAL CONSUMPTION BY SECTOR
1973 1990 1998 1999 2005 2010 2020
TFC 16.15 14.06 15.67 15.64 15.83 16.24 ..Coal 0.34 0.39 0.34 0.30 0.34 0.34 ..Oil 14.26 8.00 7.92 8.00 7.66 7.88 ..Gas 0.12 1.13 1.72 1.74 2.09 2.12 ..Comb. Renewables & Wastes1 0.05 0.20 0.51 0.51 0.57 0.57 ..Geothermal – – – – – – ..Solar/Wind/Other – 0.00 0.01 0.01 0.01 0.01 ..Electricity 1.39 2.50 2.76 2.76 2.77 2.88 ..Heat – 1.84 2.41 2.32 2.41 2.45 ..
Shares (%)Coal 2.1 2.8 2.2 1.9 2.1 2.1 ..Oil 88.3 56.9 50.6 51.1 48.4 48.5 ..Gas 0.7 8.0 11.0 11.1 13.2 13.0 ..Comb. Renewables & Wastes 0.3 1.4 3.3 3.3 3.6 3.5 ..Geothermal – – – – – – ..Solar/Wind/Other – – – – – – ..Electricity 8.6 17.8 17.6 17.6 17.5 17.7 ..Heat – 13.1 15.4 14.8 15.2 15.1 ..
TOTAL INDUSTRY5 4.04 2.99 3.34 3.30 3.54 3.64 ..Coal 0.21 0.31 0.31 0.28 0.31 0.31 ..Oil 3.41 1.30 1.12 1.12 1.05 1.07 ..Gas 0.02 0.53 0.80 0.81 0.99 1.00 ..Comb. Renewables & Wastes1 – 0.02 0.12 0.10 0.11 0.12 ..Geothermal – – – – – – ..Solar/Wind/Other – – – – – – ..Electricity 0.40 0.75 0.86 0.85 0.91 0.98 ..Heat – 0.07 0.14 0.14 0.17 0.17 ..
Shares (%)Coal 5.2 10.4 9.4 8.6 8.6 8.5 ..Oil 84.5 43.7 33.5 34.0 29.7 29.2 ..Gas 0.4 17.7 23.9 24.6 27.8 27.5 ..Comb. Renewables & Wastes – 0.6 3.4 2.9 3.2 3.2 ..Geothermal – – – – – – ..Solar/Wind/Other – – – – – – ..Electricity 9.8 25.2 25.6 25.8 25.8 26.8 ..Heat – 2.5 4.1 4.1 4.8 4.7 ..
TRANSPORT 6 3.52 4.58 4.89 5.01 5.27 5.57 ..
TOTAL OTHER SECTORS7 8.59 6.50 7.44 7.33 7.03 7.03 ..Coal 0.13 0.08 0.03 0.02 0.03 0.03 ..Oil 7.34 2.14 1.94 1.90 1.41 1.31 ..Gas 0.10 0.60 0.92 0.93 1.10 1.12 ..Comb. Renewables & Wastes1 0.05 0.18 0.40 0.42 0.45 0.46 ..Geothermal – – – – – – ..Solar/Wind/Other – 0.00 0.01 0.01 0.01 0.01 ..Electricity 0.98 1.73 1.88 1.88 1.79 1.84 ..Heat – 1.76 2.27 2.18 2.24 2.28 ..
Shares (%)Coal 1.5 1.2 0.3 0.3 0.4 0.4 ..Oil 85.4 33.0 26.1 25.9 20.1 18.7 ..Gas 1.2 9.3 12.4 12.6 15.7 15.9 ..Comb. Renewables & Wastes 0.6 2.8 5.4 5.7 6.5 6.5 ..Geothermal – – – – – – ..Solar/Wind/Other – – 0.1 0.1 0.1 0.1 ..Electricity 11.4 26.6 25.2 25.6 25.5 26.1 ..Heat – 27.2 30.6 29.8 31.8 32.4 ..

125
Unit: Mtoe
DEMAND
ENERGY TRANSFORMATION AND LOSSES
1973 1990 1998 1999 2005 2010 2020
ELECTRICITY GENERATION 8
INPUT (Mtoe) 4.69 7.36 9.70 9.01 9.97 11.35 ..OUTPUT (Mtoe) 1.64 2.21 3.53 3.34 3.89 4.61 ..(TWh gross) 19.12 25.74 41.10 38.87 45.28 53.58 ..
Output Shares (%)Coal 35.8 90.6 57.5 51.6 40.1 42.3 ..Oil 64.1 4.1 12.1 12.5 10.0 8.8 ..Gas – 2.2 19.9 23.5 28.6 26.2 ..Comb. Renewables & Wastes – 0.6 3.6 4.5 8.3 7.7 ..Nuclear – – – – – – ..Hydro 0.1 0.1 0.1 0.1 – – ..Geothermal – – – – – – ..Solar/Wind/Other – 2.4 6.9 7.8 13.0 14.9 ..
TOTAL LOSSES 3.74 3.77 4.87 4.54 5.12 5.52 ..of which:Electricity and Heat Generation9 3.04 2.85 3.11 2.74 3.16 3.78 ..Other Transformation 0.44 –0.43 –0.12 –0.08 0.00 0.00 ..Own Use and Losses10 0.26 1.34 1.88 1.87 1.96 1.74 ..
Statistical Differences –0.08 0.03 0.32 –0.11 – – ..
INDICATORS
1973 1990 1999 2000 2005 2010 2020
GDP (billion 1995 US$) 128.44 163.49 195.50 199.67 223.54 246.81 ..Population (millions) 5.02 5.14 5.30 5.32 5.40 5.44 ..TPES/GDP11 0.15 0.11 0.11 0.10 0.09 0.09 ..Energy Production/TPES 0.02 0.54 0.97 1.18 1.09 0.56 ..Per Capita TPES12 3.94 3.47 3.93 3.77 3.88 4.00 ..Oil Supply/GDP11 0.14 0.05 0.05 0.05 0.04 0.04 ..TFC/GDP11 0.13 0.09 0.08 0.08 0.07 0.07 ..Per Capita TFC12 3.22 2.74 2.96 2.94 2.93 2.99 ..Energy–related CO2
Emissions (Mt CO2)13 57.1 49.7 57.7 53.3 54.5 58.8 ..CO2 Emissions from Bunkers
(Mt CO2) 4.5 5.0 6.7 6.4 7.1 7.1 ..
GROWTH RATES (% per year)
73–79 79–90 90–99 99–00 00–05 05–10 10–20
TPES 1.2 –1.6 2.0 –3.8 0.7 0.8 ..Coal 14.4 3.1 –0.9 –18.2 –0.5 3.9 ..Oil –1.4 –5.9 1.8 –2.3 –0.2 0.6 ..Gas – – 11.4 4.7 3.5 –0.3 ..Comb. Renewables & Wastes 6.5 7.6 4.5 4.6 4.3 0.8 ..Nuclear – – – – – – ..Hydro – – – 50.0 – – ..Geothermal – – – – – – ..Solar/Wind/Other – 44.0 20.8 7.2 11.4 6.3 ..
TFC 0.6 –1.6 1.4 –0.2 0.2 0.5 ..
Electricity Consumption 4.9 2.8 1.3 –0.1 0.1 0.8 ..Energy Production 15.0 23.8 9.6 17.1 –0.5 –11.8 ..Net Oil Imports –2.6 –16.4 – 250.3 –13.9 – ..GDP 1.5 1.4 2.3 2.1 1.9 2.0 ..Growth in the TPES/GDP Ratio –0.4 –2.9 –0.3 –5.8 –1.2 –1.2 ..Growth in the TFC/GDP Ratio –0.9 –2.9 –0.9 –2.3 –1.7 –1.5 ..
Please note: Rounding may cause totals to differ from the sum of the elements.

126
Footnotes to Energy Balances and Key Statistical Data1. Comprises solid biomass, biogas, industrial waste and municipal waste. Data are
often based on partial surveys and may not be comparable between countries.2. Other includes ambient heat used in heat pumps.3. Total net imports include combustible renewables and waste.4. Total supply of electricity represents net trade. A negative number indicates
that exports are greater than imports.5. Includes non-energy use.6. Includes less than 1% non-oil fuels.7. Includes residential, commercial, public service and agricultural sectors.8. Inputs to electricity generation include inputs to electricity, CHP and heat
plants. Output refers only to electricity generation.9. Losses arising in the production of electricity and heat at public utilities and
autoproducers. For non-fossil-fuel electricity generation, theoretical losses areshown based on plant efficiency of 100% for hydro.
10. Data on “losses” for forecast years often include large statistical differencescovering differences between expected supply and demand and mostly do notreflect real expectations on transformation gains and losses.
11. Toe per thousand US dollars at 1995 prices and exchange rates.12. Toe per person.13. “Energy-related CO2 emissions”specifically means CO2 from the combustion of
the fossil fuel components of TPES (i.e. coal and coal products, peat, crude oiland derived products and natural gas), while CO2 emissions from the remainingcomponents of TPES (i.e. electricity from hydro,other renewables and nuclear)are zero. Emissions from the combustion of biomass-derived fuels are notincluded, in accordance with the IPCC greenhouse gas inventory methodology.Also in accordance with the IPCC methodology, emissions from internationalmarine and aviation bunkers are not included in national totals. Projectedemissions for oil and gas are derived by calculating the ratio of emissions toenergy use for 1999 and applying this factor to forecast energy supply. Futurecoal emissions are based on product-specific supply projections and arecalculated using the IPCC/OECD emission factors and methodology.

B
127
ANNEX
INTERNATIONAL ENERGY AGENCY“SHARED GOALS”
The Member countries* of the International Energy Agency (IEA) seek to create theconditions in which the energy sectors of their economies can make the fullestpossible contribution to sustainable economic development and the well–being oftheir people and of the environment. In formulating energy policies,the establishmentof free and open markets is a fundamental point of departure, though energy securityand environmental protection need to be given particular emphasis by governments.IEA countries recognise the significance of increasing global interdependence inenergy. They therefore seek to promote the effective operation of international energymarkets and encourage dialogue with all participants.
In order to secure their objectives they therefore aim to create a policy frameworkconsistent with the following goals:
1 Diversity, efficiency and flexibilitywithin the energy sector are basicconditions for longer–term energysecurity: the fuels used within andacross sectors and the sources of thosefuels should be as diverse as practicable.Non–fossil fuels, particularly nuclear andhydro power, make a substantialcontribution to the energy supplydiversity of IEA countries as a group.
2 Energy systems should have the abilityto respond promptly and flexibly toenergy emergencies. In some casesthis requires collective mechanisms andaction: IEA countries co–operate throughthe Agency in responding jointly to oilsupply emergencies.
3 The environmentally sustainableprovision and use of energy is centralto the achievement of these sharedgoals. Decision–makers should seek tominimise the adverse environmentalimpacts of energy activities, just asenvironmental decisions should takeaccount of the energy consequences.Government interventions should wherepracticable have regard to the PolluterPays Principle.
4 More environmentally acceptableenergy sources need to be encouragedand developed. Clean and efficient useof fossil fuels is essential. Thedevelopment of economic non–fossilsources is also a priority. A number of
* Australia, Austria, Belgium, Canada, the Czech Republic, Denmark, Finland, France, Germany, Greece,Hungary, Ireland, Italy, Japan, the Republic of Korea, Luxembourg, the Netherlands, New Zealand,Norway, Portugal, Spain, Sweden, Switzerland,Turkey, the United Kingdom, the United States.

128
IEA Members wish to retain andimprove the nuclear option for thefuture, at the highest available safetystandards, because nuclear energy doesnot emit carbon dioxide. Renewablesources will also have an increasinglyimportant contribution to make.
5 Improved energy efficiency canpromote both environmental pro-tection and energy security in acost–effective manner. There aresignificant opportunities for greaterenergy efficiency at all stages of theenergy cycle from production toconsumption. Strong efforts bygovernments and all energy users areneeded to realise these opportunities.
6 Continued research, developmentand market deployment of new andimproved energy technologies make a critical contribution to achieving the objectives outlined above.Energy technology policies shouldcomplement broader energy policies.International co–operation in thedevelopment and dissemination ofenergy technologies, including industryparticipation and co–operation with non–member countries, should beencouraged.
7 Undistorted energy prices enablemarkets to work efficiently. Energyprices should not be held artificiallybelow the costs of supply to promotesocial or industrial goals. To the extentnecessary and practicable, the environ-mental costs of energy production anduse should be reflected in prices.
8 Free and open trade and a secureframework for investment contribute toefficient energy markets and energysecurity. Distortions to energy tradeand investment should be avoided.
9 Co–operation among all energymarket participants helps to improveinformation and understanding, andencourage the development of efficient,environmentally acceptable and flexibleenergy systems and markets worldwide.These are needed to help promote theinvestment, trade and confidencenecessary to achieve global energysecurity and environmental objectives.
(The Shared Goals were adopted by IEA Ministers at their 4 June 1993meeting in Paris.)

C
ANNEX
GLOSSARY AND LIST OF ABBREVIATIONSIn this report, abbreviations are substituted for a number of terms used within theInternational Energy Agency. While these terms generally have been written out onfirst mention and abbreviated subsequently, this glossary provides a quick andcentral reference for many of the abbreviations used.
AC alternating current.
BP British Petroleum.
bcm billion cubic metres.
b/d barrels per day.
cal calorie.
CCGT combined-cycle gas turbine.
CDM Clean Development Mechanism (Kyoto Protocol).
CERT Committee on Energy Research and Technology of the IEA.
CFCs chlorofluorocarbons.
CHP combined production of heat and power; sometimes, when referringto industrial CHP, the term "co-generation" is used.
CNG compressed natural gas.
CO carbon monoxide.
CO2 carbon dioxide.
cm cubic metre.
DC direct current.
DH district heating.
DSO distribution system operator.
EFTA European Free Trade Association: Iceland, Norway, Switzerland andLiechtenstein.
EIA environmental impact assessment.
ETSO European Transmission System Operators Group.
EU The European Union, whose members are Austria, Belgium, Denmark,Finland, France, Germany, Greece, Ireland, Italy, Luxembourg, theNetherlands, Portugal, Spain, Sweden and the United Kingdom.
129

Euro European currency (€).
FCCC Framework Convention on Climate Change.
FSU Former Soviet Union.
GDP gross domestic product.
GNP gross national product.
GEF Global Environmental Facility.
GJ gigajoule, or one joule × 109.
GW gigawatt, or one watt × 109.
GWh gigawatt × one hour, or one watt × one hour × 109.
IAEA International Atomic Energy Agency.
IEA International Energy Agency whose Members are Australia, Austria,Belgium, Canada, the Czech Republic, Denmark, Finland, France,Germany, Greece, Hungary, Ireland, Italy, Japan, the Republic of Korea,Luxembourg, the Netherlands, New Zealand, Norway, Portugal, Spain,Sweden, Switzerland,Turkey, the United Kingdom, the United States.
IEP International Energy Program, one of the founding documents of theIEA.
IGCC integrated coal gasification combined cycle plant.
IPCC International Panel on Climate Change.
ISO independent system operator.
J joule; a joule is the work done when the point of application of a forceof one newton is displaced through a distance of one metre in thedirection of the force (a newton is defined as the force needed toaccelerate a kilogram by one metre per second). In electrical units, itis the energy dissipated by one watt in a second.
JI Joint Implementation (Kyoto Protocol).
kV kilovolt, or one volt × 103.
kWh kilowatt-hour,or one kilowatt × one hour,or one watt × one hour × 103.
LDC local distribution company.
LNG liquefied natural gas.
LPG liquefied petroleum gas; refers to propane, butane and their isomers,which are gases at atmospheric pressure and normal temperature.
130

mcm million cubic metres.
Mt million tonnes.
Mtoe million tonnes of oil equivalent; see toe.
MW megawatt, measure for energetic capacity (for example, one MW ofelectricity equals one watt × 106).
MWe megawatt of electricity, often used to distinguish the electricalcapacity from the heat-generation capacity in combined heat andpower plants.
MWh megawatt-hour = one megawatt × one hour, or one watt × one hour× 106.
NATO North Atlantic Treaty Organisation.
NEA Nuclear Energy Agency of the OECD.
negTPA negotiated third party access.
NGO non-governmental organisation.
NOx nitrogen oxides.
OECD Organisation for Economic Co-operation and Development.
PJ petajoule, or one joule × 1015.
ppm parts per million.
PPP purchasing power parity: the rate of currency conversion thatequalises the purchasing power of different currencies, i.e. estimatesthe differences in price levels between different countries.
regTPA regulated third party access.
R&D research and development, especially in energy technology; mayinclude the demonstration and dissemination phases as well.
SB single buyer.
SLT Standing Group on Long-Term Co-operation of the IEA.
SO2 sulphur dioxide.
TFC total final consumption of energy; the difference between TPES andTFC consists of net energy losses in the production of electricity andsynthetic gas, refinery use and other energy sector uses and losses.
131

TJ terajoule, or one joule × 1012.
toe tonne of oil equivalent, defined as 107 kcal.
TOP take-or-pay contract.
TPA third party access.
TPES total primary energy supply.
TSO transmission system operator.
TW terawatt, or one watt × 1012.
TWh terawatt × one hour, or one watt × one hour × 1012.
UGS underground storage (of natural gas).
UN the United Nations Organisation.
UNECE United Nations Economic Commission for Europe.
VAT value-added tax.
VOCs volatile organic compounds.
WANO World Association of Nuclear Operators.
132

OECD TOKYO CENTRE
Tel: (+81-3) 3586 2016
Fax: (+81-3) 3584 7929
E-mail: [email protected]
OECD WASHINGTON CENTER
Tel: (+1-202) 785-6323
Toll-free number for orders:
(+1-800) 456-6323
Fax: (+1-202) 785-0350
E-mail: [email protected]
INTERNATIONALENERGY AGENCY
O R D E R F O R M
You can also send
your order
to your nearest
OECD sales point
or through
the OECD online
services:
www.oecd.org/
bookshop
OECD PARIS CENTRE
Tel: (+33-01) 45 24 81 67
Fax: (+33-01) 49 10 42 76
E-mail: [email protected]
OECD BONN CENTRE
Tel: (+49-228) 959 12 15
Fax: (+49-228) 959 12 18
E-mail: [email protected]
OECD MEXICO CENTRE
Tel: (+52-5) 280 12 09
Fax: (+52-5) 280 04 80
E-mail: [email protected]
IEA BOOKS
Fax: +33 (0)1 40 57 65 59
E-mail: [email protected]
www.iea.org/books
DELIVERY DETAILS
Name Organisation
Address
Country Postcode
Telephone E-mail
PAYMENT DETAILS
I enclose a cheque payable to IEA Publications for the sum of $ or €
Please debit my credit card (tick choice). Mastercard VISA American Express
Card no:
Expiry date: Signature:
PUBLICATIONS ISBN QTY PRICE TOTAL
Energy Policies of IEA Countries – Denmark – 2002 Review 92-64-19767-2 $75 €82
Energy Policies of IEA Countries – The Republic of Korea – 2002 Review 92-64-19768-0 $75 €82
Energy Policies of IEA Countries – The United States – 2002 Review 92-64-19762-1 $75 €82
Energy Policies of IEA Countries – Norway – 2001 Review 92-64-19679-X $75 €82
Energy Policies of IEA Countries – 2001 Review (Compendium) 92-64-19659-5 $120 €132
Energy Policies of IEA Countries – Spain – 2001 Review 92-64-16832-X $75 €82
Energy Policies of IEA Countries – Turkey – 2001 Review 92-64-19660-9 $75 €82
Energy Policies of IEA Countries – Czech Republic – 2001 Review 92-64-18730-8 $75 €82
TOTAL
I would like to order the following publications
9, rue de la FédérationF-75739 Paris Cedex 15


IEA PUBLICATIONS, 9, rue de la Fédération, 75739 PARIS CEDEX 15
PRINTED IN FRANCE BY STEDI
(61 02 07 1P) ISBN 92-64-19767-2 - 2002