dense granular flow down an inclined plane: a comparison …€¦ · additional measures of...
TRANSCRIPT
Dense granular flow down an inclined plane: A comparisonbetween the hard particle model and soft particle simulations
K. Anki Reddy and V. KumaranDepartment of Chemical Engineering, Indian Institute of Science, Bangalore 560 012, India
�Received 10 May 2010; accepted 22 September 2010; published online 10 November 2010�
The granular flow down an inclined plane is simulated using the discrete element �DE� technique toexamine the extent to which the dynamics of an unconfined dense granular flow can be welldescribed by a hard particle model. First, we examine the average coordination number for theparticles in the flow down an inclined plane using the DE technique using the linear contact modelwith and without friction, and the Hertzian contact model with friction. The simulations show thatthe average coordination number decreases below 1 for values of the spring stiffness correspondingto real materials, such as sand and glass, even when the angle of inclination is only 1° larger thanthe angle of repose. Additional measures of correlations in the system, such as the fraction ofparticles with multibody contact, the force ratio �average ratio of the magnitudes of the largest andthe second largest force on a particle�, and the angle between the two largest forces on the particle,show no evidence of force chains or other correlated motions in the system. An analysis of thebond-orientational order parameter indicates that the flow is in the random state, as in event-driven�ED� simulations �V. Kumaran, J. Fluid Mech. 632, 107 �2009�; J. Fluid Mech. 632, 145 �2009��.The results of the two simulation techniques for the Bagnold coefficients �ratio of stress and squareof the strain rate� and the granular temperature �mean square of the fluctuating velocity� arecompared with the theory �V. Kumaran, J. Fluid Mech. 632, 107 �2009�; J. Fluid Mech. 632, 145�2009�� and are found to be in quantitative agreement. In addition, we also conduct a comparison ofthe collision frequency and the distribution of the precollisional relative velocities of particles incontact. The strong correlation effects exhibited by these two quantities in event-driven simulations�V. Kumaran, J. Fluid Mech. 632, 145 �2009�� are also found in the DE simulations.© 2010 American Institute of Physics. �doi:10.1063/1.3504660�
I. INTRODUCTION
Dense sheared granular flows are encountered in manyapplications, including geophysical applications such as ava-lanches as well as in industrial applications involving con-veying of solids. In these flows, the energy required for “flu-idizing” the system is provided by the mean shear and is notdue to forcing at boundaries. In the modeling of dense granu-lar flows, it is important to examine the range of densitiesand material properties for which the interaction betweenparticles can be adequately represented as instantaneous col-lisions. Treating the interparticle interactions as instanta-neous collisions results in several simplifications, the mostimportant of which is the Bagnold form for the stress tensorwhere all components of the stress are proportional to thesquare of the shear rate. This would also facilitate the use ofmodels based on kinetic theory calculations1–9 to be appliedfor dense granular flows. However, there is as yet no consen-sus on whether dense granular flows can be modeled usingan instantaneous collision model at all and in what parameterranges. Partly, this is because a dense flow of hard particlesinvolves two limiting processes. Multiple contacts are intu-itively expected in the limit of volume fractions greater thanabout 50% in three dimensions, and the multiple contactswould occur more frequently when the coefficient of restitu-tion is decreased. However, in the limit of hard particles �theelasticity modulus of materials, such as sand and glass, is of
the order of 100 GPa�, the contact time between pairs ofparticles goes to zero, and one would expect the binary col-lision approximation to be valid provided the coefficient ofrestitution is O�1�. The balance between these two limitingprocess would determine the range of volume fractions andmaterial properties for which a binary collision approxima-tion is expected to be valid.
Large scale simulations10 of dense granular flows downan inclined plane have been able to provide a detailed de-scription of the dynamics within the flow, which was notpreviously accessible in experiments. The simulations revealseveral surprising features. It is found that the volume frac-tion in the bulk of the flow is a constant, independent of thetotal height and of conditions at the bottom boundary, anddependent only on the angle of inclination. All the compo-nents of the stress are found to be proportional to the squareof the strain rate �Bagnold law�; this relationship is a dimen-sional necessity if the only time scale in the flow is the in-verse of the strain rate, and the period of particle interactionsdoes not influence the flow dynamics �gravitational accelera-tion does not provide a material time scale since it providesa body force acting on the entire material and not a stress dueto material deformation�.
There have been some simulation studies11–13 that havealso indicated that the constitutive relations derived from thekinetic theory based on the binary collision approximation
PHYSICS OF FLUIDS 22, 113302 �2010�
1070-6631/2010/22�11�/113302/24/$30.00 © 2010 American Institute of Physics22, 113302-1
Downloaded 01 Jan 2011 to 203.200.35.31. Redistribution subject to AIP license or copyright; see http://pof.aip.org/about/rights_and_permissions

are valid for these flows, while other studies14–17 suggestedthat long-range correlations are important and the kinetictheory cannot be applied for these flows. The simulations ofSilbert et al.10 did show that the coordination number �num-ber of particles in simultaneous contact with a particle� islarger than 1, indicating that multiple contacts dominate.However, the spring stiffness for interparticle interactions inthat simulation was kept lower than that for real materials inorder to increase the time step for the computations and de-crease the computation time. Here, our focus is on the issueof the range of parameter values for which the flows of realmaterials can be well approximated by a hard particle model.
For a fluid of elastic particles, it is well known18,19 thatthe kinetic theory calculations are valid only in the dilutelimit, and they become invalid at higher densities due to theeffect of correlations. Correlations are incorporated by solv-ing the ring-kinetic equation for the three-particle distribu-tion function, and these correlations lead to the divergence ofthe viscosity in two dimensions �proportional to log��̇�� anda contribution to the viscosity proportional to �̇3/2 in threedimensions, where �̇ is the strain rate. The divergence of thetransport coefficients is related to the long-time tails in thevelocity autocorrelation function, which are due to the con-served nature of the transverse momentum fluctuations.20
However, recent works, both theoretical21–23 and experi-mental,24 have shown that the long-time tails in the velocityautocorrelation functions are not present in a sheared granu-lar flow. This is because in contrast to a normal fluid, energyis dissipated in particle interactions in a granular flow, and soenergy is not a conserved variable. Therefore, the kinetictheory for granular materials is valid for a larger range ofvolume fractions than that for molecular fluids.
Correlations are often interpreted as either dense clustersof particles or linear “force chains,” in which the stress trans-mission is concentrated in long chains of particles, whichoften extend from one boundary to the other, or as denseclusters of particles in correlated motion.16,17 While forcechains are easily visualized in experiments on photoelasticdisks,25 they are more difficult to quantify, especially in threedimensional simulations or experiments. The significance offorce chains could also depend on the conditions underwhich the material is deformed if the force chain is definedas a linear element with compressive stresses at both ends ofthe chain. If the material deformation is carried out underconstant volume conditions and if the volume fraction isgreater than the random close packing volume fraction, therewill be multiple contacts between particles, which could beorganized as chains of highly stressed particles spanning thesample. Alternatively, for flows with a free surface such aschute flows, it is difficult to envision force chains extendingup to the surface since there is no compressive stress at thefree surface. However, there could be force chains at a depthwhere the hydrostatic head provides the necessary compres-sive force on the particles, and these force chains couldbranch out and decrease in amplitude as the surface is ap-proached.
Spatial correlations for the local collision frequencyhave been observed in hard particle simulations.26 In two-dimensional silo simulations, particles within the flow hav-
ing the highest collision frequency were identified. The sig-nificant finding was that the particles with the highestcollision frequency were formed linear structures, often sys-tem spanning in the cross-stream direction, which transmitmost of the momentum. These structures experience slowrelaxation, and the lifetime increases as the close packingvolume fraction is approached. However, the authors werenot able to extract a diverging length scale from the simula-tions. In a similar manner, Baran et al.27 were also not suc-cessful in finding a diverging length scale in the simulationsof the flow down an inclined plane. Experiments andsimulations24 show that the temporal velocity autocorrelationfunctions in a sheared granular flow decay faster than thosein an elastic hard particle fluid at equilibrium.
In this regard, some recent results from hard particleevent-driven �ED� simulations seems to suggest that all ofthe evidence is broadly consistent, provided it is interpretedcarefully, as follows.28,29 In the rapid flow regime, the stressis proportional to the square of the strain rate �Bagnold scal-ing� on the basis of the dimensional analysis since the con-tact lifetime and the spring stiffness do not affect the dynam-ics. Soft particle simulations30–32 under constant volumeconditions have shown that in the limit of high spring stiff-ness or low contact time, the flow exhibits Bagnold scalingfor volume fractions of up to 0.58, but it seems to undergo atransition to the quasistatic regime at a volume fraction be-tween 0.58 and 0.59. This was inferred as evidence thatgranular flows are always in the quasistatic regime even atvolume fractions below the random close packing volumefraction of 0.64. This is in contrast to kinetic theories, whichassumed that the kinetic regime could be extended to therandom close packing volume fractions provided the par-ticles were made stiff enough. However, recent ED simula-tions on hard particle systems28,29 have shown that the ran-dom close packing limit is lower in sheared inelastic fluidswhen compared to elastic fluids at equilibrium.
In hard particle systems,33 the approach to random closepacking is characterized by a diverging pair distributionfunction. In the empirical correlation proposed byTorquato,33 the pair correlation function diverges propor-tional to ��c−��−1, where �c=0.64 is the random closepacking volume fraction for an elastic fluid at equilibrium. Ina dynamical simulation, the divergence of the pair distribu-tion function is measured by the divergence in the collisionfrequency since the collision frequency is proportional to theproduct of the pair distribution function and the square rootof the temperature in the dense limit. It has commonly beenassumed that the divergence of the pair distribution functionin a sheared inelastic fluid also takes place at the volumefraction �c=0.64. However, some recent ED simulations in-dicate that the collision frequency in a sheared inelastic fluiddiverges at a lower volume fraction, which is dependent onthe coefficients of restitution.28,29 It should be noted that EDsimulations suffer from the disadvantage of inelastic collapsevery close to the random close packing limit, and numericalerrors caused particle overlaps. However, this is differentfrom the divergence of the collision frequency at the randomclose packing limit, which is a system property and not anartifact of the simulation, which occurs even for an elastic
113302-2 K. A. Reddy and V. Kumaran Phys. Fluids 22, 113302 �2010�
Downloaded 01 Jan 2011 to 203.200.35.31. Redistribution subject to AIP license or copyright; see http://pof.aip.org/about/rights_and_permissions

fluid. The divergence of the collision frequency is inferred byplotting the inverse of the collision frequency as a functionof the volume fraction and extending the curves to the hori-zontal axis. Data extrapolated in this manner28,29 show thatthe volume fraction for the divergence of the collision fre-quency for a sheared inelastic fluid is smaller than that for anelastic fluid. For the lowest coefficients of restitution in therange of 0.8–0.6, which were studied for rough particles, thecollision frequency diverged at a random close packing vol-ume fraction between 0.58 and 0.59. This implies that theseeming contradiction between soft particle simulations�which observed quasistatic scaling for volume fractionsgreater than about 0.59� and kinetic theory �where it waspreviously assumed that the random close packing volumefraction is 0.64� could be removed by replacing the randomclose packing volume fraction by the volume fraction forarrested dynamics �ad, which is defined as the volume frac-tion at which the collision frequency diverges in the shearedstate. It should be noted that the distinction in �ad between asheared and an unsheared system is different from the dis-tinction between jamming and random close packing in col-lections of spheres34,35 since there is no applied shear in thelatter case.
The above evidence is also consistent with large scalesoft particle simulations of flows down an inclined plane,10
where the maximum volume fraction is observed to be about0.59. In constant volume soft particle simulations, this is themaximum volume fraction at which the kinetic regime canexist in the limit of large spring stiffness, and above thisvolume fraction, the system is necessarily in the quasistaticregime where stress is transmitted by force chains. If forcechains require compressive stresses at both ends, then forcechains cannot exist in a flow with a free surface since thereare no compressive forces on the free surface. Therefore, thesystem expands so that the volume fraction remains belowthe maximum limit for the kinetic transmission of stress.From the rapid flow perspective, the revised random closepacking volume fraction in the presence of shear is in therange of 0.58–0.59, and so the flow down an inclined planedoes not have a volume fraction greater than this. Therefore,the results of soft and hard particle simulations, constant vol-ume and free surface simulations, as well as kinetic theoryare all in agreement in this respect.
There is less agreement with respect to constant stresssimulations, where the stress is kept as a constant and thevolume fraction is varied. In this case, the distinction be-tween the binary contact regime and the multibody contactregime has been made on the basis of the ratio of the averagecontact time in the simulation and the time period of a binarycollision. Note that the time period of a binary collision isindependent of the particle velocity in the linear contactmodel. Campbell32 reported that the system is in the multi-body contact regime even when the overburden is of theorder of one layer for 1 mm sand particles. This conclusion isbased on an estimate of the spring constant based on thestudy of Bathurst and Rothenberg36 discussed below. How-ever, in the contact lifetime distribution for the flow down aninclined plane, Silbert et al.37 found that the dynamics isdominated by the interactions with very short lifetimes. A
part of the difference may be because the simulations ofCampbell32 are carried out with a constant stress, whereasthose of Silbert et al.37 and Brewster et al.38 have a constantvolume fraction and linear stress profile across the height ofthe flowing layer. More studies need to be done to resolvethis contradiction.
Another interpretation of force chains emerges fromcontact-dynamics �CD� simulations,15,39 which are a combi-nation of hard particle simulations �because they consider theresisting force to be infinite at contact� and moleculardynamics-type simulations �because the particles are ad-vanced in constant time steps�. Because the system evolutionprogresses in constant time steps and not in collision events,there could be multiple collisions in a given time step. In thecase of multiple collisions, all the colliding particles are con-sidered to be simultaneously in contact, and the impulsesbetween the particles are determined on the basis of the col-lision laws. The solutions for the collision impulses for mul-tiple particles in contact are not unique, however, and a pro-cedure has to be devised to choose one of the possiblesolutions. In this case, multiple particles in simultaneouscontact are considered to be force chains, and the stressestransmitted by these particles are considered to be “contactstresses,” in contrast to collisional stresses due to binarycollisions.
There is a difference between the results of CD simula-tions and ED simulations with regard to the interpretation ofmultibody contacts. In two dimensions, ED simulations areable to access volume fractions up to about 0.76–0.8, de-pending on the coefficient of restitution �see Refs. 11 and 13,for example�, and this simulation technique incorporatesonly binary collisions. At the same volume fraction, CDsimulations �see Ref. 15, for example� indicate that the“static stress” �which includes multiple contacts� and the“collisional stress” �which is measured only over binary col-lisions� is larger than 1. The stress ratios in the abovemen-tioned paper are plotted on a log scale, and so they becomequite large. This implies that there are multibody contacts intwo dimensions at volume fractions as low as 0.75. Thisindicates a clear difference between hard particle andcontact-dynamics simulations with regard to force chains,and it would be worthwhile to examine whether the timeresolution alters the multibody contact network in contact-dynamics simulations.
The simulations of Lois et al.40–42 were all restricted totwo dimensions. In their studies, it was observed that thevolume fraction, temperature, and strain rate profiles ob-tained in the CD simulations were similar to those in discreteelement �DE� simulations. However, Lois et al.15 concludedthat kinetic theory does not apply to dense flows due to en-during contacts in the CD simulations. In particular, theyhave compared the “kinetic” and “static” stresses to showthat multibody contacts are important at high densities. Fordense shear flows, Lois et al.40 formulated a shear transfor-mation zone theory, following an earlier work on the defor-mation of amorphous solids under shear.43,44 For this, theyintroduced additional state variables and transition probabili-ties for the local rearrangements in the flow. These transitionprobabilities are related to the granular temperature and the
113302-3 Dense granular flow down an inclined plane Phys. Fluids 22, 113302 �2010�
Downloaded 01 Jan 2011 to 203.200.35.31. Redistribution subject to AIP license or copyright; see http://pof.aip.org/about/rights_and_permissions

ratio of the shear and normal stresses, and these relationsinvolve material constants. These constants were fitted usingsimulation results for the variation of �� / p� with ��̇d /�T� fora steady shear flow in the absence of gravity using Lees–Edwards boundary conditions. Here, � and p are the shearstress and pressure, �̇ is the strain rate, T is the granulartemperature, and d is the particle diameter. The authorsfound that the dependence of �� / p� on ��̇d /�T� is the samefor a homogeneous shear flow and for the flow down aninclined plane if the same particle interaction law is used.
The work of Lois et al.15 was also one of the motivationsfor modifications of the inelastic dissipation rate byJenkins16,17 to account for the correlated motions in a densegranular flow. While these modifications do provide betteragreement between kinetic theory and simulations, the pres-ence of correlations should also be independently verifiablein soft particle simulations since all microscopic variablesare accessible in these simulations. Detailed studies27 of thevelocity autocorrelation function in dense flows using DEsimulations have not detected any long-range velocity corre-lations. There is an unresolved issue that multibody contactsare present in CD simulations, while they are absent in EDsimulations at the same area fraction in two dimensions.
In the inclined plane simulations,10 it is also observedthat the stress is accurately described by Bagnold law forvariations in the spring constant over many orders of magni-tude. In fact, the Bagnold law appears to be applicable evenwhen the particles are in the multibody contact regime, andthe magnitudes of the stresses do not change very much asthe spring stiffness is increased and the system transitionsfrom a multibody contact regime to the binary collision re-gime. This is a puzzle that has not been satisfactorily re-solved. One possible explanation is that even though thereare multiple contacts, there is one dominant force on a par-ticle. This is in contrast to the quasistatic regime where theparticle is simultaneously acted on by forces from manyneighbors, which are roughly of the same magnitude. Thisexplanation was explored by Reddy and Kumaran,12 whofound that the average ratio of the magnitude of the secondlargest to the largest force is quite small even in the multi-body contact regime. A related explanation �Ref. 37� is thatparticle motion is dominated by short-lived contacts for largespring stiffnesses, although the appearance of long-lived con-tacts was accompanied by the breakdown of Bagnold rheol-ogy as the stiffness of interparticle contacts was decreased.Further work needs to be done to resolve this issue.
One question is whether the constitutive relations basedon the kinetic theory can reproduce all the qualitative fea-tures of a dense granular flow. This is slightly different fromthe issue of whether the flow is actually in the binary contactregime because simulations of the flow down an inclinedplane �Refs. 37 and 12� have consistently shown that there isvery little variation in the stress components for a given flowas the spring stiffness of interparticle contacts is changed fora given angle of inclination. The stress components vary byonly 10%–20% when the spring stiffness changes by three tofour orders of magnitude, and the dynamics transitions fromthe multibody contact to the binary collision regime. There-fore, it is necessary to examine two questions separately: the
first being whether the flow can be modeled using constitu-tive relations based on the kinetic theory and the secondwhether the flow is actually in the binary contact regime.
For the flow down an inclined plane, it is now clearthat all the qualitative features can be reproduced using con-stitutive relations obtained from the Chapman–Enskogprocedure.45,46 In addition, it has been known that thestresses in the flowing granular materials are fairly well pre-dicted by constitutive relations from the kinetic theory, butthe energy dissipation rate due to inelastic collisions are con-sistently overpredicted.11 The quantitative differences, pri-marily in the energy dissipation rate, have been attributed tocorrelations not captured by the binary contact model in ear-lier studies.16,17 More recent works28,29 on the comparisonbetween theory and hard particle simulations have shownthat the quantitative difference in the dissipation rate couldbe explained by a change in the form of the distribution ofprecollisional relative velocities between colliding particles.It should be noted that in a dense flow, the stress transmis-sion and energy dissipation occur primarily due to collisions,and the collisional stress and dissipation rate depend on thedistribution of precollisional relative velocity between pairsof colliding particles.
It should be noted that the hard particle model, withwhich we compare our simulations results, is different fromthe kinetic theory because velocity correlations between col-liding particles are included in the form of a modified rela-tive velocity distribution at collision. The Chapman–Enskogprocedure assumes that the two-particle velocity distributionfunction is the product of the single-particle distributions andthe pair distribution function at contact. It is known that con-stitutive relations obtained using the Chapman–Enskog pro-cedure do predict qualitatively, but not quantitatively, thestresses and dissipation rate in a dense granular flow.46 Hardparticle simulations29 indicate that this approximation is notvalid in a dense flow, and the distribution of the relativevelocities undergoes a transition from a Gaussian distributionto an exponential distribution as the coefficient of restitutionis decreased. If the correct form of the relative velocity dis-tribution is incorporated in the theory, it is possible to quan-titatively predict the stresses and the dissipation rate. There-fore, it is clear that quantitative agreement betweensimulations and hard particle simulations can be obtained ifthe effect of correlations on the relative velocity distributionof colliding particles is incorporated. It should be empha-sized that the “hard particle model” used here for comparisonis not the standard kinetic theory, but does include the effectof correlations.
Recent studies of Silbert et al.37 and Brewster et al.38 onthe lifetime of contacts between particles seem to suggestthat particle interactions are dominated by short-lived con-tacts, and the study of Reddy and Kumaran12 indicated thatthe coordination number is smaller than 1 when the springconstant suitable for real materials, such as sand and glass,are used in the simulations. In contrast, the studies ofCampbell31,32,47 report that the flows of real materials arealways in the multiple contact regime and conclude that thebinary collision approximation is not valid for most situa-tions of practical interest. As discussed above, one source of
113302-4 K. A. Reddy and V. Kumaran Phys. Fluids 22, 113302 �2010�
Downloaded 01 Jan 2011 to 203.200.35.31. Redistribution subject to AIP license or copyright; see http://pof.aip.org/about/rights_and_permissions

disagreement is resolved by recognizing that the volumefraction for arrested dynamics for a sheared inelastic fluid issmaller than the random close packing volume fraction foran elastic fluid. In addition, the force chains observed incontrolled volume experiments are not likely to be seen inflows with a free surface due to the lack of a compressivestress at the free surface. The second source of disagreementis the differences in the estimates for the spring stiffness forthe interaction between two particles.
The two force-displacement contact laws that are widelyused in simulations for elastic particles are the linear�Hookean� and the Hertzian contact laws, where the normalrestoring forces are f =kn� and f =kn��
3/2, respectively, where� is the linear deformation of two contacting particles per-pendicular to the surfaces of contact. For inelastic particles,these relations are modified by including viscous dampingterms, and similar relations can be written for the tangentialforce at contact as a function of the tangential displacement.The Hertzian contact law accounts for the increase in thearea of contact between two smooth particles as the defor-mation increases and is therefore better suited for contactsbetween smooth particles. However, the linear contact lawhas a constant binary collision lifetime, independent of theapproach velocities, and is consequently more widely used.In order to perform realistic simulations, it is necessary todetermine the constants kn and kn� from the material proper-ties of the grains.
If we assume that the spring constant depends only onthe elasticity modulus E and the particle diameter d, then bydimensional analysis, the spring stiffness for the linear con-tact law kn is proportional to �Ed�, while that for the Hertziancontact law, kn� is proportional to �Ed1/2�. The estimate �Ed�has been used by Silbert et al.10 and Reddy and Kumaran12
for the linear spring constant in simulations. For the Hertziancontact model, an exact calculation by Mindlin andDeresiewicz48 shows that kn��Ed1/2, in agreement with theestimate based on the dimensional analysis. Since most ma-terials �such as sand and glass� have an elasticity modulus ofthe order of 1011 N /m2, this results in the spring stiffness ofthe order of 109 N /m for 100 �m particles for the linearmodel and a spring stiffness of the order of 1011 N /m3/2 forthe Hertzian model. The estimates of the dimensionlessspring stiffness for linear and Hertzian contacts �kn / �mg /d��and �kn� / �mg /d3/2��, which are both proportional to�Ed2 /mg�, are given in Table I. It should be noted that atconstant mass density and Young’s modulus, the scaledspring stiffness are proportional to �1 /d�.
The estimate of Campbell31,32,47 has been based on themeasurements of sound speed of the order of 100 m/s inloose sand,36 which provides an elasticity modulus of theorder of 2�107 N /m2, and a spring constant of the order of103–104 N /m for particles with diameter between 100 �mand 1 mm. This estimate has led Campbell31,47 to concludethat flows of real materials are always in the multiple contactregimes. This procedure is not in agreement with theMindlin–Deresiewics calculation for the spring constant inthe Hertzian contact law, which is based on the compressionmodulus of the sand particle itself and not the compressionmodulus of a loose assembly of sand grains.
Experimental results have more recently become avail-able, which directly measure the stiffness of contacts be-tween particles.50,52 In these experiments, two individualgrains of sand were mounted on pins with a diameter of2 mm and pressed against each other. The normal displace-ment and the normal force were simultaneously measured,and the particle contact stiffness was inferred from these.The radius of curvature of the surfaces at contact was in therange 0.05–8.2 mm. There are several surprising results fromthese experiments. One of these is that for several differenttypes of sand, the force law at small forces is linear insteadof Hertzian. This because in the initial stages, the deforma-tion is due to the compression of asperities on the surface,instead of the compression of two smooth surfaces in whichthe contact area increases with time. The spring constant inthe Hertzian contact regime is well predicted by theMindlin–Deresiewicz theory, and the numerical results areabout 20% lower than the value that would be obtained if theelasticity modulus of the material is inserted into theMindlin–Deresiewicz relation. The spring constant for thelinear contact law at low forces is in the range of 0.2–2�106 N /m for a large class of materials. This spring con-stant is an order of magnitude smaller than the estimates ofReddy and Kumaran12 for particles of 100 �m in diameter,but is about two to three orders of magnitude larger than thatobtained using the speed of sound through loose sand. In ourcalculations, we use the linear spring constant of kn=0.5�106 N /m as a reference value based on the experiments ofCole and Peters.50,52 For particles with a mass density of2500 kg /m3, this results in a dimensionless spring stiffness�kn / �mg /d�� in the range of 3.82�109–3.82�107 for par-ticles with diameter in the range of 100 �m–1 mm. In thiscase, it should be noted the scaled spring constant decreasesproportional to �1 /d2� as the diameter is increased at fixed kn
and mass density. This is in contrast to the decrease propor-tional to d−1 when Young’s modulus and mass density arefixed.
For the Hertzian contact model, as discussed earlier, ex-periments show that kn� scales as Ed1/2. A lower bound on theelasticity modulus for materials, such as sand and glass, isE�0.5�1011 N /m2 �see Table I�, and if we assume a massdensity of 2500 kg /m3, the nondimensional spring stiffness
TABLE I. The Young’s modulus Y, Poisson ratio , mass density , thedimensionless number �Ed2 /mg�, which is the estimate for both the dimen-sionless linear spring stiffness �kn / �mg /d��, as well as the dimensionlessHertzian spring stiffness �kn� / �mg /d3/2�� for spheres with a diameter of100 �m some common materials.
MaterialY
�10−9 Pa�
�10−3 kg /m3� �Ed2 /mg��10−10
Iron/steela 190–210 0.27–0.30 7.83 4.63–5.13
Coppera 130 0.33 8.96 2.77
Aluminuma 70 0.33 2.70 4.94
Sandb 90–125 0.2–0.45 2.50 6.87–9.55
Glassc 50–90 0.18–0.3 2.60 3.67–6.61
aReference 49.bReference 50.
cReference 51.
113302-5 Dense granular flow down an inclined plane Phys. Fluids 22, 113302 �2010�
Downloaded 01 Jan 2011 to 203.200.35.31. Redistribution subject to AIP license or copyright; see http://pof.aip.org/about/rights_and_permissions

�kn� / �mg /d3/2�� varies in the range of 3.82�1010–3.82�109 for particles with diameter in the range of100 �m–1 mm. In this case, the scaled spring stiffness de-creases proportional to �1 /d� as the particle diameter d isincreased at constant elasticity modulus and mass density.For both linear and Hertzian contact models, it is difficult toobtain results for scaled spring stiffness greater than about108 due to computational limitations. In the present analysis,the trends in the structure and the dynamics are examined forscaled spring stiffness in the range of 2�105–2�108.
The effect of the stiffness of particle contacts on theparticle interactions in the flow down an inclined plane isexamined by calculating the coordination number, which isthe average number of particles that are in simultaneous con-tact with a particle. In addition, the fraction of particles thatoverlap with 1 ,2 ,3 , . . . other particles is also calculated inorder to examine the conditions under which the system is ina binary/multibody contact regime. The particle interactionmodels analyzed are the linear contact model with and with-out friction, as well as the Hertzian contact model withfriction.
An important measure of ordering in the flow is theicosahedral order parameter Q6 because it gives us informa-tion about the state of order in the flow.53 For a fluid ofelastic hard particles at equilibrium, the order parameter Q6
is 0 when the volume fraction is below 0.49. However, at0.49, there is spontaneous crystallization to a face centeredcubic �fcc� packing, and Q6 becomes nonzero. This impliesthat kinetic theories based on dense gases cannot be used fora volume fraction higher than 0.49 because the system is in acrystalline state with a definite lattice symmetry. Since densegranular flows mostly have a volume fraction higher than0.49, this means that the kinetic theories based on an isotro-pic pair distribution function are not valid. This leadsJenkins,17 for example, to employ a different set of constitu-tive relations for volume fractions greater than 0.49.
Recently, in simulations of sheared granular flows, it hasbeen found using ED simulations that there is no spontane-ous crystallization transition, and the system is in the randomstate even up to a volume fraction of 0.6.28,29 Shear sponta-neously breaks the ordering in the system. If hard particletheories based on a random state are to be applicable to theflow down an inclined plane, then it is important to checkthat the relative arrangement of particles is, in fact, randomin the DE simulations, and there is no fcc or hexagonalclosed packed �hcp� ordering in the system. That is why theparameter Q6 is important to verify that the state of order inthe DE and ED simulations is the same.
An attempt is also made to analyze the effect of correla-tions in the flow. Previous simulation studies27 have shownthat the spatial correlations in the velocities are insignificant.Our simulation results lead to the same conclusions, and sowe do not report these here. Previous experimental24 andsimulation28 studies have also shown that the time decay ofthe velocity autocorrelation function is much faster than thatin an elastic fluid at equilibrium. Here, we examine the cor-relations in the forces acting on a particle using two mea-sures, the “force ratio” and the “force angle,” which are dis-cussed in detail later.
There are two important phenomena that significantlyinfluence the dynamics in the shear flow of hard inelasticparticles.28,29 The first, discussed above, is the divergence ofthe collision frequency at the volume fraction for arresteddynamics �ad, which is lower than the random close packingvolume fraction for elastic particles at equilibrium. The sec-ond is the change in the form of the precollisional relativevelocity of colliding particles from the Gaussian relative ve-locity distribution for elastic particles to an exponential dis-tribution for inelastic particles with normal coefficient of res-titution en�0.8. Both of these effects are examined in DEsimulations of particles with finite spring stiffness. It is im-portant to note that discrete collisions cannot be defined inthe multibody contact regime where the coordination numberis larger than 1. Therefore, the collision frequency and therelative velocity distribution are examined only for the larg-est spring stiffness �kn / �mg /d��=2�108 used in the presentstudy.
The results for the Bagnold coefficients from the DEsimulations are compared with the results of event-drivensimulations.28,29 In order to make a quantitative comparison,we use a linear spring-dashpot model with no friction in theDE simulations. The spring constant kn in the direction nor-mal to the surfaces of contact is varied in the range of2�105–2�108, while the damping constant �n is adjustedto obtain the same coefficient of restitution for two-bodycontacts as that used in the ED simulations. The dampingconstant in the direction tangential to the surfaces at contact�t is set equal to zero so that there is no dissipation due todisplacement in the tangential direction. For a linear contactmodel with no friction, we obtain a steady flow only whenthe normal coefficient of restitution is less than 0.9, and sowe report results for normal coefficients of restitution in therange of 0.6–0.8.
As formulated above, the DE model exactly correspondsto the rough particle model with et=1, where the relativetangential velocity is reversed in a collision. Since the con-tact model in the DE simulations exactly corresponds to thecollision model in the event-driven hard particle simulations,it is possible to make a quantitative comparison of the Bag-nold coefficients obtained by the two techniques. In addition,we also compare the simulations with the predictions of thetheory,29 which included the divergence of the collision fre-quency at �ad��c under shear and the modification of therelative velocity distribution due to correlations.
In an inclined plane flow, the volume fraction is a con-stant and the stress satisfies the Bagnold law in the bulk ofthe flow, where the distance from the boundaries is largecompared to the “conduction length.”10 This is because theconduction term in the energy balance equation is smallcompared to the production of energy due to mean shear andthe dissipation due to inelastic collisions in the bulk of theflow46 and from the momentum balance equations �1� and �2�below. However, near the top and bottom boundaries, thereare “conduction boundary layers” of thickness equal to theconduction length, where the conduction term in the energybalance equation is of the same magnitude as the shear pro-duction and inelastic dissipation, and where the volume frac-tion is not a constant. In this case, a dimensionless group can
113302-6 K. A. Reddy and V. Kumaran Phys. Fluids 22, 113302 �2010�
Downloaded 01 Jan 2011 to 203.200.35.31. Redistribution subject to AIP license or copyright; see http://pof.aip.org/about/rights_and_permissions
be formed using the energy flux, the stress, the particle mass,and the thermal conductivity, and so the Bagnold law is nolonger a dimensional necessity. In order to obtain a constantvolume fraction, it is necessary to show that this energy con-duction term is not important in the bulk of the flow. Thisissue was examined in Ref. 46, where it was shown that therate of conduction of energy is important in boundary layersof thickness comparable to the conduction length for a densegranular flow scales as �d / �1−en�1/2�, where en is the normalcoefficient of restitution. The conduction length is large com-pared to the particle diameter for nearly elastic particles, butis of the same magnitude as the particle diameter for highlyinelastic particles. In simulations, the thickness of the topand bottom boundary layers is usually about 3–5 particlediameters. In the present study, we focus on the bulk flow.The top 5 and bottom 5 layers in the y direction are notconsidered when results are reported, and only the central 30layers are used for calculating the coordination number andthe stresses in the flow.
II. SIMULATION TECHNIQUE
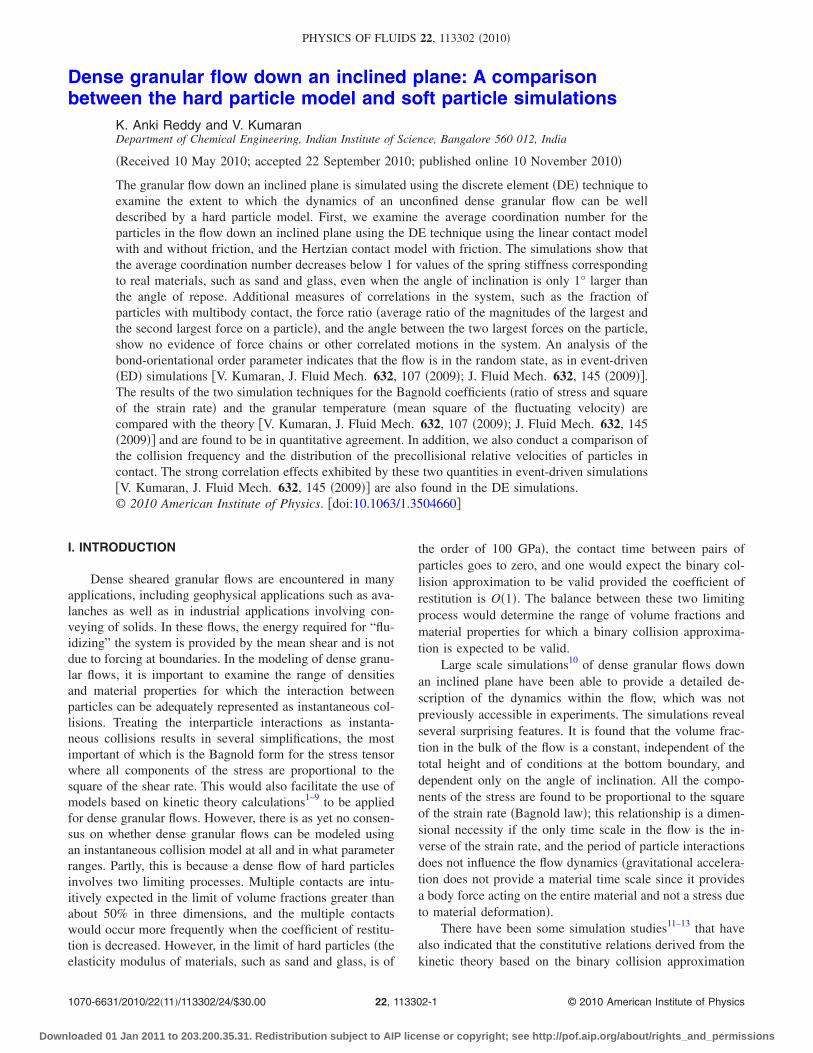
The granular material is composed of monodisperse hardparticles of diameter d flowing down a plane inclined at anangle � to the horizontal. A Cartesian coordinate system isused, where the velocity and velocity gradient are in the xand y directions, respectively, while the z direction is perpen-dicular to the plane of flow, as shown in Fig. 1. It should benoted that throughout the analysis, the mass of a particle isset equal to 1 for simplicity so that the mass dimension isscaled by the particle mass. The shear and normal stressbalances are
�d�xy/dy� = − g sin��� ,
�1��d�yy/dy� = g cos��� .
where g is the acceleration due to gravity. The ratio of theshear and normal stresses is a constant in the flow,
��xy/�yy� = − tan��� . �2�
In the simulations, periodic boundary conditions are ap-plied in the x and z directions, while rough particle boundaryconditions10 are applied at the bottom of the flowing layer inthe y direction, and there is a free surface at the top of thelayer. The simulation cell contains a total of 8000 particles,with aspect ratio of 2:4:1 along the x, y, and z directions,respectively. This gives us a total height of the flowing layerof about 40 particle diameters. The simulation is started with
random initial velocities for all the particles, and the simula-tion is permitted to evolve until steady state is reached.
The discrete element technique is used for simulating theflow, and the particle contact models used here are the linearand Hertzian contact models. The linear contact model re-sults in a constant coefficient of restitution for binary inter-actions, but the coefficient of restitution for the Hertzian con-tact model is velocity dependent, as discussed below. Thedetails of the simulation technique have been discussed indetail in a previous study,10 and a brief summary is providedin Appendix A.
The linear contact model without friction can be directlycompared with theory and with ED simulations with a con-stant coefficient of restitution since the contact time and co-efficient of restitution are independent of the initial velocity.In the case of the linear contact model with no friction, wehave been able to obtain a stable flow only for coefficient ofrestitution en 0.8, while the flow for en=0.9 was continu-ously accelerating. A stable flow was obtained when theangle of inclination was 21° � 24°. In the case of thelinear contact model with friction, we have been able to ob-tain a steady flow for en 0.9, and we report the results forthe coefficient of restitution in the range of 0.5 en 0.9. Asteady flow is obtained when the angle of inclination is in therange of 21° � 25°. In the case of the Hertzian contactmodel, we were not able to obtain a steady flow for a rea-sonable range of angles of inclination without friction.Therefore, we do not report the results for the Hertzian con-tact model with no friction. In the case of the Hertzian con-tact model with friction, a steady flow was observed for21° � 25° when the friction coefficient is set equal to0.5. The parameters used in the DE simulations are providedin Table II.
In addition to the DE simulations, we also use the EDsimulations of the simple shear flow using the Lees–Edwardsboundary conditions in the absence of gravity. The procedureused is the same as that in Refs. 28 and 29. The hard particlemodel is used in the ED simulations, and collisions betweenparticles are instantaneous. The purpose is to make a com-parison between the local rheology in the bulk of the granu-lar flow down an inclined plane and the rheology in a uni-form homogeneous shear flow. It has already been reported54
that rheological parameters in the bulk of the flow down aninclined plane in DE simulations are in quantitative agree-ment with those of a linear shear flow using DE simulationsin the absence of gravity. This implies that the stresses in thebulk of the flow down an inclined plane are only a functionof the local strain rate. The objective here is to compare thestresses in the DE simulations for the flow down an inclinedplane, as the spring constant is increased, with the stressesfor the hard particle model with instantaneous interactions.In this simulation technique, the interaction between par-ticles are modeled as instantaneous contacts, in which thepostcollisional relative velocity normal to the surface of con-tact is −en times the precollisional relative normal velocity,and the postcollisional relative velocity tangential to the sur-face of contact is −et times the precollisional relative tangen-tial velocity. Here, en is the normal coefficient of restitutionand et is the tangential coefficient of restitution. The tangen-
h
δ
δ
θ
g
y
xz
FIG. 1. Configuration and coordinate system.
113302-7 Dense granular flow down an inclined plane Phys. Fluids 22, 113302 �2010�
Downloaded 01 Jan 2011 to 203.200.35.31. Redistribution subject to AIP license or copyright; see http://pof.aip.org/about/rights_and_permissions

tial coefficient of restitution et is set equal to 1 in the EDsimulations in order to correspond to the choice �t=0 in theDE simulations. The normal coefficient of restitution is cal-culated from Eq. �A7� for the linear force model.
The results of the DE simulations are compared with theresults of event-driven hard particle simulations.28,29 Thosesimulations were carried out in a cubic box using 500 par-ticles. All simulations were averaged over 2�104 collisionsper particle, after an initial equilibration run that extendedover a time period corresponding to 2�104 collisions perparticle. For very small system sizes, when the system issheared, it attains in-plane ordering for the volume fractionsconsidered here, and the structure is not random. As the sys-tem size is increased, the ordered state becomes unstable andundergoes a transition to a random state. It is this randomstate that is of interest in the present analysis, so care hasbeen taken to ensure that the structure is actually random inboth ED and DE simulations. Event-driven simulations suf-fer from the disadvantage of numerical errors due to particleoverlaps when the system becomes dense. Due to the finitenumerical resolution in the computations and the round-offerrors therein, the actual distance between particles at colli-sion is not equal to the projected distance that was calculatedin the event-driven algorithm. When the volume fraction ishigh, there are often repeated collisions involving the sameparticle separated by time intervals approaching the round-off errors. Due to this, there may be an overlap between twoparticles at a collision time comparable to the round-off er-rors. When the collision time is next calculated with overlap-ping particles, a positive collision time is not obtained be-cause they are already overlapping. This could result in theoverlaps becoming larger. This often happens at high densi-ties, resulting in the failure of the numerical scheme. This isrelated to the inelastic collapse phenomenon, where an infi-nite number of collisions take place in finite time55,56 and inthe two-dimensional homogeneous cooling state of a granu-lar fluid.57 This error can be overcome by using a more re-alistic velocity dependent coefficient of restitution, whichgoes to 1 when the relative velocity goes to 0 �Ref. 58� aspredicted by theories of deformable viscoelastic particles,59
or by switching off inelasticity if the time between collisionsis smaller than a minimum value.60 In the present analysis,we do not apply these techniques, and we report the results
only for cases where there are no particle overlaps in the EDsimulations. In case there are particle overlaps, the results arediscarded.
III. RESULTS
A. Contacts and coordination number
The average coordination number is the average numberof particles that are in contact with a particle at any instant intime. Since the hard particle model was used in DE simula-tions, all interactions are instantaneous collisions and the co-ordination number is infinitesimally small. In the DE simu-lations, at every time step, the number of particles that are incontact with a particle is determined, and this is averagedover all the particles in the central region of the inclinedplane flow and over time in order to obtain the average co-ordination number. We examine how the coordination num-ber changes as the constants kn and kn� in the contact law areincreased.
First, it is important to note that the coordination numberis a function of height, even though the volume fractionshows very little variation with height, due to the increase inthe overburden of particles deeper into the flow. This varia-tion is shown for different angles of inclination and springstiffnesses in Appendix B. Here, we find that the coordina-tion number within the bulk of the flow, excluding the con-duction layers with thickness of 5 particle diameters at thetop and bottom, varies by about 15%. This is much largerthan the variation in the volume fraction, but it is smallerthan the variation expected if the coordination number in-creases proportional to the overburden. In the following, weshow the results for the average coordination number in thebulk of the flow excluding the top and bottom 5 layers.
Figures 2–4 show the change in the coordination numberas the stiffness parameters kn and kn� are increased over fourorders of magnitude, both for linear contact law with nofriction, the linear contact law with friction, and the Hertziancontact law with fiction, respectively. In all cases, it is ob-served that the coordination number has a maximum valuebetween 2 and 4 for the lowest angles of inclination and thelowest scaled spring stiffness of 2�105 used in the presentsimulations. However, as the spring stiffness increases, thecoordination number decreases. For a scaled spring stiffness
TABLE II. Parameter values used in the DE simulations. The friction coefficient was set equal to 0.5 in allsimulations with friction.
Linear no friction Linear with friction Hertzian with friction
�kn / �mg /d�� ��n / �g /d�1/2� en �kn / �mg /d�� ��n / �g /d�1/2� en �kn� / �mg /d3/2�� ��n� / �g1/2 /d��
2�105 89.62 0.8 2�105 42.40 0.9 2�105 275
2�106 283.40 0.8 2�107 134.07 0.9 2�106 890
2�107 896.19 0.8 2�107 423.98 0.9 2�108 8900
2�108 2834.01 0.8 2�108 1340.74 0.9 2�105 55
2�105 203.01 0.6 2�105 272.53 0.5 2�106 185
2�106 641.97 0.6 2�106 861.82 0.5 2�108 1850
2�107 2030.09 0.6 2�107 2725.30 0.5
2�108 6419.72 0.6 2�108 8618.15 0.5
113302-8 K. A. Reddy and V. Kumaran Phys. Fluids 22, 113302 �2010�
Downloaded 01 Jan 2011 to 203.200.35.31. Redistribution subject to AIP license or copyright; see http://pof.aip.org/about/rights_and_permissions

of 2�108, the coordination number decreases below 1 in allcases, except for the lowest angle of inclination of 21°. Thisimplies that each particle is in contact with less than 1 par-ticle, on average, for a scaled spring stiffness of 108 for bothlinear and Hertzian models. The coordination number in-creases systematically as the coefficient of restitution is de-creased, and it is larger when there is friction between theparticles. Also shown by the vertical dashed lined in Figs. 2and 3 �and in subsequent figures for the linear contact law�are the scaled spring constants �kn / �mg /d��=3.82�107 and3.82�109 for particles with diameters of 1 mm and100 �m, respectively, a mass density of 2500 kg /m3, and atypical dimensional spring constant of 2�106 N /m �Refs.50 and 52� for sand particles. It is clear that the coordinationnumber for the flow of real particles is greater than 1 only at
the lowest angle of inclination of 21°, and it decreases below1 for all other angles of inclination. The dashed lines in Fig.4 shows scaled spring constants �kn� / �mg /d3/2��=3.82�109
and 3.82�1010, corresponding to smooth sand particles withdiameters of 100 �m and 1 mm, mass density of2500 kg /m3, and elastic modulus of 1011 N /m2 for particlessuch as sand and glass beads. Even though the coordinationnumber for the Hertzian contact model is higher than that forthe linear contact model for equal values of the scaled springconstant, smooth particles that follow the Hertzian contactlaw have a higher scaled spring constant than rough particlesthat follow a linear contact law. Due to this, the trends in Fig.4 show that the coordination number for particles with theHertzian contact law also decreases below 1 for all angles,except the lowest angle of 21°.
The duration of an interaction between two particles isindependent of the approach velocity for the linear contactmodel, but does depend on the relative velocity in the Hert-zian model. However, from the dimensional analysis, it canbe inferred that the duration of an interaction is proportionalto �m /k�1/2. If the coordination number decreases propor-tional to the duration of an interaction at a fixed angle ofinclination, one would expect the coordination number todecrease proportional to k−1/2 �we have assumed the particlemass is 1 without loss of generality�. The dotted lines inFigs. 2–4 have a slope of ��1/2�. It is observed that thedecrease in the coordination number is consistent with thek−1/2 power law at all angles of inclination, except for thelowest angle of 21°, where we see little change in the coor-dination number as the angle of inclination is increased.
More detailed statistics of particle contacts, including thefraction of particles in simultaneous contact with 1 ,2 ,3 , . . .other particles, is provided in Appendix B. Consistent with
105 106 107 108 109 1010
(kn/(mg/d))
10-2
10-1
1
Co-o
rdin
ation
num
ber
FIG. 2. Average coordination number as a function of the spring constantfor the linear force model with no friction for kt= �2kn /7�, �t=0, and thevalue of �n chosen so that en=0.8 �filled symbols� and en=0.6 �open sym-bols�. The angles of inclination are �=21° ���, �=22° ���, �=23° ���, and�=24° �� �. The vertical dashed lines correspond to �kn / �mg /d��=3.82�109 and 3.82�107, which are the reference values for particles withkn=0.5�106 N /m, mass density of 2500 kg /m3, and diameter of100 �m–1 mm, respectively. The dotted line shows a slope of ��1/2�.
105 106 107 108 109 1010
(kn/(mg/d))
10-2
10-1
1
Co-o
rdin
ation
num
ber
FIG. 3. Average coordination number as a function of the spring constantfor the linear force model with friction ��=0.5� for �et=1, en=0.9� �filledsymbols� and �et=1, en=0.5� �open symbols�. The angles of inclination are�=21° ���, �=22° ���, �=23° ���, �=24° �� �, and �=25° �� �. Thevertical dashed lines correspond to �kn / �mg /d��=3.82�109 and 3.82�107,which are the reference values for particles with kn=0.5�106 N /m, massdensity of 2500 kg /m3, and diameter of 100 �m–1 mm, respectively. Thedotted line shows a slope of ��1/2�.
105 106 107 108 109 1010 1011
(kn’ / (mg/d 3/2))
10-2
10-1
1
Co
-ord
ina
tio
nn
um
be
r
FIG. 4. Average coordination number as a function of the springconstant for the Hertzian force model with friction ��=0.5�. The opensymbols are for system with higher dissipation: ��kn� / �mg /d3/2��=2�105 , ��n� / �g1/2 /d��=275; ��kn� / �mg /d3/2��=2�106 , ��n� / �g1/2 /d��=890;and ��kn� / �mg /d3/2��=2�108 , ��n� / �g1/2 /d��=8900; while the filled sym-bols are for a system with lower dissipation: ��kn� / �mg /d3/2��=2�105 , ��n� / �g1/2 /d��=55; ��kn� / �mg /d3/2��=2�106 , ��n� / �g1/2 /d��=185;and ��kn� / �mg /d3/2��=2�108 , ��n� / �g1/2 /d��=1850. The angles of inclina-tion are �=21° ���, �=22° ���, �=23° ���, �=24° �� �, and �=25° �� �.The vertical dashed lines correspond to �Ed2 /mg�=3.82�1010 and 3.82�109, which are the reference values for particles with E=0.5�1011 N /m2, mass density of 2500 kg /m3, and diameter of100 �m–1 mm, respectively. The dotted line shows a slope of ��1/2�.
113302-9 Dense granular flow down an inclined plane Phys. Fluids 22, 113302 �2010�
Downloaded 01 Jan 2011 to 203.200.35.31. Redistribution subject to AIP license or copyright; see http://pof.aip.org/about/rights_and_permissions
the coordination number results, we find that at the lowestangle of inclination �=21°, there is little change in the num-ber of particles with 1 and 2 contacts as the spring stiffness isincreased. However, for ��22°, there is a systematic de-crease in the number of particles with 1 or more contacts asthe spring stiffness is increased, and the fraction of particleswith no contacts shows a monotonic increase.
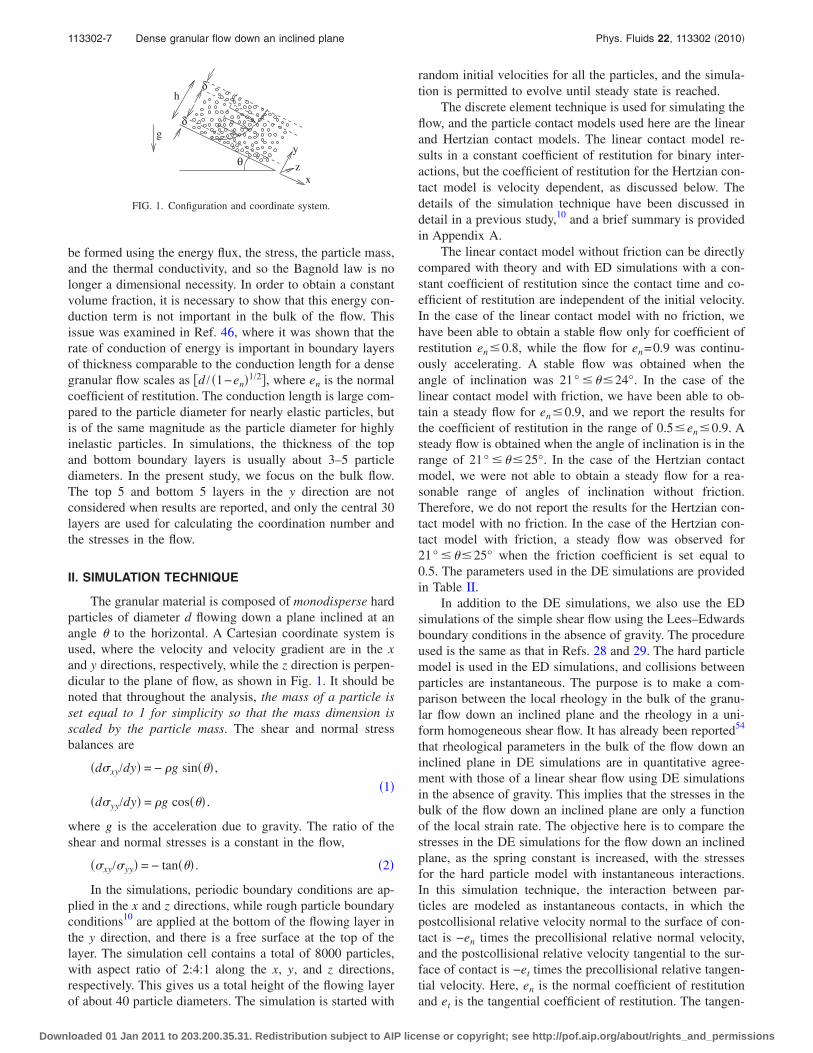
In the case of particles with multiple contacts, we canuse the force ratio,12 which is the ratio of the magnitudes ofthe second largest and the largest force acting on the particleat an instant. This force ratio is averaged over all the par-ticles with two or more contacts, and over time, to get anaverage force ratio Fr. The force ratio and force angle areintended to provide some quantitative indication of whetherthere are force chains in the system. A force ratio close to 1is a necessary, although not sufficient, requirement for forcechains since there should be, at least, two instantaneous op-posing forces on a single particle if stress is to be transmit-ted, which means that the magnitude of the two largest forceshave to be nearly equal. The force angle is intended to mea-sure whether the forces are opposing each other.
In the quasistatic limit where a particle is held in placeby forces of the same magnitude from all directions, theforce ratio will be close to 1. Alternatively, if there is onedominant force on the particle while all other forces are closeto zero, then the force ratio will be small. Therefore, theforce ratio provides an indication of whether the motion of aparticle with multiple contacts is dominated by one dominantcontact with a large force or whether all the forces on aparticle are of the same magnitude. The force ratio is shownas a function of the angle of inclination for the linear contactmodel with no friction in Fig. 5, for the linear contact modelwith friction in Fig. 6, and for the Hertzian contact model inFig. 7. These figures show that the force ratio decreases asthe angle of inclination increases and as the coefficient ofrestitution increases. The force ratio has a maximum value of
about 0.4 for the softest particles considered here, but it de-creases below 0.3 when the angle of inclination is 21° andfor scaled spring constants corresponding to materials suchas sand and glass. The force ratio is less than 0.2 for highervalues of the angle of inclination, indicating that there is, onaverage, only one dominant force on a particle. The forceratio does not also show a significant dependence on friction.
For particles with multiple contacts, the “force cosine”can be used as a measure to determine whether a particle
105 106 107 108 109 1010
(kn/(mg/d))
0
0.2
0.4
0.6
Fr
FIG. 5. The average ratio of the magnitudes of the second largest and thelargest forces acting on a particle, Fr= �F2 / F1�, as a function of the springconstant for the linear force model with no friction for en=0.8 �filled sym-bols� and en=0.6 �open symbols�. The angles of inclination are �=21° ���,�=22° ���, �=23° ���, and �=24° �� �. The vertical dashed lines corre-spond to �kn / �mg /d��=3.82�109 and 3.82�107, which are the referencevalues for particles with kn=0.5�106 N /m, mass density of 2500 kg /m3,and diameter of 100 �m–1 mm, respectively.
105 106 107 108 109 1010
(kn/(mg/d))
0
0.2
0.4
0.6
Fr
FIG. 6. The average ratio of the magnitudes of the second largest and thelargest forces acting on a particle, Fr= �F2 / F1�, as a function of the springconstant for the linear force model with friction for en=0.8 �filled symbols�and en=0.6 �open symbols�. The angles of inclination are �=21° ���,�=22° ���, �=23° ���, �=24° �� �, and �=25° �� �. The vertical dashedlines correspond to �kn / �mg /d��=3.82�109 and 3.82�107, which are thereference values for particles with kn=0.5�106 N /m, mass density of2500 kg /m3, and diameter of 100 �m–1 mm, respectively.
105 106 107 108 109 1010 1011
(kn’/(mg/d 3/2))
0
0.2
0.4
0.6
Fr
FIG. 7. The average ratio of the magnitudes of the second largest and thelargest forces acting on a particle, Fr= �F2 / F1�, as a function of thespring constant for the Hertzian contact model with friction. The opensymbols are for system with higher dissipation: ��kn� / �mg /d3/2��=2�105 , ��n� / �g1/2 /d��=275; ��kn� / �mg /d3/2��=2�106 , ��n� / �g1/2 /d��=890;and ��kn� / �mg /d3/2��=2�108 , ��n� / �g1/2 /d��=8900; while the filled sym-bols are for a system with lower dissipation: ��kn� / �mg /d3/2��=2�105 , ��n� / �g1/2 /d��=55; ��kn� / �mg /d3/2��=2�106 , ��n� / �g1/2 /d��=185;and ��kn� / �mg /d3/2��=2�108 , ��n� / �g1/2 /d��=1850. The angles of inclina-tion are �=21° ���, �=22° ���, �=23° ���, �=24° �� �, and �=25° �� �.The vertical dashed lines correspond to �Ed2 /mg�=3.82�1010 and 3.82�109, which are the reference values for particles with E=0.5�1011 N /m2, mass density of 2500 kg /m3, and diameter of100 �m–1 mm, respectively.
113302-10 K. A. Reddy and V. Kumaran Phys. Fluids 22, 113302 �2010�
Downloaded 01 Jan 2011 to 203.200.35.31. Redistribution subject to AIP license or copyright; see http://pof.aip.org/about/rights_and_permissions

could be a part of a force chain as follows. Consider a par-ticle with two contacts, in which the forces with the largestand second largest magnitude are F1 and F2. The cosine ofthe angle between these two forces is given by��F1 ·F2� / F1F2�. If the two largest forces on a particle withmultiple contacts are nearly collinear, then the parameter��F1 ·F2� / F1F2� will be close to �1. If ��F1 ·F2� / F1F2�is close to zero, it indicates that there is no correlation in thealignment of the two largest forces. Since the two largestforces on the particles have to be nearly collinear for theparticle to be a part of a force chain, a value of��F1 ·F2� / F1F2� close to �1 is a necessary �though notsufficient� condition for the presence of force chains in thesystem. Figure 8–10 shows the value of �F1 ·F2� / �F1F2�for nearly elastic and highly inelastic particles for different
coefficients of restitution and for different angles of inclina-tion for the different contact models. The force cosine isnegative in all cases, indicating that there is a bias toward theopposite orientation of the two largest forces on the particles.However, the force cosine is numerically small in all cases,indicating that this bias is small. This shows that even whena particle overlaps with two other particles, there is no sig-nificant bias for the contact forces to be opposite in directionto each other, as would be required for percolating forcechains in the system.
Next, we analyze the relative arrangement of particles inthe flow, which is quantified by the structural order param-eter Ql, defined as
Ql = �2l + 1
4��
m=−l
l
Ylm��,���2�1/2
, �3�
where Ylm�� ,�� is the spherical harmonic,
Ylm��,�� =�2l + 1
4�Pl
m�cos����exp�ım�� �4�
� and � are the azimuthal and meridional angles in a spheri-cal coordinate system with an arbitrary axis, and Pl
m are theLegendre polynomials. For systems with perfect icosahedralordering �fcc or bcp structures�, Q6 is greater than 0.5,whereas it is 0 for random structures. Therefore, Q6 can beused to distinguish between random and ordered structures.For the DE simulations, the averaging in Eq. �3� is carriedout over all the contacts of a particle, over all particles in thecentral region of the inclined plane flow, and over time. Inthe ED simulations, the average is carried out over collisionsbecause particles are in contact only when there is a colli-
105 106 107 108 109 1010
(kn / (mg/d))
0
0.2
0.4
0.6
-(F
1.F
2)/
(|F
1||F
2|)
FIG. 8. The average of the force cosine, �F1 ·F2� / �F1F2�, for the twolargest forces acting on a particle, for the linear force model with no frictionfor en=0.8 �filled symbols� and en=0.6 �open symbols�. The angles of incli-nation are �=21° ���, �=22° ���, �=23° ���, and �=24° �� �. The verticaldashed lines correspond to �kn / �mg /d��=3.82�109 and 3.82�107, whichare the reference values for particles with kn=0.5�106 N /m, mass densityof 2500 kg /m3, and diameter of 100 �m–1 mm, respectively.
105 106 107 108 109 1010
(kn/(mg/d))
0
0.2
0.4
0.6
-(F
1.F
2)/
(|F
1||F
2|)
FIG. 9. The average of the force cosine, �F1 ·F2� / �F1F2�, for the twolargest forces acting on a particle, for the linear force model with friction foren=0.8 �filled symbols� and en=0.6 �open symbols�. The angles of inclina-tion are �=21° ���, �=22° ���, �=23° ���, �=24° �� �, and �=25° �� �.The vertical dashed lines correspond to �kn / �mg /d��=3.82�109 and 3.82�107, which are the reference values for particles with kn=0.5�106 N /m, mass density of 2500 kg /m3, and diameter of100 �m–1 mm, respectively.
105 106 107 108 109 1010 1011
(kn’ / (mg/d 3/2))
0
0.2
0.4
0.6
-(F
1.F
2)/
(|F
1||F
2|)
FIG. 10. The average of the force cosine, �F1 ·F2� / �F1F2�, for the twolargest forces acting on a particle, for the Hertzian force model with friction.The open symbols are for system with higher dissipation: ��kn� / �mg /d3/2��=2�105 , ��n� / �g1/2 /d��=275; ��kn� / �mg /d3/2��=2�106 , ��n� / �g1/2 /d��=890; and ��kn� / �mg /d3/2��=2�108 , ��n� / �g1/2 /d��=8900; while the filledsymbols are for a system with lower dissipation: ��kn� / �mg /d3/2��=2�105 , ��n� / �g1/2 /d��=55; ��kn� / �mg /d3/2��=2�106 , ��n� / �g1/2 /d��=185;and ��kn� / �mg /d3/2��=2�108 , ��n� / �g1/2 /d��=1850. The angles of inclina-tion are �=21° ���, �=22° ���, �=23° ���, �=24° �� �, and �=25° �� �.The vertical dashed lines correspond to �Ed2 /mg�=3.82�1010 and 3.82�109, which are the reference values for particles with E=0.5�1011 N /m2, mass density OF 2500 kg /m3, and diameter of100 �m–1 mm, respectively.
113302-11 Dense granular flow down an inclined plane Phys. Fluids 22, 113302 �2010�
Downloaded 01 Jan 2011 to 203.200.35.31. Redistribution subject to AIP license or copyright; see http://pof.aip.org/about/rights_and_permissions

sion. It should be noted that the ED simulations were carriedout for a homogeneously sheared collection of spherical par-ticles using Lees–Edwards periodic boundary conditions.
For a collection of elastic particles in the absence ofshear, it is well known61 that there is a crystallization transi-tion at a volume fraction of 0.49, after which the parameterQ6 increases to a value between 0.5 and 0.6. In the case ofshear flows of inelastic particles, ED simulations28 haveshown that the system remains in the disordered state evenwhen the volume fraction is in the range of 0.5–0.6, providedthe system size is sufficiently large. This indicates that meanshear has a randomizing effect on the relative arrangementsof the particles in the flow. It is of interest to examinewhether such a randomizing effect is observed for the bulkflow down an inclined plane in the DE simulations. The or-der parameter Q6 is shown as a function of the volume frac-tion for scaled spring constant �kn / �mg /d��=2�105 in Fig.11. The values of Q6 for all other values of the spring con-stant are also below 2.5�10−2, indicating that there is noicosahedral order in the shear flow of soft particles down aninclined plane.
IV. GRANULAR TEMPERATURE AND DISSIPATIONRATE
The “granular temperature” is defined as
6T = m��ux − U�2 + uy2 + uz
2� + I��x2 + �y
2� + ��z − ��2�
�5�
where x, y, and z are the flow, gradient, and vorticity direc-tions, respectively, m is the particle mass, I is the moment ofinertia, U is the local mean velocity in the flow direction, and� is the local mean angular velocity. We also calculate theaverage rate of dissipation of energy per unit volume per unittime from the total energy dissipated due to particle interac-tions in a differential volume. In the bulk of the flow, wherethere is a balance between the rate of production of energy
due to mean shear and the rate of dissipation due to particleinteractions, the hard particle model predicts that �T /m�̇2d2�and �Dd /m�̇3� are constants, where T and D are the localtemperature and dissipation rates, �̇ is the strain rate, and d isthe particle diameter. These features have been observed ear-lier in the simulation of Lois et al.40 and Silbert et al.10 Thisis a consequence of the absence of any material time scale inthe hard particle model, due to which the only time scale isthe inverse of the strain rate. We test this in the DE simula-tions by plotting the ratios �T /m�̇2d2� and �Dd4 /m�T /m�3/2�in Fig. 12. In this figure, each data point is obtained byaveraging over three-particle layers.
In order to validate our simulation results, we show thescaled temperature �T / �̇2d2� and the scaled dissipation rate�Dd4 /T3/2� in Fig. 12. It is observed that there is a variationof about 7% in the temperature and dissipation rate acrossthe flow for a coefficient of restitution of 0.6, but this varia-tion decreases as the coefficient of restitution increases.However, there is no systematic variation in the scaled tem-perature and dissipation rate with height, in agreement withour expectation for the hard particle model. In the following,we compare the scaled temperature �T /m�̇2d2� and�Dd4 /m�T /m�3/2�, which are obtained by averaging over thebulk of the channel for 5 �y /d� 33, which the results ofevent-driven simulations for a homogeneous linear shearflow.28,29
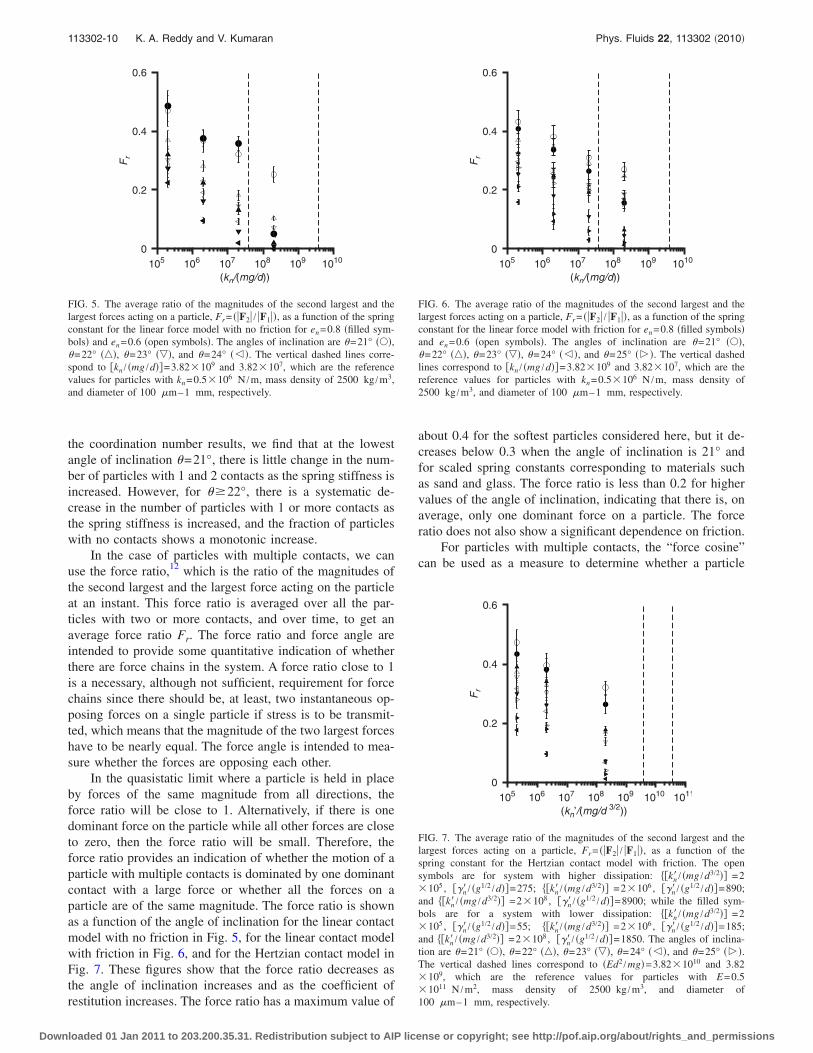
The variation of the temperature with volume fraction isshown in Fig. 13. The ED simulations predict that the tem-perature decreases as the coefficient of restitution decreases,and there is a rather sharp increase in the temperature as the�ad is approached. From the ED simulations, it appears thatthe temperatures for the different coefficients of restitutionshould cross since the slope of the volume fraction-temperature curves do increase as the coefficient of restitu-tion decreases. The results of the DE simulations, in additionto being in quantitative agreement with the ED simulations,also show that the temperatures for the different coefficientsof restitution do cross over. Very close to �ad, the tempera-ture seems to increase as the coefficient of restitution de-
0.48 0.52 0.56 0.6 0.64
φ
0
0.1
0.2
0.3
0.4
0.5
0.6
Q6
FIG. 11. The icosahedral order parameter Q6 as a function of the volumefraction for hard inelastic particles obtained by event-driven simulations�Ref. 28� �open symbols�, for the linear force model with no friction for�kn / �mg /d��=2�105 �filled symbols�, and for different coefficients of res-titution en=0.6 ���, en=0.7 ���, en=0.8 ���, and en=0.9 �� �. The symbol+ shows the icosahedral order parameter for elastic particles in the absenceof shear.
0 5 10 15 20 25 30 35 40
(y/d)
0
0.2
0.4
0.6
0.8
1
T∗
0
20
40
60
80
100
120
140
160
180
200
D∗
FIG. 12. The scaled temperature T�= �T /m�̇2d2� �� on the left y axis� andscaled dissipation rate D�= �Dd4 /T3/2� �� on the right y axis� as a functionof �y /d�, where y is the distance from the bottom of the flowing layer for thelinear contact model with no friction. The open symbols show the results forangle of inclination �=23°, �kn / �mg /d��=2�108, and en=0.6, while thefilled symbols show the results for �=24°, �kn / �mg /d��=2�105, anden=0.8.
113302-12 K. A. Reddy and V. Kumaran Phys. Fluids 22, 113302 �2010�
Downloaded 01 Jan 2011 to 203.200.35.31. Redistribution subject to AIP license or copyright; see http://pof.aip.org/about/rights_and_permissions
creases. Another puzzling feature is the apparent divergenceof the temperature at the lowest coefficients of restitutionconsidered here. It should be noted that in all the simulationresults shown in Fig. 13, the temperature increases only by afactor between 4 and 5, and so a true divergence cannot bedefinitively inferred. However, one could speculate on thephysical mechanisms, which could give rise to a divergence.The temperature is determined by a balance between the rateof production of energy due to mean shear and the rate ofdissipation due to inelastic collisions. The rate of productionis the product of the shear stress �Bxy�̇
2 /d� and the strainrate, and so it is proportional to the Bagnold coefficient�Bxy�̇
3 /d�, where d is the particle diameter, and the Bagnoldcoefficient is a dimensionless function of the volume fractionand the coefficient of restitution. The dissipation rate �perunit volume� is proportional to D�T3/2d−4, where D� is adimensionless function of the volume fraction and coeffi-cients of restitution. Therefore, we find that �T / �̇2d2���Bxy /D��2/3. Therefore, the temperature can diverge near�ad only if Bxy diverges faster than D�. The nature of thedivergence cannot be definitively inferred from the simula-tion data in Fig. 13.
The scaled dissipation rate is shown in Fig. 14 for boththe event-driven and the DE simulations. In this figure, theerror bars in the volume fraction axis translate into signifi-cant variations in the dissipation rate because of the sharpincrease in the dissipation rate with volume fraction near�ad. However, subject to these error bars, there is quantita-tive agreement between theory, ED simulations, and DEsimulations.
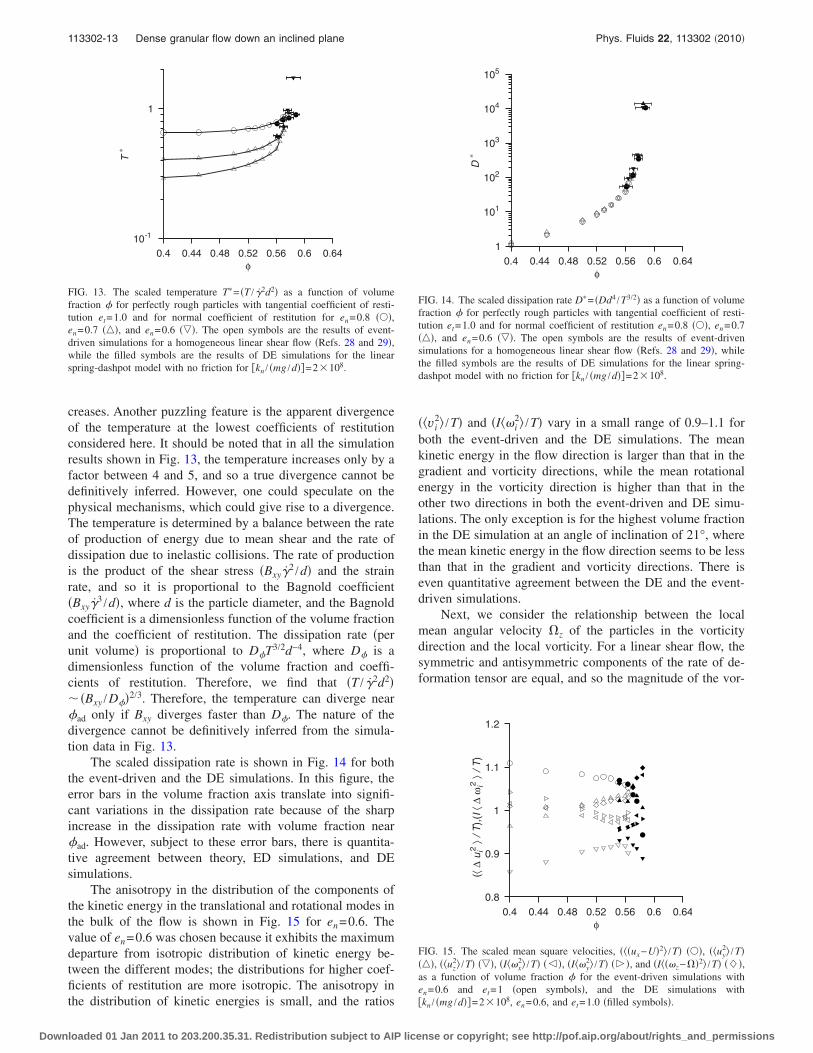
The anisotropy in the distribution of the components ofthe kinetic energy in the translational and rotational modes inthe bulk of the flow is shown in Fig. 15 for en=0.6. Thevalue of en=0.6 was chosen because it exhibits the maximumdeparture from isotropic distribution of kinetic energy be-tween the different modes; the distributions for higher coef-ficients of restitution are more isotropic. The anisotropy inthe distribution of kinetic energies is small, and the ratios
� vi2� /T� and �I �i
2� /T� vary in a small range of 0.9–1.1 forboth the event-driven and the DE simulations. The meankinetic energy in the flow direction is larger than that in thegradient and vorticity directions, while the mean rotationalenergy in the vorticity direction is higher than that in theother two directions in both the event-driven and DE simu-lations. The only exception is for the highest volume fractionin the DE simulation at an angle of inclination of 21°, wherethe mean kinetic energy in the flow direction seems to be lessthan that in the gradient and vorticity directions. There iseven quantitative agreement between the DE and the event-driven simulations.
Next, we consider the relationship between the localmean angular velocity �z of the particles in the vorticitydirection and the local vorticity. For a linear shear flow, thesymmetric and antisymmetric components of the rate of de-formation tensor are equal, and so the magnitude of the vor-
0.4 0.44 0.48 0.52 0.56 0.6 0.64
φ
10-1
1
T∗
FIG. 13. The scaled temperature T�= �T / �̇2d2� as a function of volumefraction � for perfectly rough particles with tangential coefficient of resti-tution et=1.0 and for normal coefficient of restitution for en=0.8 ���,en=0.7 ���, and en=0.6 ���. The open symbols are the results of event-driven simulations for a homogeneous linear shear flow �Refs. 28 and 29�,while the filled symbols are the results of DE simulations for the linearspring-dashpot model with no friction for �kn / �mg /d��=2�108.
0.4 0.44 0.48 0.52 0.56 0.6 0.64
φ
1
101
102
103
104
105
D∗
FIG. 14. The scaled dissipation rate D�= �Dd4 /T3/2� as a function of volumefraction � for perfectly rough particles with tangential coefficient of resti-tution et=1.0 and for normal coefficient of restitution en=0.8 ���, en=0.7���, and en=0.6 ���. The open symbols are the results of event-drivensimulations for a homogeneous linear shear flow �Refs. 28 and 29�, whilethe filled symbols are the results of DE simulations for the linear spring-dashpot model with no friction for �kn / �mg /d��=2�108.
0.4 0.44 0.48 0.52 0.56 0.6 0.64
φ
0.8
0.9
1
1.1
1.2
(⟨Δ
ui2
⟩/T
),(I
⟨Δω
i2⟩/
T)
FIG. 15. The scaled mean square velocities, � �ux−U�2� /T� ���, � uy2� /T�
���, � uz2� /T� ���, �I �x
2� /T� �� �, �I �y2� /T� �� �, and �I ��z−��2� /T� ���,
as a function of volume fraction � for the event-driven simulations withen=0.6 and et=1 �open symbols�, and the DE simulations with�kn / �mg /d��=2�108, en=0.6, and et=1.0 �filled symbols�.
113302-13 Dense granular flow down an inclined plane Phys. Fluids 22, 113302 �2010�
Downloaded 01 Jan 2011 to 203.200.35.31. Redistribution subject to AIP license or copyright; see http://pof.aip.org/about/rights_and_permissions

ticity is equal to the magnitude of the strain rate, and thedirection of the vorticity vector is along the −z axis. In thesimulations, we find that the angular velocity �z is negative�particles are rotating in the clockwise direction, on average�.In Fig. 16, we show the ratio �−�z / �̇��, where the ratio ofthe local mean angular velocity and strain rate is taken, andthen averaged over the central region of the flow. There aresignificant error bars in the calculation of both the volumefraction and the mean angular velocity. However, it is clearthat the ratio is, to within simulation accuracy, equal to 0.5,indicating that the mean angular velocity of the particles isequal to the local material rotation rate. A similar result wasobtained for all the other collision models used here and forall other coefficients of restitution.
V. COLLISION FREQUENCY AND RELATIVEVELOCITY DISTRIBUTION
An earlier study28,29 on the shear flow of inelastic hardspheres showed that there are two correlation effects thathave a significant effect on the dynamics of the system. Thefirst is in relation to the frequency of collisions between par-ticles. It was found that the collision frequency is higher thanthat for a collection of elastic spheres in the absence of shear,and it diverges at a lower volume fraction than the randomclose packing volume fraction of 0.64. The volume fractionat which the collision frequency diverges, named the volumefraction for arrested dynamics �ad, decreases as the coeffi-cient of restitution decreases, and it has a minimum value ofabout 0.58–0.585 for rough particles with et=1.0 and normalcoefficients of restitution in the range of en=0.6–0.8. Fromthe sheared inelastic hard sphere simulations, it was foundthat the collision frequency is fitted by a function of the form
=0
��ad − ��a , �6�
where the parameters 0, �ad, and a, which are obtained byfitting the simulation data in the limit �→�ad, are shown inTable III. The collision frequency used here, which is scaledby the inverse of the strain rate, is slightly different from the
scaled collision frequency in Ref. 28. The collision fre-quency is shown as a function of volume fraction in Fig. 17.The dashed lines in Fig. 17 show function �6�, with the pa-rameters given in Table III.
The second effect is the change in the form of the rela-tive velocity with which particles collide. In a gas of elasticspheres in the absence of shear, the molecular chaos approxi-mation applies and the relative velocity distribution is aGaussian distribution with a variance equal to two times thatfor the single-particle distribution. For a gas of inelastic par-ticles under shear, it was found29 that the distribution for therelative velocity along the line joining centers is significantlydifferent from a Gaussian distribution, although the distribu-tion for the component of the relative velocity tangential tothe surfaces at contact is well fitted by a Gaussian distribu-tion. The relative velocity distribution normal to the surfacesat contact approaches an exponential distribution as the co-efficient of restitution is decreased, and it is well fitted by adistribution of the form
fwn�0��wn� =
C
1 + en−1� exp�− �wn�
+�1 − C�
��Twn/2�1 + en−1�
exp�− wn2/2Twn� , �7�
where the parameter � is calculated from the distributionfunction obtained in the simulations using
0.54 0.55 0.56 0.57 0.58 0.59 0.6
x
0.3
0.4
0.5
0.6
0.7
-⟨Ω
z∗
⟩
FIG. 16. The scaled average angular velocity − �z��=− ��z / �̇��, averaged
over the central region of the flow down an inclined plane, as a function ofvolume fraction for the linear contact model with no friction for en=0.8 ���and en=0.6 ���.
TABLE III. The parameters in the correlation equation �6� for the collisionfrequency for rough particles and different normal coefficients of restitution.
et en �ad a 0
1.0 0.9 0.602 1.28 2.188
1.0 0.8 0.585 1.65 0.670
1.0 0.7 0.583 1.74 0.641
1.0 0.6 0.582 1.88 0.492
0.48 0.52 0.56 0.6
φ
1
101
102
103
104
105
106
ν∗
FIG. 17. The scaled collision frequency �= � / �̇� as a function of volumefraction from event-driven simulations of a homogeneous linear shear flow�open symbols� and DE simulations for the flow down an inclined plane�filled symbols� for rough particles with coefficients of restitution: en
=0.8, et=1.0 ���; en=0.7, et=1.0 ���; en=0.6, et=1.0 ���. The dashedlines show the results of the empirical relation �Eq. �6��, with parametersgiven in Table III In the DE simulations the spring constants are�kn / �mg /d��=2�108, kt= �2kn /7�, damping constants �t=0 and �n adjustedto obtain the required normal coefficient of restitution. The error bars showthe variation in the volume fraction in the DE simulations.
113302-14 K. A. Reddy and V. Kumaran Phys. Fluids 22, 113302 �2010�
Downloaded 01 Jan 2011 to 203.200.35.31. Redistribution subject to AIP license or copyright; see http://pof.aip.org/about/rights_and_permissions
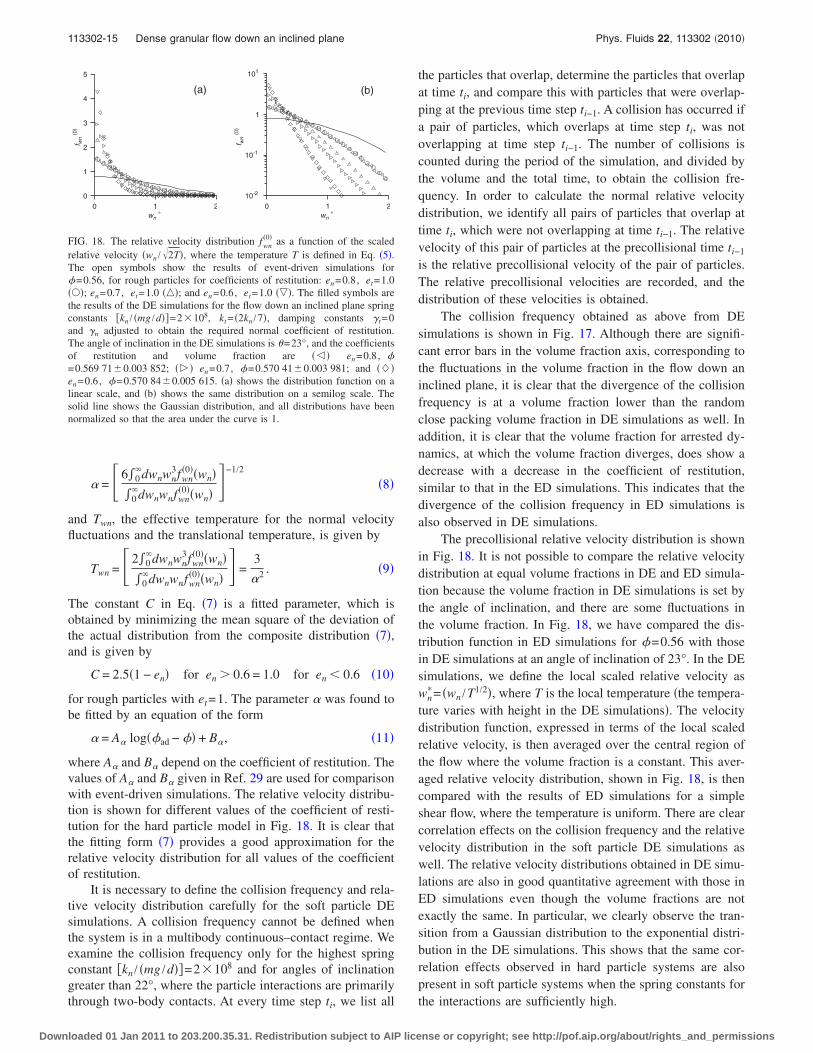
� = �6�0�dwnwn
3fwn�0��wn�
�0�dwnwnfwn
�0��wn� �−1/2
�8�
and Twn, the effective temperature for the normal velocityfluctuations and the translational temperature, is given by
Twn = �2�0�dwnwn
3fwn�0��wn�
�0�dwnwnfwn
�0��wn� � =3
�2 . �9�
The constant C in Eq. �7� is a fitted parameter, which isobtained by minimizing the mean square of the deviation ofthe actual distribution from the composite distribution �7�,and is given by
C = 2.5�1 − en� for en � 0.6 = 1.0 for en � 0.6 �10�
for rough particles with et=1. The parameter � was found tobe fitted by an equation of the form
� = A� log��ad − �� + B�, �11�
where A� and B� depend on the coefficient of restitution. Thevalues of A� and B� given in Ref. 29 are used for comparisonwith event-driven simulations. The relative velocity distribu-tion is shown for different values of the coefficient of resti-tution for the hard particle model in Fig. 18. It is clear thatthe fitting form �7� provides a good approximation for therelative velocity distribution for all values of the coefficientof restitution.
It is necessary to define the collision frequency and rela-tive velocity distribution carefully for the soft particle DEsimulations. A collision frequency cannot be defined whenthe system is in a multibody continuous–contact regime. Weexamine the collision frequency only for the highest springconstant �kn / �mg /d��=2�108 and for angles of inclinationgreater than 22°, where the particle interactions are primarilythrough two-body contacts. At every time step ti, we list all
the particles that overlap, determine the particles that overlapat time ti, and compare this with particles that were overlap-ping at the previous time step ti−1. A collision has occurred ifa pair of particles, which overlaps at time step ti, was notoverlapping at time step ti−1. The number of collisions iscounted during the period of the simulation, and divided bythe volume and the total time, to obtain the collision fre-quency. In order to calculate the normal relative velocitydistribution, we identify all pairs of particles that overlap attime ti, which were not overlapping at time ti−1. The relativevelocity of this pair of particles at the precollisional time ti−1
is the relative precollisional velocity of the pair of particles.The relative precollisional velocities are recorded, and thedistribution of these velocities is obtained.
The collision frequency obtained as above from DEsimulations is shown in Fig. 17. Although there are signifi-cant error bars in the volume fraction axis, corresponding tothe fluctuations in the volume fraction in the flow down aninclined plane, it is clear that the divergence of the collisionfrequency is at a volume fraction lower than the randomclose packing volume fraction in DE simulations as well. Inaddition, it is clear that the volume fraction for arrested dy-namics, at which the volume fraction diverges, does show adecrease with a decrease in the coefficient of restitution,similar to that in the ED simulations. This indicates that thedivergence of the collision frequency in ED simulations isalso observed in DE simulations.
The precollisional relative velocity distribution is shownin Fig. 18. It is not possible to compare the relative velocitydistribution at equal volume fractions in DE and ED simula-tion because the volume fraction in DE simulations is set bythe angle of inclination, and there are some fluctuations inthe volume fraction. In Fig. 18, we have compared the dis-tribution function in ED simulations for �=0.56 with thosein DE simulations at an angle of inclination of 23°. In the DEsimulations, we define the local scaled relative velocity aswn
�= �wn /T1/2�, where T is the local temperature �the tempera-ture varies with height in the DE simulations�. The velocitydistribution function, expressed in terms of the local scaledrelative velocity, is then averaged over the central region ofthe flow where the volume fraction is a constant. This aver-aged relative velocity distribution, shown in Fig. 18, is thencompared with the results of ED simulations for a simpleshear flow, where the temperature is uniform. There are clearcorrelation effects on the collision frequency and the relativevelocity distribution in the soft particle DE simulations aswell. The relative velocity distributions obtained in DE simu-lations are also in good quantitative agreement with those inED simulations even though the volume fractions are notexactly the same. In particular, we clearly observe the tran-sition from a Gaussian distribution to the exponential distri-bution in the DE simulations. This shows that the same cor-relation effects observed in hard particle systems are alsopresent in soft particle systems when the spring constants forthe interactions are sufficiently high.
0 1 2
wn∗
0
1
2
3
4
5f w
n(0
)
(a)
0 1 2
wn∗
10-2
10-1
1
101
f wn
(0)
(b)
FIG. 18. The relative velocity distribution fwn�0� as a function of the scaled
relative velocity �wn /�2T�, where the temperature T is defined in Eq. �5�.The open symbols show the results of event-driven simulations for�=0.56, for rough particles for coefficients of restitution: en=0.8, et=1.0���; en=0.7, et=1.0 ���; and en=0.6, et=1.0 ���. The filled symbols arethe results of the DE simulations for the flow down an inclined plane springconstants �kn / �mg /d��=2�108, kt= �2kn /7�, damping constants �t=0and �n adjusted to obtain the required normal coefficient of restitution.The angle of inclination in the DE simulations is �=23°, and the coefficientsof restitution and volume fraction are �� � en=0.8, �=0.569 71�0.003 852; �� � en=0.7, �=0.570 41�0.003 981; and ���en=0.6, �=0.570 84�0.005 615. �a� shows the distribution function on alinear scale, and �b� shows the same distribution on a semilog scale. Thesolid line shows the Gaussian distribution, and all distributions have beennormalized so that the area under the curve is 1.
113302-15 Dense granular flow down an inclined plane Phys. Fluids 22, 113302 �2010�
Downloaded 01 Jan 2011 to 203.200.35.31. Redistribution subject to AIP license or copyright; see http://pof.aip.org/about/rights_and_permissions

VI. DYNAMICS
For a homogeneous linear shear flow, all the componentsof the stress are proportional to the square of the strain ratefrom the dimensional analysis,
�ij = Bijd�̇2, �12�
where Bij, the Bagnold coefficients, are functions of the vol-ume fractions and the parameters in the contact model. In theflow down an inclined plane, Eq. �12� �Bagnold law� is stillvalid at the center of the flow sufficiently far from bound-aries, where the rate of conduction of energy is small com-pared to the rates of production and dissipation. The Bagnoldlaw is not valid in boundary layers of thickness comparableto the conduction length �= �d / �1−en�1/2�, where the rate ofconduction of energy is comparable to the rate of dissipation.In the DE simulations, we calculate the Bagnold coefficientas the ratio of the stress and square of the strain rate in thecentral region of the flow with thickness of about 30 particlediameters; the regions at the top and bottom with thicknessof 5 particle diameters are not included in the calculation ofthe Bagnold coefficients. The volume fraction in the event-driven simulations is fixed by the size of the simulation celland the number of particles, but the volume fraction in theDE simulations of the flow down an inclined plane has smallvariations. These variations are quantified by dividing thecentral region into bins of 1 particle diameter and then cal-culating the standard deviation over all the bins. This stan-dard deviation is shown by the error bars in the followingfigures.
Since the Bagnold coefficients for the linear and Hert-zian contact model with friction have been discussed before,in Ref. 10, for example, we restrict our attention to the Bag-nold coefficients for the linear contact model with no fric-tion, with the objective of comparing theory, hard particlesimulations, and DE simulations. As reported earlier,10,12 theBagnold coefficients Bxx and Bxy differ by less than 1%,whereas the Bagnold coefficient for the stress in the vorticitydirection Bzz is significantly less than Bxx and Byy. Figure 19shows the Bagnold coefficients Bxx�Byy, Bzz, and Bxy as afunction of the volume fraction in the central region of theflow down an inclined plane. The lines show the error barsalong the volume fraction axis. In all cases, it is observedthat there is very little variation of the Bagnold coefficientwith the spring constant kn or with the coefficient of restitu-tion en. It is clear that the Bagnold coefficients do increase asthe coefficient of restitution decreases, although the increaseis very small for en 0.8. The Bagnold coefficients showvery little variation as the spring constant in the contactmodel is increased. This is a very surprising feature of theflow down an inclined plane, especially since the coordina-tion number shows a rather large variation with spring con-stant in this regime. In the multibody contact regime, itmight be expected that the time period of an interaction iscomparable to the time between interactions. In this case, thetime period of an interaction �m /kn�1/2 should also be con-sidered in the dimensional analysis. More specifically, ifthere are pervasive multibody contacts in the system, then asecond particle has to come in contact with a test particle,
while it is already in contact with another particle. This im-plies that the time period of contact has to be comparable tothe time between contacts. In a homogeneous shear flow, themaximum period of contact of two particles is the inverse ofthe strain rate. In this case, �c is also a relevant variable inthe problem and should be included in the dimensional
0.55 0.56 0.57 0.58 0.59 0.6
φ
101
102
103
104
105
Bxx
≈B
yy
(a)
0.55 0.56 0.57 0.58 0.59 0.6
φ
101
102
103
104
105
Bzz
(b)
0.55 0.56 0.57 0.58 0.59 0.6
φ
101
102
103
104
105
Bxy
(c)
FIG. 19. The Bagnold coefficients Bxx�Byy �a�, Bzz �b�, and Bxy �c� as afunction of the volume fraction from DE simulations for the flow down aninclined plane. The contact model used is the linear spring-dashpot modelwith no friction, scaled spring constant �kn / �mg /d��=2�105 �open sym-bols� and �kn / �mg /d��=2�108 �filled symbols�, and for coefficients of res-titution: en=0.8 ���, en=0.7 ���, and en=0.6 ���. The tangential dampingconstant �t is equal to zero, while the normal damping constant is adjustedto obtain the desired normal coefficient of restitution. The lines show theerror bars along the volume fraction axis.
113302-16 K. A. Reddy and V. Kumaran Phys. Fluids 22, 113302 �2010�
Downloaded 01 Jan 2011 to 203.200.35.31. Redistribution subject to AIP license or copyright; see http://pof.aip.org/about/rights_and_permissions

analysis. Bagnold law is no longer a dimensional necessity.The Bagnold coefficients obtained for the highest spring
constant �kn / �mg /d��, are compared with the theory and theevent-driven simulations of Kumaran29 in Fig. 20. Due to thedivergence of the collision frequency, the variation of theBagnold coefficient with volume fraction is large for the pa-rameter space analyzed in the DE simulations, and the smalluncertainty in the volume fraction in the DE simulationstranslates into a rather large variation in the Bagnold coeffi-cients in this regime. However, it can be inferred that within
the error bars in the DE simulations, there is quantitativeagreement between the DE simulations, the ED simulations,and the theory for all the Bagnold coefficients. The onlysystematic difference between theory and DE simulations areobserved at the highest volume fraction �greater than 0.58�,�angle of inclination is 21°�, just at the inception of flow. Ourearlier analysis of the coordination number, the force ratio,and the force angles indicated that the system is in the multi-body contact regime at this angle of inclination, and so somedifferences between theory and DE simulations are expected.For all higher angles of inclination, there is quantitativeagreement between theory and DE simulations, subject to thevolume fraction uncertainties in the simulations.
A more sensitive measure is the variation of angle ofinclination with the volume fraction since this is the ratio oftwo Bagnold coefficients, which has to remain finite as weapproach the volume fraction for arrested dynamics. Thevariation of the volume fraction with angle of inclination isan important quantity in the context of dense granular flowsdown an inclined plane. A stable flow can be sustained onlyif the volume fraction decreases as the angle of inclinationincreases; if constitutive models predict that the volume frac-tion increases as the angle of inclination increases, then thereis no possibility of a steady flow. The earliest constitutiverelations obtained from the Boltzmann equation,3,4 using theEnskog approximation for the collision integral, predictedthat the volume fraction always increases as the angle ofinclination increases. This led to considerable doubts aboutwhether constitutive relations from kinetic theory could beused, at all, for describing the flow down an inclined plane.A more detailed calculation using the Enskog approximation,which incorporated the Burnett terms in the constitutiverelation,8,9 did predict that the volume fraction decreases asthe angle of inclination increases. However, the results ofthese calculations were not in quantitative agreement withthe simulation results using the soft particle model.10 Thereason could be that this model did not include the effect ofshear on the divergence of the collision frequency or theeffect of correlations on the relative velocity distributions ofcolliding particles, which significantly affect the parametersin the constitutive relations.28,29 Here, we compare thepresent results of soft particle simulations with the latter cal-culations that use the hard particle model.
In Fig. 21�a�, the angle of inclination as a function of thevolume fraction from the ED and DE simulations is com-pared with the theory of Kumaran,28,29 with the relative ve-locity distribution function formulated using Eqs. �7�–�11�. Itcan be seen that the theory predicts that the angle of inclina-tion decreases rather sharply very close to the �ad, the vol-ume fraction for arrested dynamics. The reason for this is thelogarithmic divergence of the parameter � in Eq. �11�. Thenormal stress is proportional to the second moment of therelative velocity distribution, whereas the shear stress isequal to the dissipation rate, which is proportional to thethird moment of the relative velocity distribution. If � di-verges, then the ratio of the third and second moments de-creases to zero, and the angle of inclination predicted by thetheory also goes to zero. This difficulty has already beenanticipated in Ref. 29. Although a logarithmic divergence has
0.52 0.54 0.56 0.58
φ
101
102
103
104
105
Bxx
≈B
yy
0.52 0.54 0.56 0.58
φ
101
102
103
104
105
Bzz
0.52 0.54 0.56 0.58
φ
101
102
103
104
105
Bxy
(a)
(b)
(c)
FIG. 20. The Bagnold coefficients Bxx�Byy �a�, Bzz �b�, and Bxy �c� as afunction of volume fraction from DE simulations for the flow down aninclined plane �filled symbols�, theory �lines�, and ED simulations �opensymbols� for a simple shear flow for normal coefficients of restitution: en
=0.8 ���, en=0.7 ���, and en=0.6 ���. The linear contact model with nofriction is used in the DE simulations the scaled spring constant �kn / �mg /d��is 2�108, kt= �2kn /7�, �t=0, and �n is adjusted to obtained the requirednormal coefficient of restitution.
113302-17 Dense granular flow down an inclined plane Phys. Fluids 22, 113302 �2010�
Downloaded 01 Jan 2011 to 203.200.35.31. Redistribution subject to AIP license or copyright; see http://pof.aip.org/about/rights_and_permissions

been proposed, it had been noted that � increases only by afactor of about 2 when the volume fraction is increased from0.4 to the maximum value that could be simulated. This in-crease is too small to definitively infer a logarithmic in-crease, and more detailed simulations close to the volumefraction for arrested dynamics are required.
An alternative empirical form for the parameter � in Eq.�7� is to use the best spline fit using all data points for vol-ume fractions 0.52 � �ad. The fit is of the form
� = C0 + C1�1 − ��/�ad�� + C2�1 − ��/�ad��2
+ C3�1 − ��/�ad��3. �13�
The parameters C0, C1, C2, and C3 for the best fit are pro-vided in Table IV. Using these parameters, the theoreticalpredictions are shown in Fig. 21�b�. Since the parameter � inFig. 13 does not diverge, the angle of inclination tends to afinite value as the volume fraction for arrested dynamics isapproached. The cubic spline fit in Fig. 21�b� seems betterbecause the logarithmic fit in Fig. 21�a� from the DE data isvery close to the volume fraction for arrested dynamics.However, the theoretical curves obtained from the logarith-mic fit does represent the data well and is in error only at thehighest volume fraction, which is greater than 0.58. Thisleads to two possibilities that have to be examined by furtherresearch. The first is that there is a logarithmic divergence ofthe parameter �, but as the volume fraction increases, it isnot possible to observe the sharp decrease in the angle ofinclination because the system transitions into a multibodycontact regime. The other is that there is no true logarithmicdivergence, and the angle of inclination is finite at �=�ad.
It should be noted that the decrease of the angle of in-clination to zero is a feature restricted to perfectly roughparticles, where there is no dissipation of energy due to therelative tangential velocity of the particles.28,29 There is dis-sipation of energy due to relative tangential motion, which isnot dependent on the parameter � in the expression for therelative normal velocity �7�. Due to this, the ratio of the shearstress �equal to dissipation rate� and the normal stress will
remain finite as the volume fraction for arrested dynamics isapproached, and the angle of inclination will be finite in thislimit.
VII. CONCLUSIONS
From our analysis, it is clear that the coordination num-ber in a dense granular flow down an inclined plane isstrongly dependent on the spring stiffness in the particlemodel used. When the scaled spring stiffness in the linearcontact model is 2�105, the coordination number is lessthan 1 for angles of inclination in the range of 21° � 24°. In contrast, when the scaled spring stiffness is 2�108, the coordination number is greater than 1 only for �=21°, while it is less than 1 at higher angles of inclination.Our estimates indicate that the scaled spring constants are inthe range of 108–1010 for real materials, such as sand par-ticles, with diameters in the range of 0.1–1 mm. In the caseof the Hertzian contact model, the coordination number inthe range of 2�105 �kn� / �mg /d3/2�� 2�108 is larger thanthat for the linear contact model with spring stiffness in therange of 2�105 �kn / �mg /d�� 2�108. However, thescaled spring stiffness for sand grains in the diameter rangeof 0.1–1 mm is in the range of 1010 �kn� / �mg /d3/2�� 1011.Therefore, we obtain the same conclusion that the coordina-tion number is greater than 1 only for �=21° and is largerthan 1 for higher values of the angle of inclination. This isreinforced by our finding that the fraction of particles withtwo or more contacts is small, typically less than 0.15, for��21°, and most particles have either no contacts or onecontact.
An attempt was made to examine the force correlationsin the particles with two or more contacts using two mea-sures. The first is the force ratio, which is the average of theratio of the magnitudes of the largest and second largestforces in the system. The second is the force angle, which isthe angle between the two largest forces. These measureswere specifically designed to test whether a large proportionof particles with two or more contacts were part of forcechains propagating through the system. Since force is trans-mitted nearly linearly along a force chain, the two largestforces on a particle will be nearly of equal magnitude andthey will be nearly collinear. Our results show that the forceratio is small, typically less than 0.2, and the force anglemeasure indicates that there is no biasing toward a nearlycollinear orientation of the largest force. Thus, we do not seeany evidence of force chains among particles with two ormore contacts.
TABLE IV. Parameters C0, C1, C2, and C3 in Eq. �13� for the data ofKumaran �Ref. 29� for different values of the coefficient of restitution fromthe rough particle model.
en C0 C1 C2 C3
0.8 1.670 16 �1.947 8 �6.443 72 50.4024
0.7 2.839 84 �7.896 39 25.458 6 �62.9158
0.6 4.481 84 �21.286 4 141.291 �417.005
0.52 0.54 0.56 0.58 0.6
x
0.3
0.4
0.5
0.6ta
n(θ
)
(a)
0.52 0.54 0.56 0.58 0.6φ
0.3
0.4
0.5
0.6
tan(θ
)
(b)
FIG. 21. The variation of the volume fraction � with tan���, where � is theangle of inclination. The results of DE simulations with the linear spring-dashpot model are shown for �kn / �mg /d��=2�108 �filled symbols� and�kn / �mg /d��=2�105 �open symbols�. In all cases, kt=2 /7kn, �t=0, and �n
chosen to obtain the desired normal coefficient of restitution. The values ofthe coefficient of restitution are en=0.8 ���, en=0.7 ���, and en=0.6 ���.The lines show the theoretical results obtained for en=0.8 �solid line�,en=0.7 �dashed line�, and en=0.6 �dotted line�. �a� shows the theoreticalresults when Eq. �11� is used for the parameter � in the relative velocitydistribution equation �7�, while �b� shows the results when the cubic splinefit Eq. �13� is used in Eq. �7�.
113302-18 K. A. Reddy and V. Kumaran Phys. Fluids 22, 113302 �2010�
Downloaded 01 Jan 2011 to 203.200.35.31. Redistribution subject to AIP license or copyright; see http://pof.aip.org/about/rights_and_permissions
In the context of recent works on sheared inelastic hardparticle fluids,28,29 we examined two other effects in the softparticle simulations, which have a significant effect on thedynamics of the system. The first is the divergence of thecollision frequency at the volume fraction of arrested dynam-ics �ad, which is lower than the random close packing vol-ume fraction �=0.64 for an elastic fluid at equilibrium. Insheared inelastic fluids of hard particles, the collision fre-quency diverges at a volume fraction in the range of 0.58–0.59 when the normal coefficient of restitution is less thanabout 0.8. This effect could be tested in DE simulations onlyfor the highest scaled spring stiffness �kn / �mg /d��=2�108
used here and for angles of inclination ��21°, where thesystem is mostly in the binary contact regime. Quantitativeagreement was found for the collision frequency between thehard disk �event-driven� and the DE simulations if the linearcontact model with no friction is used, and the damping con-stant in the DE simulations is adjusted to obtain the samenormal coefficient of restitution as that in the event-drivensimulation. The DE simulations showed that the collisionfrequency does diverge at a volume fraction �ad, which islower than the volume fraction for random close packing.
The other correlation effect examined was the distribu-tion of relative velocities normal to the surfaces at contact.This is important in determining the dynamics of the systemsince stress is transmitted primarily by collision in the denseflow regime. In a gas of elastic particles at equilibrium, thedistribution of the normal relative velocities is a Gaussiandistribution, with a variance equal to two times that of thesingle-particle velocity. A previous study using event-drivensimulations29 of sheared inelastic hard particles showed thatthe relative velocity distribution is close to a Gaussian fornearly elastic particles but undergoes a transition to an expo-nential distribution when the normal coefficient of restitutiondecreases below about 0.8. The variance of the relative ve-locity distribution is also much smaller than that for thesingle-particle distribution. Here, the relative velocity distri-bution has been examined in DE simulations for the linearcontact model with no friction and with �kn / �mg /d��=2�108. The results for the distribution function are in quanti-tative agreement with the results of the hard particlesimulations29 if the damping constant in the DE simulationsis adjusted to obtain the same coefficient of restitution as thatused in the event-driven simulations. This shows that thecorrelation effects observed in the hard particle model arealso observed in soft particle simulations provided the springconstant is sufficiently high.
The Bagnold coefficients obtained from the DE simula-tions were compared to those obtained in the event-drivensimulations, as well as those obtained using a theoreticalcalculation that takes into account the effect of correlationson the relative velocity distribution. The results were foundto be in quantitative agreement. The variation of the volumefraction with the angle of inclination was also examined andfound to be in quantitative agreement with hard particlesimulations. For example, for a volume fraction �=0.56 �thehighest volume fraction accessible in the event-driven simu-lations�, there is a difference of less than 1° between the
angles of inclination obtained from the DE and event-drivensimulations.
There was also agreement between DE simulations andtheory for most volume fractions analyzed here. However,there are differences when the volume fraction is very closeto the volume fraction of dynamical arrest �ad. This differ-ence can be traced back to the form of the relative velocitydistribution in Eq. �7�, with the parameter � given by Eq.�11�. Based on the available data, a cautious prediction wasmade in Ref. 29 that � diverges logarithmically as �ad isapproached. It should be noted that a logarithmic divergenceis very difficult to discern in event-driven simulations be-cause it is difficult to get very close to �ad in simulations dueto numerical errors resulting in particle overlaps. So it isdifficult to definitively conclude that this slow divergenceexists.
If the divergence does exist, it can be intuitively under-stood as the decrease to zero of the relative velocity of pairsof particles as the static configuration is approached. How-ever, this implies that the pressure diverges faster than therate of dissipation of energy as �ad is approached. This isbecause the collisional pressure is proportional to the secondmoment of the relative velocity distribution, while the rate ofdissipation of energy is proportional to the third moment.From the energy balance, the shear stress is equal to therate of dissipation of energy when the strain rate is set equalto 1. Therefore, the ratio of the shear stress and the squareof the strain rate shows a sharp decrease to zero as �ad isapproached.
More work is required to resolve whether the parameter� does diverge as �ad is approached. It is possible that thereis a divergence, in which case the hard particle model pre-dicts the angle of repose �the angle of inclination at which�=�ad� is zero. This may not be seen in soft particle simu-lations because the system transitions to a multibody contactregime before this volume fraction is approached. Alterna-tively, it is possible that there is no real divergence, in whichcase the angle of repose �the angle of inclination at which�=�ad� approaches a finite value. It should be noted that thedecrease of the angle of repose to zero is specific to the casewhere there is no tangential dissipation; in the case of tan-gential dissipation, both the pressure and the dissipation ratewill diverge as �ad is approached, leading to a finite angle ofrepose.
Apart from the above, there is another issue that requiresadditional work, which is the remarkable insensitivity of theBagnold coefficients to the spring stiffness used in the simu-lations. We find that the Bagnold coefficients change by lessthan 10% when the spring stiffnesses are changed by an or-der of magnitude. One possible reason is that even when aparticle has multiple contacts, there is one dominant contactwith the largest contact force. Due to this, the system mayresemble a hard particle fluid even though there are multiplecontacts. Our calculations on the force ratio and the forceangle does support this conclusion, but more work needs tobe done.
In conclusion, it is clear that the dynamics of the flowdown an inclined plane for real materials, such as sand, canbe captured by hard particle models, both at the macroscopic
113302-19 Dense granular flow down an inclined plane Phys. Fluids 22, 113302 �2010�
Downloaded 01 Jan 2011 to 203.200.35.31. Redistribution subject to AIP license or copyright; see http://pof.aip.org/about/rights_and_permissions
level �Bagnold coefficients� and the microscopic level �coor-dination number, icosahedral order parameter, collision fre-quency, and relative velocity distributions�, with the excep-tion for a very small range of angles of inclination �of about1°� above the angle of repose. Quantitative predictions areobtained from the kinetic theory approach that incorporatesthe effect of shear on the collision frequency and the effect ofcorrelations on the distribution of the relative velocities ofcolliding particles.
ACKNOWLEDGMENTS
This research was supported by the J. C. Bose Fellow-ship, Department of Science and Technology, Government ofIndia.
APPENDIX A: FORCE MODELS AND SIMULATIONTECHNIQUE
The DE technique is used for simulating the flow, andthe particle contact models used here are the linear and Hert-zian contact models. The linear contact model results in aconstant coefficient of restitution for binary interactions, butthe coefficient of restitution for the Hertzian contact model isvelocity dependent, as discussed below. The details of thesimulation technique have been discussed in detail in theprevious study,10 and so we provide only a brief summaryhere.
Consider two particles i and j with positions ri and r j,linear velocities vi and v j, and angular velocities �i and � j.The overlap between the two particles is given by �ij =d− rij. There is a force between the two particles, i and j,only if �ij is less than zero, i.e., only if the particles overlap.For overlapping particles, we also define the “tangential dis-placement” uij
t , which is the total displacement of the par-ticles in the direction perpendicular to the line joining centerssince the initiation of contact. For calculating the contactforces, the particle velocities are resolved along the line join-ing centers, rij =ri−r j, and in the plane perpendicular to theline joining centers. The relative velocities in these two di-rections are
vijn = �vi − v j� · r̂ij , �A1�
vijt = �I − r̂ijr̂ij� · �vi − v j − 1
2rij � ��i + � j�� , �A2�
where r̂ij = �rij / rij�. The contact force acting on particle ican be resolved into a component along the line joining cen-ters, Fi
nr̂ij, and a component perpendicular to the line joiningcenters, Fi
t,
Fi = Finr̂ij + Fi
t. �A3�
The force on particle j is equal in magnitude and opposite indirection to the force on particle i.
For a linear force model, the normal and tangential forcecomponents are given by
Fin = kn�ijr̂ij − �nmeffvij
n �A4�
and
Fit = ktuij
t − �tmeffvijt . �A5�
In this case, the spring constants kn and kt have dimensionsof MT−2, where M and T are the mass and time dimensions,while the damping constants �n and �t have dimensions ofT−1. The results are analyzed in terms of the nondimensionalspring constants �kn / �mg /d�� and �kt / �mg /d�� in our simula-tions. For simplicity, the ratio �kt /kn� is maintained at a con-stant value of �2/7� in all the results used here. The depen-dence of the results on the ratio �kt /kn� has been discussed indetail in Ref. 21. The Poisson ratio of most materials is �2/3�,and so a value of �kt /kn�=2 /7 ensures that the period of thenormal and shear oscillations are equal to each other at con-tact for the linear model. Changing this ratio does change thekinetic energy, but not the other dynamical quantities. There-fore, we have used the ratio �kt /kn�=2 /7 in all our studies.
For a binary interaction between two particles, the timeperiod of an interaction is
tc = ���2kn/m� − ��n2/4��−1/2, �A6�
independent of the preinteraction relative velocities of theparticles in the linear force model. In addition, the normalcoefficient of restitution for a binary interaction en, which isthe ratio of the post- and preinteraction relative normal ve-locities of the particles, is a constant, independent of therelative velocity
en = exp�− �ntc/2� . �A7�
The above relation is used to make a connection between theDE simulations and the event-driven simulations discussedlater. For simplicity, we set the tangential dissipation con-stant �t equal to zero in all our simulations; this correspondsto a tangential coefficient of restitution et=1 in the event-driven simulations.
For the Hertzian force model, the normal and tangentialforce components are given by
Fin = �ij
1/2�kn��ij − �n�meffvijn � �A8�
and
Fit = �ij
1/2�kt�uijt − �t�meffvij
t � . �A9�
In this case, the constants kn� and kt� have dimensions ofML−1/2T−2, while the damping constants �n� and �t� have di-mensions L−1/2T−1. The results are expressed in terms of thedimensionless spring constant �kn� / �mg /d3/2��. As in the lin-ear contact model, we set �kt� /kn��= �2 /7� and �t�=0 for theHertzian contact model as well. The time period of an inter-action and the coefficient of restitution for binary interac-tions are velocity dependent for the Hertzian contact model.From simple dimensional analysis, it can be concluded thatthe average period of a binary interaction scales as�kn�d
1/2 /m�−1/2.After the force is calculated, the equations of motion are
integrated to find the particle locations and velocities at eachtime step. The time step in the simulations for the linearcontact model was 0.02 times the collision time �Eq. �A6��.For the Hertzian contact model, the time step was 0.02 timesthe time obtained in Eq. �A6�, with �kn�d
1/2� substituted for kn
and �n�d1/2 substituted for �n in the expression. The linear
113302-20 K. A. Reddy and V. Kumaran Phys. Fluids 22, 113302 �2010�
Downloaded 01 Jan 2011 to 203.200.35.31. Redistribution subject to AIP license or copyright; see http://pof.aip.org/about/rights_and_permissions

model has been implemented both with and without a fric-tion �static yield� criterion. When there is no friction, there isno condition on the ratios of the magnitudes of the tangentialand normal forces. When there is friction, the tangential dis-placement uij
t is adjusted so that the local yield criterion,Fij
t �Fijn , is always satisfied, where � is the friction coef-
ficient. In the present case, � has been set equal to 0.5 for allthe simulations with friction. In all the simulation results, wehave calculated error bars by dividing the simulation runs forproduction into four equal intervals and calculating the aver-ages in each of these intervals.
In the simulations, the particles are sequentially droppedinto the simulation box in which the y axis is aligned withthe gravitational direction. Once the requisite number of par-ticles has been collected in the box, the bottom two layersare “frozen,” i.e., their locations are fixed, in order to createa rough base. The direction of gravitational acceleration isthen tilted to the desired angle, and the initialization contin-ues until the system reaches the steady state. The steady stateconfiguration is stored and used as the initial condition forcalculating averages. The number of time steps for equilibra-tion was 2�107 time steps for �kn / �mg /d��=2�105 �linearmodel� and �kn� / �mg /d3/2�� �Hertzian model�, and 3�108
time steps for �kn / �mg /d��=2�108 �linear model� and
�kn� / �mg /d3/2��=2�108 �Hertzian model�. Statistics was col-lected for 107 time steps for �kn / �mg /d��=2�105 �linearmodel� and �kn� / �mg /d3/2��=2�105 �Hertzian model�, and2�107 time steps for �kn / �mg /d��=108 �linear model� and�kn� / �mg /d3/2��=2�108 �Hertzian model�. The standard de-viation about the mean is then calculated, and the error barsin the figures have length equal to two times the standarddeviation. In the coordination number, force ratio, and forceangle measurements, the standard deviation is typically 10%
0 10 20 30 40
(y/d)
0
0.5
1
1.5
2
2.5
3C
o-o
rdin
ation
num
ber
0 10 20 30 40
(y/d)
0
0.5
1
1.5
Co-o
rdin
ation
num
ber
(a) (b)
FIG. 22. Average coordination number as a function scaled height �y /d� for�a� �kn / �mg /d��=2�105 and �b� �kn / �mg /d��=2�108, for the linear forcemodel with friction for kt= �2kn /7�, �t=0, and for the value of �n chosen sothat en=0.5 �open symbols� and en=0.9 �filled symbols�. The angles ofinclination are �=21° ���, �=22° ���, �=23° ���, �=24° ���, and�=25° ���. The vertical dashed lines correspond to �kn / �mg /d��=3.82�109 and 3.82�107, which are the reference values for particles withkn=0.5�106 N /m, mass density of 2500 kg /m3, and diameter of100 �m–1 mm, respectively.
0 10 20 30 40
(y/d)
0
0.5
1
1.5
2
2.5
3
3.5
4
Co-o
rdin
ation
num
ber
(a)
0 10 20 30 40
(y/d)
0
0.5
1
1.5
Co-o
rdin
ation
num
ber
(b)
FIG. 23. Average coordination number as a function scaled height �y /d� for�a� �kn / �mg /d��=2�105 and �b� �kn / �mg /d��=2�108, for the linear forcemodel without friction for kt= �2kn /7�, �t=0, and for the value of �n chosenso that en=0.6 �open symbols� and en=0.8 �filled symbols�. The angles ofinclination are �=21° ���, �=22° ���, �=23° ���, and �=24° ���.
0 10 20 30 40
(y/d)
0
0.5
1
1.5
2
2.5
3
3.5
4
Co-o
rdin
ation
num
ber
(a)
0 10 20 30 40
(y/d)
0
0.5
1
1.5
2
2.5
3
3.5
4
Co-o
rdin
ation
num
ber
(b)
FIG. 24. Average coordination number as a function scaled height �y /d� for�a� �kn� / �mg /d3/2��=2�105 and �b� �kn� / �mg /d3/2��=2�108, and for theHertzian force model with friction for kt�= �2kn� /7�, �t�=0. The open symbolsare for higher dissipation, ��kn� / �mg /d3/2��=2�108 , ��n� / �g1/2 /d��=1850in �a� ��kn� / �mg /d3/2��=2�108 , ��n� / �g1/2 /d��=8900 in �b�, while the filledsymbols are for lower dissipation, ��kn� / �mg /d3/2��=2�105 , ��n� / �g1/2 /d��=275 in �a� and ��kn� / �mg /d3/2��=2�105 , ��n� / �g1/2 /d��=55. The angles of inclination are �=21° ���, �=22°���, �=23° ���, �=24° ���, and �=25° ���.
105 106 107 108 109 1010
(kn / (mg/d))
0
0.1
0.2
0.3
0.4
0.5
0.6
0.7
0.8
0.9
1
Z0
(a)
105 106 107 108 109 1010
(kn / (mg/d))
0
0.1
0.2
0.3
0.4
0.5
0.6
Z1
(b)
105 106 107 108 109 1010
(kn / (mg/d))
0
0.1
0.2
0.3
0.4
Z2
(c)
105 106 107 108 109 1010
(kn / (mg/d))
0
0.1
0.2
0.3
0.4
0.5
0.6
∑n
≥3
Zn
(d)
FIG. 25. The fraction Zn of particles with n contacts, Z0 �a�, Z1 �b�, Z2 �c�,and �n�3Zn �d�, as a function of the scaled spring constant �kn / �mg /d�� forthe linear contact law with no friction for kt= �2kn /7�, �t=0, and the value of�n chosen so that en=0.8 �filled symbols� and en=0.6 �open symbols�. Theangles of inclination are �=21° ���, �=22° ���, �=23° ���, and �=24°�� �. The vertical dashed lines correspond to �kn / �mg /d��=3.82�109 and3.82�107, which are the reference values for particles with kn=0.5�106 N /m, mass density of 2500 kg /m3, and diameter of100 �m–1 mm, respectively.
113302-21 Dense granular flow down an inclined plane Phys. Fluids 22, 113302 �2010�
Downloaded 01 Jan 2011 to 203.200.35.31. Redistribution subject to AIP license or copyright; see http://pof.aip.org/about/rights_and_permissions

of the average, while in the measurements of the fractions ofparticles with a specified number of contacts, the standarddeviation is about 15% of the average.
APPENDIX B: PARTICLE CONTACT STATISTICS
The variation of the coordination number with �y /d� isshown in Fig. 22 for the linear contact model with friction,and in Fig. 23 for the linear contact model without friction,for two different values of the scaled spring constant,�kn / �mg /d��=2�105 and �kn / �mg /d��=2�108. Figure 24shows the variation of the coordination number with heightfor the Hertzian contact model with friction for�kn� / �mg /d3/2��=2�105 and �kn� / �mg /d3/2��=2�108. In or-der to analyze this variation, the y coordinate was dividedinto five bins of width eight particle diameters each, and thecoordination number was calculated in each of these bins.The lowest bin also included the two layers of frozen par-ticles, which are neglected in the coordination number cal-culation. However, it is likely that the coordination numberin the lowest bin is different because the coordination num-ber between the frozen and the moving particles will, in gen-eral, be different from that between the moving particleshigher up. The coordination number in the highest bin alsoincludes the fluidized layer of particles at the top, and so thecoordination number is significantly lower than the average.In addition, it is known that there are conduction boundarylayers at the bottom and top of thickness �d / �1−en�1/2�,46
where the Bagnold scaling is not valid. For this reason, wedo not include the top and bottom 5 layers in the calculation
of averages and only include particles from �y /d�=5 to�y /d�=35. In this region, there is a variation of about�10%–15% in the coordination number. A similar variationis also observed for the linear contact model without frictionand the Hertzian contact model. The earlier studies of Silbertet al.37 and Brewster et al.38 showed a similar lack of varia-tion of contact lifetimes with height.
A more detailed picture of the nature of particle contactsis obtained by looking at Zn, the fraction of the total numberof particles which have n contacts, where n varies from 0�for particles that are not in contact with any other particles�to a maximum of 12 for particles arranged in a perfect fcc orhcp lattice, or even larger if the particles are severely de-formed. The normalization condition requires that �0
�Zn
=1.0. The value of Z1 �fraction of particles that overlap withone other particle�, Z2 �fraction of particles that overlap withtwo other particles�, and �n�3Z3 �fraction of particles thatoverlap with three or more other particles� for different val-ues of the spring constant and for different angles of inclina-tion are shown in Figs. 25–27 for the three different contactmodels.
There are several interesting features in these figures. Asthe spring constant is increased at constant volume fractionand coefficient of restitution, it might be expected that theperiod of an interaction will decrease to zero proportional to
105 106 107 108 109 1010
(kn / (mg/d))
0
0.1
0.2
0.3
0.4
0.5
0.6
0.7
0.8
0.9
1Z
0
105 106 107 108 109 1010
(kn / (mg/d))
0
0.1
0.2
0.3
0.4
Z1
105 106 107 108 109 1010
(kn / (mg/d))
0
0.1
0.2
0.3
0.4
Z2
105 106 107 108 109 1010
(kn / (mg/d))
0
0.1
0.2
0.3
0.4
0.5
0.6∑
n≥
3Z
n
(a)
(b)
(c)
(d)
FIG. 26. The fraction of Zn of particles with n contacts, Z0 �a�, Z1 �b�, Z2 �c�and �n�3Zn �d�, as a function of the scaled spring constant �kn / �mg /d�� forthe linear contact law with friction for kt= �2kn /7�, �t=0, and the value of �n
chosen so that en=0.9 �filled symbols� and en=0.5 �open symbols�. Theangles of inclination are �=21° ���, �=22° ���, �=23° ���, �=24° �� �,and �=25° �� �. The vertical dashed lines correspond to �kn / �mg /d��=3.82�109 and 3.82�107, which are the reference values for particles withkn=0.5�106 N /m, mass density of 2500 kg /m3, and diameter of100 �m–1 mm, respectively.
105 106 107 108 109 1010 1011
(kn’ / (mg/d 3/2))
0
0.1
0.2
0.3
0.4
0.5
0.6
0.7
0.8
0.9
1
Z0
(a)
105 106 107 108 109 1010 1011
(kn’ / (mg/d 3/2))
0
0.1
0.2
0.3
0.4
Z1
(b)
105 106 107 108 109 1010 1011
(kn’ / (mg/d 3/2))
0
0.1
0.2
0.3
0.4
Z2
(c)
105 106 107 108 109 1010 1011
(kn’ / (mg/d 3/2))
0
0.1
0.2
0.3
0.4
0.5
0.6
0.7
0.8
∑n
≥3
Zn
(d)
FIG. 27. The fraction Zn of particles with n contacts, Z0 �a�, Z1 �b�, Z2 �c�,and �n�3Zn �d�, as a function of the scaled spring constant �kn� / �mg /d3/2��for the Hertzian contact law with friction for kt�= �2kn� /7�, �t�=0. The opensymbols are for system with higher dissipation: ��kn� / �mg /d3/2��=2�105 , ��n� / �g1/2 /d��=275; ��kn� / �mg /d3/2��=2�106 , ��n� / �g1/2 /d��=890;and ��kn� / �mg /d3/2��=2�108 , ��n� / �g1/2 /d��=8900; while the filled sym-bols are for a system with lower dissipation: ��kn� / �mg /d3/2��=2�105 , ��n� / �g1/2 /d��=55; ��kn� / �mg /d3/2��=2�106 , ��n� / �g1/2 /d��=185;and ��kn� / �mg /d3/2��=2�108 , ��n� / �g1/2 /d��=1850. The angles of inclina-tion are �=21° ���, �=22° ���, �=23° ���, �=24° �� �, and �=25° �� �.The vertical dashed lines correspond to �Ed2 /mg�=3.82�1010 and 3.82�109, which are the reference values for particles with E=0.5�1011 N /m2, mass density of 2500 kg /m3, and diameter of100 �m–1 mm, respectively.
113302-22 K. A. Reddy and V. Kumaran Phys. Fluids 22, 113302 �2010�
Downloaded 01 Jan 2011 to 203.200.35.31. Redistribution subject to AIP license or copyright; see http://pof.aip.org/about/rights_and_permissions

�m /k�1/2, and at some �large� value of the spring constant theperiod of an interaction will become small compared to thetime between interactions. Beyond this value, the system willbe in a binary contact regime, and the value Z0 will tend to 1,while all other Zn for n�1 will go to 0. Thus, it is expectedthat Z0 will increase continuously to 1 as the spring constantis increased, while Zn for n�1 will decrease to 0. Thesetrends are observed at all angles of inclination ��22°, indi-cating that the system can be well described by the binarycontact approximation. These trends are not observed at thelowest angle of inclination of 21°, as discussed below.
At the lowest angle of inclination of 21°, the fractions ofparticles with 1 and 2 contacts, Z1 and Z2, do not changemuch as the spring constant is increased. The fraction ofparticles with no contacts Z0 increases as the spring constantis increased, while the fraction of particles with more thantwo contacts decreases. The fraction of particles with morethan two contacts is less than 0.1 for the values of the scaledspring and damping constants corresponding to real particleseven when the angle of inclination is 21° for the linear con-tact model, although an extrapolation of the data in Fig. 27might lead to a slightly higher fraction. The fraction of par-ticles with one and two contacts is consistently in the rangeof 0.2–0.3 for 21°, but they decrease as the angle of inclina-tion is increased. This could indicate that the spring constantsstudied here are not large enough for the hard particle ap-proximation to be valid, and it is necessary to go to stillhigher values of the spring constant to attain the hard particlelimit. However, it is interesting to note that at the lowestangle of inclination of 21°, the fraction of particles with nocontacts is 0.4 for the linear model with scaled spring con-stants corresponding to real particles. Even for the Hertziancontact model, the extrapolation of the data in Fig. 27 indi-cates that the fraction of particles with no contacts is in therange of 0.3–0.4. This indicates that the dynamics of thesystem is dominated by the interactions of particles withzero, one, and two contacts at the lowest angle of 21°. There-fore, the binary contact model is not expected to be accurateat the lowest angle of 21°, and it may be necessary to incor-porate multiple contacts.
1S. B. Savage and D. J. Jeffrey, “The stress tensor in a granular flow at highshear rates,” J. Fluid Mech. 110, 255 �1981�.
2J. T. Jenkins and S. B. Savage, “A theory for the rapid flow of identical,smooth, nearly elastic particles,” J. Fluid Mech. 130, 187 �1983�.
3C. K. K. Lun, S. B. Savage, D. J. Jeffrey, and N. Chepurniy, “Kinetictheories for granular flow: Inelastic particles in Couette flow and slightlyinelastic particles in a general flow field,” J. Fluid Mech. 140, 223 �1984�.
4J. T. Jenkins and M. W. Richman, “Grad’s 13-moment system for a densegas of inelastic spheres,” Arch. Ration. Mech. Anal. 87, 355 �1985�.
5V. Kumaran, “Temperature of a granular material fluidised by externalvibrations,” Phys. Rev. E 57, 5660 �1998�.
6N. Sela, I. Goldhirsch, and S. H. Noskowicz, “Kinetic theoretical study ofa simply sheared two dimensional granular gas to Burnett order,” Phys.Fluids 8, 2337 �1996�.
7N. Sela and I. Goldhirsch, “Hydrodynamic equations for rapid flows ofsmooth inelastic spheres to Burnett order,” J. Fluid Mech. 361, 41 �1998�.
8V. Kumaran, “Constitutive relations and linear stability of a sheared granu-lar flow,” J. Fluid Mech. 506, 1 �2004�.
9V. Kumaran, “The constitutive relations for the granular flow of roughparticles, and its application to the flow down an inclined plane,” J. FluidMech. 561, 1 �2006�.
10L. E. Silbert, D. Ertas, G. S. Grest, T. C. Halsey, D. Levine, and S. J.
Plimpton, “Granular flow down an inclined plane: Bagnold scaling andrheology,” Phys. Rev. E 64, 051302 �2001�.
11N. Mitarai and H. Nakanishi, “Bagnold scaling, density plateau, and ki-netic theory analysis of dense granular flow,” Phys. Rev. Lett. 94, 128001�2005�.
12K. A. Reddy and V. Kumaran, “The applicability of constitutive relationsfrom kinetic theory for dense granular flows,” Phys. Rev. E 76, 061305�2007�.
13K. A. Reddy and V. Kumaran, “Structure and dynamics of two dimen-sional sheared granular flows,” Phys. Rev. E 79, 061303 �2009�.
14D. Ertaş and T. C. Halsey, “Granular gravitational collapse and chuteflow,” Europhys. Lett. 60, 931 �2002�.
15G. Lois, A. Lemaitre, and J. M. Carlson, “Emergence of multi-contactinteractions in contact dynamics simulations of granular shear flows,” Eu-rophys. Lett. 76, 318 �2006�.
16J. T. Jenkins, “Dense shearing flows of inelastic disks,” Phys. Fluids 18,103307 �2006�.
17J. T. Jenkins, “Dense inclined flows of inelastic spheres,” Granular Matter10, 47 �2007�.
18J. R. Dorfman and E. G. D. Cohen, “Velocity-correlation functions in twoand three dimensions: Low density,” Phys. Rev. A 6, 776 �1972�.
19M. H. Ernst, B. Cichocki, J. R. Dorfman, J. Sharma, and H. van Beijeren,“Kinetic theory of nonlinear viscous flow in two and three dimensions,” J.Stat. Phys. 18, 237 �1978�.
20B. Alder and A. W. Wainwright, “Decay of the velocity autocorrelationfunction,” Phys. Rev. A 1, 18 �1970�.
21V. Kumaran, “Velocity autocorrelations and the viscosity renormalisationin sheared granular flows,” Phys. Rev. Lett. 96, 258002 �2006�.
22V. Kumaran, “Dynamics of a dilute sheared inelastic fluid. I. Hydrody-namic modes and the velocity correlation functions,” Phys. Rev. E 79,011301 �2009�.
23V. Kumaran, “Dynamics of a dilute sheared inelastic fluid. II. The effect ofcorrelations,” Phys. Rev. E 79, 011302 �2009�.
24A. V. Orpe, V. Kumaran, K. A. Reddy, and A. Kudrolli, “Fast decay of thevelocity autocorrelation function in dense shear flow of inelastic hardspheres,” Europhys. Lett. 84, 64003 �2008�.
25T. P. Majmudar and R. P. Behringer, “Contact force measurements andstress-induced anisotropy in granular materials,” Nature �London� 435,1079 �2005�.
26A. Ferguson and B. Chakraborty, “Stress and large-scale spatial structuresin dense, driven granular flows,” Phys. Rev. E 73, 011303 �2006�.
27O. Baran, D. Ertas, T. C. Halsey, G. S. Grest, and J. B. Lechman, “Veloc-ity correlations in dense gravity-driven granular chute flow,” Phys. Rev. E74, 051302 �2006�.
28V. Kumaran, “Dynamics of dense sheared granular flows. Part 1: Structureand diffusion,” J. Fluid Mech. 632, 109 �2009�.
29V. Kumaran, “Dynamics of dense sheared granular flows. Part 2: Therelative velocity distribution,” J. Fluid Mech. 632, 145 �2009�.
30M. Babic, H. H. Shen, and H. T. Shen, “The stress tensor in granular shearflows of uniform, deformable disks at high solids concentrations,” J. FluidMech. 219, 81 �1990�.
31C. S. Campbell, “Granular shear flows at the elastic limit,” J. Fluid Mech.465, 261 �2002�.
32C. S. Campbell, “Stress-controlled elastic granular shear flows,” J. FluidMech. 539, 273 �2005�.
33S. Torquato, “Nearest neighbour statistics for packings of hard disks andspheres,” Phys. Rev. E 51, 3170 �1995�.
34C. Song, P. Wang, and H. Makse, “A phase diagram for jammed matter,”Nature �London� 453, 629 �2008�.
35K. Shundyak, M. van Hecke, and W. van Saarloos, “Force mobilizationand generalized isostaticity in jammed packings of frictional grains,”Phys. Rev. E 75, 010301�R� �2007�.
36R. J. Bathurst and L. Rothenburg, “Micromechanical aspects of isotropicgranular assemblies with linear contact interactions,” Trans. ASME, J.Appl. Mech. 55, 17 �1988�.
37L. E. Silbert, G. S. Grest, R. E. Brewster, and A. J. Levine, “Rheology andcontact lifetimes in dense granular flows,” Phys. Rev. Lett. 99, 068002�2007�.
38R. Brewster, L. E. Silbert, G. S. Grest, and A. J. Levine, “Relationshipbetween interparticle contact lifetimes and rheology in gravity-drivengranular flows,” Phys. Rev. E 77, 061302 �2008�.
39L. Brendel, T. Unger, and D. Wolf, in The Physics of Granular Media,edited by H. Hinrichsen and D. Wolf �Wiley-VCH, Weinheim,2005�.
113302-23 Dense granular flow down an inclined plane Phys. Fluids 22, 113302 �2010�
Downloaded 01 Jan 2011 to 203.200.35.31. Redistribution subject to AIP license or copyright; see http://pof.aip.org/about/rights_and_permissions

40G. Lois, A. Lematre, and J. M. Carlson, “Numerical tests of constitutivelaws for dense granular flows,” Phys. Rev. E 72, 051303 �2005�.
41G. Lois, A. Lemaitre, and J. M. Carlson, “Spatial force correlations ingranular shear flow. I. Numerical evidence,” Phys. Rev. E 76, 021302�2007�.
42G. Lois, A. Lemaitre, and J. M. Carlson, “Spatial force correlations ingranular shear flow. II. Theoretical implications,” Phys. Rev. E 76,021303 �2007�.
43A. S. Argon, “Plastic deformation in metallic glasses,” Acta Metall. 27,47 �1979�.
44J. S. Langer, “Dynamics of shear-transformation zones in amorphous plas-ticity: Formulation in terms of an effective disorder temperature,” Phys.Rev. E 70, 041502 �2004�.
45V. Kumaran, “Kinetic theory for the density plateau in the granular flowdown an inclined plane,” Europhys. Lett. 73, 232 �2006�.
46V. Kumaran, “Dense granular flow down an inclined plane—From kinetictheory to granular dynamics,” J. Fluid Mech. 599, 120 �2008�.
47C. S. Campbell, “Granular material flows—An overview,” Powder Tech-nol. 162, 208 �2006�.
48R. D. Mindlin and H. Deresiewicz, “Elastic spheres in contact under vary-ing oblique forces,” ASME Trans. J. Appl. Mech. 20, 327 �1953�.
49Tables of Physical and Chemical Constants, edited by G. W. C. Kaye andT. H. Laby �Macmillan, London, 1992�.
50D. M. Cole and J. F. Peters, “A physically based approach to granularmedia mechanics: Grain-scale experiments, initial results and implicationsto numerical modeling,” Granular Matter 9, 309 �2007�.
51Handbook of Glass Data, edited by O. V. Mazurin, M. V. Streltsina, and T.P. Shvaiko-Shvaikovskaya �Elsevier, New York, 1993�.
52D. M. Cole and J. F. Peters, “Grain-scale mechanics of geologic materialsand lunar simulants under normal loading,” Granular Matter 10, 171�2008�.
53P. J. Steinhardt, D. R. Nelson, and M. Ronchetti, “Bond-orientational orderin liquids and glasses,” Phys. Rev. B 28, 784 �1983�.
54GDR MiDi, “On dense granular flows,” Eur. Phys. J. E 14, 341 �2004�.55B. Bernu and R. Mazighi, “One-dimensional bounce of inelastically col-
liding marbles on a wall,” J. Phys. A 23, 5745 �1990�.56S. McNamara and W. R. Young, “Inelastic collapse and clumping in a
one-dimensional granular medium,” Phys. Fluids A 4, 496 �1992�.57S. McNamara and W. R. Young, “Inelastic collapse in two dimensions,”
Phys. Rev. E 50, R28 �1994�.58D. Goldman, M. D. Shattuck, C. Bizon, W. D. McCormick, J. B. Swift,
and H. L. Swinney, “Absence of inelastic collapse in a realistic three ballmodel,” Phys. Rev. E 57, 4831 �1998�.
59T. Schwager and T. Poschel, “Coefficient of restitution for viscoelasticspheres: The effect of delayed recovery,” Phys. Rev. E 78, 051304 �2008�.
60S. Luding, and S. McNamara, “How to handle the inelastic collapse of adissipative hard-sphere gas with the TC model,” Granular Matter 1, 113�1998�.
61V. Senthil Kumar and V. Kumaran, “Voronoi cell volume distribution andconfigurational entropy of hard spheres,” J. Chem. Phys. 123, 114501�2005�.
113302-24 K. A. Reddy and V. Kumaran Phys. Fluids 22, 113302 �2010�
Downloaded 01 Jan 2011 to 203.200.35.31. Redistribution subject to AIP license or copyright; see http://pof.aip.org/about/rights_and_permissions