density and seasonal food habits of …arizona.openrepository.com/arizona/bitstream/10150/...density...
TRANSCRIPT

Density and seasonal food habits of bobcatson the Three Bar Wildlife Area, Arizona
Item Type text; Thesis-Reproduction (electronic)
Authors Jones, James H., 1952-
Publisher The University of Arizona.
Rights Copyright © is held by the author. Digital access to this materialis made possible by the University Libraries, University of Arizona.Further transmission, reproduction or presentation (such aspublic display or performance) of protected items is prohibitedexcept with permission of the author.
Download date 03/07/2018 15:48:35
Link to Item http://hdl.handle.net/10150/566648
DENSITY AND SEASONAL FOOD HABITS OF BOBCATS
ON THE THREE BAR WILDLIFE AREA, ARIZONA
by
James Henry Jones
A Thesis Submitted to the Faculty of the
SCHOOL OF RENEWABLE NATURAL RESOURCES
In Partial Fulfillment of the Requirements For the Degree of
MASTER OF SCIENCE WITH A MAJOR IN WILDLIFE ECOLOGY
In the Graduate College
THE UNIVERSITY OF ARIZONA
1 9 7 7
STATEMENT BY AUTHOR
This thesis has been submitted in partial fulfillment of requirements for an advanced degree at The University of Arizona and is deposited in the University Library to be made available to borrowers under rules of the Library.
Brief quotations from this thesis are allowable without special permission, provided that accurate acknowledgment of source is made. Requests for permission for extended quotation from or reproduction of this manuscript in whole or in part may be granted by the head of the major department or the Dean of the Graduate College when in his judgment the proposed use of the material is in the interests of scholarship. In all other instances, however, permission must be obtained from the author.
APPROVAL BY THESIS DIRECTOR
This thesis has been approved on the date shown below:
MAN S. SMITHNORMANProfessor of Wildlife Ecology
~7 /97SDate
ACKNOWLEDGMENTS
I thank Dr. Norman S. Smith for his guidance and advice through
out the study and Drs. Lyle K. Sowls, C. Roger Hungerford and Russell
P. Davis for their instruction during my tenure. Deep thanks are given
to Albert and Karen Le Count and the AG&F Research Division and Three
Bar crew for their help and support, also to Norm Woolsey, Bill
Workman, Dr. Ross C. Babcock, Jr., Chuck Hanson and the folks at the
Arizona-Sonora Desert Museum, and JD. Finally, but not leastly, I
thank LH and ML for all they did, have done, and are still doing.
In memoriam (?), a reflection on the words of H. L. Mencken:
"For every complex problem there is a simple solution — and it is
wrong."
iii
TABLE OF CONTENTS
LIST OF ILLUSTRATIONS.......................................... v
LIST OF TABLES ................................................ vi
A B S T R A C T ........................................................ vii
INTRODUCTION.............................................. .. . 1
STUDY A R E A .............................................. 4
METHODS AND MATERIALS ............................................ 7
Density, Home Range and Sex/Age StructureD i e t ...................................Prey Availability . . . .................Population Trend Techniques ....................... . . . . 10
RESULTS.......................................................... 11
Density, Home Range and Sex/Age Structure ................. 11D i e t ........................................ 11Prey Availability.......................................... 14Population Trend Techniques ............................... 14
DISCUSSION...................................................... 20
Density, Home Range and Sex/Age Structure .................. 20Diet and Prey Availability............................... 24Population Trend Techniques . . . . . . . . . . . . . . . . 35
APPENDIX A: STANDARD MEASUREMENTS OF BOBCATS ................... 37
APPENDIX B: STANDARD MEASUREMENTS OF RODENTS ................. 39
APPENDIX C: MONTHLY PRECIPITATION ............................. 4l
LIST OF REFERENCES.............................................. 43
Page
iv
O-CO ON
LIST OF ILLUSTRATIONS
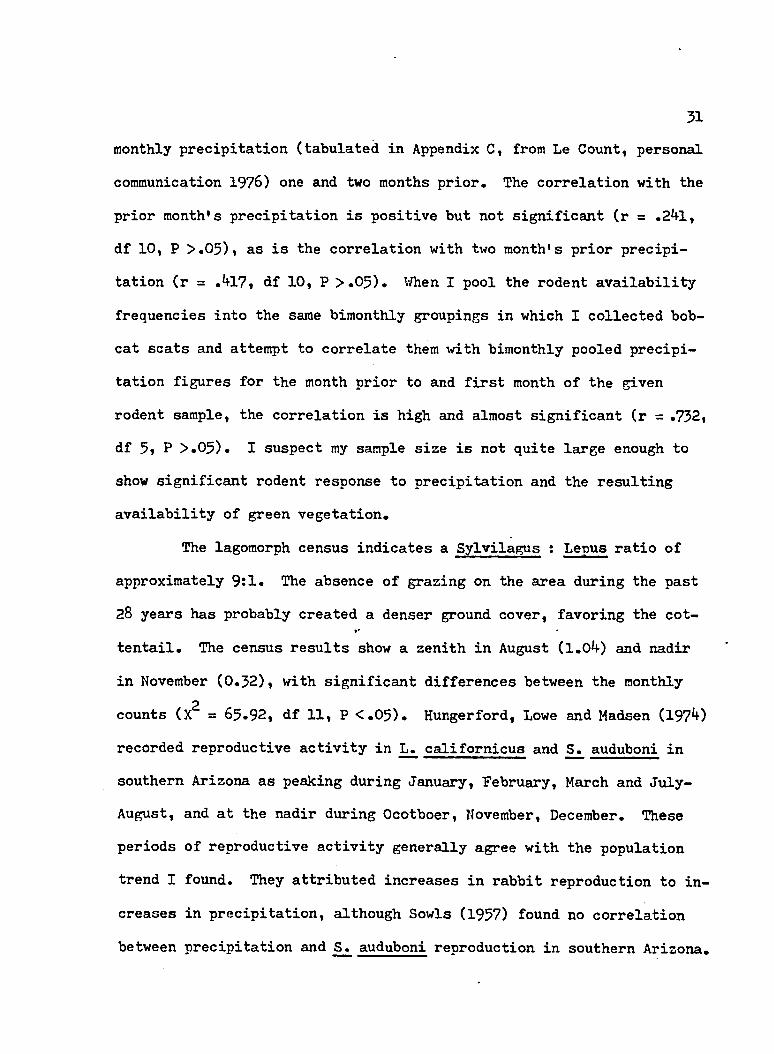
1. Bobcat study area on the Three Bar Wildlife Area,Arizona..................................... 5
2. Trapping locations of marked carnivores and trails ofbobcats when pursued by hounds on the Three Bar Wildlife Area, Arizona . . . . . . . . . . . . . . . 13
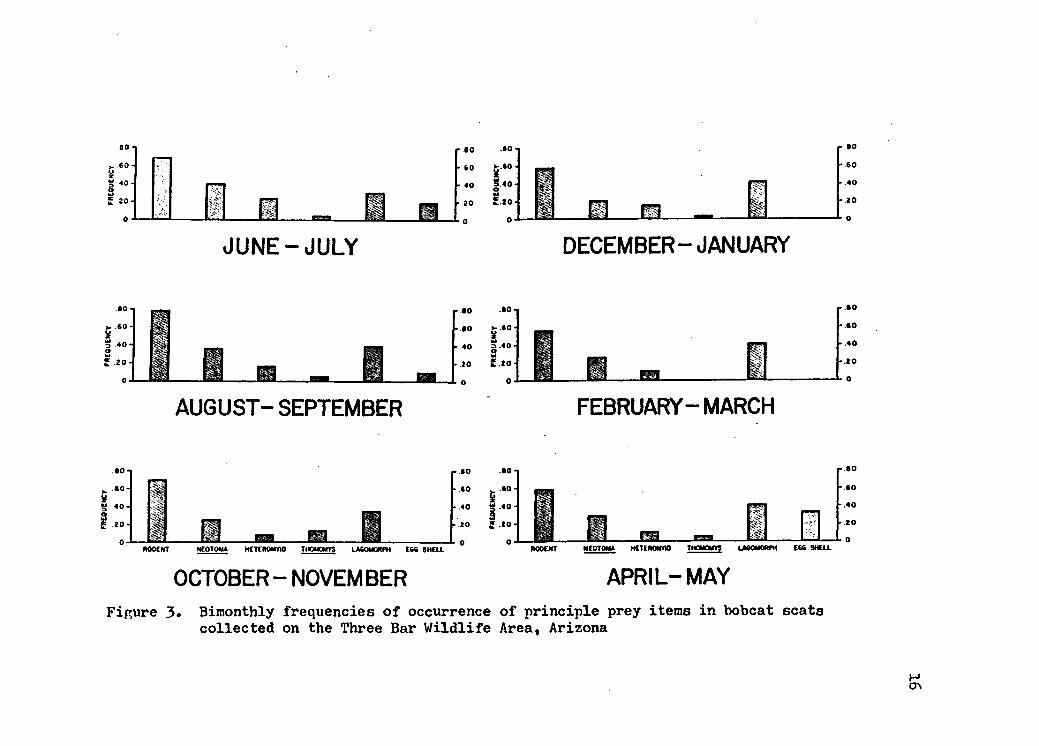
3» Bimonthly frequencies of occurrence of principle prey items in bobcat scats collected on the Three Bar Wildlife Area, A r i z o n a ............................ l6
4. Monthly rodent availability and consumption by bobcats onthe Three Bar Wildlife Area, Arizona. .................... 33
5. Monthly lagomorph availability and consumption by bobcatson the Three Bar Wildlife Area, Arizona . . . . . . . . . 34
Figure Page
v
LIST OF TABLES
1. Location, sex, age and marking data for carnivores trapped and marked on the Three Bar Wildlife Area,Arizona.................................. 12
2. Percentages of occurrence of prey items in 176 bobcatscats collected on the Three Bar Wildlife Area, Arizona . 15
3* Numbers and frequencies of rodents trapped monthly on theThree Bar Wildlife Area, Arizona ....................... 17
4. Numbers and frequencies of lagomorphs strip-censusedmonthly on the Three Bar Wildlife Area, Arizona ........ l8
5. Numbers of scats collected on monthly transects on theThree Bar Wildlife Area, A r i z o n a ............ .. . . . . 19
6. Percentages of occurrence of principle bobcat prey items— Western states . . . . . . ......................... • 28
7. Percentages of occurrence of principle bobcat prey items— Southern states . . . . . . . . . . . . . . . . . . . 29
8. Percentages of occurrence of principle bobcat prey items— Northeastern states . . . . . . ...................... 30
Table Page
vi
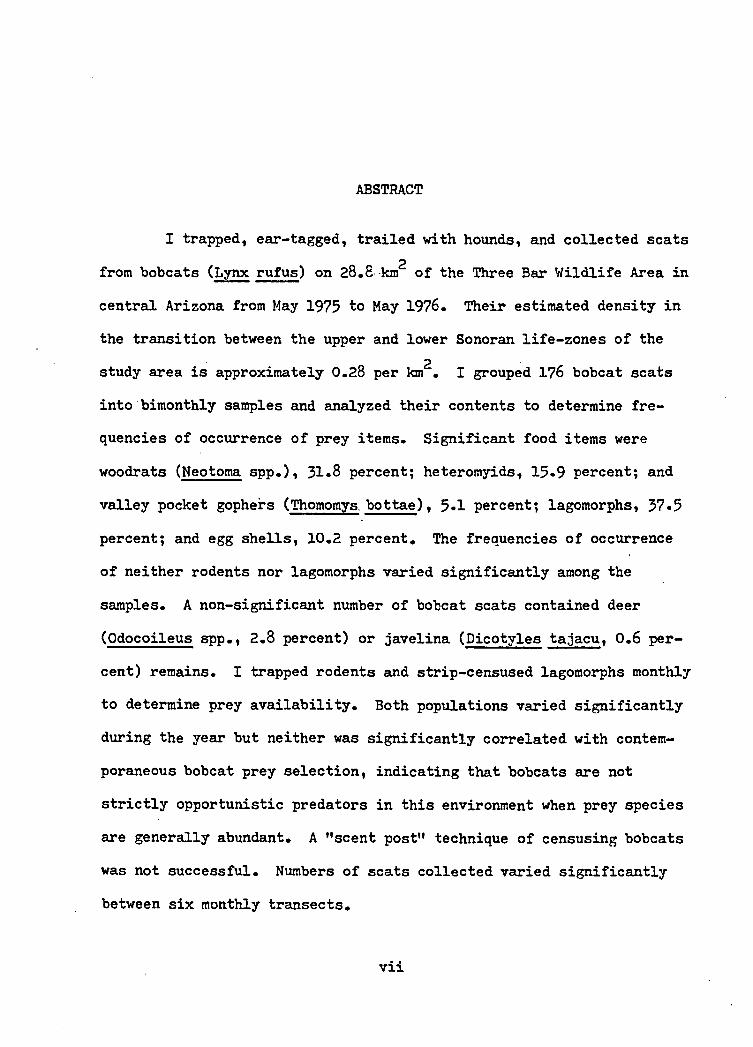
ABSTRACT
I trapped, ear-tagged, trailed with hounds, and collected scatsp
from bobcats (Lynx rufus) on 28.8 km of the Three Bar Wildlife Area in
central Arizona from May 1975 to May 1976. Their estimated density in
the transition between the upper and lower Sonoran life-zones of the
study area is approximately 0.28 per km . I grouped 176 bobcat scats into bimonthly samples and analyzed their contents to determine fre
quencies of occurrence of prey items. Significant food items were
woodrats (Neotoma spp.), 31*8 percent; heteromyids, 15*9 percent; and
valley pocket gophers (Thomomys. bottae), 5*1 percent; lagomorphs, 37*5
percent; and egg shells, 10.2 percent. The frequencies of occurrence
of neither rodents nor lagomorphs varied significantly among the
samples. A non-significant number of bobcat scats contained deer
(Odocoileus spp., 2.8 percent) or javelina (Dicotyles tajacu, 0.6 percent) remains. I trapped rodents and strip-censused lagomorphs monthly
to determine prey availability. Both populations varied significantly
during the year but neither was significantly correlated with contem
poraneous bobcat prey selection, indicating that bobcats are not
strictly opportunistic predators in this environment when prey species
are generally abundant. A "scent post" technique of censusing bobcats
was not successful. Numbers of scats collected varied significantly
between six monthly transects.
vii
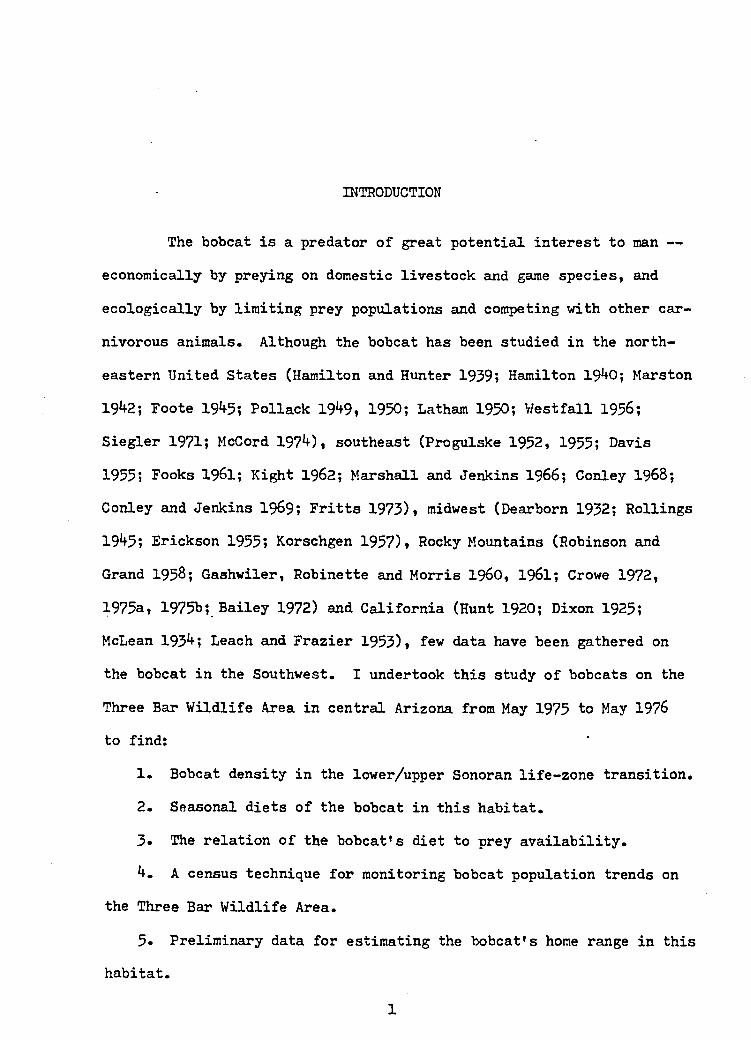
INTRODUCTION
The bobcat is a predator of great potential interest to man —
economically by preying on domestic livestock and game species, and
ecologically by limiting prey populations and competing with other car
nivorous animals. Although the bobcat has been studied in the north
eastern United States (Hamilton and Hunter 1939; Hamilton 1940; Marston
1942; Foote 1945; Pollack 1949, 1950; Latham 1950; Westfall 1956;
Siegler 1971; McCord 1974), southeast (Progulske 1952, 1955; Davis
1955; Fooks 1961; Kight 1962; Marshall and Jenkins 1966; Conley 1968;
Conley and Jenkins 1969; Fritts 1973)» midwest (Dearborn 1932; Rollings
1945; Erickson 1955; Korschgen 1957), Rocky Mountains (Robinson and
Grand 1958; Gashwiler, Robinette and Morris i960, 1961; Crowe 1972, 1975a, 1975b; Bailey 1972) and California (Hunt 1920; Dixon 1925;
McLean 1934; Leach and Frazier 1953), few data have been gathered on
the bobcat in the Southwest. I undertook this study of bobcats on the
Three Bar Wildlife Area in central Arizona from May 1975 to May 1976
to find:
1. Bobcat density in the lower/upper Sonoran life-zone transition.
2. Seasonal diets of the bobcat in this habitat.
3* The relation of the bobcat's diet to prey availabilityw
4. A census technique for monitoring bobcat population trends on
the Three Bar Wildlife Area.
5- Preliminary data for estimating the bobcat's home range in this
habitat.
1
2
6. The sex and age structure of the bobcat population on the Three
Bar Wildlife Area.
The Three Bar Wildlife Area consists of 171 km^ of the Tonto
National Forest on the west side of Roosevelt Lake in central Arizona.
The U.S. Forest Service and Arizona Game and Fish Commission have had
a cooperative agreement since 19^9 to use the area for wildlife research and it has been ungrazed since 19^7. The area has been closed
to the hunting and trapping of predators since 1972, and mule deer (Odocoileus hemionus) and javelina hunting have been closely regulated
and monitored on the area during the past 12 years.The Three Bar extends from 600 m to 2500 m in elevation and
includes lower Sonoran desertscrub, upper Sonoran desert grassland and
chaparral, oak woodland and ponderosa pine associations, as defined by
Lowe (1964). Approximately ll6-km^ of the Three Bar are suitable desert mule deer habitat (the desertscrub, desert grassland and lower
chaparral). The Arizona Game and Fish Department has been studying
mule deer here since 1952 (McCulloch 1954) and has monitored the herds
carefully during that period. The 1959 deer survey and pellet count
on the Three Bar indicated a density of approximately 11.6 deer per 2km , but eight years of any deer hunting coupled with low fawn sur
vival lowered the density to approximately 2.3 deer per km^ in 1964
(McMichael 1970) where it remained until 1971. The current density is
approximately 4.6 deer per km^ (Albert Le Count, personal communication 1976).
The decrease in deer density on the Three Bar corresponded with
a statewide decline in mule deer populations (Jantzen 1964) and this
has prompted a series of studies to determine the cause(s) of low fawn
survival in Arizona's mule deer herds. To assess the importance of
predation on fawns in limiting herd recruitment, the Department in 1970
enclosed 246 ha of typical mule deer habitat on the Three Bar to form
the Walnut Canyon Game Enclosure. The area was enclosed with chain-
link fencing approximately 3 m high, and a wire apron was placed around the base of the fence to form a barrier to predators. Bobcats and
coyotes (Canis latrans) were removed from the enclosure. No black
bears (Euarctos americanus) or mountain lions (Felis concolor) were
entrapped when the fence was completed. From 1971 to 1975 annual deer
herd composition and population counts on the Three Bar have been com
pared with the same data from inside the enclosure. The results indi
cate virtually complete fawn (and javelina piglet) survival inside the
enclosure, while survival outside has been significantly lower (xf =
56.87, df 4, P <.05 /he Count, personal communication 197(7). The
evidence suggests that bobcat and/or coyote predation on fawns (and
piglets) may be limiting herd size on the Three Bar.
Because bobcat predation on mature deer has been well docu
mented (Young 1928; Harwell 1932; Dixon 1934; Dill 1947; Matson 1948;
Westfall 1956; Petraborg and Gunvalson 1962), it is quite feasible that bobcats could prey extensively on the more vulnerable fawns. This
possibility was the motivating basis for my study.
3
STUDY AREA
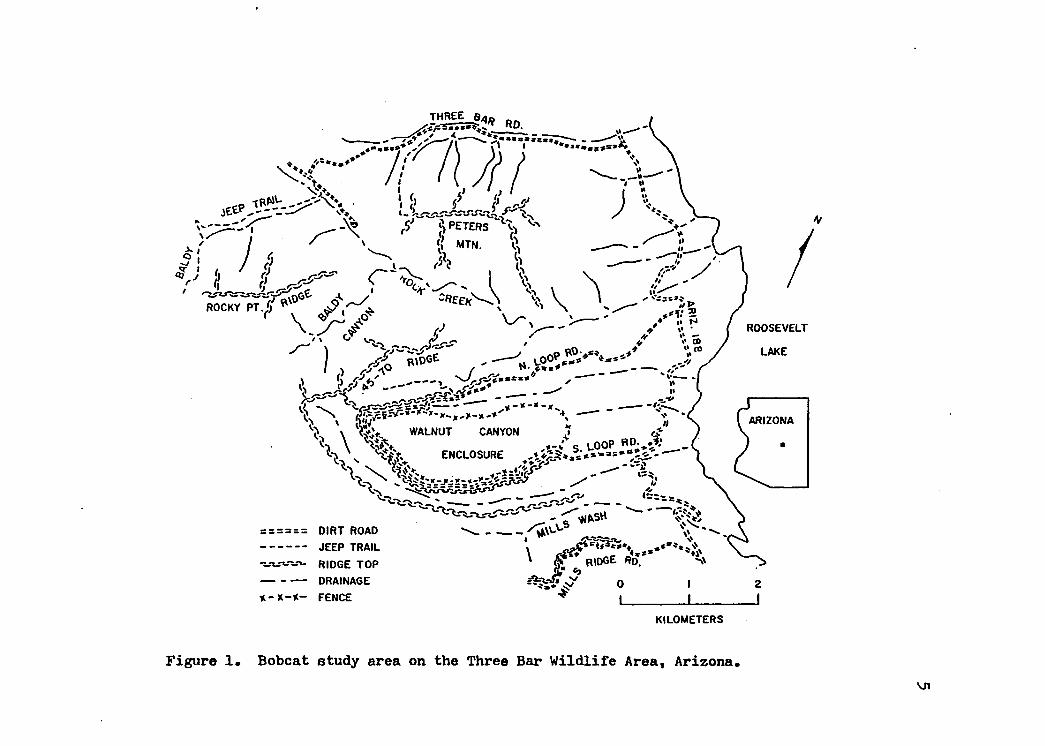
My study area extends from the Three Bar road (Forest Service
road 445) and the Baldy jeep trail on the north to the Mills Ridge road
on the south, and Arizona highway 188 on the east, to the top of the
first ridge west of the Walnut Canyon Game Enclosure on the west (Fig.p
1). This area is 28.8l-km (excluding the 246 ha in the enclosure)
and ranges in elevation from 655 m on the east edge to 1233 m on top of Rocky Point Ridge.
The vegetation includes lower Sonoran desertscrub, upper
Sonoran desert grassland and the lower edge of the upper Sonoran chap
arral associations. The desertscrub is characterized by saguaro
(Carnegia gigantea), paloverde (Cercidium microphyllum), crucifixion
thorn (Canotia holocantha), jojoba (Simmondsia chinensis), catclaw
(Acacia greggi) and red brome (Bromus rubens)• The desert grassland
is primarily composed of fairy duster (Calliandra eriophylla), prickly
pear (Opuntia engelmanni), velvet mesquite (Prosopis juliflora),
eriogonum (Eriogonum wrighti), snakeweed (Gutierrezia sarothrae), wild
oats (Avena fatua), three-awn (Aristida spp.) and red brome. The
chaparral is mainly covered with turbinella oak (Quercus turbinella),
snakeweed and red brome. More complete descriptions of the vegetation
on the Three Bar are given by McCulloch (1954) and Dickerman (1955)•
McCulloch (1954) reported that the annual precipitation on the
Three Bar is 44.0 cm but for the past 20 years it has averaged only4
three e*,,
ROCKY P I. v
ROOSEVELT
LAKE
WALNUT CANYON
ENCLOSURE
DIRT ROAD
JEEP TRAIL
RIDGE TOP DRAINAGE
FENCE
KILOMETERS
Figure 1. Bobcat study area on the Three Bar Wildlife Area, Arizona

636.4 cm (Le Count, personal communication 1976). During the year of
my study the area received 44.7 cm of precipitation (Le Count, personal communication 1976).
METHODS AND MATERIALS
Density, Home Range and Sex/Age Structure
I set coil spring traps baited for bobcats from October 1975
through March 1976. I used Victor number 2 traps with 1 m chain and
toggle drags and Victor number 3 traps with 1 m chains welded to 80 cm stakes. I boiled all traps in water and creosote (Larrea divaricata)
oil to reduce odor and weatherproof the metal. I padded the jaws with
foam rubber and vinyl tape to minimize damage to trapped animals' feet.
I made mostly double pen sets similar to those described by Young
(1958), baited with parts of jackrabbit (Lepus spp.) or desert cotton
tail rabbit (Sylvilagus auduboni) carcasses and a lure made with bob
cat urine and anal glands, beaver (Castor canadensis) castor, decom
posed fish oil, oil of catnip, skunk (Mephitis spp.) musk and glycerine.
I trapped mainly along ridge top saddles and wash bottoms and anywhere
I found fresh bobcat signs. I trapped for 21 trap-nights in October,
115 in November, 42 in December, 328 in January, 353 in February and
246 in March, during which time I made sets on all major ridges and
washes in the study area.
I immobilized trapped bobcats by holding their heads in a 1.5 m snare and injecting drugs into their thighs with l8-gauge needles on a pole syringe. I first injected 1 ml Atropine (1/120 g per ml)
to reduce salivation, followed in ten minutes by a dose of ketamine
hydrochloride (100 mg per ml) and acepromazine (0.1 mg per ml ketamine).7
I estimated dosages at 15 mg ketamine per kg body weight. I used
phencyclidine hydrochloride (100 mg per ml) to immobilize two badgers
(Taxidea taxus) and a raccoon (Procyon lotor). I applied neomycin-
sulfate gel to all immobilized animals' eyes to prevent dissiccation,
administered a 1 ml injection of Combiotic to each animal and squeezed
a penicillin-neomycin-sulfa ointment on all superficial injuries.
I placed a numbered aluminum tag in one ear of all bobcats,
the coyote and the grey fox (Urocyon cinereoargenteus), beneath which
I affixed a 7 cm x 5 cm oval of reinforced plastic colored blue, white,
orange or yellow, to allow visual identification at a distance. I took
standard body measurements and weighed each animal. I force-fed each
bobcat a gelatin capsule containing 100 glass beads for possible re
covery in feces later (Sowls and Minnamon 1965). I attempted to ex
tract an incisor from each bobcat for ageing by Crowe's (1972) tech
nique and I qualitatively estimated each animal's age class (young,
adult, old, very old) by tooth wear. I tried to cause immobilized
animals to defecate by injecting 50 ml of yellow aniline dye into their
anuses but abandoned this technique because it failed.
On April 4, 7 and 8 Karen Le Count and I followed six hounds
as they hunted across the northwestern portion of the study area. We
attempted to resight marked animals or sight bobcats that had not been trapped.
Diet
I collected bobcat scats (feces) monthly along ridge tops where
the soil is coarse and scats are not covered, and in washes. Scats are
9very similar to those described by Murie (195*0 for southwestern bobcats and I identified them on the basis of size, conformation, gross
composition, location and odor in comparison to a sample taken from
bobcats at the Arizona-Sonora Desert Museum.
I grouped the scats into bimonthly samples to indicate seasonal
diets and broke them apart individually to analyze their contents. I
identified the remains in these scats using four references as needed.
1. The key by Cockrum (i960) for osteological remains.2. The key by Moore et al. (197*0 for hair scale impressions made
by Williamson's (1951) technique, modified to use acrylic instead of
Gelva.
3. Personal collections of hairs and photomicrographs of hair
scale impressions.
4. Specimens from the University of Arizona mammal collection for
comparison.
Prey Availability
I set two 10 m x 10 m five-station grids, using a museum spe
cial and Victor rat trap at each station, each month in each of the
three associations on the study area — desertscrub, desert grassland
and chaparral. I trapped each grid for five nights for a total of 100
trap-nights per association per month. Other than these grids I did
not attempt to census sciurids or geomyids, nor to index the abundance
of birds or bird eggs.
I censused lagomorphs by driving 25 km per hour for 10 km
along the Three Bar road five days each month and counting the
10
lagomorphs seen between the drainage ditches along the sides of the
road. I did this during the half hour before sunrise to correspond
with Smith's (1959) period of peak lagomorph activity in the area. I
did not census any mammalian prey larger than lagomorphs.
Population Trend Techniques
I first attempted to census bobcats using a modification of
Linhart and Knowlton's (1976) coyote census technique. I constructed
a census route of 40 stations at 0.5 km intervals along the Three Bar,
north and south loop, and Mills Ridge roads. I randomly allocated 20
scent and 20 visual (curiosity) attractants to the stations. I made
the scent attractants by grinding 0.5 g of dried catnip leaves in a
mortar and pestle and placed them in histological staining capsules on
the ends of 15 cm wooden sticks. I made the visual attractants by
hanging shiny aluminum muffin tins, 9 cm in diameter, from stiff wires
imbedded in the ground and standing 1 m high. I placed both baits in
the centers of circles of sifted soil, 1 m in diameter, along the sides
of the roads. I operated the census route during the full moon in June
for five nights and in August for four nights, recording all legible
tracks in the circles.
I tried an alternative census method by walking transects along
the tops of Rocky Point Ridge (2 km), Peters Mountain (1.5 km) and
.45-75 Ridge (3 km) during the first week of each month and recorded
the numbers of bobcat scats found. I conducted these counts from
October through March.
RESULTS
Density, Home Range and Sex/Age Structure
I trapped six different bobcats and retrapped one on the study
area. Three of these were male and three female, I believe that the
two toes found in a trap on March 3 belong to a seventh bobcat because
of the location of the trap in relation to other locations on the study
area where I trapped bobcats. I also trapped one coyote, grey fox,
raccoon and spotted skunk (Spilogale putorious), and two badgers during
the study. Data on all these animals are in Table 1 and Appendix A,
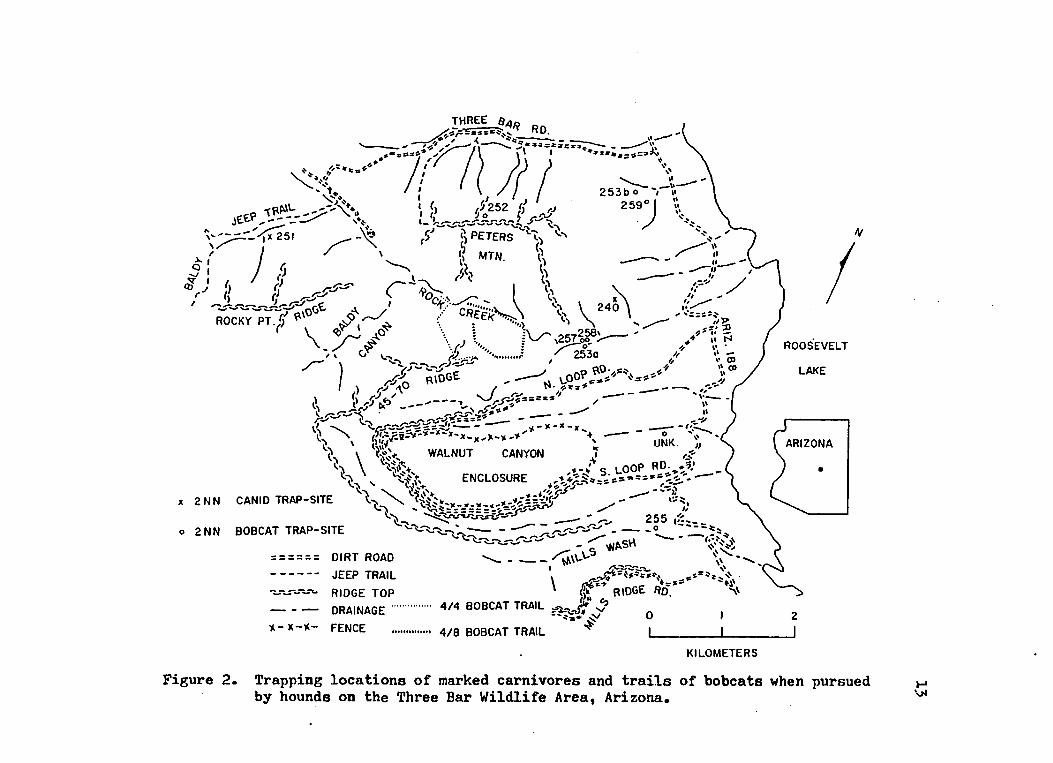
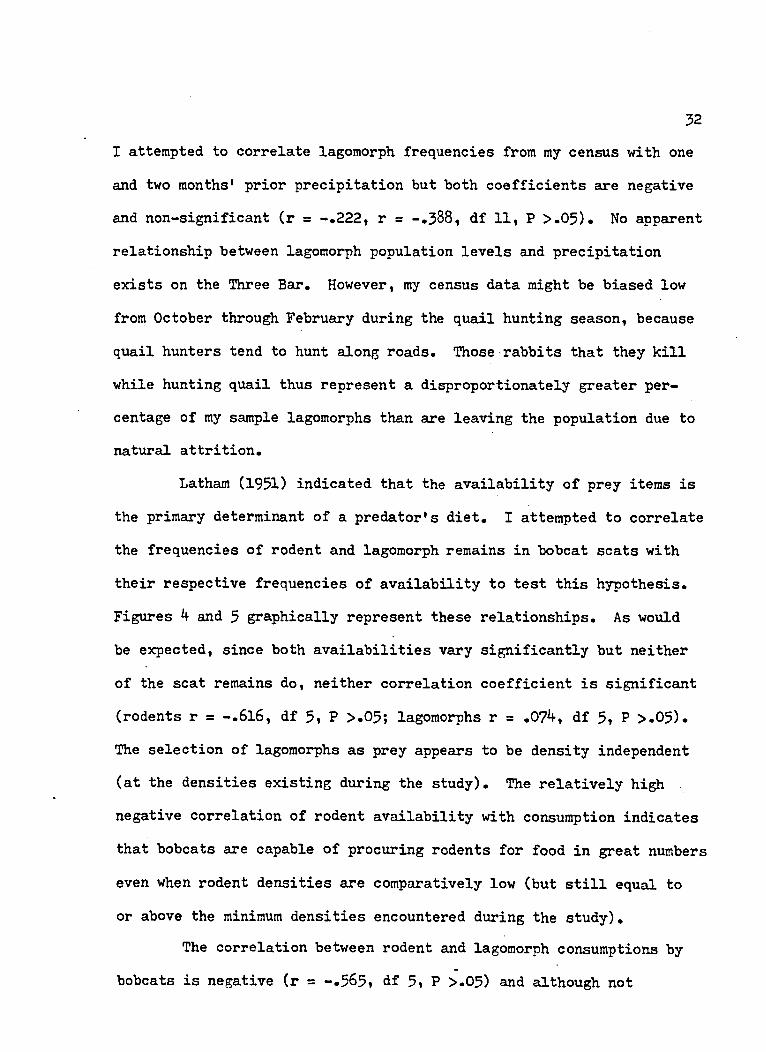
and trapping locations of carnivores marked are shown in Figure 2.
On April 8, while we were riding after a pack of hounds in Rock
Creek, Karen Le Count sighted an unmarked bobcat that the dogs had
flushed from a boulder pile. The hounds had followed a bobcat trail
on April 4 also, but she saw the only bobcat we observed. Both bobcat
trails are indicated in Figure 2.
I did not find any glass beads which I had fed to trapped bob
cats in scats I collected and analyzed, nor was I able to extract in
cisors intact from drugged bobcats for sectioning, I estimated the
trapped bobcats' ages from tooth wear only.
Diet
I collected 42 bobcat scats during the June-July period, 4l
during August-September, 23 during October-November, 19 during December-
January, 34 during February-March and 17 during April-May. In
11
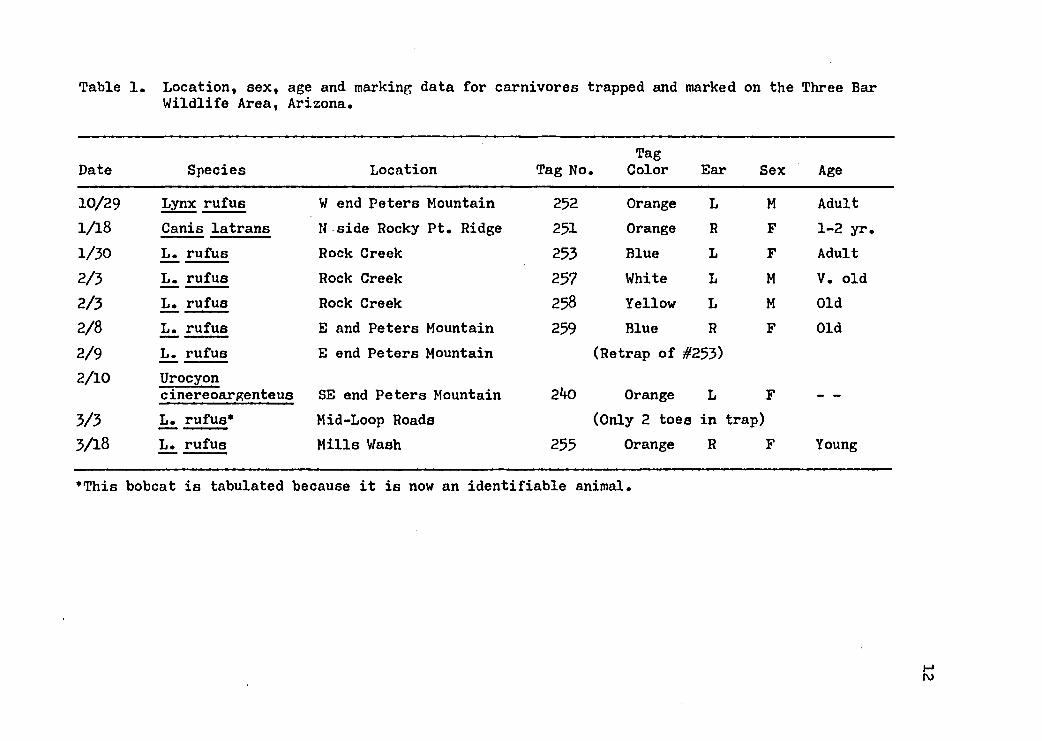
Table 1. Location, sex, age and marking data for carnivores trapped and marked on the Three Bar Wildlife Area, Arizona.
Date Species Location Tag NoTag
. Color Ear Sex Age
10/29 Lynx rufus W end Peters Mountain 252 Orange L M Adult1/18 Canis latrans N side Rocky Pt. Ridge 251 Orange R F 1-2 yr.1/30 L. rufus Rock Creek 253 Blue L F Adult2/3 L. rufus Rock Creek 257 White L M V. old2/3 L. rufus Rock Creek 258 Yellow L M Old2/8 L. rufus E and Peters Mountain 259 Blue R F Old2/9 L. rufus E end Peters Mountain (Retrap of #253)2/10 Urocyon
cinereoargenteus SB end Peters Mountain 240 Orange L F mm mm
3/3 L. rufus* Mid-Loop Roads (Only 2 toes in trap)3/18 L. rufus Mills Wash 255 Orange R F Young
•This bobcat is tabulated because it is now an identifiable animal.
Hru
THREE_64/?
x 251
ROCKY PT V
ROOSEVELT253a
LAKE
ARIZONACANYON
ENCLOSURE
2N N CANID TRAP-SITE
o 2N N BOBCAT TRAP-SITE
= = = = = = DIRT ROAD
-------------- JEEP TRAIL
- w " * - RIDGE TOP— -----------DRAINAGE
FENCE
\ r id g e R6.4 /4 BOBCAT TRAIL
4 /8 BOBCAT TRAIL ^ |____
KILOMETERS
Figure 2. Trapping locations of marked carnivores and trails of bobcats when pursued by hounds on the Three Bar Wildlife Area, Arizona.
HVI
14
analyzing the scats I grouped kangaroo rats (Dipodomys spp.) and pocket
mice (Perognathus spp.) as heteromyids because I could not clearly dif
ferentiate the remains of the two genera. For the same reason I com
bined black-tailed jackrabbits (Lepus californicus) and desert cotton
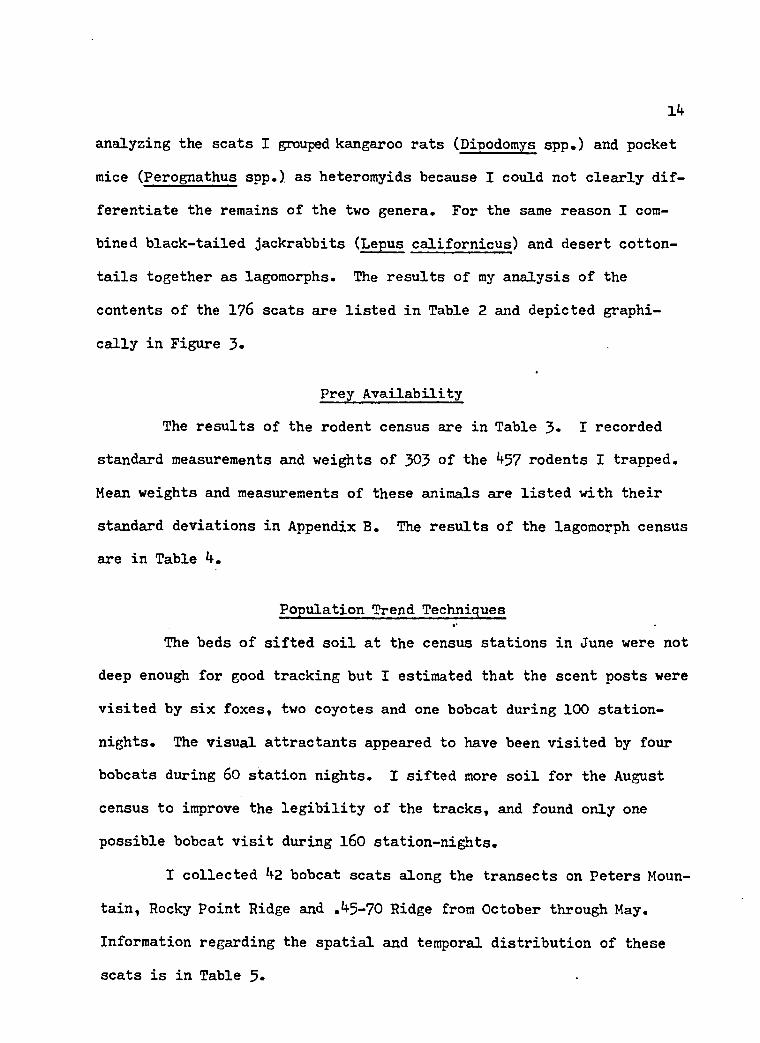
tails together as lagomorphs. The results of my analysis of the
contents of the 1?6 scats are listed in Table 2 and depicted graphi
cally in Figure 3«
Prey Availability
The results of the rodent census are in Table 3» I recorded
standard measurements and weights of 303 of the 457 rodents I trapped. Mean weights and measurements of these animals are listed with their
standard deviations in Appendix B. The results of the lagomorph census
are in Table 4.
Population Trend Techniques
The beds of sifted soil at the census stations in June were not
deep enough for good tracking but I estimated that the scent posts were
visited by six foxes, two coyotes and one bobcat during 100 station-
nights. The visual attractants appeared to have been visited by four
bobcats during 60 station nights. I sifted more soil for the August
census to improve the legibility of the tracks, and found only one
possible bobcat visit during 160 station-nights.
I collected 42 bobcat scats along the transects on Peters Moun
tain, Rocky Point Ridge and .45-70 Ridge from October through May.
Information regarding the spatial and temporal distribution of these
scats is in Table 5«
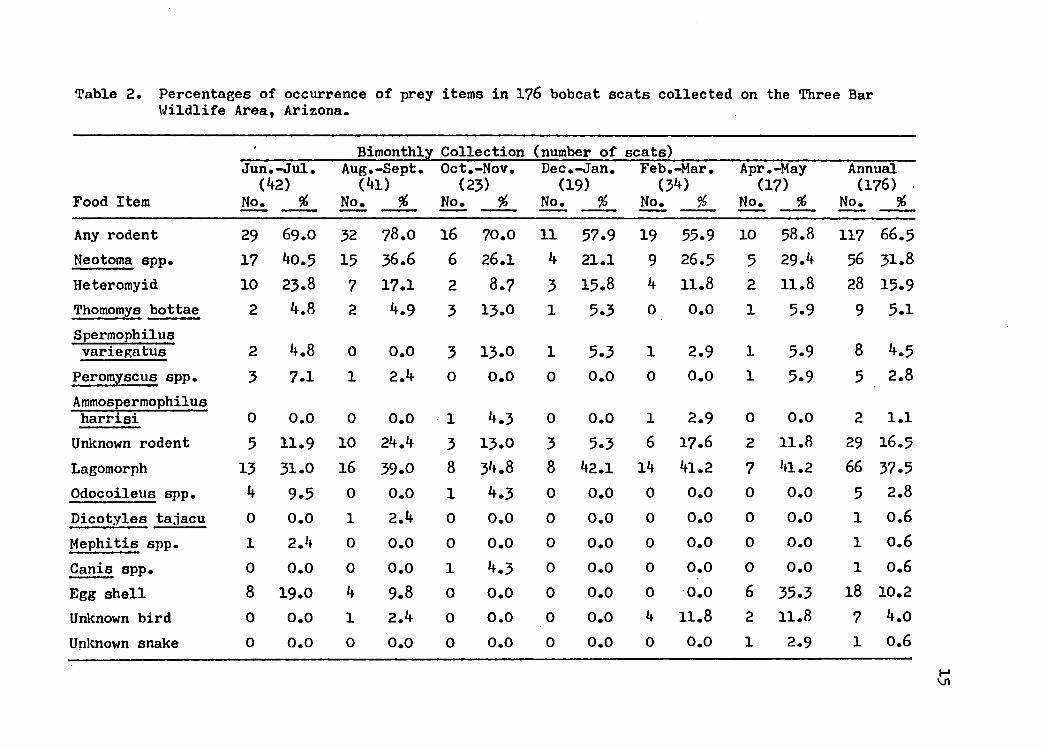
Table 2. Percentages of occurrence of prey items in 1?6 bobcat scats collected on the Three BarWildlife Area, Arizona.
Bimonthly Collection (number of scats)
Food Item
Jun.-Jul.(42)
No. %
Aug.-Sept. (41)
No. #
Oct.-Nov. (23)
No. %
Dec.-Jan. (19)
No. %
Feb.-Mar. (34)
No. %
Apr.-May (17)
No. %
Annual (176)
No. %
Any rodent 29 69.0 32 78.0 16 70.0 11 57.9 19 55.9 10 58.8 117 66.5Neotoma spp. 17 40.5 15 36.6 6 26.1 4 21.1 9 26.5 5 29.4 56 31.8Heteromyid 10 23.8 7 17.1 2 8.7 3 15.8 4 11.8 2 11.8 28 15.9Thomomys bottae 2 4.8 2 4.9 3 13.0 1 5.3 0 0.0 1 5.9 9 5.1Spermophilusvariegatus 2 4.8 0 0.0 3 13.0 1 5.3 1 2.9 1 5.9 8 4.5
Peromyscus spp. 3 7.1 1 2.4 0 0.0 0 0.0 0 0.0 1 5.9 5 2.8Ammospermophilusharrisi 0 0.0 0 0.0 1 4.3 0 0.0 1 2.9 0 0.0 2 1.1
Unknown rodent 5 11.9 10 24.4 3 13.0 3 5.3 6 17.6 2 11.8 29 16.5Lagomorph 13 31.0 16 39.0 8 34.8 8 42.1 14 41.2 7 41.2 66 37.5Odocoileus spp. 4 9.5 0 0.0 1 4.3 0 0.0 0 0.0 0 0.0 5 2.8Dicotyles ta.jacu 0 0.0 1 2.4 0 0.0 0 0.0 0 0.0 0 0.0 1 0.6Mephitis spp. 1 2.4 0 0.0 0 0.0 0 0.0 0 0.0 0 0.0 1 0.6Canis spp. 0 0.0 0 0.0 1 4.3 0 0.0 0 0.0 0 0.0 1 0.6Egg shell 8 19.0 4 9.8 0 0.0 0 0.0 0 0.0 6 35.3 18 10.2Unknown bird 0 0.0 1 2.4 0 0.0 0 0.0 4 11.8 2 11.8 7 4.0Unknown snake 0 0.0 0 0.0 0 0.0 0 0.0 0 0.0 1 2.9 1 0.6
5I
'
%; 't!. 1
J U N E -J U L Y
80
60
40
200
S**"IdDECEMBER-JANUARY
80
-6 0
-.40
-200
AUGUST-SEPTEMBER
80
-8 0
40
.200
.80
£.20 m
FEBRUARY-MARCH
80
-.60
.40
.20O
80-
60 -S..H£ 20
RODENT
80
.60
.40
.20O
HETEROMYIO THOMOMYS LAGOMORPH E66 SHELL MEOTOMA HETEROMYIO THOMOtm LAGOMORPH EGG SMELL
OCTOBER-NOVEMBER APRIL-M A YFifitire 3» Bimonthly frequencies of occurrence of principle prey items in bobcat scats
collected on the Three Bar Wildlife Area, Arizona
&
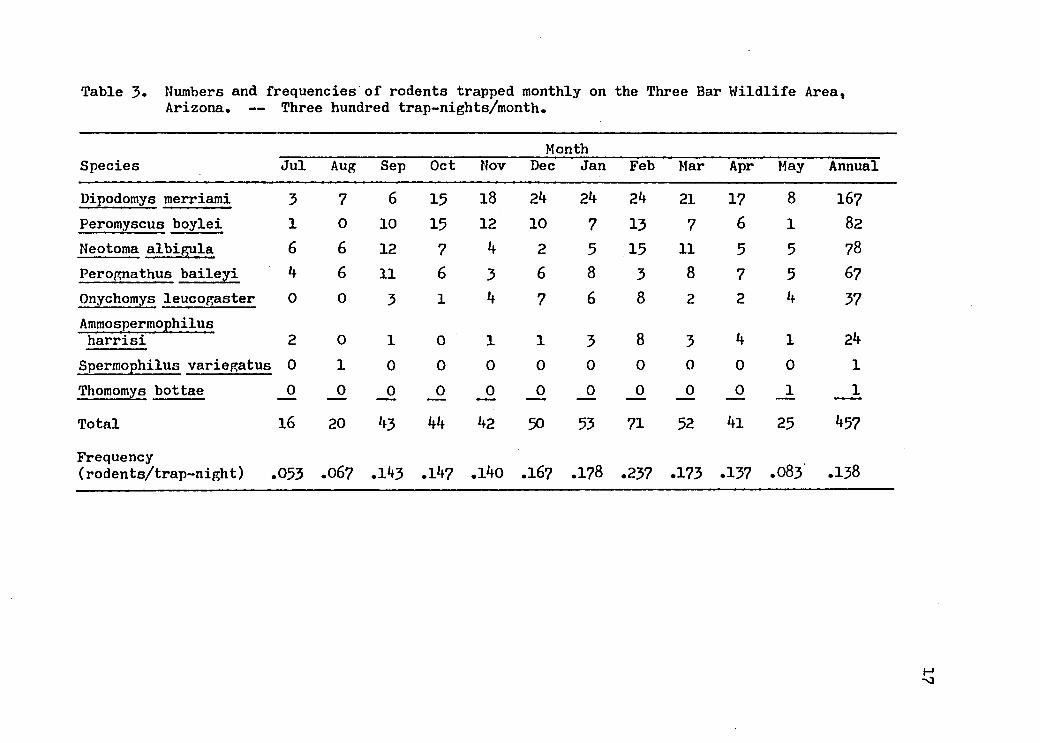
Table J>. Numbers and frequencies of rodents trapped monthly on the Three Bar Wildlife Area, Arizona. — Three hundred trap-nights/month.
MonthSpecies Jul Aug Sep Oct Nov Dec Jan Feb Mar Apr May Annual
Dipodomys merriami 3 7 6 15 18 24 24 24 21 17 8 167Peromyscus boylei 1 0 10 15 12 10 7 13 7 6 1 82Neotoma albigula 6 6 12 7 4 2 5 15 11 5 5 78Perognathus baileyi 4 6 11 6 3 6 8 3 8 7 5 67Onychomys leucogaster 0 0 3 1 4 7 6 8 2 2 4 37Ammospermophilusharrisi 2 0 1 0 1 1 3 8 3 4 1 24
Spermophilus variegatus 0 1 0 0 0 0 0 0 0 0 0 1Thomomys bottae 0 0 0 0 0 0 0 0 0 0 1 1
Total 16 20 43 44 42 50 53 71 52 4l 25 457Frequency(rodents/trap-night) .053 3̂ .143 .147 .i4o .167 .178 .237 .173 .137 O .138
Ho
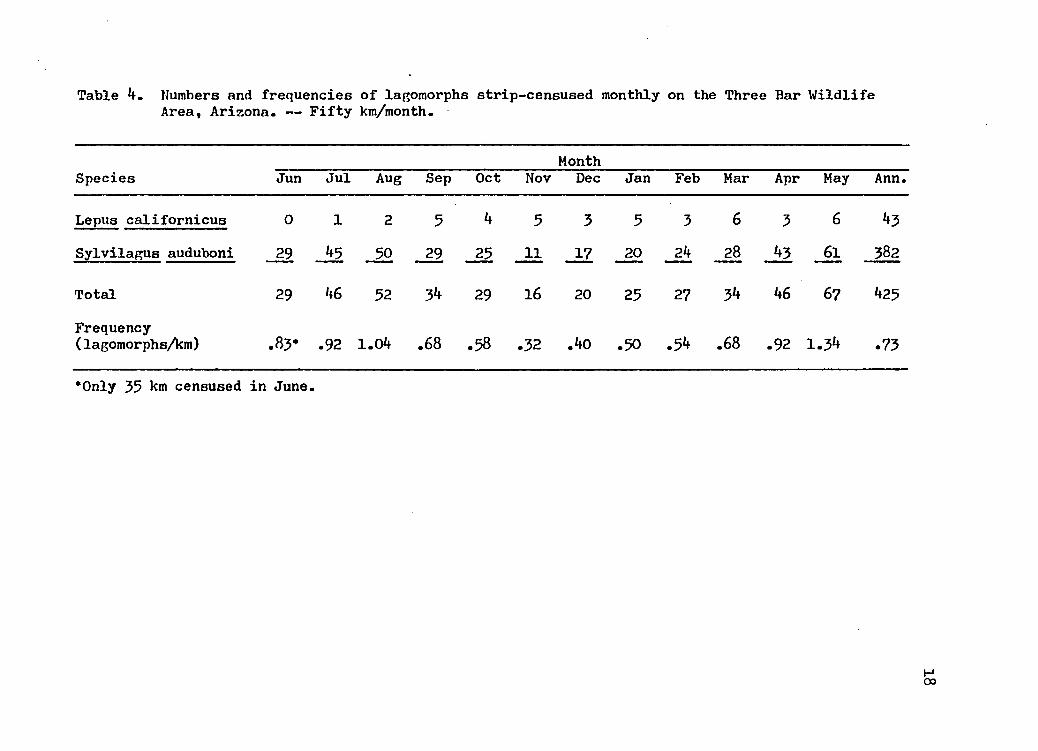
Table 4. Numbers and frequencies of lagomorphs strip-censused monthly on the Three Bar WildlifeArea, Arizona. — Fifty km/month.
MonthSpecies Jun Jul Aug Sep Oct Nov Dec Jan Feb Mar Apr May Ann
Lepus californicus 0 1 2 5 4 5 3 5 3 6 5 6 43Sylvilagus auduboni _29 J £ -50 _29 .25 11 17 20 24 28 43 6l 382
Total 29 46 52 34 29 16 20 25 27 34 46 67 425
Frequency (lagomorphs/km) .83* .92 1.04 .68 .58 .32 .40 .50 .54 .68 .92 1.34 .73
♦Only 35 km censused in June.
H00
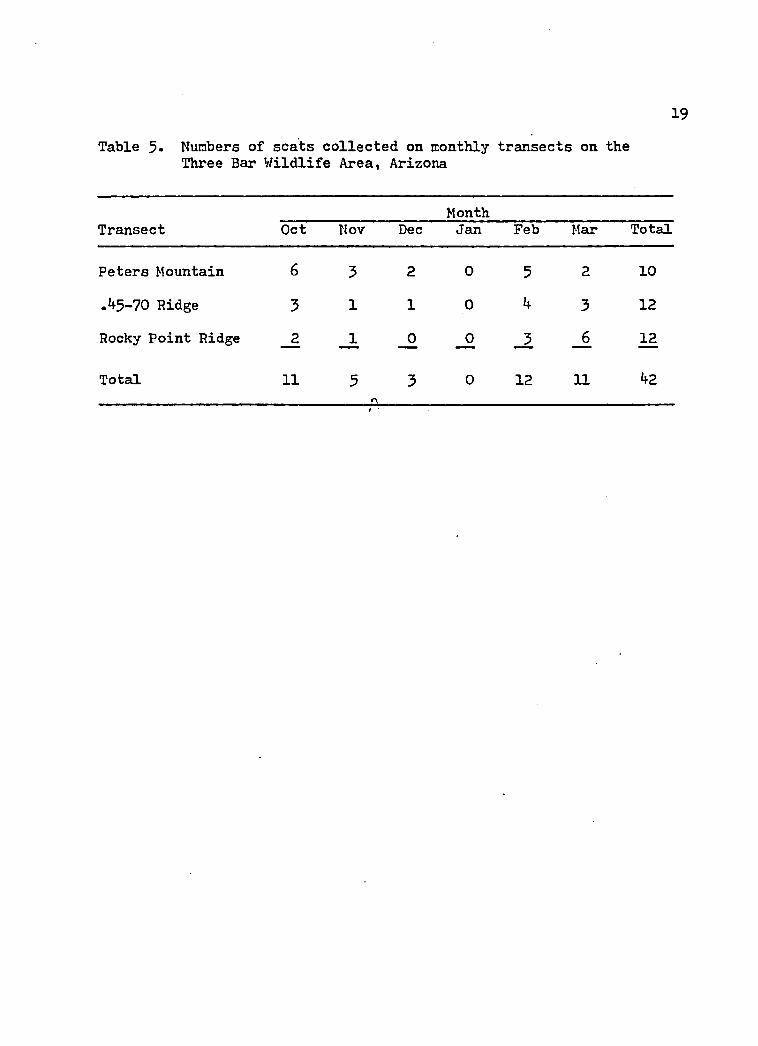
19Table 5« Numbers of scats collected on monthly transects on the
Three Bar Wildlife Area, Arizona
MonthTransect Oct Nov Dec Jan Feb Mar Total
Peters Mountain 6 3 2 0 5 2 10
.45-70 Ridge 3 1 1 0 4 3 12
Rocky Point Ridge _2 JL _0 _0 _6 12
Total 11 5 3 0 12 11 42. z x
DISCUSSION
Density, Home Range and Sex/Age Structure
Based on the six bobcats I trapped and marked, the probable
seventh bobcat that chewed off two toes to escape, and the unmarked
bobcat that Karen Le Count saw, I estimate the density of bobcats on
the area during the study to have been approximately eight bobcats per 2 228.81 km , or 0.28 cats per km . Any density estimate is a function
of space and time, and is dependent on such factors as constant natal
ity, mortality, emigration, immigration, and even distributional flux
in the population while it is being sampled. However, within the con
straints of sampling a mobile population on a fixed area over a pro
tracted period of time, I believe that my figure is a reaxonable
approximation of at least the minimum bobcat density on the Three Bar.
Bailey (1972) found in Idaho a resident bobcat density of 0.052per km . Grinnell, Dixon and Linsdale (1937) crudely estimated a den-
psity in California of O.38 bobcats per km and the U.S. Forest Service
(1942) reported bobcat densities of 0.10 per km^ in Michigan, 0.09 per 2 2km in Wisconsin and 0.07 per km in Minnesota. The minimum density
of bobcats that I found on the Three Bar is near the maximum found in
the literature.
The only indices of bobcat home range size that I gathered were
the recapture of one female (#253) 2.3 km from her initial point of
capture ten days earlier and the path of the unmarked bobcat that Karen
20
21
Le Count and I chased with hounds in Rock Creek. In addition, Karen
reported that on February 27 she trailed a bobcat with hounds up
Sycamore Creek (approximately 5 km north of the Three Bar) for a linear
distance of almost 8 km. Lowe (1958) and Toll, Baskett and Conoway
(I960) noted that the areas in which swamp rabbits (Sylvilagus
aquations) and marsh rabbits (S. palustris) ran when chased by dogs
corresponded to the home ranges of those animals as determined by trap
ping. The advantage to a harried animal in staying within familiar
territory is obvious. Assuming that bobcats exhibit the same behavior,
the minimum area, and thus minimum home range, which the unmarketed bob-2cat on April 8 circumvented was approximately 1.3 km . We trailed the
bobcat on April 4 in and around the same area and if these two obser
vations were of the same animal, as seems likely, then its minimum home
range (as circumscribed by the two chases) is slightly over 2 -km2.
A minimum home range of 1.3 to 2+ km2 is within Seton's (1929)
estimate of a maximum bobcat home range (in an area with ample food)
of 4 km . Other home range estimates have been made by Kight (1962)2
as 0.6 to 2.6 km in South Carolina, by Marshall and Jenkins (1966) as 2
2.5 to 4.6 km also in South Carolina, and by Pollack (1949, 1950) as 2
3.9 to 14.2 km in the northeast. All are fairly close to my minimumparea estimate of 1.3 to 2+ km . However, the relatively high density
of bobcats on the Three Bar might account in part for the disparity be- 2tween my +2 km home range estimate and Rollings' (1945) Minnesota
2estimate of 25 to 38 km , Erickson's (1955) Michigan figure of 39 to 5? km2 and Marston's (1942) Maine range of 4? to 104 km2.
22
The distances traveled by the female previously mentioned
and the bobcat that Karen Le Count trailed up Sycamore Creek
(2.3 km and 8 km respectively) are within the range of bobcat movements
given in the literature. Marshall and Jenkins (1966) reported daily
movements of 0.5 to 5*7 kmt Rollings (1945) estimated 1.2 to 6.0 km per
night, Robinson and Grand (1958) recovered 50 percent of their marked
bobcats within 1.6 km of the point of capture (the maximum recovery
distance during the first month was 10.2 km), Pollack (194-9, 1950)
found nocturnal movements of 3*2 to 8.0 km per night, and Erickson
(1955) estimated that bobcats' mean daily travel radius as 2.3 km. My
data from the Three Bar fall within the extremes.
Bailey (1972) found that bobcats in Idaho maintained relatively
exclusive territories, particularly with respect to conspecifics of the
same sex. Seidensticker et al. (1973) indicated that mountain lions
exhibited the same type of mutual avoidance as described by Hornocker
(1969) that Bailey's bobcats showed, but the lions appeared to be more
tolerant of one another and maintained less rigid territories than the
bobcats. The Three Bar bobcats seem to have flexible territories more
like those of Seidensticker's lions than Bailey's bobcats. Evidence
for this hypothesis is the capture of two old males (#257 and #258) on the same night within 100 m of each other. Furthermore, I caught two
females (#253 and #259) within 200 ra of each other on consecutive nights.
Two possible explanations for the synchronous presence of the
two males at Rock Creek would be the pressure to utilize a limited
23environmental resource (i.e., open water), or perhaps the presence of a
female in estrous that lured them together. Early February, when the
event occurred, should have been near the peak of the mating season
(Duke 1954; Young 1958), thus the latter explanation may be more plaus
ible.
The proximity of the two females (after catching one of them,
#253» on Rock Creek four days before catching the two males there) may
have been coincidental or might be due to the fact that #253 was a
younger animal in a transient status (Seidensticker et al. 1973)• In
effect, she may have been roving through the area without a defensible
territory of her own, and since she was not a resident was tolerated
by #259.
The sex ratio I found of 1:1 is from too small a sample to be
meaningful. Sex ratios determined by others range from 0.4 males per
female (Foote 1945) to 3.0 males per female (Bailey 1972). Most indi
cate a slight preponderance of males, but this could be due to the
greater mobility of the male increasing his chances of being captured
and thus sampled.
The mean weights of the Three Bar bobcats of 7.7 kg for males
and 5.0 kg for females are not significantly different (t = 2.77, df 4,
P >.05). However, the combined mean (6.3 kg) varies greatly from
Young's (1958) mean weight of 137 New Mexican bobcats of 9.6 kg., Rol
lings' (1945) mean weight of 9.4 kg determined from 27 Minnesota bob
cats, Progulske's (1952) mean for 117 Appalachian bobcats of 8.4 kg
and Pollack's (1949) mean of 8.3 kg from 113 New England bobcats. My
24
6.3 kg combined mean is fairly close to Young's (1958) mean weight of
100 Montana bobcats of 7.7 kg, Foote's (1945) weight from 376 Vermont
cats of 7.2 kg and Young's (1958) 6.5 kg derived from 79 California
bobcats. The range of values represented shows no trend toward larger
size in more boreal climates — a refutation of Bergmann's rule. How
ever, in general that rule holds closely only for small homeotherms for
which thermal conductance is a major factor in thermoregulation. Lar
ger homeotherms frequently use behavioral and physiological mechanisms
to circumvent the rule (Gordon 1972; Schmidt-Nielsen 1975)» which is
apparently the case with bobcats.
Diet and Prey Availability
I found rodent remains most frequently in the Three Bar bob
cats' scats on both an annual basis (frequency of occurrence .665) and
during each of the bimonthly samples, V/oodrats predominated (47.8 per
cent of the bobcat's rodent diet) and half as many heteromyids were
present (23*9 percent of the rodents consumed). These were the only
genera that had remains in bobcat scats throughout the year. In my
sample the presence of heteromyids, pocket gophers, white-footed mice
(Peromyscus spp.) and northern grasshopper mice (Onychomys leucogaster)
(if eaten) may all be biased low. Murie (1946) pointed out that
smaller rodents tend to be underestimated in scat analysis. I found
gophers and white-footed mice infrequently in bobcat scats during the
winter and early spring, but neither seasonal sample is large enough to
use as the basis for a significant conclusion. The occurrence of
25rodents in bobcat scats does not vary significantly among the six bi
monthly samples (X^ = 1.&5, df 5» P >.05).
Bobcats appear to have found and eaten rock squirrels (Spermo-
philus variegatus) throughout the year, but only rarely consumed
Harris' antelope squirrel (Ammospermophilus harrisi). I qualitatively
observed that both were generally abundant on the study area throughout
the year. Perhaps a difference in their habits or in bobcat preference
for them accounts for the apparent disparity in selection of them as
prey items.
Along with rodents, lagomorphs form the major mammalian prey
of the bobcat on the Three Bar. Lagomorph remains appear in 37.5 per
cent of the scats I analyzed and do not vary significantly (x^ = 0.90,
df 5» P >.05) among the six bimonthly samples.
Deer remains appear in 2.8 percent of the scats of Three Bar
bobcats, but of the five scats that I collected which contained deer
remains, four came from Rocky Point Ridge in mid-July. I speculate
that these may all represent one deer carcass being eaten as carrion.
The other scat containing deer remains was weatherbeaten when I found
it on Peters Mountain in late November. That scat contained a small
hoof which I believe was from a fawn, probably killed in early October.
Because white-tailed deer (Odocoileus virginianus) occur at the higher
elevations of the study area, I cannot verify that the fawn was a mule
deer. A single scat contained javelina hair, although I could not
determine the status (carrion, piglet, adult) of the javelina involved.
Albert Le Count (personal communication 1976) says that mule
deer are born on the Three Bar during the first three weeks of August
26
and herd composition counts suggest that fawns are not preyed upon sig
nificantly after they are approximately three weeks old. Sowls (1966) reported that June, July and August are the peak months of javelina
parturition. My data indicate that bobcats do not prey upon the young
of these species during their first critical weeks — at least not
during a year of abundant rodent and lagomorph populations.
I found only one scat containing skunk (Mephitis spp.) remains.
The canid remains in one scat were hair and a nail attached to a meta
tarsal, which I could only identify to genus. The bones appeared to
be of approximately coyote size.
Egg shell fragments appeared in bobcat scats from April through
August. I could not determine what types of egg shells they were, but
Gambel's quail (Lophortyx gambelli) are prevalent on the area, are
ground nesters and thus are vulnerable to predation by bobcats. Bent
(1932) quoted Willard as saying that quail eggs may be found from early
May into August, and Gorsuch (193*0 indicated that quail eggs may be
laid in April. Quail were exceptionally numerous during the fall of
1975 and appeared to have hatched two or possibly three clutches of
eggs that year, making the presence of eggs in August a likelihood.
The greater than average precipitation during the winter of 1976 might
have induced early nesting in the quail in 1976, and these early nests
may account for some of the eggs bobcats ate in April of that year.
Bird remains which I found in scat samples could have been
nesting quail, but I could not identify them positively. The single
snake was also unidentifiable
My dietary data fits the general pattern established in other
bobcat studies. Major studies represented in Tables 6, 7 and 8 indi
cate diets in the western, southern and northeastern states respec
tively. The trend is toward greater predation on rodents and some
lagomorphs in the west, increased consumption of lagomorphs in the
south and a greater dependence on lagomorphs and deer in the northeast.
This pattern optimizes the bobcat’s energy balance by yielding more
nutrients per kill (and associated hunting effort) in the more boreal
regions where the critical season (winter) is more severe and a more
efficient hunt to kill energy ratio is required to maintain homeo
stasis.
I intended for the monthly rodent samples to show the general
trend of the rodent population and thus the availability of rodents to
bobcats as prey. These samples show an increase from July to November
(frequency .053 to .237) followed by a decline into May (.083). Sig-pnificant differences (X = 62.06, df 10, P <.05) exist between the
numbers of rodents I trapped each month. All rodents trapped are
listed in Dickerman (1955) and Cockrum (i960) as present on the Three Bar, although they name others that I did not find.
Various authors (Chew and Butterworth 1964; Beatley 1969;
Bradley and Mauer 1971; Van de Graaff and Baida 1973; Reichman and
Van de Graaff 1975) have alluded to a relationship between the inges
tion of green vegetation and reproduction in desert rodents. The re
lation of precipitation to desert plant production is obvious, so I
attempted to correlate the frequencies of rodents I trapped with the
27
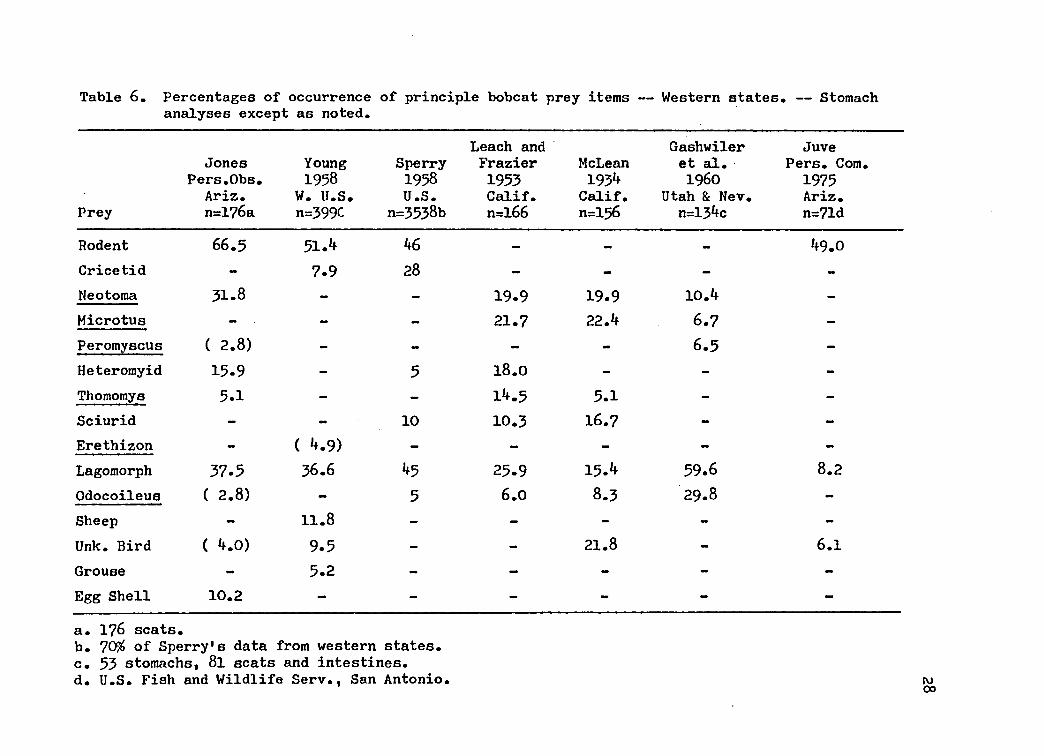
Table 6. Percentages of occurrence of principle bobcat prey items — Western states. — Stomachanalyses except as noted.
Prey
JonesPers.Obs.
Ariz.n=176a
Young1958
W. U.S.n=399C
Sperry1958U.S.
n=3538b
Leach and Frazier 1953 Calif. n=l66
McLean1934
Calif.n=156
Gashwiler et al. I960
Utah & Nev. n=134c
JuvePers. Com.
1975Ariz.n=71d
Rodent 66.5 51.4 46 - - - 49.0Cricetid - 7.9 28 - - - -Neotoraa 31.8 - - 19.9 19.9 10.4 -
Microtus — - - 21.7 22.4 6.7 -Peromyscus ( 2.8) - - - - 6.5 -Heteromyid 15-9 - 5 18.0 - - -Thomomys 5.1 - - 14.5 5.1 - -Sciurid - - 10 10.3 16.7 - -Erethizon - ( 4.9) - - - - -Lagomorph 37.5 36.6 45 25-9 15.4 59.6 8.2Odocoileus ( 2.8) - 5 6.0 8.3 29.8 -Sheep - 11.8 - - - - -Unk. Bird ( 4.0) 9.5 - - 21.8 - 6.1Grouse - 5.2 - - - - -Egg Shell 10.2 - - - - - -
a. 1?6 scats.b. 70$ of Sperry's data from western states.c. 53 stomachs, 8l scats and intestines.d. U.S. Fish and Wildlife Serv., San Antonio.
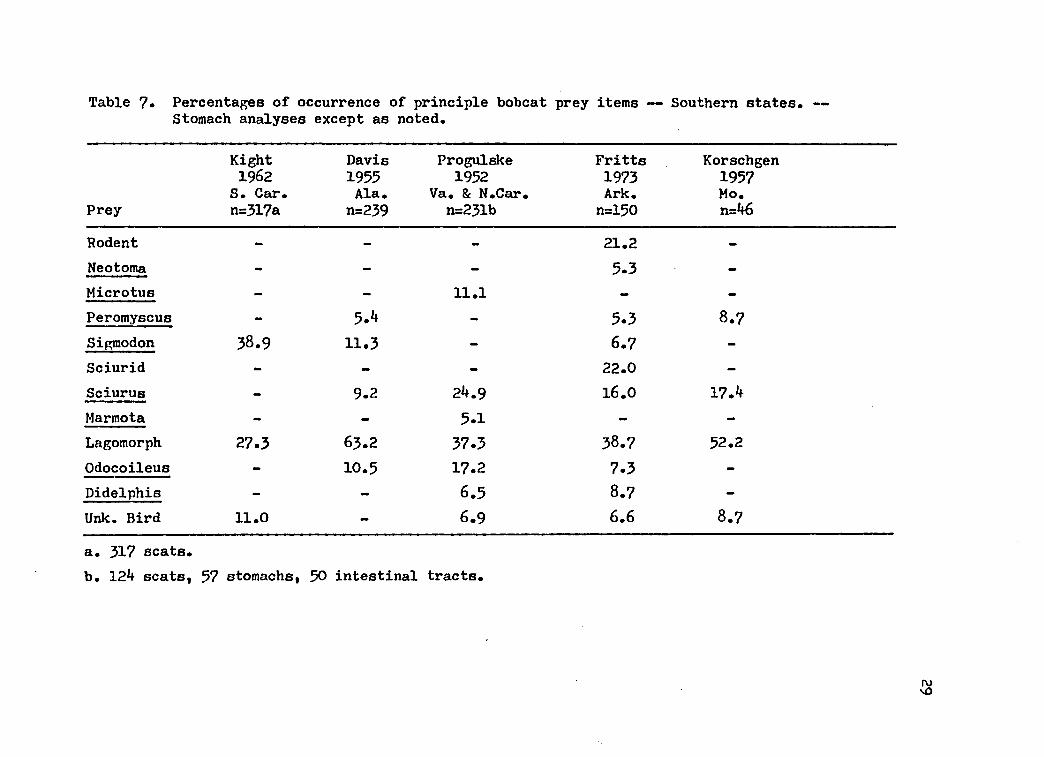
Table ?• Percentages of occurrence of principle bobcat prey items — Southern states. —Stomach analyses except as noted.
Prey
Kight 1962
S • Car. n=317a
Davis1955Ala.
n=239
Progulske1952
Va. & N.Car. n=231b
Fritts1973Ark.n=150
Korschgen1957Mo.n=46
Rodent - - 21.2 -Neotoma - - - 5.3 -Microtus - - 11.1 - -Peromyscus - 5.4 - 5.3 8.7Sigmodon 38.9 11.3 - 6.7 -Sciurid - - - 22.0 -Sciurus - 9.2 24.9 16.0 17.4Marmota - - 5.1 - -Lagomorph 27.3 63.2 57.3 38.7 52.2Odocoileus - 10.5 17.2 7.3 -Didelphis - - 6.5 8.7 -Unk. Bird 11.0 - 6.9 6.6 8.7
a. 317 scats.b. 124 scats, 37 stomachs, 50 intestinal tracts.
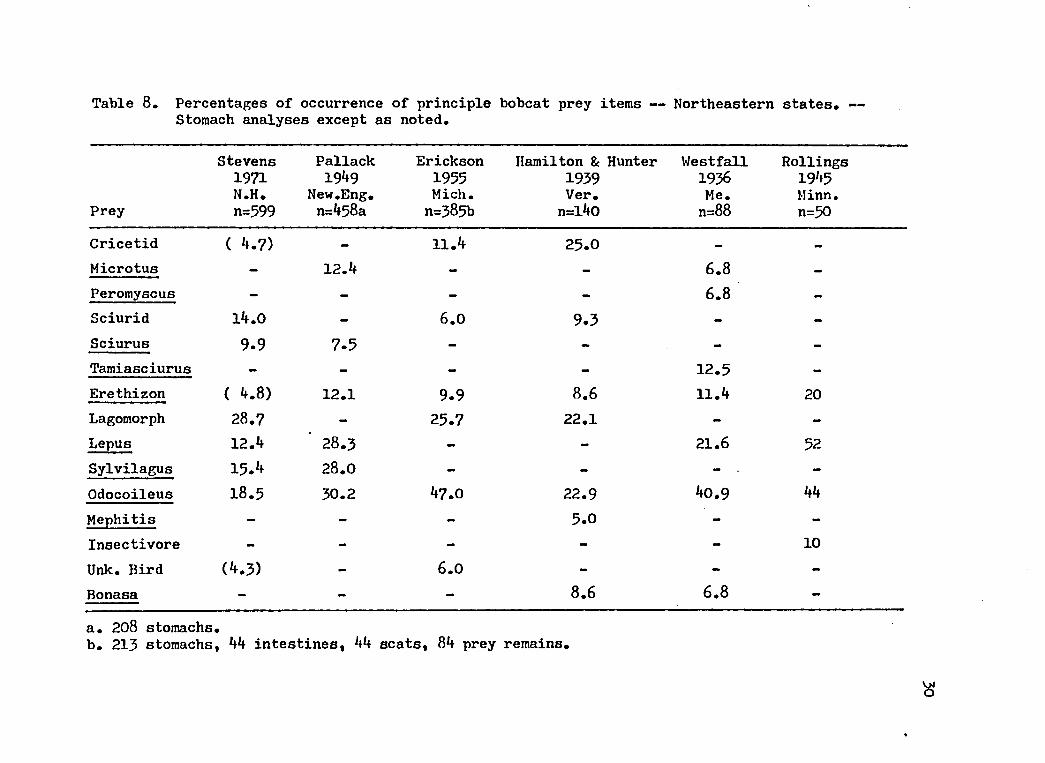
Table 8. Percentages of occurrence of principle bobcat prey items — Northeastern states. —Stomach analyses except as noted.
Prey
Stevens1971N.H.n=599
Pallack1949
New .Eng. n=458a
Erickson1955Mich.n=385b
Hamilton & Hunter 1939 Ver. n=l40
Westfall1936Me.n=88
Rollings1945Minn.n=50
Cricetid ( 4.7) - 11.4 25.0 - -
Microtus - 12.4 - - 6.8 -Peromyscus - - - - 6.8 -Sciurid 14.0 - 6.0 9 .3 - -Sciurus 9.9 7.5 - - - -Tamiasciurus - - - - 12.5 -Erethizon ( 4.8) 12.1 9 .9 8.6 11.4 20Lagomorph 28.7 - 25.7 22.1 - -Lepus 12.4 28.3 - - 21.6 52Sylvilagus 15.4 28.0 - - — -Odocoileus 18.5 30.2 47.0 22.9 40.9 44Mephitis - - - 5.0 - -Insectivore - - - - - 10Unk. Bird (4.3) - 6.0 - - -Bonasa - - - 8.6 6.8 -
a. 208 stomachs.b. 213 stomachs, 44 intestines, 44 scats, 84 prey remains.
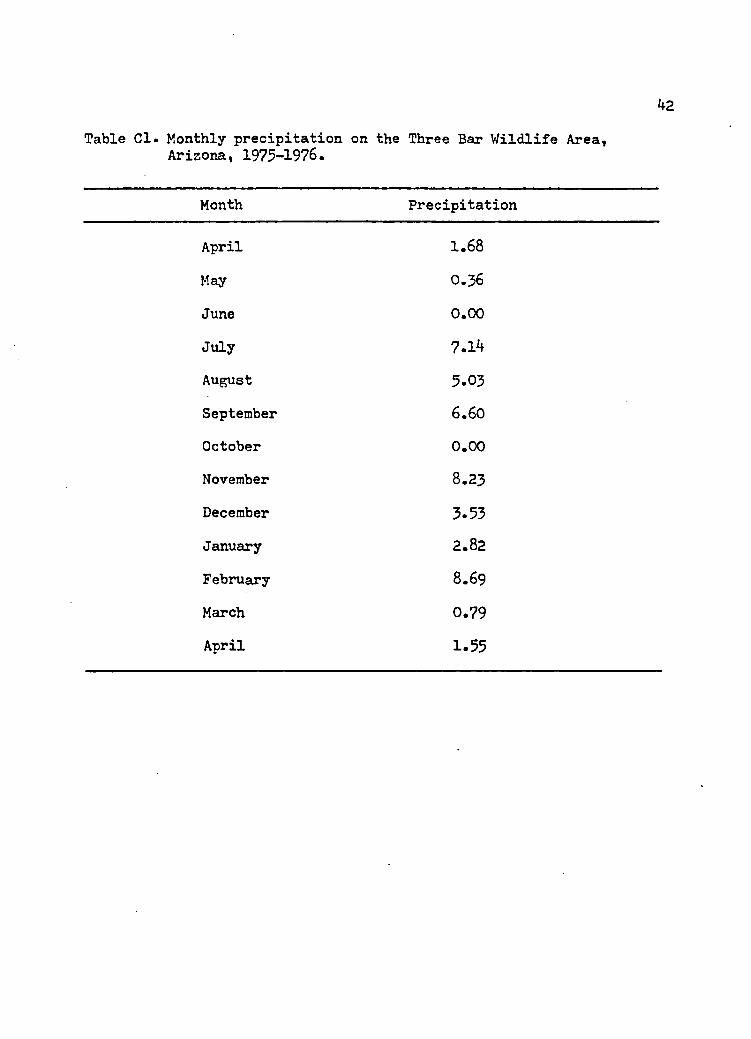
monthly precipitation (tabulated in Appendix C, from Le Count, personal
communication 1976) one and two months prior. The correlation with the
prior month's precipitation is positive but not significant (r = .241,
df 10, P >.05), as is the correlation with two month's prior precipi
tation (r = .417, df 10, P >.05). When I pool the rodent availability
frequencies into the same bimonthly groupings in which I collected bob
cat scats and attempt to correlate them with bimonthly pooled precipi
tation figures for the month prior to and first month of the given
rodent sample, the correlation is high and almost significant (r = .732,
df 5t P >.05). I suspect my sample size is not quite large enough to
show significant rodent response to precipitation and the resulting
availability of green vegetation.
The lagomorph census indicates a Sylvilagus : Lepus ratio of
approximately 9:1. The absence of grazing on the area during the past
28 years has probably created a denser ground cover, favoring the cottontail. The census results show a zenith in August (1.04) and nadir
in November (0.32), with significant differences between the monthly
counts (X = 65.92, df 11, P < .05). Hunger ford, Lowe and Madsen (1974)
recorded reproductive activity in californicus and £5̂ auduboni in
southern Arizona as peaking during January, February, March and July-
August, and at the nadir during Ocotboer, November, December. These
periods of reproductive activity generally agree with the population
trend I found. They attributed increases in rabbit reproduction to in
creases in precipitation, although Sowls (1957) found no correlation
between precipitation and jS. auduboni reproduction in southern Arizona.
31
32I attempted to correlate lagomorph frequencies from my census with one
and two months' prior precipitation but both coefficients Eire negative
and non-significant (r = -.222, r = -.388, df 11, P >.05). No apparent
relationship between lagomorph population levels and precipitation
exists on the Three Bar. However, my census data might be biased low
from October through February during the quail hunting season, because
quail hunters tend to hunt along roads. Those rabbits that they kill
while hunting quail thus represent a disproportionately greater per
centage of my sample lagomorphs than are leaving the population due to
naturEil attrition.
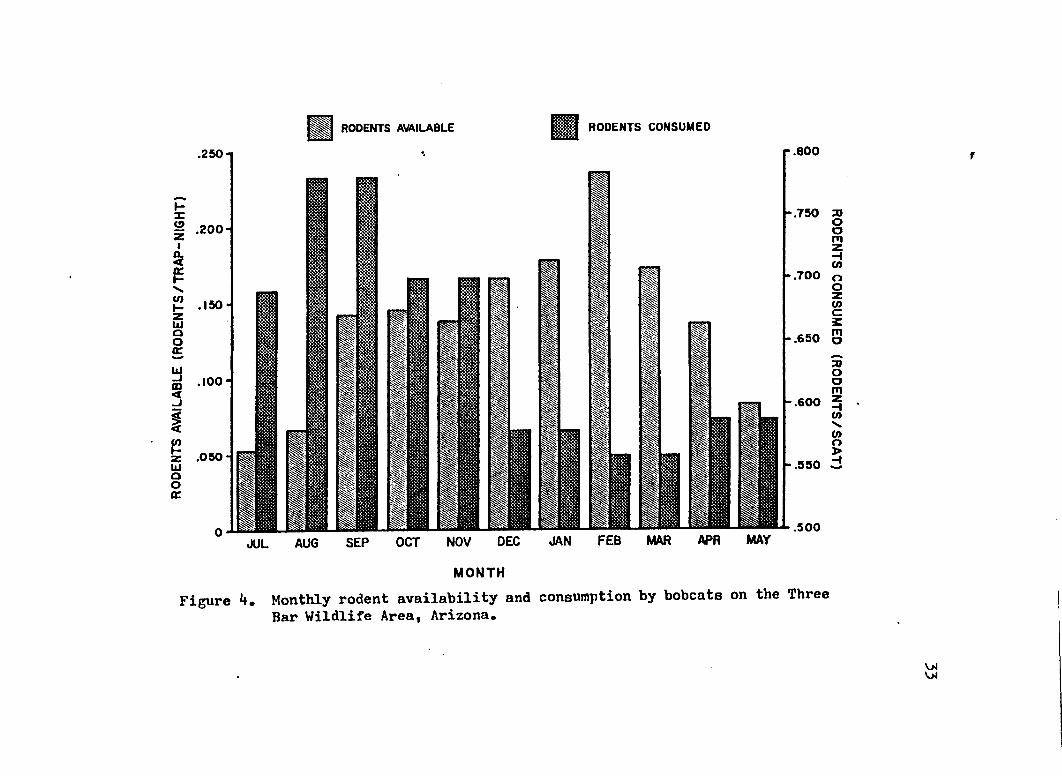
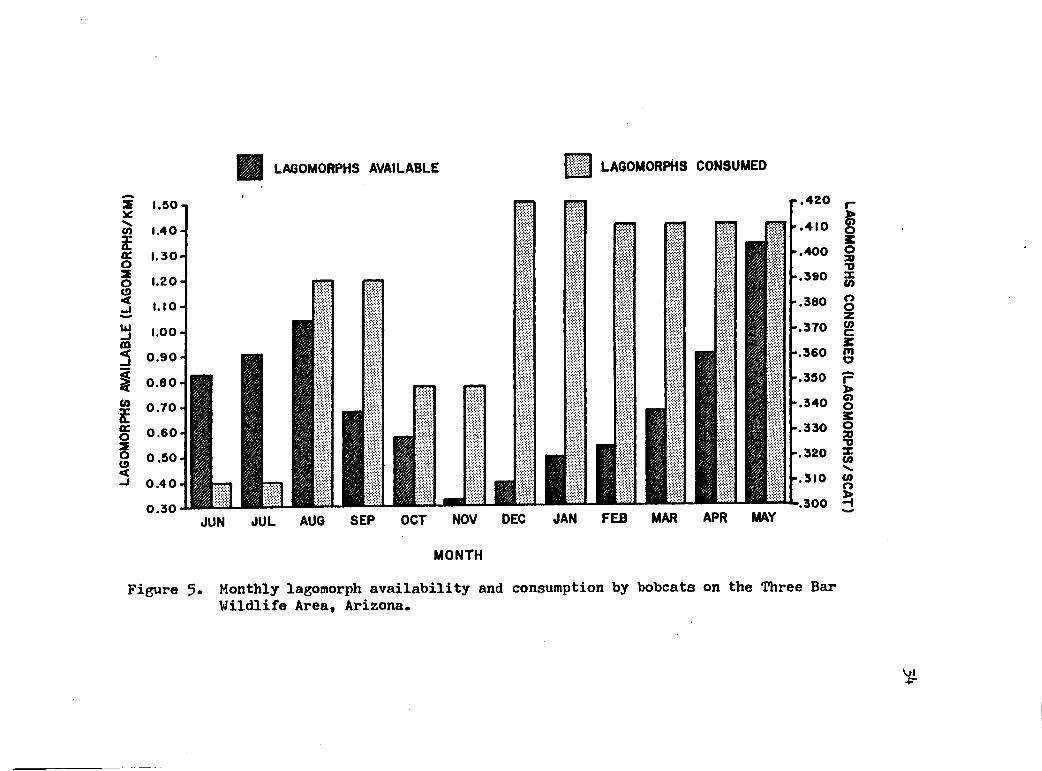
Latham (1951) indicated that the availability of prey items is
the primary determinant of a predator's diet. I attempted to correlate
the frequencies of rodent and lagomorph remains in bobcat scats with
their respective frequencies of availability to test this hypothesis.
Figures 4 and 5 graphically represent these relationships. As would
be expected, since both availabilities vary significantly but neither
of the scat remains do, neither correlation coefficient is significant
(rodents r = -.616, df 5, P >.05; lagomorphs r = .074, df 5, P >.05). The selection of lagomorphs as prey appears to be density independent
(at the densities existing during the study). The relatively high
negative correlation of rodent availability with consumption indicates
that bobcats are capable of procuring rodents for food in great numbers
even when rodent densities are comparatively low (but still equal to
or above the minimum densities encountered during the study).The correlation between rodent and lagomorph consumptions by
bobcats is negative (r = -.565, df 5, P >.05) and although not
RODENTS AVAILABLE RODENTS CONSUMED.800
.750
.700
-.650
-.600
-.550
.500JUL AUG SEP OCT NOV DEC JAN FEB MAR APR MAY
FigureM O N T H
4. Monthly rodent availability and consumption by bobcats on the Three Bar Wildlife Area, Arizona,
f
RO
DE
NT
S C
ON
SU
ME
D
(RO
DE
NT
S/S
CA
T)
LAGO
MORP
HS AVAILABLE (LA
GOMO
RPHS
/KM)
LAGOMORPHS AVAILABLE H I LAGOMORPHS CONSUMED
I.SOn 1.40
1.30
1.2 0 -
1.1 0 -
1.00
0 . 9 0 -
0 . 8 0
0 . 7 0 H
0.60
0.50
0 . 4 0 -
0 .30-1
420
k.4IO .400
-.390
.380
-.370
-.360
-.350
.340
-.330
-.320
- . 3 1 0
300
MONTH
Figure 5* Monthly lagomorph availability and consumption by bobcats on the Three Bar Wildlife Area, Arizona.
%
LAGOMORPHS CONSUMED (LAGOMORPHS/SCAT)
35significant, is high enough to suggest that to some degree increased
predation pressure on one group is accompanied by decreased pressure
on the other. The two groups may be acting as mutual buffers.
In general, bobcats on the Three Bar do not seem to be strictly
opportunistic predators. If they were, they would prey extensively on
the (relatively) most abundant prey available. Bobcats appear instead
to be efficient enough at rodent- and rabbit-catching to make it ener
getically feasible for them to hunt for other than the most abundant
prey. Griffiths (1975) has suggested that such energy-maximizing (as
opposed to number-maximizing) in prey selection can be beneficial to a
selective predator when prey densities exceed a specific minimum
threshhold, which they apparently did on the Three Bar during the
course of my study.
Population Trend Techniques
The data from the census route were questionable the first time
and negative the second time. Although Young (1958) documented the
bobcat's curiosity and fondness for catnip, they do not utilize roads
extensively in their nocturnal travels as coyotes do, and do not seem
to be curious enough to regularly come to census stations baited with
the attractants I used.
I assumed that with a (short term) stable bobcat population the
results of the scat transects would probably be fairly homogeneous.
The samples are significantly different (x^ = 18.0, df 9, P <.05)
apparently due to weather, changing bobcat activity patterns and pos
sibly seasonal differences in bobcat behavior. The greater number of
36scats that I found in February and March may have been the result of
increased marking behavior associated with mating or it may have been
random. Replications of these transect collections in future years
while monitoring the Three Bar bobcats' population trend could deter
mine the value of this technique.

APPENDIX A
STANDARD MEASUREMENTS OF BOBCATS
37
38
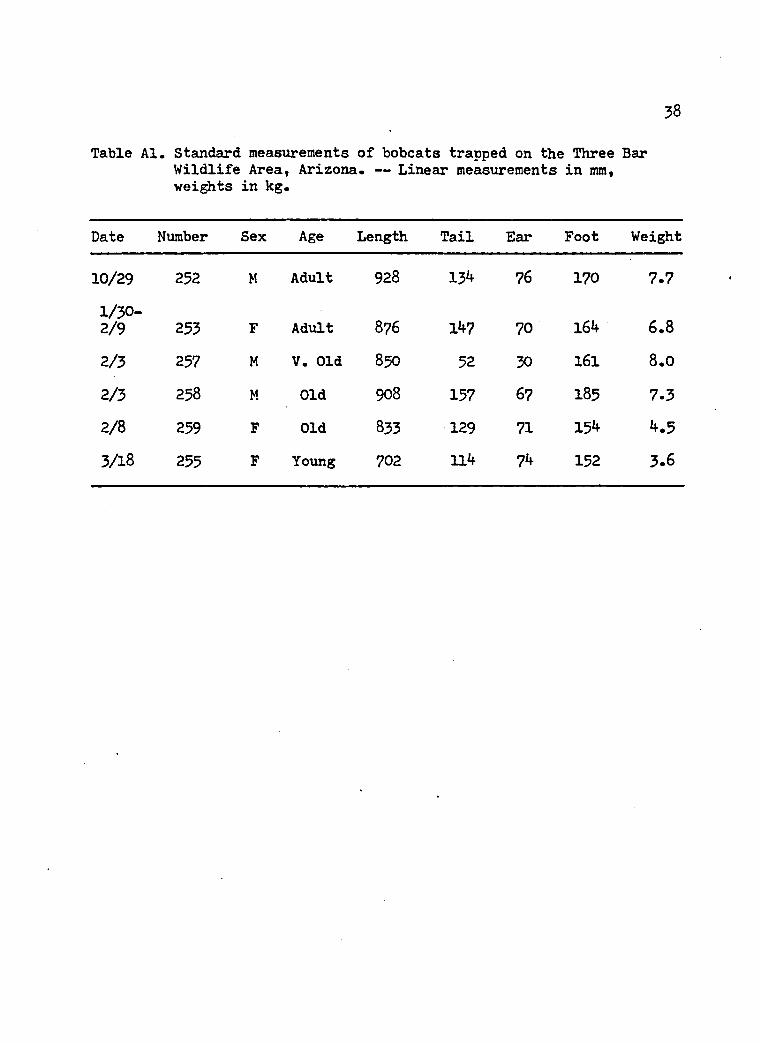
Table Al. Standard measurements of bobcats trapped on the Three Bar Wildlife Area, Arizona. — Linear measurements in mm, weights in kg.
Date Number Sex Age Length Tail Ear Foot Weight
10/29 252 M Adult 928 134 76 170 7.7
1/30-2/9 253 F Adult 8?6 147 70 164 6.8
2/3 257 M V. Old 850 52 30 161 8.0
2/3 258 M Old 908 157 67 185 7.32/8 259 F Old 833 129 71 154 4.5
3 A 8 255 F Young 702 114 74 152 3.6
APPENDIX B
STANDARD MEASUREMENTS OF RODENTS
39
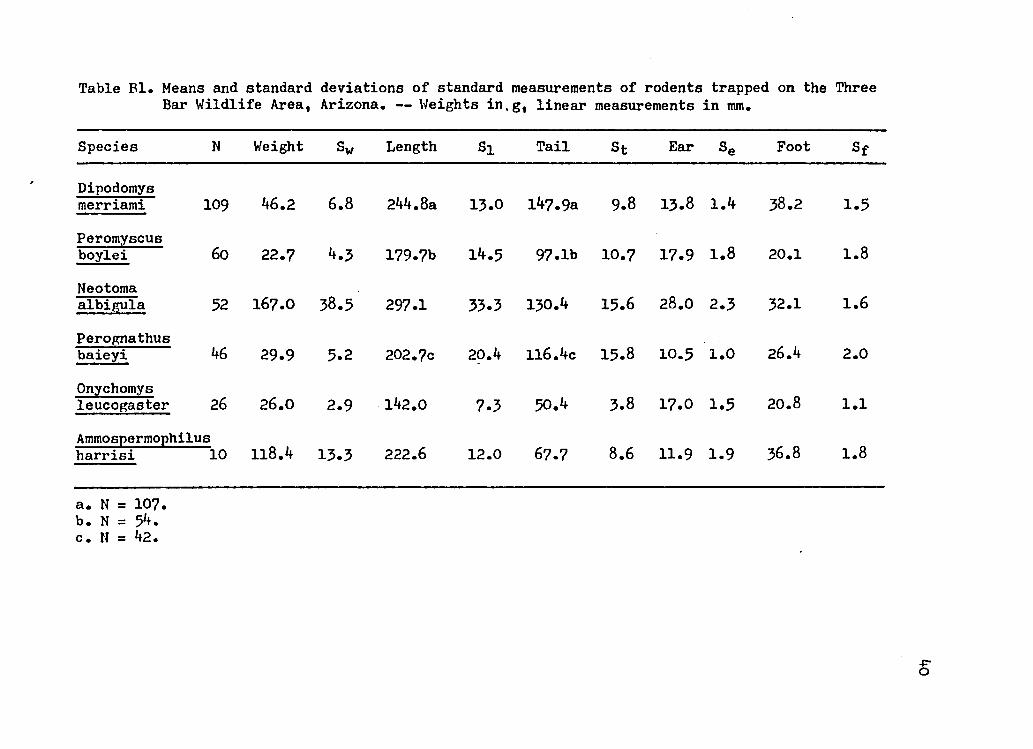
Table Bl. Means and standard deviations of standard measurements of rodents trapped on the Three Bar Wildlife Area, Arizona. — Weights in.g, linear measurements in mm.
Species N Weight Sw Length Si Tail St Ear se Foot Sf
Dipodomysmerriami 109 46.2 6.8 244.8a 13.0 147.9a 9.8 13.8 1.4 38.2 1.5Peromyscusboylei 60 22.7 4.3 179.7b 14.5 97.1b 10.7 17.9 1.8 20.1 1.8
Neotomaalbigula 52 167.0 38.5 297.1 33.3 130.4 15.6 28.0 2.3 32.1 1.6
Perognathusbaieyi 46 29.9 5.2 202.7c 20.4 116.4c 15.8 10.5 1.0 26.4 2.0
Onychomysleucogaster 26 26.0 2.9 142.0 7.3 50.4 3.8 17.0 1.5 20.8 1.1
Ammospermophilus harrisi 10 118.4 13.3 222.6 12.0 67.7 8.6 11.9 1.9 36.8 1.8
a. N = 107.b. N = 54.c. N = 42.
s

APPENDIX C
MONTHLY PRECIPITATION
41
42
Table Cl. Monthly precipitation on the Three Bar Wildlife Area,Arizona, 1975-1976.
Month Precipitation
April 1.68
May 0.36
June 0.00
July 7.14
August 5.03September 6.60
October 0.00
November 8.23
December 3.53January 2.82February 8.69
March 0.79April 1.55
LIST OF REFERENCES
BAILEY, T. N. 1972 Ecology of bobcats with special reference to social organization. Ph.D. Thesis, University of Idaho,Moscow. 82 pp.
BEATLEY, J. 1969 Dependence of desert rodents on winter annuals and precipitation. Ecology 50(4):721-724.
BENT, A. C. 1932 Life histories of North American gallinaceous birds. Smithsonian Inst. U.S. Nat. Mus., Bull. 162. 490 pp.
BRADLEY, W. G. and R. A. MAUER. 1971 Reproduction and food habits of Merriam's kangaroo rat, Dipodomys merriami. J. Mammal. 52(2):497-507.
CHEW, R. M. and B. B. BUTTERWORTH. 1964 Ecology of rodents in Indian Cove (Mojave Desert), Joshua Tree National Monument, California. J. Mammal. 45(1):203-225.
COCKRUM, E. L. i960 The recent mammals of Arizona: Their taxonomyand distribution. Univ. of Arizona Press, Tucson. 276 pp.
CONLEY, R. H. 1968 An investigation of some techniques for determining age of bobcats (Lynx rufus) in the southeast. M.S. Thesis, Univ. of Georgia. 44 pp.
CONLEY, R. H. and J. H. JENKINS. 1969 An evaluation of several techniques for determining the age of bobcats (Lynx rufus) in the southeast. Proc. S.E. Assn. Game and Fish Comm. 23:104-110.
CROWE, D. M. 1972 The presence of annuli in bobcat tooth cementum layers. J. Wildl. Manage. 36(4):1330-1332.
. 1975a A model for exploited bobcat populations inWyoming. J. Wildl. Manage. 39(2):4o8-4l5.
________________• 1975b Aspects of ageing, growth, and reproductionof bobcats from Wyoming. J. Mammal. 56(1):177-198.
DAVIS, J. R. 1955 Food habits of the bobcat in Alabama. M.S. Thesis, Alabama Polytechnic Inst. 79 pp.
DEARBORN, N. 1932 Foods of some predatory furbearing animals inMichigan. Univ. of Michigan Press. School of Forestry and Conservation, Bull. 1.
43
44
DICKERMAN, R. W. 1955 An ecological survey of the Three-Bar GameManagement Unit located near Roosevelt, Arizona. M.S. Thesis, University of Arizona, Tucson. 110 pp.
DILL, H. H. 19^7 Bobcat preys on deer. J. Mammal. 28(1):63.DIXON, J. S. 1925 Food predilections of predatory and fur-bearing
mammals. J. Mammal. 6(1):3^56.
________________. 1934 A study of the life history and food habits ofmule deer in California. Calif. Fish and Game 20(3):229-272.
DUKE, K. L. 1954 Reproduction in the bobcat. Lynx rufus. Anat.Rec. 120(3):816-817.
ERICKSON, A. W. 1955 An ecological study of the bobcat in Michigan. M.S. Thesis. Michigan State Univ. 133 pp.
FOOKS, L. G. 1961 Food habits of indigenous Canidae and Felidae in Arkansas based on complete and sample analyses of stomach contents. M.S. Thesis. Univ. of Arkansas. 52 pp.
FOOTE, L. E. 1945 Sex ratio and weights of Vermont bobcats in autumn and winter. J. Wildl. Manage. 9(4):326-327.
FRITTS, S. H. 1973 Age, food habits, and reproduction in the bobcat (Lynx rufus) in Arkansas. M.S. Thesis, Univ. of Arkansas.80 pp.
GASHWILER, J. S., W. L. ROBINETTE and 0. W. MORRIS. I960 Foods of bobcats in Utah and eastern Nevada. J. Wildl. Manage. 24(2): 226-229.
. 1961 Breeding habits of bobcats in Utah. J. Mammal.42(1): 76-84.
GORDON, M.S. 1972 Animal Physiology: Principles and Adaptations.The Macmillan Co., New York. 592 pp.
GORSUCH, D. M. 1934 Life history of the Gambel's quail in Arizona. Univ. of Arizona Bio. Sci. Bull. 2. 89pp.
GRIFFITHS, D. 1975 Prey availability and the food of predators. Ecology 56(5):1209-1214.
GRINNELL, J., J. S. DIXON and J. M. LINSDALE. 1937 Fur-bearingmammals of California. Univ. of California Press, Berkeley, Vol. 2, pp. 617-618.
45HAMILTON, W. J., 'JR. 1940 Weights of eastern bobcats. J. Mammal.
21(2):218.HAMILTON, W. J., JR. and R. P. HUNTER. 1939 Fall and winter food
habits of Vermont bobcats. J. Wildl. Manage. 3(2):99-103#
HARWELL, G. A. 1932 Winter wildlife observations. Yosemite Nature Notes 11(3):1-2.
HORNOCKER, M. G. 1969 Winter territoriality in mountain lions.J. Wildl. Manage. 33(3):457-464.
HUNGERFORD, C. R., C. H. LOWE and R. L. MADSEN. 1974 Populationstudies of the desert cottontail (Sylvilagus auduboni), blackballed jackrabbit (Lepus californicus) and Allen's jackrabbit (Lepus alien!) in the Sonoran desert. U.S./I.3.P. Desert Biome Res. Memo 74-23# pp. 73-94.
HUNT, H. H. 1920 Food of the bobcat. Calif. Fish and Game 6(1):37.
JANTZEN, R. A. 1964 Population declines of mule deer in northern Arizona. Proc. Ann. Conf. West. Game Comm. 44:158-166.
JUVE, L.E. 1975 Personal Communication, U.S. Fish and Wildlife Service, San Antonio, Texas.
EIGHT, J. 1962 An ecological study of the bobcat, Lynx rufus(Schreber), in West-Central South Carolina. M.S. Thesis.Univ. of Georgia. 52 pp.
KORSCHGEN, L. J. 1957 Food habits of coyotes, foxes, house cats and bobcats in Missouri. Missouri Consv. Comm., Fish and Game Div., P-R Ser. No. 15# 64 pp.
LATHAM, R. M. 1950 Food of predatory animals in the northeastern United States. P-R Proj. 36-R, Rep. 1. Pennsylvania Game Comm., Harrisburg.
________________. 1951 The ecology and economics of predator management. Pennsylvania Game Comm. Bull., pp. 1-96.
LEACH, H. B. and W. H. FRAZIER. 1953 A study on the possible extent of predation on heavy concentrations of valley quail with special reference to the bobcat. California Fish and Game 39(4):527-538.
LE COUNT, ALBERT. 1976 Personal Communication, Three Bar Wildlife Area, Arizona,
46
LINHART, S.B. and F. F. KNOVLTON. 1976 Determining the relative abundance of coyotes by scent station lines. V/ildl. Soc. Bull. 3(3): U9-124.
LOWE, C. E. 1958 Ecology of the swamp rabbit in Georgia. J. Mammal, 39(1):116-127.
LOWE, C. H. 1964 Arizona’s natural environment. Univ. of Arizona Press, Tucson. 136 pp.
MARSHALL, A. D. and J. H. JENKINS. 1966 Movements and home ranges of bobcats as determined by radio-tracking in the upper coastal plain of west-central South Carolina. Proc. Ann.Conf. Southeast Game Comm. 20:206-214.
MARSTON, M. A. 1942 Winter relations of bobcats to white-tailed deer in Maine. J. Wildl. Manage. 6(4):328-337.
MATSON, J. R. 1948 (Bob) cats kill deer. J. Mammal. 29:69-70.
McCORD, C. M. 1974 Selection of winter habitat by bobcats (Lynxrufus) on the Ouabbin Reservation, Massachusetts. J. Mammal. 55^27:428-437.
McCULLOCH, C. Y. 1954 Ecological investigation of the Three BarStudy Area. Arizona Game and Fish Dept. Compl. Rep. W-71-R-1 WP4jl.
McLEAN, D. D. 1934 Predatory animal studies. California Fish and Game 20(1):30-36.
McMICHAEL, T. J. 1970 Effect of hunting on desert deer populations. Arizona Game and Fish Dept. Compl. Rep. W-78-14 WP2J3.
MOORE, T. D., L. E. SPENCE, C. E. DUGNOLLE and W. G. HEPWORTH. 1974 Identification of the dorsal guard hairs of some mammals of Wyoming. Wyoming Game and Fish Dept., Bull. No. 14. Cheyenne, 177 pp.
MURIE, 0. J. 1946 Evaluating duplications in analysis of coyote scats. J. Wildl. Manage. 10:275-276.
________________. 1954 A field guide to animal tracks. HoughtonMifflin Co., Boston. 374 pp.
PETRABORG, W. H. and V. E. GUNVALSON. 1962 Observations on bobcat mortality and bobcat predation on deer. J. Mammal. 43(3): 430-431.
47POLLACK, E. M# 1949 The ecology of the bobcat (Lynx rufus rufus
Schreber) in the New England states# M#S. Thesis. Univ. of Massachusetts, Amherst. 120 pp.
. 1950 Breeding habits of the bobcat in the northeastern United States. J. Mammal. 31(3):327-330.
PROGULSKE, D. R. 1952 The bobcat and its relation to prey species in Virginia. M.S. Thesis. Virginia Polytech. Inst. 135 pp»
_______________ . 1955 Game animals utilized as food by the bobcatin the southern Appalachians. J. Wildl. Manage. 19(2):249-253•
REICHMAN, 0. J. and K. M. VAN DE GRAAF. 1975 Association betweeningestion of green vegetation and desert rodent reproduction.J. Mammal. 56(2):503-506.
ROBINSON, W. B. and E. F. GRAND. 1958 Comparative movements of bobcats and coyotes as disclosed by tagging. J. Wildl. Manage. 22(2) :117-122.
ROLLINGS, C. T. 1945 Habits, foods and parasites of the bobcat in Minnesota. J. Wildl. Manage. 9(2):131-l45*
SCHMIDT-NIELSEN, K. 1975 Scaling in biology: The consequences ofsize. J. Exp. Zool. 194(1):287-308.
SEIDENSTICKER, J. C., IV, M. G. HORNOCKER, W. V. WILES and J. P.MESSICK. 1973 Mountain lion social organization in the Idaho Primitive Area. Wildl. Monogr. No. 35. 60 pp.
SETON, E. T. 1929 Lives of game animals. Doubleday, Doran Co.,New York, Vol. I, 337 pp.
SIEGLER, H. R. 1971 The status of wildcats in New Hampshire. InS. E. Jorgensen and L. D. Mech, eds, pp. 46-53. Proceedings of a symposium on the native cats of North America: Theirstatus and management. U.S. Fish and Wildlife Service, Twin Cities.
SMITH, R. H. 1959 Cottontail rabbit population trend techniques. Arizona Game and Fish Dept. Compl. Rep. W-78-R-3 WP1J2.
SOWLS, L. K. 1957 Reproduction in the Audubon cottontail in Arizona. J. Mammal. 38(2):234-243.
. 1966 Reproduction in the collared peccary (Tayassu tajacu)*. In I. W. Rowlands, ed. Comparative biology of reproduction in mammals. Symposia of the Zoological Society of London No. 15t pp. 155-172. Academic Press,London.
48
SOWLS, L. K. and P. S. MINNAMON. 1963 Glass beads for marking home ranges of mammals. J. Wildl. Manage. 27(2):299-302.
STEVENS, CLARK 1971 Proceedings of a symposium on the native cats of North America: Their status and management. In Thestatus of wildcats in New Hampshire by H. R. Siegler, pp.46-53• U.S. Fish and Wildlife Service, Twin Cities.
SPERRY, CHARLES. 1958 The bobcat of North America, by S. P. Young.The Stackpole Co., Harrisburgh, Penn., and the Wildl. Manage. Inst., Wash., D. C. 193 PP«
TOLL, J. E,, T. S. HASKETT and C. H. CONOWAY. I960 Home range, reproduction, and foods of the swamp rabbit in Missouri. Amer. Midland Naturalist 63(2):398-412.
U. S. FOREST SERVICE. 1942 Annual wildlife report North Central Region calendar year 1941, Region 9, Milwaukee.
VAN DE GRAAFF, K. M. and R. P. BALDA. 1973 Importance of green vegetation for reproduction in the kangaroo rat, Dipodomys merriami merriami. J. Mammal. 54(2):509-512.
WESTFALL, C. Z. 1956 Foods eaten by bobcats in Maine. J. Wildl. Manage. 20(2):199-200.
WILLIAMSON, V. H. H. 1951 Determination of hairs by impressions.J. Mammal. 32(1):80-84.
YOUNG, S. P. 1928 Bobcat kills deer. J. Mammal. 9(1)i64-65.
________________• 1958 The bobcat of North America. The StackpoleCo., Harrisburgh, Penn., and the Wildl. Manage. Inst., Wash., D.C. 193 pp.
ZiQ1908 4