density of rainfa ll stations in kahayan watershed centre ...textroad.com/pdf/jbasr/j. basic. appl....
TRANSCRIPT

J. Basic. Appl. Sci. Res., 2(12)12952-12960, 2012
© 2012, TextRoad Publication
ISSN 2090-4304 Journal of Basic and Applied
Scientific Research www.textroad.com
*Corresponding Author: Ery Suhartanto, Department of Water Resources, Faculty of Engineering, University of Brawijaya. Email: [email protected]; [email protected]
Density of Rainfall Stations in Kahayan Watershed Centre Kalimantan Province of Indonesia
*Ery Suhartanto, Lily Montarcih Limantara
Department of Water Resources, Faculty of Engineering, University of Brawijaya,
Malang, East Java of Indonesia
ABSTRACT In depth analysis of area rainfall, there is necessary to considerate two type’s important thing about number of rainfall stations and their distribution in the watershed. Unsuitable number and disproportionately distribution of rainfall stations will cause inaccuracy ready used data and in further impact it will cause the design, research, and management of water resources become not efficient and effective. This paper intended to analyze the density of rainfall stations due to the standard of WMO (World Meteorological Organization). WMO suggested the minimum of rainfall station number area which represented network density was between 100-250 km2/station. In this study, analysis of rainfall stations density used Kriging Method and standard of WMO. Results showed that based on the yearly averaged rainfall, there were recommended 14 and 15 rainfall stations in Kahayan Watershed and it was due to the Kriging Method and the standard of WMO. This result can be used as the reference for deciding the effective number and distribution of rainfall stations in the location of study. Keywords: Kriging Method, standard of WMO, distribution pattern of rainfall station.
INTRODUCTION
The hydrological models are generally classified into conceptual and physically based or distributed parameter models and lumped parameter [1]. However, each kind of models has its advantages and the application of model selection is due to the specific problem. For example, modelling of river runoff hydrograph is as a classical problem in hydrology. The primary objective of frequency analysis is to relate the extreme events to their occurrence frequency through the usage of probability distributions [2][3]. The preciseness of frequency analysis depends on the kind of parameter estimation techniques and statistical distributions [4]. Some models have been developed to illustrate the hydrological data distribution, but the choice of suitable model is only one of the major conditions in frequency analysis. Generally, rainfall model is classified as high and low intensity of flows. Estimation of discharge for design and planning purpose with only limited available data is as continuously problem in hydrology [5]. However, the statistical result of rainfall model estimation is controlled by measured and observed data [6]. Basically, rainfall-runoff models are used in hydrology for a wide range of application such as observation of the effects of climate change, prediction of the effects of land use change, and estimation of flow for unmeasured watersheds [7]. Frequently, networks of ground-based hydro-meteorological observations are sparse in developing countries and there is no improvement for this condition [8]. In the hydrological analysis especially to predict floods, a lot of hydrological data like climate, rainfall, and water discharge are required. Analysis of rainfall is very necessary for designing hydraulic structure. Representative rainfall is analysed by selecting available scheme pattern of rainfall station. There are two problems which had to consider for determining area rainfall such as the number and distribution pattern of rainfall stations. Errors in monitoring hydrological basis data in a watershed will cause false the ready used data which consequently will give an impact on efficient and effective result of planning, research, and management of water resources. These errors are commonly caused by inadequate number of rainfall stations in the watershed (DAS) and uneven distribution pattern of rainfall stations. Based on the WMO (World Meteorological Organization), a watershed should have rainfall stations which represent the density of minimum rainfall station network that covers 100-250 km2/station [9]. Kahayan watershed has an important function in Centre Kalimantan Province. Since 2010, flood has been continuously happened and being damaged the available ecosystem. This problem is predicted caused by inaccuracy on hydrological analysis. Accuracy of hydrological data mainly the rainfall data is very influenced by the density of rainfall stations in a watershed. The objective of this study is to analyse the density of rainfall stations due to the standard of WMO and Kriging Method.
MATERIALS AND METHODS
This study conducted in Kahayan Watershed which is located in Centre Kalimantan Province. Geographically, Kahayan Watershed is located the east longitude of 113º51’ - 114 º 41’ and south longitude of
12952
Suhartanto et al., 2012
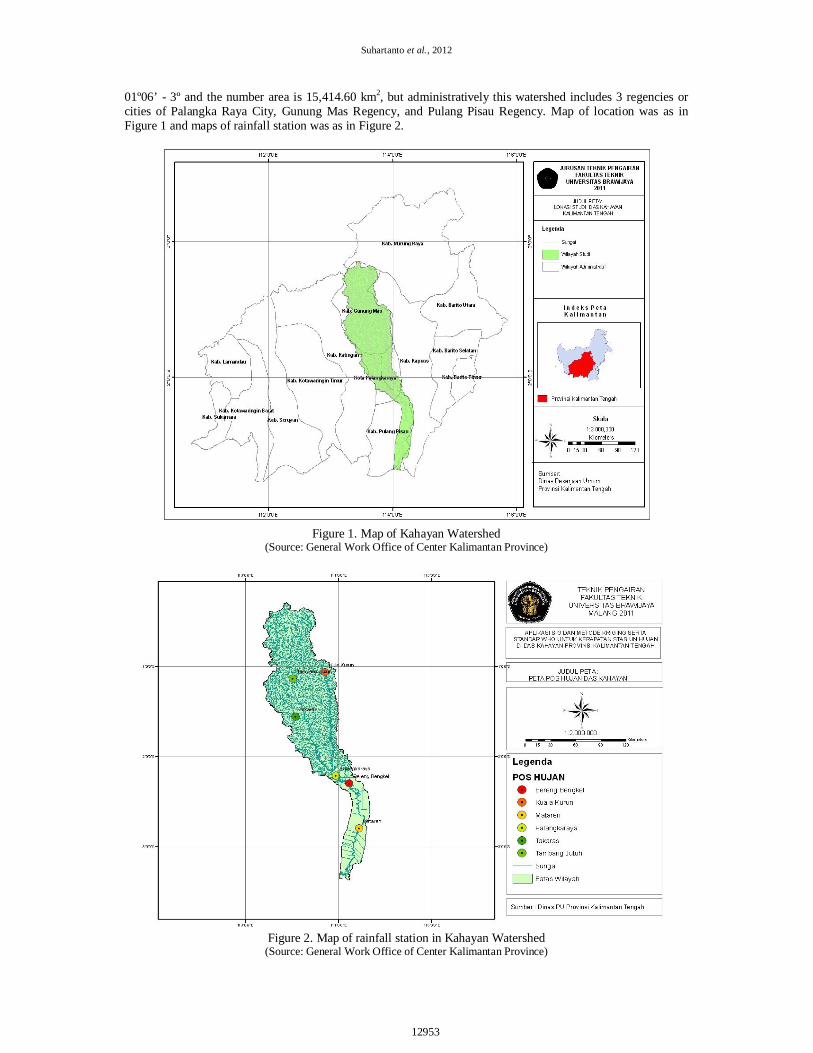
01º06’ - 3º and the number area is 15,414.60 km2, but administratively this watershed includes 3 regencies or cities of Palangka Raya City, Gunung Mas Regency, and Pulang Pisau Regency. Map of location was as in Figure 1 and maps of rainfall station was as in Figure 2.
Figure 1. Map of Kahayan Watershed
(Source: General Work Office of Center Kalimantan Province)
Figure 2. Map of rainfall station in Kahayan Watershed
(Source: General Work Office of Center Kalimantan Province)
12953

J. Basic. Appl. Sci. Res., 2(12)12952-12960, 2012
Some data that were needed in this study was as follow: 1. Daily rainfall in 1991 to 2010 for hydrological analysis. 2. Map of Kahayan Watershed and network of Kahayan River. 3. Earth Form Map of Indonesia for presenting the land use in study location. 4. Data of rainfall stations which presented administrative location and coordinate of rainfall stations.
Steps of this study was as follow:
1. Analysis of secondary data included digitation of spatial data, process of editting, selection and organizing atribute data, data uniting and determing of watershed restriction.
2. Hydrological analysis included consistency test of rainfall data, analysis of area averaged rainfall, spatial analysis by using Geographic Information System for determining area rainfall. Frequency analysis due to the test of smirnov-kolmogorof and chi square, analysis of design rainfall
3. Analysis of density and distribution rainfall stations based on the standard of WMO 4. Network analysis of rainfall stations based on Kriging Method,
Standard of WMO (World Meteorological Organization) Generally, happened rainfall area is wider than representative are rainfall of rainfall station or on the contrary, so by attending the consideration of economy, topography, etc., it has to be placed rainfall station with optimal density which can give good data for the next analysis. For this purpose, World Meteorological Organization (WMO) suggests the minimum density of rainfall station network as presented in Table 1 [10]. Table 1 Minimum density that was recommended by WMO
No. Type Area number (km2) Per-unit rainfall station
Normal condition Difficult condition 1 Plain area of mediteranian-tropic and medium 1000 – 2500
(600 – 900) 3000 – 9000
2 Mountainous area of mediteranian-tropic and medium 300 – 1000 (100 – 250)
1000 – 5000
3 Mountainous small island area with the variety of rainfall 140 – 300 (25)
4 Arid and pole area 5000 – 20000 (1500 – 10000)
Kriging Method Kriging is a geo-statistical method which uses the known value and semivariogram for predicting the value in other location that unmeasured. By Kriging, the prediction of value is not the same as source data as on polygon Thiessen approach, but it varies and depends on the similarity to the location of source data [11]. Kriging method was as forecasting method which was developed by Matheron (1965). Basically, this method was emphasized that interpolation of data from a measured data to the other data in a watershed did not only been determined by the distance between the unmeasured point and finding point, but it was determined by three factors [12] as follow: 1) the distance between finding point and unmeasured point; 2) the distance between the measured points; and 3) the intended structure variable. The variable structure can be known from variogram of measured data do the given weight to each unmeasured point is remained due to the phenomenon variability. General formula of Kriging To forecast the averaged value in a certain domain, it is remained the averaged value of n data as follow [12}:
)(*1
0 i
n
ii xZZ
(1)
Note: Z0* = computed average λi = weight Z (xi) = the value of ‘z’ on the x point Weight of λ is certainty so the estimator of Z0 as follows: 1. Unbiased 2. Optimal with minimum mean squared or
∑(푍 ∗ −푍 ) = 0 (2) Then, estimation error can be calculated as:
12954

Suhartanto et al., 2012
푍 ∗ −푍 = ∑ 휆 푍(푥 )− 푍 (3)
Estimation of variance error 휎 = 퐸[푍∗(푥 ) − 푍(푥 )] = ∑ 휆 훾 푥 ,푥 + 휇 (3)
Estimation of variance error of 휎 very depends on the number and location of observed locations. Therefore, 휎 is as an efficient tool for solving the problem of network optimization, and it is necessary to be emphasized too that 휎 is not as estimation error of real space but it is as modelling error. Semivariogram In Kriging method, the function of semivariogram determines in great percentage. Therefore, semivariogram of data is important to be known formerly. The general equation of semivariogram is as follow [13]:
훾(ℎ) = 푛∑ 푧(푥푖 + ℎ) − 푧(푥푖) (4) Note: z (xi) = the value of ‘z’ on the x point h = the distance inter point z (xi+h) = the value of ‘z’ on the distance of h from x point General form of semivariogram is presented as in Figure 3.
Figure 3. General form of semivariogram
Source: www.wikipedia.com
RESULTS AND DISCUSSION Density analysis and distribution pattern of rainfall station due to the standard of WMO (World Metrological Organization) Density analysis of rainfall station due to the standard of WMO (World Meteorological Organization), was based on the influenced number area of each station in Kahayan Watershed. The result was presented as in Table 2.
12955

J. Basic. Appl. Sci. Res., 2(12)12952-12960, 2012
Table 2 Density analysis of rainfall station based on the standard of WMO No Name of station
Influenced area number
(km2)
Percentage
(%)
Correction factor
Standard of WMO normal condition
(km2) 1,000 – 2,500
difficult condition (km2) 3,000 – 9,000
1 Kuala Kurun 5,099.8059 33.0843 0.3308 Difficult 2 Tumbang jutuh 3,002.4549 19.4780 0.1948 Difficult 3 Batu Badinding 821.0916 5.3267 0.0533 Normal 4 Tumbang Sangai 42.2887 0.2743 0.0027 Normal 5 Kasongan 302.2500 1.9608 0.0196 Normal 6 Palangka Raya 939.9849 6.0980 0.0610 Normal 7 Bereng Bengkel 459.4125 2.9804 0.0298 Normal 8 Takaras 2,178.5189 14.1328 0.1413 Normal 9 Pujon 138.8599 0.9008 0.0090 Normal
10 Mandomai 1,383.7600 8.9769 0.0898 Normal 11 Mantaren 1,046.1753 6.7869 0.0679 Normal
1,5414.6024 100.00 100.00 Result presented that in Kahayan Watershed there were 2 rainfall stations such as Kuala Kurun and Tumbang Jutuh with influenced area number in the category of difficult condition (3,000 – 9,000 km2/station). It indicated that based on the standard of WMO, the two rainfall stations were unsuitable so that was necessary a recommendation of new rainfall station. Network analysis of rainfall station due to the Kriging Method Network design of rainfall station due to the Kriging Method was based on the averaged yearly rainfall of each rainfall station. The steps were as follow:
1. Based on the averaged yearly rainfall, it was carried out the semivariogram modelling. For making easy of modelling, it was carried out binning on semivariogram. The binning process was based on the farthest distance among the rainfall stations. The farthest distance among the rainfall stations was 262.340 km such as between the station of Mandomai and Tumbang Sangai. Therefore, the selection of lag and number of selected lag in the semivariogram modelling produced the multiplication value of 131.170 and it was as half of the farthest distance among the stations. Based on the trial result, it was obtained that the combination of lag was 18.738 km and the number of lag was 7. This result was as the best combination which produced the least value of RMSE and MAE. Figure 4 presented the semivariogram of binning result.
Figure 4. Semivariogram of averaged yearly rainfall due to the binning result Source: result of analysis by using Kriging Method
2. After being carried out the binning, then it was carried out the semivariogram modelling by using 3
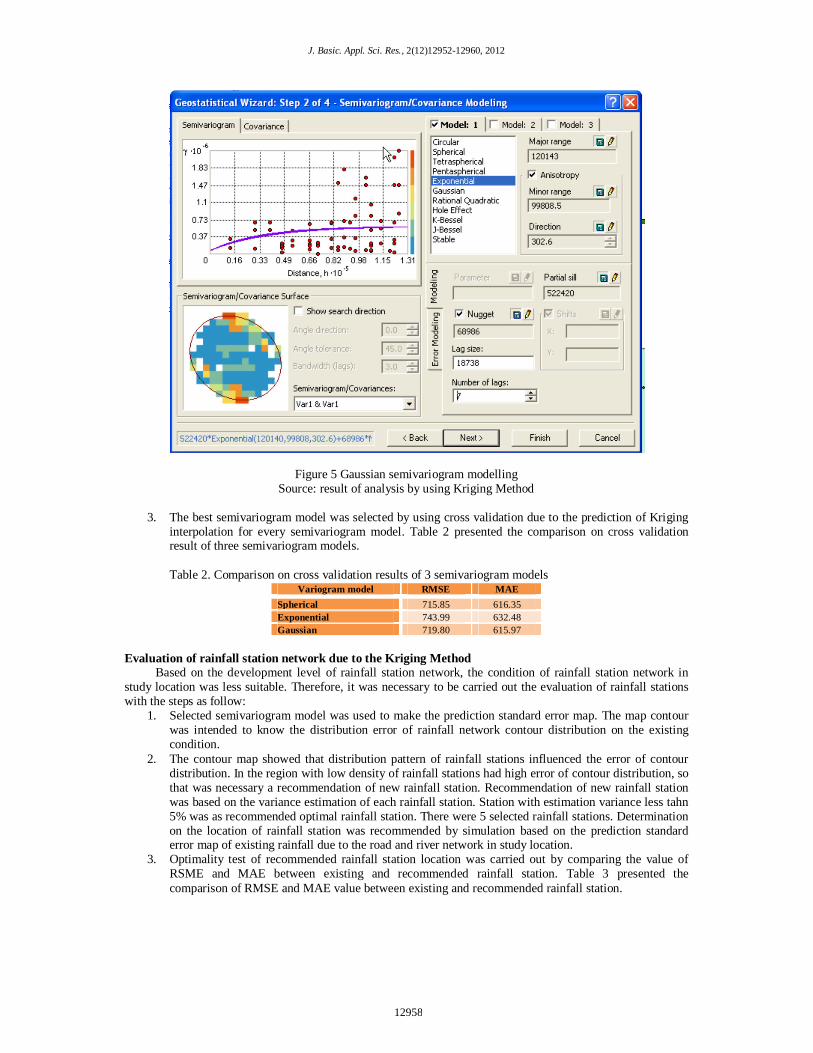
standard semivariogram models such as spherical, exponential, and gaussian. The three models were frequently used in the Kriging Method. Figure 5, 6, and 7 presented the semivariogram modelling of spherical, exponential, and gaussian.
12956

Suhartanto et al., 2012
Figure 5 Spherical semivariogram modelling Source: result of analysis by using Kriging Method
Figure 6 Exponential semivariogram modelling Source: result of analysis by using Kriging Method
12957
J. Basic. Appl. Sci. Res., 2(12)12952-12960, 2012
Figure 5 Gaussian semivariogram modelling Source: result of analysis by using Kriging Method
3. The best semivariogram model was selected by using cross validation due to the prediction of Kriging
interpolation for every semivariogram model. Table 2 presented the comparison on cross validation result of three semivariogram models. Table 2. Comparison on cross validation results of 3 semivariogram models
Variogram model RMSE MAE Spherical 715.85 616.35 Exponential 743.99 632.48 Gaussian 719.80 615.97
Evaluation of rainfall station network due to the Kriging Method Based on the development level of rainfall station network, the condition of rainfall station network in study location was less suitable. Therefore, it was necessary to be carried out the evaluation of rainfall stations with the steps as follow:
1. Selected semivariogram model was used to make the prediction standard error map. The map contour was intended to know the distribution error of rainfall network contour distribution on the existing condition.
2. The contour map showed that distribution pattern of rainfall stations influenced the error of contour distribution. In the region with low density of rainfall stations had high error of contour distribution, so that was necessary a recommendation of new rainfall station. Recommendation of new rainfall station was based on the variance estimation of each rainfall station. Station with estimation variance less tahn 5% was as recommended optimal rainfall station. There were 5 selected rainfall stations. Determination on the location of rainfall station was recommended by simulation based on the prediction standard error map of existing rainfall due to the road and river network in study location.
3. Optimality test of recommended rainfall station location was carried out by comparing the value of RSME and MAE between existing and recommended rainfall station. Table 3 presented the comparison of RMSE and MAE value between existing and recommended rainfall station.
12958

Suhartanto et al., 2012
Table 3 The comparison of RSME and MAE value between existing and recommended rainfall station Semivariogram model RSME MAE
Existing Recom. I Recom. II Existing Recom. I Recom, II Spherical 745.85 569.28 570.37 616.35 454.23 484.28 Exponential 743.99 578.93 583.21 632.48 481.58 486.90 Gaussian 719.80 591.81 618.75 615.97 468.20 529.29
Source: result of analysis
Table 3 presented that the RSME and MAE value of recommended rainfall station was smaller than existing one, so recommended of Kriging interpolation result was suitable to be approached in Kahayan Watershed. Figure 6 presented the prediction standard error map of recommended rainfall stations and Figure 7 presented map of GIS result.
Figure 6 Prediction standard error maps of recommended rainfall stations due to Kriging Method
Figure 7 Prediction standard error map of recommended rainfall stations due to GIS result
CONCLUSION
Based on the analysis as above, it was concluded as follow:
1. Based on the standard of WMO (World Meteorological Organization), there were 2 rainfall stations with influenced area number in the difficult category (3,000 – 9,000 km2) such as the stations of Kuala Kurun and Tumbang Jutuh. Therefore, it was carried out design on the location of new rainfall station with suitable to the standard of WMO by using Kriging Method. The result presented that 15 rainfall stations on the recommendation I and 14 rainfall stations on the recommendation II which was recommended from 11 existing rainfall stations with variance estimation value was less than 5%. The
12959

J. Basic. Appl. Sci. Res., 2(12)12952-12960, 2012
value if RSME and MAE of I and II recommended rainfall stations were smaller than existing one. It indicated that rainfall stations of recommendation I and II were feasible to be applied in Kahayan Watershed.
2. Based on the Kriging Method, density of rainfall stations of recommendation I and II were suitable with the standard of WMO and it can be used for rainfall stations design in Kahayan Watershed, but it was needed to attend the side of economic, operation, and maintenance. The additional of optimal rainfall stations was based on the factor of hydraulic, politic, and socio-economy. In Kahayan Watershed, the additional of 6 rainfall station on recommendation I and 4 rainfall station on recommendation II was felt to be optimal because the relative error was less than 5% and it considerates the transportation network and the influenced area number of new rainfall station has been suitable with the standard of WMO.
ACKNOWLEDGEMENT
Some of data in this study were supported by Wahyu Nugroho Wicaksono (Student of Postgraduate of Water Resources Engineering, Faculty of Engineering, University of Brawijaya, Malang, East Java of Indonesia, 2012). So the authors gave great appreciation to him and thanks so much for his great supporting for this study.
REFERENCES
1. Nasonova, O.N., F.M. Gusev. F.E. Kovalev, 2010. Application of a Land Surface Model for Simulating Rainfall Streamflow Hydrograph: 1. Model Calibration. Journal of Water Resources, 38(2): 155-168.
2. Prasetyorini, Linda and Montarcih, Lily, 2011. Analysis of Design Flood Due to Rainfall Station Distribution. Journal of Applied Sciences Research, 7(6): 844-848
3. Chow, V.T., D.R. Maidment, L.W. May, 1988. Applied Hydrology. Mc. Graw-Hill, New York.
4. Hassanzadeh, Yousef, Abdi, Amin, Talatahari, Siamak and Singh, P. Vijay, 2011. Meta-Heuristic Algorithms for Hydrologic Frequency Analysis. Journal of Water Resource Manage, 25: 1855-1879.
5. Nandakumar, N. and R.G. Mein, 1997. Uncertainty in Rainfall-Runoff Model Simulations and the Implications for Predicting The Hydrologic Effects Of Land Use Change. Journal of Hydrology, 192: 211-232.
6. Prasetijo, Hari; Montarcih, Lily; and Prasetyorini, Linda, 2011. Analysis of Average Rainfall Using Kagan Rodda. Journal of Applied Sciences Research, 7(3): 309-313
7. Hoybye, Jan and Dan. Rosbjerg, 1999. Effect of Input and Parameter Uncertainties in Rainfall-Runoff Simulations. Journal of Hydrologic Engineering, 4(3): 214-224
8. D.A. Hughes, 2006. Comparison of satellite rainfall data with observations from gauging station networks. Journal of Hydrology, Volume 327, Issues 3-4, 20 August 2006, Pages 399-410.
9. Suhartanto, Ery and Haribowo, Riyanto, 2011. Application of Kagan-Rodda Method for Rain Station Density in Barito Basin Area of South Kalimantan, Indonesia. Journal of Applied Technology in Environmental Sanitation, 1(4): 329-334.
10. Linsley, Ray K, M.A. Kohler dan JLH Pualhus. 1986. Hidrologi Untuk Insinyur.(Terjemahan). Jakarta: Erlangga.
11. Tatalovich, Z. 2005. A Comparison of Thiessen Polygon, Kriging and Spline Models of UV Exposure. www.ucgis.org/summer2005/studentpapers/tatalovich.pdf (diakses 3 November 2011)
12. Harto Br, Sri. 1986. Optimasi Kerapatan Jaringan Stasiun Jaringan Hidrologi. Yogyakarta: PAU Ilmu Teknik UGM.
13. Suharjo, Bambang. 2005. Pendekatan Fuzzy Kriging Pada Analisis Data Spasial. Seminar Nasional Aplikasi Teknologi Informasi 2005 (SNATI 2005) Yogyakarta, 18 Juni 2005. ISBN: 979-756-061-6. http://journal.uii.ac.id/index.php/Snati/article/viewFile/1375/1155 (diakses 3 November 2011)
12960