dental industry association of canada (diac) · 1 dental industry association of canada (diac)...
TRANSCRIPT
1
DENTAL INDUSTRY ASSOCIATION OFCANADA (DIAC)
ASSOCIATION CANADIENNE DE L'INDUSTRIE DENTAIRE
TWENTY-SECOND ANNUALFUTURE OF DENTISTRY SURVEY REPORT
FINAL REPORT
August 5, 2018Submitted by:

Table of Contents
1. Introduction............................................................................................................1
2. Study Methodology.................................................................................................32a. Survey Method ..................................................................................................................................32b. Identification of Survey and Sampling Bias...........................................................................52c. Questionnaire Design .....................................................................................................................82d. Sample Size ..................................................................................................................................... 112e. Actual Response Rate .................................................................................................................. 122f. Regional Analysis........................................................................................................................... 123. Executive Summary...............................................................................................13
A. Respondent Profile ...............................................................................................14A.1 Practice Type ................................................................................................................................. 14A.2 Years in Practice ........................................................................................................................... 14A.3 Location of Practice ..................................................................................................................... 15A.4 Owner or Associate...................................................................................................................... 16A.5 Practice Affiliation ………………………………………………………………….18A.6 Years After Graduation To Set-up Practice ........................................................................ 23A.7 Number of Dentists in Practice ............................................................................................... 23A.8 Number of Operatories in the Practice ................................................................................ 25A.9 Chairside Days Spent In Practice Per Year ......................................................................... 28A.10 Average Patients Treated Per Day ...................................................................................... 29A.11 Hygiene Days............................................................................................................................... 30A.12 Demographic Shift in the Practice Profile ........................................................................ 31B. Product Purchases and Usage................................................................................35B.1 Dental Equipment ........................................................................................................................ 35B.2 Sundries/Consumable Products............................................................................................. 45B.3 Dental Laboratory Products..................................................................................................... 53C. Financing ..............................................................................................................58C.1 Leasing.............................................................................................................................................. 58C.2 Capital Financing .......................................................................................................................... 61
D. Marketing and Customer Service ..........................................................................63D.1 Relative Value of Marketing Vehicles ................................................................................... 63D.2 Suggested Service Improvements ......................................................................................... 67D.3 Internet ........................................................................................................................................... 70E. Continuing Education ............................................................................................75E.1 Interest in Continuing Education Topics............................................................................. 75E.2 Type of Study Club ....................................................................................................................... 77E.3 Suggestions for Improvement of CE Opportunities ........................................................ 77F. General Trends In Dentistry ...................................................................................78F.1 Percentage of Procedures Refer to Specialist .................................................................... 78F.2 Patient Information ..................................................................................................................... 81F.3 Practice Promotion ...................................................................................................................... 85APPENDIX A — Detailed Surveyed Tabulations..........................................................91
APPENDIX B — Survey Questionnaire Contents .......................................................147
APPENDIX C — Archive ...........................................................................................169

1
1. INTRODUCTIONIn October 2018, the Dental Industry Association of Canada (DIAC) retained the firm of EricP. Jones & Associates Inc. to assist with the design and administration of its 22nd AnnualSurvey (2018) of Canadian dentists. Given the diversity of DIAC membership, the study wasdeveloped to meet a variety of objectives covering the following broad areas:Product Purchases and Usagea) To determine current ownership and/or planned purchase of various types of dentalequipment.b) To determine current and anticipated future purchase sources and ordering methodsfor dental consumables/sundries.c) To determine current and anticipated future usage trends for specific dentalprocedures.d) To determine anticipated future usage trends for specific dental laboratory productcategories.Financinga) To determine anticipated financing sources and/or use of leasing options forequipment, practice purchase or office expansion.b) To determine dentist’s main influence on financing decisions.Marketing and Customer Servicea) To evaluate the value of specific marketing vehicles to the dentist as a source of newproduct information.b) To determine dentists’ Internet usage level and their rating of its value as a source ofinformation.c) To evaluate how dental dealers, manufacturers and laboratories could improve theirservice to their customer base.d) To determine if areas of unfilled need exist or if there are specific services dentistswould like to see offered by dealers, manufacturers or laboratories.

2
Continuing Educationa) To determine dentists’ level of interest in various Continuing Education Topics.b) To determine how current CE opportunities could be improved.c) To determine how many dentists currently belong or plan to join a Study Club and whattypes of Study Clubs dentists belong to.General Trends in Dentistry1. To determine current and future anticipated percentages for different proceduresdentists refer to a specialist.2. To determine who is currently placing the majority of implants.3. To determine dentists’ opinions on where patients are obtaining information aboutdental procedures and the main changes in their patient base.4. To determine dentists’ current or future usage of practice promotion methods such asasking for referrals, promoting new technologies, newsletters/direct mail, social media,etc.5. To determine dentist’s opinions on the top challenge they intend to address in 2018 andtheir three key metrics for success.6. To determine a profile of the breakdown of solo practices, Multi-practices (Grouppractice) Or Corporate Dentistry; the intention to join one of these organizations (orremain in solo practice); and the perceived benefits and drawbacks of such amembership.As with the previous studies conducted, the objective of this year’s survey was to gain abroad overview understanding of the issues and attitudes defining the purchase dynamicsin dental offices; the perceived value of marketing vehicles employed by dentalmanufacturers, dealers and laboratories; and the identification of important issues facingall Canadian dentists decision makers within the practice today and into the future (i.e.,within a two year horizon). The study is intended to assist dental manufacturers, dealers,laboratories and service providers as they develop new products and implement marketingprograms to address the needs of dentist decision makers in Canada.

3
2. STUDY METHODOLOGY
(a) Survey MethodThe 2018 survey was administered in an online format for the third year. Prior to 2016, thesurvey was also issued as a 6-page printed insert (with postage paid reply envelope)polybagged with the February 2015 issue of CDA Essentials for English speaking dentistsacross Canada (approximate count 16,000) and Spectrum Quebec for primarily Frenchspeaking dentists in Quebec (approximate count 4,200). This split was necessitated by twofactors: the CASL opt-in process in 2014 and the fact that l’Ordre des dentists du Quebecwas no longer a member of the CDA. In combination, DIAC’s coverage in Quebec throughthe CDA (whether polybagged with magazine or by email) had dropped to approximately635 potential dentist respondents - meaning that DIAC was not communicating with 2786dentists from the province of Quebec via its former CDA channels.As with the print version of the survey, access to the Quebec dentist population via OralHealth/Scott’s Directories at that time was severely restricted by CASL opt-in and l’Ordredes dentists du Quebec leaving the CDA. Oral Health/Scott’s Lists online list coverage wasdown 30% across the country in 2015 due to the CASL opt-in requirement. In this case, theimpact was more widespread across Canada with the email address list shrinking by 2308contacts from 7546 to 5238. There was also a noticeable drop in Quebec counts from 1689to 989, along with sizeable drops in BC and ON in terms of absolute numbers. On apercentage basis, every province and territory in the country showed a noticeable dropsince 2014.For the 2018 survey, email lists from Oral Health/Scott’s and Palmeri Publishing were utilized.Oral Health/Scott’s was used for English-speaking dentists (6206 GPs and Specialists) outsideQuebec and the Palmeri Publishing List used in Quebec only (due to its stated wider coveragenumbers – 1600 GPs and Specialists - in the province during the initial project planning period).
While email list counts vary constantly, an approximate total of 7730 dentists were repeatedlyreached over the survey period as per the following provincial breakdown.
The CDA’s most recent (as of December 31, 2017) counts of licensed dentists will be used forthe purposes of comparing the email reach to the overall estimated number of practicing dentistsin total, province by province across the county. This chart is supplied below the Email Listcounts chart.

4
All Dentists EmailBC 987AB 664SK 145MB 176ON 3829QC 1600NB 89NS 142PE 28NL 60NT / NU /YUKON 10
Grand Total 7730
All Practicing Dentists
BC 3,478AB 2,533SK 473MB 722ON 10,027QC 4,386NB 339NS 552PE 78NL 206NWT / NT /YUKON
75
Grand Total 20327A total of six emails were sent to English-speaking dentists across Canada (outside ofQuebec) distributed via the Oral Health/Scott’s Lists (linking to the English surveytabulations via the web link www.surveymonkey.com/r/DIAC2018) and four bi-lingualemails with links to the French language version of the survey were distributed by PalmeriPublishing into Quebec. Both Oral Health/Scott’s and Palmeri confirmed that their on-goingopt-in methods meet CASL standards per routine.

5
The availability of the online version was promoted in English via an initial email invitationand five subsequent email reminders along with the previously mentioned PalmeriPublishing coverage to practitioners in Quebec (one invitation and three reminders).In addition, a press release campaign was launched to dental media and dental associationsacross the country prior to the initial email, with some of the contacted media andassociations agreeing to run the release. There were free insertions of a DIAC survey adwith a link to online survey in the CDA Oasis e-newsletter in French and English over thesurvey period with a link to the online survey. Oral Health and Palmeri Publishing alsoplaced the DIAC ad on their magazine home pages over the period as unsold space wasavailable, with Oral health running the add periodically in their weekly Wednesday e-newsletter at no charge. All respondents were offered a chance to enter a draw for a GrandPrize of a $5000 travel voucher, three $500 second prizes along with ten consolation prizesof $100 travel vouchers. To qualify for the draw, completed surveys had to be received byJune 6, 2018.For 2018, an additional contest was run offering the first 100 respondents to submit acompleted survey a $10 Starbucks electronic gift card. Subsequent contests were run forapproximately two weeks per tradeshow (PDC, ODA and JDIQ), offering the first 30respondents to submit a completed survey by a specific due date during that tradeshowperiod a $10 Starbucks electronic gift card. These programs dramatically increased interestand promotional impact for the survey as evidenced by increased response around thespecific EBlasts dealing with each tradeshow (all EBlasts offered national coverageirrespective of the location of the tradeshow).Given the six well-spaced email messages for the English online version (initial emailMarch 1; and follow up reminders April 17, May 8 and May 22; and final Last Chance onJune 4) and four email messages for the French online version (initial email March 1;reminders April 17 and May 15; and final Last Chance on June 4), this allowed ample timefor response.(b) Identification of Survey and Sampling Bias1. As illustrated in EXHIBIT 1, the pattern of survey response on a percentage basis forthis year did vary from the national overall breakdown of dentists by province suppliedas the Oral Health/Scott’s mailing list totals. However, there are still some similaritiesto past results. In past years, Ontario’s percentage of response has historically beenlower than that province’s overall proportion of Canadian dentists, resulting in theremaining regions being slightly higher. While once again in 2018, the percentage ofOntario (41.5%) respondents was lower than the overall total number of dentists(42.9%) in the province, the difference is almost indistinguishable as it was last year.The same situation applied in Quebec where the province accounted for 14.1%(compared to 15.8% in 2017) of overall survey response as opposed to 20.1% of the

6
0% 10% 20% 30% 40% 50%NWT/NT/YKBritish ColumbiaAlbertaSaskatchewanManitobaOntarioQuebecNew BrunswickPEINova ScotiaNewfoundland Actual Distribution% of Survey Response
total number of dentists across Canada. However, the actual number of responsescontinues to grow in the province year over year. Correspondingly, the opinions ofWestern (36.1% of response as opposed to 31.7% of total dentists) and Atlantic Canada(8.3% of respondents as opposed to 5.3% of total dentists) respondents will haveslightly more impact on overall results than their total populations might warrant.However, given the relatively small base of 414 respondents, these variances are wellwithin statistical means. It will require at least another year or two of experience andtracking to determine what may be now occurring in terms of response patterns.DENTAL INDUSTRY ASSOCIATION OF CANADA
EXHIBIT 1
% of Survey Response by Province vs Actual Distribution(2018)
Given these variances and the far smaller base of respondents, the following chartillustrates the relative response rates to actual distribution of dentists across the countryas per the CDA Practicing Dentist counts. While there is some variance between respondentand actual percentages with the on-line survey administration in 2018, this chart illustratesthat there have always been variances up and down, province by province over the historyof the survey. The variances for 2018 are no more or less than what has been experiencednormally and still indicate a good reading of overall dentist opinion.

7
10-Year Comparison of Survey Response to Actual Dentist Distribution
By ProvinceActual
2009 2010 2011 2012 2013 2014 2015 2016 2017 2018 Distribution% % % % % % % % % % %Newfoundland 1.7 1.5 0.3 1.0 0.3 1.2 1.4 1.9 0.9 1.2 .9Nova Scotia 3.1 4.5 5.3 4.3 4.6 2.7 4.0 5.3 2.7 4.6 2.4PEI 0.6 0.6 0.9 0.7 0.9 0.2 0.3 1.4 0.3 1.0 0.3New Brunswick 2.2 1.2 3.1 2.6 2.5 3.2 2.9 2.4 2.4 1.5 1.5Quebec 19.6 22.1 19.1 18.0 19.9 23.0 12.4 14.4 15.8 14.1 19.2Ontario 34.7 34.1 33.7 34.1 35.0 35.2 42.2 36.5 41.8 41.5 43.8Manitoba 6.4 4.5 4.3 5.2 7.4 4.6 3.5 5.8 2.1 1.9 3.2Saskatchewan 2.5 0.9 2.8 2.3 2.5 2.0 3.8 3.4 1.8 2.2 2.1Alberta 11.8 12.7 10.0 11.8 10.4 10.5 15.6 13 20.3 13.1 11.1British Columbia 16.5 16.6 20.1 19.3 16.3 17.1 13.3 14.9 11.6 18.7 15.2NWT/NT/YK 0.8 1.2 0.3 0.7 0.3 0.2 0.6 1.0 0.3 0.2 0.3
10-Year Comparison of Survey Response to Actual Dentist Distribution
By Region
Actual2009 2010 2011 2012 2013 2014 2015 2016 2017 2018 Distribution% % % % % % % % % % %Atlantic Canada 7.6 7.8 9.6 8.6 8.3 7.3 8.6 11.0 6.3 8.3 5.1Quebec 19.6 22.1 19.1 18.0 19.9 23.0 12.4 14.4 15.8 14.1 19.2Ontario 34.7 34.1 33.7 34.1 35.0 35.2 42.2 36.5 41.7 41.5 43.8Western Canada 38.0 35.9 37.5 39.3 36.9 34.4 36.2 38.1 36.2 36.1 31.9
8.3%14.1%
41.5%36.1%
5.1%19.2%
43.8%31.9%
Atlantic CanadaQuebecOntario
Western Canada
0% 10% 20% 30% 40% 50%Actual Distribution% of Survey Response

8
2. As with last year, non-response was not a problem with this survey falling withinexpected norms. Most dentists answered the survey fully. The only exceptions tended tobe on financial questions, which normally experience far higher non-response rates inmost surveys. In addition, open-ended questions routinely tend to result in much lowerresponse rates, particularly in an on-line as opposed to a hand-written environment.However, they are the only way of capturing opinion without biasing the response byproviding pre-determined lists of possible answers. Relevant non-response rates will benoted in the executive summary where applicable.3. Given the on-line administration methodology for 2018, it can be expected there will besome difference in the demographic make-up of respondents and its impact on theirresponses. For example, as by definition, these on-line respondents are predisposed tousing computers and working on-line, there may be variances in their responses tocomputer-oriented questions as compared to past years. These possible variances willbe noted as they occur.(c) Questionnaire DesignA questionnaire covering the key issues was developed by DIAC under the guidance of EricP. Jones & Associates Inc. As the primary purposes of this study were to measure allCanadian dentists' opinions regarding the future direction of dentistry along with thefurther development of a standard respondent profile based on their current purchasebehaviour, a mix of closed and open-ended questions were included. Open-ended questionsare an excellent way to collect “opinions”. Quite often, new factors or responses that greatlyinfluence market behaviour are uncovered.The questionnaire was specifically designed to avoid biasing response by mentioningspecific manufacturers, brands, dealers or suppliers. This data was captured, whereapplicable, through the use of open-ended questions. Specific brand data was not requestedgiven the constraints of questionnaire size.New Questions Added for 2017-2018 SurveyTwo new questions were added to the section of the survey aimed at those practicing in aMulti-practice (Group practice) or Corporate Dentistry environment as follows:
Do you feel as part of a group practice you can offer a higher standard of care thanthat of a sole practitioner?___ YES ___ NO ___ Don’t Know Do you believe your patients "feel" better serviced or less serviced compared to thatof a sole practitioner?___ Better serviced ___ Less serviced ___ Don’t Know

9
Questionnaire Review - 2017A major review and re-consideration of the survey objectives and questionnaire itself wasundertaken in 2017. As such, there were major changes made to all sections of the surveyfor 2017. New questions and response options were added or revised. In addition, it wasdecided to retire certain sections of the questionnaire entirely beginning in 2017. The finalreporting and analysis sections for these question areas will be placed in a new Appendix ofthe report moving forward to be called APPENDIX C – Archive. Changes were as follows:Questions Retired to Archive as Part of 2017 Review
The response options for the questions “Who would you approach for capitalfinancing for each of the following (please specify source if applicable)?” AND “Whywould you choose each of those sources you indicated above?” were changedcompletely from “to purchase a practice, expand a practice or to add new equipment”to “To join a group practice, To join a dental service organization, To expand a multi-practice organization”. As past results are not comparable to those using the newresponse options, the original question analysis will be archived and a new analysisstarted in its place.
Question “What are the main changes you are seeing in your patient base?” wasremoved and that past analysis will be archived. Question “Reasons Patients Are Not Accepting Treatment Plans” was removed andthat past analysis will be archived. Question “Do you have computer terminals in your operatories?” AND “If plan to
purchase, when?” was revised to “What stage of ‘digitization’ has your office reachedcurrently?” with response options:
o Fully paperlesso Not paperlesso In transition to paperlessAND “Which areas of your office are digitized? (Please check off all that apply)” withresponse options:o Chartingo X-Rayo In the operatorieso In the Private OfficeAs past results are not comparable to those using the new response options, theoriginal question analysis will be archived and a new analysis started in its place.
Question on Internet Connection “Do you have an Internet/Email connection: At theFront Desk, in the operatories, in the Private Office?” was removed and that pastanalysis will be archived.
Questions “Do you currently belong to a Study Club? (YES, NO, No, but plan to joinone)” AND “If YES, what type of Study Club(s) do you belong to?” was revised to

10
“What type of Study Club(s) do you belong to? (Please check off all that apply)” withresponse options:o Implanto C&Bo Endodontico Periodontico Orthodontico Don’t Belong to a Study Clubo Other (please specify)As past results are not comparable to those using the new response options, theoriginal question analysis will be archived and a new analysis started in its place
Questions “If you visit the Exhibit Floor at conventions, please rate the following from1 to 5 (with 1 being Not Valuable and 5 being Extremely Valuable) regarding theirinfluence on your decision.”; “How long do you spend on the Exhibit Floor on average(hours per day)?”; “Would you still attend a Convention if there was no Exhibit Floor?”and “If you don’t visit the Exhibit Floor, what are your main reasons for not visiting?”were all removed and that past analysis will be archived.
Question “Do you have or ever, worked with Practice Consultants?” AND “If Yes, whatdid they help you with?” were removed and that past analysis will be archived.
New Questions Added as Part of 2017 Review
An entirely new question “Do you currently offer financing options to our patients,such as 12 months Equal Monthly Payment plans, through any of the followingmethods?” was added to the questionnaire with response options:
o We offer in-house financing where we administer the process and assume thecredit risk
o We use a 3rd party financing provider like Health Smart Financialo We do not offer financing to our patients
An entirely new question was added “What are the three key metrics for success inyour practice? (please select up to three of the following)” to the questionnaire withresponse options:
o Financial/paying bills/overhead costs, etc.o Getting more patients/keeping busy/increasing patient visitso Staffing issueso Tracking referrals out of the practiceo Implementation of technologyo Other (Please specify)
Entirely new Questions “Is your practice: A solo practice, Multi-practice (Grouppractice) Or Corporate Dentistry?”; “In the next two years, do you intend to: Join amulti-practice (Group practice); Join a Corporate Dentistry Organization; Remain insolo practice?”; “Are you: An Owner of a multi-practice (Group practice), An Associatein a multi-practice (Group practice)?”; “Is your multi-practice (Group practice) /

11
Corporate Dentistry Organization: Regional, National, International?”; “How manyseparate Clinics/Locations are there in your multi-practice (Group practice) /Corporate Dentistry Organization: 2-4, 5 or more?”; “What do you feel are the keyadvantages of a multi-practice (Group practice) / Corporate Dentistry structure?”;“What do you feel are the main drawbacks of a multi-practice (Group practice) /Corporate Dentistry structure?” were added to the questionnaire.
An entirely new Question “How many operatories are you planning to add to yourpractice in the next 2 years?” was added to the questionnaire with response options:None, 1, 2, 3 or more.
An entirely new Question “Do you currently place the majority of your own implants?”was added to the questionnaire with response options: YES, NO but plan to do so inthe future, Plan to continue to have Specialist place, Other (please specify)”
New Response Options Added as Part of 2017 Review
“Electric Handpiece” was added to the list of response options for questions “Whichof the following equipment do you currently own and/or plan to buy in the next twoyears?”; “Concerning the equipment you plan to buy, which product would you buyfirst?” AND “Which product would you buy second?”
A new Practice promotion option “Free Service offering (e.g. a Free Whitening)” wasadded to the list for the question “Are you currently using, planning to use orconsidering any of the following in your practice? (Please check all that apply)”
Two new options (“Fluoride” and ‘Whitening”) were added to the current list ofoptions offered for the question “What are your practice’s patients asking you about?(Please check off all that apply)”
Questions Rephrased as Part of 2017 Review
Question “What are the top three challenges in your practice today?” was rephrasedas “What is the top challenge you intend to address in 2017?” The questions on Study Clubs “Do you currently belong to a Study Club?” and “If YES,
what type of Study Club(s) do you belong to?” were rephrased to the more direct“What type of Study Club(s) do you belong to? (Please check off all that apply)” alongwith a new response option “Don’t belong to a Study Club”.(d) Sample SizeTargeted survey response set beginning in 2016 was 150 completed surveys - given the on-line administration only and the far smaller overall dentist populations reached via thebaseline email address lists used (as opposed to mailing all dentists). In theory, 19 timesout of 20, the results from an overall sample of this size should vary by no more than +/- 8percentage points from what would have been found by surveying the entire population ofthe target market. This methodology and result are standards for the research industry.

12
(e) Actual Response RateA total of 414 dentists responded to the on-line survey (as opposed to 335 completing theonline survey in 2017 and 208 in 2016) within the time frame allotted. Response continuesto grow year-over-year since the initially targeted 150 on-line respondents expected for2016. The impact has been an increase in the overall accuracy of response from +/- 6.8% in2016 to +/- 4.69%. This 2018 result still provides a good reading of dental opinion acrossCanada.All respondents were dentists practicing in Canada. As illustrated in the section of thisreport covering the respondent profile, the study encompassed a diversity of generaldentists and specialists; solo and group practices and dentists practicing in all regions ofthe country.(f) Regional AnalysisSince the 2000 survey (with the exception of 2005 where response rates were too low), wehave added Regional Analysis on selected questions where noticeable variances occur. Thiswas accomplished by grouping respondents into four areas: West (B.C., Alberta,Saskatchewan and Manitoba), Ontario, Quebec and Atlantic Canada. These groupings werenecessary to ensure a sufficient number of respondents in each area to allow somereasonable level of accuracy. As the accuracy of response ranges +/- 10% to +/- 21%depending on the question, these analyses should be considered as “indications” ofbehaviour only. Regional analyses were not supplied for questions where there was littledifference between regional results and those for the country as a whole.

13
3. EXECUTIVE SUMMARY
OverviewTo allow a more systematic review of the results, the report will organize the questionsfrom the survey into logical groupings by study objective. The actual question from thesurvey will appear in its entirety. This will allow cross-referencing, if desired, back to theoriginal questionnaire form. Wherever possible, a comparison to the previous year’s surveyresults as well as five-year trends will be noted.Responses to the survey are presented in six different summaries as follows:A. Overall Respondent Profile
B. Product Purchases and Usage
C. Financing
D. Marketing and Customer Service
E. Continuing Education
F. General Trends in DentistryThe report is supplemented with three appendices: Appendix A contains the detailedtabulations of the survey: Appendix B supplies a copy of the full on-line 2018 questionnairelinked to the email announcements as outlined earlier in this report; and Appendix C nowcontains the analyses and raw results for those questions retired and archived.

14
A. Respondent Profile
1. Practice Type
Which term would best describe your practice?
As expected, the vast majority of respondents were General Dentists (92%) in 2018 while8% were Specialists, returning to the usual Specialist rate as compared to the average overthe last decade.2. Years in Practice
How many years have you practiced dentistry?
GeneralDentistry
92%
Specialist8%
5 11 16 19 28200.2
0-3 years4-9 years10-15 years16-20 years21-25 years26 years or moreNo Response

15
The vast majority (83%) of respondents in 2018 had practiced dentistry for 10 or moreyears. Survey response therefore, continues to reflect the opinions and patterns of well-established practices. What is interesting is that the percentage of dentists who havepracticed for more than 20 years rose in 2018 to 48% (from 32% in 2017 and 18% in2016) despite the new on-line survey administration. In the past, these respondentsaccounted for 64.7% in 2015 and an average of 63% from 2009-2014. This is almostentirely due to the re-emergence of the “26 years or more” respondent now at 20% of totalresponse, after almost disappearing in 2016 at only 4.3%. However, this “26 years or more”respondent had previously accounted for as much as 57% of total response so perhaps thisreflects more of a balance.There have been corresponding large increase in the percentage of “21-25 years”respondents for 2018 (28% from 19% last year) leading to an overall aging of therespondent base. Of course, there have been corresponding decreases in the “10-15” (16versus 21% in 2017 and 37% in 2016) and “16-20” (19 versus 29% last year) groups. The“0-3” (5% both years) and“4-9” (11 versus13%) groups basically held their own. Ingeneral, the respondent base continues to be younger in terms of most of the past history ofthe survey, at least in terms of years in practice, but the trend continues once againtowards an older profile.On a regional basis, Atlantic respondents (29% less than 9 years) tended to have been inpractice a shorter length of time in 2018 as opposed to respondents from other regions. In2016, it was Quebec (77%) with the highest percentage below 15 years. This changed in2018 to an older demographic with Quebec respondents having a higher than averagepercentage of respondents in practice over 26 years (28% as opposed to 20% overall).Ontario and Western respondent profiles mirrored the overall averages.3. Location of Practice
Which type of area would best describe the location of your practice?As in previous years, the majority of respondents (62% as opposed to 56% last year and51% in 2016) described their location as Urban. The remaining respondents represent agood mix of response from Suburban (22% as opposed to last year’s 29%) and Rural (12%)practices.Response from Urban area dentists is slightly higher than the average of about 53% for theprevious 10 years. The percentage of response from Suburban areas is about even with theaverage of 24.9% from the last ten years. Response from Rural practices basically the sameas in 2017 and still below the average of 17.7% from the last 10 years. “Institutional”represented 3% of respondents (about the same as 4% in 2017, above the 1% of practicesfrom 2015 and 2016 (and compared to the average of 2.2% the last ten years).

16
Regionally, there were again significantly more Atlantic Rural (24%) respondents. This wasoffset overall by lower Rural responses in Quebec and Ontario. Ontario and Quebecrespondents considered themselves Suburban. Western Canada (67%) had by far thehighest percentage of Urban respondents, as it did in 2017.4. Owner or Associate
Are you an owner or associate?
The vast majority of respondents (72% as it was last year and as opposed to 77% in 2016and 79% in 2015) considered themselves owners of their practices. This is lower than the
62%
23%12% 3%0%10%20%30%40%50%60%70%
Urban Suburban Rural Institutional
Owner72%
Associate28%

17
average from the previous 10 years (78% from 2008-2017). A further 28% identifiedthemselves as associates, a record high and much higher than the average of 17% the last10 years. The percentage of Owners continues to trend downwards and the percentage ofAssociates upwards. This may be a function of the “younger dentist” demographic outlinedin the Years in Practice section earlier and may again reinforce the premise that there is arelationship between years in practice, ownership status and the profile of the surveyrespondent.When considering the profile of the respondents in each range based on years in practice, itis evident that the 0-3 range of years in practice is dominated by Associates withownership becoming more prevalent as years in practice increases. Then as the respondentages, they return to Associateship as an exit strategy.Owner vs Associate Breakdown by Individual Year in Practice Ranges*
0-3years
4-9years
10-15years
16-20years
21-25years
26 yearsor more
Owner 18% 64% 73% 83% 80% 69%Associate 82% 36% 27% 17% 20% 31%
Total 100% 100% 100% 100% 100% 100%
*All Respondents answered the questions.
18%64% 73% 83% 80% 69%
82%36% 27% 17% 20% 31%
0-3 years 4-9 years 10-15 years 16-20 years 21-25 years 26 years ormore
Associate Owner

18
This chart illustrates the divergence between Owner and Associate based on starting out inpractice, drawing very close on a percentage basis as they move through the mid-years, withincreasing ownership over 20 years in practice and finally illustrating the return of the olderdentist to Associateship as they exit the profession.
In addition, while not tracked by this survey, there is the trend acknowledged in the dentalresearch literature towards younger dentists joining group practices (whether independent ornational organizations) as an entry into the market and older dentists joining similarorganizations as an exit strategy.Regionally, Western dentists (77%) were far more likely to describe themselves as owners.Ontario (32%) had far more Associate respondents.5. Practice AffiliationAn entirely new set of questions was added to the 2017 survey around the area ofaffiliation of the respondent dentist, both today and projected over the next two years. Thiswas accomplished by separating those currently in solo practice, and intending to remainso, from the respondents who were in a multi-practice or group dentistry situation througha two stage set of questions. As this branching can be difficult to follow without seeing thetotal flow of the questions, the full set will be outlined here first. All respondents wereasked:“Is your practice:
A solo practice, Multi-practice (Group practice) Or Corporate Dentistry?”Respondents who stated they were currently in a solo practice based on their response tothe question above were then asked:“In the next two years, do you intend to: Join a multi-practice (Group practice); Join a Corporate Dentistry Organization; Remain in solo practice?”Those who had elected to remain in solo practice where then moved on to the questionsabout their own practice regarding years to set-up, number of other dentists in practice,number of operatories in the practice, etc. as per usual.

19
Respondents who stated they were currently in a multi-practice or group dentistrysituation, or intended to do so in the next two years, were then asked a set of subsidiaryquestions as follows:“Are you: An Owner of a multi-practice (Group practice), An Associate in a multi-practice (Group practice)?”“Is your multi-practice (Group practice) / Corporate Dentistry Organization: Regional, National, International?”“How many separate Clinics/Locations are there in your multi-practice (Group practice) /
Corporate Dentistry Organization: 2-4, 5 or more?”“Do you feel as part of a group practice you can offer a higher standard of care than that
of a sole practitioner? “ YES NO Don’t Know“Do you believe your patients "feel" better serviced or less serviced compared to that of a
sole practitioner?” Better serviced Less serviced Don’t Know“What do you feel are the key advantages of a multi-practice (Group practice) / Corporate
Dentistry structure?”“What do you feel are the main drawbacks of a multi-practice (Group practice) /Corporate Dentistry structure?”

20
Actual response for each of the questions was as follows:“Is your practice: A solo practice; Multi-practice (Group practice); Or CorporateDentistry?”
2017% 2018%
A solo practice 58.5 63.0Multi-practice (Group practice) 36.4 34.3Corporate Dentistry 3.9 1.9No response 1.2 0.7The majority (63%) of respondents stated they were in a solo practice, whileapproximately a third (34%) were in a group practice situation with a further 2% inCorporate dentistry. This paralleled the 2017 breakdown.Regionally, as with 2017, Quebec (53%) and (41%) Atlantic respondents were more likelyto be in group practice with Western dentists (68%) and Ontario (67%) in solo Practice.Those currently in a solo practice stated they intend to remain there (91 -100% across allRegions), just as strongly as last year. Only Ontario showed any interest in either joining aMulti-practice (3.6%) or Corporate Dentistry Organization (5.8%).“In the next two years, do you intend to: Join a multi-practice (Group practice); Join a
Corporate Dentistry Organization; Remain in solo practice?”2017%2018%
Join a multi-practice 4.1 1.9Join a Corporate Dentistry Org 4.1 3.5Remain a solo practice 91.8 94.6
Response Regarding Multi-Practices“Are you: An Owner of a multi-practice (Group practice); or An Associate in a multi-practice (Group practice)?”
2017% 2018%An Owner of a multi-practice 46.3 45.1An Associate in a multi-practice 53.7 54.9Response from those involved in Group Practice was fairly evenly split between thoseowning a group practice and those who were Associates in one. As in 2017, Quebec (55%)had a higher percentage of Owners while Atlantic (64%) and Ontario (59%) had a higherpercentage of Associate respondents.
21
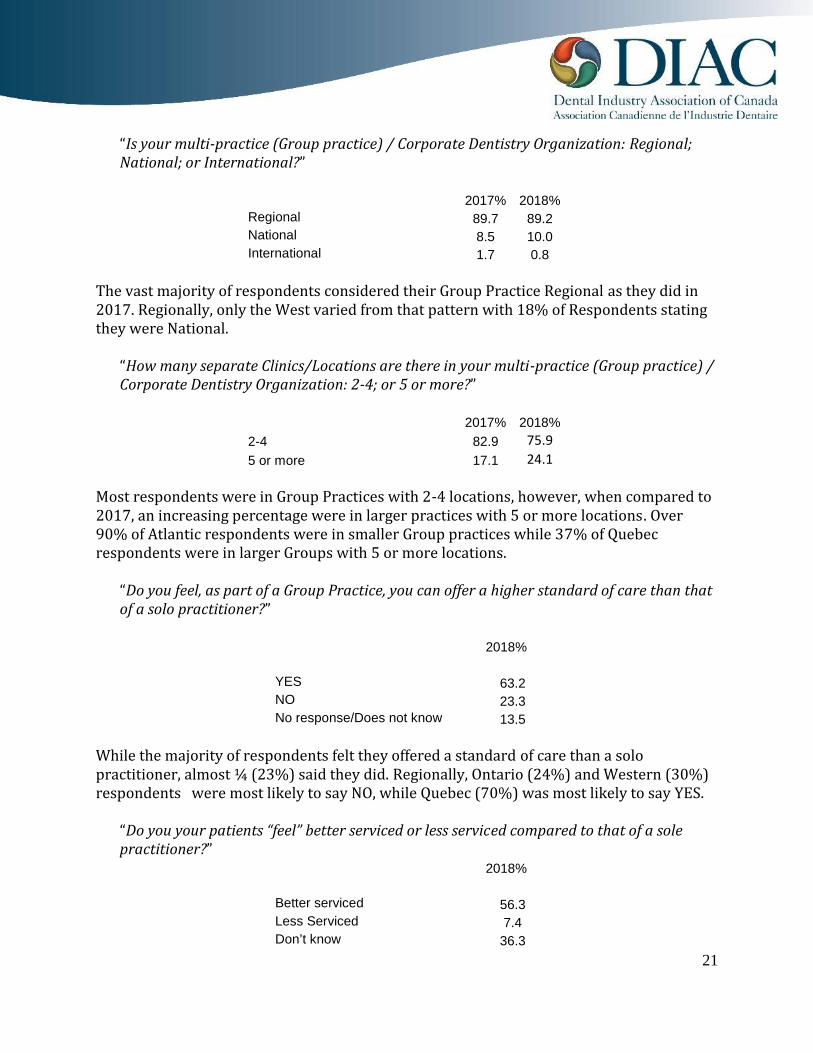
“Is your multi-practice (Group practice) / Corporate Dentistry Organization: Regional;National; or International?”
2017% 2018%Regional 89.7 89.2National 8.5 10.0International 1.7 0.8The vast majority of respondents considered their Group Practice Regional as they did in2017. Regionally, only the West varied from that pattern with 18% of Respondents statingthey were National.“How many separate Clinics/Locations are there in your multi-practice (Group practice) /
Corporate Dentistry Organization: 2-4; or 5 or more?”2017% 2018%
2-4 82.9 75.95 or more 17.1 24.1Most respondents were in Group Practices with 2-4 locations, however, when compared to2017, an increasing percentage were in larger practices with 5 or more locations. Over90% of Atlantic respondents were in smaller Group practices while 37% of Quebecrespondents were in larger Groups with 5 or more locations.“Do you feel, as part of a Group Practice, you can offer a higher standard of care than that
of a solo practitioner?”2018%
YES 63.2NO 23.3No response/Does not know 13.5While the majority of respondents felt they offered a standard of care than a solopractitioner, almost ¼ (23%) said they did. Regionally, Ontario (24%) and Western (30%)respondents were most likely to say NO, while Quebec (70%) was most likely to say YES.“Do you your patients “feel” better serviced or less serviced compared to that of a sole
practitioner?”2018%
Better serviced 56.3Less Serviced 7.4Don’t know 36.3

22
Similarly, while 56% of practitioners believed their patients felt better serviced and only7% less serviced, over 1/3 didn’t know.“What do you feel are the key advantages of a multi-practice (Group practice) / CorporateDentistry structure?”
2017% 2018%
Have associate support 51.1 57.1Buying Power 29.8 20.0Better hours for patients 6.4 12.4More schedule flexibility 5.3 2.9More variety in locations 2.1 NRReach more Patients 2.1 5.7Standardization 1.1 1.9Most respondents felt the support of their peers (57%) and buying power (20%) of theGroup Practice were still the primary benefits. However, there was a noticeable jump in thereadings for Better hours for patients and Reach more patients, which may relate toconcerns on patient volumes and level of business evidenced elsewhere in this report.“What do you feel are the main drawbacks of a multi-practice (Group practice) /
Corporate Dentistry structure?”2017% 2018%
Too many levels, too rigid 32.6 12.0Conflict with management style 20.0 29.0Too many staff 11.6 16.0Stress 10.5 2.0Less profit 7.4 5.0Consistency of Care 5.3 21.0Product demand 4.2 NRNone 3.2 9.0Standardization 2.1 2.0Patient Distribution 2.1 4.0Travel Required 1.1 NRThere was more diversity of opinion in terms of the drawbacks. The lack offlexibility/rigidity and stress (whether management style, staff or just stress itself) stillaccounted for most (65%) of the drawbacks stated. However, consistency of care wasmentioned by over 20% of respondents in 2018 (as compared to just 5% in 2017). Thisapplied across all Regions.

23
6. Years After Graduation to Set-up Your Practice
Interestingly enough, this year’s results have returned to historical norms, with 22% ofrespondents setting up their practices in the first year (26% in 2017, 29% in 2015, 32 % in 2013and a high of 44% in 2010). It would appear that 2016 was an anomaly in response. This samepattern of response applied across all Regions as it did last year with the exception of the Westwhere only 50% had set up by Year 3 (as opposed to 60% - 62% in the other Regions)..
If you are an owner, how many years after graduation did you buy/set-up your practice?
Years After Graduation Buy/Set Up Practice2011-2018 Study Periods
7. Number of Dentists in the Practice
How many other dentists are there in your practice?Here too we continue at historical norms as it was in 2017. In 2016, there was a far lowerpercentage of respondents identifying themselves as sole practitioners (23%) as opposedto36% in 2015 (and an average of 40% the last seven years and much lower from theaverage of 45.7% recorded from 1997-2007). For 2018, we have 36% as sole practitioners.Correspondingly, the number of practices with one additional dentist was at 23% (asopposed to 49.5% in 2016) corresponding to the 29.5% seen in 2015 (and the average28.9% for the last 12 years). Those practices with two and three additional dentistsaccounted for 19% (16.8% in 2016) and 8% (7.2% in 2016) respectively.
44%
34%
35%
32%
29%
7%
26%
22%
41%
45%
45%
50%
46%
76%
49%
51%
11%
11%
11%
10%
13%
9%
12%
13%
5%
10%
10%
8%
12%
7%
12%
14%
0% 10% 20% 30% 40% 50% 60% 70% 80% 90% 100%20112012201320142015201620172018Within the 1st year 2-5 years 6-9 years 10 years or more

24
The dramatic increase in the percentage of respondents (11% this year and 13% in 2017)with five or more dentists (including the respondent) in their practice continued in 2018.This was 3.4% in 2016 and an average of 6.3% the last 14 years. This may reflect the higherproportion of associates and a “younger” dentist base in recent overall respondent bases.Number of Additional Dentists in Practice (2018)
Atlantic had the highest percentage of sole practitioners (46%) and the second highest(15%) of large 4 or more dentist practices. Quebec (18%) trended towards larger practicesat the other end of the spectrum. Ontario tended to have the highest percentage ofpractices with two or fewer practitioners by far (83%). Historically, in 2015, the Maritimes(10%) were more likely to have five or more dentists in their practices than Quebec (9.3%),Ontario (3.4%) and the West (0%). In 2013, the West and Ontario were more likely to havefive or more dentists in their practice.
36%23% 19%
8% 11%
Sole Practitioner One Two Three Four or more

25
8. Number of Operatories in the PracticeIn 2016, it appeared was a definite trend towards respondents having more operatories intheir practices with 82% having four or more that year (as opposed to 64.1% in 2015).However, since that time the number of practices with four or more operatories hasdeclined each year with 64% this year and72% in 2017.
How many operatories do you have in your office?
1%11%
21%20%
18%26%
OneTwo
ThreeFourFive
More than Five

26
Yet, 2018 also saw an uptick in the number of respondents with three or fewer operatoriesat 33% (28% in 2017). As the following graph illustrates, practices with three or feweroperatories had been generally in steady decline since the survey began, a real drop of40.2% since 1997 (58% in 1997 versus 17.8% in 2016).Three or Fewer vs Four or More Operatories 1997-2018
The trend of those having more than five operatories in the practice (15.4% from 1997 to2010) had levelled off over the last five years staying in a range of 20-25%. For 2017, thisincreased to an all-time high of 30% but has returned to historical norms in 2018 at 26%.Five or More Operatories 1997-2016
58%36%41%
64%
0%10%20%30%40%50%60%70%80%90%
Three or Fewer OperatoriesFour or More Operatories
15%30%
0%5%10%15%20%25%30%35%

27
Quebec (48%) and Atlantic (47%) were the most likely to have five or more operatorieswhile the majority of Western practices (72%) had four or more. Ontario (38%) was mostlikely to have 3 or less.Number of Operatories Planning to Add in Next 2 Years“How many operatories are you planning to add to your practice in the next 2 years?”This was a new question added in 2017 with response options: None, 1, 2, 3 or more.
2017% 2018%
None 77.6 72.01 12.2 10.92 3.6 7.53 or more 3.0 6.3No Response 3.6 3.4
As with 2017, the majority of respondents (72%) were planning to stick with the statusquo. However, 28% were planning on adding at least one operatory (with increasingpercentages year-over-year planning on adding more than one).Number of Operatories Planning to Add in Next 2 Years
None72%
One11%
Two8%3 or more6% No Response3%
28
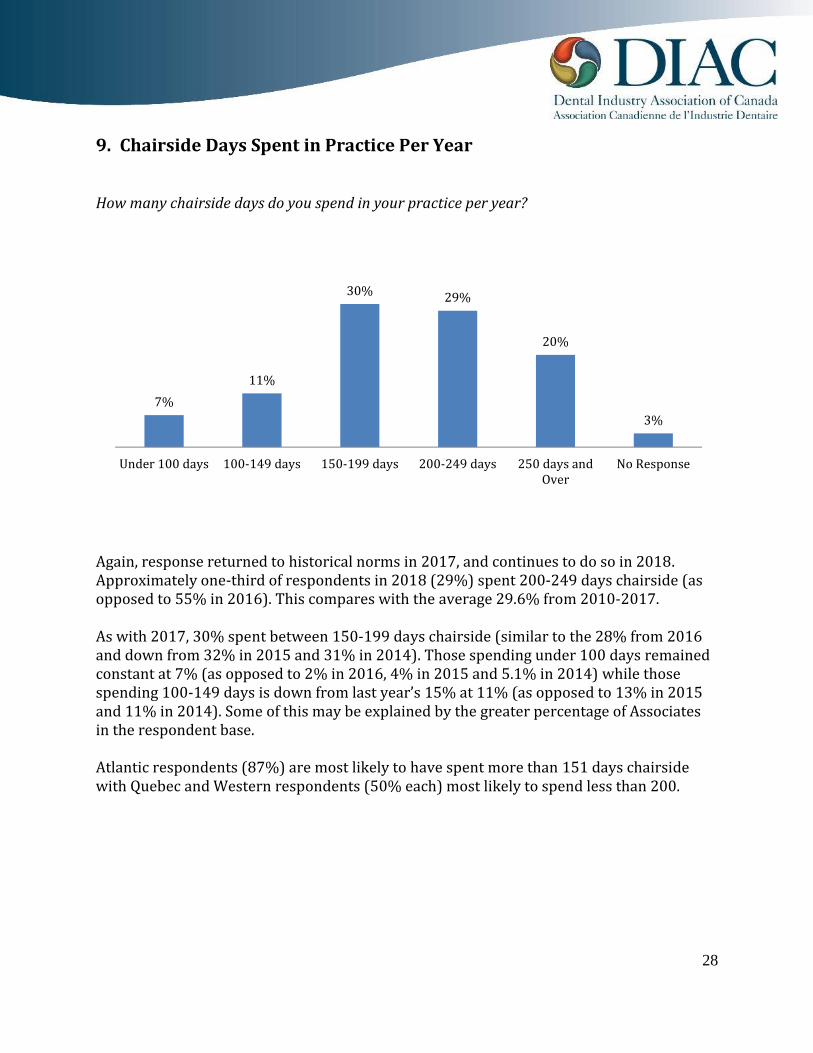
9. Chairside Days Spent in Practice Per Year
How many chairside days do you spend in your practice per year?
Again, response returned to historical norms in 2017, and continues to do so in 2018.Approximately one-third of respondents in 2018 (29%) spent 200-249 days chairside (asopposed to 55% in 2016). This compares with the average 29.6% from 2010-2017.As with 2017, 30% spent between 150-199 days chairside (similar to the 28% from 2016and down from 32% in 2015 and 31% in 2014). Those spending under 100 days remainedconstant at 7% (as opposed to 2% in 2016, 4% in 2015 and 5.1% in 2014) while thosespending 100-149 days is down from last year’s 15% at 11% (as opposed to 13% in 2015and 11% in 2014). Some of this may be explained by the greater percentage of Associatesin the respondent base.Atlantic respondents (87%) are most likely to have spent more than 151 days chairsidewith Quebec and Western respondents (50% each) most likely to spend less than 200.
7% 11%30% 29%
20%3%
Under 100 days 100-149 days 150-199 days 200-249 days 250 days andOver No Response

29
10. Average Patients Treated Per Day
In an average day, how many patients would you, as the dentist, treat?
Atlantic dentists have historically treated a slightly higher on average number of patientsper day than other regions. However, in 2018, Atlantic, Quebec and Ontario dentist wererelatively equal. Western respondents tended to treat more patients in the 15+ per dayranges.
Unlike last year, where a higher number ofspecialists responded, the GP/Specialist split onresponse has returned to historical norms. In 2017,comparisons were difficult as Orthodontists, forexample, treat a far higher number of patients perday than the average GP, while Oral Surgeons maytreat less. For 2018, it appears the trend towardstreating fewer patients per day has continued with89% of 2018 respondents stating they treated lessthan 15 patients a day (as opposed to 83% in 2017and an average of 78.6% over the last five years).
On an overall basis, dentists treated 11.3 patients inan average day comparable to the average of 12.5patients over the last ten years.
5 or less patients5%
6-10patients
62%
11-14 patients22%15-20 patients7%Over 20 patients5%
No Response0%

30
11. Hygiene Days
How many hygiene days do you have per week?
Despite a blip last year, those with three or more hygiene days per week has returned topast norms, levelled off again as it did the previous three years prior to 2017. Forty-sixpercent of respondents in 2018 had 5 or more hygiene days per week (as compared to 44% lastyear; 40% in 2016 and the average of 38.6% the last ten years), while 20% had 4 hygiene daysper week (slightly lower than the 23% in 2017 but in line with the average of 23.8% from2007-2016). The rates for those having one, two or three hygiene days per week hasreturned to historical norms of the 8% - 10% average over the last ten years.
8% 9% 10%20%
46%
7%1 day 2 days 3 days 4 days 5 or more days No Response

31
12. Demographic Shift in the Practice ProfileBeginning with the addition of a number of new questions in 2007-2008, an effort wasstarted to track the change, if any, in the “demographic profile” of the Canadian dentalpractice based on survey respondents’ answers. We now have ten years of data in manyprofile areas allowing some meaningful trend analysis over a period of time (as opposed tosingle year variances that may only be representative of a change in the mix of respondentsthat year or a short term shock to the marketplace). Beginning in 2016, a new dynamic hasbeen introduced with a change to on-line survey administration, yet many of the profilesgenerated remain the same: There are now more dentists per practice on average. The number of hygiene days per practice is increasing overall (with more days beingadded by those who only had one or two per week previously)We now see additional trends developing over the past few years: There are a growing percentage of respondents describing their location as Urban(now 62% as compared to 56% last year and 51% in 2016) (average of 53% overpast ten years). The drop off is in Suburban locations (falling to 22% from 29% lastyear and an average of 25% over the past 10 years) while Rural percentages havestayed relatively consistent over the past few surveys at 12% (but down from 17%average the past ten years). This result may be due to the growing number ofassociates answering the survey and/or a still “younger” demographic than surveysconducted earlier in the decade. There are still more operatories per practice then in the past but growth is slowingin the larger “4 or more operatory” practice. The percentage of those with “5 ormore operatories” has stabilized at around 26%. While only tracked for the past two years, there does seem to be a trend developingthat roughly 75% of respondents do not plan to add more operatories to thepractice over the next two years. However, it appears increasing percentages doplan to add 2 or 3 operatories, if they do move ahead with expansion. The trend towards treating fewer patients per day has continued with 89% treatingless than 15 patients a day. On average, dentists treated 11.3 patients a day in 2018as compared to the average 12.5 patients over the past 10 years.The trend for recent graduates to take longer to set up their practices has changed back tohistorical norms this year, perhaps been reinforced by a younger respondent demographic,more Urban practices reporting and a greater number of Associates responding.The percentage for newer graduates (0-3 years) setting up in practice within the first 3years has been dropping steadily since 2008, from around 40% at that time to 11% in2013. As might be expected, there was also a movement to a later set-up in the 4-9 years in

32
practice group, who have shown a tendency to delay until their 4th to 9th years in practice,although a far higher percentage of this group were able to set up in their first three years.As we move up the scale in terms of years in practice, we see that noticeably higherpercentages of these “older” groups were able to set up their own practice within 3 years ofactually joining the profession (50 – 65% of those over 20 years in practice).In 2014, we saw what appeared to be a switch back to historical norms with 40% of the 0-3year in practice respondents setting up in practice. However, on closer inspection, this wasa direct result of the older demographic profile of the new online respondents. In 2015, weagain saw a decline in the 0-3 results down to 29.4% setting up in their first three yearsand corresponding drops in those with longer times in dentistry. In 2016, 0-3 year resultsbasically stabilized at around 30%. At the same time, fewer and fewer dentists who havebeen practicing dentistry for 4-9 or 10-15 years were able to set up within the first threeyears, as the trend moved out over time. As the respondents length of time in the industrygrows, so too does the likelihood that they were able to set up their practice within theirfirst three years in the industry. In 2017, we saw a return to historical norms with a moreeven distribution of response as it was in 2015 and earlier. In 2018, the same historicalpattern remains but with a return to the decline in the 0-3 results (down to 22.7%) settingup in their first three years and corresponding drops in 4-9 and 10-15 years in dentistry.Length of Years to Set-up Practice by Years in Practice 2018
23%30% 24%
54% 50% 49%34% 38%
19% 20% 11%6%23% 10% 8%
0%10%20%30%40%50%60%70%80%90%
0-3 4 to 9 10 to 15 16 to 20 21 to 25 26+
10th Year & Over4th to 9th YearFirst 3 years
Years in Practice
Years to Setup Practice

33
Years to Set-up Practice Years in Practice2018 0-3 4 to 9 10 to 15 16 to 20 21 to 25 26+First 3 years 22.7 29.8 24.3 41.0 50.0 48.94th to 9th Year 0.0 34.0 37.9 19.2 19.8 10.710 Year & Over 0.0 0.0 6.1 23.1 10.3 8.32017 0-3 4 to 9 10 to 15 16 to 20 21 to 25 26+First 3 years 29.0 38.6 39.1 47.9 42.9 53.34th to 9th Year 0.0 27.2 36.2 16.7 12.7 17.710 Year & Over 0.0 0.0 5.8 15.6 11.1 8.9
2016 0-3 4 to 9 10 to 15 16 to 20 21 to 25 26+First 3 years 33.3 18.8 35.5 56.5 57.7 44.44th to 9th Year 0.0 24.9 44.7 29.0 7.6 22.210 Year & Over 0.0 0.0 5.3 4.8 7.7 33.3
2015 0-3 4 to 9 10 to 15 16 to 20 21 to 25 26+First 3 years 29.4 36.1 26.3 21.0 35.7 52.24th to 9th Year 0.0 36.1 29.0 42.1 38.0 16.310 Year & Over 0.0 0.0 18.4 10.5 19.0 7.7
2014 0-3 4 to 9 10 to 15 16 to 20 21 to 25 26+First 3 years 40.0 46.7 44.0 42.1 45.8 60.44th to 9th Year 0.0 23.3 35.3 31.7 31.4 13.710 Year & Over 0.0 0.0 2.9 13.2 10.4 5.52013 0-3 4 to 9 10 to 15 16 to 20 21 to 25 26+First 3 years 11.1 34.2 45.7 42.0 52.9 55.44th to 9th Year 0.0 43.8 23.0 38.7 25.5 10.910 Year & Over 0.0 0.0 8.6 9.7 9.8 8.32012 0-3 4 to 9 10 to 15 16 to 20 21 to 25 26+First 3 years 18.2 29.2 33.4 34.4 51.2 58.84th to 9th Year 0.0 41.8 30.0 18.8 13.9 18.210 Year & Over 0.0 0.0 13.3 15.6 11.6 5.62011 0-3 4 to 9 10 to 15 16 to 20 21 to 25 26+First 3 years 22.2 41.9 12.5 47.3 50.0 64.24th to 9th Year 0.0 23.3 45.8 16.8 34.2 10.810 Year & Over 0.0 0.0 4.2 11.1 7.9 2.42010 0-3 4 to 9 10 to 15 16 to 20 21 to 25 26+First 3 years 45.5 50.0 25.1 56.3 55.3 58.74th to 9th Year 0.0 17.9 47.0 15.6 23.4 13.010 Year & Over 0.0 0.0 6.3 9.4 8.5 8.5
34
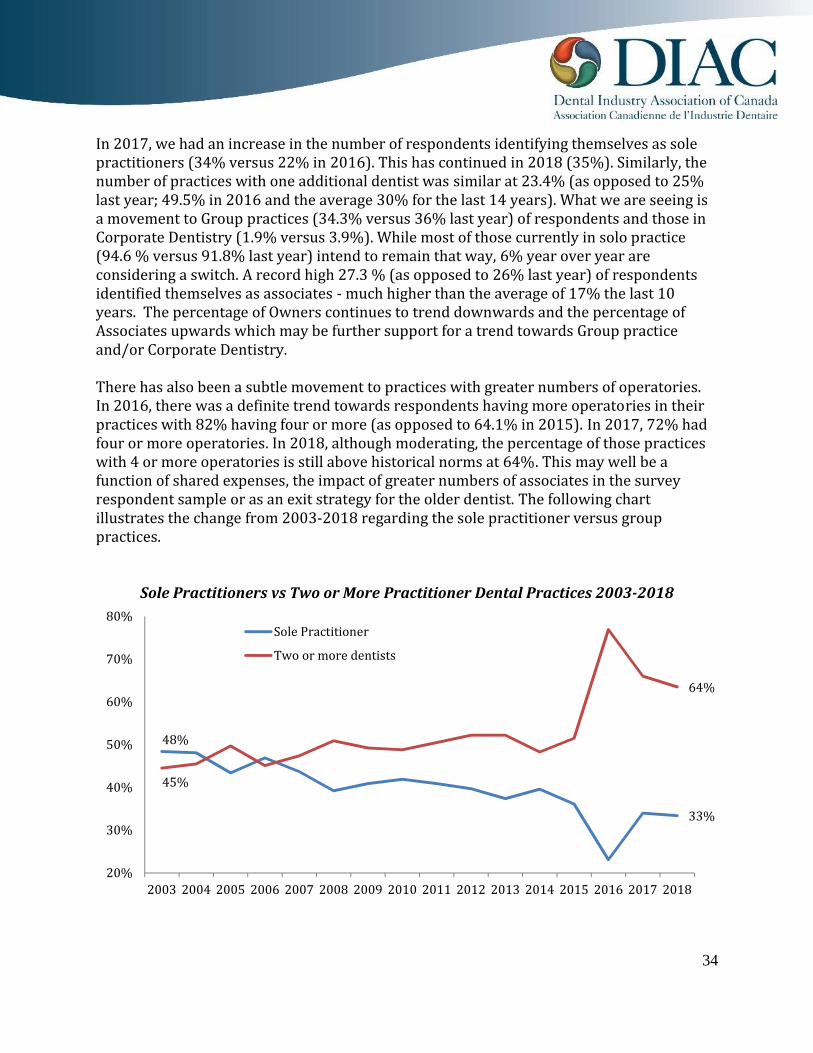
In 2017, we had an increase in the number of respondents identifying themselves as solepractitioners (34% versus 22% in 2016). This has continued in 2018 (35%). Similarly, thenumber of practices with one additional dentist was similar at 23.4% (as opposed to 25%last year; 49.5% in 2016 and the average 30% for the last 14 years). What we are seeing isa movement to Group practices (34.3% versus 36% last year) of respondents and those inCorporate Dentistry (1.9% versus 3.9%). While most of those currently in solo practice(94.6 % versus 91.8% last year) intend to remain that way, 6% year over year areconsidering a switch. A record high 27.3 % (as opposed to 26% last year) of respondentsidentified themselves as associates - much higher than the average of 17% the last 10years. The percentage of Owners continues to trend downwards and the percentage ofAssociates upwards which may be further support for a trend towards Group practiceand/or Corporate Dentistry.There has also been a subtle movement to practices with greater numbers of operatories.In 2016, there was a definite trend towards respondents having more operatories in theirpractices with 82% having four or more (as opposed to 64.1% in 2015). In 2017, 72% hadfour or more operatories. In 2018, although moderating, the percentage of those practiceswith 4 or more operatories is still above historical norms at 64%. This may well be afunction of shared expenses, the impact of greater numbers of associates in the surveyrespondent sample or as an exit strategy for the older dentist. The following chartillustrates the change from 2003-2018 regarding the sole practitioner versus grouppractices.Sole Practitioners vs Two or More Practitioner Dental Practices 2003-2018
48%33%45%
64%
20%30%40%50%60%70%80%
2003 2004 2005 2006 2007 2008 2009 2010 2011 2012 2013 2014 2015 2016 2017 2018
Sole PractitionerTwo or more dentists

35
B. Product Purchases and Usage
B.1 Dental Equipment
1. Stage of Office Digitization and Areas Digitized
What stage of ‘digitization’ has your office reached currently?
2017% 2018%
Fully paperless 37.3 32.7Not paperless 37.0 33.7In transition to paperless 25.7 33.7
The former questions “Do you have computer terminals in youroperatories?” AND “If plan to purchase, when?” asked in previoussurveys were revised in 2017 to new questions reflecting theimpact of digitization on the dental office.Respondents in 2017 and 2018 were now asked “What stage of‘digitization’ has your office reached currently?” with suppliedresponse options: Fully paperless, Not paperless, and In transitionto paperless. This was then augmented with a second question“Which areas of your office are digitized? (Please check off all thatapply)” with supplied response options: Charting, X-Ray, In theoperatories, and In the Private Office.In 2018, response was evenly split between Fully paperless(33%); Not paperless (34%) and In transition to paperless (34%).As with 2017, the overall trend is towards the paperless officewith 63% -66% either there now or moving there.

36
Which areas of your office are digitized? (Please check off all that apply)
2017% 2018%
X-Ray 84.5 86.7In the operatories 64.2 66.4In the Private Office 60.3 61.6Charting 52.8 53.4As might be expected, X-Ray was once again the top area digitized today but all areas wereover 50% (and increasing). Charting was the least likely to be digitized today at 53%.
32.7
33.7
33.7
Stage of "Digitization - 2018%
Fully paperlessNot paperlessIn transition to paperless
87% 66% 62% 53%
X-Ray In the operatories In the Private Office Charting

37
2. Utilization of Clinical Portion of Practice Management Software
For those with the applicable systems, are you utilizing the clinical portion of your practicemanagement software (i.e., in the operatory for the charting of treatment)?In 2016, almost three-quarters of respondents (73.9%) stated they were currently usingthe clinical portion of their practice management software. This was a real departure frompast results as compared to the 45% reported in 2015 (with a previous all-time high of45.5% in 2013 and up from 37.9% last year and the original 14.9% back in 2000). In 2017,this dropped back a bit to 59%, still higher than historical numbers and probably more inkeeping with a slower increase in adoption shown over the past decade,In 2018, those currently using declined at bit at 57% but those planning to use continuedits climb to 32% (above the ten-year average of 28.2%). Those stating they don’t plan touse the clinical portion of their practice management software continued to decline at 11%(compared to 16% last year).The higher percentages of Use and Plan to Use over the past few years are undoubtedly theresult of the on-line survey administration methodology (respondents predisposed to theuse of computerization) as well as the possible “younger” overall demographic of therespondent base.
Utilization of Clinical Portion of Practice Management Software 2006-2018
28%
57%
31% 32%42%
11%0%10%20%30%40%50%60%70%80%
2006 2007 2008 2009 2010 2011 2012 2013 2014 2015 2016 2017 2018Currently Using Planning To Use Don't Plan To Use

38
Western (60%) and Ontario respondents (56%) were slightly more inclined to use theclinical portion while Atlantic (52%) and Quebec (47%) practitioners were less inclined.The majority of this year’s respondents who stated they plan to eventually use the clinicalportion of their software, plan to use it “soon” (50%) or when more productive (50%).Of those who don’t plan on using the clinical portion of their software, the most commonreason given was overwhelmingly “satisfied with current system” (85%) followed byReliability (5%) and Not Flexible Enough (5%). “Paper is easier” (41% in 2015 and the topreason for all but one of the past twelve years) was not mentioned in 2018 (although thatmay be the “current system”). Popular answers from previous surveys like retiring andCost were also not mentioned at all, again illustrating the impact of the new surveyadministration methodology.3. Dental Equipment Currently Owned and/or Plan to Buy
Which of the following equipment do you currently ownand/or plan to buy in the next two years?Respondents were first asked to identify whether theyowned particular types of equipment today. Multipleresponses were allowed and, in fact, most respondentsindicated more than one category. A new responseoption “Electric Handpiece” was added back into thelist of options in 2017 (was removed in 2011) for allquestions in this section. For the 2011 survey year,Caries Detection was removed replaced by DigitalImpression System and Cone Beam ComputedTomography.In general, 2018 respondents were more likely toselect more items, either as owning now or planningto purchase in the future.

39
Dental Equipment Own Today
1 Formerly worded as Integrated Office System2 Formerly worded as Office Management SystemThe same items had consistently ranked as the top three owned (albeit not always in thesame order) in surveys from 1998 to 2016. This year, the Electric Handpiece re-added in2017 was second highest at 71%, otherwise the order was the same as the previous twoyears. Digital Radiography (82%) was again the top item (same as 80% last year, 69% in2015, 63% in 2014 and representing a steady increase in ownership from 2.6% in 2000),followed by Electric Handpiece, then by a tie between Integrated Clinical & ManagementComputerized System (67%) (63% last year, 66% in 2016 and 56% in 2015) and Intra-OralCamera (67%) (63% last year, 72 % in 2016 and steadily increasing in ownership from34.6% in 2000).Office Management-only Computerized System (51%) was fifth (an average of 50% the lastten years). This was followed by Laser (Soft Tissue Management) (43%) (year-over-yearsteady increases from 10.4% in 2007) and Interactive Patient Education System at 28%. Ofthe two new categories introduced in 2011, Digital Impression System ownership stayedthe same at 21% (up from 6.2% in 2011). Cone Beam Computed Tomography was also upat 11% ownership (up from 2.5% in 2011). Laser (Hard and Soft Tissue Mgt) was thelowest at 9% in keeping with historical trends.
82%71%67%67%51%43%27%21%16%11%9%
Digital RadiographyElectric HandpieceIntegrated Clinical & Mgt Computer Sys1Intra-Oral CameraOffice Mgt-only Computerized System2Laser (Soft Tissue Mgt)Interactive Patient Education SystemDigital Impression SystemChair Side Cad-Cam (fixed restorations)Cone Beam Computed TomographyLaser (Hard and Soft Tissue Mgt)

40
Dental Equipment Plan to Buy
Respondents were then asked to identify the pieces of equipment they planned to buywithin the next two years. Again, multiple responses were allowed. Again this year, the topchoice was Digital Impression System at 35% (up from 30% last year and. Up from the 26%average over the past 7 years). Electric Handpiece took a huge jump from 11% last year to29% and second place this year. Otherwise the order of popularity in items was much thesame as in 2017. Interactive Patient Education System is now third at 20% (17% in 2016).Cone Beam Computed Tomography (19%) was fourth most popular.Chair Side CAD-CAM has remained around its historical norm at 16% followed by Laser(Soft Tissue Management) (16%). Laser (Hard and Soft Tissue Mgt) jumped to 16% from8% last year, followed by Intra-Oral Camera (13% as it was in 2017 and 2016). IntegratedClinical & Management Computerized System was next at 10% (9% in 2016). DigitalRadiography continues to trend down from a high of 31% in 2007 and is now at 10%. Ofcourse, this also reflects the on-going growth in actual ownership for this equipment. OfficeManagement-only Computerized System was the final choice at 6% (3% last year), againbecause of actual current ownership.
35%29%20%20%16%16%16%13%10%10%6%
Digital Impression SystemElectric HandpieceInteractive Patient Education SystemCone Beam Computed TomographyChair Side Cad-Cam (fixed restorations)Laser (Soft Tissue Mgt)Laser (Hard and Soft Tissue Mgt)Intra-Oral CameraIntegrated Clinical & Mgt Computer Sys.1Digital RadiographyOffice Mgt-only Computerized System2
41
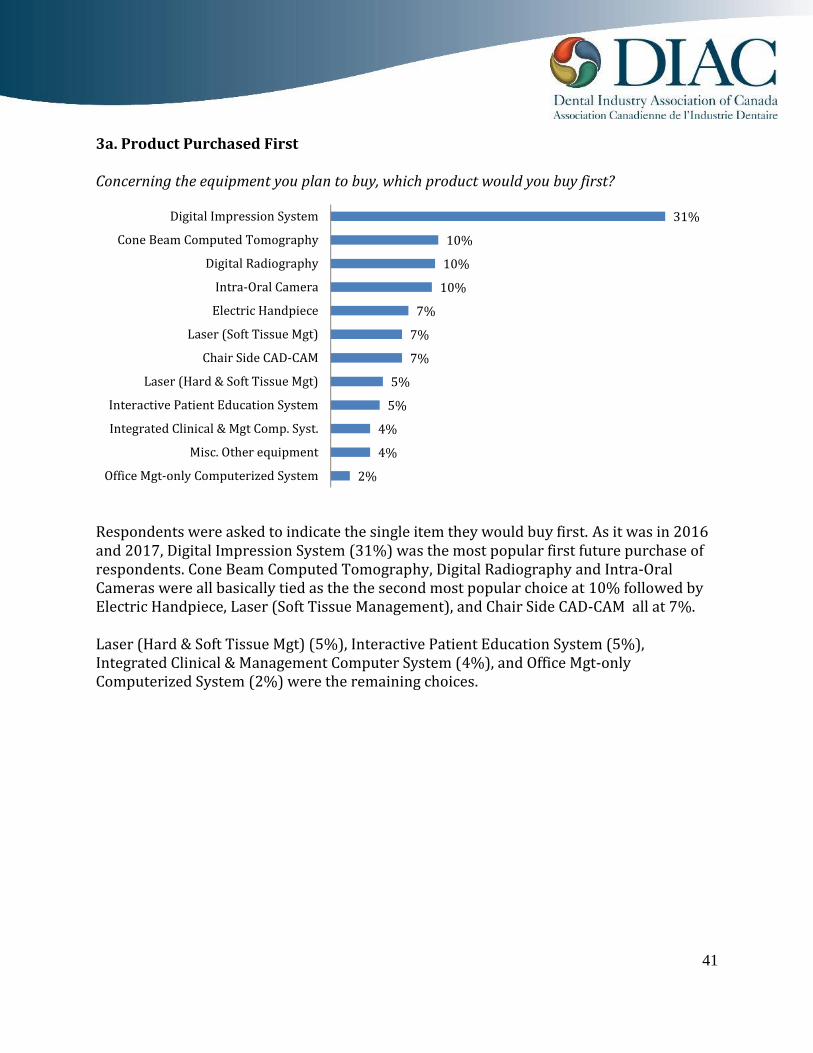
3a. Product Purchased First
Concerning the equipment you plan to buy, which product would you buy first?
Respondents were asked to indicate the single item they would buy first. As it was in 2016and 2017, Digital Impression System (31%) was the most popular first future purchase ofrespondents. Cone Beam Computed Tomography, Digital Radiography and Intra-OralCameras were all basically tied as the the second most popular choice at 10% followed byElectric Handpiece, Laser (Soft Tissue Management), and Chair Side CAD-CAM all at 7%.Laser (Hard & Soft Tissue Mgt) (5%), Interactive Patient Education System (5%),Integrated Clinical & Management Computer System (4%), and Office Mgt-onlyComputerized System (2%) were the remaining choices.
31%10%10%10%7%7%7%5%5%4%4%2%
Digital Impression SystemCone Beam Computed TomographyDigital RadiographyIntra-Oral CameraElectric HandpieceLaser (Soft Tissue Mgt)Chair Side CAD-CAMLaser (Hard & Soft Tissue Mgt)Interactive Patient Education SystemIntegrated Clinical & Mgt Comp. Syst.Misc. Other equipmentOffice Mgt-only Computerized System

42
3b. Product Purchased Second
Which product would you buy second?
Respondents were then asked to indicate the single item they would buy second. As hasbeen the case with past surveys, a significantly lower number (approximately 41%) ofrespondents answered this question versus a 62% response rate for the product theywould purchase first. However, as with 2016 and 2017, significantly more respondentsoverall specified a product for both parts of this question as opposed to previous years.The most popular “second purchase choice” in 2018 was Digital Impression System (16%)(18% in 2017 and 11.3% in 2016). Electric Handpiece jumped to second place at 14% (9%in 2017). Chair Side CAD-CAM was again third at 13% (12% in 2017 and up from anaverage of 6.5% the previous ten years), followed by Interactive Patient Education System(12%) (14% in 2017). Cone Beam Computed Tomography (2015’s first place and secondin 2016) were at a rounded 9% as was Laser (Soft Tissue Management), followed by Intra-Oral Cameras (7.3%) (11% in both 2016 and 2017) and Laser (Hard and Soft TissueManagement) (6.5%). Integrated Clinical & Management Computerized System (5%),Digital Radiography (4% and continuing a downward trend since it was number one withan average of 20.7% from 2007-2009), Misc. Other equipment (3%) and OfficeManagement-only Computer (2%) were the remaining choices.
16%14%13%12%9%9%7%7%5%4%3%2%
Digital Impression SystemElectric HandpieceChair Side CAD-CAMInteractive Patient Education SystemLaser (Soft Tissue Mgt)Cone Beam Computed TomographyIntra-Oral CameraLaser (Hard & Soft Tissue Mgt)Integrated Clinical & Mgt Comp. Syst.Digital RadiographyMisc. Other equipmentOffice Management-only Computer

43
4a. Preferred Equipment Service Provider
Who is your preferred equipment service provider?
The vast majority of respondents in 2018 preferred a Full Service Dealer (86%)(comparable to the average of 85% for the last nine years), while 9% preferred anIndependent Technician (also the same average as the last nine years) and 5% favoured theManufacturer (continuing an upward trend over the six years previous to 2017 growingfrom 1.9% in 2011).Atlantic (94%) and West (89%) were more likely to use a Full Service Dealer than otherregions. Ontario (11%) returned to being the top region using an Independent Technicianas it had been nine out of the ten years prior to 2017 and the top region using theManufacturer (7%). After a 19% reading in 2017 for Quebec use of an IndependentTechnician, this reading reverted back to historical norms in 2018 at 7%.
Full ServiceDealer
86% IndependentTechnician9%Manufacturer5%

44
4b. Preferred Equipment Service Provider – Service Contract or As Needed
Do you prefer a service contract, to have service as needed or other?
In 2016, there was almost a 50/50 split on the question of preferring a service contract orto have service as needed. For 2017 and 2018, response appears to have returned tohistorical norms. In 2015, over sixty percent (62.4%) (up from 60.1% in 2014, 59.5% in2013 and 61% in 2012 and an average of 57.3% from 2007-2011) of respondents overallpreferred to have service as needed, while 32.7% preferred a service contract (the exactsame average as the previous four years and similar to the average of 34.3% from 2007-2010). For 2018, a new all-time high of 64% of respondents preferred service as neededwhile 36% preferred a service contract.Quebec (56%) respondents were more likely to have a service contract again this year. Ineight of the last nine years, Quebec respondents have been most likely to have a servicecontract. On the other hand, Atlantic (65%), Western (59%) and Ontario (57%)respondents were more likely to have service as needed.
to haveservice asneeded63.9%
a servicecontract36.1%

45
B.2 Sundries/Consumable Products
Source for Sundry/Consumable Purchases
Preferred Source
What approximate percentage of your current sundries/consumables (e.g., paper products,impression material, amalgam, restoratives, cements, diamonds, etc.) purchases do you makefrom the following sources? What would you expect these percentages to be two years fromnow?Respondents were asked to state the percentage of their sundries/consumables theypurchased from particular sources today and what they expected those percentages to betwo years from now. The detailed percentage breakdown of response in 10% ranges bysource is provided in the APPENDIX attached to this report. However, the average responseby source (0out of 10) is a more valuable indication of dentist buying habits.
Average Response by Source for Sundries/ConsumablesCurrent2006 2007 2008 2009 2010 2011 2012 2013 2014 2015 2016 2017 2018Full Service Dealer 9.11 9.19 9.13 9.09 8.77 8.92 9.06 9.07 8.99 9.22 9.17 9.02 8.99Consumables Only Dealer NR NR NR NR NR 1.98 2.11 1.98 2.07 2.11 1.87 2.09 2.07Grey Market Dealer NR NR NR 1.14 1.24 1.38 1.19 1.19 1.22 1.18 1.21 1.25 1.22Cooperative Buying Group 1.26 2.25 2.27 2.23 1.13 1.17 1.15 1.21 1.15 1.09 1.09 1.16 1.15Mail Order 2.20 2.15 2.20 1.96 1.49 1.34 1.27 1.38 1.31 1.20 1.27 1.21 1.31Direct From Manufacturer 1.86 1.80 1.78 1.84 1.68 1.66 1.69 1.65 1.70 1.61 1.61 1.80 1.70

46
In 2 Years2006 2007 2008 2009 2010 2011 2012 2013 2014 2015 2016 2017 2018Full Service Dealer 8.72 8.81 8.76 8.80 8.50 8.67 8.81 8.82 8.71 8.93 8.26 8.65 8.71Consumables Only Dealer NR NR NR NR NR 2.01 2.12 1.99 2.09 2.22 2.08 2.13 2.09Grey Market Dealer NR NR NR 1.17 1.27 1.39 1.19 1.23 1.22 1.16 1.22 1.28 1.22Cooperative Buying Group 1.33 2.37 2.37 2.45 1.23 1.25 1.23 1.21 1.18 1.20 1.29 1.29 1.18Mail Order 2.31 2.26 2.36 2.01 1.52 1.40 1.34 1.47 1.35 1.20 1.42 1.33 1.35Direct From Manufacturer 2.06 1.94 1.88 1.96 1.78 1.75 1.75 1.71 1.81 1.67 2.08 1.88 1.81These results show the general pattern of preference by type of supply outlet since the2005 study. For the 2011 survey, Consumables Only Dealer was added to the list ofresponse categories and Other Authorized Dealer removed as a category. In 2007, Co-operative was added, while Grey Market Dealer was added as a new response category forthe 2009 survey. Buying Group and Co-operative were merged into one category in 2010(Please note: results from 2007 to 2009 for “Cooperative Buying Group” have inflatedvalues as they have been combined for year-to-year comparison purposes). This year, asthey have since 1998, the Full Service Dealer accounts for the majority of current productpurchases. In general, the same pattern of response as in previous years applies to 2018 forcurrent purchases.The second part of the question regarding respondents expected preferred source in twoyears’ time both confirms the Full Service Dealers dominance and still presents the sameinteresting paradox as outlined earlier in previous reports (although the types of sourcehave varied as the options provided have varied).Although the rating for Full Service Dealer has returned to historical norms in 2017 (andcontinues to do so in 2018), when comparing the individual survey response (currentversus expected future source in any given year) over the years, it would appear that somesmall percentage of dentists expect to be utilizing a source other than Full Service Dealer intwo years (it would appear the significant drop in the 2016 reading for Full Service Dealerswas in fact an anomaly, possibly due to the smaller respondent count and the differentsurvey administration methodology that year). The results for Cooperative Buying Group,Mail Order and Direct from Manufacturer (a significant increase) show an expectedincrease in share in two years. Yet, in terms of their actual current buying behaviour, aconsistently large share of dentists buy from Full Service Dealers with correspondingsmaller shares for Consumables Only Dealers, Cooperative Buying Group, Mail Order andDirect from Manufacturer. The paradox is why some respondents continue to feel (evenwith the new demographic profile) they will change purchase source in the future and yetdo not do so. The answer may lie later in this section where they continue to give “price” asthe driving force behind a desire to change when asked for their reason. The factor ofpurchases from multiple sources should also be kept in mind.

47
Looking at the average response habits on a regional basis, there appears to be a localizeddifference in terms of dentist buying habits.Current In 2 YearsAtlantic Quebec Ontario West Atlantic Quebec Ontario WestFull Service Dealer 9.05 8.10 8.59 9.46 9.29 7.64 8.21 8.68Consumables Only Dealer 1.82 2.64 2.46 1.77 1.91 2.55 2.45 1.81Grey Market Dealer 1.12 1.55 1.27 1.24 1.12 1.53 1.20 1.15Cooperative Buying Group 1.03 1.02 1.22 1.09 1.03 1.24 1.28 1.50Mail Order 1.09 1.43 1.36 1.27 1.18 1.47 1.47 1.51Direct From Manufacturer 1.58 1.90 1.70 1.91 1.64 2.00 1.73 1.93Today, the Full Service Dealer still accounts for the majority of product purchases in allregions. In all study periods from 2000 - 2017 (no regional analysis was completed in2005), Full Service Dealers were far more popular in Atlantic than other regions. However,in 2018, the West gave Full Service Dealers the highest rating (9.46) of any Region. In thenext two years, all regions (except the Atlantic where it actually increased) expect the FullService Dealers’ market share to erode substantially with corresponding increases in sharefor other purchase options varying from Region to Region. This drop in share is mostnoticeable in the West and Quebec Regions.Western and Quebec dentists are more likely to deal directly from the manufacturer todaythan dentists in other regions. Cooperative Buying Groups (combined as one category in2010) were much more evident in Ontario (where they were most evident over the fiveyears prior to 2016), replacing the West from last year. Grey Market Dealers are still farmore apparent in Quebec (both now and in two years) and Consumables Only Dealer (anew category in 2011), appears to be less popular in the Maritimes and the West than inother regions, as in the past.Number of Companies Dealt With Monthly (Highest Percentage Source)
Considering your highest percentage purchase source identified above, how many companiesof this type do you deal with in an average month?Only two respondents failed to answered this question in 2018 (response rate has rangedfrom 95% - 100% the last nine years). Almost a third (29%) deal with one companyexclusively. Another 39% deal with 2 companies (as with the average of 39% the last tenyears), 18% deal with 3 companies (22% last year) and 13% deal with 4 or morecompanies in an average month (up from 10% last year). This final percentage continuesto increase significantly from 5.7% in 2016 and may indicate a trend to dealing with moresuppliers. As with other areas of the survey, these results must be watched closely over anumber of future surveys to see if, in fact, a trend is occurring.

48
Regionally, Western dentists (36%) were most likely to use one company exclusively.Ontario dentists were most likely to use four or more (16%) as they were last year (15%).Atlantic practitioners were far more likely to use two (53% as opposed to 57% last year).
Reasons for Purchasing From Current Preferred Supplier
What is your main reason for purchasing from your current preferred supplier?This question was added to the 2006 survey to uncover the reason for the paradoxmentioned earlier (i.e., why do some respondents feel they will change purchase source inthe future and yet do not actually do so when that time arrives).
29%39%
18% 13%0%5%10%15%20%25%30%35%40%45%
1 2 3 4+Number of Companies

49
All dentists answered this question. For the tenth consecutive year, the most commonreason given by respondents for purchasing from their current supplier was “good service”at 21%. Price was second at 16% (same as last year and the same average from theprevious ten studies). This was followed by last year’s #2 convenience/saves time at 14.8%(up from last year’s 18% and an average of 11.8% the last ten years). Sales representative(14.6%) (comparable to average of 11% the past ten years) was fourth, and goodrelationship fifth (13%) (up from an average of 7.1% from 2006-2017). There is then asubstantial drop-off in response percentages. Therefore, it still appears the added value interms of service, convenience and personal sales calls overrides the perceived “priceadvantage” when it comes time to actually make the decision to change purchase source.Reasons for Expecting Change in Source Percentages
If you anticipate any changes in these percentages over the next two years, why do you feelthis will occur?As in all previous studies, price (27%) remains one of the main driving forces behind anexpected change in source. However, in 2016, 2017 and now 2018, “Good Service” was themost popular single reason at 51% (46.9% in 2017 and 39.7% in 2016) given byrespondents. Based on responses to other questions in the survey, it is projected thatrespondents were actually saying their service is good now and they wouldn’t be changingsuppliers.
21%16%15%15%13%4%3%3%2%2%2%1%1%1%
Good servicePriceConvenience/saves timeSales representativeGood relationshipHave contractReliabilityDeliveryProduct availabilityProduct qualityCustomer/technical supportDiscount on Bulk OrdersEase of orderingKnowledge

50
“Computerized/ Internet orders” (8.1%) returned to historical norms while “Manufacturercutting out middleman” dropped to 2.3% from 5.9%. Beyond that, the other reasonsoffered really only reflected the opinions of a few respondents.Ordering Method
Preferred Ordering MethodDentists were asked to profile how they presently order their sundries/consumables andhow they expect to be ordering them in two years.Approximately what current percentage of your sundries/consumables is ordered from yoursales representative, by telephone, by fax, through dealer purchased software or by theInternet? What would you expect these percentages to be in two years?Again, the detailed percentage breakdown of response in 10% ranges by method over thepast three years is provided in the APPENDIX attached to this report. However, the averageresponse by method is a more valuable comparative reading of dentist ordering habits.Current2009 2010 2011 2012 2013 2014 2015 2016 2017 2018From your sales representative 4.59 4.32 4.53 4.68 4.13 4.37 4.55 4.49 4.15 4.64By Telephone 5.94 6.15 5.70 5.73 5.92 5.38 5.07 4.87 4.50 4.12By Fax 1.50 1.43 1.37 1.36 1.34 1.35 1.15 1.07 1.10 1.14Through Dealer PurchaseSoftware 1.54 1.70 1.62 1.50 1.66 1.71 1.98 1.87 2.18 2.06By Internet 1.79 1.69 2.13 2.08 2.30 2.55 2.66 3.07 3.60 3.49In 2 Years2009 2010 2011 2012 2013 2014 2015 2016 2017 2018From your sales representative 4.20 3.89 4.10 4.36 3.89 4.12 4.26 4.08 3.91 4.10By Telephone 5.34 5.66 5.03 5.19 5.30 4.83 4.49 3.66 3.89 3.42By Fax 1.40 1.40 1.34 1.30 1.37 1.31 1.14 1.03 1.19 1.10Through Dealer PurchaseSoftware 1.76 1.93 1.86 1.70 1.89 1.92 1.98 1.96 2.28 2.40By Internet 2.59 2.40 2.92 2.79 2.90 3.18 3.51 4.58 4.43 4.35While there were small variances in the actual average responses over the last twentyyears, the overall pattern of response remained the same. In 2018 however, for the firsttime, ordering via the sales representative was the preferred method dropping the former#1 - Telephone – to second place. This result was not unexpected, as the use of telephoneand fax were expected to decline and had in fact done so for the last nine years. However, itwas expected that Internet-related ordering would replace them, not the Sales Rep.
51
In absolute terms from the detailed percentage responses in APPENDIX A, the percentageof respondents expecting to use their sales rep for ordering dropped from 76% to 70% twoyears from now and telephone from 73% to 59%.Much of this shift may be due to the other major change in ordering procedure — thecombined increase in the use of computer as an ordering tool, either through dealerpurchase software (replacing the By Computer category) or more prominently, through theInternet in general.This is also clear from the detailed percentage responses. While a steady 22.3%(comparable to21.2% last year, 18.8% in 2016, and up from 15.1% in 2014) of dentistsstate they use Dealer purchase software to order today and increasing to 27% within twoyears, the number of dentists ordering via the Internet is expected to grow from 53 to 64%two years from now. This is a big change from the 42.9% using the Internet in 2016, Onceagain, this change in opinion is undoubtedly due to the change in survey administrationmethodology and respondents being predisposed to use of computerized systems.However it is evident there continues to be a strong trend in increased Internet orderingversus computer-based EDI-type systems.It should be noted that most respondents gave multiple answers to this question, indicatinga variety of ordering methods are used by the individual dentist.Current In 2 YearsAtlantic Quebec Ontario West Atlantic Quebec Ontario WestFrom your sales rep. 3.38 4.05 4.17 5.69 3.50 3.53 3.65 4.98By Telephone 3.85 4.57 4.66 3.40 3.03 3.26 3.86 3.05By Fax 1.00 1.02 1.13 1.21 1.09 1.02 1.11 1.13Through DealerPurchase Software 2.42 1.66 2.19 1.99 2.70 2.25 2.50 2.27By Internet 4.97 3.88 3.49 3.03 5.61 5.12 4.30 4.84The same general pattern of response is evident on a regional basis; however, there aresignificant differences in average percentages of response.As has been the case since 2000, the use of the Telephone as an ordering method is muchmore popular in Ontario (4.66), Quebec (4.57) and the Maritimes (3.85) than in the West(3.40). The use of a sales representative is again much more prevalent in the West. The useof the Internet is also more popular in the Maritimes than in the other regions. The use ofInternet is particularly unpopular in the West today (3.03).In two years, the use of telephone is still expected to decline across all Regions, offsetlargely by increases in Internet ordering. Generally, all regions expect a sizeable increase inInternet ordering.

52
Decision Maker on Brands Ordered
Who decides which brands of sundries/consumables are ordered for your practice?Respondents were asked whether they personally, a staff member, or both themselves anda staff member makes the decision on which brands of sundries/consumables are ordered.There has been a slight movement over the past few years towards the dentist takinggreater control with more than half (53%) (similar to the average of 53% from 2007-2017)of respondents now saying that both themselves and a staff member jointly make decisionson which brands of sundries/consumables are ordered. Correspondingly, 33% stated theypersonally make the decision (continuing the fall from 42% in 2016), while a further 13%mentioned a staff member makes this decision.Regionally, Quebec (47%) was more likely to make the decision personally than the Westand Ontario, while the Atlantic (62%) was far more likely to have Both make the decision.Decision Maker on Where Orders Are Placed
Who decides where the sundries/consumables are ordered from for your practice?Respondents were asked whether they personally, or a staff member, makes the decisionon where sundries/consumables are ordered. There is a difference between Brand selectedand Source in terms of responsibility. Only 47% (down from 2016’s all-time high 58.7 andthe same as the average of 47.1% since 2004) of respondents said that both they and a staffmember jointly make decisions on where sundries/consumables are ordered. One third(34%) stated they now personally make the decision (similar to the average of 37.3% thelast ten years), while a further 18% (up from the average of 15.2% the last ten years)mentioned a staff member makes this decision.Quebec (48%) dentists were again far more likely to make the decision personally. Atlanticand Ontario Staff members were slightly more likely to make the decision (21%) than inthe West. Atlantic (50%) and Ontario (51%) practices were also most likely to have Bothmake the decision.

53
B.3 Dental Laboratory Products
Anticipated Future Usage Trends For Specific Dental Laboratory Product CategoriesA question similar to sundries/consumables was asked regarding anticipated usage ratesfor a variety of dental laboratory products. In this case, respondents were asked whetherthey would place more, less, the same or none of a list of specific laboratory products. Forthe 2011 survey, three new categories were added: Digital Impressions for laboratoryfabrication, Fixed Orthodontic Appliances and Chairside Milled Restoration (in-office).Several categories were combined: CAD-CAM Restoration (off site) and CAD-CAMRestoration (in-office) have become CAD-CAM Restoration (completed at laboratory),Implant-supported Crowns and Implant-supported Bridges have become “Implant-supported Crown & Bridges”, and Implant-supported Full Dentures and Implant-supportedPartial Dentures were combined into “Implant-supported Dentures”. In addition, SleepApnea Appliances was changed to Snoring & Sleep Apnea Appliances.Do you see your practice placing more, less or the same number of the following types ofrestorations over the next two years?
(a) Products Expected to Increase in Frequency: 58%56%47%45%43%38%37%36%36%36%25%22%20%19%18%13%11%10%8%
Implant-supported Crowns & BridgesAll-Ceramic CrownsDigital Impressions for lab fabricationInvisalignImplant-supported DenturesAll-Ceramic BridgesCAD-CAM RestorationCeramic VeneersSnoring & Sleep Apnea AppliancesAthletic MouthguardsRemovable Orthodontic AppliancesCeramic Inlays/OnlaysChairside Milled RestorationFlexible Partial Resin DenturesFixed Orthodontic AppliancesMetal Partial DenturesFull DenturesPorcelain Fused to MetalGold Inlays/Onlays/ Full Gold Crowns
54
Due to several categories being combined, and the impact of a smaller number ofcompleted surveys, it is difficult to compare 2018 rankings and percentages to previousyears. It is really the ordering of the products that is important and not the absolutepercentage. This year however, in general, there is continuing growth of Implants as part ofa practice’s armamentarium.The Top 5 most likely products to increase were Implant-supported Crowns & Bridges(58%) (as they were last year), All-Ceramic Crowns (from laboratory) (56%), DigitalImpressions for lab fabrication (47%) (still trending upward from 25% average since2011), Invisalign (45% - continuing its steady growth from 22% in 2012) and Implant-supported Dentures (43%). The next grouping of five included All-Ceramic Bridges (38%),CAD-CAM Restoration (37%), Ceramic Veneers (36%), Snoring & Sleep Apnea Appliances(36%) (trending up since 21.7% in 2011) and Athletic Mouthguards (36%).Few dentists expect the top product categories to decrease. At worst, they expect them toremain the same.However, as in previous years, a significant percentage do not utilize Chairside MilledRestorations (65%), Fixed Orthodontic Appliances (45%), CAD-CAM Restorations (39%),Digital Impressions for lab fabrication (36%) and Invisalign (35%) (making these true YESor NO categories).One aspect which should be noted is the growing popularity of several products that thesenumbers represent. For example, almost 50% more dentists are now placing CAD-CAMRestoration (completed at laboratory) today than in 2007, as represented by the differencebetween 81% not placing in 2007 and 39% not placing in 2018.(b) Products Expected to Decrease:Only a few products are expected to actually decrease in volume with Porcelain Fused toMetal having the highest percentage of respondents at 48% (dramatically trending upwardfrom 24% in 2009). Much of the increase in this percentage might be traced to the differentyounger demographic profile of the 2018 respondents.This is followed by Gold Inlays/Onlays/Full Gold Crowns (21%), Full Dentures (20%),Metal Partial Dentures (13%), and Flexible Partial Resin Dentures (9%), basically the sameproducts as in previous years.

55
(c) Products Expected to Remain at the Same Volume:The most likely products to remain at the same volume in the opinion of respondents wereMetal Partial Dentures (58%) (Number 1 for the sixth year in a row), Athletic Mouthguards(54%) (top position in 2012), Ceramic Veneers (47%), Full Dentures (46%), FlexiblePartial Resin Dentures (42%), Gold Inlays/Onlays/Full Gold Crowns (40%), and CeramicInlays/Onlays (39%).The reading of 40% for Gold Inlays/Onlays/ Full Gold Crowns may actually reflectrespondents stating they aren’t doing any, so the situation is the same.
47%21%20%13%9%8%7%6%6%5%5%4%4%3%3%3%2%2%2%
Porcelain Fused to MetalGold Inlays/Onlays/ Full Gold CrownsFull DenturesMetal Partial DenturesFlexible Partial Resin DenturesCeramic Inlays/OnlaysAll-Ceramic CrownsFixed Orthodontic AppliancesAll-Ceramic BridgesCAD-CAM RestorationCeramic VeneersRemovable Orthodontic AppliancesChairside Milled RestorationDigital Impressions for lab fabricationImplant-supported DenturesSnoring & Sleep Apnea AppliancesAthletic MouthguardsImplant-supported Crowns & BridgesInvisalign

56
The total relatively low actual counts of respondents per laboratory product category makespecific readings very unreliable by region so regional analysis will not be presented.
58%54%47%46%42%40%39%37%35%31%31%31%29%29%28%19%19%14%12%
Metal Partial DenturesAthletic MouthguardsCeramic VeneersFull DenturesFlexible Partial Resin DenturesGold Inlays/Onlays/ Full Gold CrownsCeramic Inlays/OnlaysRemovable Orthodontic AppliancesAll-Ceramic BridgesFixed Orthodontic AppliancesPorcelain Fused to MetalImplant-supported DenturesSnoring & Sleep Apnea AppliancesImplant-supported Crowns & BridgesAll-Ceramic CrownsInvisalignCAD-CAM RestorationDigital Impressions for lab fabricationChairside Milled Restoration

57
Source of Laboratory Prescriptions Fabricated
What percentage of your laboratory prescriptions are fabricated by [the following options]?
This was a new question added to the 2009 survey. The response categories were slightlyaltered for 2011 to more accurately reflect the current market situation: Local Lab, Non-local Canadian Lab, U.S. Lab and Lab Outside North America, replacing the previouscategories of “In Province”, “Other Province”, “U.S. Labs” and “Offshore”.Almost all respondents (94.9%) (similar to the 94.3% last year, 98.6% in 2016, 96.4% in2015, 96.7% in 2014 and 94.4% in 2011) stated their prescriptions are fabricated by a“Local Lab” (in previous studies in 2009-2010, 93.5% of respondents have said laboratoryprescriptions were fabricated “In Province”.A further 24.9% used a Non-local Canadian Lab (compared to 22.6 % last year, 22.7% in2016, 22.3% 1n 2015 and 24.8% in 2011). The 2018 results for using a U.S. Lab havereturned to historical norms at 8% (compared to the past 5.4%-7% range) and 2.9%(compared to 0.5%-2% the last five years) have their prescriptions fabricated by LabOutside North America.There were no significant differences regionally. In the three studies prior to 2015, Atlanticdentists were slightly less likely to have their prescriptions fabricated locally.One of the dilemmas for the dentist in answering this question is the trend for off-shorelabs to set up local feeder lab locations and the trend for existing labs to outsourceproduction (particularly in the all-ceramic arena) to larger laboratories and/or millingcentres. This is not readily apparent to the dentist nor does the individual laboratorypublicize the fact.
95%
25% 8%3%
Local Lab Non local Canadian Lab U.S. Lab Lab Outside NorthAmerica

58
C. Financing
C.1 Leasing
1. Considered Leasing
Have you ever considered leasing equipment?
Response to this question has returned to being a YES/NO proposition as in the past. In thepast, and topped by the 2016 response of 61.1%, the majority of respondents hadconsidered leasing equipment as an option. This was in keeping with the average of about52% from 2007-2015. In 2017, this YES response fell to 44%, while NO jumped to 56%. For2018, the split in response once again mirrors that typical 50/50 split seen historically.This may well be the impact of the record high Associate Group representation in thesurvey sample this year, along with those in group practice who have only recently beenidentified. These respondents may not be in a position to consider equipment purchase.The change in “opinion” is almost entirely due to Quebec (55% for 2018 as opposed to 62%last year) and Ontario (52% versus 59%) respondents being less likely to consider leasingthis year. Atlantic practitioners remained more likely (61% both years) as did Westernrespondents (55%).
No49%
Yes51%

59
2. Main Influence on Financial Decision
Who is the main influence on your financing decision?
This was a new question for the 2011 survey. More than half (56%) (as per the average of56% the last six years) felt their Accountant was main influence in their financing decision.Only 17% (but continuing to increase from an average of 12.1% the last six years) considerDealer Rep as their main influence. Manufacturer Rep held at 4% (compared to a 0.7-5.3%range the last six years). A few (1.4%) declined to answer the question.As in previous years, there was a significant percentage of response for “Other” (21%).These overwhelmingly represent the dentist themselves, with a few mentioning “Financialadvisor”, “Business partner/associate”, “Spouse/Partner”, and various other factors such as“cost”, “cash flow”, “tax write-off”, and “personal preference”.Atlantic Quebec Ontario WestAccountant 35.3 69 56.5 57.4Dealer Rep 17.6 10.3 18.5 19.6Manufacturing Rep 0.0 10.3 3.6 3.4Other 47.1 10.3 21.4 19.6Atlantic practitioners were least likely to consider Accountant as their main influence onfinancing decision, although they were also far more likely to say “myself”. Quebecrespondents were more likely to be influenced by Manufacturer Rep than other regions.
56%
17%4%
21%
Accountant Dealer Rep Manufacturer Rep Other

60
3. Preferred Method to Access Financial Information
How do you prefer to access information about your practice financial instruments (e.g. leasestatus?)
Respondents were given a predetermined list of choices and many indicated more than onecategory. As in 2017, the most preferred method for accessing Financial Information wasOn-line/Internet (47%) (up from 44% last year and up from an average of 35.7% theprevious eight years). This was followed by Personal Visit (36% and down from 39% lastyear), Telephone at 10% (an average of 14.9% from 2008-2016) and Mail (7%) (downfrom 8% in 2017 and an average of 12 % from 2011-2016).Atlantic Quebec Ontario WestPersonal Visit 29.0 44.8 35.4 35.1Telephone 6.5 6.9 10.6 11.5On-Line/Internet 54.8 41.4 47.2 45.9Mail 9.7 6.9 6.2 7.4Other 0.0 0.0 0.6 0.0As with last year, Atlantic (29%) dentists were least likely to prefer Personal Visit whilebeing most likely by far (55%) to prefer On-Line/Internet than other regions. Quebecpractitioners showed a greater preference for Personal Visit (44%).
36%
10%
47%
7%Personal Visit Telephone On-line/Internet Mail

61
C.2 Capital FinancingBeginning with the 2017 survey, the response options offered for the questions “Whowould you approach for capital financing for each of the following (please specify source ifapplicable)?” AND “Why would you choose each of those sources you indicated above?” werechanged completely from “to purchase a practice, expand a practice or to add newequipment” to “To join a group practice”, “To join a dental service organization”, “To expanda multi-practice organization”. As past results are not comparable to those using the newresponse options, and given the change in response focus, the past results and analysis forthis section were moved to APPENDIX C – Archive and a new analysis started in its place.1. Source of Capital FinancingAll respondents were asked to identify who they would approach for capital financing for avariety of different purchases. While respondents were still offered three possible responseoptions, these were changed completely from the former “to purchase a practice, expand apractice or to add new equipment” to:
To join a group practice To join a dental service Organization To expand a multi-practice organizationAs with most financial questions, there was a relatively high non-response rate for allalternatives. However, given the specific areas being asked about, it would appear manyrespondents did not believe that these questions applied to them (I.e., no interest in thoseareas) so choose to skip them. This resulted in non-response rates around 60%.
(a) To join a group practiceThe vast majority of respondents (93% as opposed to 89% last year) stated they wouldapproach a bank (either as a general statement or by mentioning a specific institution) ifconsidering joining a group practice. Financing sources and leasing companies mentionedincluded Royal Bank (7.4%), Scotia Bank (2.5%), CIBC (0.6%) and TD Canada Trust (0.6%).Accountant was mentioned by 3.7% of respondents. Other options mentioned were Broker,Cash and Leasing Company (all only one or two respondents each).(b) To join a dental service OrganizationAgain, banks were the most common response at (95% as opposed to 83.9% last year). Themost common banking institutions mentioned for practice expansion were Royal Bank(7.1%), Scotia Bank (2.6%), TD Canada Trust (0.6%) and CIBC (0.6%). Accountant (1.3%)and Dental Supplier (1.2%), leasing companies and cash were also mentioned.

62
(c) To expand a multi-practice organizationContinuing the trend, banks were the most common response (97% versus 90% in 2017)for expanding a multi-practice organization.2. Reasons for Choosing SourceRespondents were also asked for the reasons behind their choice again based on the newresponse options: “To join a group practice, To join a dental service Organization, Toexpand a multi-practice organization”.“Why would you choose each of those sources you indicated above?”(a) To join a group practiceGood relationship (41%) (31% in 2017) was again the top reason. This was followed byPrevious experience (32% versus 30%) and Best rate (20% versus 28%). There was then adrop off to convenience (4.5%). Beyond that, the reasons given only reflect the opinions ofone or two respondents.(b) To join a dental service OrganizationThe same primary reasons applied for joining a dental service Organization: Goodrelationship (41%), Previous experience (32%), and Best rate (20%) making up the topthree. These were followed by Convenient (4.7%). Flexibility in payment options wasmentioned by 7.7% in 2017 but only 0.6% in 2018.(c) To expand a multi-practice organizationThere was little change when considering expanding a multi-practice organization: Goodrelationship (42%), Previous experience (31%), Best rate (20%) and Convenient (4.8%)accounted for the bulk of response.

63
D. Marketing and Customer Service
D.1 Relative Value of Marketing Vehicles as Sources for New ProductInformationRespondents were given a list of predetermined marketing vehicles and asked to rate themfrom Not Valuable to Extremely Valuable using a 1 to 5 scale.Please rate the following from 1 to 5 (with 1 being Not Valuable and 5 being ExtremelyValuable) regarding their influence on your decision to purchase a New product.Response to each of the options showed an even distribution without polarization (i.e., noone large group saying 1 and another saying 5 giving a misleading average of 3). A full listof average response values covering all options is presented in the APPENDIX of detailedinformation.In the 2007 survey, a number of categories were merged into one single category andseveral additional categories were added. Special Offer Coupons, Samples and Discountswere merged into a single category. Dental Peers and Study Clubs were also combinedtogether as was Product Literature and Catalogues. In addition, two new categories were

64
added: Lunch & Learn and Product Trial. The wording of this question was also slightlyaltered, from purchase a particular product to purchase a New product.
The eight top ranked marketing vehicles remain the same year after year, although theorder may change. For 2018, Independent Clinical Studies (4.14) re-established itself as themost valuable followed by last year’s number 1, Lectures and Seminars at 4.11.Independent Clinical Studies has now been the most valuable vehicle in sixteen of nineteenpast studies: 2018, 2016, 2015, 2013, 2012 and 2009, and from 1997-2006. Product Trial(4.00) was third followed by Dental Peers/Study Clubs (3.94), Dental Journal Articles(3.79), Product Evaluation Organizations (3.76), Dealer Representative (3.61), DentalConvention Exhibit (3.72), and Manufacturer Representative/Lunch & Learn (tied at 3.63).
4.144.114.003.943.793.763.733.723.633.633.583.473.463.443.393.343.313.022.89
Independent Clinical StudiesLectures/SeminarsProduct TrialDental Peers/Study ClubsDental Journal ArticlesProduct Evaluation OrganizationsDealer RepresentativeDental Convention ExhibitManufacturer RepresentativeLunch & LearnPromotions (Special Offers, Discounts, Samples)The InternetDealer-Sponsored Information SessionDental LaboratoryProduct Literature/CataloguesManufacturer-sponsored ClinicLaboratory-sponsored ClinicPractice ConsultantsDental Journal Advertising
Weighted Average (Out of 5)

65
Promotions (Special Offers, Discounts, Samples) (3.58) fell out of the Top 10 for the firsttime in many years. The least valuable sources of product information were Dental JournalAdvertising at 2.89, Practice Consultants (3.02) (were least valuable last six years and anew category for the 2011 survey), Laboratory-sponsored Clinic, Manufacturer-sponsoredClinic, Product Literature/Catalogues and Dealer-sponsored Information Session.Internet was at 3.47, up from 3.36 last year.The same interesting contrast is still evident (as it was in the previous surveys) to theresponse for preferred product source, which was driven by price considerations. Aproduct is still selected based on recommendations from technical market influences. Onceselected, price determines the source of the purchase. This is obviously a very simplisticinterpretation as awareness and reinforcement that a product exists is still important inany sales process. Atlantic Quebec Ontario WestDealer Representative 3.79 3.53 3.71 3.81Manufacturer Representative 3.33 3.66 3.58 3.74Lunch & Learn 3.85 3.41 3.66 3.62Dental Laboratory 3.79 3.03 3.54 3.39Dental Journal Articles 3.67 3.60 3.89 3.76Dental Journal Advertising 2.67 2.59 2.91 2.79Promotions (Special Offers, Discounts, Samples) 3.79 3.40 3.62 3.56Product Trial 4.33 4.02 3.96 3.95Independent Clinical Studies 4.24 4.31 4.12 4.07Product Evaluation Organizations 3.73 3.90 3.82 3.64Lectures/Seminars 3.91 4.17 4.21 4.03Dental Convention Exhibit 3.55 3.86 3.77 3.64Dealer-Sponsored Information Session 3.39 3.33 3.50 3.48Manufacturer-sponsored Clinic 3.30 2.95 3.37 3.46Laboratory-sponsored Clinic 3.36 2.81 3.39 3.39Product Literature/Catalogues 3.39 3.19 3.41 3.44Dental Peers/Study Clubs 3.94 3.81 3.88 4.06Practice Consultants 3.03 3.19 2.99 2.99The Internet 3.33 3.41 3.59 3.38

66
On a Regional basis, Quebec gave lower ratings for almost all marketing vehicles comparedto the other regions. The only exceptions were Independent Clinical Studies, ProductEvaluation Organizations and Lectures/Seminars. On the other hand, The Atlantic gavealmost universally higher ratings. Lunch & Learn and Dental Laboratory are slightly morevalued in the Atlantic as is Product Trial. Lectures and Seminars are more valued in Ontariowhile Dealer and Manufacturer Reps as well as Dental Peers/Study Clubs are most valuedin the West.
0.00 1.00 2.00 3.00 4.00 5.00Dealer RepresentativeManufacturer RepresentativeLunch & LearnDental LaboratoryDental Journal ArticlesDental Journal AdvertisingPromotions (Special Offers, Discounts,Samples) Product TrialIndependent Clinical StudiesProduct Evaluation OrganizationsLectures/SeminarsDental Convention ExhibitDealer-Sponsored InformationSessionManufacturer-sponsored ClinicLaboratory-sponsored ClinicProduct Literature/CataloguesDental Peers/Study ClubsPractice ConsultantsThe Internet
WestOntarioQuebecAtlantic

67
D.2 Suggested Service ImprovementsRespondents were asked how dental dealers and manufacturers could improve theirservice to dentists.(a) Dental Dealers
How could dental dealers improve their service to you?
As with most customer service surveys, “better pricing” (35%) (as per the average of 35%the last twelve years) was mentioned as the most common improvement requested bythose who answered the question. This was followed by “more product information/knowledge” (11%), more sales visits” (6%), “Keep better inventory” (4%), “InternetOrders/Better online ordering, “prompt delivery on orders/free shipping “, “Offerrebates/buying incentives”, and “give samples/product trials” (all at 3%).
35%16%11%6%4%3%3%3%3%3%3%2%2%2%.7%.7%.7%.5%.5%.5%.5%.3%.3%.3%.3%
Better pricingService good nowMore product information/knowledgeMore sales visitsKeep better inventoryPrompt delivery on orders/free…Give more samples/product trialsInternet orders/Better online orderingOffer rebates/buying incentivesBetter customer serviceBetter communicationMore catalogues/online cataloguesBulk orderingMore trade shows/seminars/coursesFrequent purchase rewardsBetter service of equipmentBetter product qualityBetter accuracy in ordersReturn calls promptlyPrompt credit on returnsMore techniciansBetter post purchase follow-upLess packagingOne-stop shoppingMore products

68
In general, outside of requests for lower prices, there are few areas of real concern,although all comments should be looked into and improvements made. It should be notedthat a sizeable 16% (17 % last year, 21% in 2016 and 15% in 2015) of respondentsspecifically stated that current dealer service was good now. This number can beconsidered an understated reflection of the level of customer satisfaction. Roughly 11% ofrespondents did not give an answer to this question (consistent with previous years). Mostof these could be considered to be generally satisfied with current dealer service.One respondent added “Provide service that is not just about pushing product. If they takethe attitude of what problems are you having, and how can I help?, that would be much betterthan we have these specials on this month. Time is our biggest limitation, give us someconcrete methods to implement new systems instead of letting us figure them out forourselves, in a way that does not reek of profiteering.”b) Dental Manufacturers
How could dental manufacturers improve their service to you?
18%18%9%8%6%5%5%4%3%3%3%2%2%2%2%2%1%1%1%
Better pricingGood service nowMore product trials/samplesUnbiased research data/product comparisonsDeal directly with dentistBetter information/instructionsMore serviceable/new productsMore seminars/coursesMore sales visitsBetter communicationBetter warrantiesBetter qualityFaster delivery/free deliveryEasier access to orders (e.g. Internet)Bulk orderingKnowledge of productsBetter inventoryBetter customer serviceBetter service repairs

69
Almost all respondents (99%) responded to the questions regarding suggestedimprovements to dealer and manufacturer service in 2018 (as opposed to 97% formanufacturers vs. 89% for dealers last year). Those not responding may be generallysatisfied with manufacturer performance or just simply not have an opinion. Over 18% (upfrom 17% last year, 15% in 2016, and an average of 10% the last six years) of respondentsdirectly mentioned they were receiving good service now. As it was for dealers, this can beconsidered an understated reflection of the level of customer service.As it was last year, “better pricing” was the number one suggestion with 18% of response.This was followed by “more trials/samples” (9%), “unbiased research data/productcomparisons” (8%), “Deal directly with dentist” (6%), “Better information/instructions“(5%), “More serviceable new products” (5%), and “More seminars/courses” (4%).Several respondents gave more detailed comments as follows:“Clamp down on grey market and black market sellers. These businesses are selling the Mfrsproduct most of the time. Enforce the laws so that unauthorized dealers can't sell the productthus leveling the playing field for the dentist.”“Be willing to answer questions, provide information and learning sessions on new products,keep us up to date with advances as well as product recalls.”c) Dental Laboratories
How could dental laboratories improve their service to you?As in previous years, “good service now” (35%) (basically the same as last year’s 36% andwell above the average of 27.2% the previous eight years) was the top reply.However, there continues to be an increased concern with better communication (14%),faster case turnarounds (13%), better pricing (10%), and further improvements inconsistent quality (9%) – the same factors mentioned in 2017.In the 2010 survey, there was a large increase in dentists mentioning “consistent quality”as an area in need of improvement, as well as dentists mentioning other quality relatedissues such as Better Technicians, Better Esthetic Work and Follow Instructions Carefully.This may have indicated quality having become a top priority or a need to pay greaterattention to quality in the dental lab. Although respondents are still mentioning most ofthese issues again this year, concern about consistent quality is now floating in a rangemuch lower than in 2010 (i.e., 6.8 – 10% vs. 15.1%) perhaps indicating an easing in thatconcern and/or laboratories providing improved quality. On the other hand, the largeincrease in quality related issues might have been somewhat of an anomaly. No patternappears to be developing regarding this issue of quality in dental laboratory service.

70
D.3 InternetThe section on Internet usage has been dramatically changed year-by-year based on theprevious response indicating greater computer usage by dentists.(a) Use of Internet to Purchase Dental Products
Do you use the Internet to purchase dental products?This question was answered by almost all dentists. Almost 3/4 (74%) of dentists have usedthe Internet for dental purchases (up from 71% last year, the average of 57.8% from 2011to 2016, and the initial 8.4% in 2000). A further 4% intend to use this method in the future(down from 5.9% the last nine years and from the average of 14% from 2000-2006). Only22% of respondents did not use the Internet to purchase dental products. These latestresults, however, may be the result of the on-line only survey administration method andvarying demographics of the respondents this year. Several years of results will be neededbefore a definitive trend can be confirmed for this newer respondent profile.Atlantic Quebec Ontario WestYes 91.2 75.9 74.3 68.2No 5.9 24.1 21.1 24.5No, but plan to use 2.9 0.0 4.7 6.0No response/Does not know 0.0 0.0 0.0 1.3
On a regional basis, Atlantic respondents were far more likely to purchase dental productsover the Internet. Dentists in the other regions had a fairly consistent response.Respondents indicating future planned use of the Internet for dental purchases were askedwhen they were planning to do so. As in past years, the majority (74%) stated they plan topurchase “soon”. Other major responses included within 3 -6 months (16%) and when theInternet is more secure (5%).

71
(b) Internet to Purchase Non-Dental Products
Do you use the Internet to purchase any other (i.e., non-dental) products?Response here reverted to a growth pattern first seen in 2016. In 2016, almost all (91.4%)of dentists had purchased (90.9%) or planned to purchase (0.5%) non-dental productsthrough the Internet. This was up dramatically from 66.9% in 2015 and from the previoustwo years average (71%). For 2017, it returned to historical norms at 73.4% purchased(2.1% plan to purchase) and 23.6% who had not purchased. However, in 2018, we againsee higher results for Purchased at 82% and Plan to purchase (1%) with a resulting drop inwho had not purchased to 17%. More years of data are required to determine what ishappening here. Atlantic Quebec Ontario WestYes 82.4 84.5 85.4 76.8No 17.6 15.5 14 20.5No, but plan to use 0.0 0.0 0.6 2.0No response/Does not know 0.0 0.0 0.0 0.7
Western respondents (77%) were least likely to purchase non-dental products over theInternet and correspondingly showing the greatest resistance (21%). The other regionsshowed a very similar pattern of response.(c) Internet Usage for Dental Information
What is your usage rate of the Internet as a source of dental information?This question was answered by 100% of respondents. Only five (0.2%) of the respondentssaid they never used the Internet (continuing to level off from an average of 5.3% from2008-2011, and much lower than the initial 31.9% in 1997). Therefore, 99.8% of allrespondents used the Internet in 2018 (100% in 2017 and 2016, up from 97.1% in 2015and an average of 93.2% the last six years - compared to the initial 35.6% in 1997). Ofthose using the Internet, 61% considered themselves frequent users, 30% occasional usersand 8% seldom used it. These results continue to reinforce the need for dealers,manufacturers and dental laboratories to pay increasing attention to the possibilitiesoffered for Internet-based information and ordering.As in 2017, Quebec dentists were less likely to consider themselves frequent (51%) orOccasional (32%) users than other regions, while Atlantic respondents again had thehighest reading (74%) as frequent users.

72
(d) Most Valuable Aspect of the Internet/Email
If you or your staff are Internet/Email users, on a scale of 1 to 10, how valuable is the Internetfor [the following aspects]:This question was changed on the 2011 survey, with the category “Email” removed, and“Patient Communication” and “Communication with laboratory” added as new categories.
Most Valuable Aspect of Internet/Email Today
In terms of Internet usage today, Internet users feel Product Information (7.51 out of 10)(up from last year’s 7.14, 7.08 in 2016, 6.77 in 2015, and an initial 3.87 in 1999) is the mostvaluable aspect of the Internet. This was followed by Clinical Information (6.96) (up from6.96 last year, 6.62 in 2016, 6.56 in 2015, and an initial 3.87 in 1999), Method for orderingdental products (6.22) (all-time high and up from 5.88 last year, 5.39 in 2016, 5.25 in 2015,and 3.80 in 2007), Patient Communication (5.47) (but steadily increasing from 5.07lastyear, 4.62 in 2016, and 3.69 in 2011), Consultation with other dentists (5.43) (down from5.55 last year but previously 4.21 in 2007) and Consultation with insurance carriers (5.33).
7.517.196.225.475.435.334.714.363.41
Product InformationClinical InformationMethod for ordering dental productsPatient CommunicationConsultation with other dentistsConsultation with insurance carriersInterest/News GroupsCommunication with laboratoryOn-line Leasing/Financial Information
Weighted Average (Out of 10)

73
Again this year, Internet users gave the lowest ratings to On-line leasing/FinancialInformation (3.41). This was followed by Communication with laboratory (4.36), andInterest/News Groups (4.71). Current In 2 YearsAtlantic Quebec Ontario West Atlantic Quebec Ontario WestClinical Information 7.42 5.98 7.54 7.22 8.09 6.75 8.03 7.93Product Information 7.09 7.12 7.83 7.42 7.55 7.82 8.31 7.89On-line Leasing/Financial Information 3.24 3.72 3.20 3.56 3.91 4.32 3.78 4.09Method for orderingdental products 6.97 5.98 6.37 5.99 7.79 6.82 7.17 7.08Communication withlaboratory 4.94 3.98 4.34 4.40 5.88 5.35 5.47 5.65PatientCommunication 5.58 4.88 5.57 5.57 6.94 5.91 5.64 6.57Interest/News Groups 5.12 4.25 4.87 5.56 5.70 5.00 5.32 5.17Consultation withother dentists 5.58 5.18 5.37 5.48 6.55 6.04 6.39 6.29Consultation withinsurance carriers 4.55 3.91 5.58 5.79 5.73 4.91 6.76 6.93For Internet usage today, Atlantic practices rated the Internet highest for Method forordering dental products and Communication with Laboratory while Western dentists gavethe highest in category ratings for Product Information, Interest/News Groups, andConsultation with Insurance Carriers. Ontario was highest in Product Information. Quebecpractitioners gave generally lower readings with the exception of On-line Leasing/Financial Information.In terms of Internet usage overall in two years, Product and Clinical Information continuesto generally be the most valuable aspect of the Internet. This was followed again this yearby Patient Communication, Method for ordering dental products, Consultation withinsurance carriers, and Consultation with other dentists. It would appear that pro-active,outgoing Communication is expected to be the growth area of the Internet.Regionally, while almost all rankings move up, there is particularly strong growth across allregions for the Internet as a Method for ordering dental products; Communication withlaboratory; Consultation with other dentists and Consultation with insurance carriers.

74
Most Valuable Aspect of Internet/Email in Two Years
Internet users gave the lowest ratings to Interest/News Groups and On-lineLeasing/Financing Information.It is important to note that all the weighted average ratings continue to be higher (as hasbeen the case since the 1999 survey year). This indicates more widespread Internet use isexpected to continue for all facets.
7.817.14
6.586.47
6.325.55
5.383.98
Product InformationClinical Information
Method for ordering dental productsPatient Communication
Consultation with insurance carriersConsultation with other dentistsCommunication with laboratory
Interest/News GroupsOn-line Leasing/Financial Information
Weighted Average (Out of 10)8.02

75
E. Continuing Education
Practice Management Type Continuing Education Topics 2011-2018
The general upsurge in interest in all Practice Management Education topics first startingin 2016 has continued (and perhaps even accelerated in 2017 and 2018) as evidenced bythe upward trend on the lines in the chart above.The top three topics for 2018 were, as they were in 2017 albeit in a slightly different order,Leadership Team Development (3.64 out of 5) (jumping from #3 to #1); RevenueEnhancement/ Expense Management (3.62 – #1 in 2017) and Fraud Protection (3.59).
2.202.402.602.803.003.203.403.603.80
2011 2012 2013 2014 2015 2016 2017 2018
Wei
ghte
d Av
erag
e (o
ut o
f 5)
Leadership/Team DevelopmentRevenue Enhancement/ExpenseManagementFraud ProtectionCommunication/CasePresentationMarketing the PracticeSuccession PlanningThe Paperless OfficeFinding an Associate
E.1 Interest in Continuing Education Topics
Please rate the following from 1 to 5 (with 1being Not of Interest and 5 being ExtremelyInterested) regarding Continuing EducationTopics.This was a new question for the 2011 survey.Respondents were asked to rate their intereston several Practice Management and Clinicaltype continuing education topics from apredetermined list.

76
Communication/Case Presentation (3.52) has fallen to fourth place (3.27 last year, 3.58 in2016, and 2.93 in 2011). Similarly, the related topic Marketing the Practice (3.49) (3.41 lastyear, 3.73 in 2016, and 2.89 in 2011) has fallen to fifth place from the highest rated topic in2016. That being said, the readings across the Board for 2018 are again are very close interms of absolute values.Succession Planning (3.25), The Paperless Office (3.05) (although trending upward from2.65 in 2011) and Finding an Associate (2.81) were still the lowest rated topics but thismay be a function of the assumed “younger” demographic of this year’s respondents.For Practice Management type topics, there was little difference regionally compared to theNational results. Revenue Enhancement/Expense Management is universally the top area.Beyond that, Quebec and the West had the most relative interest in topics concerned withbuilding the practice (Marketing the Practice, Communication/Case Presentation, andLeadership/Team Development) as they did in 2016 and 2017. Western respondents weremore interested in Fraud protection than other regions.Clinical Type Continuing Education Topics 2011-2018
This chart illustrates how it is difficult to track trends over time as the respondent basechanges to purely on-line. This can lead to what looks like large fluctuations in results,while in actuality the ranking of types of CE courses remains constant from year to year.For Clinical type CE courses, Restorative Implants (4.01 out of 5) was again the highestrated topic for 2018, followed by Endodontics, Digital Impression Systems (moving up from4th), Periodontics, Surgical Implants and Lasers. Again, the chart illustrates rising overallsupport for all Clinical Education Topics.
2.202.703.203.704.204.70
2011 2012 2013 2014 2015 2016 2017 2018
Wei
ghte
d Av
erag
e (O
ut o
f 5) Restorative ImplantsEndodonticsDigital Impression SystemsPeriodonticsSurgical ImplantsLasersOrthodonticsMetal-Free DentistryCAD/CAM
77
The topics of least interest continue to be Orthodontics, Metal-Free Dentistry and CAD-CAM. There were a small number of other topics mentioned, shown as “Other” that mainlyreferred to Invisalign and specific programs such as LVI, Spear, etc.For Clinical topics, CAD/CAM and Digital Impression Systems were rated higher in theAtlantic. Quebec dentists showed more of an interest in Periodontics, Surgical andRestorative Implants than other regions. Ontario practitioners showed greater interest incourses regarding Metal-free Dentistry.E.2 Study ClubsThe former questions on Study Clubs “Do you currently belong to a Study Club?” and “If YES,what type of Study Club(s) do you belong to?” were rephrased to the more direct “What typeof Study Club(s) do you belong to? (Please check off all that apply)” along with a newresponse option “Don’t belong to a Study Club”.It is still possible to roughly compare the numbers belonging to a Study Club year over yeardespite the change in question. In 2016, 35.6% (comparable to, the average 37.9% of theprevious eight years) of dentists belonged to a study club, while a further 0.5% wereplanning to join one in the future. In 2017, a total of 54.9% of respondents stated they didnot belong to a Study Club so a net of 45.1% of 2017respondents stating they did belong toone or more Study Clubs. For 2018, 56% stated they did not belong to a Study Club so wehave a comparable 44% participating in one or more clubs.Of those currently in a Study Club, the most common type was again Implant (20%) (downfrom 23% last year but up from 18% in 2016) closely followed by C&B (16% as with lastyear). Endodontic (10%) moved up to third (6.9% in 2017) with Orthodontic (10%)dropping to fourth (12.2% last year). Periodontic (5.1%) was also mentioned. There few“Other” responses again this year. These have included topics such as General Dentistry,Multi-disciplinary, Restorative, Prosthodontics, Occlusion, Operative, Cosmetic, TMD,Prevention, CAD-CAM, and various specifically named local study clubs, notably AlphaOmega, LVI, Spear Group and AGD in the past.E.3 Suggestions for Improvement for Continuing EducationOpportunities
What could be improved with current CE opportunities?The most common reply was “more availability locally” (18%) as it was in 2016 and 2017,followed by “Online courses/DVD’s” (17%), “more hands on” (17%), and “bettertopics/more detail” (14%). The full listing of comments made by respondents for 2018 andprevious years are included in the detailed tabulations in Appendix A.

78
F. General Trends in Dentistry
F.1 Procedures Referred To Specialist
“Do you currently place the majority of your own implants?”This was a new question added in 2017 survey as part of the section on the general referralof procedures outside of the practice, with supplied response options: YES, NO but plan todo so in the future, Plan to continue to have Specialist place, and Other (please specify).
“Do you currently place the majority of your own implants?”56%
22% 22%1%Plan to continue haveSpecialist Yes No but plan to in the future Other

79
Most respondents (56% and up from 51% last year) plan to continue to have a Specialistplace their implants. Last year almost 50% in total either placed implants themselves(25.7%) or Planned to place them themselves in the future (22.3%). This total has droppedto 44% in 2018, with most of the drop in those now doing it themselves (now at 21.6%).Other respondents primarily had someone else in their office(s) place the implants.“What approximate percentage (0-100%) of each of the following procedures do you refer toa specialist (or outside of your practice) today?”This was a new question for the 2011 survey. Respondents were asked to specify thepercentage of their procedures they refer to a specialist (or outside of their practice) todayand what they felt the percentages would be for those same procedures in two years’ time.The detailed percentage breakdown of response in 10% ranges by procedure is provided inthe APPENDIX attached to this report. Again, the value and popularity of particularprocedures are best illustrated by looking at the average response by procedure.
7.647.025.304.894.624.363.862.73
7.306.605.284.804.564.373.902.67
OrthodonticsImplantsPeriodonticsEndodonticsOral SurgeryDenturists/Dental MechanicsPedodonticsProsthodonticsToday In Two Years

80
“Approximate amount (Rated from 1 to 10) of each of the following procedures referred to aspecialist (or outside of your practice) today” Today2011 2012 2013 2014 2015 2016 2017 2018Orthodontics 8.59 8.47 8.51 8.18 8.13 7.00 7.76 7.64Implants 7.47 6.97 7.14 6.99 6.83 6.54 7.13 7.02Periodontics 5.42 5.29 5.33 5.58 5.34 4.49 5.20 5.30Endodontics 4.26 4.33 4.53 4.72 4.12 4.03 4.62 4.89Oral Surgery 4.66 4.74 4.66 5.00 4.63 4.33 4.59 4.62Denturists/Dental Mechanics 3.93 3.98 3.90 3.89 3.76 2.73 4.53 4.36Pedodontics 3.51 3.36 3.38 3.78 3.48 3.88 3.64 3.86Prosthodontics 2.36 2.39 2.35 2.45 2.23 2.02 2.83 2.73In terms of “Today”, Orthodontics and Implants continue to be, by far, the most commonprocedures referred to a specialist for the average respondent practice. Periodontics wasthird, followed by Endodontics and Oral Surgery. These were basically the top five, and inthe same order, as the last six years.What would you expect that rating to be two years from now?In Two Years2011 2012 2013 2014 2015 2016 2017 2018Orthodontics 8.33 8.27 8.21 8.00 7.93 6.14 7.23 7.30Implants 7.00 6.34 6.55 6.80 6.48 5.01 6.56 6.60Periodontics 5.39 5.07 5.27 5.45 5.21 4.21 4.94 5.28Denturists/Dental Mechanics 4.07 4.20 3.95 3.95 3.71 2.35 4.60 4.80Endodontics 4.33 4.29 4.53 4.69 4.07 3.80 4.54 4.56Oral Surgery 4.55 4.75 4.61 4.97 4.62 4.10 4.41 4.37Pedodontics 3.67 3.46 3.53 3.89 3.55 3.85 3.68 3.90Prosthodontics 2.32 2.43 2.30 2.45 2.24 1.78 2.86 2.67“In Two Years”, dentists anticipate a large decrease in referring to a specialist forOrthodontics and Implants. While Periodontics had decreased in previous years, it wasequal for 2018. All other referral rates were expected to remain fairly consistent across theBoard for 2018.
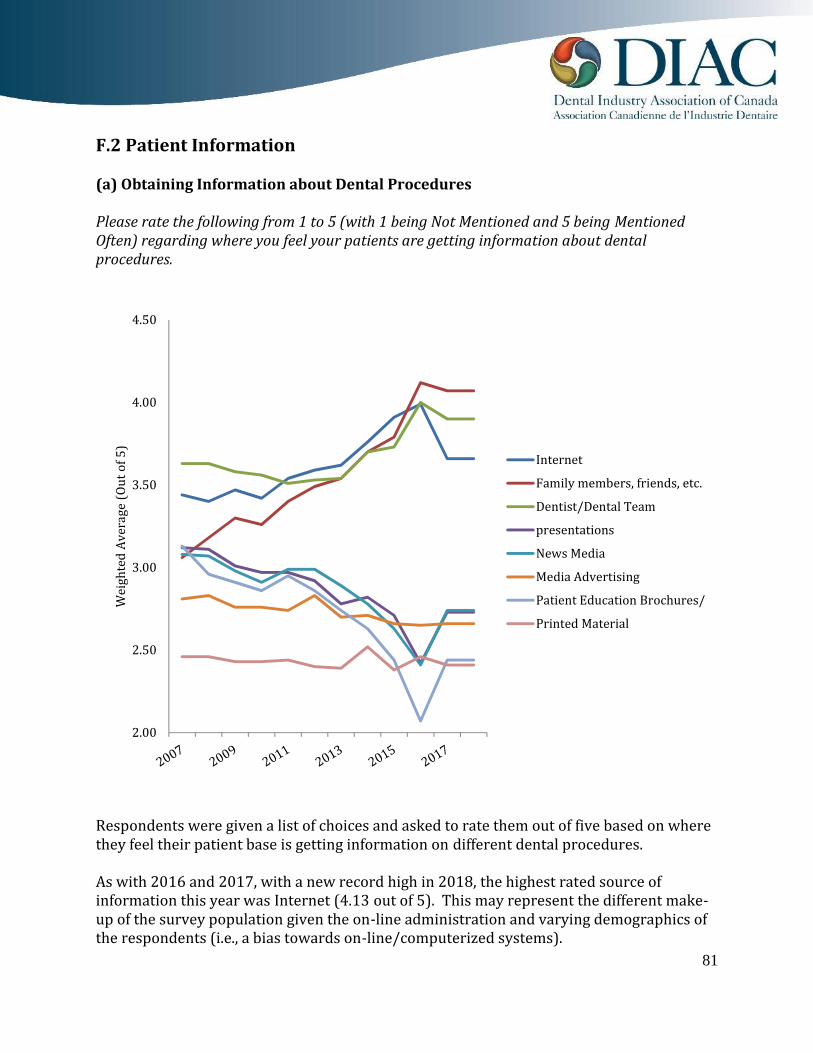
81
F.2 Patient Information
(a) Obtaining Information about Dental Procedures
Please rate the following from 1 to 5 (with 1 being Not Mentioned and 5 being MentionedOften) regarding where you feel your patients are getting information about dentalprocedures.
Respondents were given a list of choices and asked to rate them out of five based on wherethey feel their patient base is getting information on different dental procedures.As with 2016 and 2017, with a new record high in 2018, the highest rated source ofinformation this year was Internet (4.13 out of 5). This may represent the different make-up of the survey population given the on-line administration and varying demographics ofthe respondents (i.e., a bias towards on-line/computerized systems).
2.002.503.003.504.004.50
Weighted Ave
rage (Out of 5) InternetFamily members, friends, etc.Dentist/Dental TeampresentationsNews MediaMedia AdvertisingPatient Education Brochures/Printed Material

82
Family members, friends, etc. were again ranked second (3.97) followed by Dentist/DentalTeam presentations (3.76).The lowest rated sources of patient information, as they were in 2017, were Waiting RoomDVDs/Presentations (2.36), TV programs (2.41), Patient Education Brochures/PrintedMaterial (2.69), Media Advertising (2.78), and News Media (2.80).Atlantic Quebec Ontario WestInternet 4.06 4.17 4.12 4.14News Media 2.74 3.12 2.78 2.71TV Programs 2.50 2.57 2.44 2.28Media Advertising 2.94 2.81 2.76 2.74Patient Education Brochures/PrintedMaterials 2.97 2.60 2.75 2.60Waiting Room DVDs/Presentations 2.38 2.47 2.41 2.25Family members, friends, etc. 4.00 3.81 3.96 4.04Dentist/ Dental Team presentations 3.88 3.83 3.69 3.79
Regionally, Quebec dentists gave higher ratings for News Media (3.12) than other regions,while Western Canada gave very low ratings for TV programs comparatively. Otherwise,there were no real strong differences in ratings across the various Regions as compared tothe overall(b) Inquiries about Dental Procedures
What are your practice’s patients asking you about?For the 2017 survey, two new response options (“Fluoride” and ‘Whitening”) were addedto the current list of options offered. These are indicated by new lines on the followingchart rising from 0% to their 2017 (and now 2018) value. In addition, as multipleresponses were allowed, the totals exceeded 100%.

83
What Dentists Say Patients Are Asking About 2011-2018
The top five procedures remained basically the same (but in slightly different order) as lastyear: Implants as #1 for the first time since 2015, Cosmetic Dentistry (the top reply in fiveof the previous seven years), followed by Whitening, TMJ and X-ray Radiation.The middle group included Gingivitis, the Fluoride, Endodontics, Oral/Systemic Health,Oral Cancer and Toxicity of Materials.The lowest procedure enquiry was again Infection Control Procedures.
0%10%20%30%40%50%60%70%80%90%
100%
2011 2012 2013 2014 2015 2016 2017 2018
Cosmetic DentistryImplantsTMJX-ray RadiationGingivitisOral CancerOral/Systemic HealthEndodonticsToxicity of MaterialsInfection Control ProceduresFluorideWhitening

84
Atlantic Quebec Ontario WestCosmetic Dentistry 85.3 72.4 74.9 70.9Gingivitis 41.2 46.6 42.7 37.7Implants 76.5 81 72.5 79.5Endodontics 32.4 43.1 41.5 38.4Oral Cancer 23.5 29.3 29.2 31.8TMJ 64.7 34.5 51.5 48.3X-ray Radiation 38.2 48.3 46.8 45.7Fluoride 44.1 15.5 33.9 40.4Toxicity of Materials 17.6 24.1 28.1 42.4Whitening 76.5 70.7 70.2 71.5Infection Control Procedures 5.9 20.7 27.5 20.5Oral/Systemic Health 20.6 36.2 24.0 25.8Regionally, inquiries about Cosmetic Dentistry and TMJ were much more prominent inAtlantic than in other regions, however Atlantic also had the lowest readings for manyother categories. Quebec had the highest readings for Gingivitis, Implants, Endodontics, X-ray Radiation and Oral/Systemic Health and very low readings for TMJ and Fluoride.Inquiries were higher in the West for Oral Cancer and Toxicity of Materials while Ontariohad the lowest readings for Implants and the highest for Infection Control Procedures.

85
F.3 Practice Promotion
(a) Use of Practice Building ToolsRespondents were asked about their use of a variety of practice building tools. In 2017, anew Practice promotion option “Free Service offering (e.g. a Free Whitening)” was added tothe list of supplied response options.Are you currently using, planning to use or considering any of the following in yourpractice?
As with 2016 and 2017, Asking for Referrals (60.1%) (above last year’s 54.5% and theaverage of 54.3% the previous five years) was the most popular tools dentists werecurrently using. Social Networking (Facebook, Twitter, LinkedIn, etc.) (50.7%) was againsecond (and moving beyond 50% of all respondents) followed by Promoting NewTechnologies (49.1% and up from last year’s 42.9%).Community Service (30%), Traditional Media Advertising (23.2%), and E-Newsletters/Newsletters/Direct Mail (19.2%) made up the middle group.The newly added Free Service Offering again did not gain much support as a tool and wasthe least popular by far.
60.1
49.1
50.7
19.2
23.2
15.1
30
8.5
18.6
14
14.8
8.1
4.6
13.4
16.8
19.1
14.2
31.3
25.9
14.9
32
14.6
13.2
21.1
34.7
42.8
65.4
24.6
Asking for referralsPromoting New TechnologiesSocial Networking (Facebook, Twitter,LinkedIn, etc.)E-Newsletters/Newsletters/Direct Mail
Traditional Media AdvertisingFree Service offering (e.g., a FreeWhitening)Community ServiceCurrently Using Plan To Use Considering Will Not Use
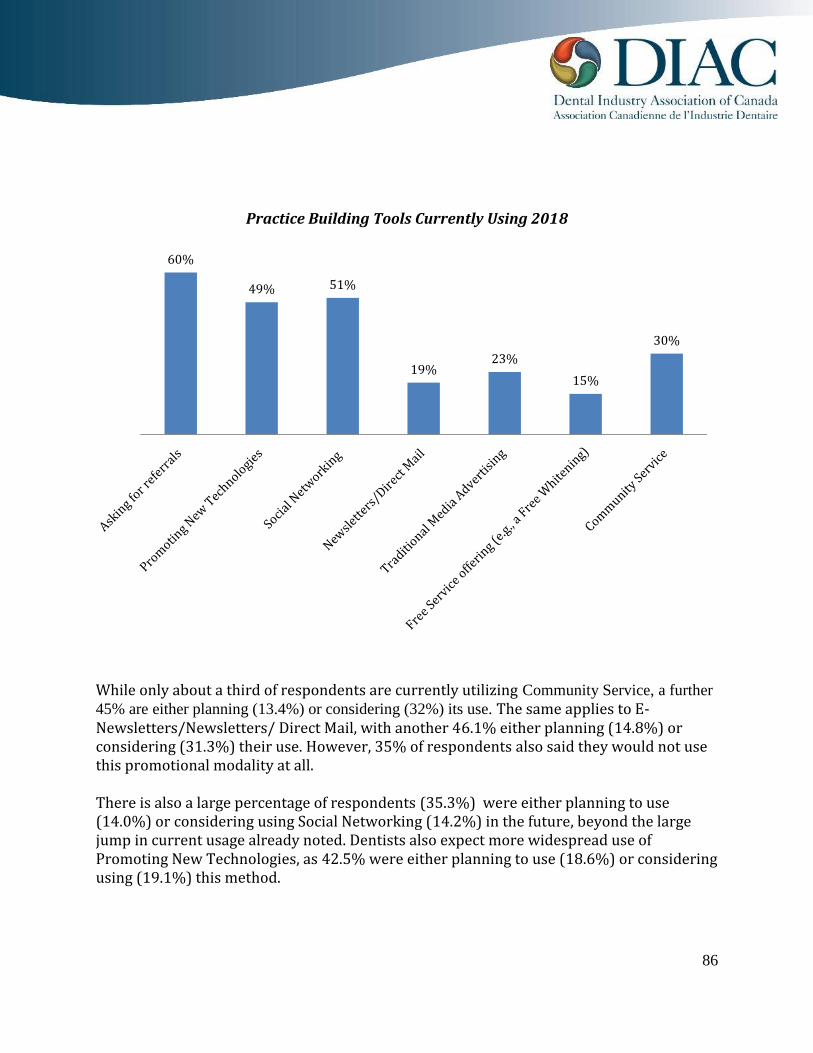
86
Practice Building Tools Currently Using 2018
While only about a third of respondents are currently utilizing Community Service, a further45% are either planning (13.4%) or considering (32%) its use. The same applies to E-Newsletters/Newsletters/ Direct Mail, with another 46.1% either planning (14.8%) orconsidering (31.3%) their use. However, 35% of respondents also said they would not usethis promotional modality at all.There is also a large percentage of respondents (35.3%) were either planning to use(14.0%) or considering using Social Networking (14.2%) in the future, beyond the largejump in current usage already noted. Dentists also expect more widespread use ofPromoting New Technologies, as 42.5% were either planning to use (18.6%) or consideringusing (19.1%) this method.
60% 49% 51%19% 23% 15%
30%

87
(b) Use of Patient Financing OptionsAn entirely new question was added to the 2017 Questionnaire “Do you currently offerfinancing options to our patients, such as 12 months Equal Monthly Payment plans, throughany of the following methods?”Respondents were given a list of predetermined Financing Options and were allowed toselect all that applied (i.e., could select both in-house financing and 3rd party financingprovider if both applied to their practice). As a result, totals were more that 100%:
We offer in-house financing where we administer the process and assume thecredit risk
We use a 3rd party financing provider like Health Smart Financial We do not offer financing to our patientsThe majority (60%, although down from 65% last year) of respondents offer financing insome fashion to their patients, whether in-house themselves (45.2%) or via a 3rd partyfinancing provider (15.2%). Still, 43% of practitioners do not offer any financing options atall. The results are very close to the pattern shown in 2017.
2017% 2018%We offer in-house financing where we administer theprocess and assume the credit risk 46.6 45.2We do not offer financing to our patients 40.0 43.0We use a 3rd party financing provider like Health SmartFinancial 18.8 15.2
Use of Patient Financing Options 2018
Offer in-house
financing45%
Do not offerfinancing43% Use 3rd partyfinancingprovider15%

88
Regionally, the West and Ontario are the most likely to offer in-house financing while theAtlantic is most likely to offer third party. Quebec is most likely not to offer any financing.Atlantic Quebec Ontario WestOffer in-house financing where we administerthe process and assume the credit risk 44.1 32.8 47.4 47.7We do not offer financing to our patients 8.8 39.7 14.0 8.6We use a 3rd party financing provider likeHealth Smart Financial 52.9 36.2 42.1 44.4
(c) Use of Practice Website
Does your practice currently have a website?
More than three-quarters (76%) (same as last year, similar to the 82% in 2016 and upsignificantly from 61.3% in 2015 and the original 20.6% in 2006) of practices have awebsite now, while a further 5% are planning to have one in the future. This dramatic shift,however, may still be more a result of the new online survey administration methodologythan a true shift in the marketplace.It appears a majority of those respondents who previously said they plan on creating awebsite continue to do so. About two-thirds of those without a website (90%) (similar tothe 75% the last two years, 66.7% in 2015, 65.9% in 2014, and up from an average of about61% from 2006-2013) specifically stated they intend on having a website within the nextyear. A significant number of respondents (65%) simply said their practice plans to have awebsite “soon”.
Yes76%
No19%No but plan tohave one5%

89
(d) Top Challenge Intend to Address in 2018“What is the top challenge you intend to address in 2018?”This was a new question in 2017 survey.2017% 2018%
Getting more patients/keep busy/Less patient visits 43.8 32.5Financial/paying bills/overhead 11.4 13.2Staffing issues/keeping staff/vacation time/finding Associate 11.1 11.5Equipment/office upgrades/repairs/replacement 5.1 6.8Acceptance of treatment plans 4.4 5.6Increased competition 7.2 5.0Marketing to right audience/Advertising from outside sources 0.3 4.3Incorporating new techniques/promoting implants 1.4 3.7Too busy/too many patients/scheduling patients 1.0 3.1New technologies/Keeping up with technology NR 2.4Minimize cancellations/no shows 3.4 1.9Transition/succession planning 0.3 1.9Effective communication 1.7 0.9Complying with regulations 1.7 0.6Collecting payment/account balances 1.4 NRComplex medical problems/health issues 0.3 0.3Getting referrals 0.3 0.3Recalls 0.2 0.3More cosmetic work/C&B NR 0.3Litigation NR 0.3Prioritize dental care and treatment 0.9 NRPatient education 0.7 NRSatisfy patient needs/Overtreatment 0.7 NRInsurance coverage/dealing with insurance 0.3 NRThe top reasons given by respondents was “Getting more patients/keep busy/Less patientvisits” at 32.5% (43.8% in 2017) along with other factors like “Financial/paying bills/overhead” (13.2%) (11.4% last year), “Increased competition” (5.0%), “Acceptance oftreatment plans” (5.6%) and “Minimize cancellations/no shows” (1.9%) - perhaps anindication of the typical dental practice struggles in today’s economy. While “Staffingissues/keeping staff/vacation time/finding Associate” (11.5%) are certainly a concern,they pale in comparison to the financial concerns in revenue and expense. What doesappear to be growing is the impact of incorporating technology in the office (Equipment/office upgrades/repairs/replacement 7%; Incorporating new techniques/promotingimplants 4% and New technologies/Keeping up with technology 2%). A more detailedoutline of response is given in APPENDIX A following this report.

90
(e) Three Key Metrics for Success“What are the three key metrics for success in your practice? (please select up to three of thefollowing)”The former question “What are the top three challenges in your practice today?” was re-phrased as this new question for the 2017 survey. Respondents were asked to select theirtop three metrics for success in their practice today from a supplied list:
Financial/paying bills/overhead costs, etc. Getting more patients/keeping busy/increasing patient visits Staffing issues Tracking referrals out of the practice Implementation of technology Other (Please specify)
The top three key metrics for success in the practice today mirror the results of the TopChallenge, involving the level of busyness in the practice with “Financial/payingbills/overhead” first at 78% and “Getting more patients/keep busy” second (75%). Thesetwo metrics switched places for 2018 but as in 2017 the readings are very close. Staffingissues (51%) was third. Implementation of technology was fourth (29%) with Trackingreferrals out practice a distant fifth at 13%.A more detailed outline of response is given in APPENDIX A following this report.
78%75%
51%29%
13%
Financial/paying bills/overheadGetting more patients/keep busy
Staffing issuesImplementation of technologyTracking referrals out practice

91
APPENDIX ADental Industry Association of Canada
Detailed Survey Tabulations
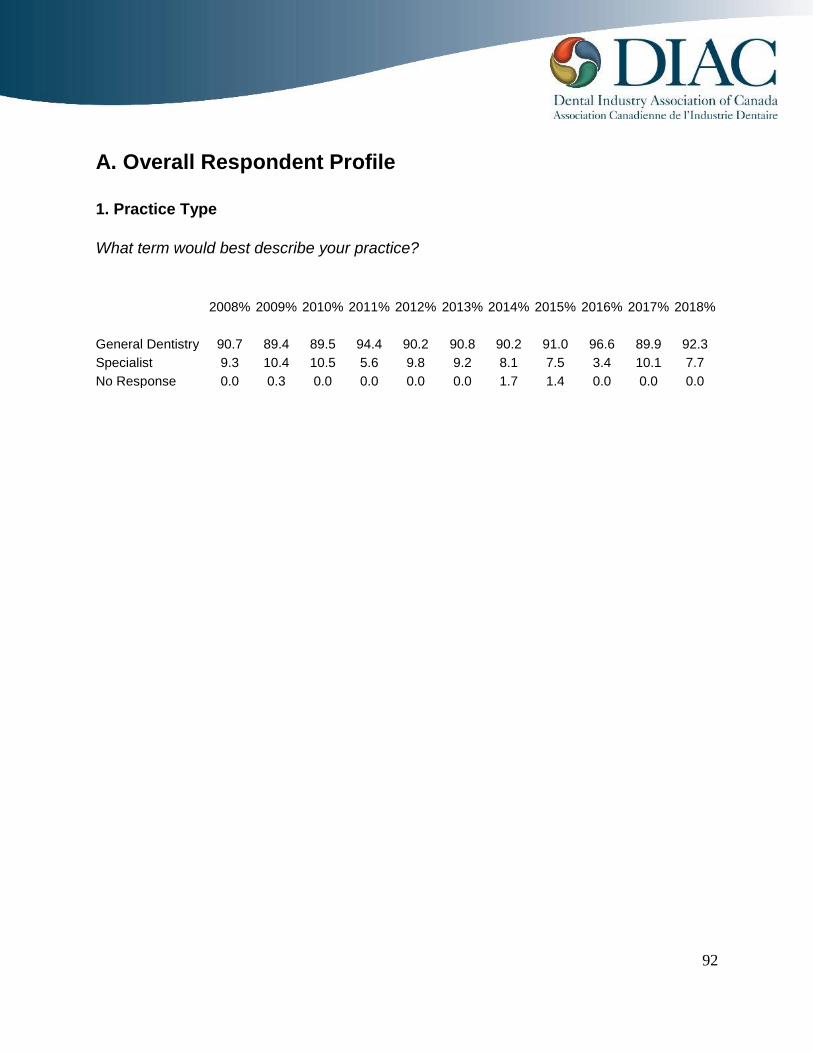
92
A. Overall Respondent Profile
1. Practice Type
What term would best describe your practice?
2008% 2009% 2010% 2011% 2012% 2013% 2014% 2015% 2016% 2017% 2018%
General Dentistry 90.7 89.4 89.5 94.4 90.2 90.8 90.2 91.0 96.6 89.9 92.3Specialist 9.3 10.4 10.5 5.6 9.8 9.2 8.1 7.5 3.4 10.1 7.7No Response 0.0 0.3 0.0 0.0 0.0 0.0 1.7 1.4 0.0 0.0 0.0

93
2. Years In Practice
How many years have you practiced dentistry?
2008% 2009% 2010% 2011% 2012% 2013% 2014% 2015% 2016% 2017% 2018%
0-3 years 6.9 5.3 3.3 2.8 3.6 2.8 1.2 4.9 1.4 5.4 5.34-9 years 10.5 12.3 8.4 13.3 7.9 12.3 7.3 10.4 15.4 13.1 11.410-15 years 10.2 10.4 9.6 7.4 9.8 21.5 8.3 11 36.5 20.6 15.916-20 years 9.9 11.5 9.6 11.1 10.5 9.5 9.3 5.5 29.8 28.7 18.821-25 years 15.7 14.6 14.2 11.8 14.1 15.7 11.7 12.1 12.5 18.8 28.026 years or more 46.4 45.4 53.3 52.0 52.5 37.2 57.5 52.6 4.3 13.4 20.3No Response 0.3 0.6 1.5 1.5 1.6 0.9 4.6 3.5 1.4 0.0 0.2

94
3. Location Of Practice
Which type of area would best describe the location of your practice?
2008% 2009% 2010% 2011% 2012% 2013% 2014% 2015% 2016% 2017% 2018%
Urban 54.8 56.6 50.6 53.9 48.5 51.4 56.7 50.0 51.4 56.1 62.1Suburban 26.8 21.8 26.2 21.4 28.5 25.2 24.0 23.4 36.5 29.0 22.9Rural 15.1 19.3 19.3 20.7 20.0 20.9 15.6 22.5 10.6 11.0 11.8Institutional 3.0 1.7 2.4 1.9 1.0 1.8 1.0 0.9 1.4 3.6 2.7No Response 0.3 0.6 1.5 2.2 2.0 0.6 2.7 3.2 0.0 0.3 0.5

95
4. Owner or Associate
Are you an owner or associate?
2008% 2009% 2010% 2011% 2012% 2013% 2014% 2015% 2016% 2017% 2018%
Owner 77.4 80.7 81.6 78.3 80.7 80.6 80.7 78.6 76.9 71.9 72.2Associate 18.4 14.3 15.1 15.8 15.1 13.5 11.5 15.9 23.1 26.3 27.3No Response 4.2 5.0 3.3 5.9 4.3 5.8 7.8 5.5 0.0 1.8 0.5

96
5. Practice Affiliation
Is your practice:
2017% 2018%
A solo practice 58.5 63.0Multi-practice (Group practice) 36.4 34.3Corporate Dentistry 3.9 1.9No response/Does not know 1.2 0.7
In the next two years, do you intend to:
2017% 2018%
Join a multi-practice 4.1 1.9Join a Corporate Dentistry Org 4.1 3.5Remain a solo practice 91.8 94.6
If a Group Practice, are you:
2017% 2018%
An Owner of a multi-practice 46.3 45.1An Associate in a multi-practice 53.7 54.9
If a Group Practice, Is your multi-practice (Group practice) / Corporate DentistryOrganization:
2017% 2018%
Regional 89.7 89.2National 8.5 10.0International 1.7 0.8

97
If a Group Practice, How many separate Clinics/Locations are there in your multi-practice (Group practice) / Corporate Dentistry Organization?
2017% 2018%
2-4 82.9 75.95 or more 17.1 24.1
Do you feel, as part of a Group Practice, you can offer a higher standard of care than that of asolo practitioner?
2018%
YES 63.2NO 23.3No response/Does not know 13.5
Do you your patients “feel” better serviced or less serviced compared to that of a solepractitioner?
2018%
Better serviced 56.3Less Serviced 7.4Don’t know 36.3

98
If a Group Practice, What do you feel are the key advantages of a multi-practice (Grouppractice) / Corporate Dentistry structure?
2017% 2018%
Have associate support 51.1 57.1Buying Power 29.8 20.0Better hours for patients 6.4 12.4Reach more Patients 2.1 5.7More schedule flexibility 5.3 2.9More variety in locations 2.1 0.0Standardization 1.1 1.9
If a Group Practice, What do you feel are the main drawbacks of a multi-practice (Grouppractice) / Corporate Dentistry structure?
2017% 2018%
Too many levels, too rigid 32.6 12.0Conflict with management style 20.0 29.0Too many staff 11.6 16.0Stress 10.5 2.0Less profit 7.4 5.0Consistency of Care 5.3 21.0Product demand 4.2 0.0None 3.2 9.0Standardization 2.1 2.0Patient Distribution 2.1 4.0Travel Required 1.1 0.0

99
6. Years After Graduation To Set-up Your Practice
If you are an owner, how many years after graduation did you buy/set-up your practice?
2009% 2010% 2011% 2012% 2013% 2014% 2015% 2016% 2017% 2018%
Within the 1st year 41.8 44.0 43.5 33.6 34.7 32.3 29.4 7.3 26.4 22.42 years 13.5 14.3 12.7 17.0 17.1 20.8 18.3 18.9 20.3 23.73 years 11.3 9.7 14.3 13.1 10.0 14.4 8.7 27.4 12.2 10.74 years 6.0 4.6 6.8 7.0 7.6 6.4 8.7 19.5 8.9 6.45 years 7.4 8.9 6.8 7.9 10.0 8.3 9.9 10.4 7.7 9.76 years 2.5 3.5 3.8 4.8 5.6 1.9 4.0 3.7 4.5 4.37 years 2.8 3.9 3.8 4.4 2.8 3.5 4.8 3.0 2 4.38 years 1.1 1.5 1.7 0.4 2.0 3.2 4.0 2.4 4.5 3.79 years 1.4 0.4 1.7 1.7 0.8 1.6 0.0 0.0 1.2 1.010 years or more 12.1 9.3 5.1 10.0 9.6 7.7 12.3 7.3 12.2 13.7

100
7. Number of Dentists in the Practice
How many other dentists are there in your practice?
2008% 2009% 2010% 2011% 2012% 2013% 2014% 2015% 2016% 2017% 2018%
None 39.2 40.9 41.9 40.9 39.7 37.4 39.6 36.1 23.1 34.0 35.5One 29.8 29.1 27.1 30.0 30.2 32.5 28.9 29.5 49.5 24.8 23.4Two 16.3 12.0 12.7 12.1 13.8 12.0 13.0 14.2 16.8 18.2 18.8Three 4.8 8.1 9.0 8.4 8.2 7.7 6.4 7.8 7.2 6.9 7.7Four or more 8.7 7.0 4.8 5.9 5.6 8.9 6.8 9.0 3.4 12.5 11.1No Response 1.2 2.8 4.5 2.8 2.6 1.5 5.4 3.5 0.0 3.6 3.4

101
8. Number of Operatories in the Practice
How many operatories do you have in your office?
2008% 2009% 2010% 2011% 2012% 2013% 2014% 2015% 2016% 2017% 2018%
One 3.9 2.8 3.9 3.1 2.6 2.5 2.4 0.6 0.0 1.5 1.2Two 13.9 16.0 13.0 12.4 12.8 11.0 13.7 11.8 3.4 11.9 11.4Three 20.5 19.0 19.0 25.7 20.7 23.3 19.8 18.8 14.4 13.4 20.8Four 19.3 19.0 18.4 21.4 22.3 23.3 22.7 20.8 31.3 21.8 19.8Five 12.7 12.0 12.0 11.1 12.8 10.4 12.5 16.8 30.3 20.0 17.9More than five 28.0 28.3 30.7 22.6 26.2 27.0 23.0 27.5 20.7 29.3 25.8No Response 1.8 2.8 3.0 3.7 2.6 2.5 5.9 3.8 0.0 2.1 3.1
How many operatories are you planning to add to yourpractice in the next 2 years?
2017% 2018%
None 77.6 72.01 12.2 10.92 3.6 7.53 or more 3.0 6.3No Response 3.6 3.4

102
9. Chairside Days Spent In Practice Per Year
How many chairside days do you spend in your practice per year?
2009% 2010% 2011% 2012% 2013% 2014% 2015% 2016% 2017% 2018%
Under 100 days 4.8 3.9 4.0 5.2 5.5 5.1 4.0 1.9 7.2 6.8100-149 days 12.3 13.6 14.2 8.9 11.0 11.2 13.0 2.4 14.6 11.4150-199 days 35.9 37.3 37.8 38.0 39.0 30.6 32.4 28.4 26.6 30.4200-249 days 35.3 29.8 24.8 28.9 29.1 34.5 28.3 55.3 30.4 29250 days and over 9.2 11.4 15.2 14.4 12.0 11.5 16.8 11.5 18.5 19.6No Response 2.5 3.9 4.0 4.6 3.4 7.1 5.5 0.5 2.7 2.9

103
10. Average Patients Treated Per Day
In an average day, how many patients would you, as the dentist, treat?
2009% 2010% 2011% 2012% 2013% 2014% 2015% 2016% 2017% 2018%
5 or less patients 5.3 3.3 3.1 7.5 5.5 4.2 2.9 2.9 7.5 4.86-10 patients 48.5 44.9 52.9 50.5 51.2 53.3 52.3 78.8 52.8 62.111-14 patients 22.4 24.7 21.7 20.0 20.6 19.3 22.0 15.9 22.4 2215-20 patients 9.8 13.0 9.9 9.2 8.3 8.1 8.1 1.9 7.2 6.8Over 20 patients 8.4 7.5 6.5 6.9 7.7 5.6 6.9 0.5 4.8 4.3No Response 5.6 6.6 5.9 5.9 6.7 9.5 7.8 0.0 5.4 0.0
Average Std Dev Max. Min.2007 13.2 8.7 90 02008 12.7 6.6 70 12009 12.9 8.4 70 02010 13.1 7.7 65 02011 12.2 7.4 80 02012 12.0 8.0 85 02013 12.2 7.7 75 22014 11.7 7.0 65 22015 12.4 8.2 75 22016 9.3 2.7 25 32017 12.3 12.0 125 32017 12.3 12.0 125 32018 11.3 8.6 130 4

104
11. Hygiene Days
How many hygiene days do you have per week?
2009% 2010% 2011% 2012% 2013% 2014% 2015% 2016% 2017% 2018%
1 day 9.2 7.8 7.7 5.9 7.7 7.1 8.1 2.9 8.7 8.02 days 8.4 6.6 9.9 5.2 9.2 7.1 6.9 4.3 8.7 9.23 days 13.2 14.5 8.4 8.9 8.3 9.8 8.4 22.1 9.3 9.74 days 22.1 22.6 27.2 29.2 23.6 24.7 20.2 28.8 23.3 20.05 or more days 35.6 36.4 35.3 39.3 40.8 38.4 44.8 40.4 44.2 46.4No Response 11.5 12.0 11.5 11.5 10.4 13.0 11.6 1.4 6.0 6.8

105
B. Product Purchases and Usage
1. Stage of Office Digitization and Areas Digitized
What stage of ‘digitization’ has your office reached currently?
2017% 2018%
Fully paperless 37.3 32.7Not paperless 37.0 33.7In transition to paperless 25.7 33.7
Which areas of your office are digitized?
2017% 2018%
X-Ray 84.5 86.7In the operatories 64.2 66.4In the Private Office 60.3 61.6Charting 52.8 53.4
3. Utilization of Clinical Portion of Practice Management Software
For those with the applicable systems, are you utilizing the clinical portion of your practicemanagement software (i.e., in the operatory for the charting of treatment)?
2008% 2009% 2010% 2011% 2012% 2013% 2014% 2015% 2016% 2017% 2018%
Currently Using 29.6 29.8 33.9 37.7 38.6 45.5 37.9 45.0 73.9 58.9 56.5Planning To Use 28.3 29.0 24.8 29.3 25.0 27.4 25.9 30.1 17.1 25.5 32.4Don't Plan To Use 42.1 41.2 41.3 33.1 36.4 27.1 36.2 24.8 9.0 15.6 11.1

106
When Planning to Use
Reasons Not Planning To Use
2007% 2008% 2009% 2010% 2011% 2012% 2013% 2014% 2015% 2016% 2017% 2018%
Satisfied with current system 19.0 13.8 4.3 9.7 11.4 3.1 2.5 7.9 7.7 82.4 77.1 84.6Reliability NR 1.1 NR 1.4 2.3 NR NR NR 2.6 NR 2.1 5.1Not flexible enough 1.2 NR NR 1.4 NR NR 2.5 3.2 NR NR 2.1 5.1Too complicated 6.0 8.6 10.0 6.9 4.5 12.5 10.0 4.8 10.3 NR 2.1 2.6No network set-up 6.0 NR 2.9 8.3 2.3 3.1 NR 3.2 10.3 11.8 NR 2.6Paper is easier 16.7 20.7 31.4 20.8 22.7 34.4 37.5 30.2 41.0 NR 6.3 NRNo time 11.9 19.0 8.6 8.3 18.2 18.8 10.0 1.6 12.8 NR 6.3 NRCost 11.9 3.4 8.6 8.3 11.4 3.1 7.5 6.3 5.1 NR 2.1 NRNon-Hygienic 2.4 3.4 NR 1.4 NR 3.1 NR 3.2 NR NR 2.1 NRLack of space 7.1 6.9 2.9 5.6 4.5 NR 2.5 4.8 2.6 5.9 NR NRRetiring 6.0 19.0 11.4 11.1 4.5 6.3 5.0 7.9 5.1 NR NR NRSecurity 1.2 NR 2.9 4.2 NR NR NR 1.6 2.6 NR NR NRNot needed 4.8 3.4 12.9 8.3 11.4 12.5 12.5 17.5 NR NR NR NRNo value to client/no benefit NR NR NR NR 4.5 3.1 5.0 4.8 NR NR NR NRAssociation authorization NR NR NR NR NR NR 2.5 1.6 NR NR NR NRStaff Turnover 2.4 1.7 1.4 NR NR NR NR 1.6 NR NR NR NRLegal reasons 1.1 NR 1.4 2.8 2.3 NR 2.5 NR NR NR NR NR
2008% 2009% 2010% 2011% 2012% 2013% 2014% 2015% 2016% 2017% 2018%
Soon NR 3.3 5.9 18.4 6.3 17.5 2.9 20.0 72.7 86.1 50.0When more productive NR NR NR NR 2.1 NR NR NR NR NR 50.03 months NR 3.3 3.9 6.1 2.1 1.8 5.9 6.7 NR 5.1 NR6 months 12.0 6.7 5.9 4.1 12.5 15.8 11.8 3.3 3.0 3.8 NR1 year 22.0 18.3 23.5 30.6 27.1 26.3 38.2 30.0 18.2 2.5 NR9 months NR NR NR NR NR NR NR NR NR 2.5 NR2 years 52.0 46.7 43.1 30.6 39.6 29.8 29.4 30.0 3.0 NR NRWhen computer in operatories 2.0 NR NR NR NR 1.8 NR NR 3.0 NR NR5 years or more 2.0 10.0 3.9 6.1 4.2 3.5 NR 3.3 NR NR NRWhen software is ready NR NR NR NR NR NR NR 3.3 NR NR NRWhen we go paperless NR NR NR NR NR NR NR 3.3 NR NR NR3 years 4.0 10.0 3.9 2.0 4.2 NR 8.8 NR NR NR NRWhen need to upgrade 4.0 1.7 2.0 NR NR 1.8 2.9 NR NR NR NRWhen it is wireless NR NR NR NR NR 1.8 NR NR NR NR NRWhen affordable NR NR NR NR 2.1 NR NR NR NR NR NR4 years 2.0 NR NR 2.0 NR NR NR NR NR NR NR

107
Dental Equipment
3. Dental Equipment Currently Owned and/or Plan To Buy
Which of the following equipment do you currently own and/or plan to buy in the next two years?
Own Today
2008% 2009% 2010% 2011% 2012% 2013% 2014% 2015% 2016% 2017% 2018%
Digital Radiography 32.8 35.0 42.8 45.5 50.2 61.0 63.3 68.8 80.3 81.5 82.1Electric Handpiece NR NR NR NR NR NR NR NR NR 79.1 71.3Integrated Clinical & Mgt Computer Sys1 40.1 40.6 47.6 49.5 51.8 58.9 56.2 56.4 66.3 63.0 67.1Intra-Oral Camera 49.1 45.7 51.5 49.8 53.4 58.3 60.9 61.6 71.6 62.7 66.7Office Mgt-only Computerized System2 47.9 49.3 45.5 48.0 46.9 51.2 48.4 54.0 52.9 50.1 50.7Laser (Soft Tissue Mgt) 16.6 18.5 19.3 23.5 32.1 32.8 38.9 37.6 52.9 42.7 43.2Interactive Patient Education System 20.5 18.8 23.5 21.4 23.6 24.8 22.7 25.1 31.7 28.1 26.8Digital Impression System NR NR NR 6.2 8.5 8.6 12.7 16.2 13.5 20.6 21.3Chair Side Cad-Cam (fixed restorations) 8.5 11.2 10.8 8.7 11.8 12.6 16.4 16.2 14.9 15.5 16.2Cone Beam Computed Tomography NR NR NR 2.5 3.3 4.0 6.4 7.2 8.2 11.3 10.9Laser (Hard and Soft Tissue Mgt) 3.6 6.2 4.2 8.7 8.2 7.1 6.1 7.8 14.4 9.6 8.7Other 2.7 3.1 3.3 1.9 1.0 1.5 3.9 2.6 0.0 0.3 0.5
Buy In 2 Years
2008% 2009% 2010% 2011% 2012% 2013% 2014% 2015% 2016% 2017% 2018%
Digital Impression System NR NR NR 13.6 17.7 22.4 21.0 23.4 56.3 30.4 34.5Electric Handpiece NR NR NR NR NR NR NR NR NR 11.3 28.7Interactive Patient Education System 15.1 14.6 15.7 11.1 14.8 10.1 14.2 15.3 14.9 17.0 20.0Cone Beam Computed Tomography NR NR NR 9.9 9.2 8.0 10.0 18.2 23.1 14.0 19.6Chair Side Cad-Cam (fixed restorations) 3.3 4.5 5.4 3.7 6.2 5.5 7.1 10.7 25.5 13.1 16.2Laser (Soft Tissue Mgt) 13.0 12.6 15.4 16.1 15.4 14.1 12.5 13.9 15.4 12.2 16.2Laser (Hard and Soft Tissue Mgt) 7.5 6.2 8.4 7.1 7.9 7.1 6.4 9.0 16.8 7.8 15.7Intra-Oral Camera 13.3 14.8 12.0 13.3 12.5 12.3 9.0 16.8 13.0 13.4 13.3Integrated Clinical & Mgt Computer Sys.1 11.4 9.2 10.5 11.8 11.5 8.3 8.3 13.0 10.6 9.3 10.4Digital Radiography 30.1 26.9 24.4 27.9 23.6 20.2 17.8 21.4 11.5 11.3 10.1Office Mgt-only Computerized System2 5.1 4.2 1.5 3.4 5.2 3.4 4.4 3.2 4.8 3.3 5.8Other 3.0 3.1 5.1 2.5 1.6 1.8 2.2 2.6 2.9 0.0 3.4
1 Formerly worded as Integrated Office System2 Formerly worded as Office Management System

108
Dental Equipment
3(a). Product Purchased First
Concerning the equipment you plan to buy, which product would you buy first?
2008% 2009% 2010% 2011% 2012% 2013% 2014% 2015% 2016% 2017% 2018%
Digital Impression System NR 0.9 1.9 8.9 13.6 20.1 22.0 16.6 47.5 34.2 31.4Cone Beam Computed Tomography NR NR 0.9 5.8 7.6 5.4 7.9 7.9 6.8 8.6 10.1Digital Radiography 35.5 30.7 33.5 35.8 29.3 23.5 24.4 22.8 11.3 9.3 9.8Intra-Oral Camera 10.3 11.2 6.5 10.0 10.6 11.3 5.9 10.8 4.5 8.9 9.5Electric Handpiece 9.3 13.5 11.6 2.6 0.5 NR NR NR NR 8.9 7.3Laser (Soft Tissue Mgt) 7.5 11.2 12.6 12.1 13.1 13.2 11.0 10.0 5.6 8.2 6.7Chair Side CAD-CAM 1.9 4.7 3.7 2.1 2.5 4.4 5.1 5.0 10.7 5.9 6.7Laser (Hard & Soft Tissue Mgt) 5.1 3.3 5.1 2.6 2.5 6.4 4.3 5.4 5.1 3.7 4.9Interactive Patient Education System 5.1 6.0 4.7 6.8 5.6 6.4 5.5 6.6 1.1 4.8 4.6Integrated Clinical & Mgt Comp. Syst. 6.1 3.7 3.3 5.8 5.1 2.9 4.7 8.3 4.0 5.2 3.7Misc. Other equipment 6.5 4.7 7.0 2.6 3.0 2.9 5.5 4.6 2.8 0.4 3.7Office Mgt-only Computerized System 1.9 3.3 1.9 1.1 4.5 1.0 2.0 0.8 0.6 1.9 1.8Software NR 0.5 NR 0.5 NR 1.0 0.4 0.4 NR NR NRPanograph NR 0.5 0.9 1.6 NR 0.5 NR 0.4 NR NR NRCaries Detection 5.6 2.8 2.3 NR NR NR 0.4 0.4 NR NR NROperating Microscope 1.9 0.5 1.4 1.6 1.0 0.5 0.4 NR NR NR NROral Cancer Detection 1.4 0.5 0.5 NR 1.0 0.5 0.4 NR NR NR NR

109
Dental Equipment
3(b). Product Purchased Second
Which product would you buy second?
2010% 2011% 2012% 2013% 2014% 2015% 2016% 2017% 2018%
Digital Impression System 1.4 17.0 18.0 19.2 12.7 16.8 11.3 18.0 15.8Electric Handpiece 11.3 0.7 NR 0.8 1.2 0.5 NR 9.2 13.5Chair Side CAD-CAM 8.5 5.2 3.1 5.0 5.4 8.1 15.0 12.4 13.1Interactive Patient Education System 6.4 5.9 10.9 6.7 13.9 6.5 14.2 14.3 11.9Laser (Soft Tissue Mgt) 15.6 17.8 9.4 14.2 6.6 6.5 8.5 7.8 8.8Cone Beam Computed Tomography 0.7 6.7 8.6 10.8 17.5 18.4 14.2 10.1 8.5Intra-Oral Camera 11.3 13.3 8.6 7.5 9.0 13.5 10.6 11.1 7.3Laser (Hard & Soft Tissue Mgt) 8.5 4.4 5.5 4.2 7.8 6.5 9.9 5.5 6.5Integrated Clinical & Mgt Comp. Syst. 6.4 9.6 10.9 10.8 7.2 8.6 9.2 6.5 5.0Digital Radiography 13.5 13.3 14.1 14.2 7.2 7.6 2.8 3.2 4.2Misc. Other equipment 4.3 1.5 3.9 3.3 6.6 4.3 0.7 0.5 3.1Office Management-only Computer 2.8 3.7 4.7 0.8 3.0 1.6 3.5 1.4 2.3Operating Microscope 0.7 0.7 NR 0.8 NR 1.1 NR NR NRSoftware 0.7 NR NR 1.7 0.6 NR NR NR NROral Cancer Detection NR NR 0.8 NR 0.6 NR NR NR NRPanograph 0.7 NR NR NR 0.6 NR NR NR NRComputers in operatory 1.4 NR 1.6 NR NR NR NR NR NRCaries Detection 4.3 NR NR NR NR NR NR NR NRAir Abrasion Unit 0.7 NR NR NR NR NR NR NR NR

110
Dental Equipment
4(a). Preferred Equipment Service Provider
Who is your preferred equipment service provider?
2009% 2010% 2011% 2012% 2013% 2014% 2015% 2016% 2017% 2018%
Full Service Dealer 82.1 82.8 83.6 86.9 84.7 84.6 84.7 89.4 86.3 85.5Independent Technician 9.8 8.1 11.5 9.8 8.9 8.8 9.0 8.2 8.7 9.2Manufacturer 5.0 6.0 1.9 1.3 3.1 4.6 5.2 2.4 4.8 4.6Other 0.0 0.0 0.0 0.0 0.3 0.0 0.0 0.0 0.0 0.2No Response 3.1 3.1 3.1 2.0 3.1 2.0 1.2 0.0 0.3 0.5

111
Dental Equipment
4(b). Preferred Equipment Service Provider – Service Contract or As Needed
Do you prefer a service contract, to have service as needed or other?
2010% 2011% 2012% 2013% 2014% 2015% 2016% 2017% 2018%
to have service as needed 55.1 56.3 61.0 59.5 60.1 62.4 49.5 42.3 60.1a service contract 38.0 34.4 31.1 31.3 34.0 32.7 50.5 55.8 34.0Other 2.4 4.0 3.6 3.4 2.4 2.0 0.0 0.5 2.4No response/Does not know 4.5 5.3 4.3 5.8 3.4 2.9 0.0 1.4 3.4

112
Sundries/Consumable Products
Source For Sundry/Consumable Purchases Source For Sundry/ConsumablePurchases
Preferred Source
1. What approximate percentage of your current sundries/consumables (e.g. paperproducts, impression material, amalgam, restoratives, cements, diamonds, etc.)purchases do you make from the following sources?
Full Service Consumables Grey Market Co-operative Mail Order Direct Fromdealer only dealer Dealer Buying Group Manufacturer
% % % % % %
0% 1.9 52.8 87.7 94.4 85.2 56.71-10% 2.2 20.1 6.1 2.9 8.7 28.611-20% 1.9 11.9 2.4 0.5 2.7 921-30% 2.7 5.8 1.9 1.7 1.7 1.531-40% 2.4 2.4 0.7 0.0 0.5 1.741-50% 5.8 2.4 0.2 0.0 0.0 0.551-60% 5.1 1.2 0.2 0.0 0.2 0.061-70% 6.8 1.0 0.0 0.0 0.0 0.271-80% 16.9 1.2 0.0 0.2 0.0 0.781-90% 17.9 0.7 0.7 0.2 0.5 0.591-100% 36.5 0.5 0.0 0.0 0.5 0.7
2. What would you expect these percentages to be two years from now?
Full Service Consumables Grey Market Co-operative Mail Order Direct Fromdealer only dealer Dealer Buying Group Manufacturer
% % % % % %
0% 3.1 53.3 90.6 89.6 81.6 55.01-10% 2.7 17.4 4.8 4.6 7.7 25.711-20% 3.6 14.3 1.9 1.9 5.6 13.321-30% 3.6 5.3 0.7 0.7 1.7 2.431-40% 2.7 3.1 0.7 0.7 1.2 1.041-50% 7.2 2.4 0.2 0.0 0.5 0.751-60% 5.1 0.7 0.5 0.5 0.2 0.261-70% 9.4 1.2 0.0 0.0 0.0 0.271-80% 18.8 1 0.0 0.5 0.2 0.581-90% 12.8 0.7 0.5 1.2 0.7 0.291-100% 30.9 0.5 0.0 0.2 0.5 0.7
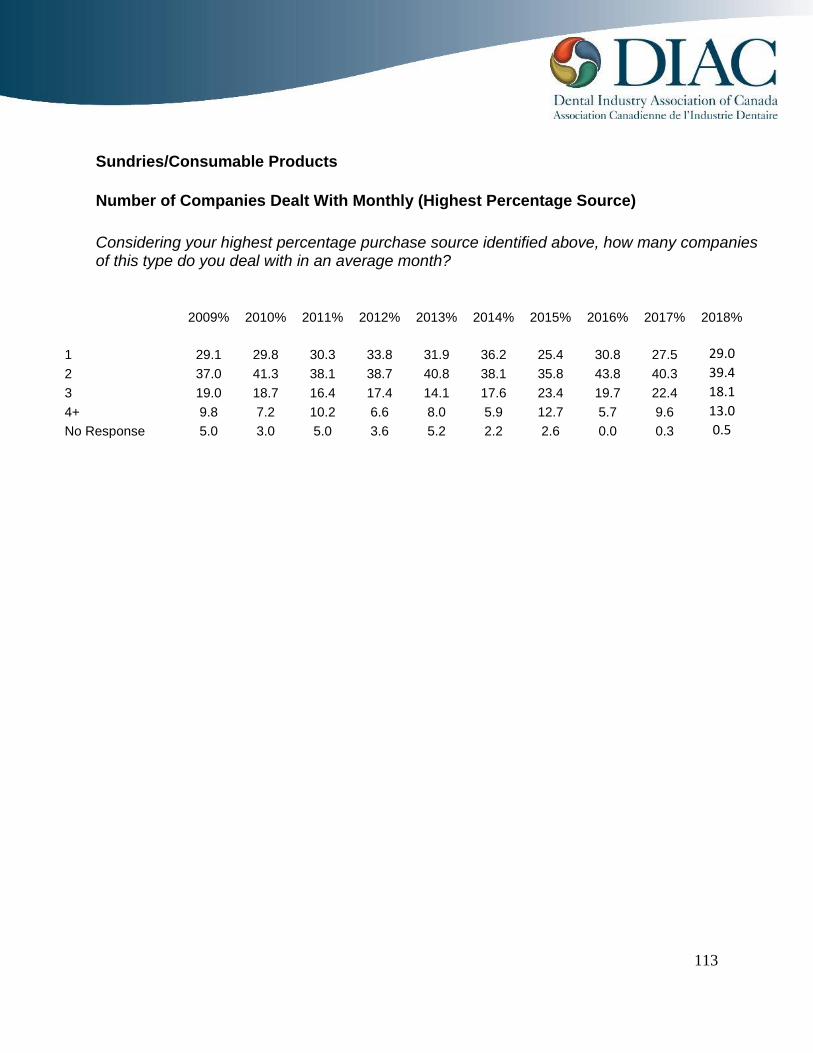
113
Sundries/Consumable Products
Number of Companies Dealt With Monthly (Highest Percentage Source)
Considering your highest percentage purchase source identified above, how many companiesof this type do you deal with in an average month?
2009% 2010% 2011% 2012% 2013% 2014% 2015% 2016% 2017% 2018%
1 29.1 29.8 30.3 33.8 31.9 36.2 25.4 30.8 27.5 29.02 37.0 41.3 38.1 38.7 40.8 38.1 35.8 43.8 40.3 39.43 19.0 18.7 16.4 17.4 14.1 17.6 23.4 19.7 22.4 18.14+ 9.8 7.2 10.2 6.6 8.0 5.9 12.7 5.7 9.6 13.0No Response 5.0 3.0 5.0 3.6 5.2 2.2 2.6 0.0 0.3 0.5

114
Sundries/Consumable Products
Reasons For Purchasing From Current Preferred Supplier
What is your main reason for purchasing from your current preferred supplier?
2009% 2010% 2011% 2012% 2013% 2014% 2015% 2016% 2017% 2018%
Good service 29.9 25.8 26.3 24.5 27.0 23.5 23.2 24.6 19.8 21.2Price 18.6 14.8 15.7 11.1 10.2 13.2 14.9 19.3 16.4 16.3Convenience/saves time 10.7 10.2 10.9 9.7 12.7 11.4 7.0 9.2 17.6 14.8Sales representative 9.3 10.5 13.5 12.4 11.7 11.6 8.5 10.1 13.4 14.6Good relationship 5.5 5.8 4.2 10.4 6.0 7.1 10.7 9.7 12.8 13.4Have contract 3.2 0.6 1.3 1.3 1.6 3.0 1.2 1.0 3.3 4.4Reliability 3.2 4.9 8.0 7.0 7.0 6.6 9.1 7.7 4.0 2.9Delivery 3.5 4.9 1.6 3.4 5.7 4.1 4.9 0.5 4.0 2.7Product availability 5.5 5.2 3.2 7.0 5.7 4.6 4.9 1.4 2.1 2.4Product quality 3.2 3.4 3.5 3.7 1.3 3.3 2.7 4.3 1.2 2.2Customer/technical support 0.9 1.2 0.3 2.3 1.9 2.5 0.9 6.3 1.5 1.5Discount on Bulk Orders 0.9 2.2 0.3 1.3 2.2 NA 0.9 2.4 2.4 1.0Ease of ordering 2.0 3.7 3.5 3.0 2.2 1.8 2.7 0.5 0.6 1.0Knowledge 0.6 1.2 1.3 0.7 0.6 1.0 1.2 0.5 NA 1.0Equipment service 1.4 2.5 2.9 1.0 1.6 3.0 4.0 1.9 0.9 0.5Location 0.6 1.5 1.3 NA 1.3 1.3 1.2 NA NA 0.2Warranty 0.6 NA 1.0 0.7 NA 0.3 NA 0.5 NA NAReputation 0.6 0.9 1.3 0.3 1.3 0.8 1.8 NA NA NAEasy returns/Return policy NA NA NA NA NA 1.0 0.9 NA NA NALoyalty NA 0.6 NA NA NA NA NA NA NA NA

115
Sundries/Consumable Products
Reasons For Expecting Change in Source Percentages
If you anticipate any changes in these percentages over the next two years, why do you feel this will occur?
2009% 2010% 2011% 2012% 2013% 2014% 2015% 2016% 2017% 2018%Good service 4.3 2.4 NR 2.4 1.1 1.5 1.9 39.5 46.9 51.1Better pricing 46.7 48.8 52.7 42.7 43.7 36.9 31.5 29.7 31.0 27.2Computerized/Internet orders 3.3 4.8 5.4 7.3 13.8 6.2 14.8 6.5 3.8 8.1Poor service 5.4 2.4 4.3 8.5 2.3 6.9 5.6 1.1 3.8 2.0Change in sales representative 3.3 2.4 3.2 2.4 4.6 6.2 3.7 0.5 2.4 2.3Mail ordering is cheaper/easier 2.2 2.4 1.1 2.4 4.6 3.8 3.7 4.3 2.4 2.3Manufacturer cutting out middleman 9.8 8.3 5.4 7.3 16.1 8.5 5.6 10.8 5.9 2.3Availability of products NR 3.6 4.3 4.9 3.4 3.8 1.9 NR NR 1.5Market rapidly changing 2.2 NR 2.2 NR NR NR 1.9 3.2 0.3 1.3Speed of delivery 3.3 NR NR NR NR 0.8 NR NR 1.0 0.8Mail Order dealer has better service NR 1.2 NR NR NR NR NR 0.5 0.3 0.3Better incentives 2.2 NR NR NR NR NR NR 0.5 0.3 0.3Better range of suppliers NR NR 1.1 NR NR NR NR 0.5 0.3 NRBetter quality control NR 2.4 2.2 NR NR NR 1.9 0.5 NR 0.3Full service has better service NR 1.2 NR 1.2 2.3 NR 1.9 NR 0.3 NRLess back orders NR NR NR NR NR NR NR NR 0.3 NRCo-op being more accessible 1.1 NR 2.2 1.2 NR NR 1.9 1.6 NR NRConsumable dealers cheaper NR NR 3.2 3.7 NR 2.3 3.7 0.5 NR NRLess frequent visits NR 1.2 NR NR NR NR NR NR NR NRFull service are more expensive 1.1 NR 6.5 3.7 1.1 0.8 7.4 NR NR NRStop Grey Market buying NR NR NR NR NR NR 3.7 NR NR NRPractice expanding/ownership change 1.1 NR 1.1 NR NR 3.1 3.7 NR NR NRIncreased competition 2.2 6.0 1.1 2.4 NR 4.6 1.9 NR NR NRMore Grey Market Dealers NR 2.4 2.2 2.4 1.1 2.3 1.9 NR NR NRReliability 2.2 NR NR NR 1.1 0.8 1.9 NR NR NRMore buying groups forming 3.3 NR NR 2.4 1.1 2.3 NR NR NR NRMore speciality items 1.1 1.2 NR NR 1.1 2.3 NR NR NR NRConvenient/saves time 2.2 2.4 NR 2.4 NR 2.3 NR NR NR NRChange in contract NR NR NR NR NR 2.3 NR NR NR NRDiscount from repeat orders/Bulk orders 1.1 NR NR 1.2 NR 1.5 NR NR NR NRTechnical expertise/maintenance NR NR 1.1 NR 1.1 0.8 NR NR NR NRAdvertising/Promotion NR 1.2 NR 1.2 NR NR NR NR NR NRNew product promotions NR NR 1.1 NR NR NR NR NR NR NRTo lower expenses 1.1 2.4 NR NR NR NR NR NR NR NRChanging economic environment NR 2.4 NR NR NR NR NR NR NR NRType of equipment NR 1.2 NR NR NR NR NR NR NR NREstablished an education program 1.1 NR NR NR NR NR NR NR NR NR

116
Sundries/Consumable Products
Ordering Method
Preferred Ordering Method
1. Approximately what current percentage of your sundries/consumables are ordered bythe following methods?
From your sales By Telephone By Fax Through Dealer By Internetrepresentative Purchase Software
% % % % %0% 23.9 27.1 97.1 77.7 46.71-10% 18.1 22.0 0.5 5.8 14.811-20% 11.8 10.4 0.5 1.7 5.821-30% 5.8 7.5 1.0 2.4 4.431-40% 2.9 2.4 0.0 1.5 3.441-50% 7.7 7.0 0.0 2.2 5.351-60% 2.9 1.7 0.0 1.5 1.561-70% 3.9 3.6 0.0 1.0 1.971-80% 6.8 5.6 0.0 1.7 4.681-90% 5.6 4.1 0.5 1.9 5.691-100% 10.6 8.5 0.5 2.7 6.1
2. What would you expect these percentages to be in two years?
From your sales By Telephone By Fax Through Dealer By Internetrepresentative Purchase Software
% % % % %0% 29.6 38.9 97.8 72.7 35.71-10% 18.9 19.5 0.5 5.4 10.311-20% 9.5 9.7 0.2 3.2 8.621-30% 7.0 6.6 0.7 1.9 931-40% 3.2 2.2 0.0 1.7 3.741-50% 8.5 5.6 0.0 3.4 6.451-60% 3.2 2.2 0.0 1.9 1.561-70% 4.1 2.7 0.0 1.5 2.471-80% 4.4 4.9 0.0 2.2 5.681-90% 2.9 2.2 0.2 1.9 5.491-100% 8.7 5.6 0.5 4.1 11.5

117
Sundries/Consumable Products
Ordering Method
Decision Maker on Brands
Who decides which brands of sundries/consumables are ordered for your practice?
2009% 2010% 2011% 2012% 2013% 2014% 2015% 2016% 2017% 2018%
You personally 36.7 38.3 35.9 33.4 35.0 43.0 36.4 42.3 37.6 33.3One of your staff members 6.2 7.8 7.7 8.2 8.6 7.3 8.4 4.8 11 13.5Both 54.9 50.9 52.9 55.7 54.6 47.2 53.8 52.9 51.3 53.1No Response 2.2 3.0 3.4 2.6 1.8 2.4 1.4 0.0 0.0 0.0

118
Sundries/Consumable Products
Ordering Method
Decision Maker on Where Orders Placed
Who decides where the sundries/consumables are ordered from for your practice?
2008% 2009% 2010% 2011% 2012% 2013% 2014% 2015% 2016% 2017% 2018%
You personally 37.7 35.6 38.0 36.5 34.1 35.3 40.8 39.3 28.8 40.6 34.3One of your staff members 16.3 16.0 13.3 12.7 14.8 16.9 13.9 15.0 12.5 15.2 18.6Both 44.3 45.7 45.2 47.4 47.9 46.0 42.3 44.2 58.7 44.2 47.1No response 1.8 2.8 3.6 3.4 3.3 1.8 2.9 1.4 0.0 0.0 0.0

119
Dental Laboratory Product Usage
Anticipated future usage trends for specific dental laboratory product categories
Do you see your practice placing more, less or the same number of the followingtypes of restorations over the next two years?
More Less Same None% % % %
Porcelain Fused to Metal 10.2 47.4 31.1 11.2All-Ceramic Crowns 56.1 7.3 28.3 8.3Digital Impressions for lab fabrication 47.0 3.0 14.0 36.0CAD-CAM Restoration 37.0 5.4 18.8 38.8Chairside Milled Restoration 19.8 3.7 11.6 64.9All-Ceramic Bridges 37.9 6.1 34.5 21.5Ceramic Veneers 36.3 4.9 46.8 12.0Ceramic Inlays/Onlays 22.1 8.4 39.1 30.5Gold Inlays/Onlays/ Full Gold Crowns 7.6 21.4 39.6 31.4Full Dentures 11.2 19.5 46.3 22.9Flexible Partial Resin Dentures 18.5 8.5 42.0 31.0Metal Partial Dentures 13.4 13.1 58.2 15.3Implant-supported Crowns & Bridges 57.6 1.5 28.7 12.3Implant-supported Dentures 43.1 2.5 30.6 23.8Fixed Orthodontic Appliances 17.5 6.4 31.3 44.8Removable Orthodontic Appliances 24.5 4.2 37.0 34.3Invisalign 44.5 1.5 19.2 34.9Athletic Mouthguards 36.1 2.2 54.4 7.3Snoring & Sleep Apnea Appliances 36.4 2.5 29.2 31.9

120
Dental Laboratory Product Usage
Source of Laboratory Prescriptions Fabricated
What percentage of your laboratory prescriptions are fabricated:
Local LabNon local
Canadian Lab U.S. LabLab Outside
North America% % % %
0% 5.1 75.1 91.9 97.11-10% 1.0 8.8 5.1 1.511-20% 0.5 3.9 1.0 0.521-30% 2.0 1.5 0.0 0.031-40% 0.7 0.2 0.2 0.041-50% 3.4 2.7 1.0 0.051-60% 0.2 0.5 0.0 0.061-70% 1.0 1.2 0.2 0.071-80% 5.1 1.0 0.0 0.081-90% 6.4 0.5 0.5 0.791-100% 74.6 4.6 0.0 0.2
Totals 100.0 100.0 100.0 100.0

121
C. Financing
Leasing
1. Considered Leasing
Have you ever considered leasing equipment?
2008% 2009% 2010% 2011% 2012% 2013% 2014% 2015% 2016% 2017% 2018%
Yes 52.7 52.4 51.2 49.2 59.0 51.5 53.3 52.6 61.1 44.2 50.5No 44.0 43.1 43.1 48.3 38.7 45.7 44.0 45.1 38.5 55.8 48.8No Response 3.3 4.5 5.7 2.5 2.3 2.8 2.7 2.3 0.5 0.0 0.7

122
Leasing
2. Main Influence on Financial Decision
Who is the main influence on your financing decision?
2011% 2012% 2013% 2014% 2015% 2016% 2017% 2018%
Accountant 53.6 54.8 52.8 55.3 58.5 62.5 59.4 56.0Dealer Rep 11.5 11.5 11.3 11.0 12.2 15.4 14.9 17.4Manufacturer Rep 0.9 0.7 3.1 2.2 1.2 5.3 3.6 4.1Other 26.0 25.6 25.8 25.2 28.0 16.8 21.2 21.0No Response 8.0 7.5 7.1 6.4 0.0 0.0 0.9 1.4

123
Leasing
3. Preferred Method To Access Financial Information
How do you prefer to access information about your practice financial instruments? (e.g., leasestatus)?
2008% 2009% 2010% 2011% 2012% 2013% 2014% 2015% 2016% 2017% 2018%
Personal Visit 38.1 29.2 35.9 40.8 35.3 35.9 36.6 36.1 43.8 38.9 36.2Telephone 16.1 19.0 15.9 14.3 18.0 17.6 14.8 14.6 9.6 9.3 10.1On-line/Internet 28.6 35.6 31.5 32.8 33.5 33.1 38.2 34.2 42.3 44.2 46.5Mail 16.8 16.3 16.3 11.5 12.9 12.3 9.1 13.9 4.3 7.5 7.0Other 0.4 0.0 0.4 0.7 0.4 1.1 1.3 1.3 0.0 0.0 0.3

124
Capital Financing
1. Source of Capital Financing
Who would you approach for capital financing for each of the following?
a. To join a group practice 2017% 2018%
Bank 79.3 82.2Royal Bank 4.6 7.4Accountant 5.2 3.7Scotia Bank 1.7 2.5Leasing Company 1.1 1.8Cash 2.9 0.6CIBC 1.1 0.6Dental Supplier 1.1 0.6TD Canada Trust 1.1 0.6Credit Bail 0.6 NRCrediDent 0.6 NRPatterson 0.6 NR
b. To join a dental serviceorganization 2017% 2018%
Bank 74.1 83.9Royal Bank 5.6 7.1Accountant 5.6 2.6Dental Supplier 4.2 NRCash 2.8 0.6Scotia Bank 2.1 2.6TD Canada Trust 1.4 0.6Dental Consultant 1.4 NRBank/Leasing 0.7 1.2CIBC 0.7 0.6Professional Corp 0.7 NRCrediDent 0.7 NRPatterson NR NR

125
c. To expand a multi-practiceorganization 2017% 2018%
Bank 80.0 86.1Royal Bank 5.4 7.2Scotia Bank 2.0 2.6Dental Supplier 1.4 1.4Leasing Company 1.3 1.2Cash 4.0 0.6CIBC 1.3 0.6TD Canada Trust 1.3 0.6National Leasing NR 0.6Professional Corp 2.0 NRCapital Leasing 0.7 NRChoice Health Leasing .0.7 .NR
Capital Financing
2. Reasons For Choosing Source
Why would you choose the source of capital financing you indicated for each?
a. To join a group practice 2017% 2018%
Good relationship 31.1 40.7Previous experience 29.8 32.2Best rate 28.0 20.0Convenient 6.2 4.5Reliable 0.6 1.3Flexibility in payment options 1.9 0.6Comfortable/Trust 0.6 0.6Large amount of money required 0.6 NRAvoid debt 0.6 NRAssistance in start-up 0.6 NR

126
b. To join a dental serviceorganization 2017% 2018%
Good relationship 26.4 40.9Previous experience 23.5 32.2Best rate 16.7 20.1Convenient 4.6 4.7Flexibility in payment options 7.7 0.6Reliable 0.6 0.6Comfortable/Trust 0.6 0.6Knowledge of dental business 0.6 NRLarge amount of money required 0.6 NRAvoid debt 0.6 NROnline management of funds 0.6 NR
c. To expand a multi-practiceorganization 2017% 2018%
Good relationship 30.9 41.7Previous experience 30.9 31.5Best rate 23.7 19.8Convenient 6.5 4.8Flexibility in payment options 3.6 0.7Reliable 0.7 0.7Comfortable/Trust 0.7 0.7Tax advantage 0.7 NRLarge amount of money required 0.7 NRAvoid debt 0.7 NRWarranty 0.7 NR

127
D. Marketing and Customer Service
1. Relative Value of Marketing Vehicles As Sources For New Product Information
Please rate the following from 1 to 5 (with 1 being Not Valuable and 5 being ExtremelyValuable) regarding their influence on your decision to purchase a new product.
Weighted Average (Out of 5)
2008 2009 2010 2011 2012 2013 2014 2015 2016 2017 2018
Lectures/Seminars 3.94 4.03 3.96 4.11 4.14 4.08 4.10 4.27 4.45 4.01 4.11Independent Clinical Studies 4.07 4.00 4.06 4.11 4.06 4.00 4.23 4.22 4.13 4.07 4.14Product Trial 3.70 3.67 3.70 3.77 3.82 3.79 3.83 3.77 4.11 3.95 4.00Dental Peers/Study Clubs 3.82 3.65 3.66 3.91 3.84 3.88 3.92 4.00 4.10 3.88 3.94Dental Journal Articles 3.63 3.61 3.66 3.67 3.68 3.68 3.68 3.72 4.17 3.68 3.79Product Evaluation Organizations 3.66 3.66 3.61 3.80 3.76 3.65 3.81 3.86 3.71 3.64 3.76Dealer Representative 3.46 3.50 3.51 3.54 3.56 3.57 3.59 3.66 3.55 3.61 3.73Dental Convention Exhibit 3.83 3.71 3.85 3.58 3.51 3.55 3.70 3.70 3.66 3.59 3.72Manufacturer Representative 3.27 3.28 3.36 3.42 3.44 3.41 3.47 3.54 3.42 3.57 3.63Lunch & Learn 3.34 3.27 3.33 3.46 3.46 3.44 3.53 3.53 3.40 3.53 3.63Promotions (Special Offers, Discounts, Samples) 3.37 3.14 3.26 3.29 3.26 3.28 3.39 3.36 3.33 3.49 3.58The Internet 3.06 3.00 3.09 3.27 3.19 3.30 3.29 3.39 3.38 3.37 3.47Dealer-Sponsored Information Session 2.80 2.75 2.75 2.78 2.73 2.99 3.07 2.96 3.46 3.36 3.46Dental Laboratory 3.52 3.40 3.46 3.28 3.13 3.26 3.37 3.34 3.21 3.27 3.44Product Literature/Catalogues 2.98 2.96 2.88 3.09 2.99 3.02 3.14 3.12 3.28 3.24 3.39Manufacturer-sponsored Clinic 3.35 3.22 3.27 3.22 3.10 3.20 3.25 3.29 3.21 3.22 3.34Laboratory-sponsored Clinic 3.17 2.97 3.06 3.21 3.15 3.21 3.18 3.28 3.21 3.15 3.31Practice Consultants 2.79 2.82 2.77 2.67 2.71 2.74 2.80 2.75 2.81 2.90 3.02Dental Journal Advertising NR NR NR 2.52 2.54 2.59 2.57 2.42 2.09 2.83 2.89Dental Peers NR NR NR NR NR NR NR NR NR NR NRSamples NR NR NR NR NR NR NR NR NR NR NRStudy Clubs NR NR NR NR NR NR NR NR NR NR NRDiscounts NR NR NR NR NR NR NR NR NR NR NRCustomer Service Personnel NR NR NR NR NR NR NR NR NR NR NRSpecial Offer Coupons NR NR NR NR NR NR NR NR NR NR NRCatalogues NR NR NR NR NR NR NR NR NR NR NR
Other 4.20 4.67 4.60 3.92 3.75 4.17 3.27 NR 3.00 2.43 3.78
*Special Offer Coupons, Samples and Discounts were combined into one category 2007*Dental Peers and Study Clubs were combined into one category in 2007*Product Literature and Catalogues were combined into one category in 2007

128
2. Suggested Service Improvements
(a) Dental DealersHow could dental dealers improve their service to you?
2009% 2010% 2011% 2012% 2013% 2014% 2015% 2016% 2017% 2018%Better pricing 31.7 35.5 45.0 38.5 32.3 34.4 36.8 36.2 36.0 34.8Service good now 15.6 12.4 14.4 11.9 19.8 14.7 14.8 20.8 17.3 15.2More product information/knowledge 4.2 6.2 3.9 5.0 6.1 6.4 5.8 4.3 8.2 11.0More sales visits 5.3 5.0 3.1 5.0 4.9 5.2 7.1 5.8 5.2 5.9Keep better inventory 3.1 4.6 4.4 3.7 4.2 3.2 1.3 3.9 4.9 3.9Prompt delivery on orders/free shipping 2.7 2.7 3.1 4.1 2.7 2.6 2.6 3.9 3.9 3.4Give more samples/product trials 2.7 1.2 2.6 3.2 2.7 3.5 1.9 1.0 2.7 3.2Internet orders/Better online ordering 6.5 1.5 2.6 2.3 1.5 2.3 1.9 3.9 4.2 3.2Offer rebates/buying incentives 1.1 1.9 1.3 2.3 NR NR 0.6 1.0 0.3 2.9Better customer service 3.8 5.0 2.2 2.8 3.4 2.9 3.2 4.8 2.1 2.7Better communication 4.2 1.2 1.7 2.3 1.5 1.7 1.9 2.4 2.1 2.5More catalogues/online catalogues 1.1 1.9 1.3 0.5 1.5 1.7 0.6 1.0 0.3 2.2Bulk ordering 0.4 1.5 1.3 NR 0.8 0.6 4.5 1.4 2.4 1.7More trade shows/seminars/courses 1.5 2.7 2.2 1.8 1.5 1.4 NR 0.5 0.7 1.5Frequent purchase rewards 1.9 NR NR 0.5 NR 4.0 1.3 NR 3.6 1.2Better service of equipment 0.4 2.7 1.7 3.7 1.1 2.3 0.6 0.5 1.2 1.0Better product quality 0.8 1.5 0.9 0.5 0.4 0.3 2.6 NR 0.3 0.7Better accuracy in orders 0.8 1.9 0.4 3.7 2.7 1.4 2.6 0.5 0.3 0.5Return calls promptly NR 0.8 0.9 0.9 1.5 0.9 0.6 0.5 0.7 0.5Prompt credit on returns 0.8 0.8 NR 0.5 NR NR NR NR 0.7 0.5More technicians 1.9 1.2 1.3 0.9 0.8 NR 0.6 1.9 0.3 0.5Better post purchase follow-up 0.4 0.8 NR 0.5 0.8 NR 0.6 1.9 0.3 0.3Less packaging 1.1 NR NR NR 0.4 0.3 1.3 NR NR 0.3One-stop shopping NR NR 0.4 NR NR 0.3 NR 1.0 NR 0.3More products 1.5 1.2 0.9 0.5 0.4 1.2 1.3 0.5 0.7 0.3Unbiased data or product comparison 0.4 0.8 0.4 0.5 1.1 0.6 NR 1.0 1.5 NRHands on demos 0.4 0.4 0.4 0.5 0.4 0.6 0.6 0.5 NR NRBetter statements/less confusing 1.5 0.4 NR 0.9 0.4 0.3 NR 0.5 NR NRHonesty/Honour your promotions 1.1 0.8 2.2 1.4 3.4 3.2 2.6 NR 0.3 NRScheduled sales visits 1.1 2.3 0.9 1.4 1.5 2.3 1.3 NR NR NRImprove warranty 0.4 0.4 NR NR 0.8 0.3 0.6 NR NR NRNo exclusive manufacturers NR NR NR NR NR 0.6 NR NR NR NRPractice Consultant services NR NR NR NR NR 0.6 NR NR NR NROrganize Study Club NR NR NR NR NR 0.3 NR NR NR NRBetter relationship with mfg. rep 1.1 NR NR 0.5 0.4 NR NR NR NR NRSeek feedback from dentists 0.4 NR NR NR 0.4 NR NR NR NR NRLive person on telephone NR 0.4 0.4 NR NR NR NR NR NR NRStop consolidating NR NR NR NR NR NR NR NR NR NR

129
2. Suggested Service Improvements
(b) Dental ManufacturersHow could dental manufacturers improve their service to you?
2009%2010%2011%2012%2013%2014%2015%2016%2017%2018%Good service now 15.4 7.7 12.7 9.8 12.0 7.3 12.9 15.0 16.6 17.8Better pricing 17.5 23.4 23.2 22.0 21.5 19.3 16.7 25.2 19.4 17.6More product trials/samples 8.3 6.8 7.3 10.2 10.3 9.0 7.6 10.7 8.4 8.8Unbiased research data/product comparisons 3.9 5.4 2.7 7.8 4.7 6.3 3.8 6.8 11.3 7.8Deal directly with dentist 8.8 5.9 5.0 6.3 7.7 3.3 7.6 7.3 9.7 6.3Better information/instructions 5.3 5.0 6.4 6.3 6.0 7.0 6.8 4.4 5.6 5.1More serviceable/new products 1.3 0.5 2.3 1.0 NR 1.0 0.8 1.0 1.6 5.3More seminars/courses 2.6 2.7 4.1 3.9 1.7 4.3 2.3 1.9 2.8 4.4More sales visits 7.0 4.5 2.7 4.9 4.7 4.7 4.5 2.4 5.0 2.9Better warrantees 3.1 3.2 1.4 3.4 5.2 3.3 1.5 5.8 2.2 2.9Better communication 1.8 2.3 1.8 1.5 0.9 3.0 1.5 3.9 4.1 2.7Faster delivery/free delivery 0.4 1.8 3.2 2.4 1.3 1.7 2.3 0.5 1.9 2.4Bulk ordering 1.3 0.5 0.9 1.0 0.9 0.3 1.5 NR 1.3 2.4Easier access to orders (e.g. Internet) 5.3 3.6 2.3 3.9 0.4 1.3 1.5 1.9 0.6 2.2Knowledge of products NR 1.4 0.5 1.0 0.4 1.0 0.8 2.4 0.3 2.0Better quality 3.9 5.0 5.9 2.9 4.3 5.0 9.8 3.4 1.9 1.7Better customer service 0.9 2.3 0.9 2.4 1.7 3.0 NR 2.4 1.9 1.2Better service repairs 0.9 2.7 1.8 1.0 1.3 1.3 NR 0.5 0.3 1.2Better inventory 1.3 1.4 1.4 0.5 0.4 2.3 1.5 1.5 2.8 1.0Better promotion of product 1.8 2.3 1.4 1.5 2.6 0.7 4.5 1.0 0.3 1.0Better post purchase follow-up 0.4 NR 0.5 1.0 0.4 0.7 NR NR NR 1.0Instructional Videos/CDs 0.4 NR 0.5 0.5 1.3 1.3 0.8 NR NR 0.7Prompt replies to requested information 0.9 1.4 0.9 NR 0.9 2.0 0.8 0.5 0.9 0.2Better websites NR NR 0.9 0.5 1.3 1.0 NR NR 0.6 0.2Hands on demonstration 0.9 1.4 0.9 0.5 1.7 2.0 NR NR NR 0.2Seek feedback from dentists 0.4 0.5 NR 0.5 NR 1.3 NR NR NR 0.2Sell products to dealers 1.3 0.9 0.9 NR 0.4 1.0 0.8 1.0 0.3 0.2Better packaging 0.9 1.8 0.9 1.0 0.9 1.7 3.8 0.5 NR NRBetter catalogues/literature 0.9 1.4 0.9 NR 0.9 0.7 2.3 NR NR NRStop introducing/changing products NR 1.4 NR NR NR NR 1.5 NR NR NRDirect mailings (fax, e-mail) 0.9 1.4 2.3 0.5 0.4 1.0 0.8 NR NR NRAccuracy in orders 0.4 NR 0.5 0.5 1.7 0.7 0.8 NR NR NRAvoid biased advertising 0.4 0.9 0.9 0.5 0.4 0.7 NR NR NR NRMore distributors for products NR NR 2.3 NR 0.9 0.3 NR NR NR NRScheduled visits NR 0.5 NR 1.0 0.4 0.3 NR NR NR NRKeep staff/avoid turnover NR NR NR NR NR 0.3 NR NR NR NRLonger shelf life 1.3 0.9 NR NR 0.4 NR NR NR NR NRFull support for products NR NR NR NR NR NR NR NR NR NR

130
2. Suggested Service Improvements
(c) Dental LaboratoriesHow could dental Laboratories improve their service to you?
2009% 2010% 2011% 2012% 2013% 2014% 2015% 2016% 2017% 2018%Good service now 23.6 20.9 24.1 28.9 28.0 23.8 25.4 35.7 35.5 34.4Better communication 12.0 8.9 12.7 7.7 10.8 8.9 13.4 10.1 11.7 14.2Faster case turnarounds 11.1 11.1 11.3 10.3 9.5 13.0 13.1 16.9 12.7 13.2Better pricing 12.9 13.8 16.5 12.9 13.4 12.1 10.1 14.0 10.2 10.2Consistent quality 7.6 15.1 9.9 11.3 9.9 12.4 8.6 6.8 10.2 9.0More courses/seminars 6.2 2.7 3.3 4.1 3.0 4.4 1.9 6.8 1.9 4.4Better workflow with digital impressions NR NR NR NR NR 0.6 0.7 1.4 1.9 2.7More in-office visits 0.9 3.1 NR 2.6 3.9 2.2 2.2 1.0 3.1 1.5Better technicians 1.3 0.9 0.5 NR 0.9 0.3 0.4 NR 0.9 1.4Follow instructions carefully 4.0 4.0 3.8 2.6 3.0 1.6 4.5 NR 0.9 1.2Access to information online 2.2 1.3 2.4 1.5 1.3 2.9 1.5 1.0 0.9 1.0Better customer service 0.9 0.9 2.8 2.6 1.7 1.6 1.1 1.0 2.1 1.0Volume discounts/loyalty program 0.4 0.4 0.5 1.0 0.4 1.0 0.4 1.4 0.3 1.0Unbiased research data/product comparison NR NR 0.5 NR NR NR NR 1.0 3.4 0.7Accurate shades/shade selection 1.3 NR 0.9 0.5 0.4 NR 1.9 NR NR 0.7Better case fittings 1.3 NR NR NR 1.3 NR 0.4 NR NR 0.7Involved in treatment planning 0.4 0.4 NR NR 1.3 0.3 NR NR NR 0.5Better warrantees 0.9 NR 0.5 2.1 0.4 0.3 NR NR 0.3 0.5More product trials/samples 0.4 0.4 0.5 0.5 NR 0.6 0.4 NR 0.3 0.5Keep current with new materials 0.4 3.6 2.8 0.5 0.4 1.6 NR NR NR 0.5Better information 3.1 2.7 2.4 1.5 3.0 2.2 1.5 1.0 1.9 0.5Better esthetic work 0.9 1.3 NR 0.5 NR 1.9 1.1 0.5 0.3 0.2Better delivery/pickups 5.8 5.8 2.4 5.7 3.4 5.1 5.6 0.5 0.9 0.2Seek feedback 0.4 0.4 NR 2.1 NR 1.0 2.2 NR NR 0.2More hands on courses NR NR NR NR 0.4 1.0 0.4 NR 0.6 0.2Patient information kits 0.4 NR 0.5 NR NR 0.3 NR NR NR 0.2Offer bonding/cementing kits NR NR NR NR NR 0.3 NR NR NR 0.2Prompt replies to requested info NR NR 0.5 NR NR NR NR 0.5 NR NRDeal directly with dentist NR NR NR NR NR NR NR 0.5 NR NRLonger or weekend hours 0.4 0.4 0.5 NR 1.7 0.3 0.7 NR NR NROpen House 0.4 NR NR 0.5 0.4 NR 0.7 NR 0.3 NRCloser location NR NR 0.5 NR 0.9 NR 0.4 NR NR NRCAD/CAM services NR 0.4 NR NR NR 0.3 NR NR NR NRBetter inventory NR 0.4 0.5 NR 0.4 NR NR NR NR NRMore proactive with imaging technology NR 0.4 NR 0.5 NR NR NR NR NR NRSharing info online 0.4 0.4 NR NR NR NR NR NR NR NRLess packaging NR NR NR NR NR NR NR NR NR NR
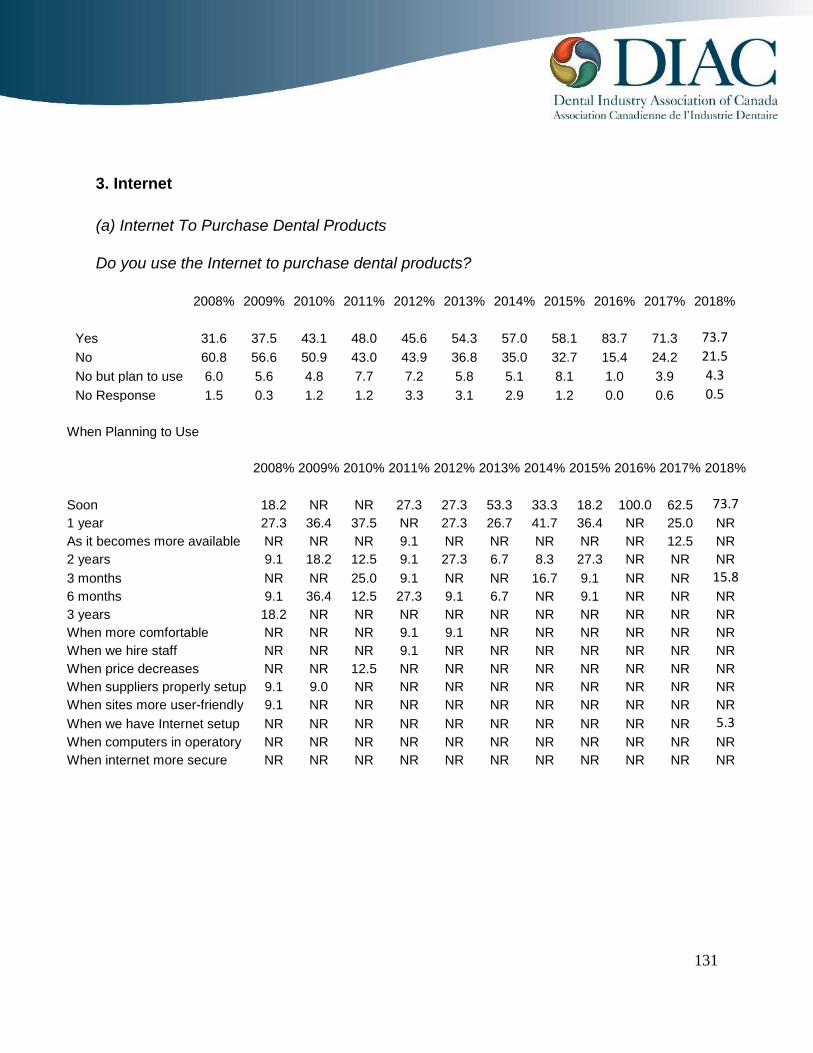
131
3. Internet
(a) Internet To Purchase Dental Products
Do you use the Internet to purchase dental products?
2008% 2009% 2010% 2011% 2012% 2013% 2014% 2015% 2016% 2017% 2018%
Yes 31.6 37.5 43.1 48.0 45.6 54.3 57.0 58.1 83.7 71.3 73.7No 60.8 56.6 50.9 43.0 43.9 36.8 35.0 32.7 15.4 24.2 21.5No but plan to use 6.0 5.6 4.8 7.7 7.2 5.8 5.1 8.1 1.0 3.9 4.3No Response 1.5 0.3 1.2 1.2 3.3 3.1 2.9 1.2 0.0 0.6 0.5
When Planning to Use
2008% 2009% 2010% 2011% 2012% 2013% 2014% 2015% 2016% 2017% 2018%
Soon 18.2 NR NR 27.3 27.3 53.3 33.3 18.2 100.0 62.5 73.71 year 27.3 36.4 37.5 NR 27.3 26.7 41.7 36.4 NR 25.0 NRAs it becomes more available NR NR NR 9.1 NR NR NR NR NR 12.5 NR2 years 9.1 18.2 12.5 9.1 27.3 6.7 8.3 27.3 NR NR NR3 months NR NR 25.0 9.1 NR NR 16.7 9.1 NR NR 15.86 months 9.1 36.4 12.5 27.3 9.1 6.7 NR 9.1 NR NR NR3 years 18.2 NR NR NR NR NR NR NR NR NR NRWhen more comfortable NR NR NR 9.1 9.1 NR NR NR NR NR NRWhen we hire staff NR NR NR 9.1 NR NR NR NR NR NR NRWhen price decreases NR NR 12.5 NR NR NR NR NR NR NR NRWhen suppliers properly setup 9.1 9.0 NR NR NR NR NR NR NR NR NRWhen sites more user-friendly 9.1 NR NR NR NR NR NR NR NR NR NRWhen we have Internet setup NR NR NR NR NR NR NR NR NR NR 5.3When computers in operatory NR NR NR NR NR NR NR NR NR NR NRWhen internet more secure NR NR NR NR NR NR NR NR NR NR NR

132
3. Internet
(b) Internet To Purchase Non-dental Products
Do you use the Internet to purchase any other (i.e., non-dental) products?
2008% 2009% 2010% 2011% 2012% 2013% 2014% 2015% 2016% 2017% 2018%
Yes 64.8 63.3 66.9 64.1 63.0 68.7 69.4 64.6 90.9 73.4 81.9No 33.7 33.9 30.4 31.3 33.1 25.8 25.2 33.1 8.7 23.6 16.9No but plan to use 1.2 2.0 2.1 3.4 1.0 2.5 1.7 2.3 0.5 2.1 1No Response 0.3 0.8 0.6 1.2 3.0 3.1 3.7 0.0 0.0 0.9 0.2
When Planning to Use
2008% 2009% 2010% 2011% 2012% 2013% 2014% 2015% 2016% 2017% 2018%
Soon NR NR NR NR NR 66.7 33.3 NR 62.5 NR 33.41 year 100.0 NR NR 33.3 NR NR 33.3 NR 25.0 NR NRWhen products areavailable
NR NR NR NR NR NR NR NR 12.5 NR NR
2 years NR 100.0 100.0 NR NR NR NR 100.0 NR NR 50.0If need arises NR NR NR NR NR NR 33.3 NR NR NR NR3 months NR NR NR NR NR 33.3 NR NR NR NR 33.36 months NR NR NR 66.7 NR NR NR NR NR NR 33.3When internet more secure NR NR NR NR NR NR NR NR NR NR NR

133
3. Internet
(c) Usage Rate
What is your usage of the Internet as a source of dental information?
2008% 2009% 2010% 2011% 2012% 2013% 2014% 2015% 2016% 2017% 2018%
Frequent 22.0 24.1 27.4 32.5 31.8 35.3 41.8 52.0 67.8 58.5 61.4Occasional 51.5 49.0 47.6 47.4 45.6 47.2 42.5 32.4 27.9 34.0 30.0Seldom 19.6 19.0 18.1 12.4 16.7 11.0 10.0 12.7 4.3 6.6 7.7Never 4.8 6.2 4.5 5.6 3.0 2.8 2.4 2.3 0.0 0.9 0.2Plan To Try In Future 1.2 1.7 1.2 0.3 0.3 0.6 0.5 0.6 0.0 0.0 0.2No Response 0.9 0.0 1.2 1.9 2.6 3.1 2.7 0.0 0.0 0.0 0.5

134
3. Internet
(d) Most Valuable Aspect Of Internet/Email
If you or your staff are INTERNET/EMAIL USERS, on a scale of 1 to 10, howvaluable is the Internet for:
Weighted Average (Out of 10)Today
2008 2009 2010 2011 2012 2013 2014 2015 2016 2017 2018
Product Information 5.51 5.66 5.61 6.36 5.79 6.40 6.49 6.77 7.08 7.14 7.51Clinical Information 5.38 5.58 5.44 5.91 5.50 6.20 6.22 6.56 6.62 6.96 7.19Method for ordering dental products 4.23 4.50 4.73 4.79 4.34 5.08 4.94 5.25 5.39 5.88 6.22Patient Communication NR NR NR 3.69 3.74 4.43 4.47 4.54 4.62 5.07 5.47Consultation with other dentists 4.47 4.90 5.20 4.42 4.46 4.93 4.81 5.21 4.91 5.55 5.43Consultation with insurance carriers 4.44 4.75 5.04 4.89 4.32 4.97 4.98 5.36 5.00 5.54 5.33Interest/News Groups 4.52 4.80 4.75 3.80 3.56 3.93 3.76 3.92 3.51 4.56 4.71Communication with laboratory NR NR NR 3.49 3.11 4.18 3.63 3.66 3.91 4.13 4.36On-line Leasing/Financial Information 3.16 3.32 3.26 3.25 2.92 3.37 2.93 2.93 3.01 3.49 3.41
Weighted Average (Out of 10)In 2 Years
2008 2009 2010 2011 2012 2013 2014 2015 2016 2017 2018
Product Information 6.69 6.48 6.68 7.17 6.72 7.09 7.17 7.25 8.34 7.54 8.02Clinical Information 6.64 6.56 6.41 6.84 6.62 6.92 7.16 7.06 8.15 7.50 7.81Method for ordering dental products 6.04 6.06 6.18 6.25 5.73 6.19 6.11 6.03 7.59 6.81 7.14Patient Communication NR NR NR 5.39 5.62 5.94 6.10 5.81 7.36 6.42 6.58Consultation with insurance carriers 6.05 5.92 6.73 6.33 5.86 6.21 6.10 6.53 6.98 6.60 6.47Consultation with other dentists 6.22 6.31 6.38 5.83 5.95 6.22 5.99 6.02 7.08 6.40 6.32Communication with laboratory NR NR NR 5.11 4.67 5.36 4.95 4.93 6.72 5.46 5.55Interest/News Groups 5.47 5.65 5.47 4.56 4.56 4.47 4.30 4.38 4.35 5.15 5.38On-line Leasing/Financial Information 4.00 3.97 3.99 3.89 3.59 3.76 3.28 3.41 4.49 4.11 3.98

135
E. Continuing Education
Interest In Continuing Education Topics
Please rate the following from 1 to 5 (with 1 being Not of Interest and 5 being ExtremelyInterested) regarding Continuing Education Topics.
Practice Management
2013% 2014% 2015% 2016% 2017% 2018%
Leadership/Team Development 3.19 3.31 3.33 3.54 3.46 3.64Revenue Enhancement/Expense Management 3.38 3.44 3.48 3.50 3.56 3.62Fraud Protection 3.19 3.30 3.38 3.30 3.53 3.59Communication/Case Presentation 3.12 3.19 3.21 3.58 3.27 3.52Marketing the Practice 3.11 3.22 3.38 3.73 3.41 3.49Succession Planning 2.90 2.89 3.10 2.48 3.05 3.25The Paperless Office 2.71 2.73 2.89 3.16 2.81 3.05Finding an Associate 2.60 2.62 2.67 2.35 2.69 2.81
Clinical
2013% 2014% 2015% 2016% 2017% 2018%
Restorative Implants 3.63 3.87 3.94 4.45 3.96 4.01Endodontics 3.42 3.57 3.81 3.62 3.56 3.70Digital Impression Systems 2.95 3.04 3.23 3.85 3.49 3.59Periodontics 3.31 3.50 3.53 3.34 3.51 3.58Surgical Implants 3.05 3.06 3.23 3.59 3.45 3.51Lasers 3.04 3.10 3.22 3.57 3.27 3.42Orthodontics 2.83 2.90 3.05 3.01 3.16 3.20Metal-Free Dentistry 2.68 3.03 3.10 3.32 3.10 3.15CAD/CAM 2.58 2.77 2.85 3.31 2.99 3.09Other 4.70 4.29 4.46 3.17 2.57 3.45

136
Study Club
Type of Study Club
What type of Study Club(s) do you belong to?
2012% 2013% 2014% 2015% 2016% 2017% 2018%
Implant 26.0 25.8 22.2 19.8 18.4 22.7 19.8C&B 19.9 14.3 19.2 20.8 19.4 15.8 15.7Endodontic 6.6 9.3 8.0 14.9 2.5 6.9 10.1Periodontic 9.9 3.8 8.4 5.0 1.0 6.9 5.1Orthodontic 11.6 12.1 18.8 8.9 6.0 12.2 9.9Don’t Belong to a Study Club NR NR NR NR NR 54.9 56.0Other 26.0 34.6 23.4 30.7 0.7 6.3 5.1

137
Continuing Education
Suggestions for Improvement for CE Opportunities
What could be improved with current CE opportunities?
2013% 2014% 2015% 2016% 2017% 2018%
More availability locally 14.1 15.0 20.5 33.5 25.7 17.7Online courses/Webinars/DVD's 12.7 12.5 19.9 13.6 17.9 16.7More hands on 9.9 5.6 12.9 13.6 9.5 16.7Better topics/more detail 12.0 11.3 9.4 6.8 12.8 14.8More convenient times 11.3 16.3 8.8 12.5 8.9 10.0More free sessions/lower cost 9.2 13.8 9.4 6.3 11.2 8.1Less product driven 0.7 0.6 0.6 3.4 0.6 3.8More Core 1 & 2 courses NR 5.0 7.0 1.1 1.1 2.9Better coordination NR NR NR NR 2.2 2.4Better lecturers/speakers 5.6 5.0 1.2 3.4 5.0 2.4Emphasis on techniques/live patients 4.9 3.8 4.7 1.7 2.2 1.9More travel based courses (cruises, etc.) 4.2 3.8 0.6 NR 0.6 1.0Website listing CE opportunities 2.1 0.6 0.6 NR NR 1.0Self-learning CE programs 2.1 NR NR 1.7 0.6 0.5More Study Clubs (i.e., Invitation sponsored) 0.7 NR 0.6 1.1 NR NRUniversity based 2.1 NR 0.6 0.6 0.6 NRMore lunch and learn 1.4 1.9 NR 0.6 0.6 NRGetting accreditation more often 4.2 3.1 0.6 NR NR NRMore advertising 2.1 1.3 0.6 NR 0.6 NRMentorship programs NR 0.6 NR NR NR NRBetter quality handouts 0.7 NR NR NR NR NRLess expensive (i.e., airfare) NR NR NR NR NR NRLess LVI NR NR NR NR NR NRMore Pedodontics NR NR NR NR 0.7 NR
General comments:
Greater lead time for notification More patient interaction More hands on component More locally More on day to day dentistry

138
We don't get too many speakers in the province and always have to go away to learn Quality Not sure, better choosing of lecturers Less cost More study clubs in Edmonton area Very practical and immediately applicable learning. Show/teach something or technique
that can be used the next day in the office. With details not generalizations Remote area, not much available Less expensive All good Location - few local more options more hands on clinical experiences More independent study Better courses more local More meetings more availability Weekend schedules Lab sponsored courses I am happy with CE opportunities "No improvement required MORE LOCAL CE COURSES Some during the summer months Lower cost less travel, more web based CE closer to home and not having to travel to get the best and latest information Lots available topics of discussion presented by specialists More hands on / one on one not many quality CE opportunities in small communities There seems to be a good variety More online I live in a major centre so have lots of opportunities for CE too expensive Actually there seems to be good coverage Cheaper and Higher quality Online availability Saturday, Sunday instead of starting on a Friday More basic science applications to practice More lunch and learn events

139
more online courses More hands on training more available in remote areas especially webinars that are affordable and provide points
for licensing More webinars. be obvious about who is paying for the speakers Less expensive, more certified sources More variety and different times (ex weekends) satisfied Lower cost More CE points should be allowed from e-learning Let me know well in advance about 6 to 12 months more hands-on

140
F. General Trends In Dentistry
Procedures Referred to Specialist
1. Do you currently place the majority of your own implants?
2017% 2018%
Yes 25.7 21.6No but plan to in the future 22.3 21.9Plan to continue have Specialist 51.4 56Other 0.6 0.5
2. What approximate percentage (0-100%) of each of the following procedures do you referto a specialist (or outside of your practice) today?
Oral Surgery Endodontics Orthodontics Periodontics Pedodontics Implants
Denturists/Dental
Mechanics Prosthodontics% % % % % % % %
0% 5.1 5.8 11.4 9.9 13.2 16 39.1 38.11-10% 31 29.9 9.6 26.2 35.8 14 16.5 37.611-20% 13.2 15.2 4.8 10.9 11.7 5.3 4.3 7.421-30% 11.7 8.4 2.8 7.4 11.9 3.0 3.3 2.331-40% 4.6 2.3 1.3 2.3 2.8 1.8 1.0 0.841-50% 11.7 12.2 6.6 9.9 9.6 5.3 9.1 4.151-60% 2.0 0.8 1.8 2.0 1.5 0.0 0.0 0.561-70% 3.6 3.3 3.0 2.5 1.5 1.5 0.5 1.071-80% 6.1 5.3 4.8 5.9 2.0 1.5 4.8 1.381%-90% 4.3 4.1 10.2 5.1 3.3 3.3 4.6 1.091-100% 6.9 12.7 43.7 17.8 6.6 48.2 16.8 6.1

141
2. What would you expect these percentages to be two years from now?
Oral Surgery Endodontics Orthodontics Periodontics Pedodontics Implants
Denturists/Dental
Mechanics Prosthodontics% (direct) % % % % % % %
0% 6.0 7.0 11.7 10.4 16.1 17.2 40.4 40.61-10% 31.0 32.6 10.7 25.3 33.9 13.8 15.6 34.111-20% 12.5 12.5 4.2 11.0 10.9 7.8 3.4 8.321-30% 12.0 9.4 4.2 7.6 11.5 4.2 3.4 3.631-40% 4.9 1.3 2.1 2.6 2.9 1.0 2.1 1.041-50% 12.2 10.7 8.3 11.0 8.6 6.3 8.3 2.951-60% 1.6 1.8 1.3 1.6 0.8 0.5 0.0 0.361-70% 3.1 3.6 3.4 2.1 1.3 1.6 0.8 0.571-80% 5.5 3.9 7.0 5.7 2.9 2.9 2.9 1.881%-90% 3.6 4.2 10.4 4.4 3.4 2.3 5.5 0.891-100% 7.6 13.0 36.7 18.3 7.8 42.4 17.7 6.0

142
Patient Information
(a) Obtaining Information about Dental Procedures
Please rate the following from 1 to 5 (with 1 being Not Mentioned and 5 being Mentioned Often)regarding where you feel your patients are getting information about dental procedures.
Weighted Avg. (Out of 5)
2009 2010 2011 2012 2013 2014 2015 2016 2017 2018
Internet 3.30 3.26 3.40 3.49 3.54 3.70 3.79 4.12 4.07 4.13Family members, friends, etc. 3.58 3.56 3.51 3.53 3.54 3.70 3.73 4.00 3.90 3.97Dentist/Dental Teampresentations 3.47 3.42 3.54 3.59 3.62 3.76 3.91 3.99 3.66 3.76News Media 2.98 2.91 2.99 2.99 2.89 2.78 2.63 2.41 2.74 2.80Media Advertising 3.01 2.97 2.97 2.92 2.78 2.82 2.71 2.42 2.73 2.78Patient Education Brochures/Printed Material 2.76 2.76 2.74 2.83 2.70 2.71 2.66 2.65 2.66 2.69TV Programs 2.91 2.86 2.95 2.86 2.74 2.63 2.44 2.07 2.44 2.41Waiting Room DVDs/Presentations 2.43 2.43 2.44 2.40 2.39 2.52 2.38 2.46 2.41 2.36

143
Patient Information
(b) Inquiries about Dental Procedures
What are your practice’s patients asking you about?
2011% 2012% 2013% 2014% 2015% 2016% 2017% 2018%
Implants 74.0 74.1 72.1 72.9 79.5 89.4 73.7 76.6Cosmetic Dentistry 79.6 78.7 73.3 73.3 76.9 90.9 77.3 73.9Whitening NR NR NR NR NR NR 72.2 71.3TMJ 48.0 54.1 54.9 48.7 55.5 70.2 51.6 49.0X-ray Radiation 46.1 45.9 48.8 46.9 47.7 46.2 47.2 45.9Gingivitis 38.1 43.6 34.0 42.8 42.8 38.5 44.2 41.3Endodontics 33.4 31.5 28.5 33.0 43.6 31.7 35.8 39.9Fluoride NR NR NR NR NR NR 38.5 34.5Toxicity of Materials 42.7 40.3 42.3 36.4 34.1 31.3 29.9 31.9Oral Cancer 30.3 30.5 29.1 29.6 33.2 37.5 31.6 29.7Oral/Systemic Health 39.0 35.7 27.6 34.7 41.9 34.1 32.8 26.1Infection Control Procedures 17.6 14.4 19.0 23.0 24.0 17.8 16.1 22.2Other 4.6 6.9 8.9 7.1 6.4 1.4 0.3 1.2
Totals exceed 100% due to multiple responses.
Practice Promotion
(a) Use of Practice Building Tools
Are you currently using, planning to use or considering any of the following in your practice?
CurrentlyUsing
Plan ToUse Considering
Will NotUse
% % % %
Asking for referrals 60.1 8.5 16.8 14.6Promoting New Technologies 49.1 18.6 19.1 13.2Social Networking (Facebook, Twitter, LinkedIn, etc.) 50.7 14.0 14.2 21.1E-Newsletters/Newsletters/Direct Mail 19.2 14.8 31.3 34.7Traditional Media Advertising 23.2 8.1 25.9 42.8Free Service offering (e.g., a Free Whitening) 15.1 4.6 14.9 65.4Community Service 30.0 13.4 32.0 24.6Other 66.7 0.0 0.0 33.3

144
(b) Use of Patient Financing Options
“Do you currently offer financing options to our patients, such as 12 months Equal MonthlyPayment plans, through any of the following methods?”
2017% 2018%We offer in-house financing where we administer theprocess and assume the credit risk 46.6 45.2We do not offer financing to our patients 40.0 43.0We use a 3rd party financing provider like Health SmartFinancial 18.8 15.2
Practice Promotion
(c) Practice Website
Does your practice currently have a website?
2008% 2009% 2010% 2011% 2012% 2013% 2014% 2015% 2016% 2017% 2018%
Yes 22.9 35.9 31.6 32.8 46.9 50.0 56.7 61.3 82.2 75.8 75.8No 60.2 52.1 53.9 41.5 33.1 29.4 30.6 24.0 13.9 16.7 19.1No but plan to have one 16.3 11.5 13.9 24.1 19.0 18.4 11.5 13.3 3.8 7.5 4.8No Response 0.6 0.6 0.6 1.5 1.0 2.1 1.2 1.4 0.0 0.0 0.2
When planning to have website?
2008% 2009% 2010% 2011% 2012% 2013% 2014% 2015% 2016% 2017% 2018%
soon 12.2 12.1 19.4 14.6 13.3 25.8 24.1 13.9 12.5 36.0 65.01 year 41.5 42.4 30.6 50.0 30.0 38.7 24.1 50.0 62.5 20.0 15.0Within 3 months 7.3 18.2 13.9 6.3 13.3 6.5 27.6 5.6 12.5 16.0 5.0Within 6 months 12.2 9.1 16.7 16.7 13.3 12.9 17.2 11.1 0.0 12.0 5.02 years 14.6 15.2 13.9 10.4 30.0 16.1 6.9 19.4 12.5 16.0 5.03 years 12.2 3.0 0.0 0.0 0.0 0.0 0.0 0.0 0.0 0.0 5.05 years 0.0 0.0 5.6 2.1 0.0 0.0 0.0 0.0 0.0 0.0 0.0

145
Practice Promotion
(d) Top Challenge Intend to Address in 2018“What is the top challenge you intend to address in 2018?”
2018%Getting more patients/keep busy/Less patient visits 32.5Financial/paying bills/overhead/saving for retirement/selling the practice 13.2Staffing issues/keeping staff/vacation time/finding Associate 11.5Equipment/office upgrades/repairs/replacement 6.8Acceptance of treatment plans 5.6Increased competition 5.0Marketing to right audience/Advertising from outside sources 4.3Incorporating new techniques/promoting implants 3.7Too busy/too many patients/scheduling patients 3.1New technologies/Keeping up with technology 2.4Transition/succession planning 1.9Minimize cancellations/no shows 1.9Insurance coverage/dealing with insurance 1.6Effective communication 0.9Complying with regulations 0.6Complex medical problems/health issues 0.3Getting referrals 0.3Recalls 0.3More cosmetic work/C&B 0.3Litigation 0.3Collecting payment/account balances NRPrioritize dental care and treatment NROther NRPatient education NRSatisfy patient needs/Overtreatment NRMisinformed public NRMore seniors/aging population NRLess discretionary spending/tx cost NRLack of space NRDifficult patients NRMaterial/Lab costs NRManaging stress NRPersonal service/emergencies NRQuality of Materials NRSterilization upgrade/procedures NREarly childhood caries/Root caries NRHygiene College interference NR

146
Practice Promotion
(e) Three Key Metrics for Success“What are the three key metrics for success in your practice? (please select up to threeof the following)”
2017% 2018%Getting more patients/keep busy 82.7 74.6Financial/paying bills/overhead 69.9 78.5Staffing issues 51.3 51.2Implementation of technology 32.2 28.5Tracking referrals out practice 11.6 13.3Other 0.3 0.5
Totals exceed 100% due to multiple responses.

147
APPENDIX BDental Industry Association of Canada
Survey Questionnaire Contents

148

149

150

151
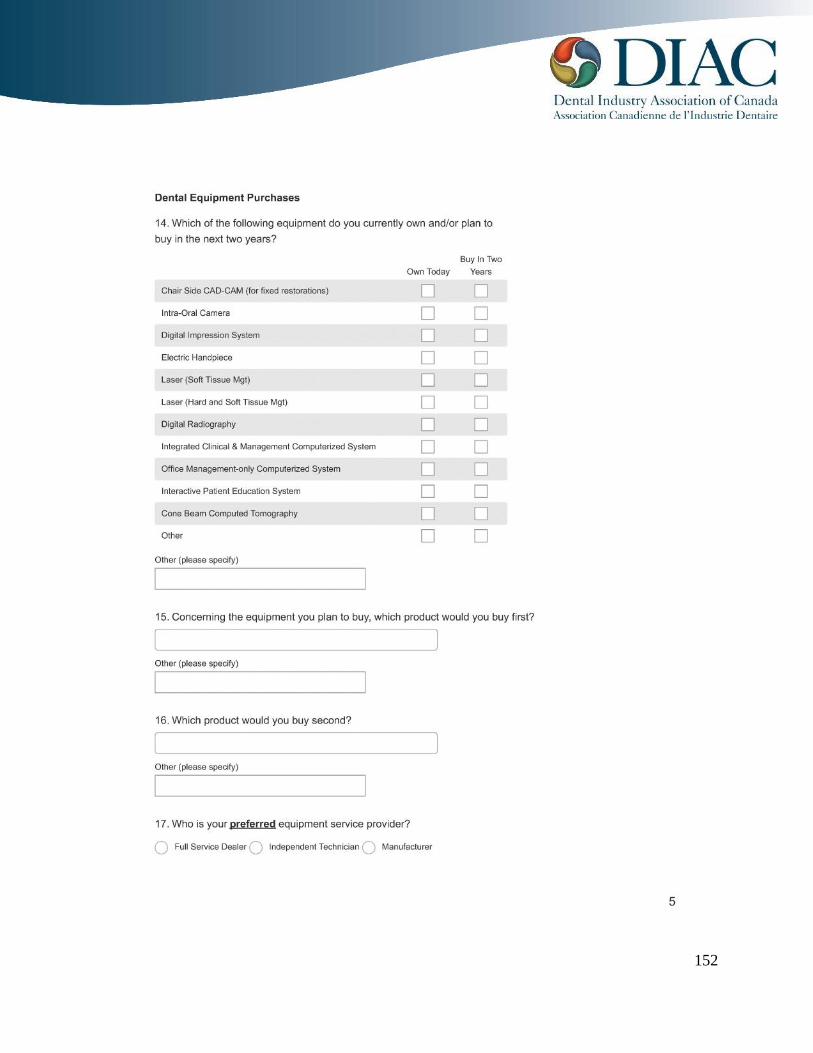
152

153

154

155

156

157

158

159

160

161

162
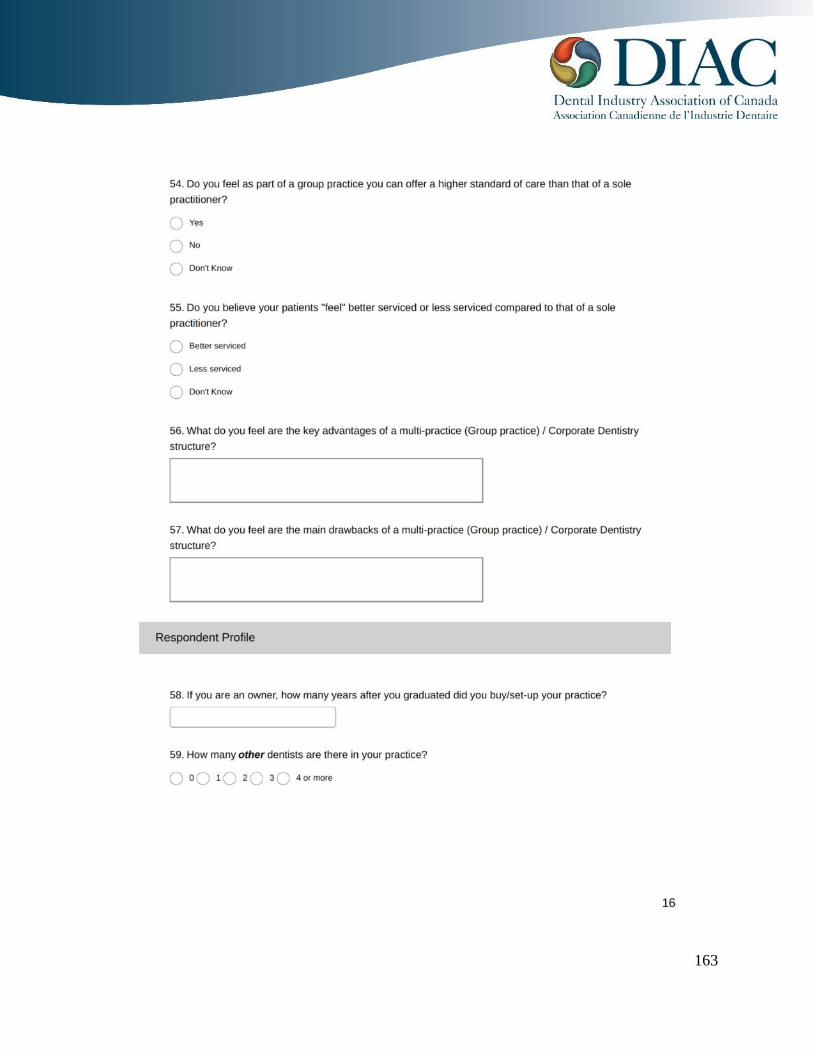
163

164

165

166

167

168

169
APPENDIX CDental Industry Association of Canada
Archived Question Results and Analysis

170
Capital Financing
1. Source of Capital FinancingAll respondents were asked to identify who they would approach for capital financing for avariety of different purchases. As with most financial questions, there was a relatively highnon-response rate for all alternatives ranging from 15% to 28%. This was similar to thatexperienced in previous years. However, when compared to the norms for financialquestions, dentists were surprisingly willing to answer these questions.Who would you approach for capital financing for each of the following?
(a) Practice PurchaseThe vast majority of respondents (97.9%) stated they would approach a bank (either as ageneral statement or by mentioning a specific institution) if considering purchasing apractice. Few financing sources and leasing companies were mentioned at all includingonly Royal Bank (3.6%) and TD Canada Trust (2.6%). Scotia Bank (last year’s top namedinstitution at 7.5% was not mentioned at all). Other options mentioned were Broker, Cashand Leasing company (all only one or two respondents each).(b) Practice ExpansionAgain, banks were the most common response at 94.4%. However, Dental suppliers, leasingcompanies and cash were more frequently mentioned than was the case for practicepurchase. The most common banking institutions mentioned for practice expansion wasRoyal Bank (3.1%) (similar to a range of 2.7-4.6% the last four years) and TD Canada Trust(2.5%).(c) New EquipmentContinuing the trend, banks were the most common response (54.5%) for adding newequipment. As in previous years, leasing companies (17%) (almost at 2010’s record high of17.8%) were a more popular choice for new equipment funding than with either practicepurchase or practice expansion. Dental Suppliers (16.5%, an all-time high) (up from14.6%in 2015, 14.1% in 2014 and up from an average of 10.9% from 2010-2013) continued theirtrend upwards in 2016.

171
2. Reasons for Choosing SourceRespondents were also asked for the reasons behind their choice.Why would you choose the source of capital funding for each?
(a) Practice PurchaseBest rate (34.4%) returned to its position as top reason after a one year hiatus as Number 2last year. It was the top answer in all previous studies prior to last year and has averaged26.9% over the last ten years. Previous experience jumped to 28.6% and second place from6.7% in 2015. Good relationship (23.3%) fell to third place after being #1 in 2015 but wasstill up from its average of 21.2% the last eight years. These were followed by convenience(7.9%) (close to an average of 9.5% the last ten years), reliable (1.6%), Tax advantage,Comfortable/trust, large amount of money required, established line of credit. These laterreasons only reflect the opinions of one or two respondents.(b) Practice ExpansionThe same primary reasons applied for practice expansion: best rate (29.3%) (15 of the past17 years as the top reason), previous experience (27.7%) (dramatically up from an averageof 8.8% the last ten years), good relationship (26.1%) (basically the same percentage as2015 but down from first place 20.6% in 2015 and 19.8% in 2014, 20.4% in 2013, 20.1% in2012, 21.9% in 2011 but higher than an average of 16.7% from 2001-2010), convenience(10.1%) (returning to the average of 10% the last ten years), large amount of moneyrequired, established line of credit and comfortable/trust (3.7%).(c) New EquipmentWhen considering new equipment purchases, Good relationship (20.9% as opposed to20.3% last year and up from an average of 15.4% the last ten years) was the most commonresponse, followed by previous experience (18.1 %, up from 7.6% last year) and then Bestrate (18.6%) in third place (continuing its drop from second last year and the top reason inprevious eighteen years). Convenience (9.8%), knowledge of dental business (8.4 %), taxadvantage (7.4%), avoid interest payments (4.2%), flexibility of payment options (2.3%)and easier than leasing (1.9%) were also mentioned.

172
Capital Financing
1. Source of Capital Financing
Who would you approach for capital financing for each of the following?
a. To purchase a practice 2006% 2007% 2008% 2009% 2010% 2011% 2012% 2013% 2014% 2015% 2016%
Bank 74.8 76.9 76.1 78.9 78.2 71.9 76.6 83.0 77.5 75.0 91.7Royal Bank 1.6 1.9 1.9 3.4 1.9 3.0 4.3 4.7 2.9 4.2 3.6TD Canada Trust 1.6 0.6 2.3 0.9 1.9 1.5 1.0 NR 0.7 1.7 2.6Broker NR NR NR NR NR 0.5 NR NR NR NR 1.0Cash 3.3 4.5 2.3 3.9 3.7 5.9 5.3 4.2 3.2 5.8 0.5Leasing Company 2.6 3.2 2.3 0.9 2.3 3.4 1.0 NR 0.4 1.7 0.5Scotia Bank 4.2 4.5 3.8 3.4 2.8 8.4 2.9 3.8 3.2 7.5 NRDental Supplier 2.0 0.3 1.4 0.4 0.5 1.0 1.0 NR 4.3 0.8 NRBank/Leasing 2.0 0.6 0.9 0.9 0.5 0.5 1.0 1.4 0.7 0.8 NRCIT Group 2.3 2.6 4.2 2.2 1.9 NR 0.5 NR 0.4 0.8 NRDeSante Financial 0.3 0.3 NR 0.4 NR NR 1.0 NR NR 0.8 NRIndependent source NR NR NR NR NR NR NR NR NR 0.8 NRAccountant 1.6 0.3 NR NR NR 1.0 1.4 0.9 3.2 NR NRCIBC 1.3 1.3 0.9 1.7 2.8 0.5 1.4 0.9 1.4 NR NRMediCapital 1.3 0.3 NR 0.4 1.4 NR 1.0 NR 1.1 NR NRHeaps & Doyle NR NR NR NR NR NR NR NR 0.4 NR NRACDQ NR NR NR NR NR NR NR NR 0.4 NR NRBank National NR NR 0.5 0.9 NR NR NR NR 0.4 NR NRBank of Montreal 0.3 0.6 1.4 1.3 0.9 1.0 NR 0.9 NR NR NRPractice Consultant NR NR 0.5 NR NR NR 1.0 NR NR NR NRCDSPI NR NR NR NR NR NR 1.0 NR NR NR NRHealthGroup (Group Sante) NR NR NR NR NR 0.5 NR NR NR NR NRDesjardins NR NR NR NR NR 0.5 NR NR NR NR NRTier Three NR NR NR NR NR 0.5 NR NR NR NR NRSinclair Dental NR NR NR NR 0.9 NR NR NR NR NR NRBusiness Development Bank NR NR NR NR 0.5 NR NR NR NR NR NRNewcourt NR NR NR 0.4 NR NR NR NR NR NR NRHSBC 0.3 0.3 0.5 NR NR NR NR NR NR NR NRCiti Bank NR 0.3 0.5 NR NR NR NR NR NR NR NRHSAA NR NR 0.5 NR NR NR NR NR NR NR NRMCAP NR 0.3 NR NR NR NR NR NR NR NR NRCrediDent NR 0.3 NR NR NR NR NR NR NR NR NRServident 0.3 NR NR NR NR NR NR NR NR NR NR

173
b. To expand your practice 2006% 2007% 2008% 2009% 2010% 2011% 2012% 2013% 2014% 2015% 2016%
Bank 69.7 72.6 68.1 71.4 73.9 67.1 68.5 75.7 68.1 68.0 88.8Dental Supplier 3.8 1.8 1.8 1.6 0.9 2.7 3.7 3.4 7.2 4.7 4.1Royal Bank 1.5 1.8 1.8 2.8 1.8 2.7 4.6 4.3 3.0 3.9 3.1TD Canada Trust 1.5 0.6 2.7 0.8 0.9 1.3 0.9 NR 0.7 1.6 2.5Cash 6.5 5.8 4.0 6.0 4.5 8.0 8.3 3.8 6.3 9.4 0.4Leasing Company 4.1 4.6 5.3 4.8 4.5 4.4 2.8 2.1 2.6 2.3 0.4Accountant 0.3 0.6 0.4 NR NR 0.9 1.4 0.9 3.3 NR 0.4Citi Bank NR NR 0.4 NR 0.5 NR NR 0.4 NR NR 0.4Scotia Bank 3.8 4.0 4.0 3.2 2.7 7.6 2.3 4.3 3.0 6.3 NRBank/Leasing 2.6 1.2 3.1 1.2 1.4 0.9 1.9 1.3 2.0 1.6 NRCIT Group 1.8 2.4 4.4 2.0 0.9 0.4 NR NR 0.3 0.8 NRDeSante Financial 0.3 0.6 NR 0.4 NR NR 0.9 NR NR 0.8 NRPatterson 0.3 NR NR NR NR 0.4 NR NR NR 0.8 NRCIBC 1.2 1.2 0.9 2.0 2.7 0.4 1.4 0.9 1.3 NR NRMedicapital 1.2 0.3 0.4 0.4 2.3 0.4 0.9 0.4 1.0 NR NRGovernment Business Loan NR NR NR NR NR 0.4 NR 0.4 0.3 NR NRBank National NR NR 0.4 0.4 NR NR NR NR 0.3 NR NRSinclair Dental NR NR NR NR 0.9 NR NR NR 0.3 NR NRElement Financial NR NR NR NR NR NR NR NR 0.3 NR NRBank of Montreal 0.3 0.3 1.3 1.2 0.9 0.9 NR 0.9 NR NR NRNational Leasing NR 0.3 NR NR NR 0.4 NR 0.4 NR NR NRHenry Schein Arcona NR NR NR NR NR 0.4 NR 0.4 NR NR NRProfessional Corp NR NR NR NR NR NR NR 0.4 NR NR NRCDSPI NR NR NR NR NR NR 0.9 NR NR NR NRPractice Consultant NR NR NR NR NR NR 0.9 NR NR NR NRCTI Financial NR NR NR 0.4 NR NR 0.5 NR NR NR NRHealthGroup (Group Sante) NR NR NR NR NR 0.5 NR NR NR NR NRDesjardins NR NR NR NR NR 0.4 NR NR NR NR NRBy referral NR NR NR NR NR NR NR NR NR NR NRSun Life/ Assante NR NR NR NR 0.5 NR NR NR NR NR NRBusiness Development Bank NR NR NR NR 0.5 NR NR NR NR NR NRVarndell Leasing NR NR NR NR 0.5 NR NR NR NR NR NRCitiCorp 0.3 0.3 NR 0.4 NR NR NR NR NR NR NRCrediDent NR 0.3 NR 0.4 NR NR NR NR NR NR NRNewcourt NR NR NR 0.4 NR NR NR NR NR NR NRHSBC NR 0.3 0.4 NR NR NR NR NR NR NR NRHSAA NR NR 0.4 NR NR NR NR NR NR NR NRMCAP NR 0.3 NR NR NR NR NR NR NR NR NRATB Financial NR 0.3 NR NR NR NR NR NR NR NR NRTreasury NR 0.3 NR NR NR NR NR NR NR NR NRCiticapital 0.3 NR NR NR NR NR NR NR NR NR NRAsh Temple 0.3 NR NR NR NR NR NR NR NR NR NR

174
c. To add new equipment 2006% 2007% 2008% 2009% 2010% 2011% 2012% 2013% 2014% 2015% 2016%
Bank 44.5 50.3 47.5 51.8 51.0 48.2 48.3 52.2 47.1 46.5 54.5Leasing Company 15.0 14.3 16.9 15.2 17.8 14.2 13.6 10.6 12.0 9.7 17.0Dental Supplier 10.8 10.3 11.0 6.5 9.9 10.3 12.0 11.4 14.1 14.6 16.5Cash 10.5 8.6 5.9 8.0 5.9 10.3 10.7 8.2 10.5 15.3 4.5Royal Bank 1.8 1.4 1.6 2.5 2.4 2.0 2.9 4.7 2.7 2.8 3.0Product Manufacturer 0.5 0.3 0.4 1.8 0.4 1.2 1.2 1.2 0.9 NR 2.5TD Canada Trust 0.8 0.5 1.6 NR 1.6 1.2 1.2 NR 0.6 1.4 2.0Scotia Bank 2.8 3.0 2.4 2.9 2.8 5.1 1.7 3.1 2.4 4.2 NRBank/Leasing Company 5.5 2.4 3.1 1.8 1.2 3.2 2.1 3.5 3.6 1.4 NRVarndell Leasing NR 0.3 NR NR 0.4 NR NR 0.4 0.6 0.7 NRNational Leasing NR 0.3 0.4 0.7 0.4 0.4 NR 0.4 0.3 0.7 NRDeSante Financial 0.5 0.5 NR 0.4 NR NR 0.8 NR NR 0.7 NRPatterson 0.3 NR NR NR 0.4 0.4 NR NR NR 0.7 NRCIT Group 2.8 3.8 4.7 2.2 0.4 0.8 0.4 0.4 0.3 0.7 NRDavidson Dental NR NR NR NR NR NR NR NR NR 0.7 NRAccountant NR NR NR NR NR NR NR NR 1.8 NR NRCIBC 1.0 1.6 0.8 1.4 1.2 0.4 1.2 0.8 0.9 NR NRHenry Schein Arcona 0.5 NR 1.2 1.1 0.4 0.4 0.4 0.8 0.9 NR NRMedicapital 1.0 0.5 0.4 0.7 2.0 0.8 0.8 0.4 0.9 NR NRBank of Montreal 0.5 NR 0.8 1.1 0.8 0.8 NR 0.8 0.3 NR NRCTI Financial NR NR NR 0.4 NR NR NR NR NR NR NRCiti Corp 0.3 0.5 0.4 0.4 0.4 NR NR 0.4 NR NR NRProfessional Capital Inc NR 0.3 NR NR NR NR NR 0.4 NR NR NRProfessional Corporation 0.3 NR NR NR NR NR NR 0.4 NR NR NRCDSPI NR NR NR NR NR NR 0.8 NR NR NR NRSinclair Dental NR NR NR NR 0.4 NR 0.4 NR NR NR NRMediDent/CrediDent NR NR NR NR NR NR 0.4 NR NR NR NRBy referral NR NR NR NR NR NR 0.4 NR NR NR NRMCAP NR NR NR NR NR NR 0.4 NR NR NR NRDesjardins NR NR NR NR NR 0.4 NR NR NR NR NRSun Life/Assante NR NR NR NR 0.4 NR NR NR NR NR NRNewcourt NR NR NR 0.4 NR NR NR NR NR NR NRBank National NR NR 0.4 0.4 NR NR NR NR NR NR NRCapital Leasing NR NR NR 0.4 NR NR NR NR NR NR NRHSBC 0.3 0.3 0.4 NR NR NR NR NR NR NR NRHSAA NR NR 0.4 NR NR NR NR NR NR NR NRMediDent NR 0.5 NR NR NR NR NR NR NR NR NRCrediDent 0.3 0.3 NR NR NR NR NR NR NR NR NRServident 0.3 NR NR NR NR NR NR NR NR NR NRCiticapital 0.3 NR NR NR NR NR NR NR NR NR NRPractice Consultant NR NR NR NR NR NR NR NR NR NR NR
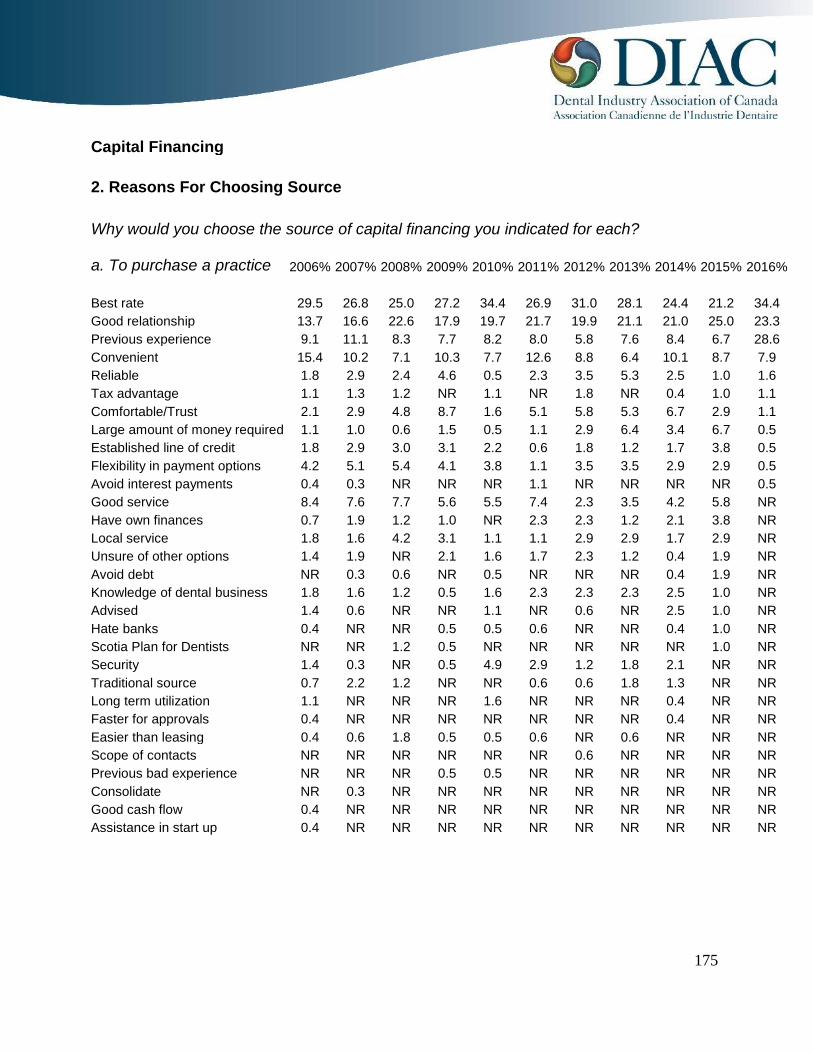
175
Capital Financing
2. Reasons For Choosing Source
Why would you choose the source of capital financing you indicated for each?
a. To purchase a practice 2006% 2007% 2008% 2009% 2010% 2011% 2012% 2013% 2014% 2015% 2016%
Best rate 29.5 26.8 25.0 27.2 34.4 26.9 31.0 28.1 24.4 21.2 34.4Good relationship 13.7 16.6 22.6 17.9 19.7 21.7 19.9 21.1 21.0 25.0 23.3Previous experience 9.1 11.1 8.3 7.7 8.2 8.0 5.8 7.6 8.4 6.7 28.6Convenient 15.4 10.2 7.1 10.3 7.7 12.6 8.8 6.4 10.1 8.7 7.9Reliable 1.8 2.9 2.4 4.6 0.5 2.3 3.5 5.3 2.5 1.0 1.6Tax advantage 1.1 1.3 1.2 NR 1.1 NR 1.8 NR 0.4 1.0 1.1Comfortable/Trust 2.1 2.9 4.8 8.7 1.6 5.1 5.8 5.3 6.7 2.9 1.1Large amount of money required 1.1 1.0 0.6 1.5 0.5 1.1 2.9 6.4 3.4 6.7 0.5Established line of credit 1.8 2.9 3.0 3.1 2.2 0.6 1.8 1.2 1.7 3.8 0.5Flexibility in payment options 4.2 5.1 5.4 4.1 3.8 1.1 3.5 3.5 2.9 2.9 0.5Avoid interest payments 0.4 0.3 NR NR NR 1.1 NR NR NR NR 0.5Good service 8.4 7.6 7.7 5.6 5.5 7.4 2.3 3.5 4.2 5.8 NRHave own finances 0.7 1.9 1.2 1.0 NR 2.3 2.3 1.2 2.1 3.8 NRLocal service 1.8 1.6 4.2 3.1 1.1 1.1 2.9 2.9 1.7 2.9 NRUnsure of other options 1.4 1.9 NR 2.1 1.6 1.7 2.3 1.2 0.4 1.9 NRAvoid debt NR 0.3 0.6 NR 0.5 NR NR NR 0.4 1.9 NRKnowledge of dental business 1.8 1.6 1.2 0.5 1.6 2.3 2.3 2.3 2.5 1.0 NRAdvised 1.4 0.6 NR NR 1.1 NR 0.6 NR 2.5 1.0 NRHate banks 0.4 NR NR 0.5 0.5 0.6 NR NR 0.4 1.0 NRScotia Plan for Dentists NR NR 1.2 0.5 NR NR NR NR NR 1.0 NRSecurity 1.4 0.3 NR 0.5 4.9 2.9 1.2 1.8 2.1 NR NRTraditional source 0.7 2.2 1.2 NR NR 0.6 0.6 1.8 1.3 NR NRLong term utilization 1.1 NR NR NR 1.6 NR NR NR 0.4 NR NRFaster for approvals 0.4 NR NR NR NR NR NR NR 0.4 NR NREasier than leasing 0.4 0.6 1.8 0.5 0.5 0.6 NR 0.6 NR NR NRScope of contacts NR NR NR NR NR NR 0.6 NR NR NR NRPrevious bad experience NR NR NR 0.5 0.5 NR NR NR NR NR NRConsolidate NR 0.3 NR NR NR NR NR NR NR NR NRGood cash flow 0.4 NR NR NR NR NR NR NR NR NR NRAssistance in start up 0.4 NR NR NR NR NR NR NR NR NR NR

176
Capital Financing
2. Reasons For Choosing Source (continued)
Why would you choose the source of capital financing you indicated for each?
b. To expand your practice 2006% 2007% 2008% 2009% 2010% 2011% 2012% 2013% 2014% 2015% 2016%
Best rate 29.9 27.2 20.7 25.2 29.2 28.6 28.2 27.2 23.0 20.6 29.3Previous experience 9.0 10.3 10.1 7.1 10.4 6.8 5.2 9.4 8.7 4.7 27.7Good relationship 13.8 19.7 21.2 17.1 18.2 21.9 20.1 20.4 19.8 26.2 26.1Convenient 14.8 10.0 8.4 11.4 8.9 13.0 9.2 7.3 9.9 7.5 10.1Comfortable/Trust 2.3 2.8 4.5 7.6 2.1 4.2 5.7 5.2 7.1 3.7 1.6Knowledge of dental business 1.6 1.7 1.1 1.0 1.6 3.1 3.4 3.1 3.2 0.9 1.6Reliable 2.3 3.1 2.2 4.3 0.5 2.1 3.4 5.2 3.6 0.9 1.1Tax advantage 1.3 1.0 2.8 1.4 3.6 1.6 1.7 NR 0.8 0.9 1.1Large amount of money required 0.6 1.0 0.6 0.5 0.5 NR 2.3 3.7 2.4 4.7 0.5Established line of credit 1.9 2.8 4.5 3.8 2.1 1.0 1.7 1.0 2.0 4.7 0.5No interest payments 0.3 NR NR NR NR 1.0 0.6 NR NR NR 0.5Have own finances 1.0 1.0 1.7 1.4 0.5 2.6 3.4 1.0 3.6 4.7 NRGood service 8.0 6.6 8.4 5.2 5.7 6.3 2.3 4.2 3.6 3.7 NRFlexibility of payment options 3.5 5.2 4.5 3.8 3.1 1.0 4.6 3.1 2.4 3.7 NRAvoid debt 1.3 NR 0.6 1.0 1.0 NR 1.1 0.5 0.4 2.8 NRLocal service 1.6 1.4 3.4 2.9 1.6 1.0 2.3 2.6 1.6 2.8 NRLease to own NR NR NR NR NR NR NR 0.5 0.8 1.9 NRUnsure of other options 1.0 2.1 NR 1.9 1.6 1.0 1.7 1.0 0.4 1.9 NRAdvised 1.6 0.7 NR 0.5 1.6 NR 0.6 NR 2.4 0.9 NRDislike banks 0.3 NR NR 1.0 0.5 0.5 NR NR NR 0.9 NRCan get equipment from them NR NR NR 0.5 0.5 NR NR NR NR 0.9 NRScotia Plan for Dentists NR NR 1.1 0.5 NR NR NR NR NR 0.9 NRSecurity 1.3 0.3 0.6 0.5 4.7 2.6 1.1 1.6 2.0 NR NRTraditional source 0.6 2.4 1.7 NR NR 0.5 0.6 1.6 1.2 NR NRGovernment NR NR NR NR NR NR NR 0.5 0.4 NR NRLong term utilization 1.0 NR NR NR 1.0 NR NR NR 0.4 NR NRFaster for approvals NR NR NR NR NR NR NR NR 0.4 NR NREasier than leasing 0.3 0.3 1.7 0.5 0.5 0.5 NR 0.5 NR NR NRScope of contacts NR NR NR NR NR NR 0.6 NR NR NR NRDepreciation NR NR NR NR NR 0.5 NR NR NR NR NRPrevious bad experience NR NR NR 0.5 0.5 NR NR NR NR NR NRDealer recommendation NR NR 0.6 0.5 NR NR NR NR NR NR NRConsolidate NR 0.3 NR NR NR NR NR NR NR NR NRGood cash flow 0.3 NR NR NR NR NR NR NR NR NR NROnline management of funds 0.3 NR NR NR NR NR NR NR NR NR NR

177
Capital Financing
2. Reasons For Choosing Source (continued)
Why would you choose the source of capital financing you indicated for each?c. To add new equipment 2006% 2007% 2008% 2009% 2010% 2011% 2012% 2013% 2014% 2015% 2016%
Good relationship 10.8 13.3 19.5 12.8 15.7 16.7 15.7 17.4 17.0 20.3 20.9Previous experience 9.7 11.8 11.0 5.8 9.3 8.1 6.3 8.5 9.7 7.6 18.1Best rate 23.4 23.3 21.0 22.1 24.1 25.7 26.2 24.9 18.4 18.6 14.4Convenient 18.5 12.7 8.0 15.5 9.3 14.3 12.0 10.0 9.4 14.4 9.8Knowledge of dental business 3.1 3.3 2.0 1.3 2.8 4.8 5.2 4.5 3.2 0.8 8.4Tax advantage 5.4 4.8 5.0 6.2 6.5 4.8 3.7 3.0 3.6 2.5 7.4Avoid interest payments 0.6 0.6 NR NR NR 1.0 1.0 NR NR NR 4.2Flexibility of payment options 4.0 6.1 3.0 2.7 5.1 2.9 3.1 4.0 4.0 2.5 2.3Easier than leasing 0.3 0.6 2.0 0.4 0.5 0.5 NR 1.5 NR 0.8 1.9Have own financing 0.6 2.1 2.5 2.7 1.4 3.8 4.2 1.5 5.8 5.9 0.9Avoid debt 3.1 0.3 2.0 1.3 2.8 NR 1.0 2.0 1.8 4.2 0.9Comfortable/Trust 2.0 2.7 3.0 5.8 1.4 3.3 6.3 4.0 5.4 2.5 0.9Reliable 1.1 1.8 2.0 3.5 0.5 1.9 1.6 3.5 3.6 1.7 0.9Established line of credit 1.1 2.4 3.0 4.0 2.8 2.9 2.1 3.0 2.2 2.5 0.5Lease to own NR NR NR NR NR NR NR 0.5 0.7 1.7 0.5Local service 1.4 1.5 3.0 2.7 0.9 0.5 1.0 1.5 0.7 1.7 0.5Good service 8.3 7.0 8.5 7.1 5.6 4.8 2.1 5.0 4.3 3.4 NRShorter terms/Less money needed 1.4 0.6 1.0 0.9 2.8 NR 3.1 NR 2.9 2.5 NRQuick access to new equipment NR NR NR 0.4 NR NR NR NR 1.4 2.5 NRAdvised 1.4 0.6 NR 0.4 1.4 NR 1.0 0.5 1.4 0.8 NRLarge amount of money required 0.6 0.3 NR 0.4 NR NR 0.5 1.5 0.4 0.8 NRUnsure of other options 0.6 1.8 NR 1.3 1.4 0.5 1.6 1.0 0.4 0.8 NRScotia Plan for Dentists NR NR NR 0.4 NR NR NR NR NR 0.8 NRSecurity 0.9 NR 0.5 0.4 3.7 1.0 0.5 0.5 1.4 NR NRTraditional source 0.6 1.5 1.5 NR NR 0.5 NR 1.0 0.4 NR NRPrefer to own equipment NR NR NR NR 0.5 0.5 0.5 NR 0.4 NR NRDealer recommendation NR NR 1.0 0.4 NR 0.5 NR NR 0.4 NR NRGood cash flow 0.3 NR NR NR 0.5 NR NR NR 0.4 NR NRRapid outdating of equipment NR 0.3 NR NR NR NR NR NR 0.4 NR NRGovernment NR NR NR NR NR NR NR NR 0.4 NR NRWarranty NR NR NR NR NR 1.0 NR 1.0 NR NR NRSelling the practice NR NR NR NR NR NR 0.5 NR NR NR NRCost promotion NR NR NR NR NR NR 0.5 NR NR NR NRDislike banks 0.6 NR NR 0.9 0.5 0.5 NR NR NR NR NRBad leasing experience NR NR NR 0.4 0.5 NR NR NR NR NR NRIncentives from manufacturing NR NR 0.5 NR 0.5 NR NR NR NR NR NR
178
F. General Trends in Dentistry
2. Patient Information
(c) Main Changes in Patient Base
What are the main changes you are seeing in your patient base?Respondents were asked what main changes they are seeing in their patient base. The topchange again this year was “increasing age of patients” (26.2%) (steadily increasing since16% in 2007). This was followed by “patients are more informed/ knowledgeable” (22.8%)(number one main change from 2007-2009), “fewer patients/not growing” (10.7%) and“more without insurance” (8.3%).“More cosmetic/esthetic inquiries” showed a rebound in 2016 to 5.3% (after averaging2.1% the last two years as did “more ethnic diversity” (3.4%). The demand for “morecosmetic/esthetic procedures” had been dropping steadily since 18.5% in 2007 and wasnot mentioned at all in 2015. Additional general comments made by respondents areincluded in the detailed tabulations in Appendix A.

179
Patient Information
(c) Main Changes in Patient Base
What are the main changes you are seeing in your patient base?
2007% 2008% 2009% 2010% 2011% 2012% 2013% 2014% 2015% 2016%
Age of patients increasing 16.0 17.2 20.7 24.2 27.6 27.5 28.4 26.2 32.4 26.2More informed/knowledgeable 25.8 29.7 21.1 19.7 11.5 15.0 12.5 12.7 9.9 22.8Fewer patients/not growing 2.2 1.4 3.3 4.0 5.8 6.3 3.5 5.6 9.2 10.7More without insurance 1.1 2.9 2.3 4.0 3.7 5.0 3.9 4.6 3.5 8.3More cosmetic/esthetic inquiries 18.5 14.4 9.4 11.1 7.0 5.0 3.1 3.4 NR 5.3Can only afford basic services NR NR NR NR 2.5 6.3 6.6 3.4 5.6 3.9More ethnic diversity 2.9 1.0 0.5 1.0 1.6 2.5 3.1 2.2 2.1 3.4More internet driven/shop around 5.1 7.7 11.7 8.1 2.9 4.6 5.4 4.3 5.6 2.4More interest in implants 4.0 2.9 3.3 2.5 2.1 1.7 3.1 1.5 0.7 1.9Longer between visits/less treatment NR NR NR NR 2.5 1.7 1.9 2.5 3.5 1.5Nothing 8.4 6.2 10.3 12.6 12.8 7.5 11.3 12.3 9.2 1.0More relying on dental insurance 1.1 1.9 0.9 1.0 2.9 3.8 1.6 3.7 4.9 1.0Increase in patients NR 1.9 3.3 1.5 3.3 4.2 3.5 2.5 0.7 1.0Better oral health 3.3 3.3 2.3 3.0 1.6 1.3 2.3 4.0 2.8 0.5Treatment acceptance/Complex txs NR NR NR NR 0.8 2.1 1.6 3.7 1.4 0.5More caries in children 1.1 2.4 0.9 1.0 0.8 NR NR 0.3 0.7 0.5Younger patients/younger families 3.3 3.8 5.2 3.0 9.5 4.2 5.4 5.9 5.6 NRLess referrals NR NR NR NR NR NR NR NR 2.1 NRMore referrals 2.9 1.9 2.3 1.5 1.2 1.7 1.6 1.2 NR NRLess Children 1.8 0.5 1.9 1.5 NR NR NR NR NR NRPatients willing to spend more 1.5 0.5 NR NR NR NR NR NR NR NRMore adult orthodontics 0.7 0.5 0.5 NR NR NR NR NR NR NRBargaining 0.4 NR NR NR NR NR NR NR NR NR

180
General comments:
none Implant awareness More diverse More sporadic as incomes down patients have more options Need for elective treatment is declining Patients more spending conscious ethnic background Not many Age. None asking a lot about what they read on internet. lower income and aging Older and more immigrants increased caries rate in children Less subsidized dental patients more young professional patients financial uncertainty older, less inclined to advanced treatments Aging population More caries in young people; patients are aware of implants and acceptance is slowly
increasing A lot of young returning patients who now have their own insurance Age increasing more decay in young children Asking for more dentistry decrease due to the increasing number of practitioners none Elderly Aging patient base. Older More children More demanding More and more are relying on insurance to provide for all services Older population Money concern Less people needing dentistry population aging slightly

181
INCREASING SLIGHTLY "more informed shop around" More upper working class Moving from office to office Hopefully more implant desiring companies Getting younger none really, a referral based specialist N.A. Patients using the internet to search for a dentist people have no insurance due to job losses so patients are ones with government
assistance older patients; many new immigrants More word of mouth referrals and Google searches Despite advances in our knowledge and technology, we still see much dental caries.
Pervasive marketing of products high in sugar. Older population more caries in very young children, but more very young children presenting for exams. More questions More middle aged patients More new patients due to internet searches on their part less full dentures, more implants, older people getting ortho, younger people with limited
benefits waiting on necessary dentistry losing insurance More younger adults they are more demanding. and the kids are much harder to deal with overprotective
parents insurance companies are reducing coverage and patients’ dental health is deteriorating.
patients are more anxious Younger Millennials with Bizarre requests more ethnic right now le3ss attendance Less coverage. People are losing their jobs and benefits. Tech savvy Gerontology Merging of a general practice that has a lot of prosthodontic work with a prosthodontic
one Patients are educated about procedures they want More new patients they are more informed and expect more decreasing in size aging

182
Patients are more educated. Patients are opting to postpone treatment. Patients do not seethe value in oral health. Unreasonable expectations for cost/time.
Cares about esthetic Less patience Less insurance coverage patients looking at pricing decrease in patient base due to increase in number of dentists resistance to media marketing....second opinions re: excessive treatment plans Families...but it's always been families more patients getting older Less people with benefits New immigrant population. Economic downturn affecting all dentists in our area. People care more for their teeth m More emergencies slowdown due to oil slump/dental plans gone

183
F. General Trends in Dentistry
3. Practice Promotion
(b) Reasons Patients Are Not Accepting Treatment Plans
Why do you feel patients are not accepting treatment plans?This was a new question in 2011 survey. Only 1% respondents (down from an average of5.4% the last five years) stated that for the most part their patients are, in fact, acceptingtreatment plans. For the third straight year, the top reason given by respondents was“cost/can’t afford” at 76.8% (up from 73.2% last year, 66.8% in 2014 and similar to 74-76% from 2011-2013). Other reasons given were: No insurance/insurance not coveringenough (9.7%), Lack of understanding/education (6.3%) (up from average of 3.8% last fiveyears), Afraid/Fear (2.9%), Lack of trust (1%), and poor case presentation (1%). Thesewere all similar reasons given last year.

184
Practice Promotion
(b) Reasons Patients Not Accepting Treatment Plans
Why do you feel patients are not accepting treatment plans?
2011% 2012% 2013% 2014% 2015% 2016%
Cost/can't afford 74.0 75.0 76.5 66.8 73.2 76.8No Insurance/not covering enough 5.6 7.2 8.2 9.9 6.5 9.7Lack of understanding/education 4.6 2.9 2.7 3.4 5.2 6.3Afraid/Fear 3.5 2.9 2.7 3.1 1.3 2.9They are accepting treatment 7.0 6.5 4.1 5.4 3.9 1.0Lack of trust 1.1 2.9 1.0 1.7 2.0 1.0Poor case presentation 0.4 0.7 1.0 1.4 2.0 1.0Delaying treatment NR NR NR 0.6 0.7 1.0Don't feel it's worthwhile 0.4 0.7 0.7 3.7 2.6 0.5Aging population NR 0.4 1.0 0.6 0.7 NRIncreasing medically compromised 0.4 NR NR NR 0.7 NRMisled by advertising NR NR NR NR 0.7 NRNo time/priorities 2.5 2.5 1.7 2.8 NR NRNot enough payment options NR NR 0.3 0.6 NR NRDentist competition NR NR NR 0.3 NR NRPoor rate of success 0.4 0.4 NR NR NR NRDon't know me well enough yet 0.4 NR NR NR NR NR

185
B. Product Purchases and Usage
Dental Equipment
1. Computer Terminals Currently In Operatories or Plan to Use
Do you have computer terminals in your operatories?
Computer Terminals in Operatories 2004-2016
24%
87%
0%10%20%30%40%50%60%70%80%90%100%
2004 2005 2006 2007 2008 2009 2010 2011 2012 2013 2014 2015 2016
Response to this question was a YES/NO proposition. 86.5% (arecord high and up significantly from73.4% last year, 70.4%in 2014,65.8% in 2013, 59.7% in 2012, 52% in 2011 and 52.4% in 2010) ofdentists in 2016 had computer terminals in their operatories. Afterlevelling off in 2011, usage of computerization in the dentaloperatory is once again trending upward, continuing the steadyincrease from 20% in 2001. Those with the intention to purchase inthe future has dropped off from 2001’s record high of 15.3% to only1.0% this year, likely indicating some conversion from intention toactual use.
This dramatic jump is at least partially caused by the new on-lineonly survey administration methodology as those reached by emailare likely to be predisposed to computer usage in their offices.However, the trend line is certainly valid.

186
B. Product Purchases and Usage
1. Currently Have Computer Terminals In Operatories
Do you have computer terminals in your operatories?
2006% 2007% 2008% 2009% 2010% 2011% 2012% 2013% 2014% 2015% 2016%
Yes 36.3 37.2 45.5 45.1 52.4 52.0 59.7 65.8 70.4 73.4 86.5No 51.4 50.7 42.8 40.9 36.1 36.8 29.8 24.2 23.2 19.1 12.5No, but plan to purchase 11.8 10.4 10.8 12.9 9.9 7.7 8.2 7.5 3.4 5.8 1.0No Response 0.6 1.7 0.9 1.1 1.5 3.4 2.3 2.5 2.9 1.7 0.0
When Plan To Purchase
2006% 2007% 2008% 2009% 2010% 2011% 2012% 2013% 2014% 2015% 2016%
2 years 23.2 25.5 40.0 32.6 20.0 18.5 35.0 42.9 31.3 29.4 50.0Soon 14.3 6.4 5.7 4.3 20.0 18.5 N/A 14.3 12.5 17.6 50.01 year 25.0 36.2 20.0 15.2 20.0 33.3 30.0 42.9 25.0 11.8 N/A6 months 16.1 4.3 11.4 17.4 8.6 7.4 15.0 N/A 6.3 17.6 N/A3 months 7.1 12.8 2.9 8.7 8.6 14.8 5.0 N/A 6.3 17.6 N/AWhen buy digital radiograph N/A N/A N/A N/A N/A N/A N/A N/A N/A 5.9 N/AWhen associate buys practice N/A N/A N/A N/A N/A N/A N/A N/A 6.3 N/A N/A3 years 5.4 6.4 8.6 6.5 2.9 7.4 5.0 N/A N/A N/A N/A5 years or more 5.4 4.3 8.6 15.2 17.1 N/A 5.0 N/A N/A N/A N/AWhen renovating 1.8 N/A N/A N/A N/A N/A 5.0 N/A N/A N/A N/AWhen affordable/reliable N/A 2.1 N/A N/A 2.9 N/A N/A N/A N/A N/A N/ACentral terminal treatment area N/A N/A 2.9 N/A N/A N/A N/A N/A N/A N/A N/A4 years N/A 2.1 N/A N/A N/A N/A N/A N/A N/A N/A N/A

187
E. Continuing Education
2. Preferred Learning Style
What is your preferred learning style?Respondents were asked to name their preferred learning style and were only allowed toselect one response from a list of predetermined categories. The top three most commonoverall learning styles were Clinical Lecture (42.5%) (up from 38.4% last year andcomparable to the previous four years: 43.5% in 2014, 39.3% in 2013, 41% in 2012 and39.9% in 2011), followed by Hands-On Workshop (28.5%) (up from about 23% last threeyears but comparable to 31.1% in 2012 and 28.8% in 2011) and E-Learning/Webcast(11.6%) (which is up from 4 - 6% each year since 2011). Study Club fell off to 11.1%reversing its upward trend over the past five years (22% last year, 18.1% in 2014, 17.2% in2013, 16.1% in 2012 and 15.5% in 2011).The least preferred learning style this year was On-Line Discussion Group (0.5%) (alsolowest preferred learning style the three of the previous four years), followed by Self-StudyMagazine articles (0.5%), Live Patient (2.4%) (down slightly from an average of 3.5% theprevious four years), and Lunch & Learn (2.6%).West Ontario Quebec MaritimesStudy Club 19.0 4.0 10.0 8.7E-Learning/Webcast 6.3 12.0 23.3 13.0On-Line Discussion Group 0.0 0.0 0.0 4.3Hands-On Workshop 26.6 34.7 16.7 30.4Live Patient 2.5 2.7 3.3 0.0Clinical Lecture 44.3 38.7 46.7 43.5Lunch & Learn 1.3 6.7 0.0 0.0Self-Study Magazine articles 19.0 1.3 10.0 8.7All regions prefer Clinical Lecture although the reading for Hands-on Workshop was a closesecond in Ontario. Western dentists were more likely to have preferred a Study Club astheir method of learning than the other regions. E-Learning/Webcast was most highlyrated in Quebec with Self-Study Magazine articles most highly rated in the West.

188
Continuing Education
Preferred Learning Style
What is your preferred learning style?
2011% 2012% 2013% 2014% 2015% 2016%
Clinical Lecture 39.9 41.0 39.3 43.5 38.4 42.5Hands-On Workshop 28.8 31.1 23.3 23.2 22.0 28.5E-Learning/Webcast 4.0 4.3 6.1 4.6 6.8 11.6Study Club 15.5 16.1 17.2 18.1 22.0 11.1Lunch & Learn 4.6 2.6 4.9 2.9 4.5 2.6Live Patient 4.0 3.3 4.0 3.4 2.8 2.4Self-Study Magazine articles 0.6 1.3 4.3 0.2 2.8 0.5On-Line Discussion Group 0.9 0.0 0.3 1.0 0.6 0.5No Response 1.5 0.3 0.6 2.9 0.0 0.5

189
E. Continuing Education
3. Study Club
Do you currently belong to a Study Club?35.6% (slightly down from, but comparable to, the average 37.9% of the previous eightyears) of dentists currently belong to a study club, while a further 0.5% are planning to joinone in the future.West Ontario Quebec MaritimesYes 39.2 32.9 26.7 43.5No 60.8 65.8 73.3 56.5No, but plan to join one 0.0 1.3 0.0 0.0Maritime (43.5%) (up from an average of 31.8% from 2009-2015) and Western (39.2%)(down from an average of 46% the last four years but similar to an average of 35.5% from2009-2011) dentists are most likely to currently belong to a study club. Ontario (32.9%)(down from an average of 41.9% since 2010) and Quebec (26.7%) (close to an average of25% the last five years) that belong to a study club.
4. Type of Study ClubIf YES, what type of Study Club(s) do you belong to?This was a new question for the 2011 survey. Of those currently in a Study Club, the mostcommon type was still C&B (19.4%) (average of 18.6% the previous four years), closelyfollowed by Implant (18.4%) (down from 19.8% last year and lower than the average of25% the last four years), Endodontic (2.5%) (down from an average of 7.9% the previousfour years), Orthodontic (6.0%) (down from an average of 14% the last four years), andPeriodontic (1%) (down from an average of 7.4% the last four years).There few “Other” responses this year (0.7 % as opposed to 30.7% last year). These haveincluded topics such as General Dentistry, Multi-disciplinary, Restorative, Prosthodontics,Occlusion, Operative, Cosmetic, TMD, Prevention, CAD-CAM, and various specifically namedlocal study clubs, notably Alpha Omega, Spear Group and AIDA, in the past.
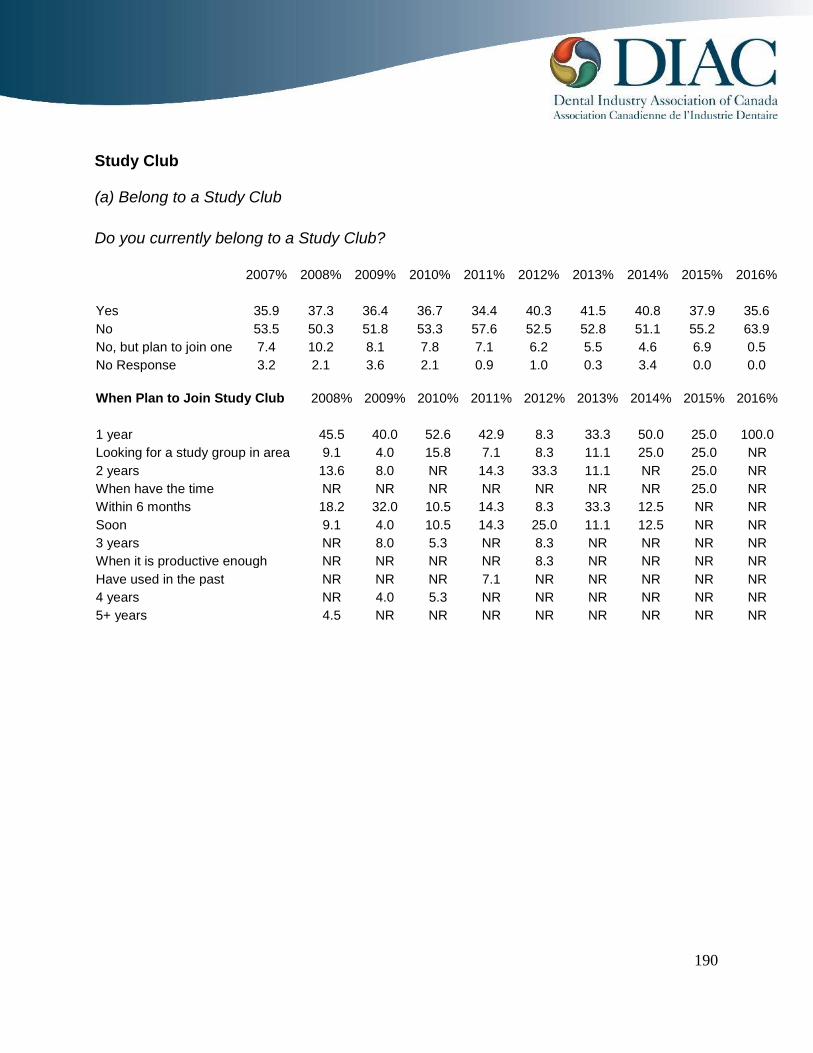
190
Study Club
(a) Belong to a Study Club
Do you currently belong to a Study Club?
2007% 2008% 2009% 2010% 2011% 2012% 2013% 2014% 2015% 2016%
Yes 35.9 37.3 36.4 36.7 34.4 40.3 41.5 40.8 37.9 35.6No 53.5 50.3 51.8 53.3 57.6 52.5 52.8 51.1 55.2 63.9No, but plan to join one 7.4 10.2 8.1 7.8 7.1 6.2 5.5 4.6 6.9 0.5No Response 3.2 2.1 3.6 2.1 0.9 1.0 0.3 3.4 0.0 0.0
When Plan to Join Study Club 2008% 2009% 2010% 2011% 2012% 2013% 2014% 2015% 2016%
1 year 45.5 40.0 52.6 42.9 8.3 33.3 50.0 25.0 100.0Looking for a study group in area 9.1 4.0 15.8 7.1 8.3 11.1 25.0 25.0 NR2 years 13.6 8.0 NR 14.3 33.3 11.1 NR 25.0 NRWhen have the time NR NR NR NR NR NR NR 25.0 NRWithin 6 months 18.2 32.0 10.5 14.3 8.3 33.3 12.5 NR NRSoon 9.1 4.0 10.5 14.3 25.0 11.1 12.5 NR NR3 years NR 8.0 5.3 NR 8.3 NR NR NR NRWhen it is productive enough NR NR NR NR 8.3 NR NR NR NRHave used in the past NR NR NR 7.1 NR NR NR NR NR4 years NR 4.0 5.3 NR NR NR NR NR NR5+ years 4.5 NR NR NR NR NR NR NR NR

191
Study Club
Type of Study Club
If YES, what type of Study Club(s) do you belong to?
2011% 2012% 2013% 2014% 2015% 2016%
C&B 19.1 19.9 14.3 19.2 20.8 19.4Implant 26.1 26.0 25.8 22.2 19.8 18.4Endodontic 7.6 6.6 9.3 8.0 14.9 2.5Orthodontic 13.4 11.6 12.1 18.8 8.9 6.0Periodontic 7.6 9.9 3.8 8.4 5.0 1.0Other 26.1 26.0 34.6 23.4 30.7 0.7

192
D. Marketing and Customer Service
3. InternetThe section on Internet usage has been dramatically changed year-by-year based on theprevious response indicating greater computer usage by dentists.(a) Internet Connection
Do you have an Internet/Email connection: At the Front Desk, in the operatories, in thePrivate Office?This question was revised in 2011 to also uncover the location of a practice’s Internet/Email connection. Multiple responses were allowed and most respondents selected morethan one location. For the first time, all dentist respondents have Internet access in theirpractice (up from 98.3% in 2015, about 95% in 2014/2013 and a steady increase from89.8% in 2012, 85.8% in 2011, 78% in 2010, and an initial 28.4% in 2000).
Internet Connection in the Dental Practice 2011-2016
Over ninety-two percent (92.3%) (up from 87.3% last year, 82.9% in 2014 and 67.2% in2011) of dentists have their connection located “At the Front Desk”, while 82.2% (up from70.2% last year, 69.2% in 2014 and 56.7% in 2011) have a connection “In the PrivateOffice”. Only 65.9% (although steadily trending upward from54% last year, 49.4% in 2014,43.6% in 2013, 38.4% in 2012 and 27.2% in 2011) have an Internet/Email connection inthe operatories.
At the Front Desk 92%
In the operatories66%In the PrivateOffice 82%
No Internet/EmailConnection 0%0%20%40%60%80%
100%
2011 2012 2013 2014 2015 2016

193
3. Internet
(a) Internet Connection
Do you have an Internet/Email connection:
2011% 2012% 2013% 2014% 2015% 2016%
At the Front Desk 67.2 73.4 78.5 82.9 87.3 92.3In the operatories 27.2 38.4 43.6 49.4 54.0 65.9In the Private Office 56.7 59.3 68.1 69.2 70.2 82.2No Internet/Email Connection 14.2 10.2 4.6 4.9 1.7 0.0
*Totals exceed 100% due to multiple responses.

194
D. Marketing and Customer Service
4. Conventions
(a) Influence on Decision to Visit Exhibit Floor
Please rate the following from 1 to 5 (with 1 being Not Valuable and 5 being ExtremelyValuable) regarding their influence on your decision to visit the Exhibit Floor at a convention.Respondents were given a list of predetermined aspects that might influence their decisionto visit the Exhibit Floor at a convention and asked to rate them from Not Valuable toExtremely Valuable using a 1 to 5 scale. Response to each of the options again showed aneven distribution without polarization (i.e., with one large group saying 1 and anothersaying 5 giving a misleading average of 3). A new category, New Technologies, was addedto the 2011 survey.
Influence on Decision to Visit Exhibit Floor
As with last eight years, Product Samples (4.15 out of 5) were the most influential aspecton dentist’s decision to visit the exhibit floor, followed closely by New Technologies (4.10),Hands-on Demonstrations (3.9o) and Discount/Specials (3.76). These continue to be thetop four aspects year after year.The aspects with the least influence were also the same as last year: Contests at 1.86, On-Floor Events (e.g., Wine & Cheese, etc.) (2.44) and Advance Direct Mail Announcements(3.30).
4.154.103.903.763.302.442.251.86
Product SamplesNew TechnologiesHands-on DemonstrationsDiscount/SpecialsAdvance Direct Mail AnnouncementsOn-Floor Events (e.g. Wine & Cheese, etc.)OtherContests
Weighted Average (Out of 5)

195
West Ontario Quebec MaritimesContests 1.90 1.00 2.33 1.57Hands-on Demonstrations 3.76 3.93 4.30 3.96New Technologies 4.00 4.11 4.23 4.26Product Samples 4.16 4.11 4.43 3.91Discount/Specials 3.84 3.66 4.07 3.43On-Floor Events (e.g. Wine & Cheese, etc.) 2.58 2.18 2.73 2.39Advance Direct Mail Announcements 3.23 3.29 3.50 3.35Other 2.00 1.00 0.00 4.30The Maritimes and Quebec were slightly more likely to value New Technologies than otherregions. Maritime doctors were much less likely to value Product Samples more than otherregions. This was similar to last year’s results.(b) Average Time Spent on Exhibit Floor
How long do you spend on the Exhibit Floor on average (hours per day)?
Dentists Are Spending Less Time on Exhibit Floor
This was a new question for the 2011 survey. In 2014, the question was altered slightly toask respondents to specify in “hours per day”, in order to get a more statistically accurateanalysis. Overall, 73% (down from 81.6% last year and 80.3% in 2014 but comparable to
71% 65% 71% 80% 82% 73%
29% 35% 29% 20% 18% 27%
2011 2012 2013 2014 2015 2016
4 hours or more
3 hours or less

196
71.2% in 2013, 64.8% in 2012, 71.4% from 2011) of respondents spent 3 hours or less perday on the exhibit floor itself during their attendance at a typical Convention with 43%(down from 61.3% last year and 57.4% in 2014 but comparable to 48.3% in 2013, 43.1% in2012 and 43.8% in 2011) spending two hours or less per day. A little over 11% (reversingthe trend from 21.9% last year and 19.4% in 2014 back towards the 14.4% in 2013, 14.1%in 2012 and 12.4% in 2011) stayed on the exhibit floor for one hour or less per day. Ineffect, these results show that dentists are moving back towards spending more time on theconvention floor, albeit in the first year of a new on-line survey administration.On the other side of the ledger, 27.1% (back up from 18.4% last year and 19.7% in 2014 tosimilar levels as the 28.7% in 2013, 35.2% in 2012 and 28.6% in the 2011 survey) statedthey were visiting the Exhibit Floor for 4 hours or more per day. Again, this illustrates anincrease in Convention Floor attendance time.West Ontario Quebec Maritimes1 hour or less 9.0 15.8 0.0 17.42 hours 25.6 36.8 33.3 34.83 hours 29.5 23.7 53.3 21.74 hours 21.8 17.1 10 17.45 or more hours 14.1 6.6 3.3 8.7Average time 3.1 hours 2.6 hours 2.8 hours 2.7 hours
Regionally, Western (3.1 hours per day) (as per the average of 3 hours from the past fouryears) respondents spent more time visiting the Exhibits on average than Quebec at 2.8hours on average, Maritimes (2.7 hours) and Ontario (2.6 hours).

197
(c) Attend Convention with No Exhibit Floor
Would you still attend a Convention if there was no Exhibit Floor?
Respondents were asked if they would still attend a convention without an exhibit floor.For the first time, the number of respondents who would not attend a convention if itlacked a convention floor was equal to those that would. This is a large change fromprevious results were only 18.5% last year (compared to 18.8% in 2014, 16.9% in 2013,21.3% in 2012, 17.3% in 2011) would not. In previous years, almost 60% of respondents(58.4% last year, 58.9% in 2014, 58.3% in 2013, 56.1% in 2012 and 59.8% in 2011) overallwould still attend a convention, even if it had no Exhibit Floor. A further 9% did not know.West Ontario Quebec MaritimesYes 39.2 50.7 36.7 60.9No 51.9 40.0 53.3 34.8Don't Know 8.9 9.3 10.0 4.3Regionally, 60% of Maritime (compared to from 66.7% last year, 70.4% in 2013, 50% in2012, 67.7% in 2011) and 54.1% of Ontario (up from 52.1% last year, 48.2% in 2013, 49%in 2012, 49.5% in 2011) would still attend. On the other hand, this drops to 36.7% ofQuebec respondents (down from 72.1% last year, 72.1% in 2014, 70.8% in 2013, 74.5% in2012 and 67.7% in 2011) were less likely to still attend if it did not have an Exhibit Floor,while only 39.2% of Western (down from 58.3% last year, 63.8% in 2014, 58.3% in 2013,55% in 2012, and 62.8% in 2011) would still attend.
No46%
Yes45%Don’t Know9%

198
(d) Main Reasons for Not Visiting Exhibit Floor
If you don’t visit the Exhibit Floor, what are your main reasons for not visiting?
In terms of the main reasons why dentists were not attending the Exhibit Floor per routine,“no time” (54%) (up from 27.9% last year, 25.4% in 2014, 28.8% in 2013, up from 18.9%in 2012 and the top reason in 2011 at 41%) has become the top reason. “Attendlectures/courses” has skipped to second place at 37% (comparable to 42.6% last year,36.5% in 2014, 42.3% in 2013, 24.3% in 2012 and 18% in 2011).
54%37%
6%1%1%
No timeLectures/courses
Talking with peersToo small/too crowded
Nothing new to see
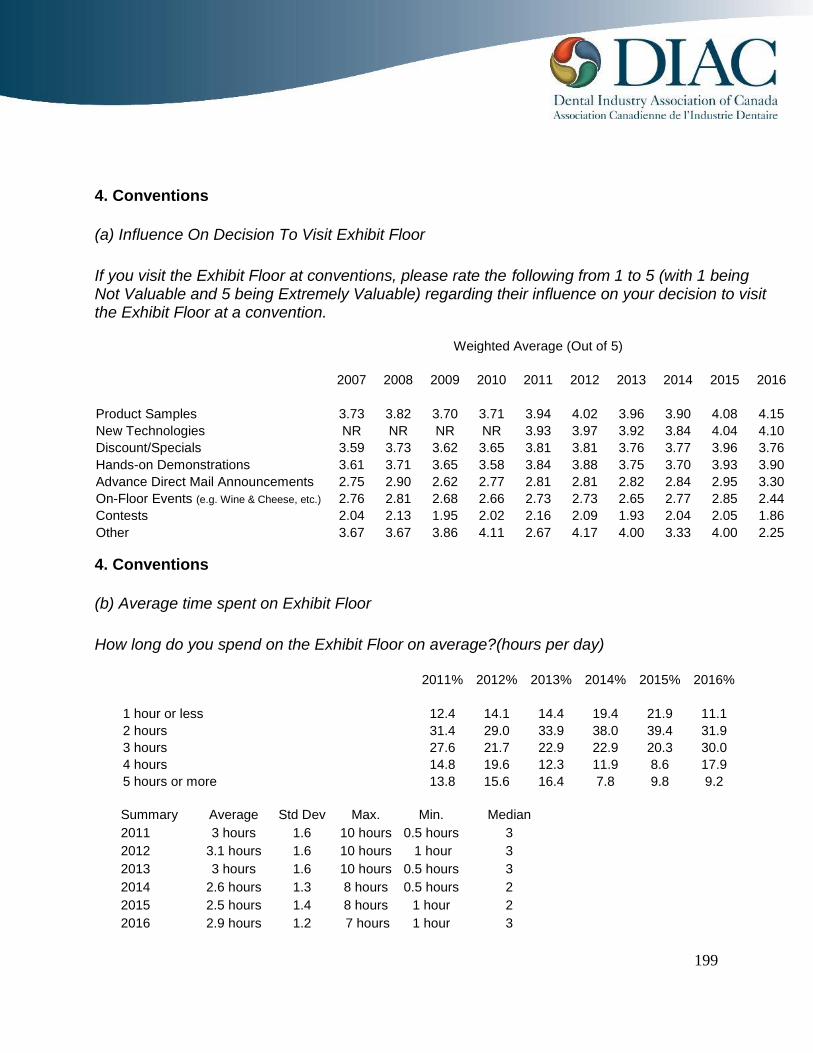
199
4. Conventions
(a) Influence On Decision To Visit Exhibit Floor
If you visit the Exhibit Floor at conventions, please rate the following from 1 to 5 (with 1 beingNot Valuable and 5 being Extremely Valuable) regarding their influence on your decision to visitthe Exhibit Floor at a convention.
Weighted Average (Out of 5)
2007 2008 2009 2010 2011 2012 2013 2014 2015 2016
Product Samples 3.73 3.82 3.70 3.71 3.94 4.02 3.96 3.90 4.08 4.15New Technologies NR NR NR NR 3.93 3.97 3.92 3.84 4.04 4.10Discount/Specials 3.59 3.73 3.62 3.65 3.81 3.81 3.76 3.77 3.96 3.76Hands-on Demonstrations 3.61 3.71 3.65 3.58 3.84 3.88 3.75 3.70 3.93 3.90Advance Direct Mail Announcements 2.75 2.90 2.62 2.77 2.81 2.81 2.82 2.84 2.95 3.30On-Floor Events (e.g. Wine & Cheese, etc.) 2.76 2.81 2.68 2.66 2.73 2.73 2.65 2.77 2.85 2.44Contests 2.04 2.13 1.95 2.02 2.16 2.09 1.93 2.04 2.05 1.86Other 3.67 3.67 3.86 4.11 2.67 4.17 4.00 3.33 4.00 2.25
4. Conventions
(b) Average time spent on Exhibit Floor
How long do you spend on the Exhibit Floor on average?(hours per day)
2011% 2012% 2013% 2014% 2015% 2016%
1 hour or less 12.4 14.1 14.4 19.4 21.9 11.12 hours 31.4 29.0 33.9 38.0 39.4 31.93 hours 27.6 21.7 22.9 22.9 20.3 30.04 hours 14.8 19.6 12.3 11.9 8.6 17.95 hours or more 13.8 15.6 16.4 7.8 9.8 9.2
Summary Average Std Dev Max. Min. Median2011 3 hours 1.6 10 hours 0.5 hours 32012 3.1 hours 1.6 10 hours 1 hour 32013 3 hours 1.6 10 hours 0.5 hours 32014 2.6 hours 1.3 8 hours 0.5 hours 22015 2.5 hours 1.4 8 hours 1 hour 22016 2.9 hours 1.2 7 hours 1 hour 3

200
4. Conventions
(c) Attend Convention With No Exhibit Floor
Would you still attend a Convention if there was no Exhibit Floor?
2011% 2012% 2013% 2014% 2015% 2016%
Yes 59.8 56.1 58.3 58.9 58.4 45.2No 17.3 21.3 16.9 18.8 18.5 45.7Don’t Know 14.6 15.7 18.1 14.4 17.1 8.7No Response 8.4 6.9 6.7 7.8 6.1 0.5
4. Conventions
(d) Main Reasons For Not Visiting Exhibit Floor
If you don’t visit the Exhibit Floor, what are your main reasons for not visiting?
2011% 2012% 2013% 2014% 2015% 2016%
No time 41.0 18.9 28.8 25.4 27.9 54.3Lectures/courses 17.9 24.3 42.3 36.5 42.6 37.1Talking with peers 5.1 NR NR NR NR 5.7Nothing new to see NR 2.7 1.9 1.6 1.6 1.4Not answering my questions 2.6 NR NR NR 1.6 1.4Too small/too crowded 5.1 13.5 9.6 4.8 9.8 NRDon't need new products 10.3 8.1 5.8 6.3 6.6 NRDon't want solicitation 7.7 2.7 3.8 6.3 4.9 NRCost NR NR NR NR 3.3 NRNo specials or samples NR 2.7 NR 3.2 1.6 NRBoring/nothing interesting NR 2.7 1.9 3.2 NR NRMy health NR NR 1.9 3.2 NR NRDon't attend any conventions NR NR NR 3.2 NR NRToo far away 2.6 2.7 1.9 1.6 NR NRToo much hype NR 5.4 NR 1.6 NR NRCloses too early 5.1 8.1 NR NR NR NRToo few booths NR 5.4 NR NR NR NR

201
(d) Use of Practice Consultant
Do you, or have you ever, worked with Practice Consultants?This was a new question for the 2011 survey. Less than one-third (32.2%) (down from theaverage of 34% the last five years) of respondents either currently work with PracticeConsultants or have in the past. A further 2.4% plan to use a Practice Consultant in thefuture (lower than the average of 4% for the last five years).Given the new lower total respondent count for 2016 based on on-line only surveyadministration, and the fact that only 36% of total respondents answered this question, theremaining regional and by area of assistance analysis in this section must be considered asindications of behaviour only.This year, Quebec dentists (43.3%) were more likely to have utilized a Practice Consultantthan other regions (26.6-34.4%).Of those who have used a Practice Consultant’s services, the most common topic theyhelped with was Practice Management (43.9%) (the top topic the last five years) followedby Marketing (16.7%), Systems Implementation (16.7%), Communications with Patients(6.1%), Practice Evaluation (3%), Organizing charts/procedures (3%), Scheduling (1.5%)Perio regimen (1.5%) and Goal setting (1.5%).

202
Practice Promotion
(d) Use of Practice Consultant
Do you, or have you ever, worked with Practice Consultants?
2011% 2012% 2013% 2014% 2015% 2016%
Yes 32.8 38.4 33.7 35.9 29.1 32.2No 60.4 56.1 59.2 58.7 61.5 65.4No but plan to use 3.4 3.9 4.6 3.9 4.4 2.4No response/Does not know 3.4 1.6 2.5 1.5 4.9 0.0
If Yes, what did they help you with?
2011% 2012% 2013% 2014% 2015% 2016%
Practice Management 20.9 22.7 16.5 18.4 22.2 43.9Marketing 7.0 3.1 7.2 10.4 13.9 16.7Staff management 15.1 7.2 11.3 15.2 5.6 16.7Systems implementation 5.8 5.2 10.3 12.8 13.9 6.1Communication with Patients 5.8 2.1 4.1 6.4 2.8 6.1Practice evaluation 5.8 3.1 1.0 3.2 2.8 3.0Organizing charts/procedures 3.5 8.2 1.0 7.2 5.6 3.0Scheduling 9.3 5.2 12.4 7.2 5.6 1.5Perio regimen 2.3 NR NR 1.6 5.6 1.5Goal setting 2.3 2.1 1.0 1.6 NR 1.5Treatment Planning 4.7 5.2 7.2 0.8 5.6 NRFinancial Planning 2.3 5.2 6.2 1.6 2.8 NRManagement by Statistics 1.2 2.1 3.1 1.6 2.8 NRTeam Building 3.5 6.2 4.1 4.0 NR NRCorporation setup/relocation NR 2.1 3.1 1.6 NR NRTransition 1.2 3.1 3.1 NR NR NRCost control 3.5 3.1 2.1 NR NR NROther 4.7 14.4 6.2 6.4 11.1 NR