denver gold forum 2014
TRANSCRIPT
DENVER GOLD FORUM 2014
14-17 SEPTEMBER
FORWARD-LOOKING STATEMENTS
This presentation contains forward-looking statements. Forward-looking statements involve known and unknown risks,
uncertainties and assumptions and accordingly, actual results and future events could differ materially from those expressed or
implied in such statements. You are hence cautioned not to place undue reliance on forward-looking statements. Forward-looking
statements include words or expressions such as “anticipated”, “expected”, “growth”, “strategy”, “generate”, “future”, “create”,
“builds”, ”continue”, “expand”, “guidance”, “objective”, “focus”, “priority”, “short-term catalysts” and other similar words or
expressions. Factors that could cause future results or events to differ materially from current expectations expressed or implied
by the forward-looking statements include the ability to fund exploration and obtain drill results for the Bilakongo, Tigan, Kana
permits and the permits on the Banfora Gold Belt in the fourth quarter, the ability to execute on our strategy, the ability of our short-
term catalysts to materialize, the ability to generate future cash flow, the ability to attain the upper end of our production guidance
of between 200,000 and 225,000 ounces of gold and the lower end of our 2014 total cash cost guidance of between $695 and
$745 per ounce, and an all-in sustaining cost of between $840 and $890 per ounce and G&A of $16 million in 2014, the ability to
continue to grow Mana and expand our project pipeline, the ability to incur $30.6 million of sustaining capital expenditures and
$17.9 million of growth capital expenditures, the ability of the infill drilling program to replace and increase the reserves base at
Siou, the ability to optimize and improve efficiencies throughout the Corporation, fluctuation in the price of currencies, gold or
operating costs, mining industry risks, uncertainty as to the calculation of mineral reserves and resources, delays, political and
social stability in Africa (including our ability to maintain or renew licenses and permits) and other risks described in SEMAFO’s
documents filed with Canadian securities regulatory authorities. You can find further information with respect to these and other
risks in SEMAFO’s 2013 Annual MD&A as updated in our 2014 First and Second Quarter MD&A and other filings made with
Canadian securities regulatory authorities and available at www.sedar.com. Documents are also available on our website at
www.semafo.com. These forward-looking statements are dated as of September 10, 2014 and we disclaim any obligation to
update or revise these forward-looking statements, except as required by applicable law.
We also advise you that the terms “Inferred Resources” and “Indicated Resources”, although recognized and required by the
Canadian Securities Administrators, are not recognized by the US Securities and Exchange Commission. There is no certainty
that Inferred Resources or Indicated Resources will be economically mineable. All mineral resources are exclusive of mineral
reserves.
In this presentation, all amounts are in US dollars unless otherwise indicated.
2
INVESTMENT SUMMARY
3
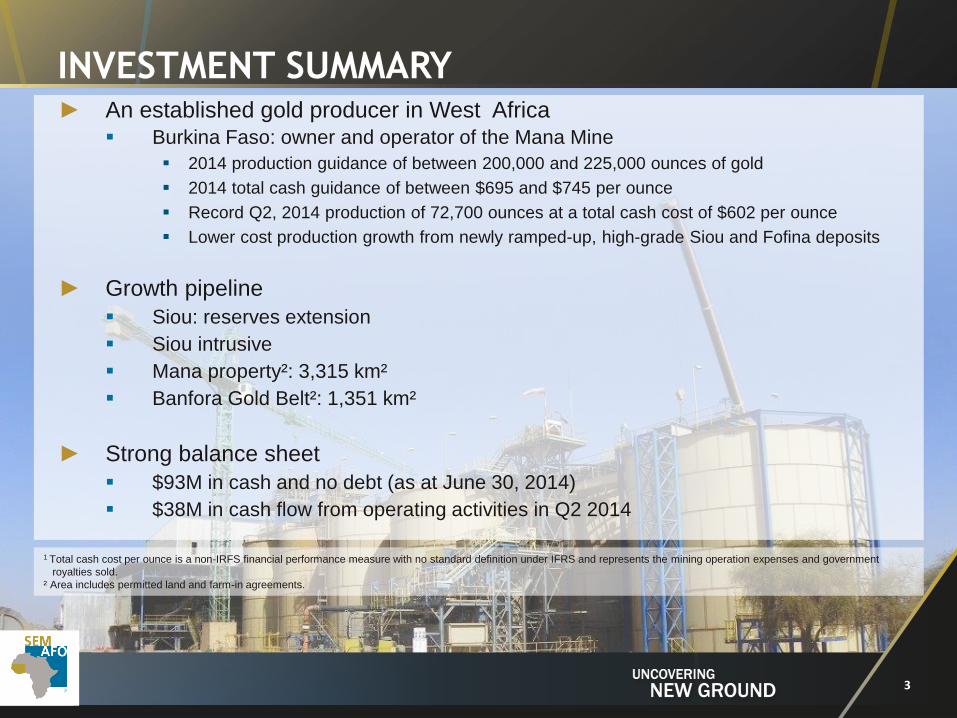
► An established gold producer in West Africa Burkina Faso: owner and operator of the Mana Mine
2014 production guidance of between 200,000 and 225,000 ounces of gold
2014 total cash guidance of between $695 and $745 per ounce
Record Q2, 2014 production of 72,700 ounces at a total cash cost of $602 per ounce
Lower cost production growth from newly ramped-up, high-grade Siou and Fofina deposits
► Growth pipeline
Siou: reserves extension
Siou intrusive
Mana property²: 3,315 km²
Banfora Gold Belt²: 1,351 km²
► Strong balance sheet
$93M in cash and no debt (as at June 30, 2014)
$38M in cash flow from operating activities in Q2 2014
1 Total cash cost per ounce is a non-IRFS financial performance measure with no standard definition under IFRS and represents the mining operation expenses and government
royalties sold.
² Area includes permitted land and farm-in agreements.
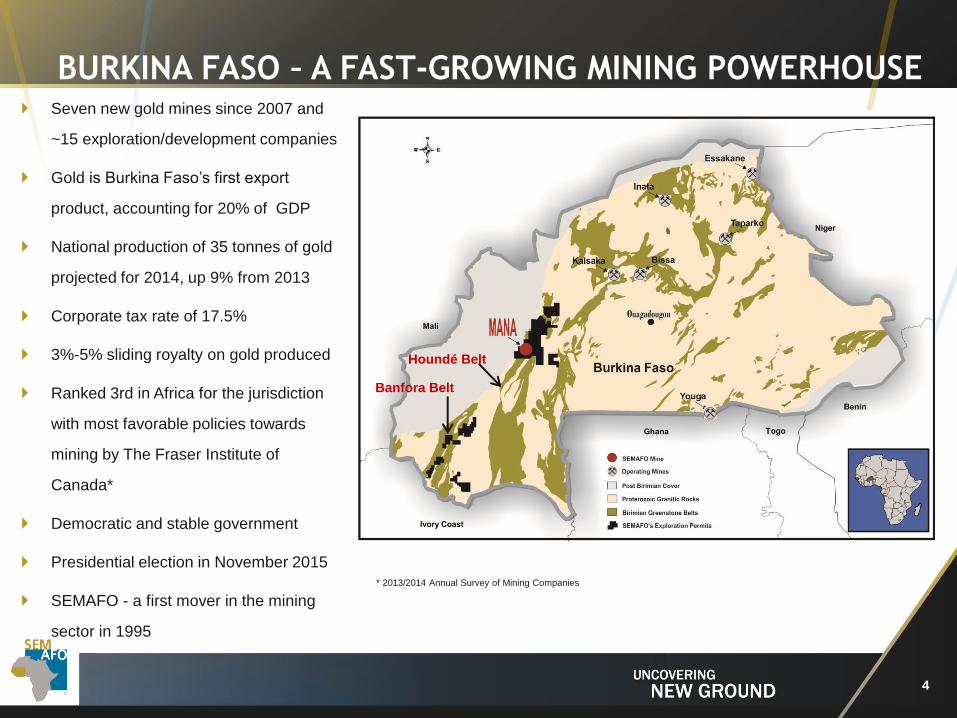
BURKINA FASO – A FAST-GROWING MINING POWERHOUSE Seven new gold mines since 2007 and
~15 exploration/development companies
Gold is Burkina Faso’s first export
product, accounting for 20% of GDP
National production of 35 tonnes of gold
projected for 2014, up 9% from 2013
Corporate tax rate of 17.5%
3%-5% sliding royalty on gold produced
Ranked 3rd in Africa for the jurisdiction
with most favorable policies towards
mining by The Fraser Institute of
Canada*
Democratic and stable government
Presidential election in November 2015
SEMAFO - a first mover in the mining
sector in 1995
Banfora Belt
Houndé Belt
4
* 2013/2014 Annual Survey of Mining Companies
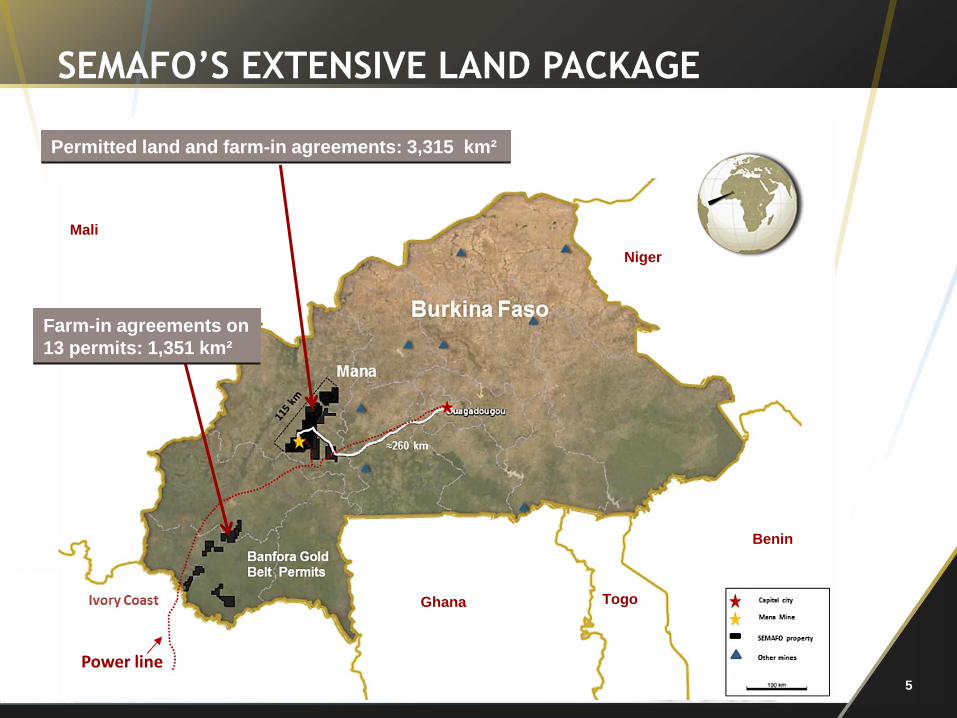
SEMAFO’S EXTENSIVE LAND PACKAGE
Permitted land and farm-in agreements: 3,315 km²
Ghana Togo
Mali
Niger
Benin
Farm-in agreements on
13 permits: 1,351 km²
Power line 5
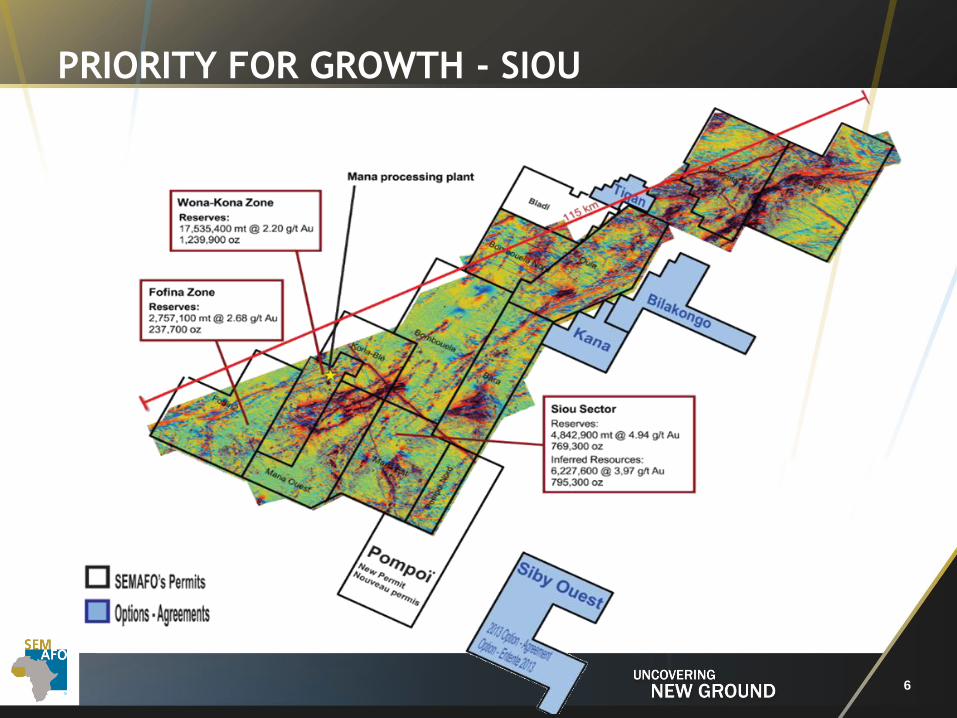
PRIORITY FOR GROWTH - SIOU
6
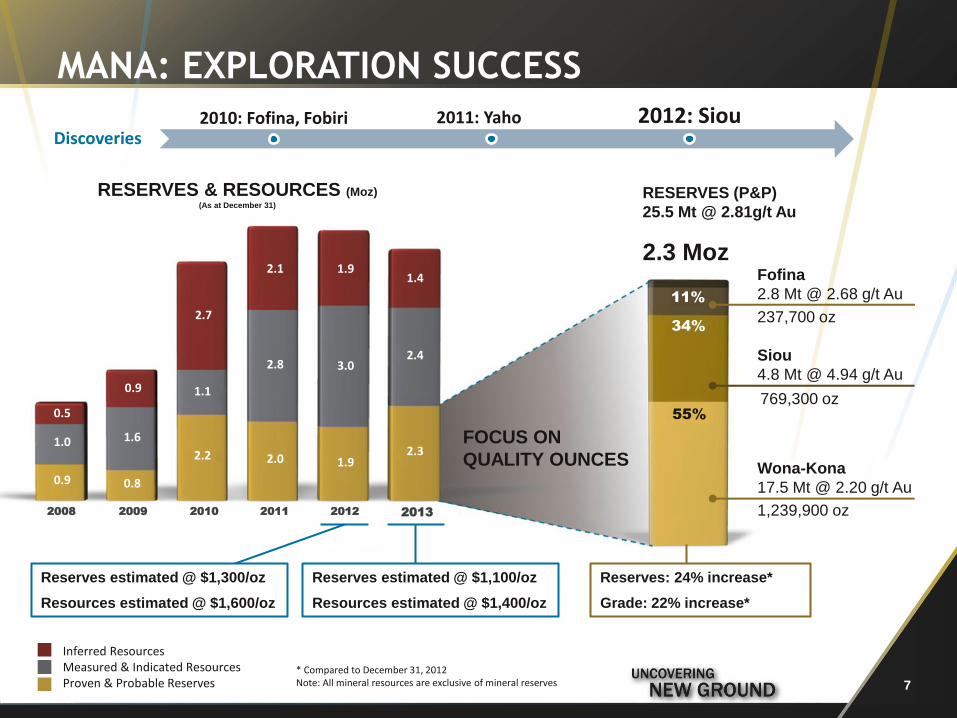
MANA: EXPLORATION SUCCESS
RESERVES & RESOURCES (Moz) (As at December 31)
Reserves: 24% increase*
Grade: 22% increase*
Reserves estimated @ $1,300/oz
Resources estimated @ $1,600/oz
Reserves estimated @ $1,100/oz
Resources estimated @ $1,400/oz
2013 2008 2009 2010 2011 2012
Inferred Resources Measured & Indicated Resources Proven & Probable Reserves
* Compared to December 31, 2012 Note: All mineral resources are exclusive of mineral reserves
Fofina
2.8 Mt @ 2.68 g/t Au
Siou
4.8 Mt @ 4.94 g/t Au
Wona-Kona
17.5 Mt @ 2.20 g/t Au
RESERVES (P&P)
25.5 Mt @ 2.81g/t Au
2.3 Moz
1,239,900 oz
769,300 oz
237,700 oz
FOCUS ON
QUALITY OUNCES
2010: Fofina, Fobiri 2012: Siou 2011: Yaho Discoveries
0.9
1.0
0.5
0.8
1.6
0.9
2.2
1.1
2.7
2.0
2.8
2.1
1.9
3.0
1.9
2.3
2.4
1.4
7
34%
11%
55%
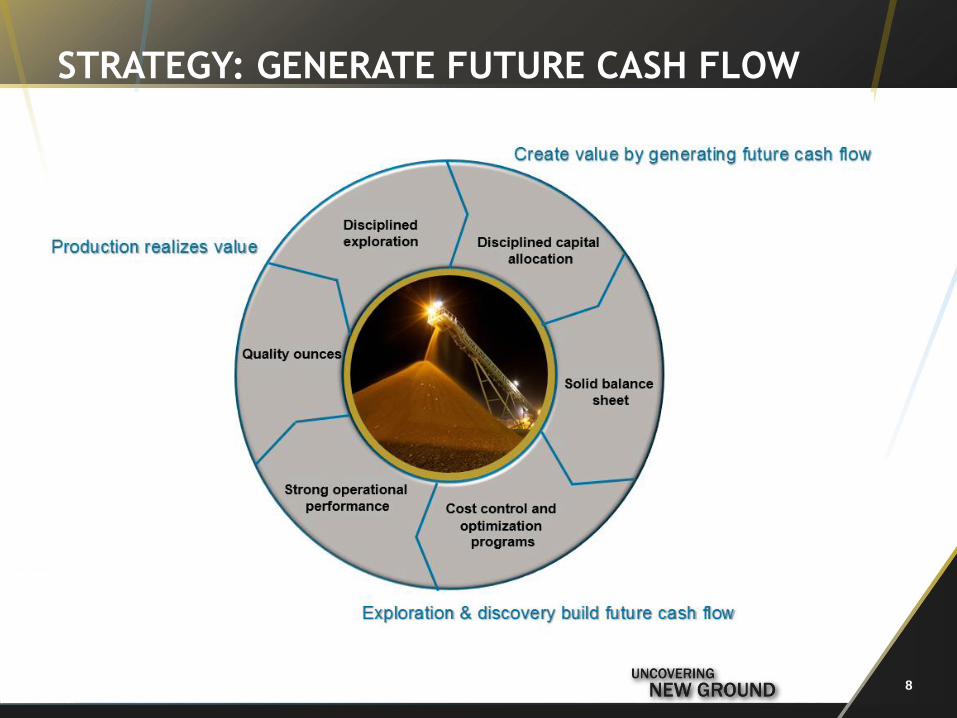
STRATEGY: GENERATE FUTURE CASH FLOW
8
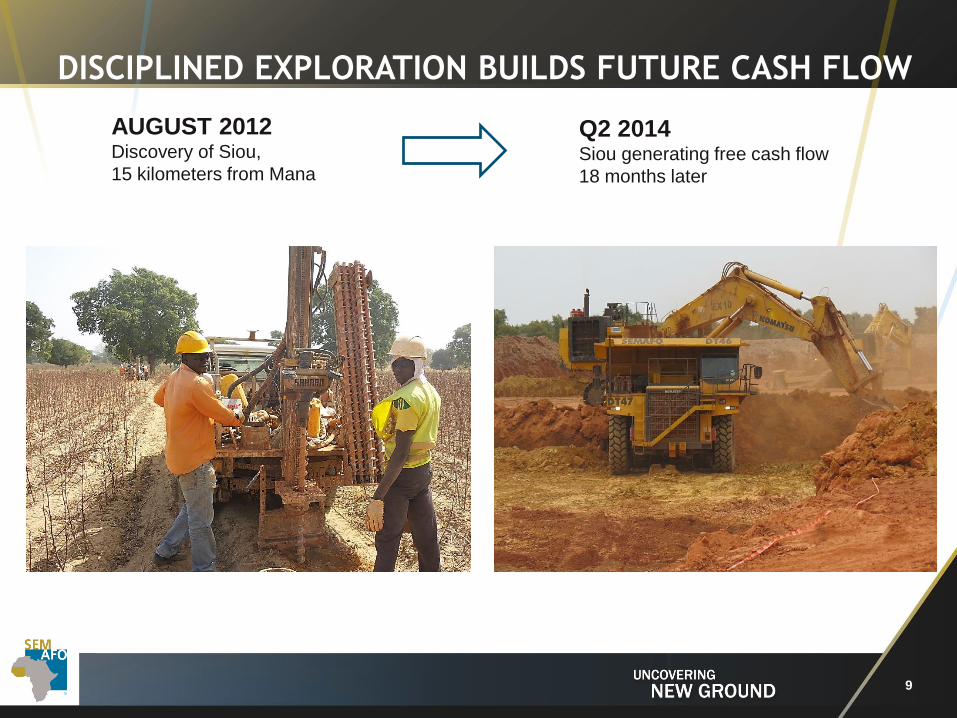
DISCIPLINED EXPLORATION BUILDS FUTURE CASH FLOW
AUGUST 2012 Discovery of Siou,
15 kilometers from Mana
Q2 2014 Siou generating free cash flow
18 months later
9
RUNDOWN OF STRATEGY Continue to grow Mana through disciplined and
intensive exploration programs
Budget of $20M, mainly focusing on vicinity of Mana
Continue to expand our project pipeline
Quality ounces approach
Mana reserves calculated at a gold price of $1,100/oz
Maximising throughput from high-grade Siou (4.94 g/t)
and Fofina (2.68 g/t) open-pit deposits
Cost control and optimization program
G&A guidance of ~$16M for 2014, ↓18% from $19.6M
in 2013 (and ↓28% from 2012)
Recently divested two non-core assets
Solid operational performance
Met production guidance for six consecutive years
10
Experienced
Team Committed
to Delivering Results
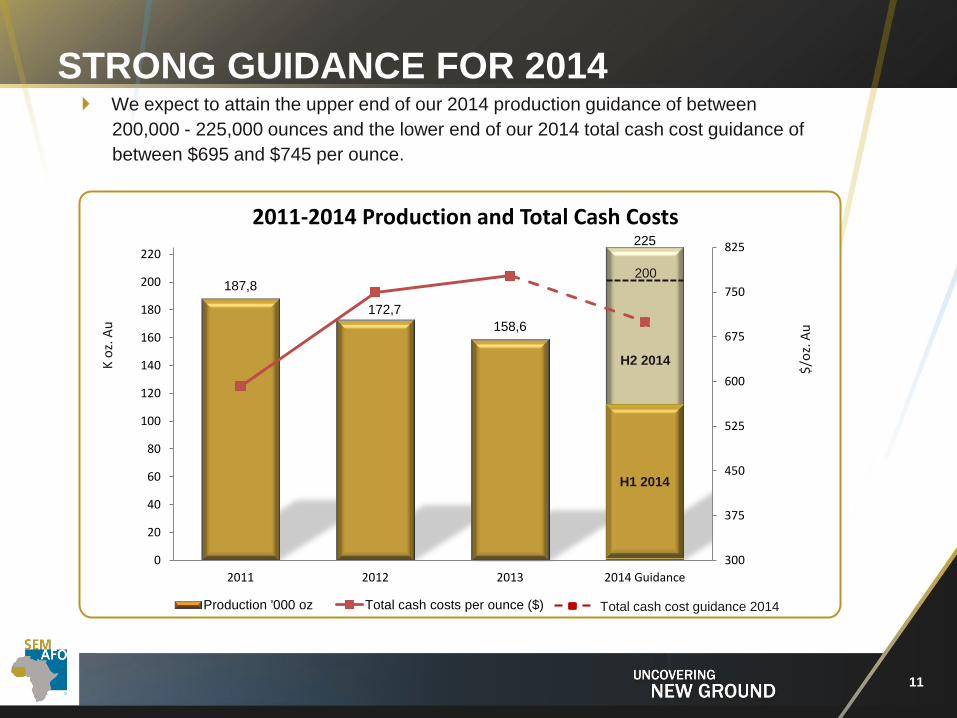
STRONG GUIDANCE FOR 2014 We expect to attain the upper end of our 2014 production guidance of between
200,000 - 225,000 ounces and the lower end of our 2014 total cash cost guidance of
between $695 and $745 per ounce.
K o
z. A
u
$/o
z. A
u
187,8
172,7
158,6
225
300
375
450
525
600
675
750
825
0
20
40
60
80
100
120
140
160
180
200
220
2011 2012 2013 2014 Guidance
2011-2014 Production and Total Cash Costs
Production '000 oz Total cash costs per ounce ($)
H1 2014
H2 2014
11
200
Total cash cost guidance 2014
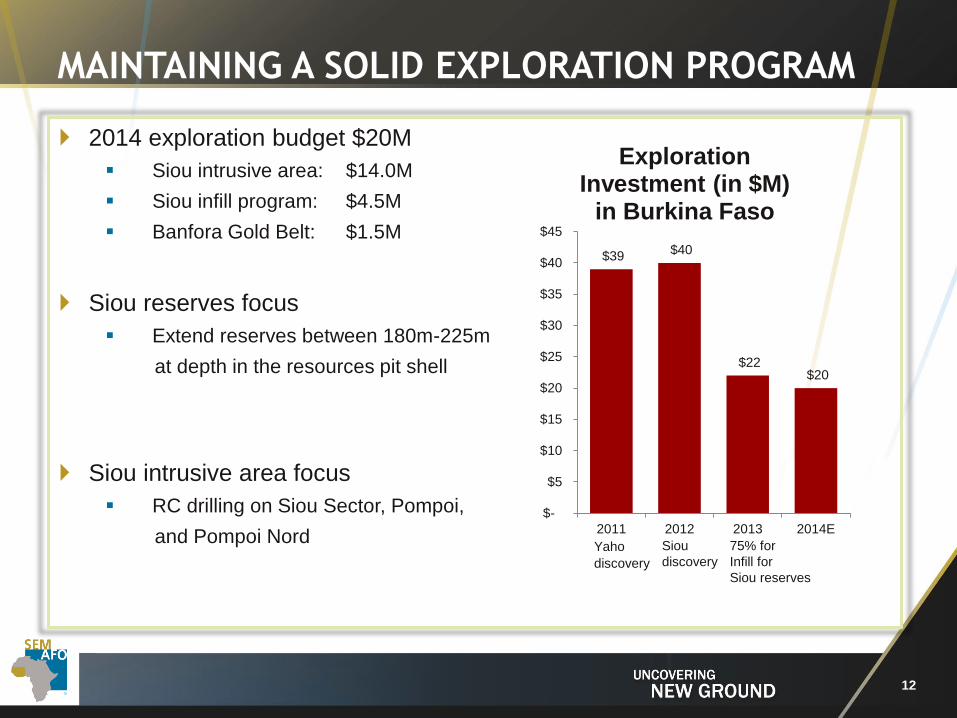
MAINTAINING A SOLID EXPLORATION PROGRAM
2014 exploration budget $20M
Siou intrusive area: $14.0M
Siou infill program: $4.5M
Banfora Gold Belt: $1.5M
Siou reserves focus
Extend reserves between 180m-225m
at depth in the resources pit shell
Siou intrusive area focus
RC drilling on Siou Sector, Pompoi,
and Pompoi Nord
$39 $40
$22 $20
$-
$5
$10
$15
$20
$25
$30
$35
$40
$45
2011 2012 2013 2014E
Exploration Investment (in $M)
in Burkina Faso
Yaho discovery
Siou
discovery
75% for
Infill for
Siou reserves
12
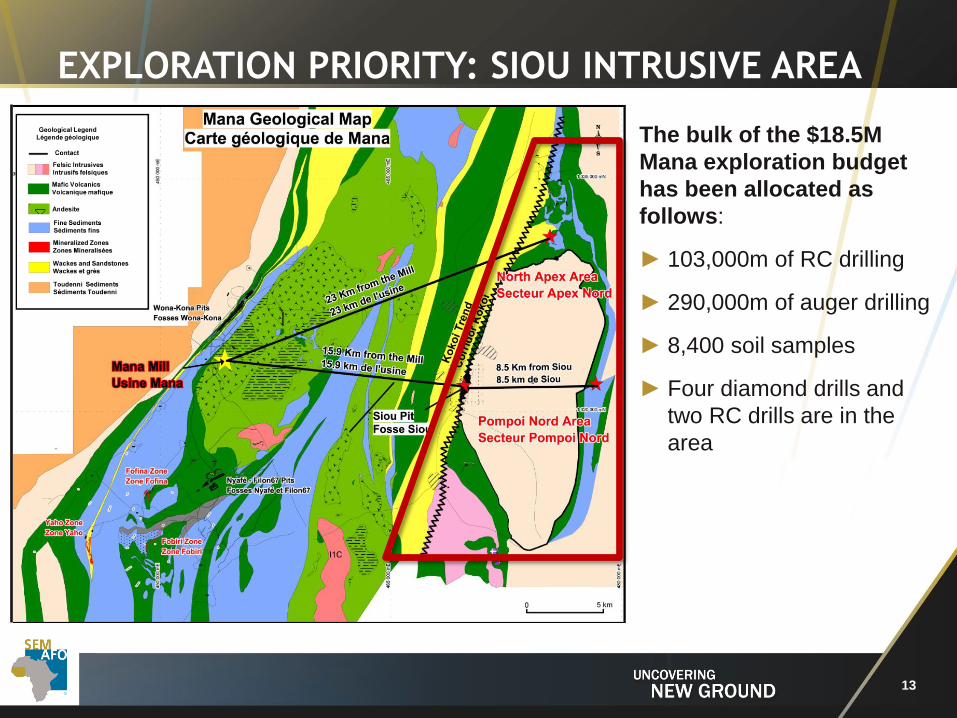
EXPLORATION PRIORITY: SIOU INTRUSIVE AREA
The bulk of the $18.5M
Mana exploration budget
has been allocated as
follows:
► 103,000m of RC drilling
► 290,000m of auger drilling
► 8,400 soil samples
► Four diamond drills and
two RC drills are in the
area
13
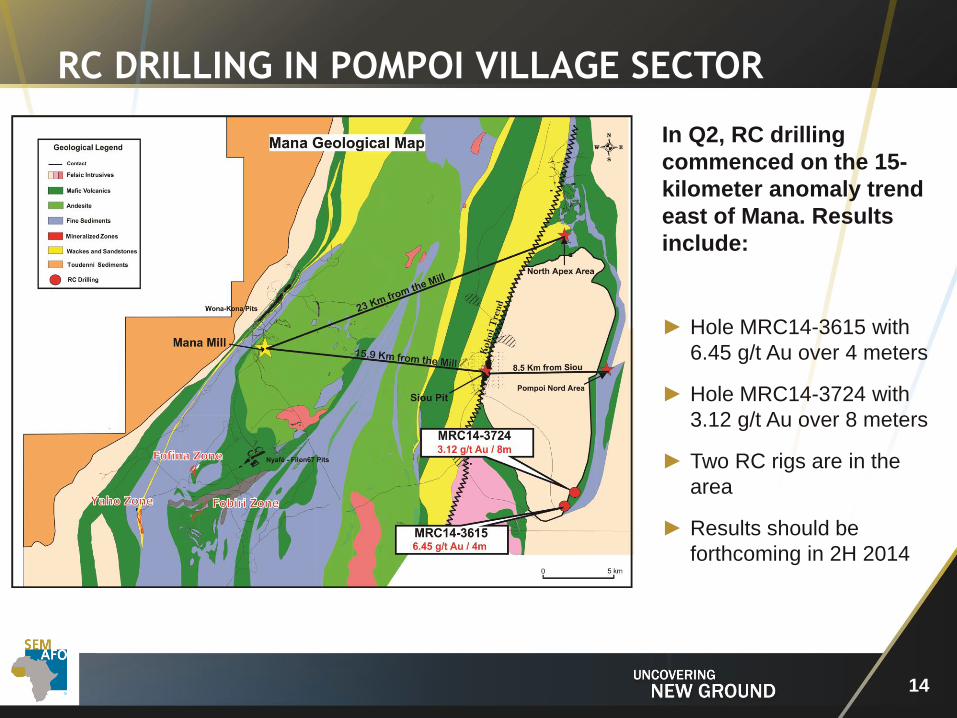
RC DRILLING IN POMPOI VILLAGE SECTOR
14
In Q2, RC drilling
commenced on the 15-
kilometer anomaly trend
east of Mana. Results
include:
► Hole MRC14-3615 with
6.45 g/t Au over 4 meters
► Hole MRC14-3724 with
3.12 g/t Au over 8 meters
► Two RC rigs are in the
area
► Results should be
forthcoming in 2H 2014
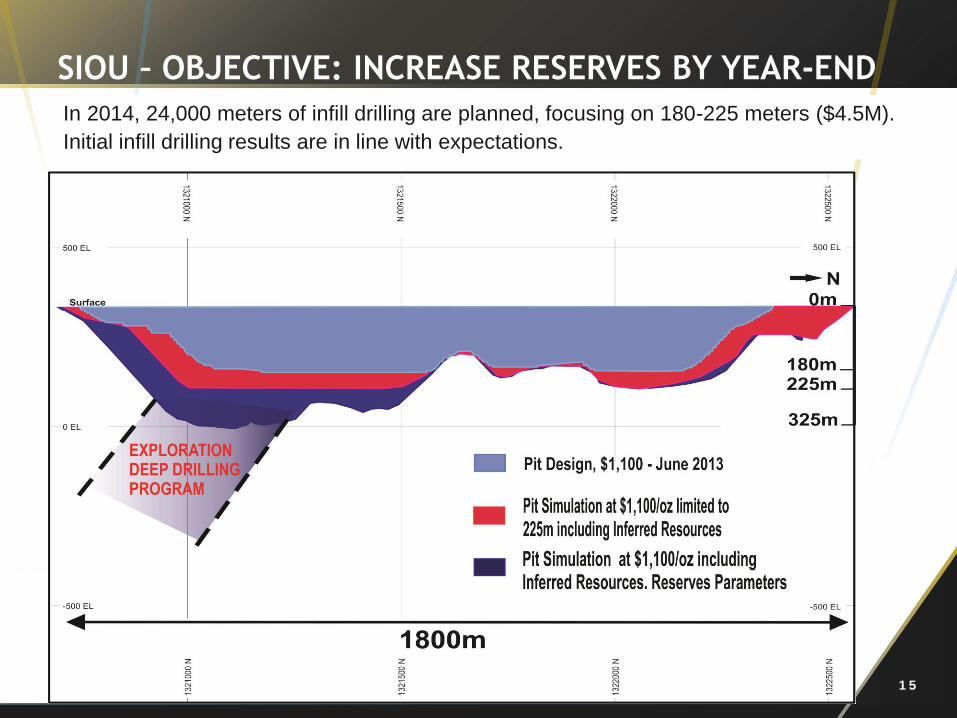
SIOU – OBJECTIVE: INCREASE RESERVES BY YEAR-END
1 5
In 2014, 24,000 meters of infill drilling are planned, focusing on 180-225 meters ($4.5M).
Initial infill drilling results are in line with expectations.
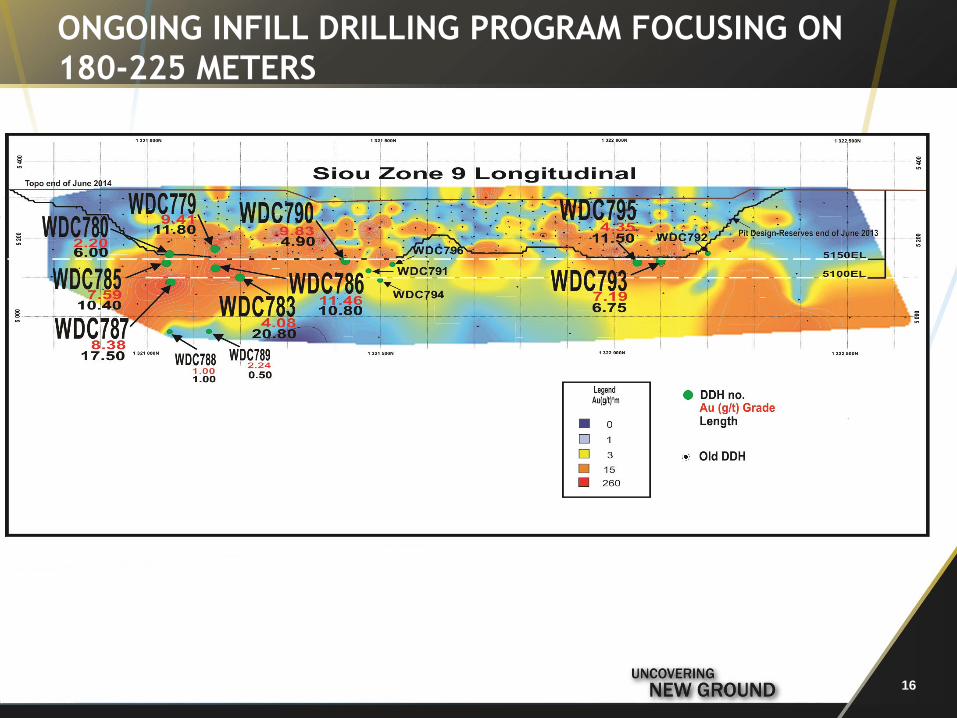
ONGOING INFILL DRILLING PROGRAM FOCUSING ON
180-225 METERS
16
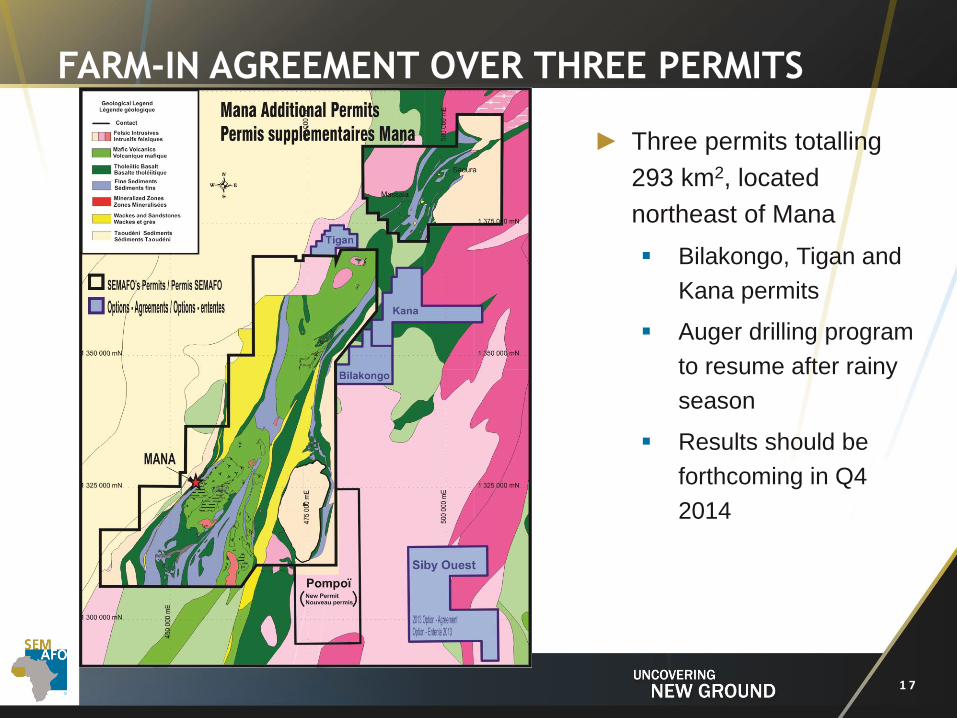
FARM-IN AGREEMENT OVER THREE PERMITS
► Three permits totalling
293 km2, located
northeast of Mana
Bilakongo, Tigan and
Kana permits
Auger drilling program
to resume after rainy
season
Results should be
forthcoming in Q4
2014
1 7
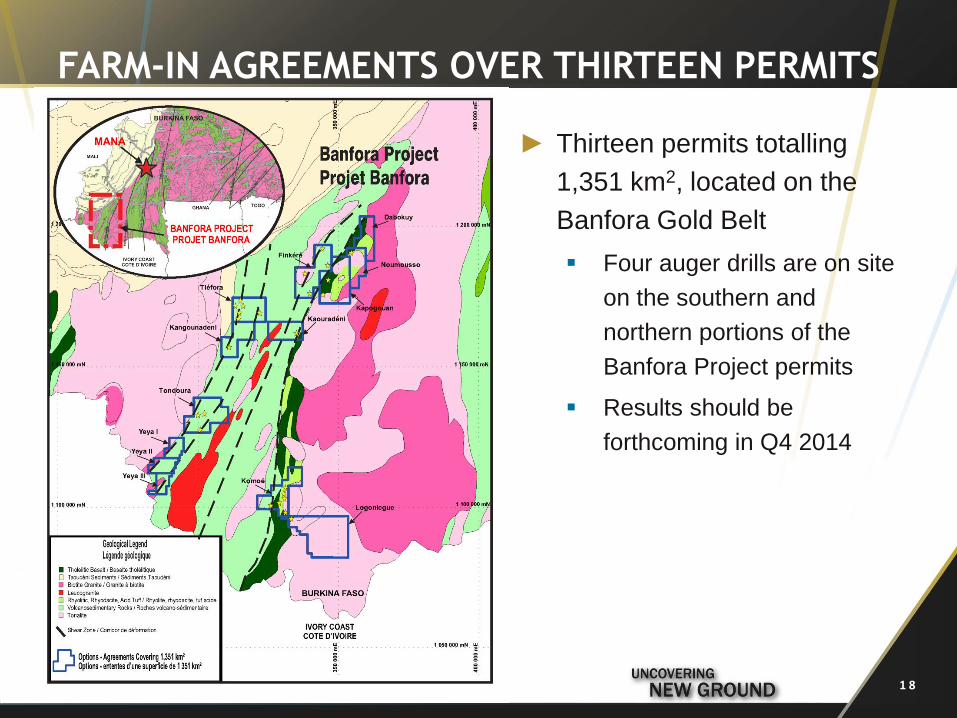
FARM-IN AGREEMENTS OVER THIRTEEN PERMITS
► Thirteen permits totalling
1,351 km2, located on the
Banfora Gold Belt
Four auger drills are on site
on the southern and
northern portions of the
Banfora Project permits
Results should be
forthcoming in Q4 2014
1 8
OPERATING ON A SOLID FOUNDATION
1 9
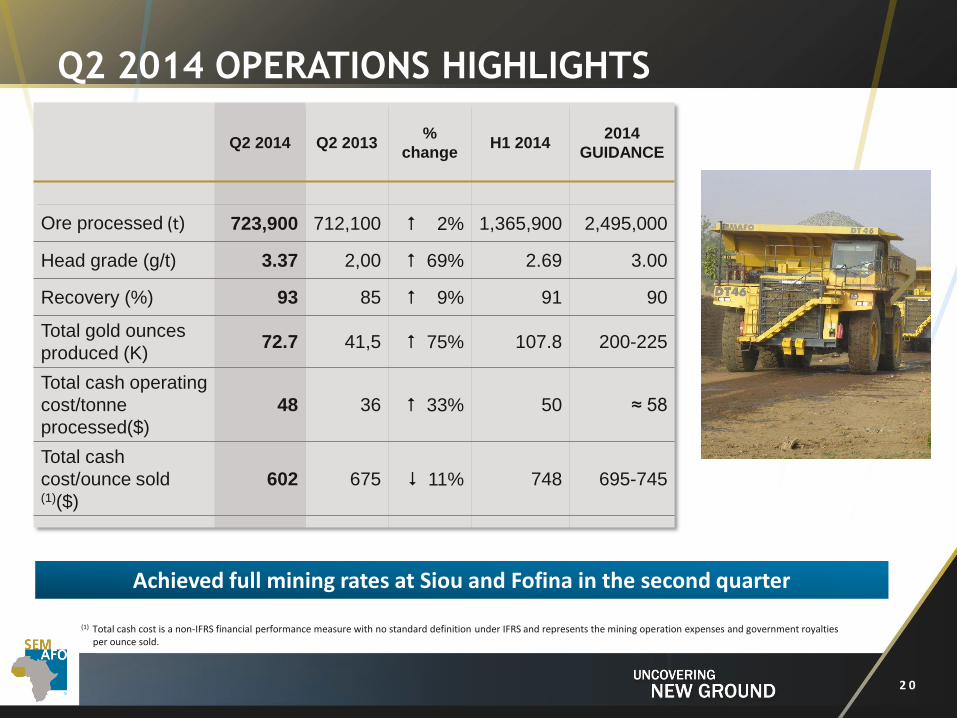
Q2 2014 OPERATIONS HIGHLIGHTS
2 0
Q2 2014 Q2 2013 %
change H1 2014
2014
GUIDANCE
Ore processed (t) 723,900 712,100 2% 1,365,900 2,495,000
Head grade (g/t) 3.37 2,00 69% 2.69 3.00
Recovery (%) 93 85 9% 91 90
Total gold ounces
produced (K) 72.7 41,5 75% 107.8 200-225
Total cash operating
cost/tonne
processed($)
48 36 33% 50 ≈ 58
Total cash
cost/ounce sold (1)($)
602 675 11% 748 695-745
(1) Total cash cost is a non-IFRS financial performance measure with no standard definition under IFRS and represents the mining operation expenses and government royalties per ounce sold.
Achieved full mining rates at Siou and Fofina in the second quarter
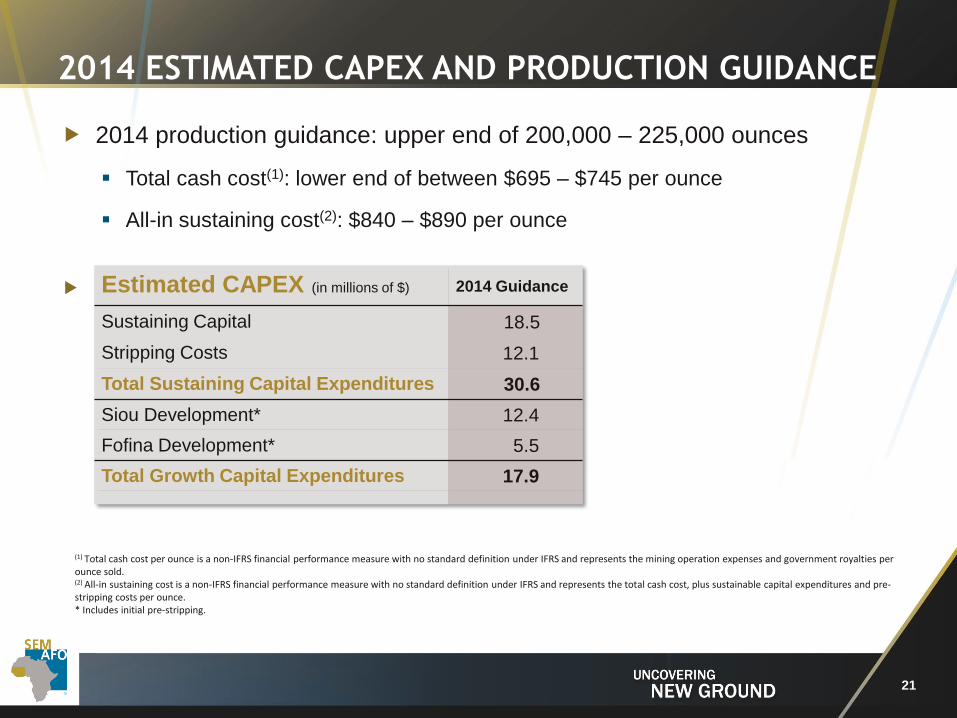
2014 production guidance: upper end of 200,000 – 225,000 ounces
Total cash cost(1): lower end of between $695 – $745 per ounce
All-in sustaining cost(2): $840 – $890 per ounce
Estimated CAPEX (in millions of $) 2014 Guidance
Sustaining Capital 18.5
Stripping Costs 12.1
Total Sustaining Capital Expenditures 30.6
Siou Development* 12.4
Fofina Development* 5.5
Total Growth Capital Expenditures 17.9
2014 ESTIMATED CAPEX AND PRODUCTION GUIDANCE
(1) Total cash cost per ounce is a non-IFRS financial performance measure with no standard definition under IFRS and represents the mining operation expenses and government royalties per ounce sold. (2) All-in sustaining cost is a non-IFRS financial performance measure with no standard definition under IFRS and represents the total cash cost, plus sustainable capital expenditures and pre-stripping costs per ounce. * Includes initial pre-stripping.
21
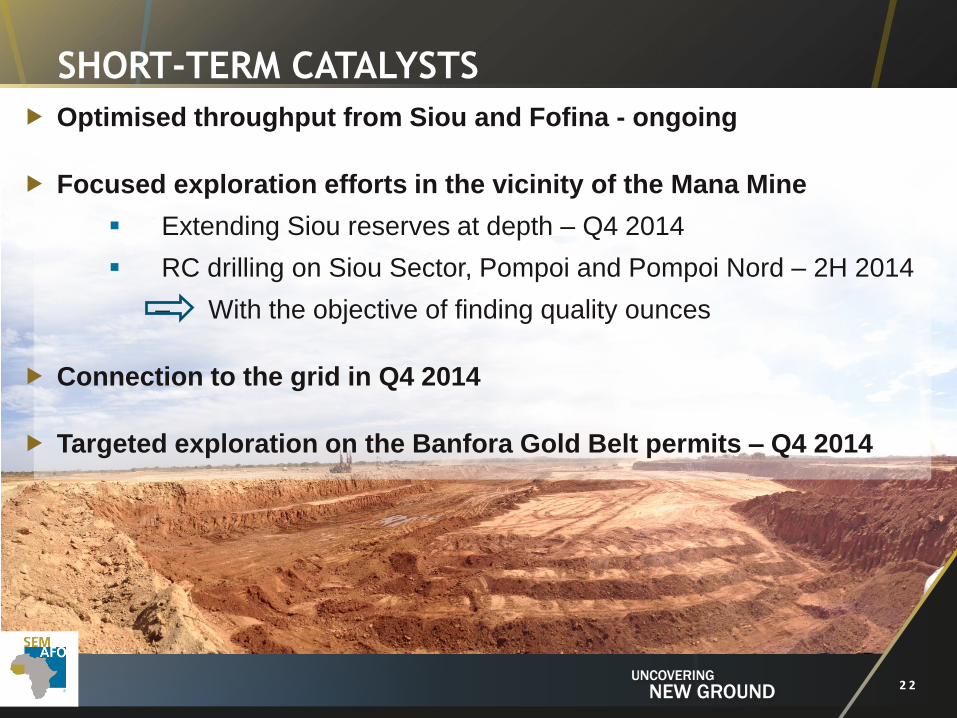
SHORT-TERM CATALYSTS
2 2
Optimised throughput from Siou and Fofina - ongoing
Focused exploration efforts in the vicinity of the Mana Mine
Extending Siou reserves at depth – Q4 2014
RC drilling on Siou Sector, Pompoi and Pompoi Nord – 2H 2014
– With the objective of finding quality ounces
Connection to the grid in Q4 2014
Targeted exploration on the Banfora Gold Belt permits – Q4 2014
Committed to generating future cash flow through operational efficiency and disciplined exploration
Ongoing operations optimisation programs
Targeted exploration program focused on the vicinity of the Mana processing plant
Sound balance sheet
$93M in cash (as at June 30, 2014), no debt
$38M in cash flow from operating activities in Q2 2014
Successful track record
Six consecutive years of achieving production guidance
Time to bring Siou from discovery to production: 18 months
Exploration success: Mana reserves and resources have more than doubled since the mine start-up in 2008
IN SUMMARY
2 3
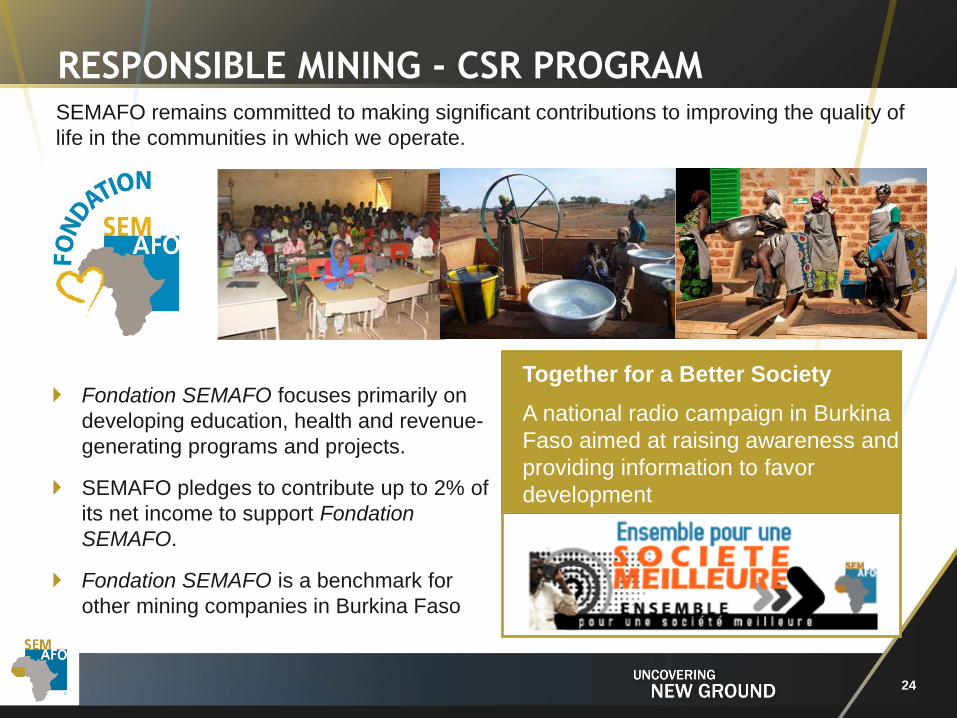
SEMAFO remains committed to making significant contributions to improving the quality of
life in the communities in which we operate.
Fondation SEMAFO focuses primarily on
developing education, health and revenue-
generating programs and projects.
SEMAFO pledges to contribute up to 2% of
its net income to support Fondation
SEMAFO.
Fondation SEMAFO is a benchmark for
other mining companies in Burkina Faso
Together for a Better Society
A national radio campaign in Burkina
Faso aimed at raising awareness and
providing information to favor
development
RESPONSIBLE MINING - CSR PROGRAM
24
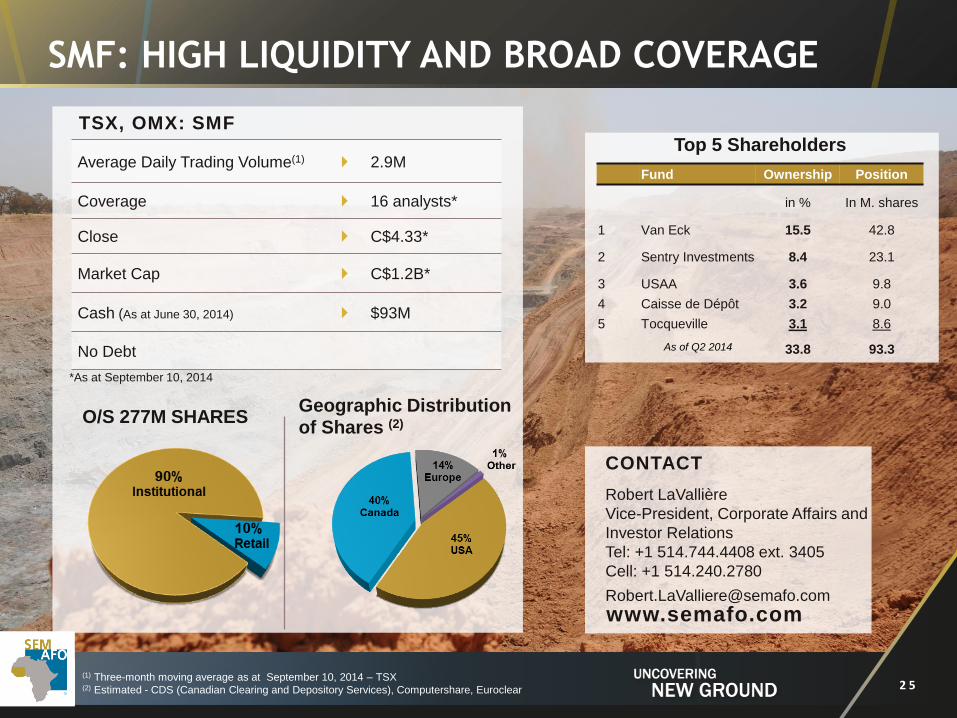
Average Daily Trading Volume(1) 2.9M
Coverage 16 analysts*
Close C$4.33*
Market Cap C$1.2B*
Cash (As at June 30, 2014) $93M
No Debt
*As at September 10, 2014
O/S 277M SHARES
SMF: HIGH LIQUIDITY AND BROAD COVERAGE
(1) Three-month moving average as at September 10, 2014 – TSX (2) Estimated - CDS (Canadian Clearing and Depository Services), Computershare, Euroclear
TSX, OMX: SMF
Geographic Distribution of Shares (2)
www.semafo.com
CONTACT
Robert LaVallière
Vice-President, Corporate Affairs and
Investor Relations
Tel: +1 514.744.4408 ext. 3405
Cell: +1 514.240.2780
2 5
Top 5 Shareholders
Fund Ownership Position
in % In M. shares
1 Van Eck 15.5 42.8
2 Sentry Investments 8.4 23.1
3 USAA 3.6 9.8
4 Caisse de Dépôt 3.2 9.0
5 Tocqueville 3.1 8.6
As of Q2 2014
33.8 93.3