department application bronze and silver award · 2020-02-25 · human resource management and...
TRANSCRIPT

Department Application Bronze and Silver Award

2
ATHENA SWAN BRONZE DEPARTMENT AWARDS Recognise that in addition to institution-wide policies, the department is working to promote gender
equality and to identify and address challenges particular to the department and discipline.
ATHENA SWAN SILVER DEPARTMENT AWARDS In addition to the future planning required for Bronze department recognition, Silver department
awards recognise that the department has taken action in response to previously identified challenges
and can demonstrate the impact of the actions implemented.
Note: Not all institutions use the term ‘department’. There are many equivalent academic groupings
with different names, sizes and compositions. The definition of a ‘department’ can be found in the
Athena SWAN awards handbook.
COMPLETING THE FORM DO NOT ATTEMPT TO COMPLETE THIS APPLICATION FORM WITHOUT READING THE ATHENA SWAN AWARDS HANDBOOK.
This form should be used for applications for Bronze and Silver department awards.
You should complete each section of the application applicable to the award level you are applying for.
Additional areas for Silver applications are highlighted throughout the form: 5.2, 5.4, 5.5(iv)
If you need to insert a landscape page in your application, please copy and paste the template page at
the end of the document, as per the instructions on that page. Please do not insert any section breaks
as to do so will disrupt the page numbers.
WORD COUNT The overall word limit for applications are shown in the following table.
There are no specific word limits for the individual sections and you may distribute words over each of
the sections as appropriate. At the end of every section, please state how many words you have used
in that section.
We have provided the following recommendations as a guide.

3
Department application Bronze Silver Word limit 10,500 12,000
Recommended word count
1.Letter of endorsement 500 500
2.Description of the department 500 500
3. Self-assessment process 1,000 1,000
4. Picture of the department 2,000 2,000
5. Supporting and advancing women’s careers 6,000 6,500
6. Case studies n/a 1,000
7. Further information 500 500

4
Name of institution University of Glasgow Department Adam Smith Business School Focus of department AHSSBL Date of application April 2019 Award Level Bronze Institution Athena SWAN award Date: April 2016 Contact for application Must be based in the department
Dr Margaret Fletcher
Email [email protected] Telephone 0141 330 5939 Departmental website https://www.gla.ac.uk/schools/business/
1. LETTER OF ENDORSEMENT FROM THE HEAD OF DEPARTMENT
Recommended word count: Bronze: 500 words | Actual: 667

5
Glossary of Acronyms
AHSSBL Arts, Humanities, Social Sciences, Business and Law
AIB Academy of International Business AACSB Association to Advance Collegiate Schools of Business AMBA Association of MBAs AccFin Accounting and Finance AS Athena Swan ASBS Adam Smith Business School CABS Chartered Association for Business Schools CAP College Assessment Panel CIPD Chartered Institute for Personnel and Development CoSS College of Social Sciences ECDP Early Career Development Programme E&D Equality and Diversity EOD Employee and Organisational Development ER External Relations ESRC Economic & Social Research Council GIC Glasgow International College HE Higher education HESA Higher Education Statistics Agency HoS Head of School HoSG Head of Subject Group HR Human Resources L&T Learning and Teaching L, T, S Learning, Teaching and Scholarship MVLS College of Medical, Veterinary and Life Sciences P&DR Performance and Development Review PG Postgraduate PGR Postgraduate research PGT Postgraduate taught PS Professional Services QEA Quality Enhancement and Assurance RAE Research Assessment Exercise REF Research Excellence Framework RG Russell Group R&T Research & Teaching SAB Strategic Advisory Board SAT Self-Assessment Team SC School Council SE School Executive SoMDN School of Medicine, Dentistry and Nursing SR Success Rates UB Unconscious Bias UCAS Universities and Colleges Admissions Service UG Undergraduate UofG University of Glasgow WLM Workload Model WP Widening Participation

6
2. DESCRIPTION OF THE DEPARTMENT
Recommended word count: Bronze: 500 words | Actual: 667
Please provide a brief description of the department including any relevant contextual information.
Present data on the total number of academic staff, professional and support staff and students by
gender.
The Adam Smith Business School (ASBS) was formed in 2010, bringing together the subjects of
Accounting and Finance, Economics and Management. Each subject is equivalent in size, in terms of both
staffing and students, and have approximately similar revenue and contributions; additionally, all
compete in terms of academic staffing in a highly competitive market, especially in Accounting, Finance
and Marketing. ASBS is one of five Schools within the College of Social Sciences (CoSS) and all ASBS staff
are co-located at the University’s Gilbert Scott Building.
The Head of School (HoS), Professor John Finch, took up post in January 2016. Since 2016, ASBS has
grown substantially (Chart 1) in terms of staffing (20% increase); currently 51% of staff are female, the
majority of women are employed in Professional Services (PS) (83% Female), with 39% in academic
positions.
Chart 1: ASBS Staff Numbers 2016 -2018 by Gender % (n)1
Expansion has brought new opportunities to recruit internationally diverse staff who bring a range of
diverse backgrounds and experiences from varying Higher Education systems. At the same time, this has
created challenges in how we recruit new colleagues, induct and on-board them properly to ensure they
are equipped to thrive in their new careers at the University, and maintain strong communication,
collegiality, and engagement across a growing and complex School. Diversity and inclusion, generally,
and gender equality, in particular, are common to each of these challenges. These issues are discussed
and addressed throughout our submission (see in particular, sections. 5.1(i)-(ii)-Recruitment strategies
and improving induction practice across ASBS; 5.3(iii) -ECDP and mentorship for new staff; and 5.6(i)-
(ii) Embedding AS Charter Principles into School structures and culture).
1 We understand that in the AS handbook we only need to provide data for 1 year however we wanted to show the expansion from 2016

7
Student numbers are provided in Chart 2; they are consistent, for each student group, across the 3 years.
As Chart 2 demonstrates, ASBS delivers a significant PGT portfolio to circa 2k students. PGT cohorts are
predominantly international students who aspire to use their enhanced qualifications following
graduation to pursue professional careers in corporate sectors. The rapid expansion of PGT offerings to
a growing international student body, observed across most UK Business Schools, has prompted ASBS
to address and invest in enhancing intercultural communication, understanding, and pastoral and well-
being support across the student experience (see s.5.6(i)). There is a slight drop in female UG-PGR
participation, which we discuss and outline plans to address in s.4.1 (iii-iv).
Chart 2: Students by Level and Gender % (n)2
The School governance and committee structure is outlined in Figure 1. Subjects reflect disciplinary
coherence, providing a forum to discuss and consult with colleagues on staffing provision and workload.
Internal governance rests with the School Executive (SE) (3F:7M). ‘Alternate’ shadowing roles (7 females
and 3 males) and a three-year tenure for SE were recently introduced as part of workforce planning
measures to improve gender balance. The HoS introduced a formalised process of recruitment for
Executive roles in 2018. Vacant roles are advertised, internally, with expressions of interest sought and
followed by a formal interview process. The impact of this approach on the gender balance of SE will be
evaluated over the life of the Action Plan [Action 1.1].
Action 1.1 Evaluate impact of workforce planning measure on gender balance of School Executive
(SE).
The School Council is comprised of all staff within the School and meets twice a year. It provides a forum
for the School to discuss strategies, plans, policies and helps to facilitate the fulfilment of the agreed
responsibilities of the SE, by considering reports and the development and delivery of the School
strategies.
2 We understand that in the AS handbook we only need to provide data for 1 year however we wanted to show the expansion from 2016

8
Figure 1: Governance and Committee Structure
Subject area remits are primarily based around teaching (delivery and resource); and the School has 10
Research Clusters (Table 1). These allow for the more detailed development and stewardship of the
research environment; leadership of these currently have a 50:50 gender mix.
Table 1: Research Clusters 2018
RESEARCH CLUSTER CLUSTER LEAD
Accounting M
Entrepreneurship, Development and Political Economy M
Finance M
Human Resource Management and Organisational Behaviour F
International Business and Enterprise M
Macroeconomics F
Marketing F
Microeconomics F
Services and Operations Management F
Strategy and Decision-making M
GRAND TOTAL 50/50
The School works closely with its Strategic Advisory Board (SAB) to ensure the relevance of our business
education offering. SAB members are drawn from the business and professional community. ASBS has
School Executive
School Council Accreditations
Committee
Admissions Committee
Health and Safety and Wellbeing
Committee
MBA Recruitment
and Marketing Committee
Professional Services Meeting
Quality Enhancement & Assurance
(QEA) Committee
Rankings Committee
School External
Engagement Committee
School Learning and
Teaching Committee
School Research and
Knowledge Exchange
Committee
Subject Group Meetings

9
increased female representation on SAB from 12% in 2017/18 to 38% in 2019: 6/16 SAB members are
women, including Carolyn Currie, Chief Executive of Women Enterprise Scotland. ASBS will build on this
progress towards 50F:50M representation over the next 4 years (equivalent to 2 membership rotation
cycles) [Action 1.2].
Action 1.2 Work with Strategic Advisory (SAB) Chair to improve gender balance on SAB towards
50:50 male and female membership by 2023; in line with Gender Representation on
Public Boards (Scotland) Act 2018.

10
3. THE SELF-ASSESSMENT PROCESS
Recommended word count: Bronze: 1000 words | Actual 500
i. The self-assessment team (SAT)
The SAT comprises 11 academic staff (including the HoS as an active member), 4 PS staff and 1 PGR
student. The University Gender Equality Officer (Equality and Diversity Unit) is an external advisor. There
were 9 females and 7 males. Dr Belgin Okay-Somerville went on maternity leave in September 2018 and
her SAT role was covered by Dr Marjana Johansson (both are listed here). See Table 2 below.
The SAT is representative of all subjects and staff groups across ASBS. It includes participation from staff
with a range of career stages, experience of the University and work/life balance perspectives and caring
commitments. To ensure a fair division of work, the SAT members were formed into 4 subgroups: students, staff, flexible working and maternity and organisation and culture. Each subgroup had a voluntary lead who co-ordinated analysis and feedback for each section of the application. Each subgroup reported back their findings which were discussed and minuted at the SAT meetings.
Table 2: SAT membership
Name Role F/M SAT role/information
Ms Lynn Bradley* Member of student subgroup
Lecturer (L,T,S) in Accounting and Finance
F Lecturer, joined ASBS in 2014 after a long career in professional practice. Her current non-executive positions out with the School reinforce her understanding of gender equality issues.
Miss Kirsteen Daly* Member of the staff subgroup
Accreditations, Rankings and Communication Manager Interim Joint Head of Professional Services
F Joined the University from school, has extensive PS line management experience, responsibilities in various job roles through advancement through the ranks; joined the SAT to ensure enhancement of policies to ensure equality of opportunity and career development.
Prof Iain Docherty Member of Organisation and Culture subgroup (until leaving ASBS in March 2019).
Director of External Engagement
M Worked at UofG for 15 years, prior to move to senior management position at University of Stirling just before submission.
Dr Katherine Duffy Member of Organisation and Culture subgroup.
Lecturer (R&T) in Management
F Lecturer in Marketing since 2015, with research expertise in consumer behaviour and digital consumption.

11
Name Role F/M SAT role/information
Prof John Finch Ex-officio member of SAT
Head of School M Head of School since 2016, responsible for the strategic development of the School and line manager to academic staff.
Dr Margaret Fletcher* Member of Organisation and Culture subgroup.
Senior Lecturer (R&T) in International Business Athena SWAN SAT Chair
F Holds the Equality and Diversity role on the Executive of the UK & Ireland Chapter of the Academy of International Business (AIB) and mentor for the Woman in AIB group. Past award holder of European Social Funding for Enterprise Education for women returners.
Mr David Jones Member of Organisation and Culture subgroup.
Internationalisation Officer
M Interested in promoting gender equality and diversity in the Higher Education sector.
Dr Marjana Johansson* Member of Flexible working subgroup (Joined September 2018).
Senior Lecturer (R&T) in Organisational Behaviour
F Research interests in gender, diversity and equality. Has published on the careers and experiences of international female faculty working in UK business schools.
Mrs Paula Karlsson-Brown Member of Flexible working subgroup.
Lecturer (L,T,S) in Management
F Early career lecturer on a learning & teaching contract. Joined the University in May 2016. No previous experience of equality issues.
Prof Charles Nolan Member of the staff subgroup.
Professor in Economics (Bonar MacFie Chair in Economics)
M Professor of Economics since 2010. Began career as economist at Bank of England. Returned to academia in 1998 and has held several senior administrative posts.
Dr Belgin Okay-Somerville Member of Flexible working subgroup (maternity leave September 2018).
Lecturer (R&T) in Human Resource Management
F Research interests include efficient skills utilisation at work with implications for employee wellbeing.
Prof Robbie Paton Member of the staff subgroup.
Director of Accreditations and Rankings
M Extensive professional and accreditation expertise, as well as Academic Fellow CIPD, all of which require awareness and action re: diversity, inclusion and equality.

12
Name Role F/M SAT role/information
Miss Jan Shearer Accreditation Officer Athena SWAN Professional Services Lead
F Interested in gender equality within the work place and associated polices. Engagement Lead for PS staff, looking to improve equality in the workplace.
Dr Vasilios Sogiakas Member of student subgroup (until leaving ASBS in December 2018).
Lecturer (L,T,S) in Finance
M Lecturer in Finance. Director of the Graduate Centre of Economic and Financial Studies.
Dr Evangelos Vagenas-Nanos Member of the staff subgroup.
Director of Graduate Studies
M Role includes promoting diversity and inclusion. Current research deals with issues around gender pay in corporate finance.
Mrs Jacqueline Williamson Member of Flexible working subgroup.
Finance Manager F Finance and Operations Manager, a qualified accountant with over 20 years’ service.
Miss Fan Wu Member of student subgroup.
PGR student F Full-time Ph.D. student with an interest in leadership and international business.
External to the School- Advisor to SAT Dr Katie Farrell Gender Equality Officer F Experience of UG-PGT-PGR-staff
transitions at UofG. In dual-career relationship. Shared data, advice and guidance on best practice and AS process.
*Subgroup leader
SAT membership is recognised in the School Workload Model (WLM) whereby an overall administration allocation of 150 hours per annum allows staff to take on roles and projects on a volunteer basis. The SAT membership can be reported in the annual Performance and Development Review process (P&DR) under leadership and citizenship. Additionally, allocation is made for the SAT chair (200 hours). This is
within a broad range of 150 to 350 hours allocated to other senior administrative roles.
ii. Account of the self-assessment process All staff were invited to note interest in participating in the SAT by email. The SAT chair was appointed
in September 2017, and the process of recruiting a balanced SAT team commenced. From the notes of
interest staff were recruited to ensure a balance of gender, roles and grades. A document with a remit
containing the terms of reference, goals, responsibilities and reporting structure was prepared and
agreed with the HoS. Members were recruited and coalesced around the four sub-task groups.
The first SAT meeting was held on 1st December 2017 and the SAT have met a further 7 times, with
additional meetings and online communication between various members/subgroups and other
School staff to access information and data. All members of the SAT contributed to the drafting of this
application. The initial tasks were to prepare a staff survey, analyse the data and prepare a report.
Overall survey response rate (SRR) was 60% (54% Academic SRR; 80% PS SSR). 64% of Academic female
and 47% Academic male; and 74% PS female and 100% PS males responded. All meetings of the SAT
are formally minuted, and the minutes are sent by email to the members of the SAT. Minutes are also
published on SharePoint.

13
Action 2.1 Increase Athena SWAN (AS) survey response rate to enhance engagement, which will run every 2 years.
Internal Consultation: At the start of the process, the ASBS SAT chair and PS lead met with the former SAT Chair from the School of Medicine, Dentistry and Nursing (SoMDN). Like SoMDN, ASBS is a large School with 3 strong and reasonably distinct ‘Subject’ areas, and this meeting provided useful insights. Prior to submission, drafts were reviewed by the subgroups, HoS, and by members of the University Gender Equality Steering Group. External Consultation and Learning from Best Practice: The SAT Chair, PS Lead members attended a number of events related to Athena Swan (AS) and
diversity; for example, University, Regional and National AS awareness, development and networking
events; Chartered Association of Business Schools (CABS) Diversity and Equality Workshop; Business
School AS network group; Association of Advanced Collegiate Business Schools (AACSB) Diversity
Summit; and a range of European Foundation of Management Development (EFMD) diversity
orientated events. Additionally, a critical friend at Imperial Business School and colleagues from the UK
Accreditation Group provided insights, guidance and reviewed our submission and Action Plan.
iii. Plans for the future of the self-assessment team The SAT will continue to meet regularly, at least three times per year, to implement and review the Action Plan, promote the AS agenda, and plan further activity. It will be the focus for School wide Equality & Diversity planning. Accountability for action points will be assigned to SAT members. AS progress will continue to be a standing item at the School meetings, and subject to an annual progress/impact report, detailing AS progress and other gender equality activities and disseminated via SharePoint. The SAT and associated leadership role will be embedded within the School’s governance structures, with the Chair taking on a broader, School wide, Equality and Diversity role [Action 2.2]. In addition, the SAT will oversee the creation and development of an AS web page as well as monitoring and responding to equality and diversity issues.
Action 2.2 SAT Chair to provide annual (AS) Equality and Diversity Summary as well as a quarterly Progress Report to the SE; actions and outcomes to be communicated to all staff via a standing item to School Council (SC).

14
4. A PICTURE OF THE DEPARTMENT
Recommended word count: Bronze: 2000 words | Actual 2309
4.1 Student data
(i) Access and Foundation Courses - Numbers of men and women on access or foundation courses
Widening Participation (WP) is a key strength at UofG and the central WP team at the University were recognised for this at Scotland’s Herald Diversity Awards last academic year. ASBS is pleased to work with WP offering courses on its Summer School. Pupils who attend benefit from an adjusted conditional offer and assistance in preparing for university life. Data for the last 5 years shows an average of 55% female and 45% male participation; with varied gender balance in progression to ASBS UG Economics and Management programmes (Table 3). Progression to UG programmes for male and female students was reasonably low over the 5-year period (14%F = 19/134; 27%M = 30/108)- ASBS will work with WP to investigate the aspirations and plans of participants who sign-up for ASBS courses [Action 3.1]. Table 3 Summer School Participation in ASBS Courses
Summer School participants Summer School entrants to ASBS UG Programmes
FEMALE MALE TOTAL % F FEMALE MALE TOTAL % F
2014 28 9 37 76% 0 2 2 0%
2015 27 23 50 54% 3 2 5 60%
2016 26 32 58 45% 5 8 13 38%
2017 29 13 42 69% 8 6 14 57%
2018 24 31 55 44% 3 12 15 20%
5-year ave: 134 108 242 55% 19 30 49 39%
Moreover, AS self-assessment showed teaching inputs were almost totally male. In future, Summer
School delivery will be more gender-balanced, with appropriate recognition in the Workload Model, to
promote a range of role models [Action 3.1 and 3.2].
Action 3.1 Work with the University Widening Participation (WP) team to investigate the
motivations and intentions for future study of those participating in the Summer School.
Action 3.2 Ensure female gender representation in WP Summer School in workload planning and
allocation.
The Glasgow International College (GIC) also offers degree preparation courses for international
students in partnership with the UofG. GIC is integrated into the University campus and the School
accepts students to Economics and Management.

15
Tables 4 and 5 show a generally consistent gender mix of UG and PG. Table 4: Gender Profile – GIC Undergraduate 2016-17, 2017-17 & 2018-19
ECONOMICS MANAGEMENT TOTAL
FEMALE MALE TOTAL (F%) FEMALE MALE TOTAL (F%) FEMALE MALE
2016/17 54 41 95 (56%) 59 43 102(58%) 113 (57%) 84 (43%)
2017/18 45 53 98 (46%) 39 48 87 (44%) 84 (45%) 101 (55%)
2018/19 49 40 89 (55%) 52 38 90 (57%) 101 (56%) 78 (44%)
Table 5: Gender Profile – GIC Post Graduate Teaching across the three subject areas
GIC FEMALE MALE TOTAL (F%)
2016/17 115 125 240 (48%)
2017/18 159 173 332 (48%)
2018/19 83 100 183 (45%)
(ii) Numbers of undergraduate students by gender
Full- and part-time by programme. Provide data on course applications, offers, and acceptance rates,
and degree attainment by gender.
ASBS offers 4 UG degrees namely; Accountancy and Finance, Business and Management, Business
Economics, and Economics; in addition, it is possible to study Business and Management and Economics
as joint degrees.
UG Students Registered on ASBS Programmes
Table 6. All UG Students (n) by Gender
YEAR FEMALE MALE TOTAL %F
2013/14 740 806 1546 48%
2014/15 769 780 1549 50%
2015/16 768 760 1528 50%
2016/17 776 749 1525 51%
2017/18 762 737 1499 51%
RUSSELL GROUP (RG) BENCHMARK 45% 55%
Table 6 above shows the number of full-time UG has remained relatively consistent with broadly equal
F: M ratios; the proportion of female UGs has grown slightly but not significantly. There is more even
gender balance at ASBS than across the RG benchmark (51%F: 49%M compared to 45%F: 55%M).
Table 7 shows that only a small number of students study part-time; over the period, 50% have been
female which exceeds the RG benchmark of 44%.

16
Table 7: UG Students by Academic Load and Gender YEAR LOAD FEMALE MALE TOTAL
2013/14
FULL-TIME 735 (48%) 798 (52%) 1533
PART-TIME 5 (38%) 8 (62%) 13
2014/15
FULL-TIME 766 (50%) 778 (50%) 1544
PART-TIME 3 (60%) 2 (40%) 5
2015/16
FULL-TIME 767(50%) 759 (50%) 1526
PART-TIME 1 (50%) 1 (50%) 2
2016/17
FULL-TIME 774 (51%) 748 (49%) 1522
PART-TIME 2 (67%) 1 (33%) 3
2017/18
FULL-TIME 761 (51%) 737 (49%) 1498
PART-TIME 1 (100%) 0 (0%) 1
RG BENCHMARK FULL-TIME 45% 55%
PART-TIME 44% 56%
Table 8. UG Students (n) by Subject and Gender
3 *JOINT Degrees relate to students studying more than one subject within the Business School as part of their academic plan – e.g. MA in Economics and Business & Management. There are too many variations to provide meaningful data by further disaggregating by each Joint programme.
SUBJECT YEAR FEMALE MALE %F
ACCOUNTING & FINANCE
2013/14 222 221 50%
2014/15 223 230 49%
2015/16 220 223 50%
2016/17 213 215 50%
2017/18 194 200 49%
RG B/MARK 48%
BUSINESS & MANAGEMENT
2013/14 300 183 62%
2014/15 337 198 63%
2015/16 310 181 63%
2016/17 306 185 62%
2017/18 309 191 62%
RG B/MARK 51%
BUSINESS ECONOMICS
2013/14 27 45 38%
2014/15 24 40 38%
2015/16 30 31 49%
2016/17 24 28 46%
2017/18 31 38 45%
RG B/MARK 36%
ECONOMICS
2013/14 136 291 32%
2014/15 130 245 35%
2015/16 155 254 38%
2016/17 172 259 40%
2017/18 179 260 41%
RG B/MARK 36%
JOINT3 (N.B. No equivalent RG Benchmark available)
2013/14 55 66 45%
2014/15 55 67 45%
2015/16 53 71 43%
2016/17 61 62 50%
2017/18 49 48 51%

17
• In Accounting & Finance, the gender balance is generally equal and in line with the RG
Benchmark.
• Business & Management show a clear weighting towards female students at 62%. This is
higher than the RG Benchmark, which shows positive gender balance (at 51%F) [Action 31]
• In both Business Economics and Economics, the proportions of women studying both exceed
the RG Benchmarks and show an upward trend in female participation (from 38%F to 45%F in
Bus Economics and from 32%F to 41%F in Economics over the reporting period).
This is particularly encouraging. We know that Economics, as a discipline, struggles to attract women
and most recently that the Royal Economic Society has included ‘Improving Diversity’ (with ‘particular
emphasis on promoting economics to women and girls’) as a key strategic priority in its 2019-2023
Strategic Plan4. The 51% split may be due to a more gender balanced approach to open days,
recruitment fairs and promotional endeavours, which ASBS intends to continue to develop [Action 31].
Action 31 Ensure gender representation in both Academic and PS staff at UG Open Days, Offer Holder Days and PGT recruitment sessions.
The gender split on Joint programmes has improved and now reflects a gender balance.
UG Admissions Data
Admissions are managed centrally by External Relations (ER) and are based on applicants meeting set
criteria (UCAS). As shown in Table 9 there are no significant differences in the numbers of females and
males applying, with near equal offer and acceptance rates.
Table 9: Admissions to ASBS UG Programmes- Apps/Offers/Accepts and Success Rates by Gender
ASBS ADMISSIONS APPLICATIONS OFFERS ACCEPTANCES Success Rate APPS to OFFERS
Acceptance Rate OFFERS to ACCEPT
2013/14
FEMALE 1595 46% 931 46% 241 46% 58% 26%
MALE 1869 54% 1115 54% 284 54% 60% 25%
TOTAL 3464 100% 2046 100% 525 100% 59% 26%
2014/15
FEMALE 1402 48% 855 50% 222 50% 61% 26%
MALE 1503 52% 870 50% 221 50% 58% 25%
TOTAL 2905 100% 1725 100% 443 100% 59% 26%
2015/16
FEMALE 1298 51% 803 52% 200 53% 62% 25%
MALE 1267 49% 741 48% 174 47% 58% 23%
TOTAL 2565 100% 1544 100% 374 100% 60% 24%
2016/17
FEMALE 1234 48% 755 48% 218 49% 61% 29%
MALE 1323 52% 808 52% 227 51% 61% 28%
TOTAL 2557 100% 1563 100% 445 100% 61% 28%
2017/18
FEMALE 1659 49% 1164 49% 267 49% 70% 23%
MALE 1761 51% 1203 51% 281 51% 68% 24%
TOTAL 3420 100% 2367 100% 548 100% 69% 23%
4 https://www.res.org.uk/about/our-strategy.html

18
UG Attainment As shown in Table 10, female first-class awards have increased from 17% to 36% compared to males
15% to 22%. Both are above the RG benchmark. The majority of degrees conferred to male and female
students are at Upper Second Class honours level across the period.
Table 10: UG Attainment – All Degrees – by HESA Classification and Gender
UG Degree Outcomes by Gender
FEMALE MALE TOTAL
no. % ↓5 % →6 no. % ↓ % → no. % ↓
2013/14
FIRST CLASS 25 17% 54% 21 15% 46% 46 16%
UPPER SECOND 106 70% 54% 92 66% 46% 198 68%
LOWER SECOND 17 11% 43% 23 17% 58% 40 14%
THIRD CLASS 2 1% 50% 2 1% 50% 4 1%
ORDINARY/UNCLASSIFIED HONS 1 1% 50% 1 1% 50% 2 1%
TOTAL 151 100% 52% 139 100% 48% 290 100%
2014/15
FIRST CLASS 29 21% 55% 24 17% 45% 53 19%
UPPER SECOND 96 69% 52% 90 63% 48% 186 66%
LOWER SECOND 9 6% 25% 27 19% 75% 36 13%
THIRD CLASS 1 1% 100% 0 0% 0% 1 0%
ORDINARY/UNCLASSIFIED HONS 4 3% 80% 1 1% 20% 5 2%
TOTAL 139 100% 49% 142 100% 51% 281 100%
2015/16
FIRST CLASS 52 24% 57% 39 17% 43% 91 21%
UPPER SECOND 131 61% 47% 149 67% 53% 280 64%
LOWER SECOND 28 13% 45% 34 15% 55% 62 14%
THIRD CLASS 1 0% 50% 1 0% 50% 2 0%
ORDINARY/UNCLASSIFIED HONS 2 1% 67% 1 0% 33% 3 1%
TOTAL 214 100% 49% 224 100% 51% 438 100%
2016/17
FIRST CLASS 60 28% 58% 44 22% 42% 104 25%
UPPER SECOND 133 62% 51% 127 62% 49% 260 62%
LOWER SECOND 20 9% 42% 28 14% 58% 48 11%
THIRD CLASS 1 0% 33% 2 1% 67% 3 1%
ORDINARY/UNCLASSIFIED HONS 1 0% 25% 3 1% 75% 4 1%
TOTAL 215 100% 51% 204 100% 49% 419 100%
2017/18
FIRST CLASS 59 36% 63% 34 22% 37% 93 29%
UPPER SECOND 83 51% 45% 101 66% 55% 184 58%
LOWER SECOND 20 12% 51% 19 12% 49% 39 12%
THIRD CLASS 0 0% 0% 0 0% 0% 0 0%
ORDINARY/UNCLASSIFIED HONS
0 0% 0% 0 0% 0% 0 0%
TOTAL 162 100% 51% 154 100% 49% 316 100%
5Compare vertically within gender 6 Compare horizontally across total population

19
RG Benchmark: 2017-18
OVERALL UG Degree Outcomes by Gender
FEMALE MALE TOTAL
% ↓ % → % ↓ % → % ↓
RG B/Mark
FIRST CLASS 29% 51% 24% 49% 26%
UPPER SECOND 50% 46% 51% 54% 51%
LOWER SECOND 15% 42% 17% 58% 16%
THIRD CLASS 3% 41% 3% 59% 3%
ORDINARY/UNCLASSIFIED HONS 4% 42% 4% 58% 4%
TOTAL 100% 46% 100% 54% 100%
Tables 11–14 detail performance by subject area. Females tend to gain proportionately more first-class
degrees than their male counterparts. Such performance discrepancies are investigated at a
programme level through both internal quality assurance and external (AACSB) assurance of learning.
These outcomes re: proportions achieving first class honours degree outcome reflect overall trends at
the University (31% F: 29%M) and CoSS (26%F: 22%M) level for 2017/18. The numbers of students
graduating in Joint Degrees and Business Economics, Table 15, are too low to draw any firm
conclusions.

20
Table 11: UG Attainment – Accounting & Finance – by HESA Classification and Gender
Accounting & Finance UG Degree Outcomes by Gender
FEMALE MALE TOTAL
no. % ↓ % → no. % ↓ % → no. % ↓
2013/14
FIRST CLASS 11 22% 61% 7 16% 39% 18 19%
UPPER SECOND 27 54% 51% 26 60% 49% 53 57%
LOWER SECOND 10 20% 56% 8 19% 44% 18 19%
THIRD CLASS 1 2% 33% 2 5% 67% 3 3%
ORDINARY/UNCLASSIFIED HONS 1 2% 100% 0% 0% 1 1%
TOTAL 50 100% 54% 43 100% 46% 93 100%
2014/15
FIRST CLASS 10 20% 59% 7 15% 41% 17 18%
UPPER SECOND 30 61% 51% 29 63% 49% 59 62%
LOWER SECOND 5 10% 36% 9 20% 64% 14 15%
THIRD CLASS 0 0% n/a 0 0% n/a 0 0%
ORDINARY/UNCLASSIFIED HONS 4 8% 80% 1 2% 20% 5 5%
TOTAL 49 100% 52% 46 100% 48% 95 100%
2015/16
FIRST CLASS 16 26% 59% 11 17% 41% 27 22%
UPPER SECOND 34 56% 44% 44 70% 56% 78 63%
LOWER SECOND 10 16% 63% 6 10% 38% 16 13%
THIRD CLASS 0 0% 0% 1 2% 100% 1 1%
ORDINARY/UNCLASSIFIED HONS 1 2% 50% 1 2% 50% 2 2%
TOTAL 61 100% 49% 63 100% 51% 124 100%
2016/17
FIRST CLASS 15 25% 75% 5 8% 25% 20 17%
UPPER SECOND 41 67% 52% 38 64% 48% 79 66%
LOWER SECOND 4 7% 25% 12 20% 75% 16 13%
THIRD CLASS 0 0% 0% 1 2% 100% 1 1%
ORDINARY/UNCLASSIFIED HONS 1 2% 25% 3 5% 75% 4 3%
TOTAL 61 100% 51% 59 100% 49% 120 100%
2017/18
FIRST CLASS 12 28% 60% 8 18% 40% 20 23%
UPPER SECOND 23 53% 41% 33 75% 59% 56 64%
LOWER SECOND 8 19% 73% 3 7% 27% 11 13%
THIRD CLASS 0 0% 0% 0 0% 0% 0 0%
ORDINARY/UNCLASSIFIED HONS 0 0% 0% 0 0% 0% 0 0%
TOTAL 43 100% 49% 44 100% 51% 87 100%

21
Table 12 UG Attainment – Business & Management – by HESA Classification and Gender
Business & Management UG Degree Outcomes by Gender
FEMALE MALE TOTAL
no. % ↓ % → no. % ↓ % → no. % ↓
2013/14
FIRST CLASS 7 11% 64% 4 11% 36% 11 11%
UPPER SECOND 49 79% 68% 23 66% 32% 72 74%
LOWER SECOND 5 8% 42% 7 20% 58% 12 12%
THIRD CLASS 1 2% 100% 0 0% 0% 1 1%
ORDINARY/UNCLASSIFIED HONS 0 0% 0% 1 3% 100% 1 1%
TOTAL 62 100% 64% 35 100% 36% 97 100%
2014/15
FIRST CLASS 13 22% 76% 4 14% 24% 17 20%
UPPER SECOND 43 74% 69% 19 68% 31% 62 72%
LOWER SECOND 2 3% 29% 5 18% 71% 7 8%
THIRD CLASS 0 0% 0% 0 0% 0% 0 0%
ORDINARY/UNCLASSIFIED HONS 0 0% 0% 0 0% 0% 0 0%
TOTAL 58 100% 67% 28 100% 33% 86 100%
2015/16
FIRST CLASS 17 20% 77% 5 9% 23% 22 15%
UPPER SECOND 58 67% 58% 42 75% 42% 100 70%
LOWER SECOND 11 13% 55% 9 16% 45% 20 14%
THIRD CLASS 0 0% 0% 0 0% 0% 0 0%
ORDINARY/UNCLASSIFIED HONS 1 1% 100% 0 0% 0% 1 1%
TOTAL 87 100% 61% 56 100% 39% 143 100%
2016/17
FIRST CLASS 23 25% 77% 7 14% 23% 30 21%
UPPER SECOND 59 64% 61% 38 75% 39% 97 68%
LOWER SECOND 10 11% 63% 6 12% 38% 16 11%
THIRD CLASS 0 0% 0% 0 0% 0% 0 0%
ORDINARY/UNCLASSIFIED HONS 0 0% 0% 0 0% 0% 0 0%
TOTAL 92 100% 64% 51 100% 36% 143 100%
2017/18
FIRST CLASS 26 40% 79% 7 19% 21% 33 33%
UPPER SECOND 33 51% 59% 23 64% 41% 56 55%
LOWER SECOND 6 9% 50% 6 17% 50% 12 12%
THIRD CLASS 0 0% 0% 0 0% 0% 0 0%
ORDINARY/UNCLASSIFIED HONS 0 0% 0% 0 0% 0% 0 0%
TOTAL 65 100% 64% 36 100% 36% 101 100%

22
Table 13. UG Attainment – Business Economics – by HESA Classification and Gender
Business Economics UG Degree Outcomes by Gender
FEMALE MALE TOTAL
no. % ↓ % → no. % ↓ % → no. % ↓
2013/14
FIRST CLASS 0 0% 0% 1 11% 100% 1 8%
UPPER SECOND 4 100% 40% 6 67% 60% 10 77%
LOWER SECOND 0 0% 0% 2 22% 100% 2 15%
THIRD CLASS 0 0% 0% 0 0% 0% 0 0%
ORDINARY/UNCLASSIFIED HONS 0 0% 0% 0 0% 0% 0 0%
TOTAL 4 100% 31% 9 100% 69% 13 100%
2014/15
FIRST CLASS 1 20% 100% 0 0% 0% 1 7%
UPPER SECOND 3 60% 33% 6 67% 67% 9 64%
LOWER SECOND 0% 0% 3 33% 100% 3 21%
THIRD CLASS 1 20% 100% 0 0% 0% 1 7%
ORDINARY/UNCLASSIFIED HONS 0 0% 0% 0 0% 0% 0 0%
TOTAL 5 100% 36% 9 100% 64% 14 100%
2015/16
FIRST CLASS 2 22% 67% 1 13% 33% 3 18%
UPPER SECOND 6 67% 60% 4 50% 40% 10 59%
LOWER SECOND 1 11% 25% 3 38% 75% 4 24%
THIRD CLASS 0 0% 0% 0 0% 0% 0 0%
ORDINARY/UNCLASSIFIED HONS 0 0% 0% 0 0% 0% 0 0%
TOTAL 9 100% 53% 8 100% 47% 17 100%
2016/17
FIRST CLASS 1 25% 100% 0 0% 0% 1 14%
UPPER SECOND 2 50% 50% 2 67% 50% 4 57%
LOWER SECOND 1 25% 50% 1 33% 50% 2 29%
THIRD CLASS 0 0% n/a 0 0% n/a 0 0%
ORDINARY/UNCLASSIFIED HONS 0 0% n/a 0 0% n/a 0 0%
TOTAL 4 100% 57% 3 100% 43% 7 100%
2017/18
FIRST CLASS 4 57% 57% 3 33% 43% 7 44%
UPPER SECOND 2 29% 29% 5 56% 71% 7 44%
LOWER SECOND 1 14% 50% 1 11% 50% 2 13%
THIRD CLASS 0 0% 0% 0 0% 0% 0 0%
ORDINARY/UNCLASSIFIED HONS 0 0% 0% 0 0% 0% 0 0%
TOTAL 7 100% 44% 9 100% 56% 16 100%

23
Table 14. UG Attainment – Economics – by HESA Classification and Gender
Economics UG Degree Outcomes by Gender
FEMALE MALE TOTAL
no. % ↓ % → no. % ↓ % → no. % ↓
2013/14
FIRST CLASS 6 24% 50% 6 13% 50% 12 17%
UPPER SECOND 17 68% 33% 34 74% 67% 51 72%
LOWER SECOND 2 8% 25% 6 13% 75% 8 11%
THIRD CLASS 0 0% 0% 0 0% 0% 0 0%
ORDINARY/UNCLASSIFIED HONS 0 0% 0% 0 0% 0% 0 0%
TOTAL 25 100% 35% 46 100% 65% 71 100%
2014/15
FIRST CLASS 4 21% 27% 11 22% 73% 15 22%
UPPER SECOND 14 74% 32% 30 60% 68% 44 64%
LOWER SECOND 1 5% 10% 9 18% 90% 10 14%
THIRD CLASS 0 0% 0% 0 0% 0% 0 0%
ORDINARY/UNCLASSIFIED HONS 0 0% 0% 0 0% 0% 0 0%
TOTAL 19 100% 28% 50 100% 72% 69 100%
2015/16
FIRST CLASS 12 29% 43% 16 21% 57% 28 24%
UPPER SECOND 24 57% 33% 49 65% 67% 73 62%
LOWER SECOND 5 12% 33% 10 13% 67% 15 13%
THIRD CLASS 1 2% 100% 0 0% 0% 1 1%
ORDINARY/UNCLASSIFIED HONS 0 0% 0% 0 0% 0% 0 0%
TOTAL 42 100% 36% 75 100% 64% 117 100%
2016/17
FIRST CLASS 15 44% 36% 27 39% 64% 42 40%
UPPER SECOND 16 47% 31% 36 51% 69% 52 50%
LOWER SECOND 3 9% 33% 6 9% 67% 9 9%
THIRD CLASS 0 0% 0% 1 1% 100% 1 1%
ORDINARY/UNCLASSIFIED HONS 0 0% 0% 0 0% 0% 0 0%
TOTAL 34 100% 33% 70 100% 67% 104 100%
2017/18
FIRST CLASS 12 30% 44% 15 28% 56% 27 29%
UPPER SECOND 23 58% 43% 30 56% 57% 53 56%
LOWER SECOND 5 13% 36% 9 17% 64% 14 15%
THIRD CLASS 0 0% 0% 0 0% 0% 0 0%
ORDINARY/UNCLASSIFIED HONS 0 0% 0% 0 0% 0% 0 0%
TOTAL 40 100% 43% 54 100% 57% 94 100%

24
Table 15 UG Attainment – Joint Degrees – by HESA Classification and Gender
Joint UG Degree Outcomes by Gender
FEMALE MALE TOTAL
no. % ↓ % → no. % ↓ % → no. % ↓
2013/14
FIRST CLASS 1 10% 25% 3 50% 75% 4 25%
UPPER SECOND 9 90% 75% 3 50% 25% 12 75%
LOWER SECOND 0 0% 0% 0 0% 0% 0 0%
THIRD CLASS 0 0% 0% 0 0% 0% 0 0%
ORDINARY/UNCLASSIFIED HONS 0 0% 0% 0 0% 0% 0 0%
TOTAL 10 100% 63% 6 100% 38% 16 100%
2014/15
FIRST CLASS 1 13% 33% 2 22% 67% 3 18%
UPPER SECOND 6 75% 50% 6 67% 50% 12 71%
LOWER SECOND 1 13% 50% 1 11% 50% 2 12%
THIRD CLASS 0 0% 0% 0 0% 0% 0 0%
ORDINARY/UNCLASSIFIED HONS 0 0% 0% 0 0% 0% 0 0%
TOTAL 8 100% 47% 9 100% 53% 17 100%
2015/16
FIRST CLASS 5 33% 45% 6 27% 55% 11 30%
UPPER SECOND 9 60% 47% 10 45% 53% 19 51%
LOWER SECOND 1 7% 14% 6 27% 86% 7 19%
THIRD CLASS 0 0% 0% 0 0% 0% 0 0%
ORDINARY/UNCLASSIFIED HONS 0 0% 0% 0 0% 0% 0 0%
TOTAL 15 100% 41% 22 100% 59% 37 100%
2016/17
FIRST CLASS 6 25% 55% 5 24% 45% 11 24%
UPPER SECOND 15 63% 54% 13 62% 46% 28 62%
LOWER SECOND 2 8% 40% 3 14% 60% 5 11%
THIRD CLASS 1 4% 100% 0 0% 0% 1 2%
ORDINARY/UNCLASSIFIED HONS 0 0% 0% 0 0% 0% 0 0%
TOTAL 24 100% 53% 21 100% 47% 45 100%
2017/18
FIRST CLASS 5 71% 83% 1 9% 17% 6 33%
UPPER SECOND 2 29% 17% 10 91% 83% 12 67%
LOWER SECOND 0 0% 0% 0 0% 0% 0 0%
THIRD CLASS 0 0% 0% 0 0% 0% 0 0%
ORDINARY/UNCLASSIFIED HONS 0 0% 0% 0 0% 0% 0 0%
TOTAL 7 100% 39% 11 100% 61% 18 100%

25
(iii) Numbers of men and women on postgraduate taught degrees
Full- and part-time. Provide data on course application, offers and acceptance rates and degree
completion rates by gender.
There are 45 PGT degrees available across the three subjects; 5 Accounting and Finance, 16 Economics
and 24 Management PGT degrees. These include specialist and general MSc’s, MBA and Professional
Pathways. All MSc’s are full-time. Due to the high number of programmes the data is provided in
aggregate for each year. Table 16 shows a consistent two third female participation which is above the
RG average. This ratio is broadly similar across all PGT programmes, with female participation never
falling below 50%.
Table 16. All PGT Students (n) by Gender
YEAR FEMALE MALE %F
2013/14 1131 587 66%
2014/15 1007 606 62%
2015/16 1042 624 63%
2016/17 1126 647 64%
2017/18 1204 693 63%
Russel Group Benchmark 57%
PGT Student Admissions and Registration Data by Gender
Admissions are managed centrally, admissions volumes are monitored and managed through PGT
Admissions Committee or MBA admissions (the latter to reflect Association of MBA’s (AMBA),
requirement for an interview. They do not make decisions on individual applications, and diversity is
monitored in terms of nation from which the application comes. The MBA is slightly different as each
candidate is interviewed to ensure professional competency and an ability to engage with a diverse
learning community (in line with AMBA accreditation standards). Interviewers have completed the
University Unconscious Bias training course.
Table 17 shows that more females apply to PGT courses than males. However, males tend to be
marginally more successful at gaining offers and less likely to accept an offer. The average number of
registered PGT students over the period is 1,773. More females study PG courses than males, the
proportion who are female over the period ranged from 62% to 66%.
2013/2014 was an unusual year where we experienced an unexpected large increase in the volume of
applications for PGT courses. Rates returned to more normal levels for the remaining period.

26
Table 17. Admissions to ASBS PGT Programmes- Apps/Offers/Accepts and Success Rates by Gender
PGT ADMISSIONS APPLICATIONS OFFERS ACCEPTANCES
Success Rate APPS to OFFERS
Acceptance Rate OFFERS to ACCEPTS
2013/14
FEMALE 8771 63% 5060 66% 2378 68% 58% 47%
MALE 5048 37% 2650 34% 1138 32% 52% 43%
TOTAL 13819 100% 7710 100% 3516 100% 56% 46%
2014/15
FEMALE 7685 64% 1630 59% 1293 61% 21% 79%
MALE 4290 36% 1146 41% 840 39% 27% 73%
TOTAL 11975 100% 2776 100% 2133 100% 23% 77%
2015/16
FEMALE 7670 65% 1746 59% 1344 61% 23% 77%
MALE 4182 35% 1220 41% 863 39% 29% 71%
TOTAL 11852 100% 2966 100% 2207 100% 25% 74%
2016/17
FEMALE 6542 66% 1780 62% 1412 64% 27% 79%
MALE 3302 34% 1091 38% 799 36% 33% 73%
TOTAL 9844 100% 2871 100% 2211 100% 29% 77%
2017/18
FEMALE 8087 66% 1944 62% 1633 64% 24% 84%
MALE 4143 34% 1185 38% 905 36% 29% 76%
TOTAL 12230 100% 3129 100% 2538 100% 26% 81%

27
PGT Attainment:
PGT Degree Outcomes
The female and male attainment is similar; participants are most likely to achieve a Qualified outcome,
Table 18. As previously noted, attainment variations are monitored at a programme level and are subject
to both internal quality assurance review, and external accreditation review.
Table 18. PGT Attainment– by HESA Classification and Gender
PGT Degree Outcomes by Gender
FEMALE MALE TOTAL
no. % ↓ % → no. % ↓ % → no. % ↓
2013/14
DISTINCTION 47 4% 57% 35 6% 43% 82 5%
MERIT 459 41% 66% 232 41% 34% 691 41%
QUALIFIED 604 54% 67% 300 53% 33% 904 54%
TOTAL 1110 100% 66% 567 100% 34% 1677 100%
2014/15
DISTINCTION 52 5% 55% 43 8% 45% 95 6%
MERIT 384 40% 63% 230 41% 37% 614 40%
QUALIFIED 526 55% 64% 290 52% 36% 816 54%
TOTAL 962 100% 63% 563 100% 37% 1525 100%
2015/16
DISTINCTION 60 6% 61% 39 7% 39% 99 6%
MERIT 422 44% 64% 238 41% 36% 660 43%
QUALIFIED 475 50% 61% 306 52% 39% 781 51%
TOTAL 957 100% 62% 583 100% 38% 1540 100%
2016/17
DISTINCTION 55 5% 50% 54 9% 50% 109 6%
MERIT 474 44% 64% 265 44% 36% 739 44%
QUALIFIED 560 51% 67% 279 47% 33% 839 50%
TOTAL 1089 100% 65% 598 100% 35% 1687 100%
2017/18
DISTINCTION 132 11% 65% 70 11% 35% 202 6%
MERIT 578 50% 68% 267 42% 32% 845 44%
QUALIFIED 442 38% 59% 302 47% 41% 744 50%
TOTAL 1152 100% 64% 639 100% 36% 1791 100%

28
(iv) Numbers of men and women on postgraduate research degrees Full- and part-time. Provide data on course application, offers, acceptance and degree completion rates by gender. PGR student numbers, see Table 19, increased over the 5 year period from 111 to 160; with average female participation of 39%, which is below the RG Benchmark. Table 19.1 shows slight subject-level variations, with participation in Business and Management more in line with benchmarks. Table 20 presents registered students by academic load and reflects the overall demographics. Table 19. All PGR Registered Students (n) by Gender
YEAR FEMALE MALE %F
2013/14 43 68 39%
2014/15 52 79 40%
2015/16 48 82 37%
2016/17 55 85 39%
2017/18 55 105 34%
RG B/Mark 45%
Table 19.1 All PGR Registered Students (n) by Gender and Main Subject
2013/14 2014/15 2015/16 2016/17 2017/18
F/M (F%) F/M (F%) F/M (F%) F/M (F%) F/M (F%)
ACCOUNTING & FINANCE 11/22 (33%) 10/24 (29%) 11/30 (27%) 18/30 (38%) 19/34 (36%)
ECONOMICS 12/23 (34%) 15/24 (38%) 17/26 (40%) 14/25 (36%) 11/34 (24%)
MANAGEMENT 18/22 (45%) 25/28 (47%) 20/26 (43%) 23/30 (43%) 24/36 (40%)
BUSINESS SCHOOL PVR 2/1 (67%) 2/3 (40%) 1/1 (50%)
RG B/Mark 45%
Table 20. PGR Students by Academic Load and Gender
YEAR LOAD FEMALE MALE TOTAL
2013/14
FULL-TIME 37 (40%) 56 (60%) 93
PART-TIME 6 (33%) 12 (67%) 18
2014/15
FULL-TIME 44 (41%) 64 (59%) 108
PART-TIME 8 (35%) 15 (65%) 23
2015/16
FULL-TIME 40 (39%) 63 (61%) 103
PART-TIME 8 (30%) 19 (70%) 27
2016/17
FULL-TIME 45 (40%) 67 (60%) 112
PART-TIME 10 (36%) 18 (64%) 28
2017/18
FULL-TIME 47 (36%) 85 (64%) 132
PART-TIME 8 (29%) 20 (71%) 28
RG B/Mark
FULL-TIME 47% 53%
PART-TIME 39% 61%

29
We use opportunities to profile a diverse range of women in our PGR communications and in our School newsletters and annual reviews:
PhD Update from 2017/18 ASBS Annual Review ‘Alumni Views’ on prospective PGR webpages AS Self-assessment has shown that our ‘Alumni Views’ segments (one of the first page’s prospective students might come to on the webpage) profiles female alumni well for PGR in Business and Management. However, all alumni featured for Economics and Accounting and Finance are male. Therefore, we aim to improve gender balance in recruitment and promotional activities and materials [Action 4]. We also plan to mainstream diversity and inclusion within our PGR attraction strategies with External Relations, as per our discussion of Admissions below [Action 5].
Action 4 Work with School PGR team and ER to improve the gender balance in all recruitment and promotional activities and materials.
Action 5 Work with the School PGR team and ER to embed diversity and inclusion within recruitment strategy towards increasing female applications/engagement.

30
PGR Admissions Data:
Table 21 below shows that there are consistently more males than females applying for PhDs, with the
ratio of a third female applications. This pattern continues, whereby the offers and acceptances made
to females are lower and resulting in a lower ratio of PGR female students registered. The proportion of
male students ranged from 61% to 66%.
As noted above, Action 4 notes the need to address gender balance when recruiting. However, it will
not address nuances related to doctoral funding. Action 5 will aim to tailor specific PGR recruitment
initiatives. PGR recruitment is centralised, and only once a formal application and associated paperwork
has been gathered will the application be considered for supervision. Detailed data is not readily
available to the School.
Action 5 Work with the School PGR team and ER to embed diversity and inclusion within recruitment strategy towards increasing female applications/engagement.
Table 21. Admissions to ASBS PGR Programmes- Apps/Offers/Accepts and Success Rates by Gender
PGR ADMISSIONS APPLICATIONS OFFERS ACCEPTANCES
Success Rate APPS to OFFERS
Acceptance Rate OFFERS to ACCEPTS
2013/14
FEMALE 192 34% 38 40% 23 40% 20% 61%
MALE 373 66% 56 60% 34 60% 15% 61%
TOTAL 565 100% 94 100% 57 100% 17% 61%
2014/15
FEMALE 227 36% 48 47% 42 47% 21% 88%
MALE 411 64% 55 53% 48 53% 13% 87%
TOTAL 638 100% 103 100% 90 100% 16% 87%
2015/16
FEMALE 172 35% 34 35% 26 36% 20% 76%
MALE 318 65% 62 65% 46 64% 19% 74%
TOTAL 490 100% 96 100% 72 100% 20% 75%
2016/17
FEMALE 153 35% 30 42% 23 40% 20% 77%
MALE 286 65% 41 58% 34 60% 14% 83%
TOTAL 439 100% 71 100% 57 100% 16% 80%
2017/18
FEMALE 166 36% 38 41% 26 36% 23% 68%
MALE 289 64% 55 59% 46 64% 19% 83%
TOTAL 455 100% 93 100% 72 100% 20% 77%

31
PGR Completion Rates
Table 22 shows the completion rates. Overall there are no major differences with completion rates
varying between 70% and 100% for both genders.
Table 22. PGR Completion Rates (n) by Gender
ADMIT TERM
MILESTONE ACHIEVED NOT ACHIEVED TOTAL
% Completion
FEMALE MALE FEMALE MALE FEMALE MALE FEMALE MALE
2008 5 8 2 3 7 11 71% 73%
2009 5 9 0 0 5 9 100% 100%
2010 5 7 0 3 5 10 100% 70%
2011 8 16 2 3 10 19 80% 84%
2012 15 23 1 4 16 27 94% 85%
2013 9 14 2 0 11 14 82% 100%
Although the PGR completion rates are on a par, there is no hard data relating to the causes of non-
completion. In conjunction with Action 5, this is intended to shed light on underlying progress issues and
if needed ensure the supervisory training course addresses any pertinent outcomes.

32
(v) Progression pipeline between undergraduate and postgraduate student levels
Identify and comment on any issues in the pipeline between undergraduate and postgraduate degrees.
The School hosts open sessions for our UG and PGT students as potential applicants to our PhD
programmes. Dissertation supervisors within the school encourage UG and PGT students to apply for
PhDs. All PGT students who are on track to gain above a ‘B’ are invited to attend an PhD open evening
where they meet PGR convenors, as well as current students across the subjects to discuss PhD
opportunities.
Chart 3: Pipeline data
For the School as a whole, the proportion of female students at PGT level is consistently higher than that
at UG and PGR level. At UG level there is gender balance, but PGR has significantly more males than
females. As outlined above, we will address the underrepresentation of women PGRs via: [Actions 4
and 5].
Action 4 Work with School PGR team and ER to improve the gender balance in all recruitment and promotional activities and materials.
Action 5 Work with the School PGR team and ER to embed diversity and inclusion within recruitment strategy towards increasing female applications/engagement.

33
4.2 ACADEMIC AND RESEARCH STAFF DATA
(i) Academic staff by grade, contract function and gender: research-only, teaching and reach or
teaching-only.
Look at the career pipeline and comment on and explain any differences between men and women.
Identify any gender issues in the pipeline at particular grades/job type/academic contract type.
ASBS’ staff body has grown year-on-year and from 118 (2013/14) to 162 (2017/18). This growth has
predominantly been to support increased PG teaching.
Table 23 and Chart 4 present overall gender composition of each subject. Academic women are
underrepresented overall, although the number has increased, the proportion remained at
approximately 36%. This data shows increasing underrepresentation of women in Accounting & Finance
(AccFin); in Economics there was an upward trajectory until 2017/18, where 4 women left; and in
Management an improvement over the period in women to 45% in 2017/18.
Census dates for data are July each academic year (i.e. July 2014 for 2013/14 etc.); a review of February
2019 data show the number and proportion of women in AccFin rose back to 36% (n=18); female
proportion remained the same for Economics at 28% (n=15); and increased slightly for Management at
46% (n=30).
Table 23: Academic and research staff number by gender and subject group
YEAR ACCOUNTING &
FINANCE ECONOMICS MANAGEMENT TOTAL
FEMALE MALE FEMALE MALE FEMALE MALE FEMALE MALE
2013/14 13 15 10 32 19 29 42 76
2014/15 13 21 14 33 19 27 46 81
2015/16 15 23 16 34 21 30 52 87
2016/17 15 27 18 35 22 32 55 94
2017/18 15 30 14 36 29 36 58 102
Chart 4: Staff number by gender and subject group (%)

34
UofG has 3 main career tracks for Academic and Research staff:
• Research & Teaching (R&T)
• Learning, Teaching and Scholarship (L, T, S)
• Research-Only (Research)
Table 24 shows the Grades for each of the roles within each of the 3 tracks.
Table 24. Grade and Role Structure for Academic and Research Staff at University of Glasgow
GRADE R&T ROLES L, T, S ROLES RESEARCH ROLES
GRADE 6 N/A TEACHING ASSISTANT RESEARCH ASSISTANT
GRADE 7 LECTURER LECTURER RESEARCH ASSOCIATE
??ASSISTANT/ASSOCIATE GRADE 8 LECTURER LECTURER RESEARCH ASSOCIATE/FELLOW
GRADE 9 SENIOR LECTURER
LELELECTURER/READER
SENIOR LECTURER SENIOR RESEARCH FELLOW
PROFESSOR PROFESSOR PROFESSOR PROFESSOR
The bulk of all Academic and Research Staff are on R&T contracts. Female numbers overall have
increased for R&T (increase of 10) and L, T, S staff (increase of 8). The female research only has
decreased. See Table 25:
Table 25: Breakdown of Academic Roles from 2013/14 – 2017/18
YEAR R&T
L, T, S RESEARCH TOTAL
FEMALE MALE FEMALE MALE FEMALE MALE FEMALE MALE
2013/14 31 (30%) 71(70%) 6 (75%) 2(25%) 5 (63%) 3 (37%) 42 (36%) 76(64%)
2014/15 33 (31%) 72(69%) 6 (60%) 4(40%) 7 (58%) 5 (42%) 46 (36%) 81(64%)
2015/16 34 (32%) 71(68%) 11(65%) 6(35%) 9 (45%) 11 (55%) 54 (38%) 88(62%)
2016/17 39 (35%) 71(65%) 12(63%) 7(37%) 4 (20%) 16 (80%) 55 (37%) 94(63%)
2017/18 41 (36%) 72(64%) 14(50%) 14 (50%) 3 (16%) 16 (84%) 58 (36%) 102 (64%)
Table 26 below shows that women start to become underrepresented at Grade 9. Women are more
represented in Grades 7 and 8 roles across all years. The data also shows a significantly higher proportion
of male compared to female professors. This is low compared to the university average of 27%. It is
notable that in 2017/18 there has been a significant increase in the percentage of female professors to
23%. The increase in female professorial staff has been due to recruitment rather than promotion
rounds. Our recruitment and progression actions should further improve our female pipeline towards
progression to Grade 9 and Professorship [Actions 7.1-7.4 (recruitment) and Actions 9 -10
(progression)].
Action 7.1 Strengthen the equality statement in job adverts and candidate brochures for the School to explicitly encourage women, an underrepresented group to apply (a particular issue at Grade 9 and above).
Action 7.2 Challenge internal search committees to identify an equal list of potential male and female candidates for senior posts and encourage applications.
Action 7.3 Highlight ASBS as an inclusive and supportive environment for career development and progression: create profiles of male and female staff linked to recruitment material.

35
Action 7.4 Evaluate recruitment data to ensure that females are not appointed to the lower end of grade spectrums (Grades 7-9).
Action 9
Hold annual promotion workshop covering criteria changes and process for all tracks and career stages.
Action 10 Invite College HR and EOD to deliver on ways to use P&DR discussions in progression planning.
Table 26. Academic and Research Staff by Grade and Gender 2013/14 – 2017/18
ACADEMIC
&
RESEARCH
2013/14 2014/15 2015/16 2016/17 2017/18
F M %F F M %F F M %F F M %F F M %F
GRADE 6 0 1 0% 1 3 25% 4 7 36% 2 5 29% 1 2 33%
GRADE 7 8 9 47% 7 7 50% 14 10 58% 16 12 57% 16 18 47%
GRADE 8 13 8 62% 15 12 56% 14 9 61% 13 16 45% 13 17 43%
GRADE 9 14 20 41% 15 24 38% 14 25 36% 16 26 38% 17 29 37%
PROF 7 38 16% 8 35 19% 8 37 18% 8 36 18% 11 36 23%
Tables 27 shows the breakdown of grades within R&T roles. There is a higher proportion of females at Grade 8 from 2013 to 2016, which dips in 2017.
Table 27. RT Staff by Grade and Gender 2013/14 – 2017/18
RT 2013/14 2014/15 2015/16 2016/17 2017/18
F M %F F M %F F M %F F M %F F M %F
GRADE 7 5 7 42% 3 4 43% 5 4 56% 8 5 62% 8 6 57%
GRADE 8 10 7 59% 11 11 50% 11 8 58% 11 13 46% 9 12 43%
GRADE 9 9 19 32% 11 22 33% 10 22 31% 12 23 34% 13 25 34%
PROF 7 38 16% 8 35 19% 8 37 18% 8 30 21% 11 29 28%
In 2016 the University introduced a L, T, S track for academics with clearly defined promotion criteria.
Since 2013 appointments to L, T, S staff have increased. There are more females than males in these
roles at all grade levels (Table 28). There is representation at Grade 9 but it is too early to comment on
the progression to L, T, S professorial roles given the recent introduction of it as a clear career ‘track’.
One L, T, S female professor was appointed in 2015 and has since moved to a College Assistant Vice-
Principal role.
Table 28. Learning, Teaching and Scholarship Staff by Grade and Gender 2013/14 – 2017/18
TEACHING 2013/14 2014/15 2015/16 2016/17 2017/18
F M %F F M %F F M %F F M %F F M %F
GRADE 7 2 0 100% 2 1 67% 6 2 75% 6 2 75% 6 6 75%
GRADE 8 0 1 0% 1 1 50% 1 1 50% 2 2 50% 4 4 50%
GRADE 9 4 1 80% 3 2 60% 4 3 57% 4 3 57% 4 4 57%
PROF 0 0 n/a 0 0 n/a 0 0 n/a 0 0 n/a 0 0 n/a
The proportion of staff in research only posts is low. This is due to the nature of the School’s research
which does not often require large research teams and does not tend to be funded in this manner (see
Table 29).

36
Table 29. Research Staff by Grade and Gender 2013/14 – 2017/18
RESEARCH 2013/14 2014/15 2015/16 2016/17 2017/18
F M %F F M %F F M %F F M %F F M %F
GRADE 6 0 1 0% 1 3 25% 4 7 36% 2 5 29% 1 2 33%
GRADE 7 1 2 33% 2 2 50% 3 4 43% 2 5 29% 2 6 25%
GRADE 8 3 0 100% 3 0 100% 2 0 100% 0 1 0% 0 1 0%
GRADE 9 1 0 100% 1 0 100% 0 0 n/a 0 0 n/a 0 0 0%
PROF 0 0 n/a 0 0 n/a 0 0 n/a 0 5 0% 0 7 0%
(ii) Academic and research staff by grade on fixed-term, open-ended/permanent and zero-hour
contracts by gender
Comment on the proportions of men and women on these contracts. Comment on what is being done
to ensure continuity of employment and to address any other issues, including redeployment schemes.
At the School we have three contract types: open ended, open ended with funding end date and fixed term. Generally, there is no pattern to suggest gender bias against women as the underrepresented group by contract types shown in Table 30. Table 30. Staff by Contract Type and Gender 2013/14 – 2017/18
YEAR
OPEN ENDED OPEN ENDED
(FUNDING END DATE) FIXED-TERM
Total
F M F% F M F% F M F% F M F%
2013/14 37 67 36% 42 76 36%
2014/15 39 71 35% 46 81 36%
2015/16 41 71 37% 54 88 38%
2016/17 47 77 38% 55 94 37%
2017/18 52 84 38% 58 102 36%
Table 31 shows the split across the grades. Most academic staff have open-ended contracts. There is a
higher representation of females in Grades 7 & 8, which is reflected in the data for staff on these
contracts at those grades.
Table 31. Academic Staff on Open Ended Contracts by Grade and Gender 2013/14 -2017/18
For posts of fixed duration, the University strives to use open-ended-with funding-end-date contracts where possible. These tend to offer more job security than rolling fixed-term contracts, which tend to be used for roles of 1 year’s duration or less and for covering periods of maternity leave or sickness absence. As shown in Table 32 the numbers in the School are low.
YEAR GRADE 7 GRADE 8 GRADE 9 PROFESSOR
F M %F F M %F F M %F F M %F
2013/14 7 7 50% 10 8 56% 13 20 39% 7 32 18%
2014/15 6 5 55% 11 12 48% 14 24 37% 8 30 21%
2015/16 8 5 62% 11 9 55% 14 25 36% 8 32 20%
2016/17 12 6 67% 11 15 42% 16 26 38% 8 30 21%
2017/18 13 9 59% 11 15 42% 17 29 37% 11 31 26%

37
There are relatively few fixed term contracts. Some of the appointments are subject to funding. Table 33 shows that only male professors are on fixed term contracts, where the other grades are both male and female. Actions 7.1, 7.2, 7.3 below aim to improve the female pipeline towards professorship.
(iii) Academic leavers by grade and gender and full/part-time status
Comment on the reasons academic staff leave the department, any differences by gender and the
mechanisms for collecting this data.
The number of staff (across the 3 contract types) who have left over the last 5 years is 64 (33M: 31F) (Table 34). The University routinely conducts exit surveys with leavers, Table 35 details the main reasons for leaving differentiating between resignation and end of post. It doesn’t provide the information that would be useful for identifying any E&D issues. There is no formalised policy in ASBS for conducting exit interviews, however HoSGs normally offer informal exit interviews. Reasons given by leaving staff are reported as straightforward career cycle, career progression and family/social reasons across genders. We aim to conduct these routinely and recorded gender. Action 6 will help enhance our understanding of any gender or inclusion-related leaving reasons:
Action 6 Formalise the School policy of conducting exit interviews by using the University HR
standard set of questions and institute a mechanism for recording and analysing
responses.
Table 32. Staff leavers by Grade, Gender and Full/Part-time status 2013/14 – 2016/17
GRADE
2013/14 2014/15 2015/16 2016/17 2017/18
F M F M F M F M F M
FT PT FT PT FT PT FT PT FT PT FT PT FT PT FT PT FT PT FT PT
GRADE 6 - 1 - - 1 2 - 2 1 - - - 3 1 2 - 2 1 1
GRADE 7 2 - - - 2 - - - - - - 1 1 1 1 - 3 1 2 2
GRADE 8 - - 1 - - - - - - - 2 - 2 1 - - 2 - - -
GRADE 9 - - 1 - 1 - - - 2 - 1 - 1 - 1 - - - 2 -
PROF 1 - 2 1 - - 2 1 1 - 2 - - - 2 1 - - 1 -
TOTAL 4 5 4 5 6 6 9 8 8 9
Table 33. Staff leavers by Main Leaving Reason 2013/14 – 2016/17
MAIN REASON FOR LEAVING 2013/14 2014/15 2015/16 2016/17* 2017/18*
F M F M F M F M F M
RESIGNATION 3 3 2 0 3 4 4 5 7 4
*END OF POST/RETIREMENT 1 2 2 5 3 1 5 3 1 5
TOTAL 4 5 4 5 6 5 9 8 8 9
% RESIGN BY GENDER 75% 60% 50% 0% 50% 80% 45% 63% 64% 36%
% RESIGN BY OVERALL LEAVERS
66% 22% 58% 53% 65%

38
5. SUPPORTING AND ADVANCING WOMEN’S CAREERS
Recommended word count: Bronze: 6000 words | Actual 6430
5.1 Key career transition points: academic staff
(i) Recruitment
Break down data by gender and grade for applications to academic posts including shortlisted
candidates, offer and acceptance rates. Comment on how the department’s recruitment processes
ensure that women (and men where there is an underrepresentation in numbers) are encouraged to
apply.
Candidates for interview are selected using pre-determined essential and desirable criteria. All appointment panel members participate in shortlisting and undergo Recruitment and Selection training (a prerequisite of which is Equality and Diversity (E&D) training and, more recently, Unconscious Bias (UB) training). Panels always have at least one member of each sex. All advertising follows HR\University guidelines and offers the prospective candidates the opportunity to discuss the role with HoSG or PS manager. Staff are encouraged to promote all vacancies across their networks.
Data are disaggregated by role type and grade to inform specific action planning below.
Research-Only Roles:
Tables 37 and 38 show low numbers, with varying applications and success rates by gender and no trends
that suggest bias at shortlisting or appointing stage.
Table 34: Grade 6
GRADE 6 APPS SH/LIST APPOINTED SH/LIST SR APPOINT SR
F M %F F M %F F M %F F M F M
2013/147 - - - - - - - - - - - - -
2014/15 39 60 39% 3 8 27% 3 3 50% 8% 13% 100% 38%
2015/16 19 17 53% 4 5 44% 2 3 40% 21% 29% 50% 60%
2016/17 3 8 27% 1 1 50% 1 0 100% 33% 13% 100% 0%
Table 35: Grade 7
GRADE 7 APPS SH/LIST APPOINTED SH/LIST SR APPOINT SR
F M %F F M %F F M %F F M F M
2013/14 17 14 55% 2 3 40% 2 0 100% 12% 21% 100% 0%
2014/15 - - - - - - - - - - - - -
2015/16 9 20 31% 4 6 40% 1 2 33% 44% 30% 25% 33%
2016/17 3 27 10% 0 4 0% 0 2 0% 0% 15% - 50%
7 ‘-‘ no posts advertised/recruited

39
Research and Teaching Roles: Often, to maximise the applicant pool, ASBS advertises roles across grades, with clear distinction in the
essential and desirable criteria between each grade. The data for Lecturer (Grade 7/8) posts show
women are less likely to apply, with female applications ranging from 26%-34%. In each of the years,
female Shortlist and Appointment Success Rates (SR) were higher than male equivalents, suggesting
women’s strong performance at shortlisting and interview.
Women make up the majority of appointees at Grades 7 and 8 (54%F at Grade 7 and 62.5%F at Grade 8); and are more likely to apply for/be appointed at Grade 8 compared to males (42% of females appointed to Grade 8 compared to 33% of male equivalents) (Table 40).
This bodes well for enhancing female representation amongst our Academic staff and supporting the
pipeline towards Grade 9 and above.
Table 36: Roles Advertised at GRADE 7/8
GRADE 7/8 APPS SHORT LIST APPOINTED SH/LIST SR APPOINT SR
F M %F F M %F F M %F F M F M
2013/14 57 112 34% 10 12 45% 4 3 57% 18% 11% 40% 25%
2014/15 9 26 26% 1 2 33% 1 0 100% 11% 8% 100% 0%
2015/16 129 246 34% 16 18 47% 10 5 67% 12% 7% 63% 28%
2016/17 78 212 27% 10 25 29% 5 6 45% 13% 12% 50% 24%
2017/18 30 60 33% 8 13 38% 5 4 56% 27% 22% 63% 31%
Table 37: Appointments at Grade 7/8 across all years
APPOINTMENTS AT GRADE 7/8
GRADE APPOINTED AT: F M
n %↓8 %→9 n %↓ %→
GRADE 7 14 58% 54% 12 67% 46%
GRADE 8 10 42% 62.5% 6 33% 37.5%
TOTAL 24 100% 57% 18 100% 43%
Grades 7/8/9: Tables 40-41 show that women are underrepresented at application stage but are more
likely to be appointed once shortlisted. Given the increased likelihood for women to be appointed at
Grade 8 when applying to Grade 7/8 (Tables 39-40), it is not clear that women are being
disproportionately appointed at Grade 7 rather than 8. We will continue to evaluate recruitment data
to ensure that is not a developing trend across Grade 7/8 appointments as well as evaluate the impact
of Actions 7.1-5 below.
Recruitment actions are therefore targeted at encouraging women to apply and, specifically, to
encourage them to apply to the higher grades:
8 Compare vertically within gender e.g. 55% of women appointed at Grades 7/8 were appointed at Grade 7 compared to 64% of men appointed at same level from Grade 7/8 recruitment. 9 Compare horizontally across total population

40
Action 7.1 Strengthen the equality statement in job adverts and candidate brochures for the School to explicitly encourage women, an underrepresented group to apply (a particular issue at Grade 9 and above).
Action 7.2 Challenge internal search committees to identify an equal list of potential male and female candidates for senior posts and encourage applications.
Action 7.3 Highlight ASBS as an inclusive and supportive environment for career development and progression: create profiles of male and female staff linked to recruitment material.
Action 7.4 Evaluate recruitment data to ensure that females are not appointed to the lower end of grade spectrums (Grades 7-9).
Table 38: Roles Advertised at Grade 7/8/9
GRADE 7/8/9
APPLICATIONS SHORTLISTED APPOINTED SH/LIST SR APPOINT SR
F M %F F M %F F M %F F M F M
2013/14 46 117 28% 4 7 36% 2 2 50% 9% 6% 50% 29%
2014/15 56 96 37% 13 11 54% 4 4 50% 23% 11% 31% 36%
2015/16 20 29 41% 2 5 29% 1 2 33% 10% 17% 50% 40%
2016/17 7 28 20% 1 6 14% 1 1 50% 14% 21% 100% 17%
2017/18 41 72 36% 3 3 50% 2 0 100% 7% 4% 67% 0%
Table 39: Appointed at Grade 7/8/9
APPOINTED AT GRADE 7/8/9
GRADE APPOINTED AT: F M
n %↓ %→ n %↓ %→
GRADE 7 5 50% 83% 1 11% 17%
GRADE 8 2 20% 40% 3 33% 60%
GRADE 9 3 30% 38% 5 56% 63%
TOTAL 10 100% 53% 9 100% 47%
Grade 9 and Professorial: Application rates vary over the period for senior levels at Grade 9 and
Professorial (Tables 42-43) and as with other grades, despite being consistently lower for women, the
data show extremely positive shortlisting and appointment success rates for women, especially at
Professorial level.
External recruitment for Professorial roles over the whole period shows gender balance at 50:50 male
and female appointments.
It will be crucial to mirror this success in recruitment of women to Grade 9 appointments whilst
continuing to attract higher proportions of female applicants to future Professorial roles.
In the past six years, we have piloted the engagement of head hunters for Professional Services and
Academic posts. In addition to Actions 7.1-3, ASBS will explicitly prioritise gender diversity, internally
and externally, in its search for senior talent acquisition [Action 7.5].
Action 7.5 Work with HR Recruitment to prioritise gender diversity during senior academic ‘talent acquisition’.

41
Table 40: Roles Advertised at GRADE 9
Grade 9
APPLICATIONS SHORTLISTED APPOINTED SH/LIST SR APPOINT SR
F M %F F M %F F M %F F M F M
2013/14 6 24 20% 2 6 25% 0 3 0% 33% 25% 0% 50%
2014/15 - - - - - - - - - - - - -
2015/16 10 39 20% 5 1 63% 2 1 67% 50% 3% 40% 100%
2016/17 8 25 24% 3 12 20% 1 3 25% 38% 48% 33% 25%
2017/18 7 31 18% 1 7 13% 0 4 0% 14% 23% 0% 57%
Table 41: Roles Advertised at PROFESSOR level
PROFESSOR
APPLICATIONS SHORTLISTED APPOINTED SH/LIST SR APPOINT SR
F M %F F M %F F M %F F M F M
2013/14 3 18 14% 0 2 0% 0 1 0% 0% 11% - 50%
2014/15 - - - - - - - - - - - - -
2015/16 3 29 9% 1 8 11% 1 3 25% 33% 28% 100% 38%
2016/17 7 15 32% 4 7 36% 3 2 60% 57% 47% 75% 29%
2017/18 2 14 13% 2 2 50% 2 0 100% 100% 14% 100% 0%
(ii) Induction
Describe the induction and support provided to all new academic staff at all levels. Comment on the
uptake of this and how its effectiveness is reviewed.
The on-boarding team in HR Recruitment circulates links to Induction Guides to all new staff.
These outline essential and mandatory training for staff to complete, including Equality and Diversity, GDPR, and Information and Cyber Security. They also include an introduction to the Core HR system and University Staff (virtual) Handbook.
ASBS enhnaces formal University processes and builds on these for new staff. On arrival, staff meet their
HoSG or PS manager. New academic staff are introduced in the monthly My Business School Newsletter
and ‘Welcome’ emails are normally sent by HoSG which include staff profile and picture. Similarly, PS
Managers circulate welcome/introductory emails to their teams when members arrive. PS staff benefit
from an Induction Buddy who assists new staff in in getting to grips with ASBS practice, processes and
UofG systems; and, provides a friendly face and contact point. Academic staff are introduced to their
Cluster Lead who brokers introductions and provide informal guidance; early career staff also benefit a
formal mentoring system.
The School launched an annual staff induction in 2015/16. This provides networking opportunities for
new and existing employees. Senior Managers from the School lead sessions on School strategies (e.g.
School Strategy and Framework, Research Strategy, Internationalisation Strategy); Introduction to
Learning and Teaching (L&T); Quality Assurance and Enhancement (QAE); and Accreditations and
Rankings. Historically, this was for Academic staff only but feedback during AS self-assessment lead to it
opening up to PS staff, meaning anyone new to ASBS can attend.
Staff survey showed variable experiences by gender and job family for those responding who have been appointed since 2013:

42
Chart 5: Survey results of induction process for academics
Data above show Academic women, in particular, are less satisfied with induction. Survey comments did not include any reference to induction. We will therefore model the Induction Buddy system that exists for PS staff with academic staff for their first two-four weeks in post [Action 8.1].
Chart 6: Survey results of induction process for PS staff
PS Staff are, overall, more satisfied with induction. Male PS staff are slightly less positive that it met their needs, with 22% in disagreement. Men are substantially underrepresented within the PS staff cohort (see s.2), we will ensure they are able to request a male Induction Buddy, which may make them feel more comfortable and enhance their induction experience. [Action 8.3]
Action 8.1 Introduce Induction Buddy system for the first 4 weeks of academic staff induction.
Action 8.2 Produce a ‘10 People to Meet’ Guide for new academic staff, according to Subject Area, outlining relevant people to meet in their first month.
Action 8.3 Create process for male PS staff to request a male induction buddy.

43
(iii) Promotion
Provide data on staff applying for promotion and comment on applications and success rates by
gender, grade and full- and part-time status. Comment on how staff are encouraged and supported
through the process.
Promotion Criteria Strands for all Career Tracks Summary from UofG:
RESEARCH AND TEACHING LEARNING, TEACHING &
SCHOLARSHIP RESEARCH-ONLY
➢ Research & Scholarship
➢ Knowledge Exchange & Impact
➢ Learning & Teaching
➢ Leadership, Management &
Citizenship (incl. Outreach)
➢ Esteem
➢ Learning & Teaching Practice
➢ Scholarship, Knowledge
Exchange & Impact (incl.
Outreach)
➢ Leadership & Management
➢ Esteem
➢ Research & Scholarship
➢ Knowledge Exchange &
Impact
➢ Learning & Teaching
➢ Leadership, Management
(incl. Outreach)
➢ Esteem
Annual promotion cycle is launched via emails from the HoS to all staff signposting links to the Academic Appointment & Promotion Policy and application materials. Applications are assessed against set criteria that reflect P&DR criteria. Application forms include a section dedicated to circumstances that should be taken into account when assessing the case for promotion, including the impact of periods of maternity, adoption and shared parental leave as well as sickness absence. Tables 44-46 provide promotion data for academic staff over five years. Overall there appears to be a
low level of applications for promotion. Given the low numbers of staff employed at Grade 6, there were
no applications to Grade 7 over the reporting period.
Women were, on average, more successful in applying to all grades than men. They were particularly
successful in applying for Professorial roles (100% success). Women comprised 30% of applicants to
Professorship, which is slightly less than %Female average at Grade 9 over the period of 38% - although
data are skewed by a high number of (unsuccessful) applications from male staff in 2014/15.
Staff survey indicated respondents’ strong understanding of the promotion criteria and process:

44
Chart 7: Survey results on promotion process Of those who identified as having submitted a promotion application in the last five years (n=31 respondents (i.e. not including everyone who did apply)) only 44% of male respondents and 47% female respondents felt they had received appropriate support:
Chart 8: Survey results on promotion process
Although this has been part of the P&DR procedure for some time, a devolved system of reviewers was
introduced to support the growth in staff numbers, and we will ensure that they are equipped and
briefed in development, progression and promotion discussions.
This will be supplemented by an annual Promotion workshop outlining promotion criteria and guidance
on preparing application, with sessions dedicated to difference career stages:
Action 9
Hold annual promotion workshop covering criteria changes and process for all tracks and career stages.

45
Action 10 Invite College HR and EOD to deliver on ways to use P&DR discussions in progression planning.
(iv) Department submissions to the Research Excellence Framework (REF)
Provide data on the staff, by gender, submitted to REF versus those that were eligible. Compare this
to the data for the Research Assessment Exercise 2008. Comment on any gender imbalances identified.
In RAE 2008 (Table 50), 65% of the eligible female population were submitted compared to 83% of the eligible male population. Women comprised 28% of the eligible staff pool and 23% of the submitted pool. In REF 2014, 58% of eligible female population were submitted compared to 73% of eligible male pool. Women comprised 30% of eligible staff pool and 26% of submitted pool. For REF2021, The School submits under two units of assessment: UoA16 Economics and UoA17 Business & Management. The UoA17 Outputs Scoring Committee will operate according to the University’s Code of Practice. Members are required to complete UB training. The composition of the Committee follows the University’s 40% female: 40%male: 20%either gender balance rule. All members are professors: six are male and five females (45% Female). In UoA16 there are 7 panel members, of which 2 are female (29% Female). This is more gender balanced than that of the Professoriate in Economics. Study leave and funding of copyediting have been provided to support staff to enhance publications and REF capacity within the School. There is significant investment from College Assessment Panel (CAP) developed through REF leads to support papers into submission (additional reviews, proof reading, informal calibration review of sample of papers). Informal review meetings are organised by cluster leads with externals (many with REF subpanel membership). There is also workload support for impact cases. Table 42. RAE and REF Returns by Gender
RAE and REF Submissions Female Male Total
No. %* %^ No. %* %^ No. %* %^
RAE 2008**
Submitted 15 65% 23% 49 83% 77% 64 78% 100%
Not submitted 8 35% 44% 10 17% 56% 18 22% 100%
Total eligible for submission 23 100% 28% 59 100% 72% 82 100% 100%
REF 2014
Submitted 18 58% 26% 52 73% 74% 70 69% 100%
Not submitted 13 42% 41% 19 27% 59% 32 31% 100%
Total eligible for submission 31 100% 30% 71 100% 70% 102 100% 100%
** RAE 2008 relates to units- Accounting and Finance, Economics and Management %* compare vertically within gender %^ compare horizontally across total population

46
5.3 Career development: academic staff
(i) Training
Describe the training available to staff at all levels in the department. Provide details of uptake by
gender and how existing staff are kept up to date with training. How is its effectiveness monitored and
developed in response to levels of uptake and evaluation?
Compulsory training includes online Equality and Diversity Essentials. For March 2019, overall 80% of staff have completed the E&D training, 86% of females and 73% of males, 70% of academics and 87% of PS staff have completed. The School will continue to promote the E&D completion amongst all staff via annual P&DR [Action 11].
Action 11 Link E&D completion amongst all staff to P&DR sign off.
UB training is mandatory for staff attending Recruitment and Selection training and was recently made
mandatory for PS staff in ASBS. All colleagues in ASBS leadership roles are asked and encouraged to
complete the UofG Unconscious Bias online training and those involved in REF2021 decision-making
have to also complete it. Given the increasing importance and recognition of UB training in undertaking
different roles and duties both within UofG and across HE sector, all staff will be required to complete
the online training [Action 12].
Action 12 Mandate Unconscious Bias training for all staff.
Professional Development and identified training needs are discussed and planned at the annual P&DR.
University’s Employee and Organisational Development (EOD) provide a suite of courses either online
or via workshops, uptake of this is reported below in Table 53.
Table 43. Academic Staff uptake of training by gender and number of instances of university training courses
YEAR GENDER
NO. OF ACADEMIC STAFF ATTENDING INTERNAL
COURSES NO. OF COURSES
ATTENDED
2013/14
FEMALE 13 29
MALE 10 27
2014/15*
FEMALE 15 35
MALE 6 12
2015/16
FEMALE 15 34
MALE 13 30
2016/17**
FEMALE 17 32
MALE 16 39
2017/18 FEMALE 31 52
MALE 30 56
* 1 Female undertook a leadership course with 10 components ** 1 Male undertook a leadership course with 13 components

47
In additional to this training staff may also identify external courses specific to their job roles and
projects. These can either be funded from the School or from the individual’s development allowance
(see s.5.3(iii)). All external training is assessed on an individual basis and reported in the P&DR or to the
line manager who approved the training. We will devise a mechanism for recording/collating
participation information in external training by gender [Action 13].
Positively, approximately 70% of academic female and male respondents agreed that they can access
courses that meet their needs in career and professional development, with c.20% of both male and
female respondents responding ambivalently and only 4-5% actively disagreeing:
Chart 9: Survey results on training and professional development
The School is committed to providing professional development for PS staff. The interim Joint Heads of
Professional Services organise bespoke training workshops to enhance the skills set of staff, such as
project management, mental health and awareness, resilience. This has been a relatively new
investment, authorised by the HoS. To support evaluation of these initiatives, participation in these
courses will also be recorded and reviewed by gender [Action 13].
Action 13 Devise process for recording staff participation in both external training and bespoke internal training (esp. for PS Staff) by staff type and gender.
(ii) Appraisal/development review
Describe current appraisal/development review schemes for staff at all levels, including postdoctoral
researchers and provide data on uptake by gender. Provide details of any appraisal/review training
offered and the uptake of this, as well as staff feedback about the process.
Annual P&DR is mandatory for all staff with at least 1 years’ service. Line managers or a senior colleague
appointed by HoS conduct reviews. Review meetings include reflection on performance and success,
completing previous objectives and objective setting for the year ahead. Evaluation criteria mirror
promotion criteria to help with development discussion and planning towards career progression.
AS staff survey showed, of respondents who had undergone P&DR (i.e. >1 years’ service):

48
Table 44: Survey results
Included a discussion and guidance about the next step in my career:
Agree Disagree Neither Agree nor Disagree
FEMALE 53% 27% 20%
MALE 65% 18% 18%
PREFER NOT TO SAY 0% 50% 50%
Helped me to manage my objectives and progress:
Agree Disagree Neither Agree nor Disagree
FEMALE 63% 13% 23%
MALE 70% 15% 15%
PREFER NOT TO SAY 0% 100% 0%
Provided useful feedback on my job performance:
Agree Disagree Neither Agree nor Disagree
FEMALE 53% 20% 27%
MALE 74% 13% 13%
PREFER NOT TO SAY 50% 50% 0%
I can request a different P&DR reviewer if I am uncomfortable with the reviewer assigned:
Yes No Don’t Know
FEMALE 35% 3% 61%
MALE 54% 5% 41%
PREFER NOT TO SAY 0% 50% 50%
In summary:
• Women were more likely to disagree (27%F: 18%M) that P&DR included a discussion and
guidance about next steps in their career;
• Women less likely to agree (63%F: 70%M) and more likely to respond as neutral (23%F: 15%M)
that P&DR had helped to manage their objectives and progress;
• Women less likely to agree that P&DR provided useful feedback on their job performance (53%F:
74%M); and
• Men more aware (54%M: 35%F) that they could request a different P&DR reviewer if
uncomfortable with the one initially assigned.
Generally, there were less affirmative positive responses by women to questions about P&DR process.
Women respondents were more likely to select ‘Neither agree nor disagree’ than to outright disagree.
This may be due to their ambivalence towards the question but may also be due to them not wanting to
actively disagree. As discussed above (s.5.1(iii)) AS staff survey highlighted a need to strengthen the
discussion of promotion during P&DR [Action 9 and 10].
Action 9 Hold annual promotion workshop covering criteria changes and process for all tracks and career stages.
Action 10 Invite College HR and EOD to deliver on ways to use P&DR discussions in progression planning.

49
(iii) Support given to academic staff for career progression
Comment and reflect on support given to academic staff, especially postdoctoral researchers, to assist
in their career progression.
In addition to the training and development outlined above (s.5. 3(i)) staff are supported in developing their careers via:
Early Career Development Programme (ECDP):
All R&T and L,T,S staff newly appointed/promoted at Grades 7/8 join the ECDP. Currently 20F: 17M
participating in ASBS.
ECDP provides learning and development opportunities in all aspects of the academic role (via
workshops, CPD and events, including PG Certificate in Academic Practice), allocates a mentor and sets
annual objectives aligned to achieving Grade 8/9 criteria within defined timescales. Participants must
have a personalised development plan and keep track of development. For staff not on ECDP, peer
mentoring is provided via Research Clusters and the same learning and development opportunities are
open to all staff.
Additionally, informal coaching takes place when staff take up new roles or duties. The School’s alternate
scheme (see 5.6(x)) also helps with this, to prepare the next generation of academic leaders.
Networking – Research Seminars, Conference Attendance:
The School provides academic staff with an individual development allowance of £5k per annum to
support career development. Staff may use this to undertake external training, attend conferences and
events to support research communication and dissemination as well as networking and collaboration.
Each main subject area hosts research seminar series. These generally kick-off between 10am and 3pm
(ending normally by 4.30pm) to try and facilitate attendance. The School hosts a ‘Meet the Editor’ series
with journal editors who present and run workshops on their publication processes. These include lunch
to enable attendees to network with the editors. Study leave:
All new early career academic staff are provided a reduced teaching load in their first year. Following
this, staff can apply for study leave to further their research or to gain significant new professional
experience. Staff may apply for periods of paid study. From 2018/19, the Director of Research and
Cluster Leads, as opposed to the HoSG, now review applications and then discuss with HoSG to ensure
there is capacity with regards to teaching loads [Action 14].
Action 14 The SAT to evaluate study leave application and success rates in light of the
‘new’ approval system by the Director of Research & KE and Cluster Leads.

50
(iv) Support given to students (at any level) for academic career progression
In support of continued academic study, UG and PGT students attend workshops on applying for PGR
study where they learn about the process and what a PhD entails. As outlined above (s.4.1), any PGT
students on course to get a B grade in their dissertation are invited to discuss future research aspirations
and application processes.
The School has multiple, vibrant and active student networks and societies, some of which are linked to
professional and accreditation bodies. The Beta Gamma Sigma society, linked to AACSB, provides career
and professional development services, as does the Chartered Institute for Personnel Development
(CIPD) student site and the MBA students are supported by the Association of MBA’s careers site.
PGR students undertake Annual Progression Review processes, whereby students present their work to
staff and students in their Research Cluster area, and the review panels which monitors the students’
progress to ensure that they are working towards fulfilling an agreed Researcher Development (RD)
Framework.
The School provides all students with £2k of conference/training course funding during their PhD.
‘Opportunities to gain teaching experience as a Graduate Teaching Assistant (GTA) are provided to PGRs
on the basis that they discuss and agree with their supervisors in advance’. PhD students are allocated
to the cluster of their first supervisor. They are included in the emails about all cluster events and
encouraged to attend to help them cultivate a presence within the Research Cluster environment.
Annual progress monitoring ensures that the students are on track for completion and identify personal
or career development requirements, in line with RD Framework. In addition, less formal days are set
aside that focus on personal and career development.
PhD workshops are provided at School-level on topics such as getting a paper published and academic
writing. These are supplemented by Graduate School and University research student development
courses on a range of courses about presenting and academic writing. PhD students also have access to
eSharpe, a leading international gateway to academic publication for postgraduates. It encourages
excellence in research through peer-reviewed publication and interdisciplinary exchange and enhances
postgraduates' skills and employability by providing hands-on experience of journal management and
editing.
UofG runs the bi-annual Postgraduate Research Experience Survey (PRES); the last PRES highlighted
positive results for male and female PGRs re: their professional development and supervisor support
in-programme:
Table 45: Survey results from PRES
SURVEY THEME % Agreement % Agreement
PROFESSIONAL DEVELOPMENT FEMALE MALE
My ability to manage projects has developed during my programme 81% 80%
My ability to communicate information effectively to diverse audiences has developed during my programme 77% 80%
I have increasingly managed my own professional development during my programme 84% 77%
SUPERVISOR AND SUPPORT FEMALE MALE
My supervisor/s have the skills and subject knowledge to support my research 91% 95%
I have regular contact with my supervisor/s, appropriate for my needs 88% 95%

51
My supervisor/s provide feedback that helps me direct my research activities 84% 88%
My supervisor/s help me to identify my training and development needs as a researcher 84% 74%
(v) Support offered to those applying for research grant applications
Comment and reflect on support given to staff who apply for funding and what support is offered to
those who are unsuccessful.
The College Research Support Office provide a research management and support process. This includes detailed support in applying for and managing research grants, including highlighting opportunities, completing bids and assisting with full costings.
Success rates vary across the 5-year period, but do not suggest an issue by gender and, in fact,
demonstrate women’s strong performance in securing grant funding.
Over and above College-level support, Research Cluster Leads provide leadership in the development of
grant applications via review of submissions. The HoS reviews and approves applications before
submission to College. ASBS runs a Grant Writing Workshop programme from March–July. The focus is
primarily for applications for research funding and entails 3 hour workshops with input from a range of
staff with various areas of expertise in grant capture. There will be time spent presenting key lessons,
discussing previous experiences, and developing your proposal. One-on-one mentoring is also provided
by a senior member of staff where staff can discuss challenges.
A programme of activities for those whose applications have been unsuccessful is currently under
development by the College.
We will:
Action 15.1 Record participation in grant writing workshop by gender and evaluate its
usefulness/impact by tracking progress in submitting a grant.
Action 15.2 Enhance support for those unsuccessful in grant applications by implementing
activities developed by College into Research Clusters.

52
5.5 Flexible working and managing career breaks
Note: Present professional and support staff and academic staff data separately
(i) Cover and support for maternity and adoption leave: before leave
Explain what support the department offers to staff before they go on maternity and adoption leave. Once a member of ASBS staff confirms their pregnancy to their line manager they should meet to discuss leave arrangements. The University HR provides a Maternity Leave Checklist - which can be used by both line manager and employee to guide discussions and covers:
a. What to do before maternity leave b. Arrangements during maternity leave, including reasonable communication and use of KIT
Days c. Returning from maternity leave
ASBS has dedicated College HR support with whom staff can discuss specific maternity leave
arrangements and details.
AS self-assessment highlighted these processes are working better for PS than for Academic staff. The
latter reported variable experiences of line manager support/knowledge pre-maternity leave via survey
comments and SAT meetings.
To strengthen support for staff planning maternity leave, we will:
Action 16 Identify Parental Champions that staff can contact for informal advice, peer support and signposting towards relevant policies, processes and support.
Action 17 Raise awareness of the ASBS HR support available via the School newsletter: My
Business Schools News and at subject meeting, this will include updates on the HR
refresher sessions.
Action 18 Create ‘bite-size’ refresher on key HR policies for Line Managers and HoSGs to
improve their support for preparing for parental forms of leave, and maternity leave
in particular.
Action 19.1 Incorporate the maternity checklist with the briefing ‘bite-size’ refresher (Action 18) and raise awareness of it with Parental Champions and in My Business School News and Induction materials.
(ii) Cover and support for maternity and adoption leave: during leave
Explain what support the department offers to staff during maternity and adoption leave.
UofG improved maternity leave benefits during our self-assessment period, removing any length of
service requirements receiver: enhanced maternity pay and increased paid leave to 18 weeks. Staff
could, in theory, now join UofG whilst pregnant and still benefit from paid leave. Changes may also
benefit early career female staff who have less service at the University.
Knowledge of Keeping in Touch Days (KIT) usage (potential uses and payment periods) is low amongst
academic staff. Two members of PS staff recently used their 10 KIT days to maintain contact, learn about
developments in the professional services delivery of ASBS and to socialise with colleagues; a third PS

53
staff member is currently doing same whilst on leave. From SAT discussions it was found that there are
better processes in place for PS staff, so these practices will be implemented for academic staff.
Our actions to improve support will help to raise awareness of KIT days, how to use them, and at which
point during leave they will be ‘paid’ – especially Actions 18, 20- 20.1 (above).
(iii) Cover and support for maternity and adoption leave: returning to work
Explain what support the department offers to staff on return from maternity or adoption leave.
Comment on any funding provided to support returning staff.
In 2015/16, the University introduced an Academic Returners Research Support Scheme to mitigate the impact of career breaks on research productivity and hence progression of, particularly female, RT staff. Under the Scheme RT returners can apply for up to £10,000 to support the resumption of their research on return. Feedback from the Flexible Working SAT Subgroup (especially contributions from 2 members preparing for maternity leave during self-assessment) revealed the difficulty in finding information about the scheme as well as the eligibility criteria which apply only to RT staff and not LTS (because the Scheme addresses evidenced impact of career breaks on research productivity, not applicable to LTS staff). To address this, we will embed the scheme details within Action 18 and 19.1 and:
Action 19.2 Encourage University to expand provision for mitigating impact of career breaks of LTS staff on scholarship production.
PS line managers hold discussions with returning staff, covering:
• Organisation of a buddy to ensure a smooth transition back to work;
• Breastfeeding arrangements (facilities provided in main building close to ASBS), if appropriate;
• Risk assessments;
• Re-induction discussions and meetings; and
• Any flexible working arrangements.
This approach will be modelled as best practice in the ‘bite-size’ refresher [Actions 18 – 19.1].
(iv) Maternity return rate
Provide data and comment on the maternity return rate in the department. Data of staff whose
contracts are not renewed while on maternity leave should be included in the section along with
commentary.
Maternity Return Rate was 91% (n=10/11).
(v) Paternity, shared parental, adoption, and parental leave uptake
Provide data and comment on the uptake of these types of leave by gender and grade. Comment on
what the department does to promote and encourage take-up of paternity leave and shared parental
leave.
Uptake of Paternity Leave was low- anecdotal discussion suggests staff used a combination of annual
leave and informal flexible working to cover paternity leave due to low UofG Paternity Leave pay.

54
The University increased paid Paternity Leave from one to two weeks in 2018.
Recently, ASBS has supported the first member of staff (Male, PS) to opt for Shared Parental Leave. To
raise awareness of this relatively new form of leave, we will:
Action 20 Create case study to highlight staff experience of Shared Parental Leave. This will sit
alongside the Maternity Leave Checklist and be made available to staff.
Action 21 Include communication of changes to Paternity Leave within Action 19.1 (to raise awareness of leave and HR Support in School Newsletter).
(vi) Flexible working
Provide information on the flexible working arrangements available.
UofG’s Flexible Working Policy enables staff to request changes to their hours, patterns and place of
work. These arrangements include part time working, staggered hours, compressed hours, home
working, job sharing, term time working, annualised hours and flexible retirement.
There seems to be an increasing trend, and this could be important to retain female staff.
Table 46. Flexible Working Requests by Grade, Category and Gender 2013/14 -2016/17
YEAR CATEGORY GRADE GENDER OUTCOME
2013/14 ACADEMIC PROFESSOR FEMALE SUCCESSFUL
2014/15 PROFESSIONAL SERVICES GRADE 6 FEMALE SUCCESSFUL
2015/16 ACADEMIC PROFESSOR FEMALE SUCCESSFUL
ACADEMIC GRADE 9 MALE SUCCESSFUL
2016/17
ACADEMIC GRADE 7 FEMALE SUCCESSFUL
PROFESSIONAL SERVICES GRADE 5 FEMALE SUCCESSFUL
ACADEMIC GRADE 6 MALE SUCCESSFUL
PROFESSIONAL SERVICES GRADE 7 FEMALE SUCCESSFUL
PROFESSIONAL SERVICES GRADE 8 FEMALE SUCCESSFUL
2017/18 PROFESSIONAL SERVICES GRADE 7 FEMALE SUCCESSFUL
(vii) Transition from part-time back to full-time work after career breaks
Outline what policy and practice exists to support and enable staff who work part-time after a career
break to transition back to full-time roles.
Any member of staff working part-time can make a flexible working request to move to full-time; this
would be supported where budget allows. No such requests were made in the review period. ASBS has
supported the phased return of colleagues from periods of sickness absence, with initially light and only
gradually increasing workloads. ASBS would use same approach for staff transitioning from part-time to
full-time work.

55
5.6 Organisation and culture
(i) Culture
Demonstrate how the department actively considers gender equality and inclusivity. Provide details
of how the Athena SWAN Charter principles have been, and will continue to be, embedded into the
culture and workings of the department.
Our activities that align with, and demonstrate, our commitment to Charter Principles include:
We commit to making and mainstreaming sustainable structural and cultural changes to advance
(gender) equality:
• The School’s commitment to Athena SWAN and Equality and Diversity is embedded in new
ASBS strategy (September 2018). A main aim of which is to enhance the School's resilience and
changing organisational culture, including succession planning, which includes consideration of
gender particularly in role allocation and committee membership (see s.5.6 (iii))
• Plans are underway to move to a new Business School Building in 2022.
Aspects of design such as practical spaces - safe areas for breastfeeding/changing and gender neutral
toilets are fundamental components of equality and diversity that are mainstreamed in the University’s
design standards and will feature in the new building.
We will use this opportunity to include recognition of women in our new infrastructure:
Action 22 Name a lecturer theatre in the New Business School building after a prominent female academic, alumni or Glasgow Business Woman.
We acknowledge that advancing gender equality demands commitment and action from all levels of
the organisation and in particular active leadership from those in senior roles:
• UB training was introduced for all those in leadership roles in 2017/18; our Action Plan extends
and mandates UB training for all staff and students:
Action 12 Mandate Unconscious Bias training for all staff.
• HoS is an active SAT member and AS will become a standing item at School Executive meetings:
Action 2.2 SAT Chair to provide annual (AS) Equality and Diversity Summary as well as a quarterly Progress Report to the SE; actions and outcomes to be communicated to all staff via a standing item to School Council (SC).
Intersectional considerations of gender and age are currently being addressed via active encouragement
for staff to take time away from work, particularly PS (majority female) to attend UofG Menopause
events (1st Workshop, November 2018) and sharing research and providing resources on this topic to
staff and line managers.
Action 23 Create a new Staff Wellbeing Resource within SharePoint (including a menopause area) to make information more accessible to staff.

56
We acknowledge that academia, and the School generally, cannot reach its full potential unless it can benefit from the talents of all: Role models are very important in celebrating the contribution and success of all our staff. We display our staff and student achievements via TV display units in ASBS reception and on our webpages, Newsletter, Annual Review and social media. Below and overleaf are some examples:

57
The first-ever StartUp Factory was organised by the ASBS, the School of Computing Science, and the students’ Entrepreneurship Society and Tech Society on the weekend of 2-4 November.
It saw 12 teams of students from UofG's Business and Computing Science Schools as well as the Glasgow School of Art compete to pitch the best business ideas. Business, design and technology were equally represented in the team composition, which created powerful entrepreneurial synergies. All the participants found this initiative extremely inspiring. Planning for next year’s event is well underway and the aim is to increase collaborations across the University enhancing ASBS position as the Business School for the University.
Dr Jillian Gordon, Senior Lecturer in Entrepreneurship said: “We want to encourage students to explore their ideas and introduce them to what it takes to build their own company. We want to connect students from different disciplines - business, design and tech - and inspire them to collaborate. StartUp Factory will enable students to make connections beyond their own networks and open doors to people from different fields with an energy to create something of value.”
Professor Nuran Acur is leading a new project in collaboration with MVLS to improve healthcare for the benefit of local women in rural areas of Indonesia. The project aims to bring together expertise in medicine, management studies, social sciences and information and communication technologies from organisations in Indonesia and the UK. The project combines healthcare and data analytics solutions in a novel way to develop an interactive digital health ecosystem for the screening and management of non-communicable diseases (NCDs) such as diabetes. In recognition of the importance of inclusion and staff being able to be themselves at work:

58
• ASBS ran ‘Mentally Healthy Workplace’ workshop (with NHS) in November 2018 for all PS
managers; we have supplemented UofG mental health support for students by resourcing
specific counselling support for our large UG and PGT student cohorts, in particular.
• As part of addressing issues related to healthy workplace behaviours, HoS created new
initiatives to reduce email overload in January 2018 involving the development of
communication via the School intranet (SharePoint) and the creation of a monthly online school
newsletter (My Business School News) is not widely read by staff although this is improving.
We seek to build a community and embed ASBS values through social events, this is particularly important for our growing numbers of new (and international) staff to help build networks:
There are formal social events throughout the year. At Christmas a lunch is organised for all staff and
this year the School also hosted a mince pie event which was also open to families. There is also a
Professional Services social committee who organise events such as charity coffee mornings, other
charity initiatives and sports days supported by the school.
Over the last few years staff have been relocated to occupy the Gilbert Scott Building to support the
cohesiveness of the staff. PS staff are located in a central location in the West Quadrangle of the GSB
behind the School reception. Academics are located in the research clusters. The reception area aims to
provide a welcoming and inspiring area for staff, students and visitors.
The continued growth of the School has resulted in pressure on both academic and PS staff
accommodation which has been spread out in the GSB buildings, this can hamper social communication
amongst the academics. There was a suggestion in the comments that academic staff did not get a
chance to interact with colleagues because offices are geographically remote [Action 24].
Action 24 Provide an informal get-together drop-in over lunch once per semester between 12.30-1.30pm to enhance communication between academics and PS and increase opportunities for new staff to network.
(ii) HR policies
Describe how the department monitors the consistency in application of HR policies for equality,
dignity at work, bullying, harassment, grievance and disciplinary processes. Describe actions taken
to address any identified differences between policy and practice. Comment on how the department
ensures staff with management responsibilities are kept informed and updated on HR polices.
ASBS’ dedicated HR Adviser provides support and advice to staff on HR policies and procedures. She also ensures consistent application of grievance and disciplinary policies/processes and updates the HoS on significant changes to HR policies and practices via monthly meetings. The HoS updates HoSGs, line managers and staff of these changes at School Executive meetings and via e-mail and the School Newsletter. In AS survey 66% Academic staff (59%F: 73%M) were confident their line manager would deal effectively with complaints or occurrences outlined in the Dignity at Work and Study Policy, 11% (10%F: 10%M) actively disagreed, with 14% (20%F: 10%M) and 9% (12%F: 6%M) ambivalent or unsure, respectively:

59
Chart 10: Survey results on HR policies for academics PS were more confident- with significant proportions in agreement – 85% (83.3%F: 85.4%M): Chart 11: Survey results on HR policies for PS staff To address this, we will:
Action 18.1 Further to Action 18, ‘Bitesize HR’ refresher sessions will include Dignity at Work and Study Policy, and support and processes.
Action 17 Raise awareness of the ASBS HR support available via the School newsletter: My Business Schools News and at subject meeting, this will include updates on the HR refresher sessions.

60
(iii) Representation of men and women on committees
Provide data for all department committees broken down by gender and staff type. Identify the most
influential committees. Explain how potential committee members are identified and comment on any
consideration given to gender equality in the selection of representatives and what the department is
doing to address any gender imbalances. Comment on how the issue of ‘committee overload’ is
addressed where there are small numbers of women or men.
The most influential is the SE Committee where strategy is formulated. Membership (38% Academic F)
is mainly related to ex offico roles. Job Rotation and an Alternate System were introduced in the last two
years for SE. This provides staff with opportunities to gain leadership experience and insights and forms
part of workforce planning.
Action 1.1 Evaluate impact of workforce planning measure on gender balance of SE.
There are 11 main School committees. Table 55 shows the staff female/total staff members for both
academic and PS staff.
Most of the committee memberships are tied to job roles and staff in senior posts (e.g. Professorial
roles), this is reflected in the Table 55, overleaf, which shows there is an underrepresentation of
female members in certain committees with ex officio membership, especially Learning and Teaching
Committee, Research and KE Committee, and External Engagement.
Staff with senior roles are normally members of various committees due to the nature of their role.
Committee remit and membership is reviewed yearly by the chair and clerk; however this is linked to
job role and not gender. Because of the imbalance created by the low level of female % is due to the
proportion of women in senior academic roles, the new mechanisms to address SE appointments (see
section 2) are newly introduced but we should start to see a change now that there has been changes
within the SE appointments and Alternate system should address this over the next 4 years [Action 25].
Action 25 Evaluate committee membership to ensure appropriate female representation.

Table 47 Business School Committees and Membership
Committee
2015/16 2016/17 2017/18
Academic PS Academic PS Academic PS
F/Total (%F) F/Total (%F) Total (%) F/Total (%F) F/Total (%F) Total (%) F/Total (%F) F/Total (%F) Total (%)
School Executive 5/13 (38) 2/2 (100) 6/15 (40) 4/13 (31) 2/2 (100) 5/15 (33) 5/13 (38) 2/2 (100) 6/15 (40)
Learning and Teaching 2/7 (29) 4/4 (100) 6/11 (54) 2/8 (25) 4/4 (100) 6/12 (50) 2/10 (20) 4/4 (100) 6/14 (42)
Research and Knowledge Exchange 5/18 (28) 1/1 (100) 6/19 (32) 6/19 (31) 1/1 (100) 7/20 (35) 7/20 (35) 1/1 (100) 8/21 (38)
External Engagement 2/12 (16) 4/4 (100) 6/16 (38) 3/13 (23) 5/5 (100) 8/18 (44) 3/18 (17) 5/5 (100) 11/23 (48)
Admissions 2/13 (15) 4/7 (57) 7/20 (35) 5/16 (31) 5/8 (63) 10/25 (40) 7/17 (41) 6/9 (66) 13/26 (50)
MBA Recruitment and Marketing 0/1 (0) 5/6 (83) 5/7 (71) 0/1 (0) 7/8 (88) 7/9 (78) 0/1 (0) 8/9 (89) 8/10 (80)
Rankings N/A N/A - 0/3 (0) 4/4 (100) 4/7 (57) 0/3 (0) 4/4 (100) 4/7 (57)
Accreditations 3/6 (50) 5/5 (100) 8/ 11 (72) 2/8 (25) 3/3 (100) 5/11 (45) 2/11 (18) 3/3 (100) 5/14 (35)
Quality Enhancement and Assurance 2/5 (40) 3/3 (100) 5/8 (62) 3/8 (38) 4/4 (100) 7/12 (58) 3/9 (33) 3/3 (100) 6/12 (50)
SAT N/A N/A - N/A N/A - 5/11 (45) 4/5 (80) 9/16 (56)
Professional Services 0/0 46/52 (88%) - 0/0 52/62 (84%) - 0/0 55/66 (83%) -

62
(iv) Participation on influential external committees
How are staff encouraged to participate in other influential external committees and what procedures
are in place to encourage women (or men if they are underrepresented) to participate in these
committees?
All staff are encouraged to participate in external committees as part of their P&DR criteria under
“Esteem”. Participation in external committees is important for promotion cases and progression.
The School is well represented externally, with academic women (underrepresented group) serving in
journal editor and reviewer roles, as consultants in international monetary/financial forums and across
multiple boards and sectors. This all contributes towards portfolio and esteem indicators for
promotion. Examples of participation include:
• Dr Margaret Fletcher was recently appointed in the role of Equality and Diversity on the
executive committee of the Academy of International Business
• Professor Sonja Gallhofer is a Fellow of the Higher Education Academy • Professor Catriona Paisey is a member of Council and the Ethics Board of The Institute of
Chartered Accountants of Scotland
• Professor Sabina Siebert is an Academic Fellow of the UK Parliament in London
• Professor Fiona Wilson is an Elected Fellow of the British Academy of Management and a
member of the Editorial Advisory Board of Women in Management Review, now Gender in
Management: an international journal.
• Dr Tanya Wilson is a council member of the Scottish Economic Society, which covers Gender
Pay Gap, Scotland’s Economic Performance and the Retention and Promotion of Women in
STEM Occupations.
• Ms Sarah Honeychurch is a member of the CABS a working group who are developing
a Certified Management & Business Educator (CMBE). The scheme is being developed to
support business school educators to develop their practice at the forefront of teaching
practice and help to advance the quality of business and management education in higher
education.
Professional Services staff also contribute and influence on external committees across Business
Schools within the UK and Ireland, examples are:
• Dr Nicola Birkin member of CABS Inaugural Scottish Professional Managers Network
• Ms Kirsteen Daly founding member of the UK and Ireland Accreditation Group*, member of
CABS Inaugural Scottish Professional Managers Network and a member of the Marketing
Society
• Mrs Angela Doris is a Charted Marketer, a member of the Marketing Society and an Associate
Fellow of the Higher Education Academy
• Ms Jan Shearer member of the UK and Ireland Accreditation Group*
• Mrs Jacqueline Williamson is a fellow of the Chartered Certified Accountants
*The UK and Ireland Accreditation Group influences and engages with all three accrediting bodies and
has produced white papers.

63
(v) Workload model
Describe any workload allocation model in place and what it includes. Comment on ways in which the
model is monitored for gender bias and whether it is taken into account at appraisal/development
review and in promotion criteria. Comment on the rotation of responsibilities and if staff consider the
model to be transparent and fair.
The School’s WLM reflects University norms and expectations. It allocates a target of 1,540 hours per year to academics, according to research, teaching and administration. Individual workloads are allocated, after discussion, by the HoSG, and by the HoS for the Executive team. It is possible to have a workload greater or less than 1,540 hours, it is incumbent on the HoS to try to protect research time. The WLM considers and makes adjustments for individual circumstances, for example, study leave, secondments, disability, sickness absence and maternity leave. The majority of data informing the model is pulled from the university business systems to reflect actual
activity e.g. teaching data pulled from timetabling system, student data from student management
system, research data from the research management system, staff data from HRcore.
There is a School policy in place with supporting documentation regarding the framework elements,
multipliers and allocation of points available for staff. Each individual can view their own detailed report
and also see how they compare to the ASBS average, and the upper/lower quartile.
Despite this, in the survey, only 48% female and 56% of males perceived the WLM allocation to be fair
and transparent. Free text comments demonstrated that changes to an individual’s workload could be
better explained.
Chart 12: Survey results on Workload Allocation
In the last 12 month revised L&T roles have been available on the School’s SharePoint, and a map
showing how these relate to the Quality Enhancement and Assurance (QEA) Committee. SE Committee
appointments are advertised and interviewed.
5%
8%
24%
21%
100%
22%
15%
49%
56%
0% 20% 40% 60% 80% 100%
Prefernot to
say
Female
Male
My workload is allocated on a transparent and fair basis:
Agree
Disagree
NeitherAgree norDisagree
Don't Know

64
Action 26 To improve the perceived lack of transparency in WLM allocation process, Research Clusters will be encouraged to discuss initial drafts each year to raise pertinent issues for consideration. Staff encouraged to feel able to raise personal issues with the Head of Subject.
In the staff survey there were comments that female staff felt many heavy academic administration
convenor roles were allocated to female staff and lack of transparency over how role allocation is
conducted:
This HoS has sought to reposition these roles to support progression in academic management and
leadership within the School:
Action 27 SAT Chair and HoSGs to review convener allocations by gender to ensure equitable allocation of academic administrative roles.
This action also aims to enhance and support women in programme leadership and course
management roles to provide important role models for our students across the School.
(vi) Timing of departmental meetings and social gatherings
Describe the consideration given to those with caring responsibilities and part-time staff around the
timing of departmental meetings and social gatherings.
All School committee meetings are held between 10am -4pm. The School has a calendar of committee
meetings that is circulated at the beginning of the academic year which provides staff with the details.
All research led events are normally scheduled Monday – Friday between 10am- 3pm to allow all
academic staff the opportunity to attend.
In the survey 67% of academic males and 58% of females agreed meetings within the School allowed
those with caring responsibilities to attend, which is similar to PS staff where 56% male and 51% of
females agreed. It is not clear from the survey response that the question was directed at School
committees. In order to seek clarity on this question we will revise the wording for the next AS survey
in 2020/21.
Our action to improve opportunities for (new) staff to network over lunch during core hours, will also
help to create more accessible social events for staff with caring responsibilities out with the more
formal event/seminar setting:
Action 24 Provide an informal get-together drop-in over lunch once per semester between 12.30-1.30pm to enhance communication between academics and PS and increase opportunities for new staff to network.

65
Chart 13: Survey Results on Meeting Timings for Academics
Chart 14: Survey Results on Meeting Timings for Professional Staff
(vii) Visibility of role models
Describe how the institution builds gender equality into organisation of events. Comment on the
gender balance of speakers and chairpersons in seminars, workshops and other relevant activities.
Comment on publicity materials, including the department’s website and images used.
Care is taken to include both female and male students and staff in all publicity including, for example
webpages, programme brochures, testimonials, internal seminar publicity. All communication materials
are approved by the PS staff in accordance with University ER guidance for example brand guidelines
and ensuring diversity.
34%
44%
14%
51%
56%
0% 10% 20% 30% 40% 50% 60%
Female
Male
Meetings within the School are scheduled to allow those with caring responsibilities to attend - PS
Agree
Disagree
NeitherAgree norDisagree
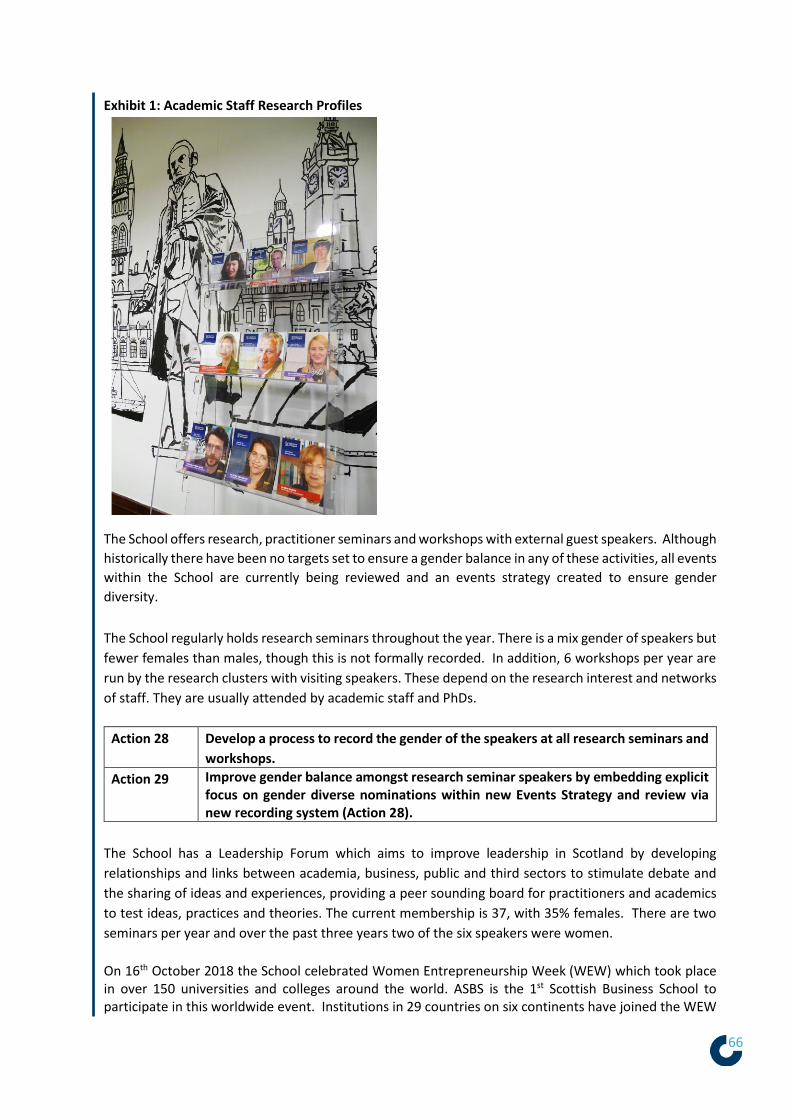
66
Exhibit 1: Academic Staff Research Profiles
The School offers research, practitioner seminars and workshops with external guest speakers. Although
historically there have been no targets set to ensure a gender balance in any of these activities, all events
within the School are currently being reviewed and an events strategy created to ensure gender
diversity.
The School regularly holds research seminars throughout the year. There is a mix gender of speakers but
fewer females than males, though this is not formally recorded. In addition, 6 workshops per year are
run by the research clusters with visiting speakers. These depend on the research interest and networks
of staff. They are usually attended by academic staff and PhDs.
Action 28 Develop a process to record the gender of the speakers at all research seminars and
workshops.
Action 29 Improve gender balance amongst research seminar speakers by embedding explicit focus on gender diverse nominations within new Events Strategy and review via new recording system (Action 28).
The School has a Leadership Forum which aims to improve leadership in Scotland by developing
relationships and links between academia, business, public and third sectors to stimulate debate and
the sharing of ideas and experiences, providing a peer sounding board for practitioners and academics
to test ideas, practices and theories. The current membership is 37, with 35% females. There are two
seminars per year and over the past three years two of the six speakers were women.
On 16th October 2018 the School celebrated Women Entrepreneurship Week (WEW) which took place in over 150 universities and colleges around the world. ASBS is the 1st Scottish Business School to participate in this worldwide event. Institutions in 29 countries on six continents have joined the WEW

67
movement, and, as part of this, the School hosted and brought together an inspiring panel of leading females from the entrepreneurial eco-system to discuss issues around entrepreneurship. Chaired by a female senior academic within the School; the panel comprised three female practitioners; an entrepreneur, Angel Investor and CEO of Women’s Enterprise Scotland. Due to the success of this event it will now become an annual event.
Exhibit 2: Women Entrepreneurship Week Webpage
Data on our practitioner seminars, where external speakers from business and the profession present
on business topics, show varied gender representation but an overall underrepresentation of women
invited speakers:
2015-16 – 7 events - all male
2016-17 – 9 events – 6 male/3 female
2017-18 – 9 events - all male
2018-19 – 4 events – 2male/2female
We will address this through the explicit focus in gender balance in our new events strategy [Action 29-
30]:
Action 30 Improve gender balance amongst Practitioner Seminars in line with Actions 28 and 29.

68
Exhibit 3: External Guest Speaker Poster and details of Guest speak event
(viii) Outreach activities
Provide data on the staff and students from the department involved in outreach and engagement
activities by gender and grade. How is staff and student contribution to outreach and engagement
activities formally recognised? Comment on the participant uptake of these activities by gender. Outreach is formally recognised in P&DR and Promotion criteria. The School participates in all UofG Open Days: 3 UG/year,2 PGT/year. These are staffed by both academics and PS. There is a rota system for UG and voluntary basis for PGT, but currently no planned gender balance in either.
The School participated in the Economic and Social Research Council (ESRC) Festival of Social Science in
2016 where the College ran events at a local retail location, the International Business cluster hosted
an event promoting ‘Doing International Business’.
As part of the 2018 Festival the HRM researchers ran a workshop at the Women’s Library called
‘changing the view of women in leadership’ for 20 modern studies girls from local schools and their
teachers. The event included exploring representations of women’s’ leadership in the media and
collaging alternative representations.
Action 31 Ensure gender representation in both Academic and PS staff at UG Open Days, Offer Holder Days and PGT recruitment sessions.

69
7. FURTHER INFORMATION
Recommended word count: Bronze: 500 words | Silver: 500 words
Please comment here on any other elements that are relevant to the application.

70
8. ACTION PLAN
The action plan should present prioritised actions to address the issues identified
in this application.
Please present the action plan in the form of a table. For each action define an
appropriate success/outcome measure, identify the person/position(s) responsible
for the action, and timescales for completion.
The plan should cover current initiatives and your aspirations for the next four years.
Actions, and their measures of success, should be Specific, Measurable, Achievable,
Relevant and Time-bound (SMART).
See the awards handbook for an example template for an action plan.
This guide was published in May 2015. ©Equality Challenge Unit May 2015.
Athena SWAN is a community trademark registered to Equality Challenge Unit: 011132057.
Information contained in this publication is for the use of Athena SWAN Charter member
institutions only. Use of this publication and its contents for any other purpose, including copying
information in whole or in part, is prohibited. Alternative formats are available: [email protected]

71