department for report · low fire load ≤ 100,000 ≤ 1134 flats, offices, hotels etc. moderate...
TRANSCRIPT

Department for Communities and Local Government Project Final Work Stream report: BD 2887 Compartment sizes, resistance to fire and fire safety project Work stream 1 – Periods of fire resistance 286855 (D23V2) CPD/04/102
The authors of this report are employed by BRE. The work reported herein was carried out under a Contract placed by the Department for Communities and Local Government. Any views expressed are not necessarily those of the Department for Communities and Local Government.
Prepared for: Brian Martin Department for Communities and Local Government Building Regulations and Standards Division 2 Marsham Street London, SW1P 4DF 03 March 2015

1 Final Work Stream Report BD 2887 (D23V2) 286855
Commercial in confidence © Building Research Establishment Ltd 2015
Printed on environmentally friendly paper
FIRE
BD 2887
Compartment sizes, resistance to fire and fire safety project
Final Work Stream Report for Work Stream 1 Periods of fire resistance
Prepared for Brian Martin
Prepared by Tom Lennon and Richard Chitty
BRE output ref. 286855 (D23V2)
Approved on behalf of BRE
Name Dr Debbie A Smith
Position Director, Fire Sciences and Building Products
Date 18 March 2015
Signature
BRE Bucknalls Lane Garston Watford WD25 9XX Tel : 01923 664573 Fax : 01923 664910 Email : [email protected] Website : www.bre.co.uk

2 Final Work Stream Report BD 2887 (D23V2) 286855
Commercial in confidence © Building Research Establishment Ltd 2015
Printed on environmentally friendly paper
Executive Summary
Building Regulations and Standards Division, Department for Communities and Local Government (DCLG) commissioned BRE to carry out a project titled “Compartment sizes, resistance to fire and fire safety”. The main aim of this project was to produce robust evidence and data based on research, experimental fire testing, computer modelling and laboratory testing, where necessary, on a number of linked work streams in relation to fire safety and associated provisions in Schedule 1 of Part B of the Building Regulations 2010.
This Final work stream report describes the findings of the research for Work stream 1 – Periods of fire resistance. The aim of this work stream was to produce robust evidence and data to explore the potential to adopt a more flexible approach to the specification of fire resistance periods in Approved Document B1.
The work conducted under this work stream has considered the background to the current guidance in relation to periods of fire resistance. New performance based methods for characterising fire severity and specifying fire resistance periods have been evaluated through a consideration of data from a large series of full scale fire experiments. In order to consider the impact of the levels of insulation typical of modern forms of construction on fire growth and development, a number of new fire experiments have been undertaken. Alternative methodologies for determining compartment fire severity and specifying fire resistance periods have been evaluated and validated as part of this work stream.
This work stream has also involved the participation of an industry Steering Group.
The conclusions of this work stream are as follows:
• The fire tests undertaken as part of this work stream have demonstrated that enhanced levels of thermal insulation result in higher peak temperatures within the compartment and higher levels of thermal radiation from the compartment to adjacent buildings. It is important that this issue is considered in any future revision of regulatory guidance for fire safety.
• The calculation methods set out in BS EN 1991-1-2 and used to develop the alternative tables in BS 9999 provide an accurate prediction of compartment peak temperature and overall fire duration for a range of different parameters and are capable of taking into account the impact of high levels of thermal insulation on fire growth and development as represented by the thermal diffusivity present in modern buildings which typically range from 300 to 1500 J/m²s½K. The conclusion is based on comparison with experimental results covering a number of different compartment sizes, geometries, ventilation conditions and fuel loads. However, the scope of validation only covers fire compartments with a floor area up to 378 m². Beyond this value, the parametric fire calculations may still be used but will tend to yield unduly conservative results. This is because the parametric approach assumes a single zone temperature distribution with the maximum value present throughout the compartment when, in reality, there will be significant spatial temperature variations throughout any large fire compartment.
1 Department for Communities and Local Government. The Building Regulations 2010 (England). Approved Document B: Fire safety. Volume 1: Dwelling houses (2006 edition incorporating 2010 and 2013 amendments). Volume 2: Buildings other than dwelling houses (2006 edition incorporating 2010 and 2013 amendments).

3 Final Work Stream Report BD 2887 (D23V2) 286855
Commercial in confidence © Building Research Establishment Ltd 2015
Printed on environmentally friendly paper
• The calculation methods in BS EN 1991-1-2 and BS 9999 are currently in the public domain and are widely used as an alternative approach to the guidance set out in Table A2 of AD B. Consideration could be given to making a specific reference to these approaches as part of an overall fire engineering strategy within any subsequent revision of AD B.

4 Final Work Stream Report BD 2887 (D23V2) 286855
Commercial in confidence © Building Research Establishment Ltd 2015
Printed on environmentally friendly paper
Contents
1 Introduction and Objectives 5
2 Programme of work 5 2.1 Stakeholder engagement 5 2.2 Review of background to existing AD B requirements 6 2.3 Review of existing fire load survey information 12 2.4 Review of large-scale fully developed fires 17 2.5 Experimental programme 26 2.6 Analysis and Cost Benefit Analysis 46
3 Discussion on structural fire engineering design 48
4 Conclusions 53
5 Acknowledgements 53
6 References 54
Appendix A – Summary of the Research

5 Final Work Stream Report BD 2887 (D23V2) 286855
Commercial in confidence © Building Research Establishment Ltd 2015
Printed on environmentally friendly paper
1 Introduction and Objectives This Final work stream report is delivered as part of the Department for Communities and Local Government (DCLG) project BD 2887, titled “Compartment sizes, resistance to fire and fire safety”, DCLG Contract reference CPD/04/102/010. The main aim of this project was to produce robust evidence and data based on research, experimental fire testing, computer modelling and laboratory testing (where necessary) on a number of linked work streams in relation to fire safety and associated provisions in Schedule 1 of Part B of the Building Regulations 2010. The project has been broken down into specific work streams.
This report describes the findings of the research for Work stream 1 – Periods of fire resistance.
Resistance to fire is specified in terms of time periods that relate to a standard furnace test. The period specified for a particular building is based on assumptions about expected fire severity and the consequences of failure. Approved Document B (AD B)1 does this with a table which specifies minimum periods of fire resistance against the intended purpose of a building and its height.
The table is, to some extent, based on the conclusions of the “fire grading of buildings” report which was originally published in 1946. Since then, the table has been modified in a piecemeal fashion. In more recent years, deterministic approaches to specifying fire resistance, have been developed and have become codified in engineering standards such as Eurocode 12 (EN 1991-1-2) and in BS 9999: 20083. This approach can offer a more cost effective approach to fire protection than the traditional prescriptive approach but the use of BS EN 1991-1-2 requires specialist expertise to apply it.
The principal objective of this work stream was to produce robust evidence and data to explore the potential to adopt a more flexible approach to the specification of fire resistance periods in Approved Document B.
The Work stream 1 tasks were:
• Task 1.1 Identification and engagement of stakeholders
• Task 1.2 Review of background to existing AD B requirements
• Task 1.3 Review of existing fire load survey information
• Task 1.4 Review of large-scale fully developed fires
• Task 1.5 Experimental programme
• Task 1.6 Analysis and Cost Benefit Analysis
• Task 1.7 Reporting.
2 Programme of work
2.1 Stakeholder engagement
This work stream has involved the participation of an industry Steering Group, Satellite Steering Group A. This group provided input during the course of the work, giving feedback on the research methodology as well as key deliverables and milestones. This group met three times.

6 Final Work Stream Report BD 2887 (D23V2) 286855
Commercial in confidence © Building Research Establishment Ltd 2015
Printed on environmentally friendly paper
The organisations represented at the Steering Group are as follows.
Organisations represented at the Steering Group
• Building Regulations Division, Department for Communities and Local Government (DCLG)
• BRE Project team • British Constructional Steelwork Association (BCSA) • Association of Specialist Fire Protection (ASFP) • Association of Building Engineers (ABE) • British Automatic Fire Sprinkler Association (BAFSA) • Business Sprinkler Alliance (BSA) • Chief Fire Officers Association (CFOA) • The Chartered Institute of Building (CIOB) • The Concrete Centre • Fire Brigades Union (FBU) • Fire Industry Association (FIA) • Institution of Fire Engineers (IFE) • LABC • National Register of Access Consultants (NRAC) • Passive Fire Protection Federation (PFPF) • RICS Building Control Professional Group (RICS) • RISCAuthority • Scottish Building Standards (SBS) • Shore Engineering • Structural Timber Association (STA) • Warwickshire FRS • Welsh Government (WG)
2.2 Review of background to existing AD B requirements
A review has been undertaken of the principal document underpinning the current regulatory guidance with respect to fire resistance to understand the methodology and background to the current guidance. The current guidance in AD B is based largely on the findings from the Post-War Building Studies No. 20 Fire Grading of Buildings Part 1 General Principles and Structural Precautions4 published in 1946. The current provisions are largely based on this pioneering document with fire load density (i.e. fire load divided by floor area) forming the principal hazard categories set alongside the type of construction requiring elements of structure to achieve a specified period of fire resistance. Three hazard categories are identified corresponding to ‘low’, ‘moderate’ and ‘high’ fire loads. The values corresponding to these categories are significantly higher than the corresponding figures used for the performance based design of buildings suggesting that performance based approaches are based on more recent information such as the fire load densities tabulated in the CIB W14 design guide for structural fire safety5 (See Section 2.3).
In the Post-War Building Studies No. 20 report three categories of occupancy are identified principally on the basis of the fire load expected in each case as illustrated in Table 1.

7 Final Work Stream Report BD 2887 (D23V2) 286855
Commercial in confidence © Building Research Establishment Ltd 2015
Printed on environmentally friendly paper
Category Fire load density (BTU/ft²)
Fire load density (MJ/m²)
Example occupancies
Low fire load ≤ 100,000 ≤ 1134 Flats, offices, hotels etc.
Moderate fire load 100,000 ≤ 200,000 1134 ≤ 2269 Shops, factories etc.
High fire load 200,000 ≤ 400;000 2269 ≤ 4538 Warehouses and storage
Note. For conversion from BTU/ft² to MJ/m² x 0.001054/0.092903)
Table 1 - Occupancy characteristics from Post-War Building Studies No. 20
The concept of ‘normal’ and ‘abnormal’ fire loads is used to quantify the additional risk related to ignitability, burning rate and products of combustion of certain materials as well as the impact that certain activities may have on the risk of fire initiation. This concept recognises that situations involving identical fire loads may create additional risks in relation to fire initiation and propagation.
Those familiar with fire load densities used for modern performance based fire engineering design solutions would be surprised to see that fire load densities up to 1134 MJ/m² are classified as low fire load. Typical design values for offices and residential buildings would be of the order of 570 and 780 MJ/m², respectively.
The relationship between fire load density and fire resistance period for cellulosic fires was identified based on USA data as shown in Table 2.
Weight (lb/ft²)
Weight (kg/m²)
Fire load (BTU/ft²)
Fire load (MJ/m²)
Equivalent fire severity (hours)
10 48.8 80,000 907.6 1
15 73.2 120,000 1361.4 1.5
20 97.6 160,000 1815.2 2
30 146.4 240,000 2722.8 3
40 195.2 320,000 3630.4 4.5
50 244 380,000 4538 6
60 292.8 43,200 5445.6 7
Note. For conversion from lb/ft² to kg/m² x 0.453592/0.092903.
Table 2 - Relationship between fire load density and fire resistance period from Post-War Building Studies No. 20
The relationship in Table 2 was used to develop the categories in the Fire Grading of Buildings report, as shown in Table 3.

8 Final Work Stream Report BD 2887 (D23V2) 286855
Commercial in confidence © Building Research Establishment Ltd 2015
Printed on environmentally friendly paper
Fire load (BTU/ft²)
Fire load (MJ/m²)
Category Equivalent fire severity (hours)
< 100000 < 1134 Low fire load 1
100000 – 200000 1134 – 2269 Moderate fire load 2
200000 - 400000 2269 – 4538 High fire load 4
Table 3 - Categorisation in Fire Grading of Buildings report
The concept of ‘fully protected’ construction was developed to cover those buildings designed to withstand a complete burn out i.e. the protection provided equals the severity anticipated.
Special requirements are included in relation to separating and division walls. It is recommended that separating walls i.e. walls which separate different buildings should provide at least 4 hours fire resistance (loadbearing capacity, integrity and insulation, as appropriate) regardless of the fire load. Division walls separating different fire risks within the same building should be related to the fire load category although it is recommended that at least 2 hours fire resistance is provided even where a low fire load is present. External walls of 1 hour fire resistance are restricted to buildings of up to 15 m (50 ft). Above this height, external walls should be of at least 2 hours fire resistance and 4 hours in the case of high fire loads.
Other categories were defined with a fire resistance less than that required to survive complete burn out as shown in Table 4.
Seven categories of construction are identified ranging from fully protected structures designed to survive a complete burn out of all combustible material through to combustible materials without any specific fire resistance requirement.
Type of construction
Fire resistance required (hours)
Description Examples
1 ≥ 4 Fully protected
2 ≥ 2 Fully protected
3 ≥ 1 Fully protected
Large warehouses, large shops, factories, office blocks, blocks of flats
4 ≥ 0.5 Partially protected
5 ≥ 2 (external walls only) Externally protected
Small shops or factories, apartment houses
6 0 but incombustible materials
Unprotected incombustible
Single storey factories, garages
7 0 Combustible Timber houses, factories etc.
Table 4 - Categories of construction from Post-War Building Studies report

9 Final Work Stream Report BD 2887 (D23V2) 286855
Commercial in confidence © Building Research Establishment Ltd 2015
Printed on environmentally friendly paper
Strict restrictions on the use of combustible material apply for Types 1-3. With the exception of fire-rated timber doors, it is recommended that all structural parts of fully protected buildings requiring fire resistance should be of incombustible (nowadays referred to as non-combustible – see Table A6 of AD B for definition) material. This has important implications when considering limitations in relation to allowable heights of buildings. The criteria in relation to fire resistance for each type of construction is summarised in Table 5.
Type of building
Fully protected Design for burn out based on fire load density Type 1, 2 and 3
Partially protected construction
Not capable of surviving a complete burn out Type 4
Externally protected Internal construction has no specified fire resistance but external walls have ≥ 2 hours
Type 5
Unprotected incombustible construction
No specified fire resistance (other than separating walls) but incombustible material e.g. portal frames
Type 6
Combustible construction No fire resistance Type 7
Table 5 - Relationship between fire resistance performance and form of construction
A summary of the grading recommendations giving the fire resistance requirements of the various elements of structure for each type of construction is presented in Table 6.
Grading Minimum fire resistance for elements of structure (hours)
Walls and columns or beams supporting walls
External Separating Division Other fire resisting or loadbearing
Floors and roofs and columns and beams supporting floors and roofs
Type 1 4 4 4 4 4
Type 2 2 4 2/4+ 2 2
Type 3 2/1* 4 2/4+ 1 1
Type 4 2/1* 4 2/4+ 1 0.5
Type 5 2 4 2/4+ 1 -
Type 6 - 4 2/4+ - -
Type 7 - 4 2/4+ - -
* 1 hour for low fire load occupancies in framed buildings below 50 ft (15 m)
+ If occupancy is of high fire load
Table 6 - Summary of grading recommendations

10 Final Work Stream Report BD 2887 (D23V2) 286855
Commercial in confidence © Building Research Establishment Ltd 2015
Printed on environmentally friendly paper
Restrictions on maximum height/floor area/cubic capacity apply depending on the type of occupancy as defined by the nature of the anticipated fire load and the accessibility of the building or compartment. The restrictions on maximum compartment size in relation to height, floor area or cubic capacity were defined based on a study of existing requirements.
The principle of establishing an appropriate fire resistance period for a particular occupancy and height of building is the same in the current guidance as the approach used in the 1946 document. The fire severity is assumed to be a function principally of the type and magnitude of the fire load. The size of the building in terms of height, floor area and cubic capacity is related to the consequences of failure and the accessibility for means of escape and fire fighter access.
The basic methodology underpinning the fire grading of buildings is summarised in Figure 1. There is an acknowledged acceptance that there may be cases where buildings will need to exceed the proposed limits on floor area, cubic capacity and height. It is therefore clear that the recommendations were never intended to cover all forms of construction just as the guidance in AD B does not cover all types of building.
Figure 1 - Methodology underpinning Fire Grading of Buildings
Grade occupancy according to fire load (Low, Moderate,
High)
Categorise type of fire load (Normal, Abnormal)
Grade building according to type of construction (Types
1-7)
Sub-divide building as required
Observe limitations on height, floor area and volume as required

11 Final Work Stream Report BD 2887 (D23V2) 286855
Commercial in confidence © Building Research Establishment Ltd 2015
Printed on environmentally friendly paper
To illustrate the similarities between the approach adopted in the Post-War Building Studies Report and the current guidance, a fire resistance period will be derived using both the recommendations of the Post-War Building Studies and the current guidance in relation to the following cases:
• Case A, an 8-storey office building 32 m high
• Case B, a 5-storey residential building 15 m high
Case A, an office building with a ‘normal’ fire load type and distribution, would be classed as low fire load. Assuming the building will need to be fully protected i.e. protected to withstand a burn out then the structure (excluding external walls) could be designed using incombustible material to provide a fire resistance of one hour (Type 3). However, the external walls and any internal compartment walls would require two hours fire resistance.
Using Approved Document B guidance, the required period of fire resistance for such a building would be two hours but the building would require an automatic sprinkler system. Elements not forming part of the structural frame would only require 90 minutes fire resistance. The results are summarised in Table 7.
Design approach
Minimum fire resistance of elements of structure for 32 m office building (hours)
Walls and columns or beams supporting walls
External Separating Division Other fire resisting or loadbearing
Floors and roofs and columns and beams supporting floors and roofs
Fire Grading of buildings Type 3
2 4 2 1 1
AD B 2 2 1.5 2 0
Table 7 - Comparison between fire grading of buildings approach and AD B guidance for Case A
Case B, a residential building (apartment block) with a ‘normal’ fire load type and distribution, would be classed as low fire load. Assuming the building will need to be fully protected i.e. protected to withstand a burn out, then the structure (excluding external walls) could be designed using incombustible material to provide a fire resistance of one hour (Type 3). However, the external walls and any internal compartment walls would require two hours fire resistance.
There is also a possibility to construct the building from Type 4 or Type 5 construction. Where Type 4 construction is used, then fire resisting construction is required but it does not need to be incombustible. Where Type 5 construction is used, the external walls need to be incombustible, but the internal construction may be combustible.
Using AD B guidance, the required period of fire resistance for such a building would be one hour. The results are summarised in Table 8.

12 Final Work Stream Report BD 2887 (D23V2) 286855
Commercial in confidence © Building Research Establishment Ltd 2015
Printed on environmentally friendly paper
Design approach
Minimum fire resistance of elements of structure for 15 m residential building (hours)
Walls and columns or beams supporting walls
External Separating Division Other fire resisting or loadbearing
Floors and roofs and columns and beams supporting floors and roofs
Fire grading of buildings Type 3
2 4 2 1 1
Fire grading of buildings Type 4
1 4 2 1 0.5
Fire Grading of buildings Type 5
2 4 2 1 -
AD B 1 1 1 1 -
Table 8 - Comparison between Fire Grading of Buildings approach and AD B Guidance for Case B
The review has established that the guidance in the Approved Document in relation to periods of fire resistance is strongly influenced by the recommendations of the Post-War Building Studies research. The current values are a combination of statistical data (fire loads), experimental data (calorific values), engineering calculations supported by empirical observations (time equivalence) and engineering judgement influenced by experience of real fires, commercial considerations and political decisions.
One area which is completely absent in the work of the Post-War Building Studies research is the impact of ventilation on fire growth and development. Fire severity is assumed to be purely a function of the fire load and the floor area of the compartment. This is clearly a major simplification of real fire behaviour.
2.3 Review of existing fire load survey information
The relationship between fire load and fire severity established in the Post-War Building Studies Fire Grading of Buildings was based on unpublished work from the Building Research Station which indicated that the fire load of residential buildings, hotels, hospitals, schools and similar occupancies does not exceed 100,000 BTU/ft2 (1,134 MJ/m²). The fire load of shops and factories is generally greater than this value and the fire load of warehouses may be as much as 1,000,000 BTU/ft² (11,345 MJ/m²).
The most comprehensive set of data relating to fire load densities yet produced was compiled as part of the CIB W14 guide to structural fire safety5. The tabulated values from this document are summarised in Table 9 with respect to variable fire load densities for various occupancies. The values given are approximate

13 Final Work Stream Report BD 2887 (D23V2) 286855
Commercial in confidence © Building Research Establishment Ltd 2015
Printed on environmentally friendly paper
averages for each data set. The source document should be consulted for the detailed breakdown according to the type of occupancy and for the reference to the original data source.
Fractile value (MJ/m²) Occupancy type Source data
80% 90% 95%
Average (MJ/m²)
Swedish 820 - - 750
European 796 860 890 642
Swiss (flat) - - - 330
Dwelling
USA - - - 320
Swedish 675-720 - - 411
European 570 740 950 420
European 520 770 920 410
European - - - 330
Swiss - - - 580-750
USA - - - 555
Office
USA - - - 580
European - - - 478 Shops
Swiss - - - 564
European 350 - 670 230
Swiss - - - 330
Hospitals
USA 108 - -
Swedish 380 - -
European 400 470 510 310
Hotels
Swiss 330
German (storage < 150kg/m²) 2560 3490 4490 1780
German (storage > 150kg/m²) 23190 33110 44330 15360
German (manufacture and storage < 150kg/m²) 1820 2640 3590 1180
Industrial buildings
German (manufacture and storage > 150kg/m²) 14180 19810 26040 9920
Swedish 340 - - 285
European 350 389 435 240
Netherlands 365 - 550 215
Schools
Swiss - - - 250
Table 9 - Summary of variable fire load data from CIB W14 Design Guide
These values should be considered alongside tabulated values from national and European standards as summarised in Table 10.

14 Final Work Stream Report BD 2887 (D23V2) 286855
Commercial in confidence © Building Research Establishment Ltd 2015
Printed on environmentally friendly paper
Fractile value (MJ/m²) Occupancy type
Source data
80% 90% 95%
Average (MJ/m²)
Dwelling 870 920 970 780
Offices 570 670 760 420
Shops 900 1100 1300 600
Hospitals 350 440 520 230
Hotels 400 460 510 310
Manufacturing and storage (< 150 kg/m²)
1800 2240 2690 1180
Manufacturing 470 590 720 300
Schools 360 410 450 285
Libraries
PD 7974-16
2250 2550 - 1500
Dwelling 948 - - 780
Offices 511 - - 420
Shops 730 - - 600
Hospitals 280 - - 230
Hotels 377 - - 310
Schools 347 - - 285
Libraries
BS EN 1991-1-22
1824 - - 1500
Table 10 - Tabulated characteristic fire load densities from national and European fire engineering codes
The codified values are very similar. The average values for each occupancy type are exactly the same suggesting that they are both based on the same data set. PD 7974-1 specifically acknowledges the CIB Design Guide as the source of the tabulated values. It is therefore reasonable to assume that both the national and European tabulated fire load densities are based on these values. The values suggest that the principal source of information is the Swedish data referenced in the CIB design guide.
More recent fire load surveys support the values above in relation to shopping malls and offices. Four shopping malls were surveyed by Carmen and Chow7. The results in terms of the range of fire load densities encountered are summarised in Table 11.

15 Final Work Stream Report BD 2887 (D23V2) 286855
Commercial in confidence © Building Research Establishment Ltd 2015
Printed on environmentally friendly paper
Shopping mall Estimated floor area (m²)
Range of fire load density (MJ/m²)
A 4500 320-1670
B 12300 190-2440
C 6100 100-2530
D 12500 75-1730
Table 11 - Range of fire load densities found by Carmen and Chow
A comprehensive survey of fire load densities was undertaken by the Fire Protection Research Association in the USA8 based on a sample size of 103 offices which compared different survey methods. The results are summarised in Table 12.
Inventory method (MJ/m2)
Weighing method (MJ/m2)
Combination method (MJ/m2)
Mean 852 530 557
80% fractile 1572 871 1077
90% fractile 1805 996 1182
95% fractile 2090 1188 1282
Table 12 - Survey data for offices by the Fire Protection Research Association, USA
The results indicate a higher fire load density than that provided in the national and European standards. The combination methodology (weighing and inventory) is thought to provide the most accurate results.
Fourteen clothing stores in Canada were surveyed as part of a research project to characterise design fires for such premises9. The results indicated a spread of fire load density between 142 and 755 MJ/m² with a 95% fractile of 661 MJ/m² which is considerably lower than the tabulated values in the codes. This study was based on a comprehensive survey of 168 stores of all types conducted in Canada. The survey indicated a mean value of 750 MJ/m² which is higher than the codified values.
Bukowski10 presented historic data from the USA and provided a comparison with Swiss data. He concluded that the numbers were reasonably consistent even though they covered a time span of almost 50 years and were based on survey data from different continents. He also mentions that fire engineering guideline documents recommend that the 90% or 95% fractile values are in the design. In the UK the 80% fractile value is usually adopted for fire engineering design calculations.
More up to date survey data was presented in relation to hotels at a SFPE keynote presentation in October 201211. The data is summarised with respect to mean, 80% and 95% fractile values in Table 13.

16 Final Work Stream Report BD 2887 (D23V2) 286855
Commercial in confidence © Building Research Establishment Ltd 2015
Printed on environmentally friendly paper
Variable fire load density (MJ/m²)
Total fire load density (MJ/m²)
Mean 80% fractile 95% fractile Mean 80% fractile 95% fractile
388 453 539 535 632 753
Table 13 - Fire load survey data for hotels
While the variable fire load densities are in line with the figures from published codes and standards, the total fire load densities are well in excess of these figures. With modern forms of construction, increasing amounts of combustible material are incorporated within the fabric or frame of the building.
Hietaniemi and Mikkola12 have argued that increasing prosperity may result in an increase in fire load density within dwellings. The theory is supported by comparative data from the USA in 1970 and Canada in 2004 which suggests an increase of around 30% to 40% over this thirty year period which is at odds with the conclusions drawn by Bukowski. Based on their observations they provided an estimate for fire load densities for apartments in Finland with an average value of 509 MJ/m² and an 80% fractile value of 575 MJ/m². These values are averaged with significant differences between the various rooms comprising the dwelling. It should be noted that these increased values are significantly lower than the corresponding design values from national and European fire engineering codes.
Based on a review of available fire load survey data the following conclusions can be drawn:
• The current guidance in relation to periods of fire resistance is partly based on fire load survey information which is out of date.
• The design values of fire load density adopted in fire engineering codes and standards are based on the survey data contained within the CIB W14 Design Guide: Structural Fire Safety. A comparison between the CIB W14 fire load survey data and the tabulated data from the codes suggest that the values contained within national and European standards appear to be based, in particular, on survey results from Sweden.
• The values in the national (PD 7974-1) and European (BS EN 1991-1-2) codes are very similar. It is currently recommended within the National Annex to BS EN 1991-1-2 that the PD 7974-1 values are adopted for design within the UK. These values are set out in the background paper (PD 6688-1-2) that provides non-contradictory complementary information (NCCI) for use in the UK with BS EN 1991-1-2 and its UK National Annex.
• The available data indicate a significant variation in data sets from individual countries. This is to be expected as fire load density will be influenced by factors such as economic prosperity, availability and cost of land for development and cultural factors.
• The data in national and European codes and standards are based on survey data related to variable (moveable) fire load density and do not incorporate combustible material which is itself part of the fabric or structure of the building.

17 Final Work Stream Report BD 2887 (D23V2) 286855
Commercial in confidence © Building Research Establishment Ltd 2015
Printed on environmentally friendly paper
2.4 Review of large-scale fully developed fires
A review of large-scale fire tests was undertaken to consider how the results (in relation to peak temperature, overall duration and equivalent period of fire severity) tie in with predictive methods from performance based fire engineering codes and standards such as the parametric approach set out in BS EN 1991-1-2 or the time equivalent methodology underpinning the alternative approach to specifying fire resistance periods in BS 9999. In order to consider the accuracy of the various design methods, it is necessary to have access to a great deal of information on the fire including magnitude and distribution of fire load, compartment geometry, ventilation conditions and type of construction involved. BRE has access to a large database of full scale fire tests which has been used to ‘calibrate’ the performance based design approaches identified above. The majority of fire tests considered either formed part of a series of tests undertaken by the Joint Fire Research Organisation in conjunction with the British Iron and Steel Federation (BISF) in the 1960s or formed part of a series of large-scale fire tests undertaken at the BRE’s Large Building Test Facility at Cardington. The tests included in the review are listed in Table 14.
Test ref.
Description Fire load density qfd (MJ/m²)
Thermal properties b (J/m²s½K)
Opening factor (m-1) Floor area (m²)
1 BRE corner13 720 720 0.183 54
2 BS corner13 810 1600 0.05 76
3 BRE large compartment13 720 720 0.164 342
4 BS Demo13 828 1600 0.07 136
5 European robustness14 720 714 0.043 77
6 Slimdek15 900 720 0.03-0.04 144
7 Hollow core (x2)16 540 945 0.065 36
8 Concrete building17 720 1104 0.08 225
9 NFSC 2 & 318 720 720 0.1 144
10 NFSC 1 & 818 720 1600 0.1 144
11 NFSC 4 & 518 720 720 0.07 144
12 NFSC 6 & 718 720 1600 0.07 144
13 Steel house 119 648 650 0.037 29.6
14 Steel house 219 648 650 0.048 28.8
15 Large compartment 120 360 415 0.062 138
16 Large compartment 220 360 415 0.062 138
17 Large compartment 320 720 415 0.022 138

18 Final Work Stream Report BD 2887 (D23V2) 286855
Commercial in confidence © Building Research Establishment Ltd 2015
Printed on environmentally friendly paper
Test ref.
Description Fire load density qfd (MJ/m²)
Thermal properties b (J/m²s½K)
Opening factor (m-1) Floor area (m²)
18 Large compartment 420 360 415 0.022 138
19 Large compartment 520 360 415 0.012 138
20 Large compartment 620 360 415 0.003 138
21 Large compartment 720 360 377 0.05 36
22 Large compartment 820 360 732 0.057 138
23 Large compartment 920 360 415 0.058 138
24 Large hollow core (x2)21 585 1060 0.03 125
25 TF200022 414 720 0.038 21.5
26 SIPS (x4)23 450 520 0.026 12
27 BISF A24 135 1768 0.06 28.7
28 BISF B24 135 1768 0.06 28.7
29 BISF C24 1080 1768 0.06 28.7
30 BISF D24 270 1768 0.12 28.7
31 BISF E24 540 1768 0.12 28.7
32 BISF F24 540 1768 0.12 28.7
33 BISF G24 270 1768 0.06 28.7
34 BISF H24 540 1768 0.06 28.7
35 BISF I24 540 1768 0.06 28.7
36 BISF J24 135 1768 0.12 28.7
37 BISF K24 135 1768 0.12 28.7
38 BISF L24 1080 1768 0.12 28.7
39 BISF M24 540 1768 0.06 28.7
40 BISF N24 540 1768 0.12 28.7
41 BISF O24 135 553 0.06 28.7
42 BISF P24 135 553 0.12 28.7

19 Final Work Stream Report BD 2887 (D23V2) 286855
Commercial in confidence © Building Research Establishment Ltd 2015
Printed on environmentally friendly paper
Test ref.
Description Fire load density qfd (MJ/m²)
Thermal properties b (J/m²s½K)
Opening factor (m-1) Floor area (m²)
43 BISF Q24 540 553 0.06 28.7
44 BISF R24 540 553 0.12 28.7
45 BISF S24 135 677 0.06 28.7
46 BISF U24 1080 1768 0.06 28.7
47 BISF V24 1080 1768 0.03 28.7
48 BISF W24 135 1768 0.12 28.7
49 BISF X24 270 1768 0.06 28.7
50 BISF Y24 135 1768 0.12 28.7
Table 14 – Large-scale fire tests included in review together with relevant parameters
For all the tests in Table 14, atmosphere temperatures have been recorded allowing a comparison between measured and predicted values of peak temperature. For many tests, indicative specimens were included to allow a comparison with an equivalent period of fire exposure to the standard fire curve. Where this data is available, a comparison is made with predicted and measured values of time equivalence. All available large-scale fire test information has been reviewed. In certain cases, such as test references 1, 2, 6 and 8, there were changes to the ventilation condition over the course of the fire test. However, this is to be expected in real situations where glazing will break over the course of the fire. Estimates representative of the range of ventilation conditions have been used in all cases where there have been changes over the course of the test.
The comparisons in terms of peak temperature and time to peak temperature as predicted using the parametric approach are illustrated graphically in Figures 2 to 6. In order to make interpretation of the data a little easier, the BISF fire tests are considered separately. For both the parametric and time equivalent approaches, there are limits to specific parameters outside of which the calculation is no longer valid. Where the parameters of a particular fire test lie outside the scope of validation for the predictive equation this is identified. Figure 2 shows the value of the measured to predicted temperature for a total of 35 large-scale fire tests. All parameters were within the allowable scope of the parametric equation and the complementary information contained within the UK National Annex with the exception of test reference 21 where the opening factor is lower than the minimum value permitted. Values above unity mean that the parametric equation under predicts peak temperature while values below unity mean that the parametric equation over predicts peak temperature.

20 Final Work Stream Report BD 2887 (D23V2) 286855
Commercial in confidence © Building Research Establishment Ltd 2015
Printed on environmentally friendly paper
Figure 2 - Comparison between measured and peak temperatures for a range of large-scale fire tests
Figure 3 shows the same relationship for the BISF tests.
21 Final Work Stream Report BD 2887 (D23V2) 286855
Commercial in confidence © Building Research Establishment Ltd 2015
Printed on environmentally friendly paper
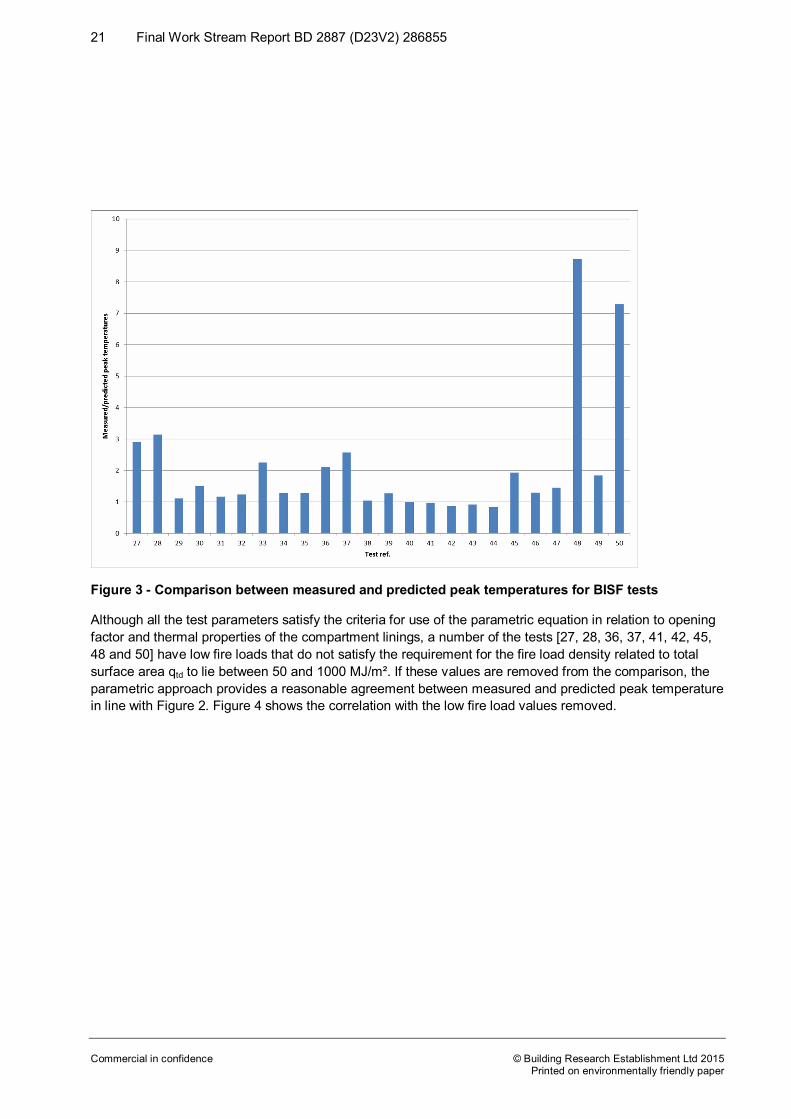
Figure 3 - Comparison between measured and predicted peak temperatures for BISF tests
Although all the test parameters satisfy the criteria for use of the parametric equation in relation to opening factor and thermal properties of the compartment linings, a number of the tests [27, 28, 36, 37, 41, 42, 45, 48 and 50] have low fire loads that do not satisfy the requirement for the fire load density related to total surface area qtd to lie between 50 and 1000 MJ/m². If these values are removed from the comparison, the parametric approach provides a reasonable agreement between measured and predicted peak temperature in line with Figure 2. Figure 4 shows the correlation with the low fire load values removed.

22 Final Work Stream Report BD 2887 (D23V2) 286855
Commercial in confidence © Building Research Establishment Ltd 2015
Printed on environmentally friendly paper
Figure 4 - Comparison between measured and predicted peak temperatures for BISF tests with low fire load values removed
Figure 5 shows the comparison between measured and predicted times to peak temperature for the range of fire tests covered in Figure 2.

23 Final Work Stream Report BD 2887 (D23V2) 286855
Commercial in confidence © Building Research Establishment Ltd 2015
Printed on environmentally friendly paper
Figure 5 - Comparison between measured and predicted time to peak temperatures for a range of large fire tests
The correlation is generally very good. Where the parametric approach under predicts time to peak temperatures this is generally due to a pre-flashover phase. Figure 6 is a similar comparison for the BISF experimental programme.

24 Final Work Stream Report BD 2887 (D23V2) 286855
Commercial in confidence © Building Research Establishment Ltd 2015
Printed on environmentally friendly paper
Figure 6 - Comparison between measured and predicted time to peak temperature for BISF fire tests
The results show that the parametric approach provides a reasonable estimate of peak compartment temperature and time to peak temperature for a wide range of different parameters.
Figure 7 shows the relationship between measured and predicted values of time equivalence for the fire experiments shown in Figure 2. The measured values are based on instrumented steel sections placed within the fire compartment for which standard fire test data is available. The predicted values are based on the time equivalence formulation set out in BS EN 1991-1-2 and associated National Annex and NCCI.

25 Final Work Stream Report BD 2887 (D23V2) 286855
Commercial in confidence © Building Research Establishment Ltd 2015
Printed on environmentally friendly paper
Figure 7 - Comparison between measured and predicted values of time equivalence for a range of large-scale fire tests
Figure 8 shows the corresponding relationship for the BISF tests.

26 Final Work Stream Report BD 2887 (D23V2) 286855
Commercial in confidence © Building Research Establishment Ltd 2015
Printed on environmentally friendly paper
Figure 8 - Comparison between measured and predicted values of time equivalence for BISF tests
In Figure 8, a minimum period of 20 minutes has been assumed for the predicted period of fire resistance. This is consistent with observed behaviour in real fires and takes into account inconsistent values due to low fire load densities.
The results show that the time equivalent approach provides a reasonable estimate of equivalent severity for a wide range of different parameters.
2.5 Experimental programme
The database of fire tests reviewed above incorporates a wide range of different parameters with compartment floor area ranging from 12 m² to 378 m², fire load densities ranging from 135 MJ/m² to 1080 MJ/m² and opening factors ranging from 0.002 m-1 to 0.18 m-1. While a number of the fire tests have considered the impact of the thermal properties of compartment linings on fire growth and development, this remains an area where further work is required.
Modern methods of construction incorporate large quantities of thermal insulation within the wall, floor and roof construction to provide the energy efficiency performance required by modern regulations. More information is required on the impact of the thermal properties of compartment linings on fire growth and development.
Three fully-developed post flashover fire experiments were conducted in this project in support of Work Stream 1. A specially designed compartment was used to carry out the experiments relevant to this work stream as well as providing additional information for other work streams within the research project. The compartment had internal dimensions of 3.6 m long, 3.6 m deep and 2.4 m high with provision for a 2.0 m

27 Final Work Stream Report BD 2887 (D23V2) 286855
Commercial in confidence © Building Research Establishment Ltd 2015
Printed on environmentally friendly paper
high, 2.0 m wide opening in one wall. The walls of the compartment were built from medium density load bearing concrete blocks 100 mm thick (density 1400 kg/m3). The roof of the compartment was constructed from a reinforced concrete beam and block system supported on two of the block walls. The floor of the laboratory was protected by either plasterboard sheets or sand.
To provide alternative levels of thermal insulation to the rig, non-combustible linings were selected to give thermal performance equivalent to walls and ceilings used in modern buildings. The insulation options and experimental programme are given in Table 15.
Experiment number
Work stream
Ventilation Insulation Roof structure
Date
1 1, 6 Wall 1.5 m2 Very high Closed 28th November 2013
2 1, 6 Wall 1.5 m2 High Closed 11th December 2013
3 1, 6 Wall 1.5 m2 Low Closed 17th December 2013
Table 15 – Experimental programme for Work stream 1
The 2 m by 2 m opening provided access to the rig to change lining materials, construct the fire and to remove debris. During each fire, the opening was partly blocked to provide the required wall ventilation.
The basic structure, prior to Experiment 1 is shown in Figure 9.
Figure 9 - View of the fire compartment looking in from front ventilation opening

28 Final Work Stream Report BD 2887 (D23V2) 286855
Commercial in confidence © Building Research Establishment Ltd 2015
Printed on environmentally friendly paper
To assist with the location of instrumentation and other items in the rig, a reference grid was devised. This is shown in Figure 10.
Figure 10 - Plan of rig showing reference grid and location of cribs
To provide alternative levels of thermal insulation, the rig included a non-combustible lining selected to give thermal performance equivalent to walls and ceilings used in modern buildings. The three options are given in Table 16.
Level Relative degree of insulation
Construction Thermal properties U value (W/m²K)
Walls: Block work, no lining Conductivity 0.42 W/mK Thermal inertia 660 J/m2s1/2K
3.33
1 Low
Roof: Precast concrete beam and block floor
Conductivity 1.0 W/mK Thermal inertia 1100 J/m2s1/2K
2.36
Walls: Block work, lined with plasterboard
Conductivity 0.24 W/mK Thermal inertia 520 J/m2s1/2K
1.84 2 High
Roof: Precast concrete beam and block floor lined with plasterboard
Conductivity 0.24 W/mk Thermal inertia 520 J/m2s1/2K
1.90
Walls: Block work lined with ceramic blanket
Conductivity 0.02 W/mK Thermal inertia 54 J/m2s1/2K
0.36 3 Very high
Roof: Precast concrete beam and block floor lined with ceramic blanket
Conductivity 0.02 W/mK Thermal inertia 54 J/m2s1/2K
0.59
Table 16 - Thermal insulation
4
3
2
1
A B C D E
Opening
3.6m
3.6m

29 Final Work Stream Report BD 2887 (D23V2) 286855
Commercial in confidence © Building Research Establishment Ltd 2015
Printed on environmentally friendly paper
Although it is true that higher levels of insulation produce more severe fires in terms of peak temperature and time to flashover there is no simple correlation between the impact of U values and the thermal properties of compartment linings. U values are used to determine heat transfer over a long period of time under steady state conditions where all constituent layers will play a role in providing insulation. In a fire situation the interaction between the compartment linings and the development of the fire is primarily influenced by those materials in direct contact with the fire compartment with materials on the non-fire side playing a less important role.
The key dimensions and material properties of the experimental rig are summarised as follows.
Internal dimensions:
Width 3.6 m
Depth 3.6 m
Height 2.4 m
Wall block thickness: 100 mm
Insulation thickness:
Ceramic fibre: 25 mm
Plasterboard: 12.5 mm
Wall opening: 2.0 m by 2.0 m
Blocked to 1.5 m wide by 1.0 m high opening in Experiments 1, 2 and 3
Material properties:
Material Density (ρ )
Conductivity (k)
Specific heat capacity (c)
Thermal inertia ( )
kg/m3 W/m/K J/kg/K J/m2s1/2K
Block work 1375 0.42 753 660
Plasterboard 900 0.24 1250 520
Sand 1750 1.0 800 1185
Ceramic fibre
128 0.02 1130 54
Table 17 - Thermal properties for compartment linings
For each experiment, a fire load of 570 MJ/m2 (averaged over the entire floor area) has been used.

30 Final Work Stream Report BD 2887 (D23V2) 286855
Commercial in confidence © Building Research Establishment Ltd 2015
Printed on environmentally friendly paper
For Experiments 1 to 3, the fire load was distributed across six wooden cribs made up of 1 m long 50 mm square section Scots pine timber sticks with a moisture content of less than 13%. The sticks were arranged in seven layers of ten sticks as shown in Figure 11. Figure 10 shows the locations of the cribs centred at locations B2, C2, D2, B3, C3, and D3. The crib at location C2 was constructed on a weighting platform; this raised its upper surface from the floor by approximately 150 mm (see Figure 11).
Figure 11 - View of cribs inside rig prior to Experiment 1
The common instrumentation for all the experiments was:
• Six thermocouple columns at locations B2, C2, D2, B3, C3, and D3.
• Each column had thermocouples at distances of 100, 400, 600, 1000 and 1400 mm from the ceiling.
• Weighting platform under crib C3.
• Two sets of three wall thermocouples (exposed side, middle, unexposed side) at grid lines A and 4.
Experiments 1 to 3 with a wall opening included heat flux meters at 4 m from the centre of the opening (1.4 m from the floor).
Experiments 1 to 3 included indicative protected steel sections suspended from the ceiling to provide information on the severity of the fires relative to an equivalent period in a standard fire test. Each sample had three thermocouples to measure the temperature of the steel flanges and web. It has not been possible to obtain standard fire test data corresponding to the instrumented sections so it is not possible to obtain measured values of time equivalence. However, the results indicate that the severity of the compartment fires was in excess of the design fire resistance of the protected steel sections.

31 Final Work Stream Report BD 2887 (D23V2) 286855
Commercial in confidence © Building Research Establishment Ltd 2015
Printed on environmentally friendly paper
Experiments 1 to 3 included an array of six velocity measurement probes and thermocouples as shown in Figure 11. The instruments were located at on the centre line of the opening at 1/5, 2/5, 3/5 and 4/5 of the depth from the top of the opening and one at ¼ and ¾ width of the opening and 1/5 from the top of the opening.
The data were recorded using a data logger scanning each channel every 2.5 seconds.
Each experiment was recorded with at least one fixed video camera and observers took still and video images together with visual observation notes.
Experiment 1 - details and observations
Date and time: 28th November 2013 at 14:00
Ventilation: Wall opening 1.5 m wide, 1.0 m high, sill 0.9 m above floor.
Ventilation factor ( ) = 1.5 m3/2
Opening Factor ( ) = 1.5/47.5 = 0.032 m1/2
Insulation: Very high (see Table 15)
Thermal inertia, b = 54 J/m2s1/2K
Fire load: Six wood cribs, fire load = 570 MJ/m2
Observations: Laboratory ambient temperature = 10°C prior to ignition
Time (mins: secs)
Observation
-5:00 Ignition countdown started: data logging begins 0:00 Ignition started 1:30 Ignition established, lower section of opening in place 3:00 Flames tips at sill level 7:00 Flame tips reach compartment ceiling 7:50 Flames leave compartment 7:50 Intumescent on indicative specimen activated 8:00 Flashover 10:00 Strong external flaming black smoke. Smoke from Target 1 12:00 Smoke from Target 2 17:00 Mass loss instrumentation fails 30:30 Target 1 falls from stand 40:00 Frame over sill falls away 53:00 Spalling of roof – test terminated 57:00 Explosive failure of lintel 90:00 Data logging stopped Table 18 - Experiment 1 observations

32 Final Work Stream Report BD 2887 (D23V2) 286855
Commercial in confidence © Building Research Establishment Ltd 2015
Printed on environmentally friendly paper
Experiment 1 – results
Figure 12 shows the spatially-averaged temperature of the six thermocouples mounted 1 m below the ceiling (at approximately the centre height of the opening) and some of the key events during the experiment.
Figure 12 - Average temperature 1 m below ceiling and key events for Experiment 1
To illustrate the severity of the conditions in the compartment, Figure 13 shows a comparison between the average temperature 1 m below the ceiling and the standard “fire resistance” curves1.
Figure 13 - Average temperature 1 m below ceiling and “fire resistance curves” for Experiment 1

33 Final Work Stream Report BD 2887 (D23V2) 286855
Commercial in confidence © Building Research Establishment Ltd 2015
Printed on environmentally friendly paper
Figure 14 summarises the development of the fire using a series of “snapshots” of the data at key times during the experiment. These show an image of the fire, the vertical temperature profile at location C3 (above the back centre crib), a calculation of heat release rate based on the weighing platform data, maximum temperature recorded and the radiation intensity 4 m from the centre of the opening. The heat release rate data is calculated from the mass loss rate obtained for crib C2. The assumption is that the mass loss rate from the other cribs is identical and that the heat release rate is given by a two minute time averaged mass loss rate multiplied by the heat of combustion for timber (17.5 MJ/kg).
Heat release rate 0.8 MW
Maximum Temperature 247°C
Radiation intensity at 4 m, 0.05 kW/m2
5 minutes (Pre flashover)
Heat release rate 3.5 MW
Maximum Temperature 830°C
Radiation intensity at 4 m, 2.7 kW/m2
8 minutes (Flashover)
Heat release rate 3.5 MW
Maximum Temperature 950°C
Radiation intensity at 4 m, 2.7 kW/m2
9 minutes (Post flashover)
Heat release rate 3.5 MW
Maximum Temperature 1131°C
Radiation intensity at 4 m, 4.7 kW/m2

34 Final Work Stream Report BD 2887 (D23V2) 286855
Commercial in confidence © Building Research Establishment Ltd 2015
Printed on environmentally friendly paper
12 minutes
Heat release rate No data
Maximum Temperature 1162°C
Radiation intensity at 4 m, 5.6 kW/m2
15 minutes
Heat release rate No data
Maximum Temperature 1158°C
Radiation intensity at 4 m, 6.3 kW/m2
17 minutes (end of mass loss rate data)
Heat release rate
No data
Maximum Temperature 1230°C
Radiation intensity at 4 m, 8.6kW/m2
30 minutes (prior to target at 2m falling away)
Heat release rate
No data
Maximum Temperature 1231°C
Radiation intensity at 4 m, 9.4 kW/m2
40 minutes (frame above sill falls away)

35 Final Work Stream Report BD 2887 (D23V2) 286855
Commercial in confidence © Building Research Establishment Ltd 2015
Printed on environmentally friendly paper
Heat release rate
No data
Maximum Temperature 1213°C
Radiation intensity at 4 m, 10.2 kW/m2
45 minutes
Heat release rate
No data
Maximum Temperature 1211°C
Radiation intensity at 4 m, 9.3 kW/m2
50 minutes
Heat release rate
No data
Maximum Temperature 1172°C
Radiation intensity at 4 m, 7.7 kW/m2
53 minutes (at termination)
Figure 14 - Time line for Experiment 1
An indicative column element with an intumescent coating was present in the rig under the ceiling near location C3. Figure 15 shows the temperature history at three points on the element.

36 Final Work Stream Report BD 2887 (D23V2) 286855
Commercial in confidence © Building Research Establishment Ltd 2015
Printed on environmentally friendly paper
Figure 15 - Indicative column element temperatures for Experiment 1
The rise in temperature after ~18 minutes indicates failure of the protective coating on the indicative column.
After the test was terminated, during the period while the fire was being extinguished, the lintel above the 2 m opening failed explosively. There had already been some spalling of some of the roof beams at this time. It is not clear from video records whether the spalling was a consequence of the structure entering a cooling phase or if fire-fighting water had come into contact with the lintel.
Figure 16 shows some images of the roof beams after the fire had been extinguished.
Figure 16 - Roof beams after Experiment 1

37 Final Work Stream Report BD 2887 (D23V2) 286855
Commercial in confidence © Building Research Establishment Ltd 2015
Printed on environmentally friendly paper
Experiment 2 - details and observations
Date and time: 11th December 2013 at 10:00
Ventilation: Wall opening 1.5 m wide, 1.0 m high, sill 0.9 m above floor.
Ventilation factor ( ) = 1.5 m3/2
Opening Factor ( ) = 1.5/47.5 = 0.032 m1/2
Insulation: High (see Table 15)
Thermal inertia, b = 520 J/m2s1/2K
Fire load: Six wood cribs, fire load = 570 MJ/m2
Observations: Laboratory ambient temperature 7°C prior to ignition
Time (mins: secs)
Observation
-5:00 Ignition countdown started: data logging begins 0:00 Ignition started 1:30 Ignition established, lower section of opening in place 1:30 to 4:30 Grey smoke issuing, buoyant plume 9:48 Flames filling compartment 10:00 Flashover 11:00 Intumescent activated 20:40 Smoke coming from 2 m wood target 23:15 Smoke coming from 3 m wood target 30:30 Lintel spalls 35:00 Top third of opening 2 m wide (plasterboard at sides fails) 41:00 Opening 2 m wide over full height 42:40 2 m wood target falls from stand Fire left to burn out naturally 90:00 Data logging stopped Table 19 - Experiment 2 observations
Experiment 2 – results
When clearing the debris from the fire, it was noted that much more of the fuel had been consumed at the front of the compartment when compared to the back.
Figure 17 shows the spatially-averaged temperature of the three thermocouples mounted 1 m below the ceiling (at approximately the centre height of the opening) on grid lines 2 and 3 and some of the key events during the experiment.

38 Final Work Stream Report BD 2887 (D23V2) 286855
Commercial in confidence © Building Research Establishment Ltd 2015
Printed on environmentally friendly paper
Figure 17 - Average temperature below ceiling and key events for Experiment 2
To illustrate the severity of the conditions in the compartment, Figure 18 shows a comparison between the average temperature 1 m below the ceiling and the standard “fire resistance” curves.
Figure 18 - Average temperature 1 m below ceiling and standard “fire resistance curves” for Experiment 2
Figure 19 summarises the development of the fire using a series of “snapshots” of the data at key times during the experiment. This shows an image of the fire, the vertical temperature profile at location C3 (above the back centre crib), a calculation of heat release rate based on the weighing platform data as described previously, maximum temperature recorded and the radiation intensity 4 m from the centre of the opening.

39 Final Work Stream Report BD 2887 (D23V2) 286855
Commercial in confidence © Building Research Establishment Ltd 2015
Printed on environmentally friendly paper
Heat release rate 1.3 MW
Maximum Temperature 180°C
Radiation intensity at 4 m, 0.03 kW/m2
5 minutes (Pre flashover)
Heat release rate 1.3 MW
Maximum Temperature 593°C
Radiation intensity at 4 m, 0.47 kW/m2
10 minutes (Flashover)
Heat release rate 1.3 MW
Maximum Temperature 788°C
Radiation intensity at 4 m, 1.3 kW/m2
11 minutes (Post flashover)
Heat release rate No data
Maximum Temperature 837°C
Radiation intensity at 4 m, 2.5 kW/m2
15 minutes
Heat release rate 1.9 MW
Maximum Temperature 966°C
Radiation intensity at 4 m, 4.0 kW/m2

40 Final Work Stream Report BD 2887 (D23V2) 286855
Commercial in confidence © Building Research Establishment Ltd 2015
Printed on environmentally friendly paper
20 minutes
Heat release rate 2.3 MW
Maximum Temperature 1127°C
Radiation intensity at 4 m, 8.0 kW/m2
30 minutes
Heat release rate 2.7 MW
Maximum Temperature 1190°C
Radiation intensity at 4 m, 10.6 kW/m2
40 minutes
Heat release rate No data
Maximum Temperature 1195°C
Radiation intensity at 4 m, 9.6 kW/m2
50 minutes
Figure 19 - Time line for Experiment 2
An indicative column element with an intumescent coating was present in the rig under the ceiling near location C3. Figure 20 shows the temperature history at three points on the element.

41 Final Work Stream Report BD 2887 (D23V2) 286855
Commercial in confidence © Building Research Establishment Ltd 2015
Printed on environmentally friendly paper
Figure 20 - Temperatures of indicative column element for Experiment 2
The rise in temperature after ~35 minutes indicates failure of the protective coating on the indicative column.
Experiment 3 – details and observations
Date and time: 17th December 2013 at 15:00
Ventilation: Wall opening 1.5 m wide, 1.0 m high, sill 0.9 m above floor.
Ventilation factor ( ) = 1.5 m3/2
Opening Factor ( ) = 1.5/47.5 = 0.032 m1/2
Insulation: Low (see Table 15)
Thermal inertia, b = 660 J/m2s1/2K
Fire load: Six wood cribs, fire load = 570 MJ/m2
Observations: Laboratory ambient temperature 9°C prior to ignition

42 Final Work Stream Report BD 2887 (D23V2) 286855
Commercial in confidence © Building Research Establishment Ltd 2015
Printed on environmentally friendly paper
Time
(mins: secs)
Observation
-5:00 Ignition countdown started: data logging begins 0:00 Ignition started 1:30 Ignition established, lower section of opening in place 1:50 Buoyant smoke plume rising from compartment 8:28 Intumescent starts to activate 11:57 Flames just starts to come out of opening 12:50 Intermittent flames out of opening 14:28 Back of compartment visible 16:16 Back of compartment visible; appears as though one crib is out 23:00 Flashover 23:29 Fire “picking up” 28:25 Insulation went 32:35 Back of compartment visible 35:30 Test terminated due to development of severe cracks in structure of rig 90:00 Data logging stopped Post test Due to the damage to the experimental rig that occurred, it was decided not
attempt another experiment with exposed blockwork until the end of the programme.
Table 20 - Experiment 3 observations
Experiment 3 – results
Figure 21 shows the spatially-averaged temperature of the six thermocouples mounted 1 m below the ceiling (at approximately the centre height of the opening) and some of the key events during the experiment.
Figure 21 - Average temperature 1m below the ceiling and key events for Experiment 3

43 Final Work Stream Report BD 2887 (D23V2) 286855
Commercial in confidence © Building Research Establishment Ltd 2015
Printed on environmentally friendly paper
To illustrate the severity of the conditions in the compartment, Figure 22 shows a comparison between the average temperature 1 m below the ceiling and the “fire resistance” curves.
Figure 22 - Average temperature 1 m below the ceiling and “fire resistance curves” for Experiment 3
Figure 23 summarises the development of the fire using a series of “snapshots” of the data at key times during the experiment. This shows an image of the fire, the vertical temperature profile at location C3 (above the back centre crib), a calculation of heat release rate based on the weighing platform data as described previously, maximum temperature recorded and the radiation intensity 4 m from the centre of the opening.

44 Final Work Stream Report BD 2887 (D23V2) 286855
Commercial in confidence © Building Research Establishment Ltd 2015
Printed on environmentally friendly paper
Heat release rate --No data
Maximum Temperature 219°C
Radiation intensity at 4 m, 0.01 kW/m2
5 minutes
Heat release rate No data
Maximum Temperature 647°C
Radiation intensity at 4 m, 0.43 kW/m2
10 minutes
Heat release rate 1.8 MW
Maximum Temperature 728°C
Radiation intensity at 4 m, 1.1 kW/m2
15 minutes
Heat release rate 1.8 MW
Maximum Temperature 731°C
Radiation intensity at 4 m, 1.34 kW/m2
20 minutes

45 Final Work Stream Report BD 2887 (D23V2) 286855
Commercial in confidence © Building Research Establishment Ltd 2015
Printed on environmentally friendly paper
Heat release rate 1.8 MW
Maximum Temperature 797°C
Radiation intensity at 4 m, 1.7 kW/m2
23 minutes (flashover)
Heat release rate 1.8 MW
Maximum Temperature 884°C
Radiation intensity at 4 m, 2.4 kW/m2
25minutes
Heat release rate 1.8 MW
Maximum Temperature 910°C
Radiation intensity at 4 m, 2.7 kW/m2
27 minutes (Left hand side panel moves)
Heat release rate 1.8 MW
Maximum Temperature 942°C
Radiation intensity at 4 m, 3.2 kW/m2
29 minutes
Figure 23 – Timeline for Experiment 3
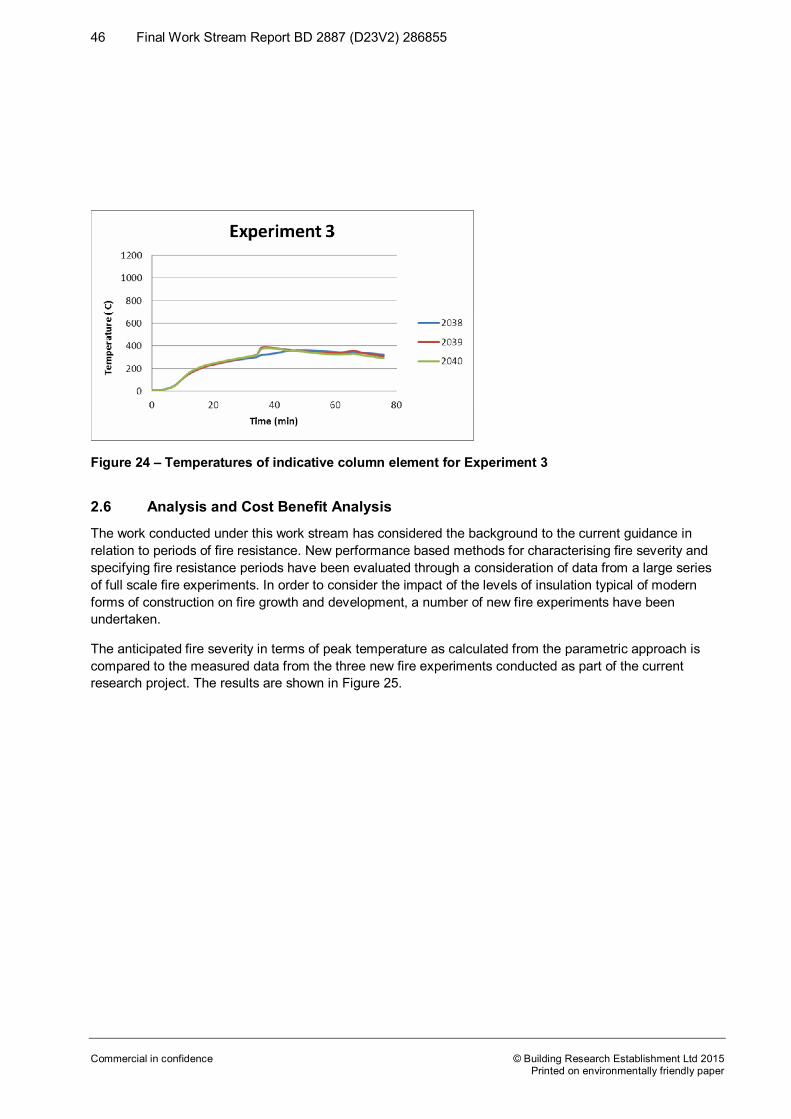
An indicative column element with an intumescent coating was present inside the rig under the ceiling near location C3. Figure 24 shows the temperature history at three points on the element.
46 Final Work Stream Report BD 2887 (D23V2) 286855
Commercial in confidence © Building Research Establishment Ltd 2015
Printed on environmentally friendly paper
Figure 24 – Temperatures of indicative column element for Experiment 3
2.6 Analysis and Cost Benefit Analysis
The work conducted under this work stream has considered the background to the current guidance in relation to periods of fire resistance. New performance based methods for characterising fire severity and specifying fire resistance periods have been evaluated through a consideration of data from a large series of full scale fire experiments. In order to consider the impact of the levels of insulation typical of modern forms of construction on fire growth and development, a number of new fire experiments have been undertaken.
The anticipated fire severity in terms of peak temperature as calculated from the parametric approach is compared to the measured data from the three new fire experiments conducted as part of the current research project. The results are shown in Figure 25.

47 Final Work Stream Report BD 2887 (D23V2) 286855
Commercial in confidence © Building Research Establishment Ltd 2015
Printed on environmentally friendly paper
Figure 25 - Measured/predicted peak temperatures for the Work stream 1 experiments
The corresponding relationship for time to peak temperature is illustrated in Figure 26.
Figure 26 - Measured/predicted time to peak temperatures for Work stream 1 experiments

48 Final Work Stream Report BD 2887 (D23V2) 286855
Commercial in confidence © Building Research Establishment Ltd 2015
Printed on environmentally friendly paper
The results show a good correlation between the predicted and measured values. The reason for the low values in Figure 25 was mainly due to the requirement to terminate the experiment to prevent more extensive damage to the fire compartment.
The work considered under this work stream has provided validation for design methods already in the public domain and already in widespread use. As a consequence, there are no specific changes proposed to either the guidance or the regulations therefore a Cost Benefit Analysis is not required for this work stream.
3 Discussion on structural fire engineering design This report has considered the scope and applicability of performance based methods for characterising fire severity through a comparison with data from full scale fire experiments. Specifically, the parametric approach set out in BS EN 1991-1-2 and the time equivalent methodology underpinning the alternative approach to specifying fire resistance periods in BS 9999 have been considered.
In terms of specifying fire resistance for elements of structure, the BS 9999 approach allows the designer to choose from either a “prescriptive” specification (Table 25) that mirrors Table A2 of Approved Document B or an alternative approach (Table 26) that requires the designer to check if ventilation conditions permit the use of the table.
The values in Table 26 were developed by a Task Group under the auspices of the British Standards Institution. The tabulated values were derived from extensive fire engineering calculations based upon a time equivalent approach to specifying fire resistance periods which incorporated parametric fire calculations, heat transfer to protected structural steel elements and a Monte Carlo method to incorporate a large number of variable parameters used as input to the initial compartment fire calculations. The analysis procedure is as follows:
1. Calculate natural (parametric) fire curve for specific parameters (O, b, qfd) within a specified range.
2. Calculate the temperature of a structural member exposed to the natural fire curve using the fundamental principles of heat transfer – for steel beams, the protection thickness is specified such that the steel temperature does not exceed 550°C.
3. Calculate the temperature history for the same member when subject to the standard fire curve.
4. The time equivalent period (for this fire curve) is the time taken to reach 550°C under the standard fire curve.
This procedure is repeated many times using the Monte Carlo method to develop the cumulative frequency distribution.
While the fundamental calculations in relation to parametric fire exposure and time equivalence have been validated within the current project for the range of parameters considered in the experimental work, there are a number of issues within the derivation of the tabulated BS 9999 fire resistance periods that require further consideration. These include:
• Risk analysis. The outputs from the fire engineering analysis (cumulative plot of equivalent fire resistance periods) were quantified in terms of risk to life safety depending upon the height of the building. A decision was made to determine what risk is deemed to be acceptable by relating a specific height and occupancy type to a particular value from the cumulative plot. A time equivalent

49 Final Work Stream Report BD 2887 (D23V2) 286855
Commercial in confidence © Building Research Establishment Ltd 2015
Printed on environmentally friendly paper
period of 60 minutes was chosen to apply to an office building of 18 m height. This corresponds to a fractile value of 80%. In this case, this corresponds to 80% of the cases considered in the Monte Carlo analysis for that specific occupancy having a time equivalent value less than 60 minutes. This provides a fixed point from which the risk associated with height (and occupant awareness and mobility) can be varied.
• Suppression. The influence of a sprinkler system is accounted for by multiplying the fire load density by 0.61 to provide a reduced cumulative plot of equivalent fire resistance periods for each occupancy type. This factor was derived as part of the Natural Fire Safety Concept25 based on a semi-probabilistic approach to derive an acceptable target failure probability (pt) of 7.23 x 10⁻⁵ per building life (1.3 x 10⁻⁶ per year).
• Occupant awareness and mobility. The tabulated values in BS 9999 incorporate the influence of occupant awareness and mobility with respect to evacuation characteristics. Specifically, the impact of sleeping risk is related to an increased fire resistance requirement by moving up a consequence rating. A similar approach is adopted in areas such as medical care facilities incorporating horizontal evacuation within a place of safety. In such cases, the consequence rating is increased by two categories.
• New height categories. Two new height categories have been introduced at 11 m and 60 m to provide a more rational approach to probability of fire occurrence and consequence of failure.
The current project has provided a justification for the basic analytical methodology underpinning the tabulated approach in BS 9999 with specific reference to the parametric time-temperature calculations and the concept of time equivalence. However, the cumulative distribution curves for the various occupancies have been derived based on a single “failure” temperature related to a time taken for a protected steel section to achieve a specific temperature. The question arises as to the relevance of this to other forms of construction. In some ways the outcome can be seen as material independent as it is really just a means of quantifying severity in a comparative manner. Certainly, the current prescriptive approach does not attempt to define different periods of fire resistance for different structural elements based on specific mechanisms of failure. It should be possible to derive similar curves based on a specific limiting temperature for a specific reinforced concrete beam, although the heat transfer calculations would be somewhat more complicated. Similarly, there is no reason in principle why similar calculations could not be undertaken on a protected timber floor joist with “failure” based on a specified charring rate. However, this approach would require a great deal of effort and the current state of knowledge with regard to the performance of such elements in fire is limited.
One potential approach is to derive similar values based on a time equivalent calculation approach. Although the original purpose of the time equivalent methodology was to enable fire severity to be evaluated in terms of an equivalent period of heating of a protected steel member in a standard furnace test, it has been used (within BS EN 1992-1-2) to derive fire resistance periods independent of the form of construction. Such an approach would still need to incorporate probabilistic methods to take into account issues such as height of the building, occupant awareness and mobility, etc.
The inclusion of a new table of fire resistance periods alongside the existing Table A2 in AD B is not a sensible approach as designers will undoubtedly “cherry pick” the lowest values from each table. Replacing the existing Table A2 (and Table A1) is one option. The new approach to specifying fire resistance periods set out by the BS 9999 Task Group is a serious attempt to produce a scientifically derived methodology that takes into account the principal parameters influencing fire growth and development. It could be argued that

50 Final Work Stream Report BD 2887 (D23V2) 286855
Commercial in confidence © Building Research Establishment Ltd 2015
Printed on environmentally friendly paper
it incorporates factors (such as thermal properties of compartment linings) that are not taken account of in the current prescriptive approach. However, there are a number of areas that require further investigation. A third option would be to reference the design approach within BS 9999 and that of BS EN 1991-1-2 without providing any further technical or supporting guidance. This would simply be a means of legitimising the current situation with the possibility of including further information on the scope of applicability of the various methods and the degree of competence required to apply them.
To illustrate the importance of a variation in specific parameters, the time equivalent calculation methodology has been used to consider a limited variation in parameters for a compartment with a plan floor area of 12 m by 12 m, a floor to ceiling height of 3.6 m and lined with plasterboard to give a value for thermal diffusivity of 720 J/m²s½K. A variation in fire load density covering the average, 80%, 90% and 95% fractiles for fixed conditions of a single ventilation opening with a width of 7.2 m and a height of 3.4 m was considered. The fire load density was then fixed at the 80% fractile value and the width of the single ventilation opening varied and the final case considered the influence of a reduction in the height of the ventilation opening.
The cases considered are summarised in Table 21 and illustrated in Figure 27.
Case Fire load density qf,d
(MJ/m²)
Height of ventilation opening hv
(m)
Width of ventilation opening wv
(m)
1a 420 3.4 7.2
1b 570 3.4 7.2
1c 670 3.4 7.2
1d 760 3.4 7.2
2a 570 3.4 7.2
2b 570 3.4 5.0
2c 570 3.4 3.0
2d 570 3.4 2.0
3a 570 3.4 7.2
3b 570 2.5 7.2
3c 570 1.5 7.2
3d 570 1.0 7.2
Table 21 - Cases considered for study of influence of variation in fire load density and ventilation conditions using EN 1991-1-2 time equivalent calculation

51 Final Work Stream Report BD 2887 (D23V2) 286855
Commercial in confidence © Building Research Establishment Ltd 2015
Printed on environmentally friendly paper
Figure 27 - Effect of variation in fire load density and ventilation conditions
In this simple study, Case 1b could be seen as the base case representing a fire load density corresponding to the 80% fractile usually adopted for fire engineering design calculations. Reductions to the area of the ventilation opening increase the equivalent severity of the fire relative to this base case. Using this method, it is possible to construct a cumulative distribution as shown in Figure 28 without recourse to either parametric fire calculations or heat transfer to protected structural steel elements.

52 Final Work Stream Report BD 2887 (D23V2) 286855
Commercial in confidence © Building Research Establishment Ltd 2015
Printed on environmentally friendly paper
Figure 28 - Cumulative distribution for limited case study using Eurocode time equivalent calculation
The use of a Monte Carlo technique to account for the influence of design variables has a number of advantages. It can be used to determine which variables have the greatest influence on the severity of the fire and which are relatively unimportant. It is clear from the simple study above that ventilation has a significant impact on calculated severity where a reduction in either the height or the width of the opening can result in a calculated equivalent severity of more than twice the base value.
The attempt to produce a simplified table for use by those without any specialist fire engineering knowledge is a worthy aim. However, compartment fire behaviour is difficult to predict and even small changes to specific parameters can have a marked effect on fire severity. In terms of fire resistance, requirements should be related to either a known and accepted standard of reliability, as represented by the guidance in AD B, or by an alternative procedure, supported by an understanding of the principles of fire dynamics and a knowledge of structural fire engineering.
The existing tabulated guidance in AD B is by no means perfect and it is entirely possible that the changes proposed in the Table 26 approach in BS 9999 are a more accurate representation of the risk in relation to life safety. However, if they are to be used alongside AD B guidance, then designers will simply cherry pick the lowest value for their particular circumstance. If the Table 26 values were to replace the existing guidance then this would have a profound effect on the nature of the UK construction market and the relative competitiveness of specific sectors of the industry.

53 Final Work Stream Report BD 2887 (D23V2) 286855
Commercial in confidence © Building Research Establishment Ltd 2015
Printed on environmentally friendly paper
4 Conclusions The principal objective of this work stream was to produce robust evidence and data to explore the potential to adopt a more flexible approach to the specification of fire resistance periods in Approved Document B. Alternative methodologies for determining compartment fire severity and specifying fire resistance periods have been evaluated and validated within specific limitations as part of this work stream.
The fire tests undertaken in support of this work stream have demonstrated that enhanced levels of thermal insulation result in higher peak temperatures within the compartment and higher levels of thermal radiation from the compartment to adjacent buildings. It is important that this issue is considered in any future revision of regulatory guidance for fire safety.
The calculation methods set out in BS EN 1991-1-2 and used to develop the alternative tables in BS 9999 provide an accurate prediction of compartment peak temperature and overall fire duration for a range of different parameters and are capable of taking into account the impact of high levels of thermal insulation on fire growth and development as represented by the thermal diffusivity present in modern buildings which typically range from 300 to 1500 J/m²s½K. The conclusion is based on comparison with experimental results covering a number of different compartment sizes, geometries, ventilation conditions and fuel loads. However, the scope of validation only covers fire compartments with a floor area up to 378 m². Beyond this value, the parametric fire calculations may still be used but will tend to yield unduly conservative results. This is because the parametric approach assumes a single zone temperature distribution with the maximum value present throughout the compartment when, in reality, there will be significant spatial temperature variations throughout any large fire compartment.
The calculation methods in BS EN 1991-1-2 and BS 9999 are currently in the public domain and are widely used as an alternative approach to the guidance set out in Table A2 of AD B. Consideration could be given to making a specific reference to these approaches as part of an overall fire engineering strategy within any subsequent revision of AD B.
5 Acknowledgements The authors, Tom Lennon and Richard Chitty, would particularly like to acknowledge the valuable contribution provided by the following:
• Satellite Steering Group A and the overall Project Steering Group.
• BRE colleague: Corinne Williams.
• BRE project team members: Luke Bisby, University of Edinburgh and Neal Butterworth, Arup Fire.
• BRE experimental team for Experiments 1 to 6: Tom Lennon, Phil Clark, Simon Barrow, Harry Granados.
• Steering Group member companies who contributed materials for construction, rig linings and indicative test specimens for BRE Experiments 1 to 6: The Concrete Centre - beam and block floor and blocks for walls, ASFP- plasterboard for linings, insulation blanket, and protected steel indicative specimens.
• Steering Group members who provided specialist advice in relation to the construction of the experimental rig.

54 Final Work Stream Report BD 2887 (D23V2) 286855
Commercial in confidence © Building Research Establishment Ltd 2015
Printed on environmentally friendly paper
6 References 1. Department for Communities and Local Government. The Building Regulations 2010 (England).
Approved Document B: Fire safety. Volume 1: Dwelling houses (2006 edition incorporating 2010 and 2013 amendments). Volume 2: Buildings other than dwelling houses (2006 edition incorporating 2010 and 2013 amendments).
2. British Standards Institution. BS EN 1991-1-2 Eurocode 1: Actions on structures – Part 1-2: General actions – actions on structures exposed to fire, London, 2002.
3. British Standards Institution. BS 9999 Code of practice for fire safety in the design, management and use of buildings, London, 2008.
4. Post-War Building Studies No. 20 Fire Grading of Buildings Part 1 General Principles and Structural Precautions by a Joint Committee of the Building Research Board of the Department of Scientific & Industrial Research and of the Fire Offices’ Committee, His Majesty’s Stationery Office, London, 1946.
5. CIB W14 Workshop Report, Design Guide: Structural Fire Safety, Fire Safety Journal, Volume 10, No. 1, pp 77-154, 1986.
6. British Standards Institution. PD 7974-1 Application of fire safety engineering principles to the design of buildings – Part 1: Initiation and development of fire within the enclosure of origin (Sub-system 1), London, 2003.
7. Fong Carmen C S and Chow W K, Fire load density survey in four shopping malls in Hong Kong, International Journal on Engineering Performance-Based Fire Codes, volume 10, number 1, pp.12-16, 2011.
8. Zalok E, Validation of Methodologies to Determine Fire Load for Use in Structural Fire Protection, Final Report, The Fire Protection Research Foundation, Maryland, 2011.
9. Zalok E, Design Fires for Commercial Premises, Workshop on Design Fires, Ottawa Ontario, May 2005.
10. Bukowski R W, Determining Design Fires for Design-level and Extreme Events, SFPE 6th International Conference on performance-Based Codes and Fire Safety Design Methods, Tokyo, June 2006.
11. Hadjisophocleous G, Fire Loads and their use in Fire Protection Design, Carleton University, SFPE Keynote Presentation, October 2012.
12. Hietaniemi J and Mikkola E, Design Fires for Fire Safety Engineering, VTT Working Papers 139, 2010.
13. Moore D B and Lennon T, Fire engineering design of steel structures, Progress in Structural Engineering and Materials, volume 1, number 1, September 1997.
14. Wald F, Simoes da Silva L, Moore D B, Lennon T, Chaldna M, Santiago A, Benes M and Borges L, Experimental behaviour of a steel structure under natural fire, New Steel Construction, March 2005.

55 Final Work Stream Report BD 2887 (D23V2) 286855
Commercial in confidence © Building Research Establishment Ltd 2015
Printed on environmentally friendly paper
15. Wainman D E, Temperature data recorded during a natural fire test at BRE Cardington on November 4th 1998, British Steel Swinden Technology Centre S3019, 1999.
16. Lennon T, Precast Hollow core slabs in fire, BRE Information Paper IP 5/03, IHS BRE Press, 2003.
17. Bailey C, Holistic behaviour of concrete buildings in fire, Proceedings of the Institution of Civil Engineers, Structures & Buildings 149, Issue 4, 2002.
18. Lennon T and Moore D B, The natural fire safety concept – full-scale tests at Cardington, Fire Safety Journal, volume 38, 2003.
19. Lennon T and Hopkin D, Fire performance of light steel-frame buildings, BRE Information Paper IP 6/11, IHS BRE Press, 2011.
20. Kirby B R, Wainman D E, Tomlinson L N, Kay T R and Peacock B N, Natural Fires in Large Scale Compartments, A British Steel Technical, Fire Research Station Collaborative Project, Swinden Laboratories, 1994.
21. Bailey C G and Lennon T, Full-scale fire tests on hollow core floors, The Structural Engineer, volume 86, number 6, March 2008.
22. Lennon T, Bullock M J and Enjily V, The fire resistance of medium-rise timber frame buildings, Proceedings of the World Conference on Timber Engineering WCTE 2000, Whistler, British Columbia, Canada, 2000.
23. Lennon T and Hopkin D, Fire Performance of Structural Insulated Panel Systems, BRE Information Paper IP 21/10, IHS BRE Press, 2010.
24. Heselden A J M, Smith P G and Theobald C R, Fires in a large compartment containing structural steelwork, detailed measurements of fire behaviour, Fire Research Note No. 646, 1966.
25. Schleich J-B, Cajot L-G et al, UK version of the essentials of the Final report of the research project - Natural Fire Safety Concept Valorisation, ECSC Research, CEC agreement 7215 – PA/PB/PC – 042 and -057, 20th August 2001.

56 Final Work Stream Report BD 2887 (D23V2) 286855
Commercial in confidence © Building Research Establishment Ltd 2015
Printed on environmentally friendly paper
Appendix A – Summary of the Research
Building Regulations and Standards Division, Department for Communities and Local Government (DCLG) commissioned BRE to carry out a project titled “Compartment sizes, resistance to fire and fire safety”. The main aim of this project was to produce robust evidence and data based on research, experimental fire testing, computer modelling and laboratory testing, where necessary, on a number of linked work streams in relation to fire safety and associated provisions in Schedule 1 of Part B of the Building Regulations 2010.
This Final work stream report describes the findings of the research for Work stream 1 – Periods of fire resistance. The aim of this work stream was to produce robust evidence and data to explore the potential to adopt a more flexible approach to the specification of fire resistance periods in Approved Document B.
The work conducted under this work stream has considered the background to the current guidance in relation to periods of fire resistance. New performance based methods for characterising fire severity and specifying fire resistance periods have been evaluated through a consideration of data from a large series of full scale fire experiments. In order to consider the impact of the levels of insulation typical of modern forms of construction on fire growth and development a number of new fire experiments have been undertaken. Alternative methodologies for determining compartment fire severity and specifying fire resistance periods have been evaluated and validated as part of this work stream.
The fire tests undertaken in support of this work stream have demonstrated that enhanced levels of thermal insulation result in higher peak temperatures within the compartment and higher levels of thermal radiation from the compartment to adjacent buildings. It is important that this issue is considered in any future revision of regulatory guidance for fire safety.
The calculation methods set out in BS EN 1991-1-2 and used to develop the alternative tables in BS 9999 provide an accurate prediction of compartment peak temperature and overall fire duration for a range of different parameters and are capable of taking into account the impact of high levels of thermal insulation on fire growth and development as represented by the thermal diffusivity present in modern buildings which typically range from 300 to 1500 J/m²s½K. The conclusion is based on comparison with experimental results covering a number of different compartment sizes, geometries, ventilation conditions and fuel loads. However, the scope of validation only covers fire compartments with a floor area up to 378 m². Beyond this value, the parametric fire calculations may still be used but will tend to yield unduly conservative results. This is because the parametric approach assumes a single zone temperature distribution with the maximum value present throughout the compartment when, in reality, there will be significant spatial temperature variations throughout any large fire compartment.
The calculation methods in BS EN 1991-1-2 and BS 9999 are currently in the public domain and are widely used as an alternative approach to the guidance set out in Table A2 of AD B. Consideration could be given to making a specific reference to these approaches as part of an overall fire engineering strategy within any subsequent revision of AD B.