department of agriculture cotton: foreign world markets
TRANSCRIPT

For an email subscription, click here to register: https://public.govdelivery.com/accounts/USDAFAS/subscriber/ new.
Approved by the World Agricultural Outlook Board/USDA
Global Consumption Rises Above Production, Stocks Fall USDA’s initial forecast for 2015/16 shows world consumption exceeding production for the first time in 6 years. As a result world stocks will decrease by almost 4 percent to 106.5 million bales; however, the stocks-to-use ratio of 92 percent will remain near historic highs.
World production is forecast to fall nearly 7 percent in response to lower prices in most major producing regions. India is forecast to decline only slightly as its support policy protects farmers from world prices decline. China is expected to fall by 10 percent to the lowest level since 2003, led by a steep decline in eastern provinces due to the less generous level of support under the current program. Xinjiang will likely decline slightly in response to a reduced target price and efforts to exclude unregistered land from receiving subsidies. An 11 percent drop is projected for the U.S. as harvested area responds to lower prices.
World consumption is forecast to increase by 3.5 percent, based on world GDP growth and the lagged effect of falling cotton prices. China is forecast to increase at less than the world rate as domestic policies keep cotton prices above world prices despite its massive stock level. Structural changes in China’s
spinning sector will limit growth. Outside of China, growth is expected to be focused in those countries which have benefited from the situation in China. India, Pakistan, and Southeast Asian countries in particular are expected to continue to experience spinning growth.
United States Department of Agriculture Foreign Agricultural Service May 2015
Cotton: World Markets and Trade

Despite rising demand in import dependent counties such as Pakistan and Southeast Asia, world trade is expected to virtually unchanged. Imports in China are expected to fall to the lowest level in 13 years due to continuing import restrictions accompanying efforts to reduce government-held stocks. India’s exports are expected to increase sharply in response to the large carry-in stocks that resulted from this season’s support policy. Australia’s exports are expected to decline due to a second season of unfavorable weather and planting conditions. Overview
For 2015/16, world stocks are expected to decrease for the first time in five years due to growing consumption outside of China, a reduction in China’s stocks, and lower global production. Continued low prices are expected to weigh on global production. Trade is down, largely due to continued declines in Chinese imports. The U.S. season average farm price is projected at 60 cents/pound, with the mid-point unchanged from the current season estimate. For 2014/15, world production is relatively unchanged. World trade, use, and stocks are raised. Forecasts for the U.S. for 2014/15 are unchanged. The forecast for the U.S. season average farm price is maintained at 60 cents/pound. For current prices received by farmers click here; NASS farm price Prices Market concerns over tightening supplies of desirable cotton grades have helped push the A-Index and spot prices up to levels not seen since the beginning of the season. For more information on U.S. spot price click here; AMS Cotton Market News
For more information on U.S. export sales click here; FAS Export Sales Query System
Foreign Agricultural Service/USDA May 2015Office of Global Analysis

2015/16 TRADE OUTLOOK Major Exporters:
• India is up 1.1 million bales to 5.0 million on higher carry-in stocks.
• Australia is cut 800,000 bales to 2.0 million on lower production.
• Brazil is cut 400,000 bales to 3.6 million on lower exportable supply.
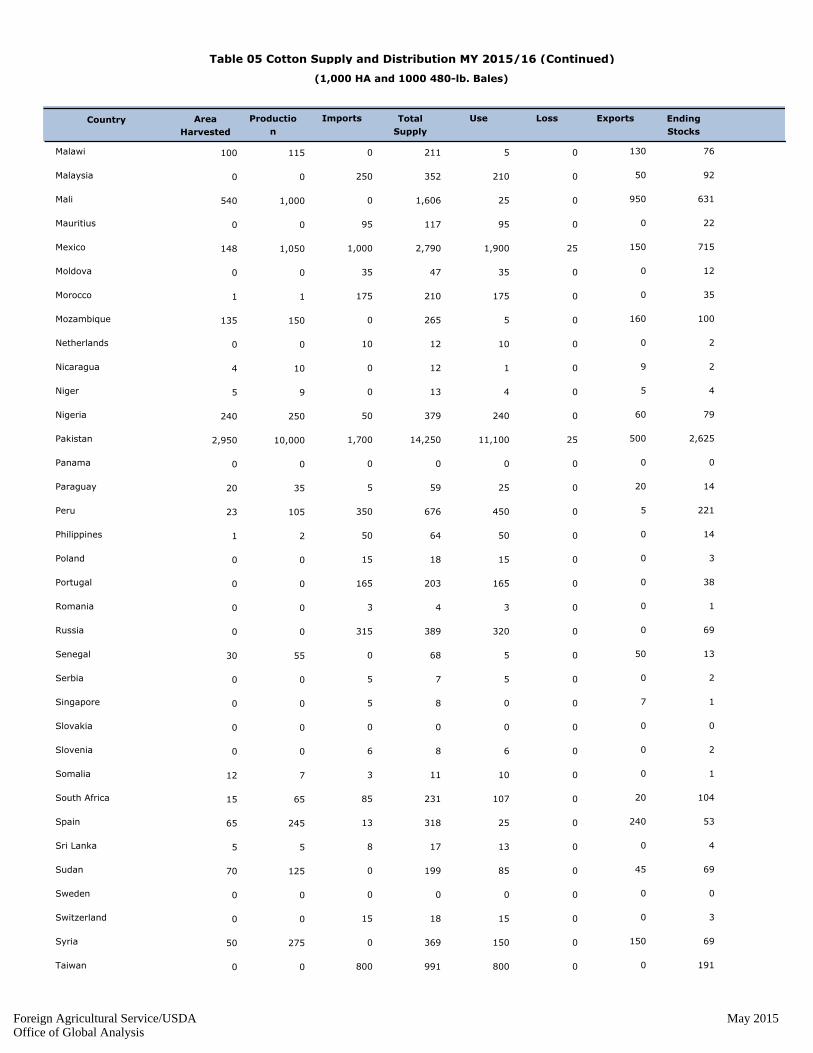
• Mali is up 250,000 bales to 950,000 on two years of large crops.
Major Importers:
• China is reduced 1.7 million bales to 6.0 million on continuing policy constraints.
• Pakistan is raised 900,000 bales to 1.7 million on lower production and rising use.
• India is lowered 200,000 bales to 900,000 on large available stocks.
• Mexico is up 175,000 bales to 1.0 million on lower production and rising use.
• Indonesia is raised 150,000 bales to 3.5 million on rising use.
• Bangladesh is increased 100,000 bales to 4.6 million on consistently growing demand.
• Brazil is increased 100,000 bales to 150,000 on lower exportable supplies and rising use.
• Egypt is up 100,000 bales to 450,000 on greatly reduced production due to policy changes.
• Vietnam is increased 100,000 bales to 4.2 million on rising use.
2014/15 TRADE CHANGES Major Exporters:
• Malaysia is cut 700,000 bales to 100,000 on greatly reduced transit trade.
• Brazil is raised 150,000 bales to 4.0 million on strong demand for machine picked cotton.
• Cote d’Ivoire is raised 75,000 bales to 800,000 on strong deliveries, especially to Far Eastern markets.
• Pakistan is reduced 50,000 bales to 550,000 on recent slower activity.
Major Importers:
• Malaysia is cut 850,000 bales to 300,000 on greatly reduced transit trade.
• China is raised 200,000 bales to 7.7 million on strong demand for high grades of cotton.
• Pakistan is raised 100,000 bales to 800,000 on strong mill use and deliveries.
Foreign Agricultural Service/USDA May 2015Office of Global Analysis

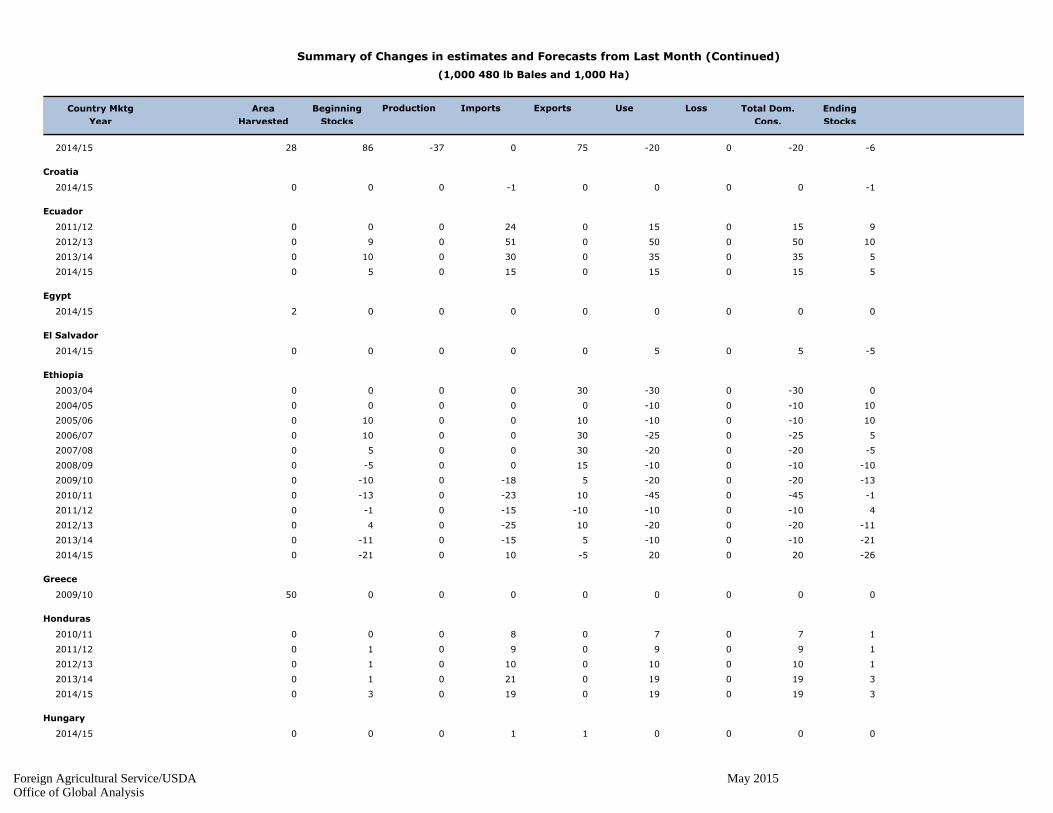
HISTORICAL SERIES CHANGES (see Summary of Changes table for details)
• Spain production, export, use, and stock data is adjusted for the period 2000/01 to 2014/15.
• Lesotho is added to the database as an importer with data from 2002/03 to 2014/15
• Ethiopia export, import, use, and stock data is adjusted for the period 2003/04 to 2014/15.
• Benin export and stock data is adjusted for the period 2004/05 to 2014/15.
• South Africa export, import, use, and stock data is adjusted for the period 2004/05 to 2014/15.
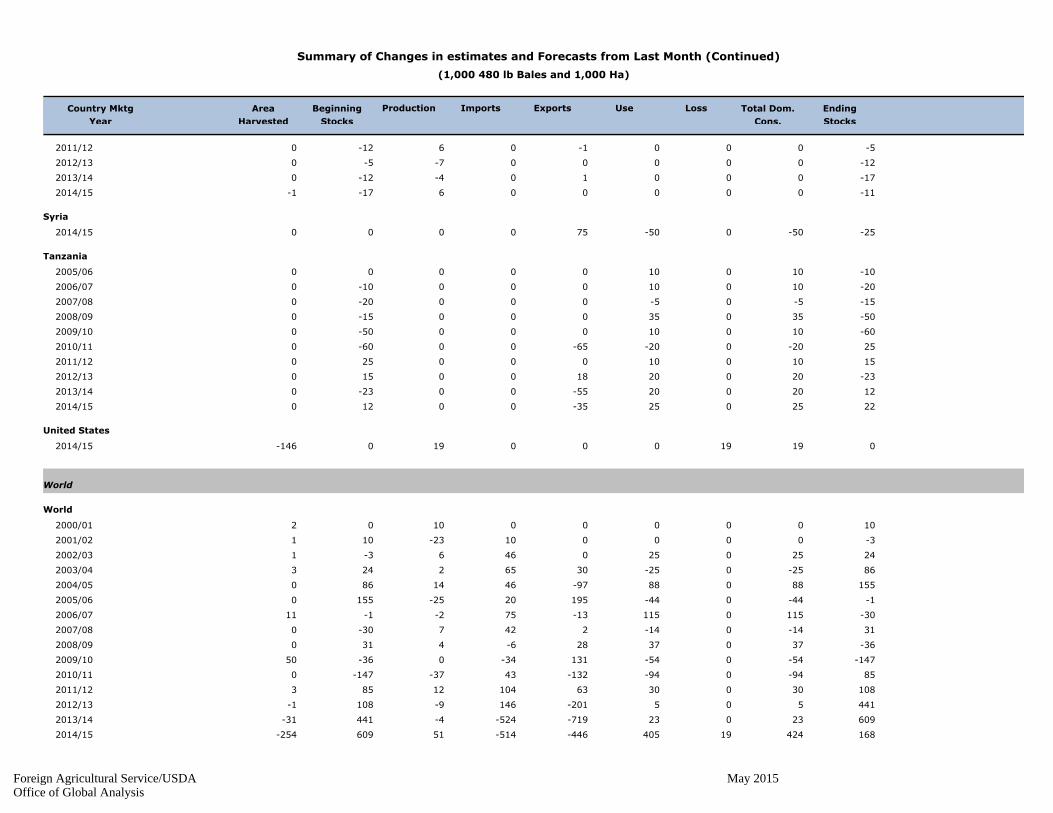
• Tanzania export, use, and stock data is adjusted for the period 2005/06 to 2014/15.
• Cote d’Ivoire export, use, and stock data is adjusted for the period 2006/07 to 2014/15.
• Albania import, use, and stock data is adjusted for the period 2006/07 to 2014/15
• Bahrain import, use, and stock data is adjusted for the period 2010/11 to 2014/15.
• Honduras import, use, and stock data is adjusted for the period 2010/11 to 2014/15.
• Moldova import, use, and stock data is adjusted for the period 2010/11 to 2014/15
• Argentina use and stock data is adjusted for the period 2010/11 to 2014/15.
• Ecuador import, use, and stock data is adjusted for the period 2011/12 to 2014/15.
• Burma production, import, and stock data is adjusted for the period 2011/12 to 2014/15.
Foreign Agricultural Service/USDA May 2015Office of Global Analysis

The Foreign Agricultural Service (FAS) updates its production, supply and distribution (PSD) database for cotton, oilseeds, and grains at 12:00 p.m. on the day the World Agricultural Supply and Demand Estimates (WASDE) report is released. This circular is released by 12:15 p.m.
FAS Reports and Databases: Current World Market and Trade and World Agricultural Production Reports:
http://apps.fas.usda.gov/psdonline/psdDataPublications.aspx Archives World Market and Trade and World Agricultural Production Reports:
http://usda.mannlib.cornell.edu/MannUsda/viewTaxonomy.do?taxonomyID=7 Production, Supply and Distribution Database (PSD Online): http://apps.fas.usda.gov/psdonline/psdHome.aspx Global Agricultural Trade System (U.S. Exports and Imports):
http://apps.fas.usda.gov/gats/default.aspx Export Sales Report:
http://apps.fas.usda.gov/esrquery/ Global Agricultural Information Network (Agricultural Attaché Reports):
http://gain.fas.usda.gov/Pages/Default.aspx Other USDA Reports: World Agricultural Supply and Demand Estimates (WASDE):
http://www.usda.gov/oce/commodity/wasde/ Economic Research Service:
http://www.ers.usda.gov/topics/crops National Agricultural Statistics Service:
http://www.nass.usda.gov/Publications/
Questions may be directed to:
James Johnson (202) 690-1546 [email protected]
Lyman Stone (202) 720-0683 [email protected]
Foreign Agricultural Service/USDA May 2015Office of Global Analysis

Summary of Changes in estimates and Forecasts from Last Month
(1,000 480 lb Bales and 1,000 Ha)
Country Mktg
Year
Area
Harvested
Beginning
Stocks
Production Imports Exports Use Loss Total Dom.
Cons.
Ending
Stocks
Albania
1-50-50-4000 2006/07
2-50-50-4010 2007/08
020200020 2008/09
2808010000 2010/11
215015015020 2011/12
314014015020 2012/13
315015015030 2013/14
315015015030 2014/15
Argentina
50-500-5000000 2010/11
100-500-50000500 2011/12
150-500-500001000 2012/13
275-1250-1250001500 2013/14
400-1250-125000275-20 2014/15
Armenia
-10000-1000 2013/14
-1-10-10-10-10 2014/15
Bahrain
020202000 2010/11
610010016000 2011/12
215015011060 2012/13
1020020028020 2013/14
1200200110100 2014/15
Bangladesh
-500000-50000 2014/15
Belarus
2-50-50-3000 2013/14
-3-50-50-10020 2014/15
Benin
100000-1000000 2004/05
-40000140001000 2005/06
5000-4500-400 2006/07
25000-200050 2007/08
25000000250 2008/09
00002500250 2009/10
125000-1250000 2012/13
Foreign Agricultural Service/USDA May 2015Office of Global Analysis

Summary of Changes in estimates and Forecasts from Last Month (Continued)
(1,000 480 lb Bales and 1,000 Ha)
Country Mktg
Year
Area
Harvested
Beginning
Stocks
Production Imports Exports Use Loss Total Dom.
Cons.
Ending
Stocks
1250000001250 2013/14
10000025001250 2014/15
Bolivia
420200603 2011/12
020200-24-1 2012/13
Brazil
-1500001500000 2014/15
Burkina
10000001002 2013/14
150000051020 2014/15
Burma
200002000 2011/12
400002020 2012/13
26000032-1040 2013/14
2600005-5260 2014/15
Cambodia
-1-10-10-2000 2012/13
-1-30-30-30-10 2013/14
-1-40-40-40-10 2014/15
Chad
-10000100000 2014/15
Chile
-10000-1000 2014/15
China
2000000200000 2014/15
Colombia
-12-100-1015-1580-2 2014/15
Cote d'Ivoire
10-100-1000000 2007/08
15-50-5000100 2008/09
-55-300-3010000150 2009/10
17-200-20-5200-550 2010/11
-13-200-205000170 2011/12
107-200-20-10000-130 2012/13
86-200-20250-1610788 2013/14
Foreign Agricultural Service/USDA May 2015Office of Global Analysis
Summary of Changes in estimates and Forecasts from Last Month (Continued)
(1,000 480 lb Bales and 1,000 Ha)
Country Mktg
Year
Area
Harvested
Beginning
Stocks
Production Imports Exports Use Loss Total Dom.
Cons.
Ending
Stocks
-6-200-20750-378628 2014/15
Croatia
-10000-1000 2014/15
Ecuador
915015024000 2011/12
1050050051090 2012/13
5350350300100 2013/14
515015015050 2014/15
Egypt
000000002 2014/15
El Salvador
-550500000 2014/15
Ethiopia
0-300-30300000 2003/04
10-100-1000000 2004/05
10-100-101000100 2005/06
5-250-253000100 2006/07
-5-200-20300050 2007/08
-10-100-101500-50 2008/09
-13-200-205-180-100 2009/10
-1-450-4510-230-130 2010/11
4-100-10-10-150-10 2011/12
-11-200-2010-25040 2012/13
-21-100-105-150-110 2013/14
-2620020-5100-210 2014/15
Greece
0000000050 2009/10
Honduras
170708000 2010/11
190909010 2011/12
110010010010 2012/13
319019021010 2013/14
319019019030 2014/15
Hungary
000011000 2014/15
Foreign Agricultural Service/USDA May 2015Office of Global Analysis

Summary of Changes in estimates and Forecasts from Last Month (Continued)
(1,000 480 lb Bales and 1,000 Ha)
Country Mktg
Year
Area
Harvested
Beginning
Stocks
Production Imports Exports Use Loss Total Dom.
Cons.
Ending
Stocks
India
100-1000-10000000 2012/13
1000000001000 2013/14
-20030003000001000 2014/15
Lesotho
525025030000 2002/03
1035035040050 2003/04
10750750750100 2004/05
15250250300100 2005/06
10500500450150 2006/07
15250250300100 2007/08
15250250250150 2008/09
20250250300150 2009/10
15450450400200 2010/11
15450450450150 2011/12
15650650650150 2012/13
10400400350150 2013/14
15250250300100 2014/15
Macedonia
0-50-50-5000 2012/13
-1-90-90-10000 2013/14
-2-140-140-150-10 2014/15
Malaysia
-30505-675-700000 2013/14
-19515015-700-8500-300 2014/15
Mali
00000000-30 2013/14
6000000600-32 2014/15
Mexico
900000904 2013/14
900000090 2014/15
Moldova
020202000 2010/11
412012016000 2011/12
418018018040 2012/13
826026030040 2013/14
825025025080 2014/15
Foreign Agricultural Service/USDA May 2015Office of Global Analysis

Summary of Changes in estimates and Forecasts from Last Month (Continued)
(1,000 480 lb Bales and 1,000 Ha)
Country Mktg
Year
Area
Harvested
Beginning
Stocks
Production Imports Exports Use Loss Total Dom.
Cons.
Ending
Stocks
Pakistan
00000000-100 2013/14
01500150-5010000-100 2014/15
Peru
700000705 2013/14
-800000-157-3 2014/15
Senegal
00001001000 2014/15
Singapore
-2000-8-10000 2014/15
South Africa
10000010000 2001/02
260000160100 2002/03
81-300-300250260 2003/04
26230233-290810 2004/05
21-490-4944-100260 2005/06
-40900902310210 2006/07
-17101-7170-400 2007/08
-36-250-2513-310-170 2008/09
-49-340-341-460-360 2009/10
-12-80-8-2540-490 2010/11
-36-80-824-80-120 2011/12
-33707-460-360 2012/13
-1115015-20170-330 2013/14
10000-9120-110 2014/15
Spain
10000001002 2000/01
-1300000-23101 2001/02
-7000006-131 2002/03
-5000002-73 2003/04
90000014-50 2004/05
3-200-2010-2590 2005/06
9-50-503-2311 2006/07
16000-1-1790 2007/08
515015004160 2008/09
10-50-500050 2009/10
-12-150-1500-37100 2010/11
Foreign Agricultural Service/USDA May 2015Office of Global Analysis
Summary of Changes in estimates and Forecasts from Last Month (Continued)
(1,000 480 lb Bales and 1,000 Ha)
Country Mktg
Year
Area
Harvested
Beginning
Stocks
Production Imports Exports Use Loss Total Dom.
Cons.
Ending
Stocks
-5000-106-120 2011/12
-1200000-7-50 2012/13
-1700010-4-120 2013/14
-11000006-17-1 2014/15
Syria
-25-500-50750000 2014/15
Tanzania
-101001000000 2005/06
-2010010000-100 2006/07
-15-50-5000-200 2007/08
-5035035000-150 2008/09
-6010010000-500 2009/10
25-200-20-6500-600 2010/11
1510010000250 2011/12
-23200201800150 2012/13
1220020-5500-230 2013/14
2225025-3500120 2014/15
United States
01919000190-146 2014/15
World
World
10000001002 2000/01
-3000010-23101 2001/02
24250250466-31 2002/03
86-250-2530652243 2003/04
15588088-974614860 2004/05
-1-440-4419520-251550 2005/06
-301150115-1375-2-111 2006/07
31-140-142427-300 2007/08
-363703728-64310 2008/09
-147-540-54131-340-3650 2009/10
85-940-94-13243-37-1470 2010/11
108300306310412853 2011/12
441505-201146-9108-1 2012/13
60923023-719-524-4441-31 2013/14
16842419405-446-51451609-254 2014/15
Foreign Agricultural Service/USDA May 2015Office of Global Analysis

Summary of Changes in estimates and Forecasts from Last Month (Continued)
(1,000 480 lb Bales and 1,000 Ha)
Country Mktg
Year
Area
Harvested
Beginning
Stocks
Production Imports Exports Use Loss Total Dom.
Cons.
Ending
Stocks
Foreign Agricultural Service/USDA May 2015Office of Global Analysis
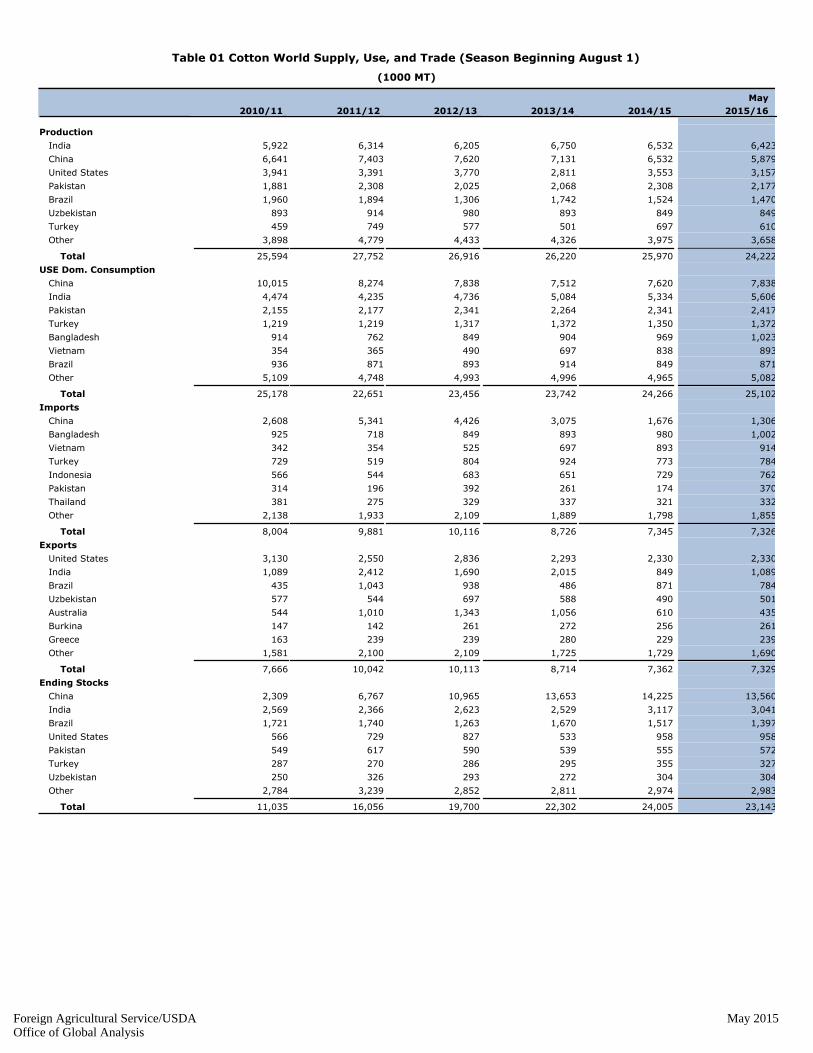
Table 01 Cotton World Supply, Use, and Trade (Season Beginning August 1)
(1000 MT)
2010/11 2011/12 2012/13 2013/14 2014/15
May
2015/16
Production none
5,922 India 6,314 6,205 6,750 6,532 6,423
6,641 China 7,403 7,620 7,131 6,532 5,879
3,941 United States 3,391 3,770 2,811 3,553 3,157
1,881 Pakistan 2,308 2,025 2,068 2,308 2,177
1,960 Brazil 1,894 1,306 1,742 1,524 1,470
893 Uzbekistan 914 980 893 849 849
459 Turkey 749 577 501 697 610
3,898 Other 4,779 4,433 4,326 3,975 3,658
25,594 Total 27,752 26,916 26,220 25,970 24,222
USE Dom. Consumption none
10,015 China 8,274 7,838 7,512 7,620 7,838
4,474 India 4,235 4,736 5,084 5,334 5,606
2,155 Pakistan 2,177 2,341 2,264 2,341 2,417
1,219 Turkey 1,219 1,317 1,372 1,350 1,372
914 Bangladesh 762 849 904 969 1,023
354 Vietnam 365 490 697 838 893
936 Brazil 871 893 914 849 871
5,109 Other 4,748 4,993 4,996 4,965 5,082
25,178 Total 22,651 23,456 23,742 24,266 25,102
Imports none
2,608 China 5,341 4,426 3,075 1,676 1,306
925 Bangladesh 718 849 893 980 1,002
342 Vietnam 354 525 697 893 914
729 Turkey 519 804 924 773 784
566 Indonesia 544 683 651 729 762
314 Pakistan 196 392 261 174 370
381 Thailand 275 329 337 321 332
2,138 Other 1,933 2,109 1,889 1,798 1,855
8,004 Total 9,881 10,116 8,726 7,345 7,326
Exports none
3,130 United States 2,550 2,836 2,293 2,330 2,330
1,089 India 2,412 1,690 2,015 849 1,089
435 Brazil 1,043 938 486 871 784
577 Uzbekistan 544 697 588 490 501
544 Australia 1,010 1,343 1,056 610 435
147 Burkina 142 261 272 256 261
163 Greece 239 239 280 229 239
1,581 Other 2,100 2,109 1,725 1,729 1,690
7,666 Total 10,042 10,113 8,714 7,362 7,329
Ending Stocks none
2,309 China 6,767 10,965 13,653 14,225 13,560
2,569 India 2,366 2,623 2,529 3,117 3,041
1,721 Brazil 1,740 1,263 1,670 1,517 1,397
566 United States 729 827 533 958 958
549 Pakistan 617 590 539 555 572
287 Turkey 270 286 295 355 327
250 Uzbekistan 326 293 272 304 304
2,784 Other 3,239 2,852 2,811 2,974 2,983
11,035 Total 16,056 19,700 22,302 24,005 23,143
Foreign Agricultural Service/USDA May 2015Office of Global Analysis

Table 02 Cotton World Supply, Use, and Trade (Season Beginning August 1)
(1000 Bales)
2010/11 2011/12 2012/13 2013/14 2014/15
May
2015/16
Production none
9,000 Brazil 8,700 6,000 8,000 7,000 6,750
30,500 China 34,000 35,000 32,750 30,000 27,000
27,200 India 29,000 28,500 31,000 30,000 29,500
8,640 Pakistan 10,600 9,300 9,500 10,600 10,000
2,110 Turkey 3,440 2,650 2,300 3,200 2,800
18,102 United States 15,573 17,314 12,909 16,319 14,500
4,100 Uzbekistan 4,200 4,500 4,100 3,900 3,900
17,901 Other 21,949 20,361 19,868 18,258 16,801
117,553 Total 127,462 123,625 120,427 119,277 111,251
USE Dom. Consumption none
4,200 Bangladesh 3,500 3,900 4,150 4,450 4,700
4,300 Brazil 4,000 4,100 4,200 3,900 4,000
46,000 China 38,000 36,000 34,500 35,000 36,000
20,550 India 19,450 21,750 23,350 24,500 25,750
2,600 Indonesia 2,450 3,050 3,050 3,300 3,400
1,700 Mexico 1,700 1,800 1,850 1,850 1,900
9,900 Pakistan 10,000 10,750 10,400 10,750 11,100
5,600 Turkey 5,600 6,050 6,300 6,200 6,300
3,900 United States 3,300 3,500 3,550 3,650 3,800
1,625 Vietnam 1,675 2,250 3,200 3,850 4,100
15,264 Other 14,359 14,582 14,495 14,002 14,242
115,639 Total 104,034 107,732 109,045 111,452 115,292
Imports none
4,250 Bangladesh 3,300 3,900 4,100 4,500 4,600
11,979 China 24,533 20,327 14,122 7,700 6,000
450 India 600 1,187 675 1,100 900
2,600 Indonesia 2,500 3,137 2,989 3,350 3,500
1,038 Korea, South 1,170 1,314 1,286 1,275 1,275
1,196 Mexico 1,000 950 1,040 825 1,000
1,443 Pakistan 900 1,800 1,200 800 1,700
1,752 Thailand 1,263 1,511 1,546 1,475 1,525
3,350 Turkey 2,382 3,692 4,246 3,550 3,600
1,569 Vietnam 1,625 2,410 3,200 4,100 4,200
7,136 Other 6,110 6,236 5,676 5,060 5,346
36,763 Total 45,383 46,464 40,080 33,735 33,646
Exports none
2,500 Australia 4,640 6,168 4,852 2,800 2,000
2,000 Brazil 4,792 4,307 2,230 4,000 3,600
675 Burkina 650 1,200 1,250 1,175 1,200
250 Cote d'Ivoire 425 575 725 800 800
750 Greece 1,100 1,100 1,285 1,050 1,100
5,000 India 11,080 7,761 9,255 3,900 5,000
450 Mali 625 900 800 700 950
1,100 Turkmenistan 750 1,000 800 700 725
14,376 United States 11,714 13,026 10,530 10,700 10,700
2,650 Uzbekistan 2,500 3,200 2,700 2,250 2,300
5,460 Other 7,845 7,210 5,597 5,739 5,287
35,211 Total 46,121 46,447 40,024 33,814 33,662
Ending Stocks none
7,906 Brazil 7,993 5,801 7,668 6,968 6,418
10,603 China 31,081 50,361 62,707 65,332 62,282
11,799 India 10,869 12,045 11,615 14,315 13,965
2,520 Pakistan 2,835 2,710 2,475 2,550 2,625
1,319 Turkey 1,241 1,315 1,357 1,632 1,502
2,600 United States 3,350 3,800 2,450 4,400 4,400
1,148 Uzbekistan 1,498 1,348 1,248 1,398 1,398
12,788 Other 14,876 13,101 12,912 13,659 13,702
50,683 Total 73,743 90,481 102,432 110,254 106,292
Foreign Agricultural Service/USDA May 2015Office of Global Analysis

Table 04 Cotton Area, Yield, and Production
From last month From last year
MBalesPercent
Yield
(Kilograms per hectare)
May 2013/14 MBales
Country / Region
Area
(Million hectares)
Production
(Million 480 lb. bales)
Change in Production
2013/14
Prel.
2014/15
Prel.
2014/15 May
Prel.
2014/15 May Percent
2015/16 Proj.2015/16 Proj. 2015/16 Proj.
2013/14
32.74World -6.73-8.03111.2533.83 31.77 801 768 763 120.43 119.28
3.05United States -11.15-1.8214.503.78 3.48 921 939 907 12.91 16.32
29.69Total Foreign -6.03-6.2196.7530.05 28.29 788 746 745 107.52 102.96
none
Western Hemisphere
1.12 Brazil -3.57-0.256.750.98 0.95 1,555 1,563 1,547 8.00 7.00
0.12 Mexico -23.13-0.321.050.18 0.15 1,652 1,643 1,545 0.93 1.37
0.56 Argentina -11.11-0.131.000.50 0.46 474 490 473 1.22 1.13
0.02 Paraguay -22.22-0.010.040.03 0.02 381 392 381 0.04 0.05
0.04 Peru -8.70-0.010.110.03 0.02 1,008 1,002 994 0.16 0.12
0.03 Colombia -5.59-0.010.140.03 0.03 878 943 919 0.13 0.14
Africa
0.65 Burkina -9.77-0.131.200.66 0.63 421 439 418 1.25 1.33
0.45 Mali -5.66-0.061.000.54 0.54 411 429 403 0.85 1.06
0.45 Cote d'Ivoire -7.74-0.070.780.41 0.42 382 442 407 0.78 0.84
0.22 Cameroon -10.00-0.050.450.22 0.21 495 495 467 0.50 0.50
0.27 Benin -3.33-0.020.580.28 0.28 464 467 451 0.58 0.60
0.21 Chad -2.27-0.010.220.26 0.25 161 188 187 0.15 0.22
0.13 Togo -11.43-0.020.160.13 0.11 261 305 307 0.15 0.18
0.03 Senegal 10.000.010.060.03 0.03 381 435 399 0.06 0.05
0.13 Egypt -35.24-0.190.340.16 0.10 729 728 740 0.44 0.53
0.26 Zimbabwe 10.000.030.280.23 0.22 224 237 272 0.26 0.25
0.29 Nigeria 25.000.050.250.22 0.24 199 203 227 0.26 0.20
Asia Oceania
4.80 China -10.00-3.0027.004.40 3.70 1,486 1,484 1,589 32.75 30.00
11.70 India -1.67-0.5029.5012.70 12.00 577 514 535 31.00 30.00
2.90 Pakistan -5.66-0.6010.002.95 2.95 713 782 738 9.50 10.60
0.14 Kazakhstan 0.000.000.250.13 0.13 536 425 419 0.34 0.25
0.19 Tajikistan -12.50-0.050.350.18 0.17 516 498 462 0.45 0.40
0.58 Turkmenistan 0.000.001.450.55 0.55 568 579 574 1.50 1.45
1.29 Uzbekistan 0.000.003.901.29 1.29 695 661 661 4.10 3.90
0.33 Turkey -12.50-0.402.800.43 0.38 1,517 1,620 1,604 2.30 3.20
0.44 Australia -9.09-0.202.000.21 0.19 2,047 2,281 2,292 4.10 2.20
0.10 Syria -8.33-0.030.280.06 0.05 1,306 1,089 1,197 0.60 0.30
0.30 Burma -5.03-0.050.850.30 0.29 646 650 649 0.89 0.90
Europe
0.25 Greece -6.69-0.091.200.28 0.25 1,217 1,007 1,045 1.37 1.29
1.74Others -4.33-0.132.811.73 1.70 360 370 360 2.87 2.93
Note: Yeild for Total Foreign and Others is an incorrect calculation.
Foreign Agricultural Service/USDA May 2015Office of Global Analysis

(1,000 HA and 1000 480-lb. Bales)
Table 05 Cotton Supply and Distribution MY 2015/16
Area
Harvested
Ending
Stocks
ExportsLossUseTotal
Supply
ImportsProductio
n
Country
0 15070988545 Afghanistan 13
15 00162011 Albania 4
25 00252900 Algeria 4
3 3051052 Angola 2
20 35006502,3371,000460 Argentina 1,337
0 000000 Armenia 0
0 2,000-100353,2722,000190 Australia 1,337
25 30223000 Austria 5
0 00701057023 Azerbaijan 35
50 00505800 Bahrain 8
4,600 0104,7005,90612545 Bangladesh 1,196
55 00556600 Belarus 11
60 250356800 Belgium-Luxembour 8
0 575015893580280 Benin 303
8 202035145 Bolivia 13
150 3,600-1504,00013,8686,750950 Brazil 6,418
20 003038102 Bulgaria 8
0 1,2000151,5951,200625 Burkina 380
50 509001,164850285 Burma 259
0 001100 Cambodia 0
0 450020620450210 Cameroon 150
3 003400 Canada 1
0 2805433034 Central African Republic 10
0 210010270215250 Chad 50
0 000000 Chile 0
6,000 50036,00098,33227,0003,700 China 62,282
145 10526534913532 Colombia 69
2 0017211530 Congo (Kinshasa) 4
1 002311 Costa Rica 1
0 8000301,095775415 Cote d'Ivoire 265
0 000000 Croatia 0
10 00141644 Cuba 2
0 000000 Cyprus 0
15 00151900 Czech Republic 4
0 000000 Denmark 0
Foreign Agricultural Service/USDA May 2015Office of Global Analysis

(1,000 HA and 1000 480-lb. Bales)
Table 05 Cotton Supply and Distribution MY 2015/16 (Continued)
Area
Harvested
Ending
Stocks
ExportsLossUseTotal
Supply
ImportsProductio
n
Country
1 004534 Dominican Republic 1
80 009010993 Ecuador 19
450 150106501,044340100 Egypt 234
155 0016520711 El Salvador 42
0 000000 Estonia 0
45 00210261188130 Ethiopia 51
75 150608800 France 13
210 30018524800 Germany 33
0 15010322816 Ghana 7
10 1,100301001,6601,200250 Greece 430
120 0012315032 Guatemala 27
0 1400171412 Guinea 3
5 00101157 Haiti 1
20 00242942 Honduras 5
0 000000 Hong Kong 0
4 202500 Hungary 1
900 5,000025,75044,71529,50012,000 India 13,965
3,500 703,4004,185219 Indonesia 778
300 200575760300110 Iran 165
30 0060803020 Iraq 20
2 002200 Ireland 0
2 550474608 Israel 15
215 15020025000 Italy 35
290 0029033300 Japan 43
0 1600100408250130 Kazakhstan 148
15 0035461821 Kenya 11
95 001502055519 Korea, North 55
1,275 501,2751,56500 Korea, South 285
0 85051089025 Kyrgyzstan 18
1 100200 Latvia 1
3 003400 Lebanon 1
25 00254000 Lesotho 15
0 000000 Lithuania 0
5 005600 Macedonia 1
0 10050716030 Madagascar 11
Foreign Agricultural Service/USDA May 2015Office of Global Analysis
(1,000 HA and 1000 480-lb. Bales)
Table 05 Cotton Supply and Distribution MY 2015/16 (Continued)
Area
Harvested
Ending
Stocks
ExportsLossUseTotal
Supply
ImportsProductio
n
Country
0 13005211115100 Malawi 76
250 50021035200 Malaysia 92
0 9500251,6061,000540 Mali 631
95 009511700 Mauritius 22
1,000 150251,9002,7901,050148 Mexico 715
35 00354700 Moldova 12
175 0017521011 Morocco 35
0 16005265150135 Mozambique 100
10 00101200 Netherlands 2
0 90112104 Nicaragua 2
0 5041395 Niger 4
50 600240379250240 Nigeria 79
1,700 5002511,10014,25010,0002,950 Pakistan 2,625
0 000000 Panama 0
5 20025593520 Paraguay 14
350 5045067610523 Peru 221
50 00506421 Philippines 14
15 00151800 Poland 3
165 0016520300 Portugal 38
3 003400 Romania 1
315 0032038900 Russia 69
0 5005685530 Senegal 13
5 005700 Serbia 2
5 700800 Singapore 1
0 000000 Slovakia 0
6 006800 Slovenia 2
3 001011712 Somalia 1
85 2001072316515 South Africa 104
13 24002531824565 Spain 53
8 00131755 Sri Lanka 4
0 4508519912570 Sudan 69
0 000000 Sweden 0
15 00151800 Switzerland 3
0 150015036927550 Syria 69
800 0080099100 Taiwan 191
Foreign Agricultural Service/USDA May 2015Office of Global Analysis

(1,000 HA and 1000 480-lb. Bales)
Table 05 Cotton Supply and Distribution MY 2015/16 (Continued)
Area
Harvested
Ending
Stocks
ExportsLossUseTotal
Supply
ImportsProductio
n
Country
0 325035621350165 Tajikistan 261
0 2300175809400400 Tanzania 404
1,525 3251,5001,73921 Thailand 211
0 150015207155110 Togo 42
35 004558102 Tunisia 13
3,600 23006,3008,0322,800380 Turkey 1,502
0 72507502,4241,450550 Turkmenistan 949
0 900517010075 Uganda 75
8 0081000 Ukraine 2
2 200300 United Kingdom 1
10 10,700103,80018,91014,5003,480 United States 4,400
3 003400 Uruguay 1
0 2,30001,6005,2983,9001,285 Uzbekistan 1,398
15 001001248515 Venezuela 24
4,200 004,1004,95842 Vietnam 858
0 1030373218 Yemen 6
0 155040301190160 Zambia 106
0 1901575439275220 Zimbabwe 159
World
33,646 33,662-95115,292255,151111,25131,765 World 106,292
Foreign Agricultural Service/USDA May 2015Office of Global Analysis

(1000 MT and 1000 HA)
Table 05A Cotton Supply and Distribution MY 2015/2016
Area
Harvested
Ending
Stocks
ExportsLossUseTotal
Supply
ImportsProductio
n
Country
0 3015211910 Afghanistan 3
3 003400 Albania 1
5 005600 Algeria 1
1 101210 Angola 0
4 760142509218100 Argentina 291
0 000000 Armenia 0
0 435-22871243541 Australia 291
5 105700 Austria 1
0 001523155 Azerbaijan 8
11 00111300 Bahrain 2
1,002 021,0231,2862710 Bangladesh 260
12 00121400 Belarus 2
13 5081500 Belgium-Luxembour 2
0 1250319412661 Benin 66
2 004831 Bolivia 3
33 784-338713,0191,470207 Brazil 1,397
4 007820 Bulgaria 2
0 26103347261136 Burkina 83
11 1019625318562 Burma 56
0 000000 Cambodia 0
0 98041359846 Cameroon 33
1 001100 Canada 0
0 601977 Central African Republic 2
0 4602594754 Chad 11
0 000000 Chile 0
1,306 1107,83821,4095,879806 China 13,560
32 215876297 Colombia 15
0 004537 Congo (Kinshasa) 1
0 000100 Costa Rica 0
0 1740723816990 Cote d'Ivoire 58
0 000000 Croatia 0
2 003311 Cuba 0
0 000000 Cyprus 0
3 003400 Czech Republic 1
0 000000 Denmark 0
Foreign Agricultural Service/USDA May 2015Office of Global Analysis

(1000 MT and 1000 HA)
Table 05A Cotton Supply and Distribution MY 2015/2016 (Continued)
Area
Harvested
Ending
Stocks
ExportsLossUseTotal
Supply
ImportsProductio
n
Country
0 001111 Dominican Republic 0
17 00202421 Ecuador 4
98 3321422277422 Egypt 51
34 00364500 El Salvador 9
0 000000 Estonia 0
10 0046574128 Ethiopia 11
16 30131900 France 3
46 70405400 Germany 7
0 302763 Ghana 2
2 23972236126154 Greece 94
26 00273310 Guatemala 6
0 300433 Guinea 1
1 002212 Haiti 0
4 005610 Honduras 1
0 000000 Hong Kong 0
1 000100 Hungary 0
196 1,08905,6069,7366,4232,613 India 3,041
762 2074091152 Indonesia 169
65 401251656524 Iran 36
7 00131774 Iraq 4
0 000000 Ireland 0
0 120116132 Israel 3
47 30445400 Italy 8
63 00637300 Japan 9
0 35022895428 Kazakhstan 32
3 0081045 Kenya 2
21 003345124 Korea, North 12
278 1027834100 Korea, South 62
0 190124205 Kyrgyzstan 4
0 000000 Latvia 0
1 001100 Lebanon 0
5 005900 Lesotho 3
0 000000 Lithuania 0
1 001100 Macedonia 0
0 201115137 Madagascar 2
Foreign Agricultural Service/USDA May 2015Office of Global Analysis

(1000 MT and 1000 HA)
Table 05A Cotton Supply and Distribution MY 2015/2016 (Continued)
Area
Harvested
Ending
Stocks
ExportsLossUseTotal
Supply
ImportsProductio
n
Country
0 2801462522 Malawi 17
54 110467700 Malaysia 20
0 20705350218118 Mali 137
21 00212500 Mauritius 5
218 33541460722932 Mexico 156
8 0081000 Moldova 3
38 00384600 Morocco 8
0 3501583329 Mozambique 22
2 002300 Netherlands 0
0 200321 Nicaragua 0
0 101321 Niger 1
11 13052835452 Nigeria 17
370 10952,4173,1032,177642 Pakistan 572
0 000000 Panama 0
1 4051384 Paraguay 3
76 1098147235 Peru 48
11 00111400 Philippines 3
3 003400 Poland 1
36 00364400 Portugal 8
1 001100 Romania 0
69 00708500 Russia 15
0 110115127 Senegal 3
1 001200 Serbia 0
1 200200 Singapore 0
0 000000 Slovakia 0
1 001200 Slovenia 0
1 002223 Somalia 0
19 402350143 South Africa 23
3 5205695314 Spain 12
2 003411 Sri Lanka 1
0 10019432715 Sudan 15
0 000000 Sweden 0
3 003400 Switzerland 1
0 33033806011 Syria 15
174 0017421600 Taiwan 42
Foreign Agricultural Service/USDA May 2015Office of Global Analysis

(1000 MT and 1000 HA)
Table 05A Cotton Supply and Distribution MY 2015/2016 (Continued)
Area
Harvested
Ending
Stocks
ExportsLossUseTotal
Supply
ImportsProductio
n
Country
0 71081357636 Tajikistan 57
0 500381768787 Tanzania 88
332 1532737900 Thailand 46
0 3303453424 Togo 9
8 00101320 Tunisia 3
784 5001,3721,74961083 Turkey 327
0 1580163528316120 Turkmenistan 207
0 2001372216 Uganda 16
2 002200 Ukraine 0
0 000100 United Kingdom 0
2 2,33028274,1173,157758 United States 958
1 001100 Uruguay 0
0 50103481,154849280 Uzbekistan 304
3 002227193 Venezuela 5
914 008931,07910 Vietnam 187
0 007874 Yemen 1
0 3409664135 Zambia 23
0 41316966048 Zimbabwe 35
World
7,326 7,329-2125,10255,55324,2226,916 World 23,143
Foreign Agricultural Service/USDA May 2015Office of Global Analysis

(1,000 HA and 1000 480-lb. Bales)
Table 06: Cotton Supply and Distribution by Country 2014/2015
Area
Harvested
Ending
Stocks
ExportsLossUseTotal
Supply
ImportsProductio
n
Country
0 15070988545 Afghanistan 13
15 00162011 Albania 4
25 00252900 Algeria 4
3 3051052 Angola 2
20 40006502,3671,125500 Argentina 1,317
0 000000 Armenia 0
0 2,800-100354,0072,200210 Australia 1,272
25 30223000 Austria 5
0 00701057023 Azerbaijan 35
41 00505800 Bahrain 8
4,500 0104,4505,64112043 Bangladesh 1,181
55 00607100 Belarus 11
60 250356800 Belgium-Luxembour 8
0 575015903600280 Benin 313
7 202035145 Bolivia 13
50 4,000-1503,90014,7187,000975 Brazil 6,968
20 003038102 Bulgaria 8
0 1,1750151,5851,330660 Burkina 395
5 509001,169895300 Burma 264
1 001200 Cambodia 1
0 450020640500220 Cameroon 170
3 003400 Canada 1
0 3005483734 Central African Republic 13
0 190010255220255 Chad 55
0 001100 Chile 0
7,700 75035,000100,40730,0004,400 China 65,332
135 15526535414333 Colombia 69
2 0017211530 Congo (Kinshasa) 4
1 002311 Costa Rica 1
0 8000301,150840414 Cote d'Ivoire 320
0 001100 Croatia 0
10 00141644 Cuba 2
0 000000 Cyprus 0
15 00151900 Czech Republic 4
0 000000 Denmark 0
Foreign Agricultural Service/USDA May 2015Office of Global Analysis

(1,000 HA and 1000 480-lb. Bales)
Table 06: Cotton Supply and Distribution by Country 2014/2015 (Continued)
Area
Harvested
Ending
Stocks
ExportsLossUseTotal
Supply
ImportsProductio
n
Country
1 004534 Dominican Republic 1
80 009011093 Ecuador 20
350 150106501,064525157 Egypt 254
155 0015520611 El Salvador 51
0 000000 Estonia 0
30 50195228175125 Ethiopia 28
75 150608800 France 13
220 35018525800 Germany 38
0 15015342816 Ghana 4
10 1,050301001,6301,286278 Greece 450
120 0012014732 Guatemala 27
0 1400171412 Guinea 3
5 00101157 Haiti 1
20 00242942 Honduras 5
0 1050010500 Hong Kong 0
4 202500 Hungary 1
1,100 3,900024,50042,71530,00012,700 India 14,315
3,350 703,3003,971219 Indonesia 664
275 200550730300110 Iran 160
30 0060803020 Iraq 20
2 002200 Ireland 0
2 650481668 Israel 12
225 15020025000 Italy 35
300 0030034300 Japan 43
0 180095433250128 Kazakhstan 158
5 0035483238 Kenya 13
95 001502055519 Korea, North 55
1,275 501,2701,56500 Korea, South 290
0 85051089027 Kyrgyzstan 18
1 100200 Latvia 1
3 003400 Lebanon 1
30 00254000 Lesotho 15
0 000000 Lithuania 0
5 006700 Macedonia 1
0 10050716030 Madagascar 11
Foreign Agricultural Service/USDA May 2015Office of Global Analysis

(1,000 HA and 1000 480-lb. Bales)
Table 06: Cotton Supply and Distribution by Country 2014/2015 (Continued)
Area
Harvested
Ending
Stocks
ExportsLossUseTotal
Supply
ImportsProductio
n
Country
0 14005241150130 Malawi 96
300 100020040200 Malaysia 102
0 7000251,3311,060538 Mali 606
90 009011200 Mauritius 22
825 160251,8502,7751,366181 Mexico 740
35 00354700 Moldova 12
165 0016519911 Morocco 34
0 16005280170135 Mozambique 115
10 00101200 Netherlands 2
0 90112104 Nicaragua 2
0 5041395 Niger 4
50 500220349200215 Nigeria 79
800 5502510,75013,87510,6002,950 Pakistan 2,550
0 000000 Panama 0
5 20025644525 Paraguay 19
330 5045067611525 Peru 221
50 00506221 Philippines 12
15 00151800 Poland 3
165 2016020000 Portugal 38
3 003400 Romania 1
325 0033540900 Russia 74
0 4505635025 Senegal 13
5 005700 Serbia 2
10 12001500 Singapore 3
0 000000 Slovakia 0
6 006800 Slovenia 2
3 001011712 Somalia 1
76 260972048519 South Africa 81
10 30002538533174 Spain 60
8 00131755 Sri Lanka 4
0 4008019413067 Sudan 74
0 000000 Sweden 0
15 00151800 Switzerland 3
0 175020046930060 Syria 94
775 0080099100 Taiwan 191
Foreign Agricultural Service/USDA May 2015Office of Global Analysis

(1,000 HA and 1000 480-lb. Bales)
Table 06: Cotton Supply and Distribution by Country 2014/2015 (Continued)
Area
Harvested
Ending
Stocks
ExportsLossUseTotal
Supply
ImportsProductio
n
Country
0 375035681400175 Tajikistan 271
0 2000175784375400 Tanzania 409
1,475 5251,4501,69221 Thailand 212
0 150015217175125 Togo 52
35 004558102 Tunisia 13
3,550 27506,2008,1073,200430 Turkey 1,632
0 70007002,3741,450545 Turkmenistan 974
0 1000517511552 Uganda 70
8 0081000 Ukraine 2
2 200300 United Kingdom 1
10 10,700293,65018,77916,3193,783 United States 4,400
3 003400 Uruguay 1
0 2,25001,5005,1483,9001,285 Uzbekistan 1,398
15 001001248515 Venezuela 24
4,100 003,8504,60463 Vietnam 754
0 1030363218 Yemen 5
0 140040291150160 Zambia 111
0 1751575429250230 Zimbabwe 164
World
33,735 33,814-76111,452255,444119,27733,829 World 110,254
Foreign Agricultural Service/USDA May 2015Office of Global Analysis

(1,000 Metric Tons)
Table 06A: Cotton Supply and Distribution by Country 2014/2015
Area
Harvested
Ending
Stocks
ExportsLossUseImportsProductio
n
Beginning
Stocks
Country
19 30150310 Afghanistan 3
0 003310 Albania 1
0 005510 Algeria 1
1 101100 Angola 0
245 8701424266109 Argentina 287
0 000000 Armenia 0
479 610-228039346 Australia 277
0 105510 Austria 1
15 0015085 Azerbaijan 8
0 0011940 Bahrain 2
26 029699802229 Bangladesh 257
0 00131230 Belarus 2
0 5081320 Belgium-Luxembour 2
131 1250306661 Benin 68
3 004231 Bolivia 3
1,524 871-33849111,670212 Brazil 1,517
2 007420 Bulgaria 2
290 25603056144 Burkina 86
195 1019615965 Burma 57
0 000000 Cambodia 0
109 980403048 Cameroon 37
0 001100 Canada 0
8 701027 Central African Republic 3
48 41020856 Chad 12
0 000000 Chile 0
6,532 1607,6201,67613,653958 China 14,225
31 315829177 Colombia 15
3 004017 Congo (Kinshasa) 1
0 000000 Costa Rica 0
183 1740706790 Cote d'Ivoire 70
0 000000 Croatia 0
1 003201 Cuba 0
0 000000 Cyprus 0
0 003310 Czech Republic 1
0 000000 Denmark 0
Foreign Agricultural Service/USDA May 2015Office of Global Analysis

(1,000 Metric Tons)
Table 06A: Cotton Supply and Distribution by Country 2014/2015 (Continued)
Area
Harvested
Ending
Stocks
ExportsLossUseImportsProductio
n
Beginning
Stocks
Country
1 001001 Dominican Republic 0
2 00201751 Ecuador 4
114 332142764134 Egypt 55
0 003434110 El Salvador 11
0 000000 Estonia 0
38 10427527 Ethiopia 6
0 30131630 France 3
0 80404880 Germany 8
6 303013 Ghana 1
280 22972227361 Greece 98
1 00262650 Guatemala 6
3 300013 Guinea 1
1 002102 Haiti 0
1 005410 Honduras 1
0 23000230 Hong Kong 0
0 000100 Hungary 0
6,532 84905,3342392,5292,765 India 3,117
5 207187291312 Indonesia 145
65 40120603424 Iran 35
7 0013744 Iraq 4
0 000000 Ireland 0
14 1401032 Israel 3
0 30444950 Italy 8
0 00656590 Japan 9
54 3902104028 Kazakhstan 34
7 008128 Kenya 3
12 003321124 Korea, North 12
0 10277278630 Korea, South 63
20 1901046 Kyrgyzstan 4
0 000000 Latvia 0
0 001100 Lebanon 0
0 005720 Lesotho 3
0 000000 Lithuania 0
0 001100 Macedonia 0
13 2011027 Madagascar 2
Foreign Agricultural Service/USDA May 2015Office of Global Analysis

(1,000 Metric Tons)
Table 06A: Cotton Supply and Distribution by Country 2014/2015 (Continued)
Area
Harvested
Ending
Stocks
ExportsLossUseImportsProductio
n
Beginning
Stocks
Country
33 300102028 Malawi 21
0 2204465220 Malaysia 22
231 15205059117 Mali 132
0 00202050 Mauritius 5
297 35540318012739 Mexico 161
0 008830 Moldova 3
0 00363670 Morocco 7
37 350102429 Mozambique 25
0 002200 Netherlands 0
2 200001 Nicaragua 0
2 101011 Niger 1
44 11048112247 Nigeria 17
2,308 12052,341174539642 Pakistan 555
0 000000 Panama 0
10 405135 Paraguay 4
25 109872505 Peru 48
0 00111120 Philippines 3
0 003310 Poland 1
0 00353680 Portugal 8
0 001100 Romania 0
0 007371180 Russia 16
11 1001035 Senegal 3
0 300210 Singapore 1
0 000000 Slovakia 0
0 001100 Slovenia 0
2 002103 Somalia 0
19 60211794 South Africa 18
72 650521016 Spain 13
1 003211 Sri Lanka 1
28 901701415 Sudan 16
0 000000 Sweden 0
0 003310 Switzerland 1
65 3804403713 Syria 20
0 00174169470 Taiwan 42
87 820806138 Tajikistan 59
Foreign Agricultural Service/USDA May 2015Office of Global Analysis

(1,000 Metric Tons)
Table 06A: Cotton Supply and Distribution by Country 2014/2015 (Continued)
Area
Harvested
Ending
Stocks
ExportsLossUseImportsProductio
n
Beginning
Stocks
Country
82 4403808987 Tanzania 89
0 15316321470 Thailand 46
38 33030927 Togo 11
2 0010830 Tunisia 3
697 6001,35077329594 Turkey 355
316 15201520201119 Turkmenistan 212
25 220101311 Uganda 15
0 002200 Ukraine 0
0 000000 United Kingdom 0
3,553 2,33067952533824 United States 958
0 001100 Uruguay 0
849 49003270272280 Uzbekistan 304
19 0022353 Venezuela 5
1 008388931081 Vietnam 164
7 007014 Yemen 1
33 300903135 Zambia 24
54 3831603950 Zimbabwe 36
World
25,970 7,362-1724,2667,34522,3027,365 World 24,005
Foreign Agricultural Service/USDA May 2015Office of Global Analysis

Table 09: World Cotton Supply and Distribution
(1,000 HA and 1000 480-lb. Bales)
Country Mktg
Year
Beginning
Stocks
Area
Harvested
Production Imports Total
Supply
Exports Use Loss Total Dom.
Cons.
Ending
Stocks
Stock to
Use %
World
5942,12671,29047470,81627,200140,61627,62988,70633,74124,281 1984/85
6347,58975,58225275,33028,078151,24928,98180,14231,58142,126 1985/86
4335,41782,27417982,09533,350151,04133,09370,35929,34747,589 1986/87
3932,60984,68053484,14630,103147,39230,52981,44630,87135,417 1987/88
3631,05085,88064285,23833,481150,41133,58284,22033,83132,609 1988/89
2924,97887,13923486,90531,357143,47432,70379,72131,69631,050 1989/90
3227,46785,69417085,52429,560142,72130,57887,16533,15324,978 1990/91
4336,96586,55636886,18828,204151,72529,02495,23434,75827,467 1991/92
4034,50486,4006386,33725,435146,33927,06782,30732,64336,965 1992/93
3327,82785,70314385,56026,620140,15027,96777,67930,71834,504 1993/94
3832,01484,292-33084,62228,118144,42430,30086,29732,25027,827 1994/95
4740,12985,396-54485,94027,396152,92127,00493,90335,92032,014 1995/96
5144,63387,351-58587,93626,777158,76128,57990,05333,74040,129 1996/97
5749,46786,686-58187,26726,777162,93025,92992,36833,79744,633 1997/98
6252,85283,651-1,11484,76523,517160,02024,48086,07332,88549,467 1998/99
5651,14090,485-60291,08727,126168,75127,97687,92332,35052,852 1999/00
5449,54590,779-1,42492,20326,156166,48026,22989,11132,01251,140 2000/01
5854,58293,726-78194,50729,066177,37429,32298,50733,71949,545 2001/02
4847,75897,683-80498,48730,400175,84130,23391,02630,77654,582 2002/03
4948,29697,194-90998,10333,157178,64734,17596,71432,34347,758 2003/04
5660,881107,983-1,245109,22834,934203,79833,985121,51735,69548,296 2004/05
5361,810115,190-1,793116,98344,907221,90744,693116,33334,77060,881 2005/06
5163,078122,599-1,715124,31437,451223,12838,305123,01334,60261,810 2006/07
5062,403121,762-2,094123,85638,953223,11839,463120,57732,89563,078 2007/08
5662,200108,968-1,536110,50430,132201,30030,597108,30030,63462,403 2008/09
3947,226119,673-62119,73535,653202,55236,993103,35930,23762,200 2009/10
4450,683115,6489115,63935,211201,54236,763117,55333,52647,226 2010/11
7173,743103,664-370104,03446,121223,52845,383127,46235,96450,683 2011/12
8490,481106,904-828107,73246,447243,83246,464123,62534,38873,743 2012/13
94102,432108,532-513109,04540,024250,98840,080120,42732,74490,481 2013/14
99110,254111,376-76111,45233,814255,44433,735119,27733,829102,432 2014/15
92106,292115,197-95115,29233,662255,15133,646111,25131,765110,254 2015/16
Foreign Agricultural Service/USDA May 2015Office of Global Analysis

Table 10: United States Cotton Supply and Distribution
(1,000 HA and 1000 480-lb. Bales)
Country Mktg
Year
Area
Harvested
Yield Beginning
Stocks
Production Imports Total
Supply
Exports Use Loss Ending
Stocks
Stock to
Use %
United States
193,000-1436,5069,22918,592514,6293,9586135,193 1979/80
232,668-3355,8915,92614,1502811,1223,0004535,348 1980/81
566,632-1235,2646,56718,3402615,6462,6686085,601 1981/82
747,937-425,5135,20718,6152011,9636,6326613,939 1982/83
222,7752385,9216,78615,720127,7717,9375692,973 1983/84
354,102-745,5386,21515,7812412,9822,7756734,200 1984/85
1129,348-1546,4131,96017,5673313,4324,1027064,140 1985/86
365,026-807,4526,68419,08239,7319,3486183,427 1986/87
415,771-1827,6176,58219,788214,7605,0267924,059 1987/88
517,0921657,7826,14821,187515,4115,7716944,835 1988/89
183,000-1638,7597,69419,290212,1967,0926883,860 1989/90
142,344-2858,6577,79318,509415,5053,0007114,748 1990/91
233,70489,6136,64619,9711317,6142,3447315,245 1991/92
304,662-19010,2505,20119,923116,2183,7047854,501 1992/93
203,530-810,4186,86220,802616,1344,6626795,173 1993/94
132,650-3811,1989,40223,2122019,6623,5307945,391 1994/95
142,6092710,6477,67520,95840817,9002,6506026,478 1995/96
223,971-811,1266,86521,95440318,9422,6097915,216 1996/97
213,8874111,3497,50022,7771318,7933,9717545,425 1997/98
273,939-39410,4014,29818,24443913,9183,8877014,324 1998/99
233,91514510,1946,75021,0049716,9683,9396805,433 1999/00
386,000-4838,8626,74021,1191617,1883,9157085,282 2000/01
407,4481807,69611,00026,3242120,3036,0007905,596 2001/02
285,3851667,27311,90024,7246717,2097,4487465,025 2002/03
173,4502116,26613,75823,6854518,2555,3858184,858 2003/04
265,4951086,69114,43626,7302923,2513,4509585,284 2004/05
266,069-2005,87117,67329,4132823,8905,4959315,586 2005/06
539,4793034,93512,95927,6761921,5886,0699125,152 2006/07
5510,0514294,58413,63428,6981219,2079,4799854,245 2007/08
386,337-2633,54113,26122,876012,82510,0519123,063 2008/09
192,947-143,55012,03718,520012,1836,3378703,049 2009/10
142,6001823,90014,37621,058918,1022,9479104,330 2010/11
223,350-1723,30011,71418,1921915,5732,6008863,829 2011/12
233,8003483,50013,02620,6741017,3143,3509993,772 2012/13
172,4501923,55010,53016,7221312,9093,8009213,053 2013/14
314,400293,65010,70018,7791016,3192,4509393,783 2014/15
304,400103,80010,70018,9101014,5004,4009073,480 2015/16
Foreign Agricultural Service/USDA May 2015Office of Global Analysis

Table 11: Foreign Cotton Supply and Distribution
(1,000 HA and 1000 480-lb. Bales)
Country Mktg
Year
Area
Harvested
Yield Beginning
Stocks
Production Imports Total
Supply
Exports Use Loss Ending
Stocks
Total Foreign
18,23215359,39821,43399,21630,50150,81717,89840927,026 1979/80
17,94130259,13020,33997,71227,22552,25518,23242127,021 1980/81
19,20236258,04519,19796,80625,67253,19317,94142427,337 1981/82
17,51734461,45320,30899,62226,05154,36919,20243127,455 1982/83
21,50625862,75918,547103,07027,04758,50617,51745627,947 1983/84
38,02454865,27820,985124,83527,60575,72421,50655829,541 1984/85
38,24140668,91726,118133,68228,94866,71038,02452927,441 1985/86
30,39125974,64326,666131,95933,09060,62838,24150925,920 1986/87
26,83871676,52923,521127,60430,52766,68630,39154226,812 1987/88
23,95847777,45627,333129,22433,57768,80926,83851728,996 1988/89
21,97839778,14623,663124,18432,70167,52523,95852827,836 1989/90
25,12345576,86721,767124,21230,57471,66021,97854928,405 1990/91
33,26136076,57521,558131,75429,01177,62025,12357329,513 1991/92
29,84225376,08720,234126,41627,06666,08933,26151128,142 1992/93
24,29715175,14219,758119,34827,96161,54529,84252525,545 1993/94
29,364-29273,42418,716121,21230,28066,63524,29754026,859 1994/95
37,520-57175,29319,721131,96326,59676,00329,36456229,442 1995/96
40,662-57776,81019,912136,80728,17671,11137,52054328,524 1996/97
45,580-62275,91819,277140,15325,91673,57540,66256528,372 1997/98
48,913-72074,36419,219141,77624,04172,15545,58055028,561 1998/99
47,225-74780,89320,376147,74727,87970,95548,91357426,917 1999/00
43,545-94183,34119,416145,36126,21371,92347,22558626,730 2000/01
47,134-96186,81118,066151,05029,30178,20443,54560528,123 2001/02
42,373-97091,21418,500151,11730,16673,81747,13462425,751 2002/03
44,846-1,12091,83719,399154,96234,13078,45942,37362227,485 2003/04
55,386-1,353102,53720,498177,06833,95698,26644,84670430,411 2004/05
55,741-1,593111,11227,234192,49444,66592,44355,38669029,184 2005/06
53,595-2,018119,36624,492195,43538,272101,42555,73875029,450 2006/07
52,349-2,523119,26025,319194,40539,440101,37053,59577028,650 2007/08
55,861-1,273106,95516,871178,41430,59095,47552,34975427,571 2008/09
44,278-48116,17923,616184,02536,98891,17655,86173027,188 2009/10
48,082-173111,73520,835180,47936,75099,45144,27874229,196 2010/11
70,392-198100,73034,407205,33145,360111,88948,08275832,135 2011/12
86,680-1,176104,22833,421223,15346,450106,31170,39275630,616 2012/13
99,980-705105,49029,494234,25940,061107,51886,68078829,691 2013/14
105,852-105107,79723,114236,65833,720102,95899,98074630,046 2014/15
101,890-105111,48722,962236,23433,63196,751105,85274528,285 2015/16
Foreign Agricultural Service/USDA May 2015Office of Global Analysis