department of chemistry university of botswana
TRANSCRIPT

______________________________________________________________________________
ELUCIDATION OF STRUCTURE − PROPERTY CORRELATIONS USING
EXPERIMENTAL NUCLEAR MAGNETIC RESONANCE (NMR) AND FOURIER
TRNSFORM INFRARED (FTIR) SPECROSCOPY ANALYSIS, AND DENSITY
FUNCTIONAL THEORY (DFT) CALCULATIONS OF THE DIFURYLMETHANE
(DFM) MOLECULE, AND DIFURYLMETHANE-METHANOL CLUSTERS
_____________________________________________________________________________
By
Kago Dikomang
[email protected] (+267) 75366278
BSc General (Chemistry & Mathematics) University of Botswana, 2013
Department of Chemistry
University of Botswana
A dissertation Submitted to the Faculty of Science in Partial Fulfillment of the
Requirements for the Award of the Degree of Master of Science in Physical Chemistry
Principal Supervisor: Baagi Thema-Mmereki, PhD
Co-Supervisor: Wilfred Ddamba, PhD
February 2019

i
COPYRIGHT AND DECLARATION
“I hereby declare that the dissertation submitted for a Master of Science Degree in Chemistry at
the University of Botswana, is my own original work and has not been previously submitted to
any other institution and any work quoted is indicated and acknowledged by means of a
comprehensive list of references.”
__________________________________________
KAGO DIKOMANG (ID number: 200102106)
Date……/……./2019
© 2018 UB. All rights reserved

ii
CERTIFICATION
The undersigned certify that they have read and hereby recommends for acceptance by the Faculty
of Science a dissertation/thesis titled “ELUCIDATION OF STRUCTURE − PROPERTY
CORRELATIONS USING EXPERIMENTAL NUCLEAR MAGNETIC RESONANCE (NMR) AND
FOURIER TRNSFORM INFRARED (FTIR) SPECROSCOPY ANALYSIS, AND DENSITY
FUNCTIONAL THEORY (DFT) CALCULATIONS OF THE DIFURYLMETHANE (DFM)
MOLECULE, AND DIFURYLMETHANE-METHANOL CLUSTERS’’, in fulfillment of the
requirements for the degree of Master of Science in Physical Chemistry at University of Botswana.
Dr. Baagi T. Mmereki. PhD
……..…………………….
(Principal Supervisor)
Dr. Wilfred Ddamba. PhD
……..…………………….
(Co-Supervisor)
Date….../...…/2019

iii
ACKNOWLEDGEMENTS
My sincere thanks go to my MSc supervisor Dr. Baagi T. Mmereki for his inspirational
instructions, patient guidance and endless source of knowledge to my thesis.
I would also like to acknowledge members of my research committee Dr. Wilfred Ddamba as a
Co-Supervisor and Dr. Thabo T. Mokoena as a member for their guidance and comments.
Especially I acknowledge Dr. Zibo G. Keolopile who is a Chemical Physicists for instructions,
discussions and comments on matters relating to computational chemistry.
I also feel indebted to my financial support by the University of Botswana Foundation and the
Department of Chemistry for making this journey possible.
Last, my great gratitude goes to my family for their support and patience during my research
period.

iv
DEDICATION
To my late grandmother Mrs. Keleofile Dikomang.
v
CONTENTS
COPYRIGHT AND DECLARATION............................................................................................ i
CERTIFICATION .......................................................................................................................... ii
ACKNOWLEDGEMENTS ........................................................................................................... iii
DEDICATION ............................................................................................................................... iv
CONTENTS .................................................................................................................................... v
LIST OF TABLES ........................................................................................................................ vii
LIST OF FIGURES ....................................................................................................................... ix
ABSTRACT .................................................................................................................................... x
1 INTRODUCTION ................................................................................................................... 1
1.1 Scope of the Study............................................................................................................ 2
1.2 Objectives ......................................................................................................................... 3
1.3 Intermolecular Interactions .............................................................................................. 3
1.3.1 Molecular Structural Parameters............................................................................... 5
1.3.2 Binding Energies ....................................................................................................... 6
1.3.3 Molecular Vibrations / Infrared Spectral Analysis ................................................... 7
1.3.4 Natural Bond Orbital (NBO) Analysis ..................................................................... 8
1.3.5 Molecular electrostatic potential (MEP) map ........................................................... 9
1.3.6 AIM Analysis ............................................................................................................ 9
1.3.7 Molecular Mechanics (MM) and Ab-initio study of DFM-n-propanol .................. 10
2 METHODOLOGIES ............................................................................................................. 10
2.1 EXPERIMENTAL METHODS ..................................................................................... 10
2.1.1 Materials and purification of solvents..................................................................... 10
2.1.2 Purification of solvents ........................................................................................... 10
2.1.3 Preparation of the difurylmethane (DFM) .............................................................. 11
2.1.4 Sample preparation for NMR Analysis................................................................... 13
2.1.5 Sample preparation for IR spectral analysis ........................................................... 13
2.2 COMPUTATIONAL METHODS ................................................................................. 13
2.2.1 Hartree-Fock (HF) .................................................................................................. 13

vi
2.2.2 Density Functional Theory (DFT) .......................................................................... 15
2.2.3 The Formulation of Basis Sets ................................................................................ 16
2.2.4 Equilibrium structures ............................................................................................. 18
2.2.5 Polarizability and dipole moment ........................................................................... 20
3 RESULTS AND DISCUSSION ............................................................................................ 24
3.1 Equilibrium structures .................................................................................................... 24
3.2 Infrared spectral data ...................................................................................................... 28
3.3 Gauge Independent Atomic Orbital (GIAO) calculated chemical shifts and 1-dimensional
experimental proton nuclear magnetic resonance (1-Dimensional 1H-NMR) chemical shifts . 34
3.4 Geometric Parameters of DFM-Methanol adducts ........................................................ 41
3.4.1 Molecular electrostatic potential map ..................................................................... 45
3.4.2 Potential Energy Surface (PES) Scan ..................................................................... 46
3.4.3 Natural Bond Orbital Analysis................................................................................ 51
4 SUMMARY & CONCLUSIONS ......................................................................................... 53
References ..................................................................................................................................... 54
Appendices:................................................................................................................................... 62
Appendix A. Conformers of DFM ................................................................................................ 62
Appendix B. Conformers of DFM-Methanol obtained from relaxed potential energy scan ........ 63

vii
LIST OF TABLES
Table 1.1: Classification of Hydrogen Bonds [19] ........................................................................ 4
Table 2.1: Experimental (measured using microwave spectroscopy) and theoretical equilibrium
structure for Furan bond lengths in angstroms optimized at different levels of theory and basis sets
(in Å). Calculations in this work were performed using B3LYP/6-31+ (3d, 3p) ......................... 19
Table 2.2: Experimental (measured using microwave spectroscopy) and theoretical equilibrium
structure for Furan bond angles optimized at different levels of theory and basis sets in degrees
(θ). Calculations in this work were performed using B3LYP/6-31+(3d,3p). ............................... 21
Table 2.3: Equilibrium geometry and dipole moment for furan calculated at different levels of
theory with 6-31G** basis set....................................................................................................... 22
Table 2.4: Polarizability components for furan calculated as different levels of theory and basis
sets................................................................................................................................................. 23
Table 2.5: Experimental and Theoretical dipole moment (μ) of furan calculated using different
model chemistries ......................................................................................................................... 23
Table 3.1: Equilibrium bond distance (re) of DFM calculated at B3LYP/6-31+G (3d, 3p) in
Angstroms ..................................................................................................................................... 25
Table 3.2: Equilibrium bond angles (θe) of DFM calculated at B3LYP/631+G(3d,3p) in degrees
....................................................................................................................................................... 26
Table 3.3: Different energetics of 4 conformers of DFM molecule ............................................. 27
Table 3.4: Experiment and calculated Harmonic frequencies and intensities calculated at B3LYP
+G 631(3d, 3p), DFM molecule ................................................................................................... 32
Table 3.5: NMR chemical shifts obtained from experimental and calculated at B3LYP/IGLO-2
for DFM MOLECULE. TMS, σiso=32.0092 (IUPAC numbering system is represented as H-3, H-
4, H-5 and H-6 and are highlighted) ............................................................................................. 39
Table 3.6: Theoretical NMR nuclear coupling constants ............................................................. 39
Table 3.7: 1H-NMR (300 MHZ NMR data for difurylmethane in CDCl3) ................................ 39
Table 3.8: The calculated O-H bond in the DFM-MeOH complex and intermolecular bond
distance and bond angles. ............................................................................................................. 44
Table 3.9: Calculated binding energy (BEa), Counterpoise energy (∆ECP)b, Energy for Methanol
(Ec) and DFM (Ed) monomers in DFM-MeOH complex geometry and Enthalpy of formation (H)f
and Gibbs free energy in kcal/mol ................................................................................................ 44

viii
Table 3.10: Potential energy data points σ-type (structure A) furan-methanol complex obtained by
performing rigid (manual) scan .................................................................................................... 48
Table 3.11: Potential energy data points π-type (structure B) furan-methanol complex obtained by
performing redundant scan ........................................................................................................... 49
Table 3.12: The stabilization energy, Fock-matrix and energy gap between HOMO and LUMU
orbitals........................................................................................................................................... 52
Table 3.13: The atomic charges of DFM-MeOH complex .......................................................... 52

ix
LIST OF FIGURES
Figure 1.1: Structure of difuryl methane ....................................................................................... 2
Figure 1. 2: Schematic of Hydrogen bonding showing donor acceptor rearrangement ........ 4
Figure 1.3: The optimized hydrogen bonded adduct of furan-water cluster showing classical (O-
H•••O) and non-classical (O-H•••π) hydrogen bonding, Adapted from Kaur and co-workers [ .... 6
Figure 2.1: Synthesis process of DFM ....................................................................................... 12
Figure 2.2: Molecular structure of furan ...................................................................................... 19
Figure 3.1: Equilibrium structure of DFM (Global minimum) and the Equilibrium structure of
DFM (showing numbering according to IUPAC) ........................................................................ 24
Figure 3.2: Conformational structures of DFM molecule............................................................ 27
Figure 3.3: Experimental and calculated proton NMR spectra for DFM molecule calculated at
B3LYP/ 6-31+G(3d, 3p) ............................................................................................................... 38
Figure 3.4: Experimental 1H- NMR spectrum of DFM in CDCl3 .............................................. 40
Figure 3.5: σ-type hydrogen bonding as calculated at B3LYP+G(3d,3p) level of theory ........... 44
Figure 3.6: π-type hydrogen bonding scheme as calculated at B3LYP+G 6-31(3d, 3p) level of
theory ............................................................................................................................................ 45
Figure 3.7: Molecular electrostatic potential map (MEP) OF DFM ............................................ 46
Figure 3.8: Potential energy surface of Complex A ..................................................................... 47
Figure 3.9: Relaxed energy scan profile ..................................................................................... 50

x
ABSTRACT
Ab Initio Hatree-Fock (HF) and Density Functional Theory (DFT) are used to study the molecular
structure of difurylmethane (DFM) and its interaction with methanol (MeOH) in the formation of
DFM-MeOH complexes. The molecular structure of difurylmethane is further probed by using
experimental proton nuclear magnetic resonance (1H-NMR), gauge including atomic orbital
nuclear magnetic resonance (GIAO-NMR), Fourier transform infrared (FTIR) spectroscopy
analysis to elucidate any structure-property relations which may play a role in the DFM-MeOH
complex formation.
Conclusions from previous work in the researcher’s laboratory on ultrasonic speeds and volumetric
studies of mixtures of DFM and a series of (C1-C6)-n-alkanol binary solutions underpins dipole-
dipole interactions and possibly hydrogen bonding as the main intermolecular forces between
molecules in the solution. To probe this further a theoretical and experimental investigations on
the system is required. The scope of this work is to study the interactive behavior of DFM-MeOH
complex system through computational methods using relevant model chemistries.
The geometries of DFM molecular structures were optimized without symmetry constraints, using
Gaussian ’09 package with B3LYP / 6-31+G (3d, 3p) method. The nature of stationary point was
evaluated using harmonic frequency analysis and it was confirmed to be a local minimum in the
potential energy surface. The potential energy surface scanning tool (PESST) was used to generate
12 conformational structures of DFM, by varying the angle between two furanic rings at an
increment of 30 degrees. The global minimum in the Potential Energy Surface is located when the
oxygen atoms in the furan rings are as far away from each other as possible and on opposite sides.
Results from experimental 1H-NMR and FTIR spectroscopy analysis of the DFM molecule agree
with the molecular structure obtained from computational B3LYP/6-31+G(3d,3p) methodology
For the DFM-Methanol complexes, two equilibrium complexes were obtained and identified as
either σ-type or π-type configurations where the –OH moiety of the methanol with the oxygen
atom of the furan ring in the σ-type and the –OH interacts with the π-system of the furanic ring in
the π-type configuration respectively. The basis set superposition error (BSSE) and thermal energy
(calculated under the harmonic-rigid rotor approximation) corrected stabilization energies

xi
associated with the σ-type and π–type configurations are -3.16 kcal / mol. and -1.89 kcal / mol.
suggesting that the σ-type configuration is the most favorable interaction. In a different study
Kgagodi and Mbaiwa did similar study on DFM-n-propanol binary mixture (employing Molecular
Mechanics and ab-initio methods) looking at the thermodynamic properties and structure. The
results obtained from radial distribution functions and ab-initio calculations show evidence of
hydrogen bonding between n-propanol and DFM via the acidic hydrogen of -OH group in MeOH
and the hetero atom of DFM which is agreement with conclusions from this study on the most
probable interaction between DFM and R-OH.
1
1 INTRODUCTION
Forces of interaction that exist between molecular species often give rise to the formation of
clusters and/or bulk phases. Studies of intermolecular interaction allow us to understand many
phenomena in science such as the shapes and properties associated with biological and synthetic
macromolecules [1]–[4]. The underlying difference in the nature of intermolecular interactions
gives rise to disparity in physical properties in clusters and bulk phases e.g. the self–association of
water molecules in a bulk phase that occurs through hydrogen bonding and also intra-molecular
interactions (dipole-dipole interactions) of tertiary amines contributes to differences in viscosity,
boiling point and solubility properties of these two systems. Some of these differences in properties
such as in boiling points and solubility ratios occurring between different components in a solution
mixture are utilized in separation science. They are used to augment the efficiency of separation
of various components in solution mixtures such as in solvent extraction and distillation methods.
Another example is found in processes involving chelating compounds which are the result of
hydrogen bonding of different species binding together through two or more sites of one molecule
to another. The implication of hydrogen bonding in biological systems ranges from the essence of
protein folding to formation of DNA molecular structure. In the folding of proteins for example,
hydrogen bonding can occur between the hydrogen of an amine and an electronegative element
such as oxygen in another residue as a protein folds into place; in addition hydrogen bonds hold
complementary strands of DNA together. [1]
In recent investigations in the writer’s research laboratory [5]–[7], experimental work (using
ultrasonic speeds and density measurement) was done to study the nature of intermolecular forces
that occur between difurylmethane (DFM) and (C1-C6)-n-alkanol binary solutions [5], DFM with
(C5-C8)-n-alkanes (n-pentane, n-hexane, n-heptane, n-octane1 ) [6] or amides (N-
methylformamide, N-ethylformamide, N,N-dimethylformamide, N,N-dimethylacetamide) [7]
over the entire composition range (0 to 1 in the mole fraction scale) at various temperatures. Thus
thermodynamic properties such as volumetric changes were used to yield useful information about
the system’s intermolecular interactions and its internal behaviour. These volumetric properties
were found not to be additive (as in 1+1≠ 2) and as such do not show ideal behaviour: Deviations
from ideal behaviour are determined from thermodynamic parameters of solution mixtures such
as excess molar volume, excess partial molar volume and limiting partial molar volume in the
previous work [5]–[7] and elsewhere [8]–[11].

2
Difurylmethane (DFM) was first identified by Dunlop and co-workers [12], in 1953 as one of the
products of furfuryl alcohol oligomerization. DFM has since found wide utility as an alternative
substitute for diphenyl methane [13], [14]. DFM is an aprotic solvent and its molecular species
self-associate through dipole-dipole interactions giving rise to a pure dipolar fluid [5], [6]. DFM
is made of two furan rings linked by a methylene group as shown in Figure 1.1 below.
Figure 1.1: Structure of difuryl methane
Conclusions from previous work in the writer’s research laboratory [5]–[7] on volumetric changes
of a mixture of DFM and a series of (C1-C6)-n-alkanol binary solutions underpin dipole-dipole
interaction and possibly hydrogen-bonding as the underlying intermolecular forces between
molecules in the system. To probe this further a theoretical and an experimental investigation on
the system is required.
1.1 Scope of the Study
The scope of this work is to study the interactive behaviour of a DFM + methanol complex system
through computational methods using relevant model chemistries. Hartree-Fock (HF) and Density
Functional Theory (DFT) procedures are used in combination with 6-31+G (3d, 3p) basis set to
characterize the DFM molecule and then DFM-Methanol complexes. The choice of the Model
Chemistry (DFT or HF and associated basis sets and what they represent are explored and detailed
under Section 2.2 Computational Methods). These computational calculations are used to
determine the nature of intermolecular interactions within the DFM-Methanol complex. For the
DFM molecule experimental Infra-Red (IR), proton nuclear magnetic resonance (1H-NMR) and
computational work are compared to our own spectral calculations on DFM using Hartree-Fock
and DFT methods. This will be discussed in detail under results and discussions.

3
In this study, preliminary investigations are done on a furan molecule, which is a structural moiety
of DFM, in order to help us select the most appropriate model chemistry suitable for our work.
There are several model chemistries used in the preliminary study of furan to decipher electronic
structure properties such as dipole moment, equilibrium structure and polarizability. The model
chemistries employed involve: B3LYP/ G(d), B3LYP/ 6-31+G(d,p) and B3LYP/ 6-31+G(3d,3p).
There is extensive literature on the comparison between theoretical and experimental molecular
structural properties of furan which gives a platform to decipher the most appropriate model
chemistry to use for DFM. In the preliminary investigations Furan was first optimized to identify
equilibrium structures with more computational work done to determine its net dipole moment and
static polarizability and these are compared with experimental values where possible. Molecular
parameters of the equilibrium structure of furan, such as bond lengths and bond angles are
compared to literature values as well as the net dipole moment and static polarizability. The most
efficient model chemistry (6-31+G(3d,3p)), for furan is then adopted for further work on DFM-
Methanol following this investigation through a potential energy scan to obtain a global minimum
representative isomer of DFM.
In the following section we explore intermolecular interactions in general and discuss a platform
which focuses on the system of interest for the (DFM + MeOH) binary system.
1.2 Objectives
The objectives of this work is to study the structural parameters and properties of DFM and DFM-
MeOH complexes. The nature of intermolecular interactions between the two monomers; DFM
and MeOH will be interrogated using computational simulations.
1.3 Intermolecular Interactions
Intermolecular interactions are ubiquitous in virtually all areas of science. The hydrogen bond (X-
H· · ·A) in particular [15], [17], [18] is central to chemistry and biology. A hydrogen bond is an
electrostatic attraction between two polar groups (one a donor and the other an acceptor) that
occurs when a hydrogen (H) atom, bound to a highly electronegative atom such as nitrogen (N),
oxygen (O), or fluorine (F), experiences the electrostatic field of another highly electronegative
atom nearby [19].

4
Hydrogen bonds can occur between molecules (intermolecular) or within different parts of a single
molecule (intramolecular). Depending on the nature of the donor and acceptor atoms which
constitute the bond, their geometry, and environment, the energy of a hydrogen bond can vary
between 1 and 40 kcal/mol. This makes the hydrogen bond somewhat stronger than a van der
Waals interaction, and weaker than covalent or ionic bonds. This type of bond can occur in
inorganic molecules such as water and in organic molecules like DNA and proteins. A comparison
and classification and terminology of hydrogen bonds is shown in Figure 1.1 and Table 1.1 below
A-H B
Figure 1. 2: Schematic of Hydrogen bonding showing donor acceptor rearrangement
Table 1.1: Classification of Hydrogen Bonds [19]
The importance of hydrogen bonding interactions in nature, such as O-H· · ·π, C-H· · · O, C-H· ·
·π, and N-H· · ·π, have been identified [20]. There are two categories of intermolecular hydrogen
bonding types namely classical and non-classical hydrogen bonding. The classical hydrogen
bonding involves the F, O, N atoms within the bonding fragments i.e. O-H· · ·O, O-H· · ·F and O-
H· · ·N. In contrast the non-classical hydrogen bonding type may involve one species not being

5
one of the N, O and F atoms i.e. O-H· · ·π, C-H· · · O, C-H· · ·π, and N-H· · ·π bonds [21]. Previous
experimental and computational studies have been undertaken in the areas of classical and non-
classical hydrogen bonding in a vast number of systems. In non-classical H-bonding the interaction
scheme of the type O-H· · ·π has received widespread attention [22]–[28]. Kaur and co-workers
[29] did a study on heterocyclic-water adducts e.g. the furan-water adduct was examined and
essentially classified as an example of a system that interacts through both types of hydrogen
bonding schemes. In general two types of hydrogen bonding scheme within the furan-water cluster
was established and it is of the following type: O-H···π and O-H···O [11], [15]–[17]. It was
observed that the O-H· · · O configuration is the global minimum due to the presence of contracted
lone pairs as opposed to highly delocalized electrons in π-cloud around the furanic ring system. In
the O-H· · ·π bonding type, a proton of the O-H group points directly to the site of β-carbon of
furan ring [21], [29]–[31].
Other investigations on the nature of intermolecular interaction present in heterocyclic (such as
furanic-water) systems sought to address the following research questions
1.2.1 Molecular structural parameters (bond length and bond angles);
1.2.2 Binding energies (BEs) between molecules;
1.2.3 Molecular vibrations via infrared spectroscopy;
1.2.4 Natural bond orbital (NBO) analysis ;
1.2.5 Molecular electrostatic potential (MEP) maps which give insight into the nature of the
interactions of pyridine, furan and thiophene with LiNH3 [30] and
1.2.6 Bader’s atom in a molecule (AIM) analysis was employed in a study of Benzene (B)-Water
(W), BZWn (n=1-10) clusters [20].
1.2.7 Molecular mechanics and ab-initio study of DFM-n-propanol
These are explored in detail as follows:
1.3.1 Molecular Structural Parameters
The study of intermolecular bond distances often provides essential information about the nature
of hydrogen bonding and changes in structural parameters of the individual molecules in the cluster

6
due to complex formation. In the area of structural parameters Kaur and co-workers [29] looked
into r(O-H· · ·π) and r(O-H· · · O) bond distances in a furan-water cluster (see Figure 1.2 below).
Figure 1.3: The optimized hydrogen bonded adduct of furan-water cluster showing classical (O-
H•••O) and non-classical (O-H•••π) hydrogen bonding, Adapted from Kaur and co-workers [29]
It was established that the classical hydrogen bonding O-H···O is the predominant configuration
of the two bonding schemes. The intermolecular distances r(C-H··· O), r(O-H···π) and r(O-H···
O) agree well with the experimental values [31]. In general hydrogen bonding is obtained when
the intermolecular bond distance is less than the Van der Waals atomic radii of the two binding
fragments. Furthermore the classical hydrogen bonding scheme features a much smaller
intermolecular bond distance that is less than the bond distance associated with the non-classical
hydrogen bonding scheme and thus molecular geometry is a useful feature in the classification of
hydrogen bonding [31].
1.3.2 Binding Energies
Binding energies (BEs) have profound implications in classification of hydrogen bonds [16]. Since
different types of hydrogen bonding configurations (classical and non-classical bonds) are
associated with unique values of stabilization or binding energies. Binding energies (BE’s) are
calculated and corrected for basis set superposition error (BSSE) and zero point vibrational energy
(ZPE). The BSSE calculations are done in this work.

7
The Boys and Bernadi counterpoise correction (CP) procedure was employed to remove BSSE
[32]. The uncorrected interaction energies between monomer A (DFM) and monomer B (MeOH)
were calculated as:
Eint (AB) = 𝐸𝐴𝐵𝐴𝐵(AB) -𝐸𝐴
𝐴(A) -𝐸𝐵𝐵(B) (1.1)
Where the superscripts denote the basis used the subscripts denotes the geometry and the symbol
in brackets denote the chemical structure considered.
THUS , 𝐸𝐴𝐵𝐴𝐵(AB) represents the dimeric complex AB (DFM-MeOH) evaluated in the dimer basis
sets. Likewise , monomers A and B were evaluated at their own geometries and basis. The
correction to BSSE was evaluated as:
EBSSE (A) =𝐸𝐴𝐴𝐵(B) - 𝐸𝐴
𝐴(A) (1.2)
EBSSE (B) = 𝐸𝐵𝐴𝐵(B) - 𝐸𝐵
𝐵(B) (1.3)
The energy of monomer A in its monomer bais is substituted from energy of monomer A in the
dimer basis (and likewise for monomer B) [32].
The Boys and Bernadi counterpoise correction is calculated as:
E 𝑖𝑛𝑡𝐶𝑃 (AB) =𝐸𝐴𝐵
𝐴𝐵- 𝐸𝐴𝐴𝐵- 𝐸𝐵
𝐴𝐵 (1.4)
A study done by Daiqian [31] compared the energy of geometries between two structures (A)
and (B) where structure (A) is Cl-H· · · O and structure (B) is Cl-H· · · π which are both formed
through a non-classical hydrogen bonding to a heteroatom and a π-system. The energy profiles of
both structures show that structure (A) corresponds to a global minimum. There is a strong
correlation between the binding energy BE (O···H) and the distance r(O···H) than to BE (π ···H)
and r (π···H), since the lone pair electrons in the O are more contracted (localized) than π electrons.
The results show that the interaction of Cl-H···O is stronger than that of Cl-H···π.
1.3.3 Molecular Vibrations / Infrared Spectral Analysis
The nature of hydrogen bonding (classical or non-classical) can be studied using infrared (IR)
spectral analysis. In theory, due to the nature of interaction of hydrogen acceptor-hydrogen donor

8
atoms, X-H· · · Y (where Y is hydrogen acceptor atom and X-H is hydrogen donor group), the
r(X-H) bond distance can either elongate or shorten during complexation. This change in r(X-H)
bond distance can result in either red shift (r(X-H) bond elongation) or blue shift (r(X-H) bond
contraction) in vibrational frequency. By studying the extent of IR frequency shift and change in
peak intensity we can successfully classify the type of intermolecular bonding scheme into either
classical or non-classical hydrogen bonding. In all of the optimized X-H · · ·Furan (where X= O,
N, Cl or F), the X-H bond length is elongated and its vibrational frequency is red shifted with
subsequent increase in intensity. This behaviour is somewhat similar to that observed in spectral
analysis of conventional hydrogen bonding schemes; for example X-H · · ·Furan (where X= O, N
or F). In a study conducted by Xie and co-workers [31] on the nature of intermolecular interactions
within HCl-Furan complex, it was uncovered that the change in H-Cl vibrational frequency is
negative (thus the measured H-Cl frequency after complexation is smaller than the frequency of
free fragment) - indicative of the ongoing red shift [30], [31], [33]–[37].
1.3.4 Natural Bond Orbital (NBO) Analysis
Another method of studying hydrogen bonding is the Natural Bond Orbital (NBO) analysis;
whereby the hydrogen bond acceptor abilities of heteroatom and the π-electron cloud of the ring
are compared. The NBO analysis was used to study the furan-water complex [29]. The energy gap
between HOMO (furan) and LUMO (water) determines the overlapping strength between these
two frontier orbitals. Thus in the NBO analysis we can mention two types of hydrogen bonding
interactive schemes, namely σ-type (O-H···O) and π-type (O-H···π) hydrogen bonding. In the first
configuration (σ-type) there is a hydrogen bond transfer from donor orbital (σ* or O-Hwater)
towards heteroatom (O, lone pair) acceptor orbital whereas the second configuration involves
hydrogen bond transfer towards the β-carbon of the ring. The magnitude of overlap between
bonding NBO and anti-bonding NBO frontier orbitals can be measured using second order
perturbation energy. The second order stabilization (Perturbation) energy, (E2) is associated with
electron delocalization for instance in the case of furan from n (lone-pair) →π* or π→π*. E2 is
represented by the equation:
E2=-2(Fij/∆Eij) (1.5)

9
Where ∆Eij = Ei-Ej is the difference in energy between the interacting molecular orbitals i and j, Fij
is the Fock matrix elements for the interaction between orbitals i and j.
In a system involving hydrogen bonding between furan and methanol, which is somewhat similar
to the system involving difurylmethane-methanol which is under investigation for this study, there
are two types of interactive schemes (σ-type (O-H···O) and π-type (O-H···π)) also known as
classical and non-classical hydrogen bonding schemes. The σ-type occurs at the lone pair site of
the hetero atom (which is Oxygen) but the π-type configuration occurs at β-carbon of the furanic
ring. Using the computed magnitude of second order perturbation energy done by various workers,
[29]–[31] it is noted that the classical hydrogen bonding or the σ-type configuration is the most
stable energy structure compared to non-classical or the π-type configuration [29]–[31] and this
hypothesized to be similar in the DFM-MeOH complex under study herein.
1.3.5 Molecular electrostatic potential (MEP) map
Molecular electrostatic potential (MEP) map is an important tool in exploring the nature of
intermolecular interactions. Hua Yan and co-workers [30] did a plot of 3-dimensional MEP map
around furan ring to estimate its bonding aspects with relevant molecular structure while working
with furan- LiNH2 complex.
From this map (furan) of potential energy surface, it was elucidated that both the immediate
vicinity of the O atom and the region above the ring show noticeable negative electrostatic
potential thus resulting in two generic configuration schemes for Furan-X dimer (where X=
hydrogen bond donor molecule) [30]. The potential site of hydrogen bonding in furanic rings
giving rise to the most stable complex as elucidated by MEP is in agreement with that suggested
by Molecular Structural Parameters, Natural Bond Orbital (NBO) Analysis, and Binding Energies
as discussed in Sections 1.2.1, 1.2.2 and 1.2.4 above respectively.
1.3.6 AIM Analysis
The atom in a molecule (AIM) analysis is a useful tool to measure the hydrogen bonding using the
calculated electron densities and Laplacian [23], [29] Similar studies to those done on furan-X

10
(elucidating the nature of intermolecular forces) were conducted on benzene(B)-Water(W) (BZWn
(n=1-10) ) [21] by surveying the geometries, BEs, IR spectroscopy and AIM analysis of the
complexes. The AIM analysis somehow revealed three types of bonding schemes in BZWn (n=1-
10) clusters; O-H•••π cloud, C-H•••O (W) and O-H•••O (furan), and evidence of red shift in the
O-H stretching frequency
1.3.7 Molecular Mechanics (MM) and Ab-initio study of DFM-n-propanol
In a different study Kgagodi and Mbaiwa [30] have investigated the DFM-n-propanol binary
mixture using Molecular Mechanics simulations to look at the thermodynamic properties and
structure of the system. The data obtained from radial distribution functions and ab-initio
calculations show evidence of hydrogen bonding between n-propanol and DFM via the acidic
hydrogen atom of -OH group and the hetero atom (Oxygen) of DFM. The results reported for
DFM-n-propanol complex are in agreement with the results reported herein (vide infra) for DFM-
MeOH complex employing Density Functional Theory calculations.
2 METHODOLOGIES
2.1 EXPERIMENTAL METHODS
2.1.1 Materials and purification of solvents
For experimental work, the following chemicals were used: acetone (Skylabs chemicals, analytical
reagent, 99%), acetonitrile (E-lab Direst Limited chemicals, spectral reagent, 99.5%), ammonia
solution (Rochelle chemicals, 25%), furan (Merck Co., 99.0%), furfuryl alcohol (Merck Co.,
98.0%), borontrifluoridedietherate catalyst (Sigma-Aldrich Chemicals Co., 99.0%), sodium
hydroxide pellets (Rochelle Chemicals, 99.0%), anhydrous sodium carbonate (Glassworld,
analytical reagent, 99.5%), ethanol (Sigma-Aldrich Chemicals, 99.5%), molecular sieves (Sigma-
Aldrich).
2.1.2 Purification of solvents
Acetonitrile: This solvent was purified by distillation using 1 metre fractionation column fitted
with glass beads. The purified Acetonitrile was then stored in tightly stoppered bottles to prevent
atmospheric contamination.

11
Ultrapure water: Distilled water was first de-ionized by means of ion exchange resins, then
refluxed over KMnO4 and finally doubly distilled under nitrogen flow using a two-stage Heraeus
Destamat quartz still instrument. Its conductivity was always less than 1.0 x 10⁻⁶ S-cm-1.
2.1.3 Preparation of the difurylmethane (DFM)
Difurylmethane (DFM) was prepared in accordance to the modified method from the literature
[38]. Acetonitrile was first distilled before preparation of the reaction mixture. To minimize the
self-polymerization of furfuryl alcohol, which would result in lower DFM yield and to enhance its
coupling to furan, the initial molar ratio of furfuryl alcohol to furan in the reaction mixture was
kept low at (1:10). Furan (400 cm3, 5.46 mol), and boron trifluoride dietherate catalyst (0.40 cm3,
3.28*10-3mol) were dissolved in acetonitrile solvent (300 cm3) in a 3 dm3 round bottom flask.
Furfuryl alcohol (40 cm3, 0.46 mol) was dissolved in acetonitrile (300 cm3), and thereafter the
solution was added drop-wise to a stirred (furan + BF3 (OEt2)2) mixture at room temperature. In
the first 80 minutes, the colour of the reaction mixture intensified from light yellow to an
intermediate dark green and finally to dark brown. The reaction mixture was allowed to stand
overnight at room temperature while being continuously stirred to ensure homogeneity: high
conversion of furan to difurylmethane (DFM). The reaction occurs according to the following
scheme:

12
O
Furan
+
O
BF3((OCH2CH3)2)
O O
Difurylmethane
+
Furfuryl alcohol
O O CH2OH
n
+
O
+ H2O
WaterOligomer Unreacted furan
CH2OH
Figure 2.1: Synthesis process of DFM
At the end of a 12h reaction time, 25cm3 of 5% aqueous ammonia was added to neutralize
boron triflouride dietherate catalyst. The reaction mixture turned from deep brown to a light
yellow colour as an indication of reduction of polymerization rate of alcohol. The un-reacted
furan and acetonitrile solvent were evaporated from the reaction mixture by a means of a rotary
evaporator. The reaction products were then dissolved in 150 cm3 acetone to form a light brown
clear solution. Whereas DFM has a very high solubility in n-hexane, the unreacted furfuryl
alcohol, its oligomers and other by-products such as water show very poor solubility. At this
point we took advantage of the high solubility of DFM in n-hexane to separate it from the
reaction products. The reaction products now dissolved in acetone were poured into 500 cm3
of vigorously stirred n-hexane and the light yellow n-hexane phase was filtered off, n-Hexane
and acetone were evaporated off. The remaining impure DFM was re-dissolved in 300 cm3
fresh n-hexane. The solution was then extracted with 100 cm3 portions of 1M aq. NaOH. The
extraction was continued until the aqueous phase remained colourless. The n-hexane phase
was washed with dil. NaOH followed by several portions of water to remove NaOH, and
thereafter dried over several portions of baked Na2CO3. The solvent was distilled off with a
rotary evaporator giving a DFM yield of 70 to 85% on the furfuryl alcohol basis. DFM was

13
further purified by distillation under partial vacuum and its purity confirmed by 1H-NMR and
elemental analysis. When freshly purified, DFM is a light yellow liquid. Like many furan
compounds, DFM slowly darkens in colour over several days due to photo-decomposition.
Storage of DFM in a dark-brown bottle covered by aluminum foil partly prevents the
deterioration of its colour.
2.1.4 Sample preparation for NMR Analysis
Sample preparation for NMR involves a mixture of few drops of DFM with chloroform which
was then run on Bruker Advance DPX 300 MHZ to obtain 1H-NMR spectra for DFM using
CDCl3 as a solvent, 99.8 % supplied by Aldrich. All the spectra were recorded at room temperature
with all chemical shifts recorded against a reference peak of internal standard, Tetramethyl silane
(TMS).
2.1.5 Sample preparation for IR spectral analysis
Few drops of DFM were smeared on FTIR spectrometer sample crystal and an IR spectrum was
recorded using Perkin Elmer HATR spectrum 2 FTIR spectrometer
2.2 COMPUTATIONAL METHODS
Computational calculations on Furan and DFM were undertaken in gas phase using Hartree-Fock
(HF) and Density Functional Theory (DFT) theoretical methods run on the Gaussian ’09 suite of
program using 6-31+G (3d,3p) basis set: Each method is briefly outlined as follows.
2.2.1 Hartree-Fock (HF)
We are interested in describing electronic charge distribution in molecules. Electrons are small
and very nimble and they move very fast and nuclear positions are considered to be parametric;
when invoking the Born-Oppenheimer approximation. Electronic structure of molecular species
can only be described using quantum mechanics. Molecular wave functions were initially
described using Hartree Product in the literature (equation 2.2). Molecular wave functions are now
accurately described using linear combinations of atomic orbitals. These atomic orbitals are
depicted as single slater determinants because electrons are fermions and thus there is a need to
14
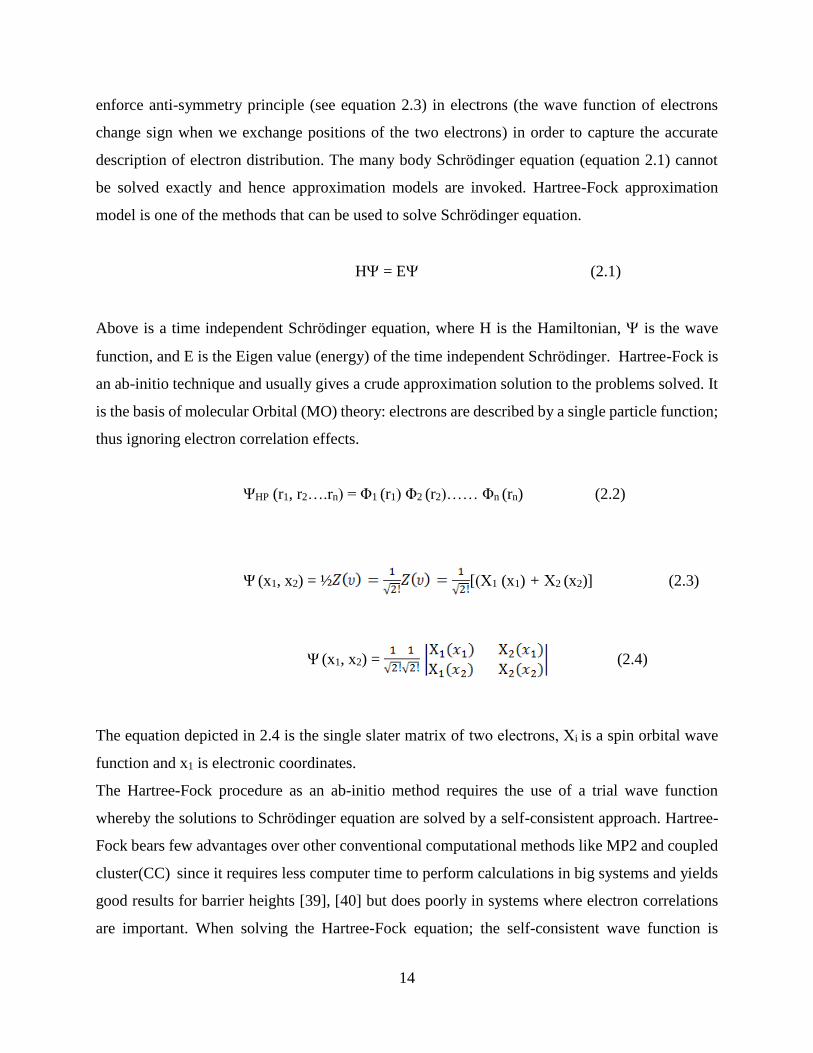
enforce anti-symmetry principle (see equation 2.3) in electrons (the wave function of electrons
change sign when we exchange positions of the two electrons) in order to capture the accurate
description of electron distribution. The many body Schrödinger equation (equation 2.1) cannot
be solved exactly and hence approximation models are invoked. Hartree-Fock approximation
model is one of the methods that can be used to solve Schrödinger equation.
H = E (2.1)
Above is a time independent Schrödinger equation, where H is the Hamiltonian, is the wave
function, and E is the Eigen value (energy) of the time independent Schrödinger. Hartree-Fock is
an ab-initio technique and usually gives a crude approximation solution to the problems solved. It
is the basis of molecular Orbital (MO) theory: electrons are described by a single particle function;
thus ignoring electron correlation effects.
ΨHP (r1, r2….rn) = Φ1 (r1) Φ2 (r2)…… Φn (rn) (2.2)
Ψ (x1, x2) = ½ [(Χ1 (x1) + Χ2 (x2)] (2.3)
Ψ (x1, x2) = (2.4)
The equation depicted in 2.4 is the single slater matrix of two electrons, Χi is a spin orbital wave
function and x1 is electronic coordinates.
The Hartree-Fock procedure as an ab-initio method requires the use of a trial wave function
whereby the solutions to Schrödinger equation are solved by a self-consistent approach. Hartree-
Fock bears few advantages over other conventional computational methods like MP2 and coupled
cluster(CC) since it requires less computer time to perform calculations in big systems and yields
good results for barrier heights [39], [40] but does poorly in systems where electron correlations
are important. When solving the Hartree-Fock equation; the self-consistent wave function is

15
optimized by minimizing the energy with respect to a trial wave function using a variational
principle. Then the Fock operators( F) are obtained in the process, which involve the one electron
operator term, interaction coulomb operator and exchange term and is the pseudo eigen value (Ɛ).
F Χ (1) = Ɛ Χ Ø (1) (2.5)
2.2.2 Density Functional Theory (DFT)
Density functional theory employs the use of ground state density instead of wave-functions and
it has resulted in reduced complexity of the computational time cost, because only 3 dimensional
coordinates are required. Hohenberg and Kohn provided a proof in principle that the total energy
used could be obtained from the ground state density [41], [42]. Kohn-Sham equation is depicted
below:
< Φ > = + FHK[P(r) ] = E[ P’(r) ] ≥ E[ P0(r) ] (2.6)
FHK[P(r)] = T[p] + Vee [p] (2.7)
…………………….. ……. External potential
T[p] …………………………………. ……… Kinetic energy
Vee [p] ………………………………………… Inter-electronic potential
The solutions for T[p] and Vee [p] are not known.
The practical application of DFT became apparent in 1965 when Kohn –Sham provided a plausible
solution for the kinetic energy term by using single–electron orbitals.
( + V (r) + dr’ + Vxc) Φi = E Φi (2.8)
Where:
V(r): Electron-nuclear electrostatic potential

16
ρ (r): Electron density
r: electronic distance from the nucleus
Vxc: Exchange-correlation term
The exchange-correlation term Vxc, is still enigmatic and can only be approximated. Since
electronic correlation, exchange and kinetic terms pose great difficulty in general solutions of
Schrödinger equation correction factor known as correlation-exchange functional are embedded
in the Kohn-Sham equation as an error correction terms. The exchange-correlation term (Vxc) is
still enigmatic and can only be approximated. Computational chemists have devised a number of
exchange-correlation functional terms optimized for DFT calculations of different electronic
structure properties
In this work the functional adopted is B3LYP: Consisting of Becke-3 parameter exchange term
and LYP correlation functional. This functional relatively yields excellent results for energy,
barrier heights and harmonic vibrational frequencies much better than most existing functionals,
however even though DFT shows excellent results when used with a good functional, it should
not be used for studying ionic compounds due to its general poor performance in calculations
involving ionization energies. In terms of computational cost DFT is comparable to Hartree-Fock
but gives excellent results somewhat equivalent to correlated methods such as MP2 [43]–[47]. In
this work we employ both HF and DFT (B3LYP) to characterize molecular structures and
properties such as dipole moment and polarizability for Furan and DFM and for Energy of
complexation between DFM and Methanol.
2.2.3 The Formulation of Basis Sets
A basis set is a set of functions used to create molecular orbitals, which are expanded as a linear
combination of atomic orbitals with coefficients as variational parameters to be determined. In the
early days of quantum chemistry, the so-called Slater type orbitals (STOs,) were used as basis
functions due to their similarity with the Eigen functions of the hydrogen atom. STOs have an
advantage in that they have direct physical interpretation and thus are naturally good basis for
molecular orbitals. However, from a computational point of view the STOs have the severe

17
shortcoming that most of the required integrals needed in the procedure must be calculated
numerically which drastically decreases the speed of a computation.
STOs can be approximated as linear combinations of Gaussian orbitals. Gaussian Type Orbitals
(GTOs) are not really orbitals. They are simpler functions and are frequently called Gaussian
primitives. The smallest possible basis set is called the minimal basis set, and it contains one orbital
(which may be contracted) for every orbital we usually think of an atom (including unoccupied
orbitals). For example, hydrogen has just one orbital, but carbon has 5 (1s, 2s, 2px, 2py, and 2pz)
even though one of the p orbitals for carbon atom will be unoccupied. The STO-3G basis is a very
well-known minimal basis set which contracts 3 Gaussian functions to approximate the more
accurate (but more difficult to compute) Slater type orbitals. Although a contracted GTO might
give a good approximation to an atomic orbital, it lacks any flexibility to expand or shrink in the
presence of other atoms in a molecule. Hence, a minimal basis set such as STO-3G is not capable
of giving highly accurate results.
The solution is to add extra basis functions beyond the minimum number required to describe each
atom. Then, the Hartree-Fock procedure (Section 2.2.1) can weight each atomic orbital basis
function more or less to get a better description of the wave function. If we have twice as many
basis functions as in a minimum basis, this is called a ̀ `double zeta'' basis set (the zeta, comes from
the exponent in the GTO). Hence, a double-zeta basis set for hydrogen would have two functions,
and a true double-zeta basis set for carbon would have 10 functions. However, sometimes
Computational Scientists use only a single orbital for the core (1s), giving 9 functions for carbon.
Such basis sets are said to be ``double-zeta in the valence'' space; they are also called ``split-
valence'' basis sets. Double-zeta basis sets are often denoted DZ. Often additional flexibility is
built in by adding higher-angular momentum basis functions. Since the highest angular momentum
orbital for carbon is a p orbital, the ``polarization'' of the atom can be described by adding a set of
d functions.
The late Nobel Laureate, John Pople developed a basis set notation, which was subsequently
popularized by the Gaussian set of programs as follows.
STO-3G is a minimal basis set in which each AO is represented by 3 Gaussians (3G),
chosen to mimic the behaviour of a STO.

18
Pople’s split-valence double-zeta basis set is called 6-31G; the core orbital is a CGTO made
of 6 Gaussians, and the valence is described by two orbitals — one CGTO made of 3
Gaussians, and one single Gaussian in the valence orbitals.
6-31G* [or 6-31G(d)] is 6-31G with added d polarization functions on non-hydrogen
atoms; 6-31G** [or 6-31G(d,p)] is 6-31G* plus p polarization functions for hydrogen
6-311G is a split-valence triple-zeta basis; it adds one GTO to 6-31G
6-31+G is 6-31G and diffuse s and p functions for non-hydrogen atoms; 6-31++G has
diffuse functions for hydrogen also.
In this study, the choice of basis sets is premised on the above discussions as well as the results of
several computational literature papers on the furan molecule which is the building block for the
DFM molecule under study herein.
2.2.4 Equilibrium structures
Unlike DFM the amount of theoretical calculations done on furan is very extensive. Several ab-
initio and DFT calculations on furan is about its equilibrium structure, dipole moment, harmonic
frequencies and many other fundamental molecular properties exist in the literature. And since
DFM is a molecular derivative of furan, we can assume that most of electronic structure properties
associated with furan are also common to DFM. We therefore select furan as a prototype molecule
to conduct preliminary investigations so that we are able to determine appropriate theoretical
model and basis set suitable for the calculations we need to perform on DFM.
Baldridge and co-workers [48], [49] calculated molecular structures of 5-membered heterocyclic
molecules including furan using HF/ 3-21G(d). The results of these calculations together with
other literature values are shown in Table 2.0 with the corresponding calculated (HF/ 3-21G(d))
geometric parameters; such as bond lengths and bond angles had average deviation of 1.34 and
3.21% respectively from the experimental values [42], [50], [51]; thus making the calculated
(HF/3-21G(d)) values for furan to have close resemblance to available literature values. These
findings (calculated and experimental) correlate well with those we obtained using B3LYP/ 6-
31+G(3d,3p). The structural parameters we computed for Furan show average deviation of 0.14
and 0.50 % in bond distance and bond angles respectively. The literature data on structural

19
parameters as depicted in Tables 2.1 to 2.3 show that lower theoretical models and basis sets have
poor correlation with experimental values whilst higher models operating on sufficient basis sets
have excellent agreement with available experimental values on equilibrium parameters. This is
the basis for the selection of the model chemistry: B3LYP/ 6-31+G(3d,3p) in this work, as it
performs on par with advanced model chemistries [52]–[57].
Figure 2.2: Molecular structure of furan
Table 2.1: Experimental (measured using microwave spectroscopy) and theoretical equilibrium
structure for Furan bond lengths in angstroms optimized at different levels of theory and basis sets
(in Å). Calculations in this work were performed using B3LYP/6-31+ (3d, 3p)
Method r(C1-O5) r(C1=C2) r(C2-C3) r(C4-H9) r(C3-H8)
This work (B3LYP/6-31 +G (3d, 3p).) 1.364 1.3606 1.4354 1.0778 1.0793
HF/ 3-21G(d) 1.380a 1.339a 1.450a …… 1.065a
B3LYP(sadlej-pol) 1.362b 1.366b 1.439b 1.085b 1.087b
HF(sadlej-pol) 1.342b 1.343b 1.443b 1.074b 1.076b
HF/ 6-31G(d,p) 1.344c 1.3391c 1.4406c 1.0684c 1.0703c
Experimental 1.362d 1.3609d 1.4309d 1.0750d 1.0768d
% deviation,this work to experimental
values 0.15 0.022 0.32 0.26 0.23
aReference [48],bReference [52], cReference [55], dReference [50]

20
Notes: Percentage deviation of theoretical calculations in this work to experimental values show that
the chosen model chemistry in this work compares well with experimental values.
2.2.5 Polarizability and dipole moment High angular momentum diffuse and polarized basis sets are able to describe the region of charge
distribution accurately, thus they can be used in the calculation of dipole moments and high rank
tensors such as static polarizability and hyper polarizability [52]. Alparone and coworkers [52] did
work on polarizability calculations for chalcogenophenes (C4H4X (X= O, S, Se, Te)) using
extended basis sets specifically designed for this type of calculations. Their data show that
HF/HF/Pol method gives a poor estimate of the static polarizability with inherent percentage
deviation from experimental data varying from 5% - 10 %. But when correlated geometries are
used (HF//B3LYP/ Pol) the error is significantly reduced to ≈ 2.3%. The results of the work by
Alparone et al. [52] closely resemble calculations in this work done at B3LYP/ 6-31+G (3d, 3p)
theoretical level, showing small percentage deviation of 0.81% (for mean static polarizability)
from the experimental value. These findings ascertain us that a smaller percentage discrepancy is
measured, when correlated methods are employed [52], [58]–[61].
From the work done by Alparone and co-workers [52] using two diffuse and polarized basis sets,
it can be shown that B3LYP/Pol gives the most accurate results that also correlates well with our
findings in calculations of mean polarizabilities as depicted in Table 2.4.
Higher angular momentum and diffuse basis sets when combined with correlated methods yield
excellent results in dipole moment and higher rank tensors – these findings are depicted in Tables
2.4 and 2.5 they somewhat agree with values obtained from experiment and the chosen model
chemistry in this work [52], [58], [62], [63].
21
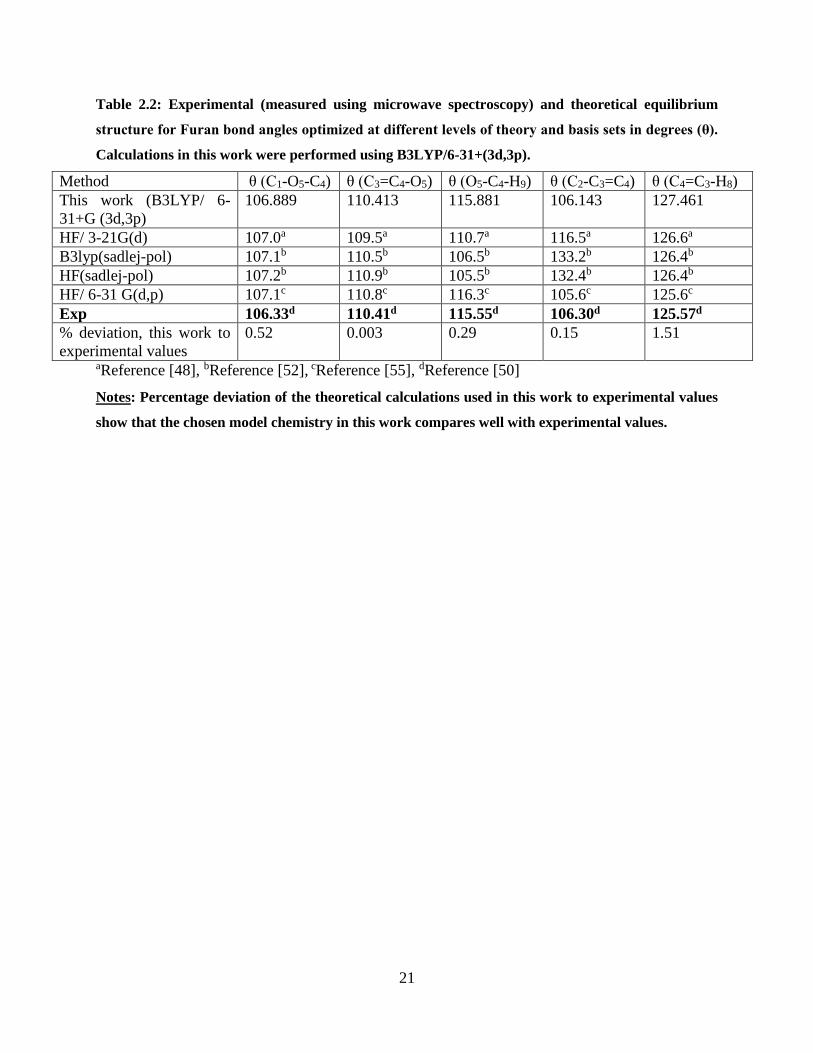
Table 2.2: Experimental (measured using microwave spectroscopy) and theoretical equilibrium
structure for Furan bond angles optimized at different levels of theory and basis sets in degrees (θ).
Calculations in this work were performed using B3LYP/6-31+(3d,3p).
Method θ (C1-O5-C4) θ (C3=C4-O5) θ (O5-C4-H9) θ (C2-C3=C4) θ (C4=C3-H8)
This work (B3LYP/ 6-
31+G (3d,3p)
106.889 110.413 115.881 106.143 127.461
HF/ 3-21G(d) 107.0a 109.5a 110.7a 116.5a 126.6a
B3lyp(sadlej-pol) 107.1b 110.5b 106.5b 133.2b 126.4b
HF(sadlej-pol) 107.2b 110.9b 105.5b 132.4b 126.4b
HF/ 6-31 G(d,p) 107.1c 110.8c 116.3c 105.6c 125.6c
Exp 106.33d 110.41d 115.55d 106.30d 125.57d
% deviation, this work to
experimental values
0.52 0.003 0.29 0.15 1.51
aReference [48], bReference [52], cReference [55], dReference [50]
Notes: Percentage deviation of the theoretical calculations used in this work to experimental values
show that the chosen model chemistry in this work compares well with experimental values.

22
Table 2.3: Equilibrium geometry and dipole moment for furan calculated at different levels of theory
with 6-31G** basis set
Coordinate Exp HF MP2
Full
MP2
Fc
DFT
BLYP
DFT
B3LYP
DFT
LDA
DFT
BVWN
O1-C2 1.362a 1.343 1.364 1.366 1.382 1.364 1.351 1.383
C2=C3 1.361a 1.339 1.365 1.366 1.371 1.361 1.361 1.369
C3-C4 1.431a 1.441 1.426 1.427 1.444 1.435 1.422 1.443
C2-H6 1.075a 1.069 1.074 1.075 1.086 1.079 1.088 1.080
C3-H7 1.077a 1.070 1.075 1.076 1.087 1.080 1.089 1.082
C5-O1-C2 1.06.5a 1.07.2 106.6 106.6 106.4 106.8 107.2 106.3
O1-C2-C3 110.7a 110.8 110.5 110.5 110.5 110.5 110.4 110.5
C2-C3-C4 106.0a 105.6 106.2 106.2 106.3 106.0 106.0 106.3
O1-C2-H6 115.9a 116.2 115.7 115.7 115.4 115.8 115.9 115.4
C3-C2-H6 133.4a 132.9 133.8 133.9 134.1 133.7 133.8 134.1
C2-C3-H7 126.1a 126.8 126.2 126.2 126.6 126.5 126.5 126.6
C4-C3-H7 127.9a 127.6 127.6 127.5 127.1 127.5 127.4 127.1
Dipole
moment 0.66a 0.77 0.64 0.87 0.60 0.63 0.52 0.64
aReference [54]
Notes: DFT B3LYP as highlighted in the table captures very well both the bond length and the dipole
moment in comparison to experimental values.

23
Table 2.4: Polarizability components for furan calculated as different levels of theory and basis sets
Method <α> ∆α
This work (B3LYP/ 6-31+ (3d,3p 48.72 21.098
B3LYP/pol 49.71a 22.69a
B3LYP/(+sd+sp) 47.57a 22.25a
MP2/ 6-31+G(d,p) 43.6b 19.1b
MP2/ C 48.5c 20.6c
Exp 49.12d 21.98d
% deviation, this work to experimental
values
0.81 4.01
areference[52], breference[55], creference[62], dreference[63]
Notes: Percentage deviations of our theoretical calculations of polarizability components as
compared to experimental findings show that they is high correlation between calculated and
experimental values.
Table 2.5: Experimental and Theoretical dipole moment (μ) of furan calculated using different model
chemistries
method μ (DEBYE)
B3LYP/ 6-31+G(3d,3p) 0.66
B3lyp /pol 0.83a
HF/ pol 1.03
SCF/ 6-31G* 0.86b
SCF/B 0.79
SCF/C 0.82
MP2/B 0.62
MP2/C 0.65
MP2/ 6-31G* 0.68
EXP 0.661 0.006 c
areference[52], breference[63], creference[54]

24
3 RESULTS AND DISCUSSION
3.1 Equilibrium structures
The geometries of DFM molecular structures were optimized without considering symmetry
constraints, using Gaussian ’09 package with B3LYP/6-31+G(3d,3p) method. The nature of
stationary point was evaluated using harmonic frequency analysis and it was confirmed to be a
local minimum in the potential energy surface. The potential energy surface scanning tool (PESST)
[64] was used to generate 12 conformational structures of DFM, by varying the angle between two
furanic rings at an increment of 30 degrees. The geometric parameters of DFM such as equilibrium
bond lengths (re) and bond angles (Θe) were calculated using DFT (B3LYP) theoretical method
and 6-31+G(3d, 3p) basis set as listed in Table 3.1 and 3.2 the equilibrium structure is depicted in
Figure 3.1
Figure 3.1: Equilibrium structure of DFM (Global minimum) and the Equilibrium structure
of DFM (showing numbering according to IUPAC)

25
Table 3.1: Equilibrium bond distance (re) of DFM calculated at B3LYP/6-31+G (3d, 3p) in
Angstroms
Bond type re
r(C1=C2)= r(C12-H13) 1.363
r(C1-O5) = r(C13-H14) 1.369
r(C1-C9) = r(C9-C13) 1.496
r(C2-C3) = r(C11-C12) 1.436
r(C2-H6) = r(C12-H17) 1.080
r(C3=C4)= r(C10=C11) 1.359
r(C3-H7) = r(C11-H16) 1.080
r(C4-O5) = r(C10-O14) 1.366
r(C4-H8) = r(C10-H15) 1.078
r(C9-H18) = r(C9-H19) 1.095

26
Table 3.2: Equilibrium bond angles (θe) of DFM calculated at B3LYP/631+G(3d,3p) in degrees
Bond angle type θe
θ (C2=C1-O5) 09.7
θ (C2=C1-C9) 133.4
θ (O5-C1-C9) 116.9
θ (C1=C2-C3) 106.6
θ (C1=C2-C6) 126.0
θ (C3-C2-H6) 127.4
θ (C2-C3=C ) 106.1
θ (C2-C3-H7) 127.5
θ (C4=C3-H7) 126.4
θ (C3=C4-O5) 110.3
θ (C3=C4-H8) 133.8
θ (O5-C4-H8) 115.9
θ (C1-O5-C4) 107.3
θ (C1-C9-C13) 114.7
θ (C1-C9-H18) 107.7
θ (C1-C9-H19) 107.7
θ (C13-C9-H18) 109.7
θ (C13-C9-H19) 107.7
θ (H18-C9-H19) 107.1
θ (C11=C10-O14) 110.3
θ (C11-C10-H15) 133.8
θ (O14-C10-H15) 115.9
θ (C10-C11-H12) 106.1
θ (C10-C11-H16) 126.4
θ (C12=C11-H16) 127.5
θ (C11-C12-H17) 127.4
θ (C13=C12-H17) 126.0
θ (C9-C13=C12) 133.4
θ (C9-C13-O14) 116.8
θ (C12-C13=O14) 109.7
θ (C11-C12-H17) 127.4
θ (C13=C12-H17) 126.0
θ (C9-C13=C12) 133.4

27
Conformer 1 Conformer 2, global minimum
Conformer 3 Conformer 4
Figure 3.2: Conformational structures of DFM molecule
The energetics and pictorial representations of 4 equilibrium conformational structures of DFM
are depicted in Table 3.3 and Figure 3.2.
Table 3.3: Different energetics of 4 conformers of DFM molecule
Conformer Energy (kcal/mol)
1 0.0903
2 0.000
3 0.0156
4 0.254

28
3.2 Infrared spectral data
The IR spectrum for DFM obtained from DFT, B3LYP/6-31+G(3d,3p), shows fifty one (51)
fundamental bands (modes). This is in accordance with the 3N-6 rule for non-linear molecules
which in this case suggests the absence of Fermi resonance effect (degenerate fundamental bands)
or infrared inactive symmetric stretch or crowding of peaks and low intensities that can result in
poor resolution. It can be deduced that the model chemistry employed in the harmonic frequency
calculation can accurately describe quadratic part of the potential energy surface (PES) due to the
inclusion of correlation and relatively large basis set [65]–[68].
There is a good correlation between calculated (B3LYP/6-31+G(3d,3p)) and experimentally
(FTIR) obtained IR spectral data. The harmonic frequency method was employed for the
description of force fields without scaling of the results against experimental values to avoid losing
physical meaning of the PES (the use of scale factor bears no information about the harmonicity
and anharmonicity of the PES) [65].
The experimental FITR and computational DFT-IR spectra are compared using vibrational modes
and intensities of several peaks. The two IR spectra match as depicted in Figures 3.2.a and 3.2.b.

29
Figure 3.2 a: Calculated IR spectrum of DFM calculated at B3LYP/ +G (3p, 3p) DFM molecule

30
Figure 3.2 b: Experimental IR spectrum of DFM molecule

31
Figure 3.2 c: Experimental and calculated IR spectra for DFM molecule
The calculated DFT harmonic vibrational frequencies are reported in Table 3.4. They are compared
with the experimental FTIR spectral analysis. We observe small discrepancy between
experimental FTIR data and DFT-IR calculations in part due to non-scaling, anharmonicity and
basis set incompleteness error (BSIE).

32
Table 3.4: Experiment and calculated Harmonic frequencies and intensities calculated at B3LYP +G
631(3d, 3p), DFM molecule
Vibrational mode ѵTheo (cm-1) ѵexp ITheo %∆ѵ
=CH (Olefin
asymmetric stretch)
3243.2 ……. …… ……..
-CH2 (aliphatic
asymmetric stretch)
3081.2 3148.2 8.1 -2.2
-CH2 (aliphatic
symmetric stretch)
3035.5 3118.5 15.7 -2.7
C=C (Furanic residue) 1629.5 1598.3 10.6 -1.9
C=C (Furanic ring) 1536.7 1505.8 42.2 -2.0
CH2 (Scissoring) 1451.7 1424.4 4.6 -1.9
CH2 (See saw) 1343.1 1320.2 18.6 -1.7
COC (Furanic
residue)
1251.8 1211.4 4.8 -3.3
COC (Furanic ring) 1172.0 1147.4 19.1 .-2.1
=CH (Breathing
mode)
1034.0 1008.7 49.6 -2.4
Out of plane 815.6 803.5 16.4 -1.5
Out of plane 774.3 725.4 43.4 -6.3
Out of plane 736.5 598.3 52.7 -18.7

33
The analysis of corresponding peaks between the overlapping IR spectra in Figure 3.2.c is outlined
as follows:
C-H vibrational mode: The hetero-aromatic structure shows the presence of calculated CH
stretching band at 3243.21 cm-1 and the FTIR peak at 3117.8 cm-1.
Out-of-plane C-H bending modes: According to Kalsi and co-workers [69]: substitution patterns
on the ring can be judged from the out-of-plane bending of the ring C-H bands in the region 900 -
675 cm-1 for furan. The calculated band of out-of-plane bending deformations for DFM is
identified at 815.6,774.3 and 736.5 cm-1 these agrees well with FTIR (peaks) results that resonate
at 803.5 and 725.4 cm-1 with an average percentage difference of -1.55%. The DFM molecule can
be easily described by substitution patterns on its furanic ring as they are three C-H bands from IR
spectra but only two C-H bands would be observed in the case of mono-furanic ring structure;
because furan is a highly symmetric molecule with a C2V point group. Therefore only two out-of-
plane C-H bending modes are anticipated, for DFM this symmetry pattern is broken due to the
presence of CH2 substituent bridge between two furanic rings.
Ring vibration: In DFM, the ring vibrations appear to be mixed among the modes shown in Table
3.3. The position and intensity of these vibrations are dependent on the nature of the ring and the
type of substitution [70]. Billes and co-workers reported a vibrational spectroscopic study on furan
and its hydrated derivatives [71] and they closely resemble the IR spectral data of DFM molecule.
C=C vibrational mode: The DFM calculated modes are in the regions 1629.5 and 1536.7 cm-1 in
good agreement with FTIR vibrational modes at 1598.3 and 1505.8 cm-1.
COC vibrational mode: The FTIR band for COC aromatic stretch can be identified at 1147.4 and
is theoretically calculated to be 1172.0 cm-1.
The average percentage (~5.0%) discrepancy for stretching frequency is higher than those of
bending (at ~ 2%) due to the more pronounced effect of anharmonicity within the stretching mode
as more forces are applied to the bonds thus forcing them to depart from a harmonic description

34
[65].
Note: Some peaks were not labelled during data compilation and are represented by gaps as
they do not adversely affect the comparison of the two overlapping spectra.
3.3 Gauge Independent Atomic Orbital (GIAO) calculated chemical shifts
and 1-dimensional experimental proton nuclear magnetic resonance (1-
Dimensional 1H-NMR) chemical shifts
NMR chemical shifts and coupling constants are mixed second derivative properties of electronic
energy against magnetic field and magnetic dipole moment. The introduction of a magnetic field
in the electronic Schrödinger equation results in the occurrence of the “gauge problem.” Whereby
our calculations inherently depend on the origin of the coordinate system; magnetic field does not
directly depend on the gauge. Since magnetic field is a function of a vector potential that depends
on the gauge therefore the magnetic field is somehow linked to the gauge origin in that manner.
One of the best remedy to the gauge problem is to develop methods of calculation that are gauge
independent [72], and to date the most robust conventional gauge independent method is the gauge
independent atomic orbital (GIAO) developed by London in 1937 [72].
The GIAO calculations are known to be very proficient in determining NMR shielding tensors
[73]. In computation of isotropic chemical shielding tensors, Gauge Independent Atomic Orbital
(GIAO) calculation method was employed with iglo-2 basis sets. The GIAO calculations were
done on optimized geometries of DFM. The calculated chemical shift (δcalc) is determined as
shown below:
δcalc = σtms – σiso (3)
Where σtms and σiso are isotropic shielding tensors for a reference molecule (Tetramethyl silane)
and difurylmethane (DFM) respectively.
Previous work from literature was reported using correlation between experimental (δexp) and
calculated (δcalc) chemical shifts [73], [74], in the following equation:

35
δexp= a x δcalc + b (4)
Where a and b give slope (a) or (first derivative of δexp with respect to
δcalc) and it is the intercept between the experimental and the calculated shifts; these terms (a and
b) bears no physical importance but they arise due to the subsequent plot of δexp against δcalc and
they are linked to the valuation of the theoretical chemical shifts to the experiment. The idealized
situation is when the values of a and b are 1 and 0, respectively and in that case; the theoretical
data precisely matches the experiment. In our work, we are using GIAO calculations where the
gauge origin is localized in the center of the field dependent orbitals (GIAO is a method that uses
functions that have inherent dependence on external magnetic field), the gauge origin is localized
to the center of basis functions and matrix elements rearranged to be independent of the origin.
In NMR, electrons generate secondary magnetic fields described by paramagnetic and diamagnetic
terms. When the secondary field is aligned with the external field, paramagnetic term takes root
but when it is anti-parallel to the field it describes a diamagnetic term. During the early years of
quantum NMR shielding calculations, the origin of the field was taken to be localized in the
nucleus but this were found to drift drastically when doing calculations because in a given
molecule there are several nuclei. This subsequently results in obtaining different terms for
secondary magnetic fields (paramagnetic and diamagnetic term mismatch). This anomaly is offset
by fixing the gauge origin within the field dependent atomic centers rather than in the nucleus. We
can offset this discrepancy by eliminating the paramagnetic term [73].
The use of density functional theory (DFT) with more advanced basis sets gives more precise
results. Rablen et al [75] showed that the use of hybrid functionals like B3LYP give very accurate
results for many organic compounds. Bagno and co-workers also showed that using B3LYP and
moderately large basis set gives reasonably precise magnetic parameters [76].
In the literature 1H-NMR GIAO calculations are not numerous due to the fact that proton chemical
shifts are very small and often overlap with the region associated with the solvent effect [72].
Errors in NMR calculations might arise from sources, such as electron correlation and rotational-

36
vibrational effects and incompleteness of the basis set. Many errors in the calculated chemical shift
from single point of the reference compound will be reflected in all derived chemical shift.
Subtracting the chemical shift of the reference can also compensate for general discrepancy in
magnitude of the predicted absolute shielding. Borkowski and coworkers [73] hold the hypothesis
that, it is also reasonable to consider parameters derived from shielding tensor to take into account
the anisotropy which cannot be eliminated by orientational averaging of conformation energy or
chemical shifts. Some of the errors can be offset by calculating weighted average of chemical shifts
and by scaling shielding tensors to experimental chemical shifts.
The correlation between experimental and calculated chemical shifts is shown in Figure 3.3 and
the values are listed in Tables 3.5, 3.6 and 3.7. The plot shows correlation coefficient (0.9842)
with some discrepancy in peak at δ= 6.362, 4, (7, 16) and δ=6.143, 3, (6, 17): The numbers in
brackets refer to numbering in the Gaussian model. The order of chemical shifts between these
peaks is inconsistent with experimental shifts. Hypothetically it is expected that protons (7, 16) to
resonate at a frequency/chemical shift higher than that associated with protons (6, 17), mainly
because the proposed configuration agrees well with the clockwise electron flow in the furan ring.
This clockwise flow of electrons in resonance structure of furan as opposed to the anticlockwise
direction of resonance places a negative charge at carbon 3 (proton 6, 17) and 5 (8, 15) ( carbons
numbered according to IUPAC). Thus in comparison to proton (7,16) proton (6,17) is more
shielded by virtue of lone pair of electrons situated at carbon 3 . Thus due to the influence of
inductive effect the peaks should follow the ordering given by experimental NMR data.
There are four terms which are relevant to Jmax or coupling constant, diamagnetic and
paramagnetic, spin orbit terms, spin dipole and Fermi contact term. Jmax is sensitive to the type of
functional and basis set chosen. The Gaussian type orbitals (GTOs) like 6-31+G (3d,3p) do not
produce the correct cusp of the nuclei. Koch and Holthausen [77] recommend the use of IGLO-II
and –III basis sets for proton NMR. The theoretical coupling constants are depicted in table 3.6.
The experimental 1H-NMR (Figure 3.4) of DFM molecule shows a singlet (s) at δH-6 = 4.057 due
to the -CH2- protons, the molecule is taken to be symmetrical therefore similar protons are
represented by one proton position. The spectrum also shows a doublet of doublet at δH-5 = 7.391

37
(2H, dd, J3,5= 0.733 and J4,5= 1.953 Hz), whereby J represents coupling constants for proton 8.
Furthermore another doublet of doublet is shown at δH-4 =6.362 (2H, dd, J4,5= 1.953 and J3,4 =
3.175 Hz) for proton 4. A doublet of doublet is shown at δH-3 = 6.1425 (2H, dd, J3,5= 0.733 and J3,4
= 3.175 Hz) corresponding to proton 3.
This data is depicted in Table 3.6 and it is quite clear that proton 5 have at least one common
coupling constant which can be associated with protons 3 and 4 therefore it couples with both of
them. Similarly these applies to protons 4 being split by protons 4 and 5. Even proton 3 couples
with 4 and 5 by virtue of common coupling constants.
All this information obtained from experimental 1-Dimensional 1H-NMR (300 MHz) clearly helps
us to characterize molecular structure of DFM.
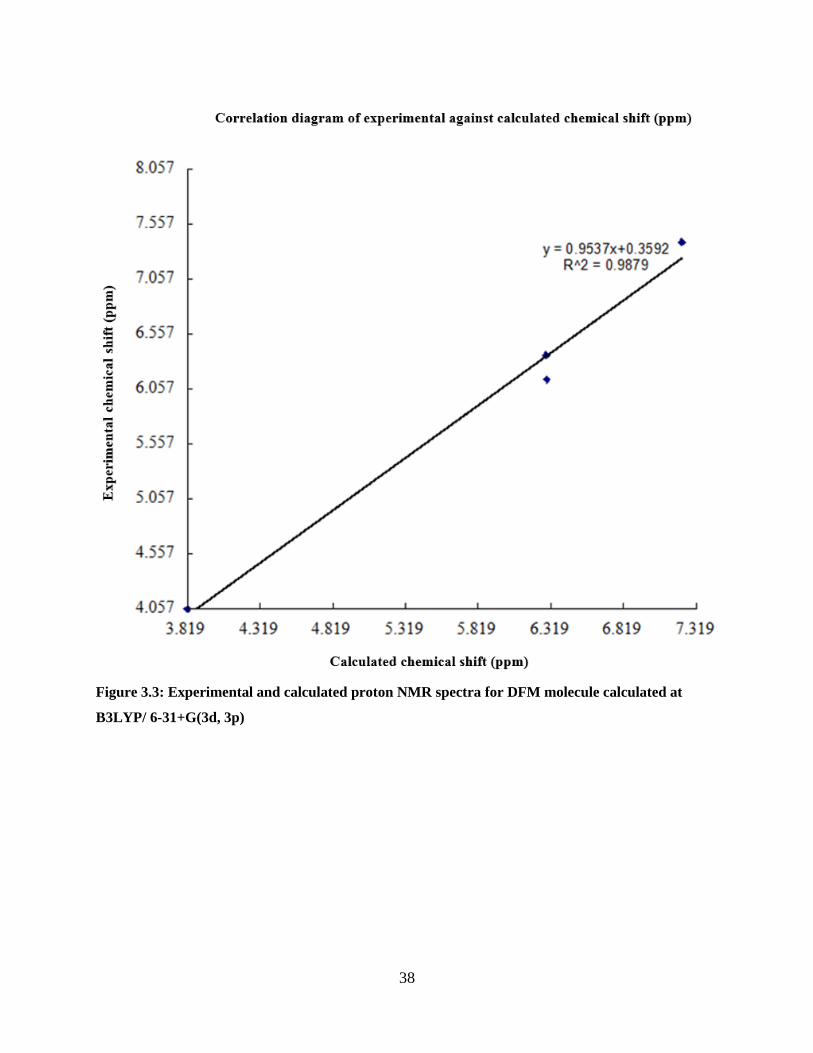
38
Figure 3.3: Experimental and calculated proton NMR spectra for DFM molecule calculated at
B3LYP/ 6-31+G(3d, 3p)

39
Table 3.5: NMR chemical shifts obtained from experimental and calculated at B3LYP/IGLO-2 for
DFM MOLECULE. TMS, σiso=32.0092 (IUPAC numbering system is represented as H-3, H-4, H-5
and H-6 and are highlighted)
Position σiso δcal δexp
8, 15 (H-5) 24.788, 24.787 7.218 7.391
7, 16 (H-4) 25.726, 25.726 6.284 6.362
6, 17 (H-3) 25.717, 25.723 6.289 6.143
18, 19 (H-6) 28.191, 28.190 3.819 4.057
Table 3.6: Theoretical NMR nuclear coupling constants
Peak assignments 8 7 6
8, 15 (H-5) - -1.18919 Hz -2.18809 Hz
7, 16 (H-4) - - -0.929184 Hz
Table 3.7: 1H-NMR (300 MHZ NMR data for difurylmethane in CDCl3)
position δH (ppm)
8, 15 (H-5) 7.391 (2H, dd, J3,5= 0.733 and J4,5=1.953 Hz)
7, 16 (H-4) 6.362 (2H, dd, J4,5=1.953 and J3,4 = 3.175 Hz)
6, 17 (H-3) 6.143 (2H, dd, J3,5= 0.733 and J3,4 = 3.175 Hz)
18, 19 (H-6) 4.057 (2H, s)

40
Figure 3.4: Experimental 1H- NMR spectrum of DFM in CDCl3

41
3.4 Geometric Parameters of DFM-Methanol adducts
The Oxygen atom in DFM with lone pairs and the polarized π-system of the furanic ring offer two
probable sites that serve as hydrogen bond acceptors to the proton in the hydroxyl (O-H) group of
methanol. Two types of configurations classified as σ-type and π-type hydrogen bonding have
been indicated as depicted in Figure 3.5 and 3.6 following geometric optimization at B3LYP/6-
31+G(3d,3p) level of theory. The σ-type configuration is the binding scheme whereby the acidic
proton of -OH group in MeOH is facing the DFM oxygen atom and π-type configuration is the
scheme where the acid proton is pointing towards the β-carbon in the furanic ring of DFM.
The basis set superposition error (BSSE) and thermal energy (calculated under the harmonic-rigid
rotor approximation) corrected stabilization energies associated with the σ-type and π–type
configurations are -3.16 and -1.89 kcal/mol, respectively as depicted in Table 3.9. These values
are compared to -1.79 (σ-type) and -1.08 (π–type) kcal/mol literature data obtained for furan-
MeOH complex computed by Xiatong and co-workers [78] working at B3LYP/ Aug-cc-PVTZ
level of theory. The enthalpies of formation and Gibbs free energy for σ-type complex were
calculated as -1.97 and 5.64 kcal/mol, respectively. It is quite evident from the negative value of
enthalpy of formation, that complexation of Methanol and DFM is quite favourable at low
temperatures and due to the small value of equilibrium constant (positive value of ∆G) the reaction
is less feasible in the forward direction. The enthalpy of formation and Gibbs free energy for π–
type dimer is -0.75 and 5.66 kcal/mol, respectively.
From the rigid scan results, we conclude that the interaction of the proton of the hydroxyl group
of MeOH with charge density around the hetero atom of DFM in Figure 3.5 is the most favorable
σ-type of hydrogen bonding, as it is the interactive scheme with the minimal energy. Furthermore,
a redundant potential energy scan was performed on the π–type hydrogen bonding configuration
and it was established that the bonding scheme whereby the acidic proton of MeOH interacts with
the β-carbon in the furanic ring is most stable among the π–type configurations. But between the
two local minima (σ-type and the π–type configurations); the σ-type hydrogen bonding
configuration is the most stable because it has larger stabilization energy (∆E = 1.27 kcal/mol)
between the two configurations. Similar results were obtained in the study of furan-HCl complex
[31]. In a different study Kgagodi and Mbaiwa did similar study on DFM-n-propanol binary

42
mixture (employing Molecular Mechanics and ab-initio methods) looking at the thermodynamic
properties and structure. The data obtained from radial distribution functions and ab-initio
calculations show evidence of hydrogen bonding between n-propanol and DFM via the acidic
hydrogen MeOH and the hetero atom of DFM [79]. The results they obtained from radial
distribution functions showed a broad, low intensity peak centred at 2.21 Å corresponding to the
distance between the hetero atom of furan and acidic proton of hydroxyl group of propanol and
this distance was calculated to be 2.20 using ab initio methods with HF/6-31 G(d) model chemistry.
The results obtained in these study for σ-type complex was calculated to be 2.09 Å, which is
slightly lower than those obtained for DFM-Propanol dimer. The reason for this difference might
be due to the accuracy of different model chemistries employed in each case and also due to the
fact that two different types of complexes are being compared. Hartree-Fock in general using
constrained methods tends to underestimate bond lengths. This is mainly due to the exclusion of
electron correlation compared to unrestricted Hartree-Fock, Density functional theory and
correlation methods. In the computational calculations employed in these work B3LYP/6-31 +G
(3d,3p) method was employed.
In the current study, it is evident that the extent of O-H bond elongation found among the two local
minima complexes is more profound within the σ-type configuration in comparison to the π–type.
This can be used to emphasize that hydrogen bonding is more pronounced within the σ-type
binding configuration. The change associated with the O-H bond length (bond elongation) during
hydrogen bonding closely resembles those observed in classical hydrogen bonding, where the O-
H bond length elongates [24], [54]. This is the common feature observed in both configurations
present in the DFM-MeOH complexes. The change in O-H bond length for σ-type hydrogen
bonded DFM-MeOH complex was calculated to be 0.97 Å, a closely similar value (0.96 Å) was
computed by Xiatong and co-workers [78] on furan-MeOH complex. The O-H elongation value
for π–type DFM-MeOH complex in this work was calculated at 0.97 Å, whilst the value obtained
in the literature by Xiatong and co-workers is 0.96Å for furan-MeOH. Consequently there is
smaller bond elongation for π–type system compared to the σ-type system. The O-H bond
elongation in both complex is due to the effective pulling of the acidic proton of the hydroxyl
group of MeOH by the either of the two lewis bases ( heteroatom and the β-carbon of the polarized
π-system) thus weakening the O-H bond and causing it to elongate. This effect is more pronounced

43
in the σ-type configuration because oxygen is a stronger lewis base than the polarised π-system.
The IR spectral data on DFM-MeOH complex clearly shows red shifts in the OH vibrational
transitions on both adducts configurations which is consistent with presence of hydrogen bonding
in hetero-aromatic systems, This is consistent with what have been obtained by Xiatong and co-
workers on IR spectral transitions of furan-MeOH [78], [80]–[83]. The IR spectroscopy data and
geometries of DFM-MeOH complex is depicted in Table 3.8. The red shift frequency for σ-type
configuration from O-H fundamental band (3820.70 cm–1) in methanol was found to be 66.83 cm–
1 and that in a π–type configuration was calculated at 74.18 cm–1. This is somewhat inconsistent
with previous [78] experimental findings that indicate that σ-type dimer is more red shifted due to
its stronger classical nature of hydrogen bonding compared to π–type dimer that undergoes non-
classical less stronger hydrogen bonding. The red shift is used to index the strength of O-H bond
or force constant. The σ-type complex is associated with larger elongation of O-H bond length and
thus larger red shift. This is not observed in our computational results due to the nature of B3LYP
to overestimate the O-H stretch of O-H···O configuration.
The σ and π–type complexes have higher intensities (262.0429, 259.3501 kJ/mol) for O-H bond,
compared to the intensity of O-H stretching band in the reference (32.7250 kJ/mol) molecule
(MeOH) indicative of significance of high oscillation of transition moment, a required
characteristic for IR absorption and also a requirement associated with the red shift. The σ-type
dimer have higher intensity (262.0429 kJ/mol) for OH bond than π–type dimer (259.3501 kJ/mol)
due to large polarisation of OH bond length by the heteroatom.. This is a prerequisite for IR
absorption or peak intensity.

44
Table 3.8: The calculated O-H bond in the DFM-MeOH complex and intermolecular bond distance
and bond angles.
Complex R (O-H)a ∆R (O-H)b Θc ѵe ∆ѵf Ig
π –type R (O-H) 0.96597 0.00326 164.169 3746.52 74.18 259.3501
σ –type (R (O-H)) 0.96647 0.00376 162.658 3753.87 66.83 262.0429
Free (R (O-H)) 0.96271d ………. ………. 3820.70 …….. 32.7250
σ –type (R (O-H· · ·O)) 2.09103 ………. ………. ……… …….. …….. aOH bond length in the complex in angstroms, bchange of bond length upon complexation in
angstroms, cintermolecular hydrogen bond angle, dOH bond length in unbounded methanol,
evibrational frequency (cm–1) , fshift in vibrational frequency (cm–1), gIR intensities (kJ/mol)
Table 3.9: Calculated binding energy (BEa), Counterpoise energy (∆ECP)b, Energy for Methanol (Ec)
and DFM (Ed) monomers in DFM-MeOH complex geometry and Enthalpy of formation (H)f and
Gibbs free energy in kcal/mol
Conformer BEa (∆ECP)b Ec(MeOH) Ed(DFM) ∆Ge (H)f
σ –type -3.16 -385273.8280 -72629.4694 -312641.1984 5.63817 -1.97038
π –type -1.89 -385272.6287 -72629.4786 -312641.2611
5.65762 -0.75113
abinding energy, bcounterpoise energy, cEnergy of Methanol, d Energy of DFM, eGibbs free energy
and fenthalpy of formation
The Figures 3.5 and 3.6 show different hydrogen bonding configurations: σ-type and π–type
hydrogen bonding schemes respectively.
Figure 3.5: σ-type hydrogen bonding as calculated at B3LYP+G(3d,3p) level of theory

45
Figure 3.6: π-type hydrogen bonding scheme as calculated at B3LYP+G 6-31(3d, 3p) level of theory
3.4.1 Molecular electrostatic potential map
The molecular electrostatic potential (MEP) map in Figure 3.7 is portrayed in a colour coding
gradient, whereby the red shade is the most robust electron density region (-0.0295 a.u, more
negative zone) and the blue shade is indicative of the less robust charge density (+0.0295 a.u, more
positive zone ). The MEP map depicted in Figure 3.7 clearly shows that the region above the
hetero-atom of DFM is the more electron dense zone, therefore there is higher likelihood for the
hydrogen bond to form in these regions than in other regions of the furan moiety. The other site
that comprises relatively high density of charge is the region above the furan ring. The nature of
charge distribution around the furan moiety can be explained in terms of the presence of lone pair
in the hetero-atom and electron resonance in the ring. There is a small delocalization of the lone
pair from the hetero atom to the ring because oxygen is largely electronegative thus it holds more
to its electron pair thus making the region around the hetero-atom to have high charge density.
Similarly the area around the ring is somehow rich in charge density due to resonance.

46
Figure 3.7: Molecular electrostatic potential map (MEP) OF DFM
3.4.2 Potential Energy Surface (PES) Scan
A rigid PES scan was performed which consists of single point energy evaluation over a
rectangular grid involving selected internal coordinates on complex A (DFM-MeOH complex)
associated with σ-type hydrogen bonding. Only Six (6) possible steps at an incremental angle of
600 were generated. The rigid scan operation (job) was performed by varying the dihedral angle in
atoms (25, 23, 24, and 5) within the DFM–MeOH complex. A one dimensional potential energy
surface was generated by plotting the values of potential energy and corresponding dihedral angle
as depicted in Figure 3.8. It was established that the minimum energy of rigid scan in a plotted
potential energy surface (structure σ-type complex) is 0 kcal/mol (before employing thermal
energy and Basis set superposition error (BSSE) corrections) and its corresponding dihedral angle
of -1200. The values for potential energy surface are displayed in Table 3.10.
An equilibrium structure or local minimum was obtained following the complexation reaction
between DFM and MeOH. It was pre-eminent to probe the potential energy surface of this system
for possible global minimum state. This is done by tweaking the dihedral angle Θ (25, 23, 24, 5)
of the complex with respect to change in single point energy. At first during the preliminary or
exploratory phase a relaxed energy scan was performed but the job did not converge and it was
aborted. Thereto the rigid scan procedure was adopted.

47
A relaxed scan was performed upon the π-type complex (The π-type hydrogen bond structure) in
order to determine the global minimum within this region of potential energy surface by varying
the dihedral angle at 31 steps. The relaxed scan is plotted in Figure 3.9 and the scan coordinates
are shown in Table 3.11.
The global minimum (most stable configuration) computed from the PES scan was set to 0.000
kcal/mol. Thus the comparison between σ-type, and π-type complex gives the absolute energy
difference (E) of 1.174 kcal/mol. It can be established that σ-type complex is relatively lower in
energy, than π-type complex supporting the hypothesis that the σ-type configuration possesses
larger binding energy (absolute value) than that founding π-type configuration
Figure 3.8: Potential energy surface of Complex A

48
Table 3.10: Potential energy data points σ-type (structure A) furan-methanol complex obtained by
performing rigid (manual) scan
Θ (Degrees) ∆Etotal (kcal/mol)
-180 0.0872
-120 0.000a
-60 1.1729
0 18.9982
60 72.157
120 4.8144
180 0.0872
a Global minimum energy of Rigid scan

49
Table 3.11: Potential energy data points π-type (structure B) furan-methanol complex obtained by
performing redundant scan
Computational step ∆Etotal (kcal/mol)
1 0.3332
2 0.0081
3 0.000a
4 0.0012
5 0.0207
6 0.0508
7 0.0922
8 0.1424
9 0.2033
10 0.278
11 0.3602
12 0.4424
13 0.5271
14 0.6187
15 0.2573
16 0.2303
17 0.2108
18 0.1976
19 0.1882
20 0.1851
21 0.1901
22 0.2014
23 0.2196
24 0.2736
25 0.3024
26 0.325
27 0.3313
29 0.3282
30 0.3213
31 0.3182

50
a global minimum energy on the redundant scan
Figure 3.9: Relaxed energy scan profile
Rigid and relaxed potential energy scans DFM-MeOH complex are displayed in Figure 3.8 and
3.9 respectively. The relative minimum energy in rigid scan and relaxed energy scan was set to
0.000 kcal/mol and the discrepancy between the two minima is 1.1737 kcal/mol

51
3.4.3 Natural Bond Orbital Analysis
The energy gap between HOMO (DFM) and LUMO (MeOH) determines the overlapping strength
between the two frontier orbitals. Thus we can mention two types of hydrogen bonding interactive
schemes, namely σ-type and π-type hydrogen bonding. In the first configuration (σ-type) we
observe hydrogen bond transfer from donor orbital (σ* or O-Hmethanol) towards heteroatom (O, lone
pair) acceptor orbital. The magnitude of overlap between bonding NBO and antibonding NBO
frontier orbitals can be measured using second order perturbation energy E2ij .
E2ij = -2 Fij/ ∆ Eij (3.4)
Where ∆Eij = Ei-Ej is the difference in energy between the interacting molecular orbitals i and j,
Fij is the Fock matrix elements for the interaction between orbitals i and j [84]–[88].
We have two types of interactive schemes for hydrogen bonding, but the π-type configuration
occurs at C2 and C3 on both sides of the furanic ring. Judging from the magnitude of second
pertubative energy, the σ-type configuration is the most stable energy structure with second
pertubative energy equivalent to 4.55 kcal/mol in contrast to 2.79 kcal/mol as listed in Table 3.11,
energy associated with the most stable π-type configuration. Since second order stabilization
energy is a measure of electron delocalization or hydrogen bonding, it is quite evident that complex
A (σ-type hydrogen bonding configuration) is strongly stabilized by hydrogen bonding than
complex B (π-type hydrogen bonding configuration).
The charges on basic oxygen atom of furan around the acidic hydrogen of MeOH within the
complex A was calculated as -0.47892 a.u and +0.5127 a.u respectively as depicted in Table 3.12.
In complex B the C (2) of furan and acidic proton of Methanol hydroxyl group have atomic charges
-0.35129 a.u and 0.50183 a.u respectively. This atomic charge values signify that complex A has
more profound electron density transfer than complex B; thus supporting the hypothesis that
Complex A is strongly hydrogen bonded.
The redundant energy scan calculations yield two possible equilibrium structures for π-type
configuration occurring between acidic proton of methanol and carbon 2 and 3 (β-carbons) of DFM

52
with relative equilibrium energies of 0.000 kcal/mol for both complexes and their absolute energy
differences of 1.1737 kcal/mol. But preferentially the interaction between methanol and carbon 2
of DFM is the global minimum. General inspection of the MEP map of DFM molecule shows that
the region around the furanic ring of DFM is clustered with charge density characterized by colour
shading gradient ranging from yellow to orange shades and it is apparent that the region associated
with carbon 2 of the furanic ring has more charge density when compared to the region above
carbon 3. This could be primarily due to the close proximity of this region to the highly electron
dense carbon number 1 that receives shuttle of electrons from the adjacent methylene carbon
within the structure of DFM, this proximal methylene group determines the direction of flow of
electrons . Thus some of the charge density from this region is smeared around the region above
carbon 2. Furthermore the β-carbons are preferred binding sites in the furanic ring of DFM in
contrast to the centre of the ring because due to resonance structures obtained following electron
delocalization, a negative charge is localized in the positions of two β-carbons of the ring. This
positioning of negative charge in the β-carbons increases the charge density within these positions
thus making them more susceptible to hydrogen bonding. Moreover they is competition happening
at this two binding sites of the ring for acid proton of methanol, but carbon-2 is most favoured as
they is preferential smearing of charge density around this region arising from proximity to the
methylene group directing the flow of electron resonance in a clockwise direction.
Table 3.12: The stabilization energy, Fock-matrix and energy gap between HOMO and LUMU
orbitals
Configuration type Ei-Ej (kcal/mol) Fij (kcal/mol) E2ij (kcal/mol)
σ-type
1.09
0.063
4.55
π-type
0.77 0.043 2.79
Table 3.13: The atomic charges of DFM-MeOH complex
Atom Atomic Charge (a.u)
O(5) -0.47892
H(24) +0.5127
C(2) -0.35129
H(24) +0.50183

53
4 SUMMARY & CONCLUSIONS
The objectives of this work was to study the structural parameters and properties of DFM and
DFM-MeOH complexes. The nature of intermolecular interactions between the two monomers;
DFM and MeOH using computational simulations.
In this work the electronic structure properties of DFM and DFM-MeOH Complex was probed
using DFT-calculations in order to determine the nature of intermolecular interactions within the
DFM-MeOH Complex: two types of hydrogen bond configurations were succinctly obtained. The
type-1 configuration depicts hydrogen bonding between acidic proton in MeOH and the hetero
atom of furan ring moiety and the type-2 configuration is the interaction between the acidic proton
of MeOH and the polarized π-system. This illustration apparently shows that the predominant local
minima structure is the type-1 configuration hydrogen bonding. In the previous experimental work
in our research laboratory dipole-dipole interaction between the molecular fragments was
suggested as the possible intermolecular forces in DFM-MeOH binary solution obtained using
excess volumetric properties by density measurements throughout the molar composition.
In our computational calculations we looked at binding energy profile and natural bond orbitals to
calculate the stabilization energetics between DFM-MeOH complexes. The later suggested that
the nature of intermolecular forces within the dimeric structure of DFM and Methanol is largely
hydrogen bonding of classical and non-classical hydrogen bonding type.

54
References
[1] P. J. Atkins.P, De, Physical chemistry, 6th editio. Oxford,UK: Oxford University Press,
2006.
[2] C. Tanford, C. Tanford, J. G. Kirkwood, and J. G. Kirkwood, ‘Theory of Protein Titration
Curves. I. General Equations for Impenetrable Spheres’, J. Am. Chem. Soc., vol. 79, no. 3,
pp. 5333–5339, 1957.
[3] N. Prabhu and K. Sharp, ‘Protein-solvent interactions’, Chem. Rev., vol. 106, no. 5, pp.
1616–1623, 2006.
[4] M. Krishnan, ‘A simple model for electrical charge in globular macromolecules and linear
polyelectrolytes in solution’, J. Chem. Phys., vol. 146, no. 20, 2017.
[5] O. Mokate and W. A. A. Ddamba, ‘Volumetric Properties of Difurylmethane in Methanol
from 288 . 15 to 308 . 15 K’, J. Solution Chem., vol. 34, no. 11, pp. 1327–1339, 2005.
[6] O. Mokate and W. A. A. Ddamba, ‘Effect of Temperature on the Volumetric Properties of
[ Difurylmethane + ( C 2 – C 6 ) Alkan-1-ol ] Binary Systems : Analyses of New and
Literature Density Data in the Temperature Range 288 . 15 – 308 . 15 K’, J. Solution Chem.,
pp. 331–350, 2008.
[7] B. T. Mmereki, I. Oathotse, and W. A. A. Ddamba, ‘Ultrasonic speeds and isentropic
compressibilities of {difurylmethane + (C1-C6) n-alkanol} binary mixtures at T = 298.15
K’, J. Chem. Thermodyn., vol. 42, no. 11, pp. 1346–1351, 2010.
[8] G. C. Benson and O. Kiyohara, ‘Thermodynamics of aqueous mixtures of nonelectrolytes.
I. Excess volumes of water-n-alcohol mixtures at several temperatures’, J. Solution Chem.,
vol. 9, no. 10, pp. 791–804, 1980.
[9] G. Douheret and M. I. Davis, ‘Measurement, Analysis, and Utility of Excess Molar -’,
Chem. Soc. Rev., vol. 22, no. 434, pp. 43–50, 1971.
[10] M. I. Davis, ‘Partial Excess Molar Properties of Water in Amphiphile Plus Water-Systems’,
Thermochim. Acta, vol. 200, pp. 15–31, 1992.
[11] T. C. Bai, J. Yao, and S. J. Han, ‘Excess molar volumes for the ternary mixture N,N-
dimethylformamide + methanol + water at the temperature 298.15 K’, J. Chem. Eng. Data,
vol. 44, no. 3, pp. 491–496, 1999.
[12] F. N. Dunlop, A.P., Peters, The Furans. New York, USA: Reinhold Publishing Co, 1953.
[13] T. A. Nevolina, T. A. Stroganova, M. V Shevlyakov, and A. V Butin, ‘Synthesis of amines

55
of the di- and trifurylmethane series’, Chem. Heterocycl. Compd., vol. 43, no. 4, pp. 505–
512, 2007.
[14] K. Ji, Y. Shen, X. Shu, and H. Xiao, ‘Synthesis of Difurylmethane Derivatives via the Gold-
Catalyzed’, Adv.Synth. Catal., pp. 1275–1280, 2008.
[15] B. T. O. M. Sidney and F. Winmill, ‘q = Sl c =’, J. Chem. Soc. Trans, vol. 101, pp. 1635–
1676, 1912.
[16] T. H. E. Standpoint, ‘most of the fixed oxygen was removed while the hydrocarbon content
was not much altered, the differences observed are more likely due to this latter cause.
Conclusions.’, vol. 453, no. 1899, pp. 1419–1433, 1920.
[17] E. Arunan, G. R. Desiraju, R. A. Klein, J. Sadlej, S. Scheiner, I. Alkorta, D. C. Clary, R. H.
Crabtree, J. J. Dannenberg, P. Hobza, H. G. Kjaergaard, A. C. Legon, B. Mennucci, and D.
J. Nesbitt, ‘Definition of the hydrogen bond ( IUPAC Recommendations 2011 )*’, vol. 83,
no. 8, pp. 1637–1641, 2011.
[18] J. Phillips, B. Xia, and J. A. Menéndez, ‘Calorimetric study of oxygen adsorption on
activated carbon’, Thermochim. Acta, vol. 312, no. 1–2, pp. 87–93, 1998.
[19] Louis J Farrugia, ‘No Title’. .
[20] M. Prakash, K. G. Samy, and V. Subramanian, ‘Benzene−Water (BZW n ( n = 1 − 10))
Clusters’, J. Phys. Chem. A, vol. 113, no. 50, pp. 13845–13852, Dec. 2009.
[21] S. V. Prakash.M, Gopal Samy.K, ‘Benzene-Water ( BZWn ( n = 1-10 )) Clusters’, J. Phys.
Chem. A, vol. 113, no. 50, pp. 13845–13852, 2009.
[22] T. Emilsson, H. S. Gutowsky, G. De Oliveira, and C. E. Dykstra, ‘Rotational patches : Stark
effect , dipole moment , and dynamics of water loosely bound to benzene Rotational
patches : Stark effect , dipole moment , and dynamics of water loosely bound to benzene’,
J. Chem. Phys., vol. 1287, no. 2000, 2014.
[23] T. Desiraju, G. R.; Steiner, ‘The Weak Hydrogen Bond in Structural Chemistry and
Biology’, Oxford,NY: Oxford University Press Inc, 1999.
[24] G. A. Jeffrey, An Introduction to Hydrogen Bonding. Oxford, NY: Oxford University Press,
1997.
[25] T. Steiner and G. R. Desiraju, ‘Distinction between the weak hydrogen bond and the van
der Waals interaction’, Chem. Commun., no. 8, pp. 891–892, 1998.
[26] J. K. Gregory, ‘The dipole moment of the water dimer’, Chem. Phys. Lett., vol. 282, no. 2,

56
pp. 147–151, 1998.
[27] J. K. Gregory, D. C. Clary, K. Liu, M. G. Brown, and R. J. Saykally, ‘The water dipole
moment in water clusters’, Science (80-. )., vol. 275, no. 5301, pp. 814–817, 1997.
[28] A. A. Vostrikov, D. Y. Dubov, and S. V. Drozdov, ‘Dipole moment of water clusters and
the greenhouse effect’, Tech. Phys. Lett., vol. 34, no. 3, pp. 221–224, 2008.
[29] D. Kaur and S. Khanna, ‘Intermolecular hydrogen bonding interactions of furan , isoxazole
and oxazole with water’, Comput. Theor. Chem., vol. 963, no. 1, pp. 71–75, 2011.
[30] J. Wu, H. Yan, H. Chen, A. Zhong, and W. Cao, ‘Insight into the nature of the interactions
of pyridine , funan and thiophene with LiNH 2’, Comput. Theor. Chem., vol. 1000, pp. 52–
59, 2012.
[31] D. Xie and J. Li, ‘Molecular Design’, Internet Electron. J. Mol. Des., pp. 306–314, 2003.
[32] J. A. Sordo, ‘On the use of the Boys ± Bernardi function counterpoise procedure to correct
barrier heights for basis set superposition error q’, vol. 537, pp. 245–251, 2001.
[33] O. H. Cl, H. Zhao, S. Tang, Q. Zhang, and L. Du, ‘RSC Advances Weak hydrogen bonding
competition between O –’, RSC Adv., vol. 7, pp. 22485–22491, 2017.
[34] D. L. Howard and H. G. Kjaergaard, ‘Vapor Phase near Infrared Spectroscopy of the
Hydrogen Bonded Methanol - Trimethylamine Complex’, J Phys Chem, pp. 9597–9601,
2006.
[35] M. Heger, R. A. Mata, and M. A. Suhm, ‘Chemical Science ethene prototype under
experimental and theoretical scrutiny’, Chem. Sci., vol. 6, pp. 3738–3745, 2015.
[36] E. E. Fileti and S. Canuto, ‘Calculated infrared spectra of hydrogen-bonded methanol-water,
water-methanol, and methanol-methanol complexes’, Int. J. Quantum Chem., vol. 104, no.
5, pp. 808–815, 2005.
[37] M. Hippler, ‘Quantum chemical study and infrared spectroscopy of hydrogen-bonded
CHCl(3)-NH(3) in the gas phase.’, J. Chem. Phys., vol. 127, no. 8, p. 084306, 2007.
[38] S. L. Buchwalter, ‘The Polymerization of Furfuryl Acetate in Acetonitrile’, J. Polym. Sci.,
vol. 23, pp. 2897–2911, 1985.
[39] J. P. Desclaux, ‘Hartree Fock Slater Self Consistent Field Calculations’, Comput. Phys.
Commun., vol. 1, pp. 216–222, 1969.
[40] H. Fock, S. Self, C. Field, C. J. P. Desclaux, P. C. Deshmukh, A. Banik, and D. Angom,
‘Hartee-Fock Self-Consistent Field Method for Many-Electron Systems’, vol. 1, no.

57
November, pp. 216–222, 1969.
[41] R. Van Leeuwen, J. Neugebauer, L. Visscher, and F. M. Bickelhaupt, ‘Editorial for PCCP
themed issue “developments in Density Functional Theory”’, Phys. Chem. Chem. Phys.,
vol. 18, no. 31, pp. 20864–20867, 2016.
[42] H. Soscún, J. Hernández, R. Escobar, C. Toro-Mendoza, Y. Alvarado, and A. Hinchliffe,
‘Ab initio and density functional theory calculations of the dipole polarizability and the
second dipole hyperpolarizability of benzene’, Int. J. Quantum Chem., vol. 90, no. 2, pp.
497–506, 2002.
[43] H. O. Di Rocco, F. Lanzini, and J. C. Aguiar, ‘Thomas–Fermi approach to density
functional theory: binding energy for atomic systems’, Eur. J. Phys., vol. 37, no. 6, p.
065402, 2016.
[44] B. G. Johnson, P. M. W. Gill, and J. A. Pople, ‘The performance of a family of density
functional methods’, J. Chem. Phys., vol. 98, pp. 5612–5626, 1993.
[45] P. N. Ma, S. Pilati, M. Troyer, and X. Dai, ‘Density functional theory for atomic Fermi
gases’, Nat. Phys., vol. 8, no. 8, 2012.
[46] R. G. Parr and S. K. Ghosh, ‘Thomas-Fermi theory for atomic systems’, Proc. Natl. Acad.
Sci. , vol. 83, no. 11, pp. 3577–3579, 1986.
[47] L. C. Cune and M. Apostol, ‘On the atomic binding energy in the Thomas-Fermi model’,
Rom. Reports Phys., vol. 55, no. 9–10, pp. 913–919, 2010.
[48] K. K. Baldridge and M. S. Gordon, ‘Potentially Aromatic Metallocycles’, J. Am. Chem.
Soc., vol. 110, no. 34, pp. 4204–4208, 1988.
[49] Y. G. Byun, S. Saebo, and C. U. Pittman, ‘An Ab Initio Study of Potentially Aromatic and
Antiaromatic Three-Membered Rings’, J. Am. Chem. Soc., vol. 113, no. 10, pp. 3689–3696,
1991.
[50] L. H.-N. B. Bak, D. Christensen, W B. Dixon and and M. S. J. R Andersen, ‘The Complete
Structure of Furan’, J. Mol. Spectrosc., vol. 129, pp. 124–129, 1962.
[51] G. Maroulis, ‘Applying conventional Ab initio and density functional theory approaches to
electric property calculations. Quantitative aspects and perspectives’, Struct. Bond., vol.
149, pp. 95–130, 2012.
[52] S. Millefiori and A. Alparone, ‘(Hyper)polarizability of chalcogenophenes C4H4X (X = 0,
S, Se, Te) Conventional ab initio and density functional theory study’, J. Mol. Struct., vol.

58
1280, pp. 59–78, 1998.
[53] J. Lii and N. L. Allinger, ‘Systematic Comparison of Experimental, Quantum Mechanical,
and Molecular Mechanical Bond Lengths for Organic Molecules’, J. Chem. Phys., vol.
3654, no. 95, pp. 8763–8769, 1996.
[54] H. U. Suter, ‘Comparison between Optimized Geometries and Vibrational Frequencies
Calculated by the DFT Methods’, J. Chem. Phys., vol. 3654, no. 96, pp. 15056–15063,
1996.
[55] A. H. Ta and J. M. Sosctin, ‘Ab initio studies of the dipole polarizabilities of conjugated
molecules. Part 5. The five-membered heterocyclics C4H4E (E = BH, AlH, CH2, SiH2,
NH, PH, 0 and S)’, J. Mol. Struct., vol. 1, pp. 109–125, 1995.
[56] F. H. Allen, O. Kennard, D. G. Watson, L. Brammer, A. G. Orpen, and R. Taylor, ‘Bond
Lengths in Organic Compounds’, J. Chem. Soc., Perkin Trans. 2, pp. S1–S19, 1987.
[57] B. Ma, J.-H. Lii, H. F. Schaefer III, and N. L. Allinger, ‘Systematic comparison of
experimental, quantum mechanical, and molecular mechanical bond lengths for organic
molecules’, J. Phys. Chem., vol. 100, no. 21, pp. 8763–8769, 1996.
[58] J. L. Toto, T. T. Toto, and C. P. De Melo, ‘A comparative study of the effect of electron
correlation in the hyperpolarizability of polyyne , polyacetylene and polypyrrole
oligomers’, Chem. Phys. Lett., vol. 4, no. November, pp. 2–6, 1995.
[59] P. A. Limacher, Q. Li, and H. P. Lüthi, ‘On the effect of electron correlation on the static
second hyperpolarizability of conjugated oligomer chains’, J. Chem. Phys., vol. 135, no. 1,
2011.
[60] D. R. Beck and C. A. Nicolaides, ‘The effect of electron correlation on atomic properties’,
Int. J. Quantum Chem., vol. 8, no. 8 S, pp. 17–28, 1974.
[61] G. Maroulis and A. J. Thakkar, ‘How important is electron correlation for the
hyperpolarizability of ethyne?’, J. Chem. Phys., vol. 93, no. 1, pp. 652–656, 1990.
[62] M. H. Sirvetz, ‘The Microwave Spectrum of Furan’, J. Chem. Phys., vol. 19, no. 12, pp.
1609–1610, 1951.
[63] N. E. Kassimi, R. J. Doerksen, and A. J. Thakkar, ‘Polarizabilities of oxazoles: ab initio
calculations and simple models’, J Phys Chem, vol. 100, no. 95, pp. 8752–8757, 1996.
[64] Z. G. Keolopile, M. Gutowski, and M. Haranczyk, ‘Discovery of Most Stable Structures of
Neutral and Anionic Phenylalanine through Automated Scanning of Tautomeric and

59
Conformational Spaces’, J. Chem. Theory Comput., 2013.
[65] E. D. Simandiras, N. C. Handy, and R. D. Amos, ‘Correlated ab Initio Harmonic
Frequencies and Infrared Intensities for Furan, Pyrrole, and Thiophene’, J Phys Chem, no.
17, pp. 1739–1742, 1988.
[66] V. Barone, ‘Vibrational spectra of large molecules by density functional computations
beyond the harmonic approximation : the case of pyrrole and furan’, Chem. Phys. Lett., vol.
383, pp. 528–532, 2004.
[67] C. Cappelli, S. Monti, G. Scalmani, and V. Barone, ‘On the calculation of vibrational
frequencies for molecules in solution beyond the harmonic approximation’, J. Chem.
Theory Comput., vol. 6, no. 5, pp. 1660–1669, 2010.
[68] D. Oschetzki, M. Neff, P. Meier, F. Pfeiffer, and G. Rauhut, ‘Selected Aspects Concerning
the Efficient Calculation of Vibrational Spectra beyond the Harmonic Approximation’,
Croat. Chem. Acta, vol. 85, no. 4, pp. 379–390, 2012.
[69] p.s. Kalsi, Spectroscopy of Organic Compounds, 6th ed. New Delhi: springfield,VA, U.S.A,
1993.
[70] J. D. Magdaline and T. Chithambarathanu, ‘Natural bond orbital analysis and vibrational
spectroscopic studies of 2-furoic acid using density functional theory’, Indian J. Pure Appl.
Phys., vol. 50, no. January, pp. 7–13, 2012.
[71] M. Ackermann, M. Kudra, F. Billes, and H. Bo, ‘A vibrational spectroscopic study on furan
and its hydrated derivatives’, J. Mol. Struct., vol. 672, pp. 1–16, 2004.
[72] A. H. Cowley, J. E. Kilduff, N. C. Norman, M. Pakulski, J. L. Atwood, and W. E. Hunter,
‘Electrophilic Additions to Diphosphenes (RP=PR)’, J. Am. Chem. Soc., vol. 105, no. 14,
pp. 4845–4846, 1983.
[73] E. J. Borkowski, F. D. Suvire, and R. D. Enriz, ‘Journal of Molecular Structure :
THEOCHEM Advances in correlation between experimental and DFT / GIAO computed C
NMR chemical shifts : A theoretical study on pentacyclic terpenoids ( fernenes )’, J. Mol.
Struct. THEOCHEM, vol. 953, no. 1–3, pp. 83–90, 2010.
[74] D. A. Forsyth and A. B. Sebag, ‘Computed 13 C NMR Chemical Shifts via Empirically
Scaled GIAO Shieldings and Molecular Mechanics Geometries . Conformation and
Configuration from 13 C Shifts’, J. Am. Chem. Soc., vol. 7863, no. c, pp. 9483–9494, 1997.
[75] G. M. Sheldrick, ‘Crystal structure refinement with SHELXL’, Acta Crystallogr. Sect. C

60
Struct. Chem., vol. 71, no. Md, pp. 3–8, 2015.
[76] A. D. Becke, ‘Density-functional thermochemistry. III. The role of exact exchange’, J.
Chem. Phys., vol. 98, no. 7, pp. 5648–5652, 1993.
[77] W. Koch and M. C. Holthausen, A Chemist’s Guide to Density Functional Theory, vol. 3.
2001.
[78] L. Du, ‘Matrix isolation FTIR study of hydrogen- bonded complexes of methanol with
heterocyclic organic compounds complexes of methanol with heterocyclic organic’, RSC
Adv., vol. 7, no. January 2017, pp. 2503–2512, 2016.
[79] O. W. Kgagodi and F. Mbaiwa, ‘Molecular dynamics study of 2,2’-difurylmethane and n-
propanol binary mixture’, J. Mol. Liq., vol. 17, pp. 30481–30491, 2016.
[80] B. G. Oliveira, E. M. Duarte, R. C. M. U. Araújo, M. N. Ramos, and A. B. Carvalho, ‘A
theoretical study of nonlinearity in heterocyclic hydrogen-bonded complexes’,
Spectrochim. Acta - Part A Mol. Biomol. Spectrosc., vol. 61, no. 3, pp. 491–494, 2005.
[81] A. M. Priya, L. Senthilkumar, and P. Kolandaivel, ‘Hydrogen-bonded complexes of
serotonin with methanol and ethanol: A DFT study’, Struct. Chem., vol. 25, no. 1, pp. 139–
157, 2014.
[82] M. K. Van Bael, J. Smets, K. Schoone, L. Houben, W. McCarthy, L. Adamowicz, M. J.
Nowak, and G. Maes, ‘Matrix-isolation FTIR studies and theoretical calculations of
hydrogen-bonded complexes of imidazole. A comparison between experimental results and
different calculation methods’, Journal of Physical Chemistry A, vol. 101, no. 13. pp. 2397–
2413, 1997.
[83] S. B. H. Bach and B. S. Ault, ‘Infrared matrix isolation study of the hydrogen-bonded
complexes between formaldehyde and the hydrogen halides and cyanide’, J. Phys. Chem.,
vol. 88, no. 16, pp. 3600–3604, 1984.
[84] G. P. Bean, ‘Application of Natural Bond Orbital Analysis and Natural Resonance Theory
to Delocalization and Aromaticity in Five-Membered Heteroaromatic Compounds’, J. Org.
Chem., vol. 3263, no. 97, pp. 2497–2506, 1998.
[85] J. P. Foster and F. Weinhold, ‘Natural Hybrid Orbitals’, J. Am. Chem. Soc., vol. 4, no. 22,
pp. 7211–7218, 1980.
[86] A. E. Reed, L. A. Curtiss, and F. Weinhold, ‘Intermolecular Interactions from a Natural
Bond Orbital , Donor-Acceptor Viewpoint’, Chem. Rev., no. 88, pp. 899–926, 1988.

61
[87] L. Goodman and R. R. Sauers, ‘Diffuse functions in natural bond orbital analysis’, J.
Comput. Chem., vol. 28, no. 1, pp. 269–275, 2007.
[88] A. J. Pounds, ‘Valency and Bonding: A Natural Bond Orbital Donor–Acceptor Perspective
(Frank Weinhold and Clark Landis)’, J. Chem. Educ., vol. 84, no. 1, p. 43, 2007.

62
Appendices:
Appendix A. Conformers of DFM
C1 C2 C3
C5 C6
C4
C7 C8 C9
C10 C11 C12
Figure A 1: Conformational structures of DFM

63
Appendix B. Conformers of DFM-Methanol obtained from relaxed
potential energy scan
C1B C2B
C3B
Figure B 1: Conformers of DFM-MeOH Complex 1