· pdf filedepartment of comm unity development city plan division housing and community...
TRANSCRIPT

~.J
\
.."
1
"
i
19 .... -
" . . · · ·
"
"
. ' . . . .
"
+
. .
, '0
l...J
:
,
)
~ . to: ;:; ~
~.
"
"
· · . · · · · '. . , '-"
p
LA< ST'

CITY OF KENOSHA
Mayor
WallaceE. SUt"kea
Memoon. of ,he Common Council
Dl)llaldAndreoli
Robert V. Baker
Mic:hiilelC.Baltes
Gerald F. Bellow
Frank J. Bennett
JohnD. Bilotti
George R. Fitchett
Albert Frank
Alvin G. Hoffman
Jesse Kolmos
Donald S. Lambrecht
John R. Madison. Jr.
Casimir J. Miechowicz
William S. Poean
Elmer J. Rogan
Paul W. Saftig
Frank G. Senliasmann
Earle G. Scoville
KENOSHA COUNTY Donald L. Klapper Donald E. Mayew FrancisJ. Pitts,
Vice-Chairman
MILWAUKEE COUNTY Richard W. Cutler, Secretary
Evelyn L.Petdlek Emil M. Stanislawski
OZAUKEE COUNTY Thomas H. Buestrin John P. Dries JamesF.Egan
TECHNICAL COORDIKATING AND ADVlSORV COMMtTTEE ON TRANSIT DEVELOPMENT FOA THE KENOSHA PLANNING DISTRICT
Robert Kolstad .. Chairman
Frank J. Bennett. Howard J. Blackmon .. WaliecaE. Burkee Mrs. Ben Ami Chemerow . John S. Culver Arnel.Gausmann.
KeithW.Graham .. Or. Thomas N. Harvey.
Charles W. Haubrich. JotmO. Hibbs. ..
Alvin G. Hoffman. Edward A. Jenkins .. Thomas R. Kinsey.
Mrs. lone Kreamer .. Or. WiliiamJ. Murin. Eric H. Ol$On . Fram;:isJ.Pitts.
.. Director, Department of Community Development, City of Kenosha Aldermen, City of Kenosha
. ... Chairman, Town of Somers . . . . .. Mayor, City of Kenosha
.. league of Women Voters . . . .. Kenosha Manufacturers Association
. Director, Bureau of Systems Planniflg, Division of Planniflg, Wisconsin Department of Transportation
.... Assistant Director, SCWRPC Regional Representative, Urban Mass Transportation Administration Chairman, Town of Pl811$8nt Pf"airie Division Engineer, Federal Highway Administration, U. S. Department of Transportation
.. Alderman, City of Kenosha Transportation Director, City of Kenosha District Engineer, District 2, Division of Highways, Wisconsin Department of Transportatiorl American Association of University Wornen University of Wisconsin' Parks ide
. Clainnan, Kenosha County Board of Supervisors . ..... Vice·Chairman, Kenosha County Board of
Supervisors; Commissioner, SEWRPC Rev. Robert Rodriquez. . Director, Latin American Center EUgene Ryshkus . . . . .. Board of EdUcation, Kenosha Unified SdIools Mrs. Shirley 5chmerling . . . . . . . . . . . .. University of Wisconsin·Parkside Donald Taske. . President, Downtown Kenosha Association Bert Thompson .. TonyValeo . ElmerF.Wilda. CharlesWoelffer.
.... Senior Citizens . ............ Chaj.rman, Kenosha Transit Commission
.. Plumbers and Steamfitters Local 182 . ....... Transportation Supervisor. Kenosha Unified Schools
COIIotMlSSlON MEMBERS
WAUKESHA COUNTY OlvlesJ.Davis LyleL. link Theodore F. Matt
RACINE COUNTY George C. Berteau,
Chairman John Margis, Jr. LeonvdC. Rauen
WALWORTH COUNTY Anthony F. Balestrieri Eugene A. Hollister Harold H. Kolb
WASHINGTON COUNTY Lawrencft W. Hillmen Paul F.Quick Joseph A. Schmitz.
TreaSUf"er
KurtW. Bauer, P.E., Executive Director

COMMUNITY ASSISTANCE PLANNING REPORT NUMBER 7
KENOSHA AREA TRANSIT DEVELOPMENT PROGRAM: 1976-1980
City of Kenosha
Southeastern Wisconsin Regional Planning Commission
The preparation of this report was financed in part through a joint planning grant from the Wisconsin Department of Transportation; the U. S. Department of Transportation, Federal Highway Administration, and Urban Mass Transportation Administration; and the U. S. Department of Housing and Urban Development.
March 1976

(This page intentionally left blank)

DEPARTMENT OF COMM UNITY DEVELOPMENT
CITY PLAN DIVISION
HOUSING AND
COMMUNITY DEVELOPMENT
DIVISION
"PRIDE BUILDS KENOSHA" MUNICIPAL BUILDING. KENOSHA. WIS. 53140
AREA CODE 414 658·4811
ROBERT F. KOLSTAD DIRECTOR
March 29, 1976
To: The Honorable Mayor and Members of Common Council, City of Kenosha Kenosha Transit Commission Southeastern Wisconsin Regional Planning Commission
Gentlemen:
To provide a sound basis for the important decisions facing the City of Kenosha regarding the continued provision and improvement of public transit service, the Kenosha Common Council by Resolution No. 185-73 requested and authorized the Southeastern Wisconsin Regional Planning Commission and the Wisconsin Department of Transportation to work with the City of Kenosha in the preparation of a Transit Development Program for the Kenosha Urban Planning District. To assist and advise the interagency technical staff in the preparation of the Program, a Technical Coordinating and Advisory Committee was formed, representing interested citizens and those federal, state, and local units and agencies of government concerned with transit development in the Kenosha Urban Planning District.
The five year Kenosha Transit Development Program, prepared under direction of the Technical Coordinating and Advisory Committee and documented in this report is based upon an inventory and evaluation of the present transit system and service levels, an analysis of the needs and demand for transit service in the Kenosha area, and a careful examination of the attendant costs of and funding for alternative transit improvement plans. The evaluation and selection of the recommended plan was made on the basis of the objectives, principles, and standards of transit development for the Kenosha area as prepared and adopted by the Committee. Included in the five year recommendations· are the addition of a bus route, improvements in the configuration of the existing routes, the provision of transit waiting shelters, the initiation of an elderly and handicapped transit program, and the staged reduction of bus route headways.
The findings and recommendations contained in this report were carefully reviewed and unanimously approved by the Technical Coordinating and Advisory Committee. Adoption and implementation of the recommended plan would, in the Committee's opinion, provide the Kenosha Urban Planning District in the years immediately ahead with the maximum practical level of public mass transit service. It would also serve to concentrate appropriate resources and capabilities on corresponding areas of need, thereby assuring the most effective use of the total public resources in the provision of mass transportation service.
The report and plan are hereby respectfully submitted for your careful consideration and, hopefully, adoption. Favorable action on the report and plan is respectfully urged by the interagency staff and by the Technical Coordinating and Advisory Committee.
Respectfully submitted,
~~v(~ Robert F. Kolstad, Chairman Technical Coordinating and Advisory
Committee on Transit Development for the Kenosha Urban Planning District
recycled paper

(This page intentionally left blank)

TABLE OF CONTENTS
Chapter Page
I INTRODUCTION. . . . . . . . . . . . . . . . . . . . . . . . . . . . . . . . . . . . . . . . . . . . . . . . . . . . . . . . . . . . . . . . . . . . . 1 Definition of a Transit Development Program. . . . . . . . . . . . . . . . . . . . . . . . . . . . . . . . . . . . . . . . . . . . . . 1 Need for a Transit Development Program. . . . . . . . . . . . . . . . . . . . . . . . . . . . . . . . . . . . . . . . . . . . . . . . . 1 Study Organization. . . . . . . . . . . . . . . . . . . . . . . . . . . . . . . . . . . . . . . . . . . . . . . . . . . . . . . . . . . . . . . . . . 2
Staff. . . . . . . . . . . . . . . . . . . . . . . . . . . . . . . . . . . . . . . . . . . . . . . . . . . . . . . . . . . . . . . . . . . . . . . . . . . 2 Advisory Committee Structure . . . . . . . . . . . . . . . . . . . . . . . . . . . . . . . . . . . . . . . . . . . . . . . . . . . . . . . 2
Study Purpose and Plan Objectives. . . . . . . . . . . . . . . . . . . . . . . . . . . . . . . . . . . . . . . . . . . . . . . . . . . . . . 2 Transit Development Planning Process . . . . . . . . . . . . . . . . . . . . . . . . . . . . . . . . . . . . . . . . . . . . . . . . . . . 2
Study Design. . . . . . . . . . . . . . . . . . . . . . . . . . . . . . . . . . . . . . . . . . . . . . . . . . . . . . . . . . . . . . . . . . . . . 3 Formulation of Objectives and Standards. . . . . . . . . . . . . . . . . . . . . . . . . . . . . . . . . . . . . . . . . . . . . . . 3 Inventory . . . . . . . . . . . . . . . . . . . . . . . . . . . . . . . . . . . . . . . . . . . . . . . . . . . . . . . . . . . . . . . . . . . . . . . 3 Transit System Analysis . . . . . . . . . . . . . . . . . . . . . . . . . . . . . . . . . . . . . . . . . . . . . . . . . . . . . . . . . . . . 4 Plan Design. . . . . . . . . . . . . . . . . . . . . . . . . . . . . . . . . . . . . . . . . . . . . . . . . . . . . . . . . . . . . . . . . . . . . . 4 Plan Test and Evaluation. . . . . . . . . . . . . . . . . . . . . . . . . . . . . . . . . . . . . . . . . . . . . . . . . . . . . . . . . . . . 4 Plan Adoption. . . . . . . . . . . . . . . . . . . . . . . . . . . . . . . . . . . . . . . . . . . . . . . . . . . . . . . . . . . . . . . . . . . . 4
Summary.......................................................................... 5
II TRANSIT PLANNING STATUS. . . . . . . . . . . . . . . . . . . . . . . . . . . . . . . . . . . . . . . . . . . . . . . . . . . . . . . . . . 7 Introduction. . . . . . . . . . . . . . . . . . . . . . . . . . . . . . . . . . . . . . . . . . . . . . . . . . . . . . . . . . . . . . . . . . . . . . . 7 Regional Land Use-Transportation Plan (1966). . . . . . . . . . . . . . . . . . . . . . . . . . . . . . . . . . . . . . . . . . . . . 7 Comprehensive Plan for the Kenosha Urban Planning District (1967). . . . . . . . . . . . . . . . . . . . . . . . . . . . 7 Improved Transit Services for City of Kenosha, Wisconsin (1969) ..... . . . . . . . . . . . . . . . . . . . . . . . . . 7 Interim Kenosha Transit Development Plan (1974). . . . . . . . . . . . . . . . . . . . . . . . . . . . . . . . . . . . . . . . . . 7 Current Kenosha Transit Commission Plans . . . . . . . . . . . . . . . . . . . . . . . . . . . . . . . . . . . . . . . . . . . . . . . 8 Regional Transportation Authority (Illinois -1974) . . . . . . . . . . . . . . . . . . . . . . . . . . . . . . . . . . . . . . . . . 8 Regional Land Use-Transportation Plan Reevaluation. . . . . . . . . . . . . . . . . . . . . . . . . . . . . . . . . . . . . . . . 8 Definitions of Mass Transit. . . . . . . . . . . . . . . . . . . . . . . . . . . . . . . . . . . . . . . . . . . . . . . . . . . . . . . . . . . . 8 Summary ......................................................................... , 10
III KENOSHA TRANSIT SERVICE AREA................................... ...... ........... 11 Introduction ...................................................................... , 11 Physical Description ................................................................ , 11 Land Use Characteristics ............................................................. , 11 Population Characteristics ............................................................ , 13 Economic Characteristics ................ ',' .......................................... , 13 Identification of Special Population Groups .............................................. , 14
School Children. . . . . . . . . . . . . . . . . . . . . . . . . . . . . . . . . . . . . . . . . . . . . . . . . . . . . . . . . . . . . . . . . .. 15 The Elderly . . . . . . . . . . . . . . . . . . . . . . . . . . . . . . . . . . . . . . . . . . . . . . . . . . . . . . . . . . . . . . . . . . . . .. 15 Low Income Families ............................................................. , 16 Minorities . . . . . . . . . . . . . . . . . . . . . . . . . . . . . . . . . . . . . . . . . . . . . . . . . . . . . . . . . . . . . . . . . . . . . .. 17 The Handicapped . . . . . . . . . . . . . . . . . . . . . . . . . . . . . . . . . . . . . . . . . . . . . . . . . . . . . . . . . . . . . . . .. 17 Automobile Ownership ............................................................ , 17 High Priority Transit Service Areas ................................................... , 17
Major Trip Generators. . . . . . . . . . . . . . . . . . . . . . . . . . . . . . . . . . . . . . . . . . . . . . . . . . . . . . . . . . . . . . .. 18 Employment Centers. . . . . . . . . . . . . . . . . . . . . . . . . . . . . . . . . . . . . . . . . . . . . . . . . . . . . . . . . . . . . .. 18 Shopping Areas. . . . . . . . . . . . . . . . . . . . . . . . . . . . . . . . . . . . . . . . . . . . . . . . . . . . . . . . . . . . . . . . . .. 20 Educational Institutions. . . . . . . . . . . . . . . . . . . . . . . . . . . . . . . . . . . . . . . . . . . . . . . . . . . . . . . . . . .. 21 Public and Medical Institutions. . . . . . . . . . . . . . . . . . . . . . . . . . . . . . . . . . . . . . . . . . . . . . . . . . . . . .. 24 Recreational Areas . . . . . . . . . . . . . . . . . . . . . . . . . . . . . . . . . . . . . . . . . . . . . . . . . . . . . . . . . . . . . . .. 24
Travel Habits and Patterns .............................................. '. . . . . . . . . . . . . .. 25 Summary .......................................................................... 28
v

Chapter Page
IV EXISTING MASS TRANSIT SYSTEMS. . . . . . . . . . . . . . . . . . . . . . . . . . . . . . . . . . . . . . . . . . . . . . . . . . .. 31 Introduction. . . . . . . . . . . . . . . . . . . . . . . . . . . . . . . . . . . . . . . . . . . . . . . . . . . . . . . . . . . . . . . . . . . . . .. 31 History .................................. " ... , ............................ " . .. .. 31 Kenosha Transit Commission . . . . . . . . . . . . . . . . . . . . . . . . . . . . . . . . . . . . . . . . . . . . . . . . . . . . . . . . .. 32
Management Structure and Personnel. . . . . . . . . . . . . . . . . . . . . . . . . . . . . . . . . . . . . . . . . . . . . . . . .. 32 Levels of Service. . . . . . . . . . . . . . . . . . . . . . . . . . . . . . . . . . . . . . . . . . . . . . . . . . . . . . . . . . . . . . . . .. 33 Capital Equipment and Maintenance. . . . . . . . . . . . . . . . . . . . . . . . . . . . . . . . . . . . . . . . . . . . . . . . . .. 34 Marketing and Public Relations. . . . . . . . . . . . . . . . . . . . . . . . . . . . . . . . . . . . . . . . . . . . . . . . . . . . . .. 37 Financial Status. . . . . . . . . . . . . . . . . . . . . . . . . . . . . . . . . . . . . . . . . . . . . . . . . . . . . . . . . . . . . . . . . .. 38
Other Bus Services. . . . . . . . . . . . . . . . . . . . . . . . . . . . . . . . . . . . . . . . . . . . . . . . . . . . . . . . . . . . . . . . . .. 40 Commuter Rail Service. . . . . . . . . . . . . . . . . . . . . . . . . . . . . . . . . . . . . . . . . . . . . . . . . . . . . . . . . . . . . .. 40 Existing Transit Travel Habits and Patterns. . . . . . . . . . . . . . . . . . . . . . . . . . . . . . . . . . . . . . . . . . . . . . .. 42
User Characteristics. . . . . . . . . . . . . . . . . . . . . . . . . . . . . . . . . . . . . . . . . . . . . . . . . . . . . . . . . . . . . . .. 42 Trip Characteristics. . . . . . . . . . . . . . . . . . . . . . . . . . . . . . . . . . . . . . . . . . . . . . . . . . . . . . . . . . . . . . .. 45 Transfer Movement. . . . . . . . . . . . . . . . . . . . . . . . . . . . . . . . . . . . . . . . . . . . . . . . . . . . . . . . . . . . . . .. 45
Public Opinion Concerning Mass Transit. . . . . . . . . . . . . . . . . . . . . . . . . . . . . . . . . . . . . . . . . . . . . . . . .. 45 Summary .......................................................................... 47
V EXISTING TRANSIT LEGISLATION AND REGULATIONS................................... 49 Introduction. . . . . . . . . . . . . . . . . . . . . . . . . . . . . . . . . . . . . . . . . . . . . . . . . . . . . . . . . . . . . . . . . . . . . .. 49 Federal Legislation ...................... '. . . . . . . . . . . . . . . . . . . . . . . . . . . . . . . . . . . . . . . . . . .. 49 State Legislation. . . . . . . . . . . . . . . . . . . . . . . . . . . . . . . . . . . . . . . . . . . . . . . . . . . . . . . . . . . . . . . . . . .. 51 Local Legislation. . . . . . . . . . . . . . . . . . . . . . . . . . . . . . . . . . . . . . . . . . . . . . . . . . . . . . . . . . . . . . . . . . .. 53 Legislative Analysis. . . . . . . . . . . . . . . . . . . . . . . . . . . . . . . . . . . . . . . . . . . . . . . . . . . . . . . . . . . . . . . . .. 53 Summary .......................................................................... 54
VI EVALUATION OF EXISTING SySTEMS.................................................. 55 Introduction. . . . . . . . . . . . . . . . . . . . . . . . . . . . . . . . . . . . . . . . . . . . . . . . . . . . . . . . . . . . . . . . . . . . . .. 55 Objectives and Standards. . . . . . . . . . . . . . . . . . . . . . . . . . . . . . . . . . . . . . . . . . . . . . . . . . . . . . . . . . . . .. 55 Management Structure and Personnel. . . . . . . . . . . . . . . . . . . . . . . . . . . . . . . . . . . . . . . . . . . . . . . . . . .. 60 Levels of Service. . . . . . . . . . . . . . . . . . . . . . . . . . . . . . . . . . . . . . . . . . . . . . . . . . . . . . . . . . . . . . . . . . .. 60
Service to Priority Population Groups ............................................ , . . . .. 61 Service to Major Trip Generators. . . . . . . . . . . . . . . . . . . . . . . . . . . . . . . . . . . . . . . . . . • . . . . . . . . . .. 61 Service Relative to Existing Travel Habits and Patterns. . . . . . . . . . . . . . . . . . . . . . . . . . . . . . . . . . . .. 62
Capital Equipment and Maintenance. . . . . . . . . . . . . . . . . . . . . . . . . . . . . . . . . . . . . . . . . . . . . . . . . . . .. 62 Marketing and Public Relations ............................................... ' . . . . . . . . .. 63 Financial Status. . . . . . . . . . . . . . . . . . . . . . . . . . . . . . . . . . . . . . . . . . . . . . . . . . . . . . . . . . . . . . . . . . . .. 63 Other Transit Services. . . . . . . . . . . . . . . . . . . . . . . . . . . . . . . . . . . . . . . . . . . . . . . . . . . . . . . . . . . . . . .. 63 Alternatives. . . . . . . . . . . . . . . . . . . . . . . . . . . . . . . . . . . . . . . . . . . . . . . . . . . . . . . . . . . . . . . . . • . . . . .. 64 Summary .......................................................................... 65
VII RECOMMENDED TRANSIT IMPROVEMENTS . . . . . . . . . . . . . . . . . . . . . . . . . . . . . . . . . . . . . . . . . . . .. 67 Introduction. . . . . . . . . . . . . . . . . . . . . . . . . . . . . . . . . . . . . . . . . . . . . . . . . . . . . . . . . . . . . . . . . . . . . .. 67 Routes and Schedules. . . . . . . . . . . . . . . . . . . . . . . . . . . . . . . . . . . . . . . . . . . . . . . . . . . . . . . . . . . . . . .. 67
Minor Adjustments. . . . . . . . . . . . . . . . . . . . . . . . . . . . . . . . . . . . . . . . . . . . . . . . . . . . . . . . . . . . . . .. 67 Route Additions. . . . . . . . . . . . . . . . . . . . . . . . . . . . . . . . . ... . . . . . . . . . . . . . . . . . . . . . . . . . . . . . .. 69 Frequency of Service. . . . . . . . . . . . . . . . . . . . . . . . . . . . . . . . . . . . . . . . . . . . . . . . . . . . . . . . . . . . . .. 69 Hours of Operation. . . . . . . . . . . . . . . . . . . . . . . . . . . . . . . . . . . . . . . . . . . . . . . . . . . . . . . . . . . . . . .. 70
Capital Improvements. . . . . . . . . . . . . . . . . . . . . . . . . . . . . . . . . . . . . . . . . . . . . . . . . . . . . . . . . . . . . . .. 70 Operating Improvements. . . . . . . . . . . . . . . . . . . . . . . . . . . . . . . . . . . . . . . . . . . . . . . . . . . . . . . . . . . . .. 72 Noncapital Intensive Improvements. . . . . . . . . . . . . . . . . . . . . . . . . . . . . . . . . . . . . . . . . . . . . . . . . . . .. 73 Special Projects .................................................. " . . . . . . . . . . . . . . . . .. 74 Program of Projects ........................................................... '.' . . . .. 74 Financial Evaluation . . . . . . . . . . . . . . . . . . . . . . . . . . . . . . . . . . . . . . . . . . . . . . . . . . . . . . . . . . . . . . . .. 74
Capital Costs. . . . . . . . . . . . . . . . . . . . . . . . . . . . . . . . . . . . . . . . . . . . . . . . . . . . . . . . . . . . . . . . . . . .. 74 Operating Costs. . . . . . . . . . . . . . . . . . . . . . . . . . . . . . . . . . . . . . . . . . . . . . . . . . . . . . . . . . . . . . . . . .. 75 Operating Revenue ............................................................... , 78 Sources of Funding. . . . . . . . . . . . . . . . . . . . . . . . . . . . . . . . . . . . . . . . . . . . . . . . . . . . . . . . . . . . . . .. 78
Environmental and Energy Considerations . . . . . . . . . . . . . . . . . . . . . . . . . . . . . . . . . . . . . . . . . . . . . . .. 79 Summary .......................................................................... 80
VIII SUMMAR Y AND CONCLUSIONS. . . . . . . . . . . . . . . . . . . . . . . . . . . . . . . . . . . . . . . . . . . . . . . . . . . . . . .. 81
vi
LIST OF APPENDICES
Appendix Page
A Technical Coordinating and Advisory Committee on Transit Development for the Kenosha Planning District . . . . . . . . . . . . . . . . . . . . . . . . . . . . . . . . . . . . . . .. 85
B Kenosha Transit Commission Financial Statement: 1971-1974. . . . . . . . . . . . . . . . . . . . . . . . . . . . . . . . . .. 87
LIST OF TABLES
Table Page
1 Land Uses in the Kenosha Urban Planning District: 1970. . . . . . . . . . . . . . . . . . . . . . . . . . . . . . . . . . . . . .. 13 2 Population of the Kenosha Planning District by Civil Division: 1960,1970, and 1974. . . . . . . . . . . . . . . .. 15 3 Employment by Industry Group in the Kenosha Urban Planning District: 1970. . . . . . . . . . . . . . . . . . . . .. 15 4 Employment by Occupation in the Kenosha Urban Planning District: 1970. . . . . . . . . . . . . . . . . . . . . . . .. 15 5 Selected Characteristics for the Kenosha Urban Planning District by Census Tracts: 1970 . . . . . . . . . . . . .. 16 6 Facilities for the Elderly in the Kenosha Urban Planning District: 1975. . . . . . . . . . . . . . . . . . . . . . . . . . .. 17 7 Facilities for the Handicapped in the Kenosha Urban Planning District: 1975 . . . . . . . . . . . . . . . . . . . . . .. 17 8 Major Employment Centers in the Kenosha Urban Planning District: 1975 . . . . . . . . . . . . . . . . . . . . . . . .. 21 9 Major Shopping Areas in the Kenosha Urban Planning District: 1975. . . . . . . . . . . . . . . . . . . . . . . . . . . . .. 23
10 Educational Institutions in the Kenosha Urban Planning District: 1975 . . . . . . . . . . . . . . . . . . . . . . . . . . .. 23 11 Public and Medical Institutions in the Kenosha Urban Planning District: 1975. . . . . . . . . . . . . . . . . . . . . .. 25 12 Major Recreational Areas in the Kenosha Urban Planning District: 1975 . . . . . . . . . . . . . . . . . . . . . . . . . .. 25 13 Age Distribution of Tripmakers in the Kenosha Effective Urban Transit Service Area: 1972 .......... '. 29 14 Income Distribution of Tripmakers in the Kenosha Effective Urban Transit Service Area: 1972 .. . . . . . .. 29 15 Mass Transit Revenue Passengers, Vehicle Miles, and Vehicle Hours
in the Kenosha Urban Planning District by Year: 1955-1974. . . . . . . . . . . . . . . . . . . . . . . . . . . . . . . . . . .. 32 16 Mileage in the Kenosha Transit System by Route: December 1975. . . . . . . . . . . . . . . . . . . . . . . . . . . . . . .. 33 17 Transit Revenue Ridership by Month in the Kenosha Urban Planning District: 1971-1975. . . . . . . . . . . . .. 37 18 Selected Characteristics of Buses Owned by the Kenosha Transit Commission: 1975. . . . . . . . . . . . . . . . .. 38 19 Operating Costs and Revenues of the Kenosha Transit Commission: 1971-1974. . . . . . . . . . . . . . . . . . . . .. 39 20 Percentage Distribution of Ridership on the Kenosha Transit System by Sex by Route: May 4, 1972 . . . .. 44 21 Percentage Distribution of Ridership on the Kenosha Transit System by Race by Route: May 4, 1972 . . .. 44 22 Percentage Distribution of Ridership on the Kenosha Transit System by Age by Route: May 4, 1972. . . .. 44 23 Percentage Distribution of Ridership on the Kenosha Transit System by Income by Route: May 4, 1972 .. 44 24 Percentage Distributions of Trip Origins and Trip Destinations
on the Kenosha Transit System: May 4, 1972. . . . . . . . . . . . . . . . . . . . . . . . . . . . . . . . . . . .. . . . . . . . . . .. 46 25 Percentage Distribution of Trips on the Kenosha Transit System by Trip Purpose: May 4, 1972 . . . . . . . .. 46 26 Morning Transfers (6 A.M. to 12 Noon) on the Kenosha Transit by Route: May 4, 1972. . . . . . . . . . . . . .. 46 27 Afternoon Transfers (12 Noon to 9 P.M.) on the Kenosha Transit System by Route: May 4,1972 . . . . . .. 46 28 Total Daily Transfers on the Kenosha Transit System by Route: May 4, 1972. . . . . . . . . . . . . . . . . . . . . .. 46 29 Objectives and Standards for Kenosha Transit Development Planning Study . . . . . . . . . . . . . . . . . . . . . . .. 55 30 Proposed Transit Shelter Locations on the Kenosha Transit System. . . . . . . . . . . . . . . . . . . . . . . . . . . . . .. 70 31 Buses Required for Regular Kenosha City Transit Routes with 20 Minute Peak Headways. . . . . . . . . . . . .. 71 32 Buses Required for Regular City and School Tripper Routes of Kenosha Transit System: 1976-1980 . . . .. 72 33 Projections of Operating Data for the Kenosha Transit System: 1976-1980 . . . . . . . . . . . . . . . . . . . . . . . .. 73 34 Projects Recommended in Kenosha Transit Development Program: 1976-1980 . . . . . . . . . . . . . . . . . . . . .. 75 35 Capital Expenditures Recommended in the Kenosha Transit Development Program: 1976-1980. . . . . . . .. 75 36 Projected Operating Costs of the Kenosha Transit System: 1976-1980. . . . . . . . . . . . . . . . . . . . . . . . . . . .. 76 37 Operating Costs, Revenues, and Deficit of the Kenosha Transit System: 1974-1980. . . . . . . . . . . . . . . . . .. 78 38 Federal and Local Shares of Projected Capital Costs
in the Kenosha Transit Development Program: 1976-1980. . . . . . . . . . . . . . . . . . . . . . . . . . . . . . . . . . . . .. 79
vii

LIST OF FIGURES
Figure Page
1 Functional Classification of Mass Transportation Systems . . . . . . . . . . . . . . . . . . . . . . . . . . . . . . . . . . . . . . 9 2 Organization Chart for Management of the Kenosha Transit System. . . . . . . . . . . . . . . . . . . . . . . . . . . . . .. 33 3 Operating Cost and Revenue Per Mile for the Kenosha Transit System: 1971-1975 . . . . . . . . . . . . . . . . . .. 39 4 Operating Cost and Revenue Per Passenger for the Kenosha Transit System: 1971-1975 ............. " 39
LIST OF MAPS
Map Page
1 Location of the Kenosha Urban Planning District In the Southeastern Wisconsin Region. . . . . . . . . . . . . .. 12 2 Generalized Existing Land Use in the Kenosha Urban Planning District: 1970 ..................... " 14 3 Population Density in the Kenosha Urban Planning District: 1970 . . . . . . . . . . . . . . . . . . . . . . . . . . . . . . .. 14 4 Concentration of the Elderly and Location of Facilities for the
Elderly in the Kenosha Urban Planning District. . . . . . . . . . . . . . . . . . . . . . . . . . . . . . . . . . . . . . . . . . . . .. 18 5 Concentration of Low Income Groups in the Kenosha Urban Planning District by Census Tract: 1970 . . .. 18 6 Concentration of Minority Groups in the Kenosha Urban Planning District by Census Tract: 1970 ...... , 19 7 Location of Facilities for the Handicapped in the Kenosha Urban Planning District: 1975. . . . . . . . . . . . .. 19 8 Concentration of Occupied Housing Units with No Auto Ownership
in the Kenosha Urban Planning District by Census Tract: 1970 . . . . . . . . . . . . . . . . . . . . . . . . . . . . . . . . .. 20 9 High Priority Transit Service Areas in the Kenosha Urban Planning District by Census Tract: 1970. . . . . .. 20
10 Location of Major Employment Centers in the Kenosha Urban Planning District: 1975. . . . . . . . . . . . . . .. 22 11 Distribution of American Motors Corporation and Anaconda American Brass Employees
in the Kenosha Urban Planning District by U. S. Public Land Survey Quarter Section: 1972. . . . . . . . . . .. 22 12 Location of Major Shopping Areas in the Kenosha Urban Planning District: 1975 . . . . . . . . . . . . . . . . . . .. 24 13 Location of Educational Institutions in the Kenosha Urban Planning District: 1975 . . . . . . . . . . . . . . . . .. 24 14 Location of Public and Medical Institutions in the Kenosha Urban Planning District: 1975 . . . . . . . . . . . .. 26 15 Location of Major Recreational Areas in the Kenosha Urban Planning District: 1975. . . . . . . . . . . . . . . . .. 26 16 Total Person Trip Attractions in the Kenosha Effective Urban Transit Service Area: 1972. . . . . . . . . . . . .. 27 17 Total Person Trip Productions in the Kenosha Effective Urban Transit Service Area: 1972 . . . . . . . . . . . .. 27 18 City Routes Operated by the Kenosha Transit Commission: December 1975. . . . . . . . . . . . . .. . . . . .. . .. 35 19 School Tripper Routes Operated by the Kenosha Transit Commission: September 1975 . . . . . . . . . . . . . .. 36 20 Intercity Bus and Commuter Train Routes in the Kenosha Urban Planning District: 1975. . . .. . . . . . . . .. 41 21 City Routes Operated by the Kenosha Transit System: May 4, 1972 . . . . . . . . . . . . . . . . . . . . . . . . . . . . .. 43 22 Modifications and Additions Recommended to the Route Structure of the Kenosha Transit System. . . . .. 68
viii

Chapter I
INTRODUCTION
DEFINITION OF A TRANSIT DEVELOPMENT PROGRAM
The provision of adequate mass transit service is essential to the continued vitality of any urban area. This important fact has been recognized in all recent transportation-related planning efforts for the Kenosha urban area and the Southeastern Wisconsin Region, of which Kenosha is an integral part. These planning efforts, which will be discussed fully in later sections of this report, have been primarily aimed at providing a sound long-range framework for transit development within the Kenosha area and the entire Southeastern Wisconsin Region. Although the long-range plans are necessary to provide general direction for future transit development and to assure coordination between the transit and other elements of the overall physical development plan, there are many day-to-day policy and operating decisions which require a short-range comprehensive planning effort. A short-term transit plan not only serves to refine and detail the long-range plans but it also is a prerequisite' to state and federal assistance for urban transit improvements. Such a short-range plan, directed to the continuation and improvement of urban mass transportation, is termed by the U. S. Department of Transportation, Urban Mass Transportation Administration, a transit development program.
More specifically, a transit development program may be defined as a short range (at least five-year) coordinated schedule of capital and operating improvements intended to achieve a maximum practical level of public mass transit service within an urban transit service area and to promote implementation of the transit improvement recommendations of adopted areawide transportation plans.
A transit development program must be based upon: an understanding and evaluation of the existing transit system in terms of service, physical facilities, maintenance, marketing, and management practices; a description and evaluation of the transit service area in terms of population to be served, personal travel habits, and patterns of transit users and in terms of the location and characteristics of major traffic generators; and an evaluation of alternative courses of action including transit operating policies, transit operations improvements, capital improvements, and other related policy decisions. A transit development program must include alternative and recommended five-year staging plans for transit improvements. The first two of these years must be sufficiently specific to be immediately implementable. As a working document the transit development program must be updated annually so that there is always a two-year period in which plans are at a detailed operational level and changes in community development and in transit ridership patterns over the five-year period can be readily incorporated into the plan. Finally, a transit development program must include a unified course of action, consistent with areawide plans, for all transit facilities in the urban area. The program must identify the actions to be taken and the financial commitments to be made by all agencies concerned with implementation of the plan.
NEED FOR A TRANSIT DEVELOPMENT PROGRAM
Transit development in the Kenosha urban area is in a state of rapid transition. The major transit system in the Kenosha urban area has been publicly owned and operated by the City of Kenosha since 1971. Despite the deteriorated condition of this system at the time of acquisition, the demand for transit service in the City of Kenosha has increased dramatically in the past three years, probably due in part to a significant reduction in fare. To satisfy this demand with reliable and convenient bus service, the City of Kenosha in 1974 applied for and received a capital improvement grant of over $1.5 million from the Urban Mass Transportation Administration. The greater part of this grant has been used to purchase 24 new buses, recently delivered, and for a new garaging and maintenance facility, presently under construction. As part of the application process the City of Kenosha in cooperation with the Southeastern Wisconsin Regional Planning Commission developed an interim Kenosha transit development program. Although this interim program provided sufficient justification for the capital grant, it did not, nor was it intended, to fully meet the criteria for a comprehensive transit development program as outlined in the preceding section.
It is, therefore, appropriate at this time to fully reevaluate transit service not only for the City of Kenosha but for the entire urbanizing area. This reevaluation is intended to result in a series of specific recommendations that, if implemented over the next five years, will provide the Kenosha area with the maximum practical level of mass transit service. These recommendations will deal primarily with service levels, route configuration, scheduling, management, marketing, financing, and operating policies. Only in this way can the newly acquired equipment and facilities be used to provide the greatest potential benefit.
Finally, a transit development program is needed to provide state and federal funding agencies with a basis upon which specific applications for transit capital improvement and operating assistance can be considered. This is a particularly important function in light of increases in available funds and subsequent increases in the number and complexity of planning requirements.
STUDY ORGANIZATION
Staff The preliminary research, system design, and final report preparation for the Kenosha transit development program have been a joint staff effort between the City of Kenosha, the Southeastern Wisconsin Regional Planning Commission, and the Wisconsin Department of Transportation. An interagency team was assembled from the staff of these three agencies to gather the data, analyze the results, develop alternative plans, and prepare reports for Technical Coordinating and Advisory Committee review and response. Because the transit development planning program was preceded by related transit inventory and planning efforts, a large staff was not required to carry out the effort. It was necessary, however, to obtain additional staff assistance from a number of the agencies represented on the Technical Coordinating and Advisory Committee including the Kenosha Transit-Parking Commission and the University of Wisconsin-Parkside.
Advisory Committee Structure Because any transit development proposal would affect a number of governmental agencies and private interests, it was considered essential to involve these interests actively in the transit planning process. Accordingly, a technical coordinating and advisory committee was established representing a broad spectrum of leadership in the Kenosha Urban Planning District as well as concerned regional, state, and federal officials and representatives from local interest groups. In general, the purpose of the Committee was to broaden input in the study through a critical review of staff efforts.
Specifically, the Committee was charged with these tasks: assisting and advising the study staff on technical methods, procedures, and interpretations; aiding in the assembly and evaluation of planning and engineering data; assisting in the establishment, definition, and review of criteria; appraising alternative plans, and resolving any conflicts that might arise in plan preparation and selection. The Committee was intended to be a working group and to actively involve the federal, state, and local technical officials in the planning process, objectives which have been fully met. A complete Committee membership list is set forth in Appendix A of this report.
STUDY PURPOSE AND PLAN OBJECTIVES
The primary purpose of the transit development program is to postulate, evaluate, and recommend a series of specific actions that can be taken during the next five years to provide the Kenosha urban area with the maximum practical level of mass transit service. More specifically, the objectives of the transit development program are to:
1. Promote implementation of the adopted regional transportation and regional land use plans, as those plans have been refined in the comprehensive plan for the Kenosha Urban Planning District.
2. Provide a sound basis for the continuation and improvement of transit service within the transit service area.
3. Provide a sound basis for the making of those management and transit operating policy decisions necessary to carry out transit service improvements.
4. Provide a basis for establishment of a sound fiscal policy and for the systematic scheduling of transit service and system improvements to assure effective use of public resources in providing urban mass transit.
5. Provide a sound basis for the efficient management of the urban transit system, for attainment of the necessary coordination in that management, for continued monitoring of program results, and for continued program updating to maintain program goals through the five years beyond current activities.
6. Provide documentation that relates transit improvements to long-range transportation and comprehensive plan recommendations for the Kenosha urbanized area to assure coordinated physical development, provision for balanced transportation, and support for capital and operating assistance grant applications to state and federal agencies.
TRANSIT DEVELOPMENT PLANNING PROCESS
As stated earlier, a transit development program must result in a short-range plan that concurs with and tends to implement the adopted long-range areawide transportation plans. The appropriate point of departure for the Kenosha transit development program was, therefore, a review of the adopted long-range transportation plans. There are essentially two such plans. Together they constitute a long-range areawide plan for the physical development of the Kenosha urban area.
2

The first is the regional land use-transportation plan of the Southeastern Wisconsin Regional Planning Commission. That plan along with the salient findings and recommendations of the comprehensive land use-transportation study, upon which the plans are based, is set forth in SEWRPC Planning Report I\io. 7, Volume One, Inventory Findings-1963; Volume Two, Forecasts and Alternative Plans--1990; and Volume Three, Recommended Regional Land Use and Transportation Plans---1990. The recommended plan, which contains long-range transit facility and service improvements, was adopted by the Commission on December 1, 1966, by the Kenosha County Board of Supervisors on April 20, 1967, by the Town of Somers on December 8, 1969, and by the City of Kenosha on May 15,1972.
The second plan resulted from a comprehensive community development planning study initiated in 1962 for the Kenosha Urban Planning District. The study was completed in 1967 with the publication of SEWRPC Planning Report No. 10, Volumes One and Two, A Comprehensive Plan for the Kenosha Planning District. This plan, which further refined transit recommendations for the Kenosha area, was adopted by the Commission on June 1, 1972, and by the City of Kenosha on October 16, 1972.
Although the specifics of these plans will not be restated here, it is important to note that the trarisit-related recommendations of these plans were considered and that the transit development program documented herein is fully consistent with the objectives of these plans. The program serves to further refine and detail them with respect to transit development in the Kenosha area.
The preparation of a transit development program requires a rational and systematic process to develop a workable plan of action to achieve an effective balance between increased service, ridership, and revenue on the one hand and efficient transit operations with minimized system costs on the other. An established seven-step planning process, found effective in the conduct of similar studies, was used to prepare the transit development program for the Kenosha urbanized area. The seven steps were:
1. Study design
2. Formulation of objectives and standards
3. Inventory
4. Transit systems analysis
5. Plan design
6. Plan test and evaluation
7. Plan adoption
A brief description of each of these steps as it relates to the transit development program for Kenosha follows.
Study Design Every planning program must embrace a formal structure or study design so that the program can be carried out in a logical, consistent, and efficient manner. A statement of policy and procedure, setting forth the routine for the conduct of the study was, therefore, prepared as the initial work element of the Kenosha transit development program. This statement provided a sequential overview of the major work elements of the study. It also provided for establishment of the Technical Coordinating and Advisory Committee necessary to assist in conducting the study and providing technical policy guidance. It provided, further, for documentation of study results in detailed staff memoranda, the minutes of the Technical Coordinating and Advisory Committee meetings, and ultimately, in this published report.
Formulation of Objectives and Standards In its most basic sense, planning is a rational process for establishing and meeting objectives. Formulation of objectives is, therefore, an essential task to be undertaken before plans can be prepared. Basic transportation system development objectives and specific transit system development objectives are set forth in the adopted regional transportation plan. Upon review of these objectives it was determined that they could be adapted, with certain modifications, for the Kenosha area. Not only did these objectives guide the evaluation of the existing system but they also were used to compare alternatives and measure the effectiveness of the recommended program. These objectives are set forth in Chapter VI of this report.
Inventory Reliable basic data is absolutely essential to formulation of workable development plans. Consequently, inventory growing out of the study design becomes the first operational step in any planning process. The crucial nature of factual information in the planning process should be evident since no intelligent forecasts can be made or alternative courses of action selected without knowledge of the current state of the system being planned.
3

The inventories for this study covered four basic areas: past transit planning efforts; the relevant characteristics of the urban mass transit service area; the existing transit sy~tems, and pertinent transit legislation and regulation.
The inventory of past planning efforts, found in Chapter II of this report, reviews adopted and proposed transit plans for the Kenosha urbanizing area. In addition to providing the basic context for development of this program, Chapter II also establishes working definitions of -a set of transit terminologies and defines the types of mass transit service available in the study area.
The inventory of the transit service area provides a description of the study area in terms of physical attributes and land use, population, and economic characteristics. The extent and character of travel demand in the study area are determined through the identification of major trip generators and examination of recent origin-destination surveys. In addition, those concentrations of people and activities most highly dependent on and closely related to mass transit service are identified. The findings of this inventory can be found in Chapter III of this report.
The inventory of the existing transit system identifies the history, extent of service, management, financial situation, and operating policies of the organizations offering transit service within the study area. The inventory also examines existing transit usage not only in terms of quantity but also in terms of the socioeconomic characteristics of the existing transit patronage. The findings of this inventory are contained in Chpater IV of this report.
Finally, if a program capable of immediate implementation is to be developed, consideration must be given to any legal or institutional constraints. For this reason, Chapter V contains a review of transit legislation and regulation emanating: from the federal, state, and local levels. This review is crucial since even local development plans must have the financial support and thus the approval of the higher levels of government.
Transit System Analysis Following completion of the inventory stage, it is necessary to analyze the performance of the existing transit system. This function can be accomplished primarily by determining how well the present service meets the adopted objectives and standards for transit development. In this manner, specific areas of need can be identified and subsequently addressed. The analysis function also includes predictions of future transit demand and the potential problems associated with satisfying this demand. The results of the analysis step of the transit development program may be found in Chapter VI of this report.
Plan Design Plan design forms the heart of the planning process. The outputs of each of the previously described planning operations become inputs to the design problem of plan synthesis.
Improvements in transit service and the transit system aimed at removing existing deficiencies identified in the analysis stage are detailed and staged over a five year period. Feasible alternatives are postUlated for each of the several transit improvement areas including: route structure, scheduling, management, capital improvements, marketing, and low and non-capital intensive solutions. The alternative transit plans considered are set forth in Chapter VI of this report.
Plan Test and Evaluation If the plans developed in the design stage of the planning process are to be realized in terms of program development, measures must be applied to test these plans quantitatively and qualitatively before their recommendation, adoption, and implementation. The plan test and evaluation process must ascertain whether or not the plans are realistic in scope, consistent with the desirable advancement of the public interest; if they are technically, legally, and financially feasible; and if they are readily comprehensible by knowledgeable elected public officials, engineers, and technicians who ultimately will be charged with implementation. With specific regard to transit systems, alternatives can be evaluated against program objectives and standards, number of people served, cost of service, revenue obtained, and compatibility with the other elements of the adopted transportation system. While it is generally recognized that urban mass transit service is not able to support itself from fare box revenues, certain measures of cost effectiveness can be employed to balance the financial requirement against the service provided. The result of the evaluation process is a recommended transit development program which can be certified to the constituent units of government for their consideration, adoption, and implementation. The results of the evaluation of the alternative plans are set forth in Chapter VI while the recommended plan is described in Chapter VII of this report.
Plan Adoption In a practical sense, the transit development program is not complete until the steps required for its implementation, that is, the steps necessary to convert the plan recommendations to action policies and programs, are specified. Plan implementation must begin with plan adoption by the respective implementing agencies, including the City of Kenosha, the Towns of Somers and Pleasant Prairie, the Unified School District, the Kenosha County Board of Supervisors, the University of Wisconsin-Parkside, the Wisconsin Department of Transportation, and the U. S. Department of Transportation, Urban Mass Transportation Administration. It is only after coordinated adoptive actions of these concerned agencies that smooth and expeditious implementation can occur.
4

SUMMARY
The current urgency of providing an adequate level of mass transportation service in the Kenosha urban area requires that a short-range planning effort directed toward the continuation and improvement of existing urban mass transportation be conducted. The result of this planning effort will be a transit development program defined as a five year coordinated schedule of capital and operating improvements whose purposes are to achieve a maximum practical level of public mass transit service. The transit development program documented herein will serve to refine and detail adopted long range transit plans. As such it is intended to satisfy state and federal planning requirements for capital and operating assistance. This transit development program, formulated under an established seven step planning process, represents a joint staff effort between the City of Kenosha, the Southeastern Wisconsin Regional Planning Commission, and the Wisconsin Department of Transportation. The further establishment of a Technical Coordinating and Advisory Committee not only assures adequate local participation but also facilitates implementation of the recommendations contained within the Kenosha transit development program.
5

(This page intentionally left blank)

Chapter II
TRANSIT PLANNING STATUS
INTRODUCTION
Planning is, by its very nature, a continuing process. A planning effort can rarely be conducted properly without a working knowledge of the planning efforts and adopted plans which preceded it. To assure such continuity in the Kenosha transit development program, it is necessary to review briefly the relevant past planning efforts as they pertain to transit development in the Kenosha area. The following sections describe the major adopted plans and planning efforts of the past fifteen years with emphasis on their implications for the Kenosha transit development plan. In addition, the final section of this chapter offers definitions of mass transit terminology in order to facilitate understanding of the remaining chapters.
REGIONAL LAND USE-TRANSPORTATION PLAN (1966)
The adopted regional transportation plan recommended that an improved and expanded mass transit system be developed to serve the rapidly urbanizing Region in an effort to reverse long-term downward trends in transit ridership. Foremost among the recommendations was the Commission finding that a flexible, rubber tire, intraurban transit system is the best means for providing high level rapid transit service in the Kenosha urbanized area. Other alternatives such as fixed rail were considered, but the study determined that, apart from the loss of flexibility, such alternatives were less cost effective in providing the desired level of service and they involved too great a public expenditure for any potential benefit. Finally, the adopted regional plan proposed a series of interurban bus routes connecting Kenosha with Chicago, Milwaukee, and Racine. It was recommended that these routes operate at high speeds over the existing freeway system and the expanded freeway system also proposed in the regional transportation plan.
COMPREHENSIVE PLAN FOR THE KENOSHA URBAN PLANNING DISTRICT (1967)
As stated in the preceding chapter, the second major regional planning element for the Kenosha area was the development of a comprehensive plan for the Kenosha Urban Planning District. Intended to refine and detail the adopted regional land use-transportation plan, this study considered all modes of travel including transit. Besides reaffirming the desirability of a flexible rubber tire transit system, the plan recommended construction of a common terminal facility in the Kenosha central business district, primarily to coordinate the various interurban bus lines. The plan also recommended changes in the local bus routes aimed primarily at extending the transit service area.
IMPROVED TRANSIT SERVICES FOR CITY OF KENOSHA, WISCONSIN (1969)
In early 1969, the City of Kenosha, anticipating the collapse of privately owned local bus operations, applied for and received a technical study grant from the U. S. Department of Transportation, Urban Mass Transportation Administration (UMTA). The grant was used to retain the consulting firm of Simpson and Curtin to evaluate the local bus system and propose possible improvements in that system. The principal recommendation of the study, published in December 1969, was for public acquisition and operation of the local transit system. The report contained an evaluation of existing service, an audit and inventory of the private bus company's holdings, recommendations for methods of purchase and financing, alternative structures of public management, and the necessary capital improvements to be made upon acquisition.
INTERIM KENOSHA TRANSIT DEVELOPMENT PLAN (1974)
Following the decision to publicly operate the transit system, the City of Kenosha applied for a capital grant from the Urban Mass Transportation Administration to assist in purchase of new buses and related maintenance equipment. As part of the application process, the City of Kenosha in cooperation with the Southeastern Wisconsin Regional Planning Commission prepared an interim transit improvement program. The supporting study for the improvement program was published in April 1974, and, although not so comprehensive, it followed the same format as the study reported herein. An evaluation of the transit system was performed; priority groups and major traffic generators were identified, and recommendations were made concerning route configurations, scheduling, capital improvements, and management and marketing policies. A more detailed description of the recommended interim program is given in Chapter VI of this report in a discussion of alternative plans.
7

CURRENT KENOSHA TRANSIT COMMISSION PLANS
The recommendations of the interim Kenosha transit development plan (TDP) called for significant transit route and schedule improvements with reduced head ways, thus requiring substantial increases in the number of bus drivers and subsequently in the amount of local financial support for transit operations. At the time of the plan's introduction (April 1974) it was approved by the Kenosha Transit Commission, the City administration, and the Common Council finance committee. In the months that followed, however, with the economy worsening and budget cuts threatened in state aids for transportation, the City of Kenosha reexamined the level of all city expenditures including those for transit operations. As a part of this austerity campaign the Common Council requested that the City Department of Transportation devise a new route system. ,While properly using all of the new equipment forthcoming under the UMT A grant, this route system would require fewer drivers and, therefore, a smaller operating budget. Such a route structure incorporating many of the interim TDP recommendations was subsequently devised in late 1974. Pursuant to state law, a public hearing to consider the new route structure was held on December 19, 1974. Based upon the comments generated at the hearing, additional modifications including continuation of bus service to UW-Parkside were made. The route structure was further reviewed and adjusted through a joint staff effort by the City Department of Transportation and SEWRPC to assure the technical adequacy of the plans and the coordination of scheduling to facilitate ease of transfers and efficient manpower use. The new routes and schedules were approved by the Kenosha Transit Commission, the Kenosha Common Council, and the Wisconsin Public Service Commission in July and August of 1975. The new routes and schedules were implemented on August 11, 1975, and have been modified slightly since then in response to transit patron comments.
Experience with the new route and schedule structure thus has been limited. Although initial response has been excellent, it is essential that the new system be rigorously evaluated under the criteria of adopted transit development objectives and standards. If serious deficiencies are identified, immediate modifications will be recommended. For practical purposes, however, severe changes in route configuration cannot be made in the near future without very adverse effects on ridership. Recommendations for future improvement in levels of service will, therefore, be presented in later sections of this report using the recently instituted route system as an accepted base.
REGIONAL TRANSPORTATION AUTHORITY (Illinois -1974)
The establishment of a Regional Transportation Authority (RTA) in northern Illinois may have some direct effects on transit service in the Kenosha urban area. Presently there are nine round-trip commuter trains daily which connect the City of Kenosha with adjacent counties in Illinois and the City of Chicago. As this service is based and operates primarily in the State of Illinois, the plans and policies of the RTA will have considerable influence upon the future status of Kenosha transit service. Currently the RTA is negotiating purchase-of-service agreements with the Chicago and Northwestern Transportation Company (CN&W) to assure continued commuter train service to northern Illinois. In order to provide coordinated interstate transportation service such as the train service to Kenosha, the RTA has the authority to enter into agreements with agencies in Wisconsin. Thus, should the CN&W ever choose to alter service patterns to Kenosha, a public administrative vehicle exists to continue appropriate levels of service. Finally, it should be noted that the Wisconsin Department of Transportation is currently engaged in the conduct of a comprehensive statewide railroad plan. An element of that plan is consideration of rail passenger service, including commuter service.
REGIONAL LAND USE-TRANSPORTATION PLAN REEVALUATION
The Southeastern Wisconsin Regional Planning Commission as part of its continuing regional land use-transportation study is engaged in a major plan reevaluation. Although the study will not be completed until mid-1976, the inventory stage has been finished and will be used in evaluating the Kenosha transit system. The elements of the SEWRPC reinventory conducted in 1972 that are relevant to this study include an interregional bus, rail, and ferry survey; a mass transit user survey; a mass transit nonuser survey; a major traffic generator survey; and a home interview survey. Each of these surveys will be explained in the appropriate inventory chapters of this report.
DEFINITIONS OF MASS TRANSIT
Mass transportation may be defined as the transportation of large groups of people by relatively large, generally publicly or quasi-publicly owned vehicles routed between or along significant concentrations of related trip origins and destinations. As shown in Figure 1, mass transit may be divided into two subcategories: fixed route and nonfixed route. Fixed route mass transit may be defined as transit service provided to the general public or special subgroups of the public by relatively large vehicles operated on regular schedules over prescribed routes. Nonfixed route mass transit may be defined as service provided to the public or to special subgroups on a demand-responsive basis. Currently only fixed route mass transit is available to residents of the Kenosha Planning District. An investigation will be conducted, however, as to the need and desirability of providing the more flexible nonfixed route mass transit service to certain population groups.
8
FLxed route mass transit service may be further subdivided into common carrier service and special carrier service. Within this category, common carrier service may be defined as fixed route, scheduled headway mass transit service to the general public. J\'lost transit service in the Kenosha Planning District is provided by common carriers. Special carrier service may be defined as fixed route mass transit service provided to special subgroups of the public, where ridership eligibility is largely based on membership in a qualified group. The primary example of special carrier service is the traditional yellow school bus service provided to rural school children of the Kenosha Urban Planning District.
As shown in Figure 1, common carrier fixed route mass transportation service may be further subdivided by the geographic area served. The first category-interregional- includes those forms of fixed route mass transportation providing service across regional boundaries to meet external travel demand, such as the railway passenger train or intercity bus service between the Cities of Kenosha and Chicago . The second category-intraregional - providing service with in the Southeastern Wisconsin Region to meet internal travel demand- can be further classified by operating characteristics into primary, secondary, and tertiary levels of service.
The primary level of service facilitates intercommunity travel by connecting major regional activity centers- such as regional commercial, industrial, and recreational centers--to residential communities comprising the Region. The major objective of the primary mass transit service is to provide a network of relatively high speed lines which serve and connect these kinds of centers and residential communities. Primary level mass transit service is characterized as having a very high level of speed and a limited degree of accessibility. No primary level service is currently provided in the Kenosha Urban Planning District. The secondary level of common carrier fixed route service consists of express service operated on arterial streets in mixed traffic or over exclusive lanes on an arterial street. Secondary mass transit service generally can be distinguished from primary mass transit service in that it provides more accessibility at somewhat slower travel speeds. Secondary level service currently provided in the Kenosha Urban Planning District consists of bus connections to the Cities of Racine and Milwaukee. The tertiary level of fixed route common carrier mass transit service consists of local service operated on arterial streets. It is marked by a high degree of accessibility and a relatively low travel speed, The entire local bus system of the City of Kenosha thus would be classified as tertiary service. The primary emphasis of this report will be on the operations of this particular type of mass transportation service.
Fig ure 1
FUNCTIONAL CLASSIFICATION OF MASS TRANSPORTATION SYSTEMS
Source: SEWRPC
9

With this basic framework in mind, it will improve clarity to define a number of transit-related terms which will appear in later sections of this report. These terms include:
1. Rapid Transit Service-Primary mass transit service operated within its own exclusive, fully grade-separated right-ofway at relatively high speeds for a major part of its route.
2. Modified Rapid Transit Service-Primary mass transit service operated with buses at high speed over freeways for a major part of its route or operated with light-rail vehicles at high speed over right-of-way with grade crossings for a major portion of its route.
3. Express Transit Service-Secondary mass transit service operating primarily over arterial streets with limited or no stops for a major part of its route.
4. Local Transit Service-Tertiary mass transit service operating primarily over arterial and collector streets with frequent stops for passenger pick-up and discharge.
5. Demand-Responsive Service-A range of local mass transit services characterized by the flexible routing and scheduling of relatively small vehicles to provide shared-occupancy, door-to-door personalized transportation on demand.
6. Major Trip Generator-Specific land uses or concentrations of such land uses that attract a large number of person trip destinations.
7. Peak Period-The time period of day when transit usage is at a maximum, usually at the beginning and end of normal business hours.
8. Headway-The time interval between two buses traveling the same route.
9. Passenger Revenue-Fares paid by transit passengers traveling aboard transit vehicles operating in regular service; also known as "farebox revenue."
10. Operating Revenue-Revenues derived from provision of transit service including 1) fares paid by transit riders, 2) charter service and special service revenues, 3) other revenues such as sale of advertising space aboard transit vehicles or income from concession retails.
11. Load Factor-The ratio of passengers carried on a mass transit vehicle to the seating capacity of that vehicle.
12. Dead Mileage-The distance traveled by a regularly scheduled transit vehicle during which no revenue passengers are carried, usually the distance a bus travels from the garaging facility to the beginning of a route in the morning and back to the garaging facility at night. Also called nonrevenue mileage.
13. Cycle Schedule-Urban mass transit service operating over routes established so as to require the vehicles serving the system to layover at a common location at the same time thus maximizing the opportunity for transfpTs.
14. Noncycle Schedule-The scheduling of each transit route in a community on an individual basis.
15. Tripper Service-Local mass transit service operated for a limited time and, in some cases, on a special route to serve special community needs. For example, the transit service offered by the Wisconsin Coach Lines, Inc. to serve the Waukesha school system could be classified as a tripper service.
SUMMARY
A complete understanding of adopted regional plans as well as current local plans is essential to the proper conduct of a transit development program planning effort. The regional land use-transportation plan and the comprehensive plan for the Kenosha Planning District as formulated and adopted by the Southeastern Wisconsin Regional Planning Commission and appropriate local units of government serve as a basic framework for the short-term transit development planning process. The transit recommendations of these long-range plans, including reliance upon a flexible, rubber tired transit system for intraurban service and an expanded and coordinated interurban bus network have been further refined by local plans including a technical study and an interim transit development program. In addition, local operations planning recently has resulted in an improved route configuration and schedule, which provide a base system to be examined and refined by this transit development program. Finally, the plans and policies of the northern Illinois RTA in terms of commuter train service to the City of Kenosha must be considered so that appropriate interstate action can be taken to preserve coordinated commuter train service.
10

Chapter III
KENOSHA TRANSIT SERVICE AREA
INTRODUCTION
In order fully to evaluate the present transit situation in the Kenosha urban area, it is necessary to inventory those factors which either affect or are affected by the existing transit system. This inventory must, therefore, include an analysis of both the demand for and the supply of transit services. This chapter will deal primarily with the demand side while analysis of the supply of transit services is the topic of the following chapter.
A proper analysis of the demand for transit service should be based upon pertinent factual data from the study area including a physical description of the area, its land use, population, and economic characteristics. Special transit-dependent population groups and major transit trip generators should be identified and the travel habits and patterns of the study area determined through surveys of travel habits and patterns.
PHYSICAL DESCRIPTION
The study area considered in this report is the Kenosha Urban Planning District as defined by the Southeastern Wisconsin Regional Planning Commission. The area, comprising the eastern portion of Kenosha County, is bounded by IH 94 on the west, Lake Michigan on the east, the Kenosha-Racine County line on the north, and the Wisconsin-Illinois State line on the south. Several special and general purpose units of government operate within the District and have important transportation responsibilities. They include the City of Kenosha, the Town of Pleasant Prairie, the Town of Somers, Kenosha County, and the Kenosha Unified Public School District Number One which serves the entire study area. The location of the civil divisions and of the entire study area within the Southeastern Wisconsin Region is shown on Map 1.
The topography of the study area, formed by glacial action, is characterized by gently rolling hills that present no particular problem for transit operations. The only topographic feature of interest to transit operations is Pike Creek which meanders through the City of Kenosha and discharges into Lake Michigan just north of the central business district. With recent construction, however, a sufficient number of bridges exists so that this feature presents only a minor constraint to efficient transit operations.
Soils within the study area are primarily suited for agricultural uses. There are only minor soil limitations for residential development as long as public sewer service is available. The severest problem regarding soil suitability is industrial development, since much of the area is covered by soils classified as having moderate-to-very severe limitations for such development.
The climate of the study area is semi-humid with moderate rainfall and sunshine. The climatic effects of Lake Michigan are often quite pronounced with large variations in temperature and precipitation between the coastal zone and inland areas. The great variation in temperature from season to season often results in discomfort for the waiting transit patron, a condition which must be considered in plans for the provision of transit shelter facilities, particularly at terminal and transfer points.
Air and water pollution problems in the study area are relatively minor. Prevailing westerly winds prevent any extreme concentrations of air pollutants. Such air pollution problems as do exist, and the more serious surface water quality problems which do exist, are being addressed in other regional planning programs in an integrated manner with the overall, areawide land use-transportation planning program.
LAND USE CHARACTERISTICS
The past land use development of the Kenosha Urban Planning District has been relatively compact and quite similar to the pattern of development found in other urban areas located along Lake Michigan. Early settlement took place near the mouth of Pike Creek which forms an excellent natural harbor. The major commercial area was located just south of the river mouth with industrial development taking place near the harbor and later along railroad rights-of-way traversing the area. Except for the depression years, development has been quite rapid in the Kenosha urbanized area since the turn of the century. Since 1963, for example, urban land use in the District has increased more than 9 percent from about 14,900 to 16,300 acres. This rapid urbanization has been marked by lower overall population densities, a diffusion of both commercial and residential development, and declining use of the downtown shopping district. Industry has tended also to move to outlying areas although not nearly to the degree found in other urban areas of the Region.
11

Map 1
LOCATION OF THE KENOSHA URBAN
PLANNING DISTRICT IN THE
SOUTH EA ST ERN WISCONSIN REGION
STATE OF WISCONSIN
H ~- --H Sr" .. " .., ... >0 r """"" Out
~~l------'-'-----'----r-"c ~~ I .... , .. ". 1.~ .. "
0 ,0 ' lJ !l.> .
l~tl~ 0';:' , -
~
Source: SEWRPC.
12
co

Primary emphasis in this report will be on the developed urban area of the District. It is important to note in this respect that despite rapid urbanization most land in the Kenosha Urban Planning District still is used for agricultural or other open, rural use and that the Towns of Pleasant Prairie and Somers are still largely rural. Table 1 contains a breakdown of land uses within the District, while Map 2 depicts the generalized land uses within the District. Of interest is the large proportion of area devoted to parks and recreation. Once entitled "The City of Parks," Kenosha has recognized the importance ever since completion of its first master plan in 1922 of reserving recreational areas, especially those along the Lake Michigan shoreline.
Present development trends indicate that the most active areas of new urbanization may be expected to be located in the Town of Pleasant Prairie to the south and west of the present intensively urbanized areas of the City of Kenosha. Current forecasts of growth, however, indicate a slower rate of urban land conversion in the District. Although the urban population of the District may be expected to continue to increase, it is anticipated that it will do so only at a moderate rate.
POPULATION CHARACTERISTICS
According to the 1970 census, the popUlation of the Kenosha Planning District was about 98,100. As can be seen in Table 2, this represents a 15 percent increase over the 1960 population level. The 1974 popUlation of the District was estimated at about 103,200, an increase of 5.2 percent over the 1970 level. The greatest relative increase among the civil divisions within the District took place in Pleasant Prairie which, as already noted, is experiencing rapid residential development. The City of Kenosha also experienced a significant population increase although much of it can be attributed to annexations of developing land in the Towns of Somers and Pleasant Prairie.
An important factor affecting the efficiency and cost effectiveness of mass transit service is popUlation density. The overall population density of the Kenosha Planning District is 1,145 persons per square mile. The rural areas of the Planning District consisting of the major portions of the Towns of Somers and Pleasant Prairie have population densities of less than 500 persons per square mile, a density far too low to be supportive of a local mass transit system. The urbanized areas of the Planning District consisting of the City of Kenosha and adjacent areas of continuous urban development in the Towns of Pleasant Prairie and Somers have a popUlation density of slightly more than 4,000 persons per square mile. Map 3 illustrates the 1970 popUlation densities of the Kenosha Urban Planning District.
ECONOMIC CHARACTERISTICS
According to the 1970 census, total employment in the Kenosha Urban Planning District was 37,746. Of this total 30,245, or about 80 percent of the employed, were in the City of Kenosha while the Towns of Pleasant Prairie and Somers accounted for 4,712 and 2,789 employed, respectively. The 1972 employment of the District is estimated at 38,151, or an increase of approximately 2.6 percent over 1970. Table 3 contains a breakdown of total employment by type of industry.
Although agriculture, as indicated earlier, comprises the major land use in the study area, manufacturing is the primary economic activity in the District as evidenced by its near 44 percent share of total employment. Manufacturing became significant in the District about the turn of the century when the Simmons Bedding Company, the Chicago and Rockford Hoisery Company, and the Nash Auto Company began local operations. Although only the latter, now American Motors Corporation, has remained, manufacturing of durable goods in the District has continued to grow primarily through the introduction of a small number of large firms. Presently two American Motors plants alone employ over
Table 1
LAND USES IN THE KENOSHA URBAN PLANNING DISTRICT: 1970
Land Use Acres
Urban Residential Single Family .............. 6,243.35 Two Family ............... 282.49 Multi·Family ............... 96.04 Under Development .......... 1,467.74
Subtotal ................ 8,089.62
Industrial Manufacturing .............. 283.82 Mining ................... 86.46 Wholesale and Other .......... 453.71
Subtotal ................ 823.99
Transportation Streets and Highways ......... 3,300.21 Off-street Parking ............ 344.74 Other. ................... 779.79
Subtotal ................ 4,424.74
Retail and Services ............ 404.33 Governmental and Institutional ... 1,079.58 Communications and Utilities .... 348.53 Park and Recreation ........... 1,116.36
Total Urban Land Use 16,287.15
Rural Agriculture ................. 31,168.53 Open Lands and Water ......... 7,396.70
Total Rural Land Use 38,565.23
Total Land Use 54,852.38
Source: SEWRPC.
Percent
of Total
11.4 0.5 0.2 2.7
14.7
0.5 0.2 0.8 1.5
6.0 0.6 1.4 8.1
0.7 2.0 0.6 2.0
29.7
56.8 13.5 70.3
100.0
13
CJ
Ell -
Map 2
GENERALIZED EXISTING LAND USE IN THE
KENOSHA URBAN PLANNING DISTRICT, 1970
LEGE ND
cOw ~'Y "u""~,,~~ <0 •• >~ ...... ~Ct<1 ~.~ ... f AU '''''''''~L ~c.n
• .... .IOft ~("L _0 3'~~.a
• • .... .... ..,..-.'COU.DOOto ~.~·U'_ .,,~ t
, ,
,"-,--,--_. Source: SEWRPG.
Map 3
POPULATION DENSITY IN THE
KENOSHA URBAN PLANNING DISTRICT, 1970
+
~ I .,
.; \, i i
C\ '\ --' ~
l LEG£ND
I'El'IlIQtf5 PUO .5QVo>"": .......:
_ '0..000 "" UO)oOf:
CJ CJ D
Source: SEWRPC.
t
\. " r
/ ,/ L .
): t ,0. , ....... , "".'.~"-".~''''A~_=_"-,
~-<? "... --
30 percent of the District labor force while the seven largest firms, all but one engaged in the manufacture of durable goods, account for some 50 percent of total District employment. A more detailed accounting of these and other major employers will be presented in the discussion of the major trip generators in the Kenosha Urban Planning District.
The influence of the dominant industry of the District, durable goods manufacturing, also is evidenced by the occupational distribution of the employed labor force . As can be seen on Table 4, blue collar workers, consisting of craftsmen, foremen, operatives, and laborers, constitute almost 44 percent of the total labor force, considerably higher than the regional or national average . It is important to note, however, that this percentage has decreased in recent years and that the character of the labor force in Kenosha may change with the fortunes of the automobile industry.
IDENTIFICATION OF SPECIAL POPULATION GROUPS
There are certain segments of the population whose dependence on pnd, therefore, use of mass transit are greater than that of the population as a whole. These groups usually are unable to use the normally preferred mode, the automobile. Accordingly, they must rely on public transportation for mobility. Because mobility has become an established American

Table 2
POPULATION OF THE KENOSHA PLANNING DISTRICT BY CIVIL DIVISION: 1960,1970, and 1974
Population Percentage Change
Civil Division 1960 Census 1970 Census 1974 Estimatea 1960·1970 1970·1974
City of Kenosha ........... 67,899 78,805 82,839 16.1 5.1 Town of Pleasant Prairie ...... 10,287 12,019 12,810 16.8 6.6 Town of Somers ........... 7,139 7,270 7,567 1.8 4.1
Kenosha Urban Planning District 85,325 98,094 103,216 15.0 5.2
a Population level based on Wisconsin Department of Administration estimates.
Source: U. S. Bureau of Census, Wisconsin Department of Administration, and SEWRPC.
Table 3
EMPLOYMENT BY INDUSTRY GROUP IN THE KENOSHA URBAN PLANNING DISTRICT: 1970
Percent
Table 4
EMPLOYMENT BY OCCUPATION IN THE KENOSHA URBAN PLANNING DISTRICT: 1970
Percent
Industry Group Employment of Total Occupation Employment of Total
Construction ..................... . 1,419 3.8 Professional, Technical, and Kindred Workers. 5,000 13.2
Manufacturing .................... . 16,574 43.9 Managers and Administrators, except Farm. 2,464 6.5
Transportation ................... . 939 2.5 Sales Workers .. . . .. 2,089 5.5
Communications, Utilities, and Sanitary Services. 658 1.7 Clerical and Kindred Workers. .. 5,995 15.9
Wholesale Trade ................... . 849 2.2 Craftsmen, Foremen, and Kindred Workers. 5,807 15.4
Retail Trade ..................... . 6,385 16.9 Operatives, except Transport .. 7,863 20.8
Finance, Insurance, and Real Estate ....... . 862 2.3 Transport Equipment Operatives. 1,402 3.7
Business and Repair Services ............ . 559 1.5 Laborers, except Farm. · . . . .. 1,534 4.1
Personal Services .................. . 922 2.5 Service Workers. . . · . .. 5,112 13.6
Health Services ................... . 2,444 6.5 Farm Workers. . . · . 257 0.7
Educational Services ................ . 3,014 8.0 Private Household Workers . . .. 223 0.6
985 2.6 1,528 4.0
Other Professional and Related Services ..... . Public Administration ............... .
16 Years and Over 37,746 100.0
Other Industries ................... . 608 1.6
16 Years and Over 37,746 100.0 Source: U. S. Bureau of Census and SEWRPC.
Source: U. S. Bureau of Census and SEWRPC.
value, special consideration must be given to these groups in the transit planning effort. These groups include school children, the elderly, low income families, minorities, the handicapped, and those who cannot or do not have access to automobile transportation.
School Children School age children in the 10 to 19 year age group comprise about 20 percent of the Kenosha Planning District population. Table 5 contains a breakdown by census tract of this and all other special popUlation groups. As expected, with the excep· tion of tract two, there are no significant (at least 25 percent) concentrations of school age children in any census tract. Therefore, it is not useful to look at residential concentrations but rather at the destinations of the home to school transit trip, that is, the junior and senior high schools and the universities and colleges. This analysis will be made in later sections concerning major trip generators in the Planning District.
The Elderly In the Kenosha Planning District there are, according to the 1970 census, 9,131 individuals who are 65 years of age or older, representing over 9 percent of the total District population. As can be seen in Table 5, there are certain census tracts which contain relatively high concentrations of the elderly including tracts 10, 11, 17, and 19. These high priority tracts, which contain concentrations of 13 percent or more, are graphically summarized on Map 4. Also identified are
15

Table 5
SELECTED CHARACTERISTICS FOR THE KENOSHA URBAN PLANNING DISTRICT BY CENSUS TRACTS: 1970
Tract Tract Number Population
1 2,392 2 983 3 4,343 4 4,757 5 4,716 6 4,888 7 3,670 8 3,054 9 5,153
10 1,623 11 4,410 12 5,084 13 3,684 14 5,584 15 4,895 16 4,399 17 3,258 18 3,018 19 3,164 20 2,914 21 4,088 22 4,702 23 4,807 24 3,122 25 1,250 26 4,136
Total 98,094
a Ages 10-19 inclusive_
b Ages 65 and over.
School Childrena
Number Percent
390 16.3 463 47.1 763 17.6
1,049 22.1 1,039 22.0 1,004 20.5
674 18.4 601 19.7 855 16.6 235 14.5 745 16.9 859 16.9 722 19.6
1,221 21.9 970 19.8 802 18.2 618 19.0 564 18.7 598 18.9 565 19.4 942 23.0 918 19.5
1,070 22.3 700 22.4 253 20.2 954 23.1
19,574 20.0
c Family of four, income below $3.743.
Elderlyb Low Incomec
Number Percent Numberd Percent
180 7.5 160 6.7 3 0.3 11 1.1
532 12.2 710 16.3 372 7.8 138 2.9 160 3.4 135 2.9 569 11.6 271 5.5 160 4.4 203 5.5 315 10.3 263 8.6 558 10.8 601 11.7 265 16.3 391 24.1 604 13.7 787 17.8 616 21.1 466 9.2 191 5.2 159 4.3 321 5.7 342 6.1 592 12.1 368 7.5 500 11.4 577 13.1 502 15.4 107 3.3 391 13.0 401 13.3 505 16.0 253 8.0 129 4.4 111 3.8 240 5.9 178 4.4 600 12.8 155 3.3 356 7.4 132 2.7 225 7.2 113 3.6 67 5.4 7 0.6
178 4.3 260 6.3
9,131 9.3 7,299 7.4
Number of Occupied Housing
Units with No Minoritye
Occupied Auto Ownership
Housing Number Percent Units Number Percent
4 0.2 745 18 2.4 32 3.3 .. -- --88 2.0 1,469 350 23.8
6 0.1 1,407 116 8.2 21 0.4 1,181 30 2.5 11 0.2 1,267 42 3.3
473 12.9 1,128 69 6.1 210 6.9 960 117 12.2 112 2.2 1,721 438 60.7 219 13.5 712 321 45.1 82 1.9 1,569 384 24.5 67 1.3 1,752 317 18.1 13 0.4 1,073 35 3.3 13 0.2 1,564 44 2.8 35 0.7 1,541 216 14.0
655 14.9 1,461 420 28.7 11 0.3 1,045 105 10.0 75 2.5 989 175 17.7
7 0.2 1,087 130 12.0 7 0.2 830 55 6.6
26 0.6 1,073 64 6.0 11 0.2 1,500 120 8.0 35 0.7 1,252 45 3.6
9 0.3 946 64 6.8 4 0.3 313 -- --
23 0.6 1,067 28 2.6
2,249 2.3 29,652 3,703 12.5
d Excludes inmates of institutions, members of Armed Forces living in barracks, col/ege students in dormitories, and unrelated individuals under 14 years.
eNonwhite.
Source: U. S. Bureau of Census and SEWRPC.
Tract Number
1 2 3 4 5 6 7 8 9
10 11 12 13 14 15 16 17 18 19 20 21 22 23 24 25 26
Total
tracts of medium concentrations of the elderly as well as those with less than average concentrations. Although not indicated by 1970 census data, there is presently an elderly housing development called Saxony Manor located in census tract five, As one of the large concentrations of elderly housing, this area will also be considered in plans for transit route configuration.
Although census information provides a general indication of residential location, it was considered necessary, with regard to the elderly, to further determine the demand for transit service. To this purpose Table 6 and Map 4 are provided to indicate facilities for the elderly in the Kenosha Planning District. These facilities include elderly housing developments, nursing homes, and elderly activity centers. In this manner not only are the residential concentrations identified but also those places frequently used by the elderly for care and recreational purposes.
Low Income Families By federal definition a non-farm family of four was considered below the poverty level if total income was $3,743 or less. According to the 1970 census, 7,299 individuals, or approximately 7.4 percent of the total District population, were in this category. It is evident from Table 5 that there are extreme concentrations of low income individuals in census tracts 3, 10, 11,16, and 18_ Map 5 graphically summarizes these high priority as well as medium priority census tracts.
16

Table 6
FACILITIES FOR THE ELDERLY IN THE KENOSHA URBAN PLANNING DISTRICT: 1975
Code Number a Facility Addressb
1 Brookside County Home 3418 Washington Road 2 Kenosha Senior Citizens Center 2717 67th Street 3 Midway Manor Nursing Home 1519 60th Street 4 Saxony Manor Apartments 1876 22nd Avenue 5 Shady Lawn Nursing Home 1 703 60th Street 6 Shady Lawn East 920 61 st Street 7 Sheridan Nursing Home 8400 Sheridan Road 8 St. Joseph's Home 9244 29th Avenue
9 St. Mary's Community Center 7400 39th Avenue 10 St. Matthew's Community Center 5900 7th Avenue 11 Washington Manor Nursing Home 3100 Washington Road
12 Woodstock Center 3415 Sheridan Road
a See Map 4.
b Except where noted, the addresses refer to the City of Kenosha.
Source: Kenosha Transit Commission.
Minorities For the purposes of this study, a minority individual was defined as belonging to a racial group other than Caucasian. Although only slightly over 2 percent of the District population, or 2,249 individuals, are considered minorities, there are concentrations of minorities in census tracts 7, 8, 10, and 16. Table 5 and Map 6 indicate the relative concentrations and locate transit service priority areas.
The Handicapped The Wisconsin Department of Health and Social Services, Division of Vocational Rehabilitation, reports that it has 272 clients who are disabled and in need of transportation in the Kenosha Planning District. Wisconsin Statutes Section 55.01(13) prohibits the release of names or addresses of these clients and thus the geographic concen-
Table 7
FACILITIES FOR THE HANDICAPPED IN THE KENOSHA URBAN PLANNING DISTRICT: 1975
Code Number a Facility Address b
Curative Workshops 1 Kenosha Ach ievement Center 1 1218 79th Street
2 Kenosha Achievement Center 3 4709 Green Bay Road
3 Kenosha Achievement Center 4 21 22 56th Street
Nursing Homes 4 Dayton Hotel 521 59th Street
5 Lamplighters 5905 19th Avenue 6 Midway Manor 1519 60th Street 7 Mueller's Homestead 6024 18th Avenue
8 Shady Lawn 1703 60th Street
9 Shady Lawn East 92061 st Street 10 Sheridan Nursing Home 8400 Sheridan Road 11 St. Joseph's Home 9244 29th Avenue
PI easa nt Pra i r ie 12 Washington Manor 3100 Washington Road 13 Woodstock Kenosha Health Center 3415 Sheridan Road
Schools with Special Educationc
14 Berryville 704 Sheridan Road Somers
15 Columbus 6410 25th Avenue 16 Durkee 839 62nd Street 17 Jefferson Annex 180841 st Place 18 McKinley 5520 32nd Avenue 19 Pleasant Prairie 9208 Wilmot Road
Pleasant Prairie 20 Sunnyside 7714 20th Avenue 21 Jane Vernon 8518 22nd Avenue
a See Map 7.
b Except where noted, the addresses refer to the City of Kenosha.
c All junior and senior high schools have special facilities.
Source: Kenosha Transit Commission and SEWRPC.
trations of the handicapped could not be ascertained. It is possible, however, to identify the locations used by the handicapped for residential, care, or educational purposes. The locations include curative workshops, nursing homes, which are also utilized by the elderly, and schools with special education facilities. Table 7 contains a listing of such facilities along with their locations and corresponding number on Map 7.
Automobile Ownership One of the most reliable indicators of transit use and need is the availability of an automobile. According to the 1970 census, there were 29,652 occupied housing units within the Planning District of which 3,703, or 12.5 percent, had no automobile. Table 5 and Map 8 indicate the highest concentration of such households located in census tracts 9,10, and 16.
High Priority Transit Service Areas The preceding sections have identified the residential concentrations of those groups that depend most heavily on transit service. With this information it is possible to identify those census tracts which, because of their resident population characteristics, should be considered high priority transit service areas. These high priority areas, including census tracts 3,8,9, 10, 11, 12, 16, and 18, are graphically summarized on Map 9. The four categories considered in this analysis were the concentrations of elderly, low income, minorities, and households without automobiles. The census tracts defined as high priority either contained high concentrations in at least one category and medium concentrations in two others or medium concentrations in all four categories. Because of the indeterminable overlap which exists among these four categories, it was not feasible to carry the analysis to any greater detail. It should be noted, however, that this determination of high priority areas is only one of many criteria influencing the transit development planning process.
17

Map4
CONCENTRATION OF THE ELDERLY AND LOCATION OF FACILITIES FOR THE ELDERLY IN THE KENOSHA URBAN PLANNING DISTRICT
L.E GEND
.' '.""-"'" m .. ' ................ ,., 100:, , ... t ..
.... ItC.l .. r '" a:~s\JS Tflot.CT I"OO'Ul-"'TO;)N & Tt:AAS or A<:;I: Ate OU'!" ""'0 CJ "0_ ,~
CJ .0-<29
CJ o - '"
Source: U. S. Bureau of Census and SEWRPC.
MAJOR TRIP GENERATORS
t .....::l.::..-. ....-.
Map5
CONCENTRATION OF LOW INCOME GROUPS IN THE KENOSHA URBAN PLANNING DISTRICT
BY CENSUS TRACT' 1970
".l"CE"T o~ ~.P;"8 US r .. ACT POPULU ' ON ~~LOw ~OV.P;"T'r L.P;vtL
o ,.0 _ 200
Source: U. S. Bureau of Census and SEWRPC.
r , ....,- -"'l' ry
The preceding sections have dealt primarily with the origins, that is, the residences of potential transit users, The possible destinations of such users must also be considered. These destinations are comrnonly referred to as major trip generators. For Lhe purposes of Lhis study five categories of land use were identified as major trip generators: employment centers; shopping areas ; educational institutions; public and medical insLitutions; and recreational areas,
Employment. Centers The trip from home to work and back constitutes a significant proportion of all person trips in the Kenosha Planning District. It. is, therefore, appropriat..e 1..0 begin the analysis of trip generators with the identification of major employment centers. As noted earlier, the economy of the District is large·firm oriented, The identification of the several largest emploY8fs will thus cover the vast majority of employment opportunities within the District. Table 8 contains such a listing while corresponding r..'1ap 10 shows the location of these major employers .
18
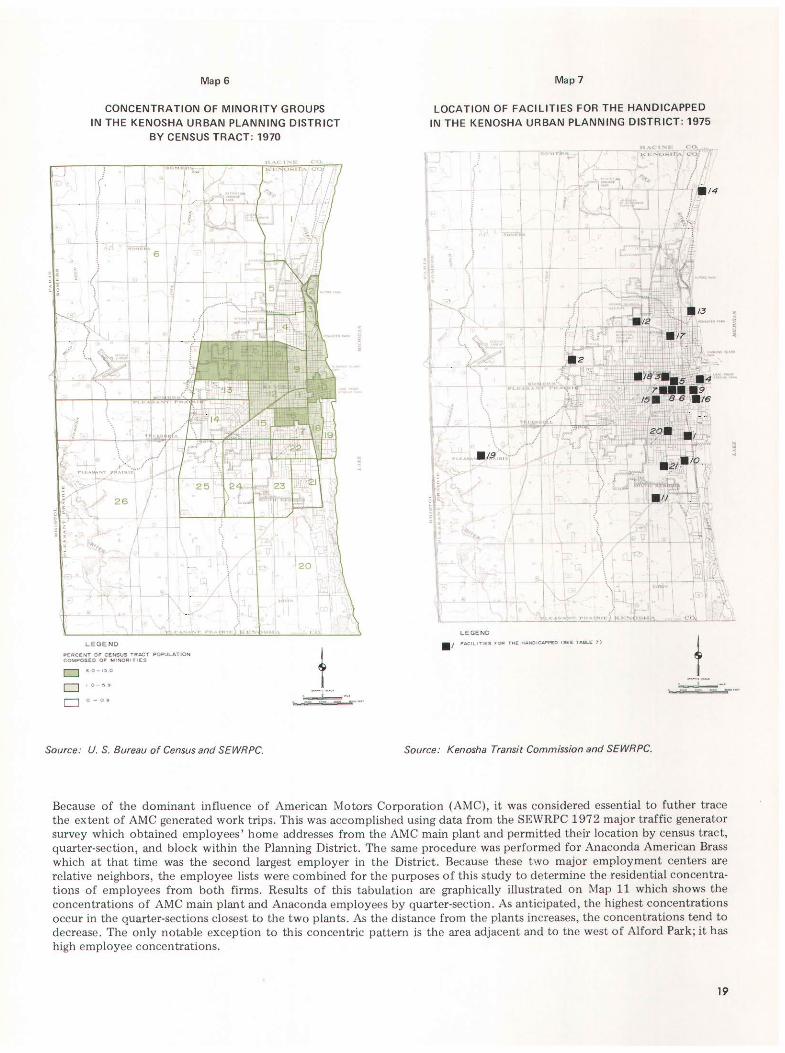
Map 6
CONCENTRATION OF MINORITY GROUPS IN THE KENOSHA URBAN PLANNING OISTRICT
BY CENSUS TRACT: 1970
1 ) , -,,'
! ,.' .I
\.'\
f
, -, , i ~
i
•
LEGE NO
f
I
, -k
I . \o~ I i I
\, .'.!t
25 .2 4
\
,,€ACU. T 0" CI:N5 \1S - . 00(:1 ~TIOf< eO-O$~O ~ .. , _ " 1: :1
CJ CJ CJ
, ,.
Source: U. S. Bureau of Census and SEWRPC.
... ".. tI .
23
.)
'2,
20
t ....:::.:.:... •. - ·,. ·m ... -
I
Map 7
LOCATION OF FACILITIES FOR THE HANOICAPPEO
IN THE K ENOSHA URBAN PLANNING OISTRICT : 1975
I ~ ... 1
f
.. ,'L
,.
/ .. ,/ .,
\
L EG ENO
'"47' S7 - r -
Source: Kenosha Transit Commission and SEWRPC.
Because of the dominant influence of American Motors Corporation (Al\'IC), it was considered essential to futher trace the extent of AMC generated work trips. This was accomplished using data from the SEWRPC 1972 major traffic generator survey which obtained employees' home addresses from the AMC main plant and permitted t.heir location by census tract, quart.er-section, and block with in the Planning District. The same procedure was performed for Anaconda American Brass which at that time was the second largest employer in the District. Because these two major employment. centers are relative neighbors, the employee lists were combined fo r the purposes of this study to determine the residential concentrations of employees from both firms. Results of this tabulation are graphically illustrated on tvlap 11 which sho ws the concent.rat. ions of A~'IC main plant and Anaconda employees by quarter-section. As anticipated, the highest concentrations occur in the quarter-sections closest to the two p lants. As the distance from the plants increases, the concentrations tend to decrease. The only notable exception to this concentric pattern is the area adjacent. and to t l1e west of Alford Park ; it has high employee concentrations.
19

MapS
CONCENTRATION OF OCCUPIED HOUSING UNITS WITH NO AUTO OWNERSHIP
IN THE KENOSHA URBAN PLANNING DISTRICT BY CENSUS TRACT: 1970
., .'
{.
o
i
l -4~ >1/("f' ~ , .... ~"' ", ... ".. 11 ' ,.\ .. r" + ~..,..~ 26 I
;r: 'Ii:'"
~ j....-
25
f
,
_ l ! I ; .~ }-l L-_.+:. -+--'f'.J
"" '"'' i, , ! I " f
'H \, 1 - - 1 - \~ ,J;...
.> " " .... ' ~ ..... "'~) ,",'''''' , .. ,"
L.EGEN O
~["ct"T 01'" C~U5 n.,ocT OCCU~ltD " OVS'''<1 UNO U WI T"DuT "H AU T DMODIl. E:
CJ o o
" <>- ~ . ,
Source: U. S. Bureau of Census and SEWRPC.
}
h
\. , 20,
I
Map9
HIGH PRIORITY TRANSIT SERVICE AREAS IN THE KENOSHA URBAN PLANNING DISTRICT
BY CENSUS TRACT : 1970
..' I ~ t rr'i
I i I4.J ;
·..16 I~ t - ..... ~
J
<' + -r-- +-I
r-~~-+.-- ~~,~~~~~~~~~
I- ~···· , . ~../)"'/ I ~ .. .... ~ , ..... 'H'.
I-~ ,
26 / 1 r
( I
t i )
, ... '''',. .. " .... , .. < " ...... , .. ~, ...
Source: U. S. Bureau of Census and SEWRPC.
The City of Kenosha also conducted an employee survey in mid-1974, although one smaller in scope than the SEWRPC survey . Aimed exclusively at industrial workers, this origin-ciestination survey was based on employee locations by aldermanic districts. Of major significance was the finding that there are heavy concentrations of workers living in the southern part of the City who work on the north end at McWhyte, Eaton, and Peter Pirsch. These and other relevant inventory findings will be given proper considerat ion in later sections dealing with route and schedule design.
Shopping Areas The trip from home to shopping and back is another major component of total travel demand. This type of travel is particularly suited for transit since shopping trips are expected to maintain cost effective passenger volumes during the non peak hours.
20
. ,

TableS
MAJOR EMPLOYMENT CENTERS IN THE KENOSHA URBAN PLANNING DISTRICT: 1975
Code Numbera
1 2 3 4 5 6 7 8
9 10 11 12 13
14 15 16 17 18 19 20
21 22 23
a See Map 10.
Employer
Industrial American Motors ................ . American Motors ................ . Anaconda American Brass .......... . Arneson Foundry ............... . Eaton, Inc ..................... . Frost Company ................. . Jockey International ............. . Ladish Co.-Tri-Clover Division ....... .
Leblanc Corporation ............. . MacWhyte Wire Rope Company ...... . Ocean Spray ................... . Peter Pirsch and Son ............. . Snap-On Tools ................. .
Retail and Service First National Bank .............. . Kenosha Memorial Hospital ......... . Kenosha News Publishing .......... . K-Mart Store .................. . Montgomery Ward and Company ..... . St. Catherine's Hospital ........... . Sears, Roebuck and Company ....... .
Educational Carthage College ................ . Gateway Technical Institute ........ . University of Wisconsin-Parkside ..... .
b Except where noted, the addresses refer to the City of Kenosha.
Source: Kenosha Manufacturer's and Employer's Association and SEWRPC.
Approximate Addressb 1975 Employment
5626 25th Avenue 8,900 5525 5th Avenue 3,100 1420 63rd Street 850 3303 66th Street 125 3307 14th Avenue 750 6523 14th Avenue 200 2300 60th Street 500 9201 Wilmot Road 700 Pleasant Prairie 701930th Avenue 185 2906 14th Avenue 520 7800 60th Avenue 130 1308 35th Street 100 2801 80th Street 1,000
5522 6th Avenue 150 6308 8th Avenue 1,030 715 58th Street 130
4100 52nd Street 300 3600 52nd Street 210 3556 7th Avenue BOO 7630 Pershing Boulevard 270
2001 Alford Drive 600 3520 30th Avenue 250 Wood Road 550 Somers
Two classes of shopping areas are of concern in this study_The first category is shopping centers which are characterized by the presence of at least one major department store and numerous small service and specialty shops. Because of the large land requirements, shopping centers usually are located in the outlying areas and parking is almost always plentifuL
The second category is major strip commercial areas which are characterized by heavy commercial development of mixed retail and service uses along a major traffic artery. These areas are usually in intensively developed urban sections such as central business districts. Usually there is limited parking, making these areas prime target for transit service.
Both types of shopping areas are listed in Table 9 and their locations plotted on corresponding Map 12. If large enough, these areas not only attract shopping trips but are major employers as well.
Educational Institutions The trip from home to school and back presently constitutes the plurality of transit trips in the Kenosha Planning District. The major generators for this trip include junior and senior high schools, colleges, universities, and technical schools. Table 10 lists these major generators and their current enrollments while corresponding Map 13 graphically illustrates their locations and the junior and senior high school service area boundaries_ Elementary schools were not included as major generators since most of their students live in the surrounding neighborhood and walk to schooL
21

Map 10
LOCATION OF MAJOR EMPLOYMENT CENTERS IN THE KENOSHA URBAN PLANNING DISTRICT: 1975
; )
•
I...EGEND
\
,;;j;
1
rt I ,
, ,
I ~.. \ t ".,,'
,.2...~.! .. '::.;' ... ::: __ ! .. !! .. ::~~.L.!, ' ... (' .. '''~ ~,"
Source: Kenosha Manufacturer's and Employer's Association and SEWRPC.
Map 11
OISTRIBUTION OF AMERICAN MOTORS CORPORATION ANO ANACONOA AMERICAN BRASS EMPLOYEES
IN THE KENOSHA URBAN PLANNING DISTRICT BY U. S. PUBLIC LAND SURVEY OUARTER SECTION: 1972
-,
r ,,~
(' t
\. > . .. LO ....... ~ .... ",. j\
• 'I
I
LEGEND
E MI't..OYE~ 1'£1> QUARTER KC T IOft
_ ~<>OOlt>O()""
C!] <&0 ... "
D <.~ •• , ~ ....... o
Source: SEWRPC.
" +
In addition to determining the locations of these educational institutions it was deemed desirable in some cases to locate the origins of the home to school trips. As such, student address lists are prepared annually by Unified School District Number One for junior and senior high schools .. Also, as part of a concurrent transportation study, the University of Wisconsin-Parkside collected and mapped the location of their students and faculty. by aldermanic district.
22

Table 9
MAJOR SHOPPING AREAS IN THE KENOSHA URBAN PLANNING DISTRICT: 1975
Code Numbera Shopping Area Location or Limits
1 K-Mart Store 52nd Street and 41st Avenue 2 Montgomery Ward Store 52nd Street and 36th Avenue 3 Pershing Plaza 75th Street and Pershing Boulevard 4 Town and Country Shopping Center 4623 75th Street 5 Villa Capri Shopping Center 212 21 st Street 6 Welles Shopping Center 5914 75th Street 7 Downtown Business District 6th Avenue between 55th Avenue
and 59th Avenue 8 Midtown Shopping District 52nd Street between 19th Avenue
and 23rd Avenue 9 Roosevelt Road Shopping District Between 30th Avenue and 39th Avenue
10 South Sheridan Road Shopping District Between 75th Street and 80th Street 11 Uptown Business District 22nd Avenue between 61st Street
and Roosevelt Road
aSeeMap 12_
Source_' Kenosha Transit Commission and SEWRPC_
Table 10
EDUCATIONAL INSTITUTIONS IN THE KENOSHA URBAN PLANNING DISTRICT: 1975
Code Numbera Educational Institutions
Colleges and Technical Schools 1 Carthage College 2 Gateway Technical Institute 3 University of Wisconsin-Parkside
Public High Schools 4 Bradford High School 5 Reuther Alternate High School 6 Tremper High School
Public Junior High Schools 7 Bullen Junior High 8 Lance Junior High 9 Lincoln Junior High
10 McKinley Junior High 11 Washington Junior High
Major Parochial Schools 12 Holy Rosary 13 Our Lady of Mt. Carmel 14 St. George 15 St. Joseph High School 16 St. Mark's 17 St. Mary's
a See Map 13.
bExcept where noted, addresses refer to the City of Kenosha.
Source: Unified School District Number One and SEWRPC.
Addressb Approximate
1975 Enrollment
2001 Alford Drive 1,300 3520 30th Avenue 2,200 Wood Road 5,400 Somers
913 57th Street 1,940 3700 Washington Road 630 8560 26th Avenue 2,470
2804 39th Avenue 1,040 4515 80th Street 1,300 6729 18th Avenue 980 5710 32nd Avenue 900 811 Washington Road 1,040
4400 22nd Avenue 280 5400 19th Avenue 320 712 49th Street 290 2401 69th Street 700 7207 14th Avenue 500 7400 39th Avenue 510
23

\
I ,
Map 12
LOCATION OF MAJOR SHOPPING AREAS
IN THE KENOSHA URBAN PLANNING DISTRICT: 1975
I \~
/ \
)
( ..,
LEGE NO
~. 0\-
I
I "
I
, ,
. '-,",,-,"-,'<.'.'" ,="' iF'
llA,C , .... ,
"'- ' .",, " 11 '. '0
<:'1 I
t.
-'~"~'~
Source: Kenosha Transit Commission and SEWRPC.
Public and Medical Institutions
Map 13
LOCATION OF EDUCATIONAL INSTITUTIONS IN THE KENOSHA URBAN PLANNING OISTRICT: 1975
LE GE ND
~-'? ...... .. --="' "'.
Source: Unified Schoof District Number One and SEWRPC.
Public buildings and medical centers generate an important type, if not a large quantity, of person trips. Included in this category of major lrip generators are hospitals, city, town and county governmental buildings, post offices, libraries, and museums. Table 11 contains a listing of these generators and corresponding Map 14 shows their locations. As can be seen, most of these institutions, especially governmental buildings, are located in or near the central business district and are thus easily accommodated by transit service.
Recreational Areas As noted earlier, the Kenosha Planning District has an abundance of park and recreational facilities. This last category of major trip generators is somewhat unique in that most recreational trips occur on weekends. Because recreational areas often are scattered through sparsely populated areas and because recreation often is sought by family units, the recreational trip is an unlike ly lransit prospect. Nevertheless, limited transit &.ccessiblity must be maintained for those with no alternative means of trav~l.
24

Table 12 and accompanying Map 15 indicate the major recreational areas. Because of the great number of parks and recreational facilities, it was necessary arbitrarily to limit the number which would be considered. Therefore, recreational areas listed are those which are greater than ten acres in size and which have the potential for attracting a relatively large number of people.
TRAVEL HABITS AND PATTERNS
Code Number a
1 2
3 4 5 6 7
8
Table 11
PUBLIC AND MEDICAL INSTITUTIONS IN THE KENOSHA URBAN PLANNING DISTRICT: 1975
Institution Addressb
Hospitals Kenosha Memorial 6308 8th Avenue St. Catherine'S 3556 7th Avenue
City of Kenosha G. M. Simmons Main Library 711 59th Place Municipal Office Building 625 52nd Street Pol ice Department 812 56th Street Public Museum 5608 10th Avenue U. S. Post Office 5605 Sheridan Road
Kenosha County and Towns of Somers and Pleasant Prairie
Agricultural Office 714 52nd Street
Up to this point the analysis of the demand for transit has consisted of an identification of transit-dependent population groups and major trip generators. In other words, the study has determined where potential transit riders are and where they are likely to want to go. The analysis is not complete, however, until the connection is made; that is, until origins are properly paired with destinations. To accomplish this it is necessary to examine empirical data which actually describe the existing travel habits and patterns within the Planning District. 9 Comprehensive Board-Mental Health 3700 Washington Road
As noted earlier, the Southeastern Wisconsin Regional Planning Commission in 1972 conducted a major inventory of travel within the Region. An important part of this inventory was the home interview survey to determine the character of intraregional travel on an average weekday. A representative and statistically valid sample of people was provided in advance with trip logs and personally interviewed the day after the prescribed travel
10 Courthouse 912 56th Street 11 Highway Department 5512 60th Street 12 Sheriffs Department 911 55th Street
13 Town of Pleasant Prairie Town Hall 9915 39th Avenue Pleasant Prairie
14 Town of Somers Town Hall County Trunk E Somers
aSeeMap 14.
b Except where noted, addresses refer to the City of Kenosha_
Source: Kenosha Transit Commission and SEWRPC.
Table 12
Code Numbera
1 2 3 4
5 6 7
8 9
10 11 12 13
14 15 16 17 18 19
aSee Map 15_
Source: SEWRPC_
MAJOR RECREATIONAL AREAS IN THE KENOSHA URBAN PLANNING DISTRICT: 1975
Approximate Major Recreational Area Civil Division Acreage
Public Facilities Alford Park City of Kenosha 87 Eichelman Park City of Kenosha 10 James Anderson Park City of Kenosha 96 J_ F. Kennedy Park City of Kenosha 24 Lake Front Stadium Park City of Kenosha 16 Li ncol n Park City of Kenosha 44 Pennoyer Park City of Kenosha 24 Petrifying Springs Park Town of Somers 353 Prairie Lane Heights Park Town of Pleasant Prairie 10 Simmons Island Park City of Kenosha 42 Southport Park City of Kenosha 24 Washington Municipal Golf Course City of Kenosha 69 Washington Park City of Kenosha 30
Private Facilities Girl Scout Camp Town of Somers 10 Hawthorn Hollow Town of Somers 38 Kenosha Country Club Town of Somers 160 Maplecrest Country Club Town of Somers 165 Pheasant Valley Hunting Club Town of Pleasant Prairie 391 Trident Marina Town of Pleasant Prairie 25
25

Map 14
LOCA TlON OF PUBLIC AND MEDICAL INSTITUTIONS IN THE KENOSHA URBAN PLANNING DISTRICT, 1975
r
i i
\ (
>
.......
) \.
L EGE ND
T
- ,.J • • 14
Source: Kenosha Transit Commission and SEWRPC.
~
...
..
~-. ==. - ........
Map 15
LOCATION OF MAJOR RECREATIONAL AREAS IN THE KENOSHA URBAN PLANNING DISTRICT, 1975
.. ... : !
i
L
I , < ? ,
.. \.
A/
, > ,
' ... J A/B
I
L EG E ND
Source: SEWRPC.
1 • .14 " ."
A/6
t '1i..12 1i..4 /3A
'1: 1i..10
Ii.ljQ.l I . ~ 5'A
_'-T " A2
A6 I·: .1.
, •
\
day . Prom the completed trip log and the personal interview information was collected on all trips made on the prescribed travel day including; trip origin and destination; trip purpose; land use at origin and destination; mode of travel; auto availability; and parking information for auto trips. Results were then assigned to 1,220 regional traffic analysis zones, and appropriate factors were applied to expand the sample to represent total trips originating [rom each analysis zone. To insure accuracy and completeness of origin-destination data and subsequent calculations, screenline surveys were conducted to provide actual traffic counts along major arterials. These vehicular volumes were then compared with the volumes derived from the sample data, and adjustments were made as necessary.
Although the survey documented travel habits and patterns for the entire Region, for the purposes of this study only those trips which could conceivably be made via the Kenosha local bus system are explicitly considered . Therefore, to accommodate local transit system design and evaluation, the following analysis is confined to travel between those zones within an effective urban transit service area, consisting of the 86 traffic analysis zones in or adjacent to the City of Kenosha. Travel outside this service area or intrazonal travel was not considered as it would not be served by the local bus system within the next five years . The 86 zones comprising the effective urban transit service area are shown on Maps 16 and 17.
26

, c
Map 16
TOTAL PERSON TRIP ATTRACTIONS IN THE KENOSHA
EFFECTIVE URBAN TRANSIT SERVICE AREA, 1972
'. h ·
I
)
...... .. '. '-- I .'
0 - t ...... {'" , ! ( ...-
( ! I , ,
,
r \i. ~ ..
,.. I l
I L ,f' l
,.
". ,J' , .•
f \
1 ' j
~
"'" r
{ '.
. I..EGEND
P[R:SON HIP ATT RACT ION9 ~" ." IY TRAF~ IC ANALYSIS 20NE
0 ~,OtlC 0 ",nO<)
0 .O~ - ... n f
0
Map 17
TOTAL PERSON TRIP PRODUCTIONS IN THE KENOSHA EFFECTIVE URBAN TRANSIT SERVICE AREA, 1972
,
,
0 ,
"- .. >
, ...,.
. I
/~
n""· ~, .• I; ~ ,
~
I
LEGEND
P[R9ON TRII' ~ODl>C" ONS pER DAY . ~ ,RAFFIC ~N"L~aIS Z aN f
',0<>0 _ .,.000
< ,
n , I
"-'
~
• \
'n -" 1 . " \:-' " ,
,
\ .
•
f
..
~-
-
.
•
0 ,.~
...:.::c... .. r d1 n .......
o o o o
>. 000 _ "'"~ m = .,..-0 LUI '~.N ',000
."UNDAn '" .~.~~ .. v~ ..... N 'UN'" I( R"lCl ."".
Source: SEWRPC.
LU~ ,~ ... J,OOO
.. :>vt<I).o.~. or .... c To Y .... eA~ TUN!" ...,.~,CI' uu
Source: SEWRPC.
As noted earlier, the home interview survey provides two basic cagegories of travel inventory data: trip characteristics including origins, destinations, and trip purposes; and socioeconomic data on all tripmakers. The survey determined that on an average weekday a total of about 286,400 interzonal trips are made within the Kenosha transit service area. Of this total 43,100, or 15 percent, are home-based work trips; 47,000, or 16.4 percent, are home-based shopping trips; 21,800, or 7.6 percent, are home-based school trips; 119,000, or 41.6 percent, are home-based other trips,1 and 55,500, or 19.4 'percent, are nonhome-based trips.
1 Home-based other trips include personal business, medical-dental, social-eat meal, recreational, and serve-passenger trips.
27

To facilitate further analysis of trip characteristics, it is convenient to express travel in terms of trip ends, one end of the trip being the "production" end while the other end is termed the "attraction" end. For trips beginning or ending at home, termed "home-based trips," the production end is always considered as the home end of the trip while the attraction end is always considered as the nonhome-end, regardless of the actual direction of the trip. The number of work trips "produced" within a specified zone, for example, would be the number of trips from homes in that zone to places of employment in all other zones plus the number of trips from places of employment in all other zones to homes in the specified zone. Conversely, the number of work trips "attracted" to a specified zone would be the number of trips from homes in all other zones to a place of employment within that specified zone plus the number of trips from the places of employment in the specified zone to homes in all other zones. Such a designation is helpful in defining the residential distribution of tripmakers and also the concentrations of work, shopping, and school facilities. For trips having n~ither end at home, termed "non home-based trips," the origin of the trip is defined as the production end, while the destination is defined as the attraction end.
Based upon this distinction, Map 16 graphically illustrates the distribution of total person trip attractions in the effective transit service area. As can be seen, there are heavy concentrations of trip attractions in the central business district consisting of traffic analysis zones 1143, 1144, 1145, and 1146.2 The majority of total person attractions in these zones is home-based-other indicating the concentrations of medical and governmental institutions within these zones. Other zones attracting large numbers of total person trips are: zone 1141 which contains the AMC plant and thus attracts many work trips; zone 1131 containing the Montgomery Ward Store complex, thus attracting a large number of shopping trips; zone 1158 containing the uptown shopping area and thus attracting large numbers of home-based shopping trips; zone 1165 containing numerous small retail and service businesses, thus attracting large number of home-based other trips; and zone 1174 containing Pershing Plaza which attracts primarily shopping trips.
In terms of trip productions Map 17 graphically illustrates the distribution of total person trip productions in the effective transit service area. In general, this will indicate the residential concentrations of tripmakers except for those downtown zones where there are large numbers of nonhome-based trips. Although it is not practical to present all the detailed trip information provided by the survey in this report, further classification of total person trips by trip purpose was made to determine by zone the distribution of productions and attractions in terms of work, shopping, school, and other purpose trips. In addition, desire line plots were made to determine the distribution of travel between different zones. Such information proved invaluable in the later evaluation of the ability of the local bus system to serve existing travel patterns.
As noted earlier, the second category of travel inventory data provided by the home interview survey consisted of the socioeconomic characteristics of tripmakers. Based upon the production end of trips which, in general, represents the home end, the characteristics of tripmakers recorded included sex, race, age, income, mode of travel, and ability to drive a car. The survey determined that, of tripmakers in the effective transit service area, 51 percent was female and 95 percent was Caucasian. The primary mode of travel was the automobile. It represented 97 percent of trips while the local bus and school bus together accounted for only 2 percent of total person trips. Moreover, 19 percent of those surveyed was unable for various reasons to drive a car. The distribution of tripmakers by age and income closely resembles that of the entire population and can be seen in Tables 13 and 14, respectively. Socioeconomic characteristics also were determined for each zone to provide a contingency check on the socioeconomic data presented earlier from census information. In general, the concentrations of the elderly, low income, and minorities as determined by the home interview survey compared well with the census data. The particular travel habits and patterns of these groups as determined by the home interview survey will be carefully considered in later chapters dealing with local bus operations.
SUMMARY
The study area for this transit development program is the Kenosha Planning District, comprising the eastern urbanized portion of Kenosha County. Special and general purpose units of government having important transportation responsibilities within the District include the local civil divisions of the City of Kenosha, the Town of Pleasant Prairie and the Town of Somers, Kenosha County, and the Kenosha Unified Public School District Number One.
Land uses in the District vary greatly from low density agriculture in the Towns of Pleasant Prairie and Somers to high density urban in the City of Kenosha. Urbanization has been rapid in recent years with the acreage of urban land uses increasing over 9 percent between 1963 and 1970. Current estimates indicate a continuation of this trend with the most rapid urbanization occurring southwest of the existing urban areas of the City of Kenosha.
2 The numbering of the traffic analysis zones is based upon the system used for the entire Southeastern Wisconsin Region. Therefore, the 86 zones comprising the Kenosha effective urban transit service area are not necessarily consecutively numbered.
28
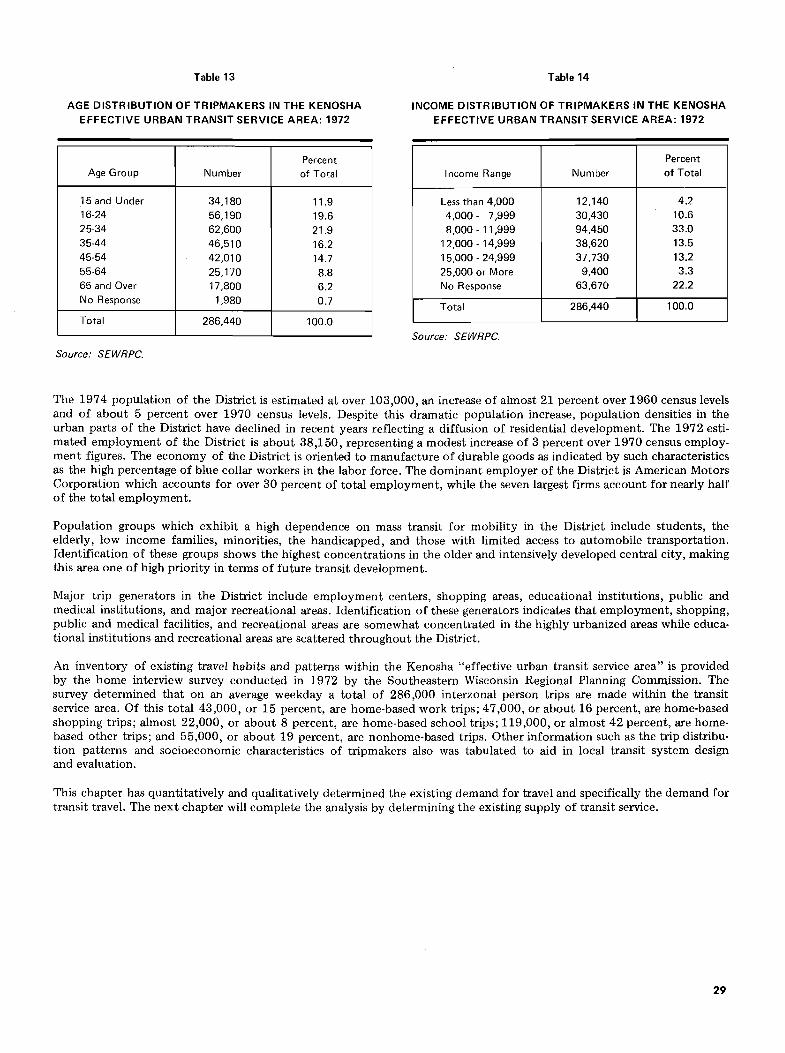
Table 13
AGE DISTRIBUTION OF TRIPMAKERS IN THE KENOSHA EFFECTIVE URBAN TRANSIT SERVICE AREA: 1972
Percent Age Group Number of Total
15 and Under 34,180 11.9 16-24 56,190 19.6 25-34 62,600 21.9 35-44 46,510 16.2 45-54 42,010 14.7 55-64 25,170 8.8 65 and Over 17,800 6.2 No Response 1,980 0.7
Total 286,440 100.0
Source: SEWRPC.
Table 14
INCOME DISTRIBUTION OF TRIPMAKERS IN THE KENOSHA EFFECTIVE URBAN TRANSIT SERVICE AREA: 1972
Percent
Income Range Number of Total
Less than 4,000 12,140 4.2
4,000 - 7,999 30,430 10.6
8,000 - 11,999 94,450 33.0
12,000 - 14,999 38,620 13.5
15,000 - 24,999 37,730 13.2
25,000 or More 9,400 3.3
No Response 63,670 22.2
Total 286,440 100.0
Source: SEWRPC.
The 1974 population of the District is estimated at over 103,000, an increase of almost 21 percent over 1960 census levels and of about 5 percent over 1970 census levels. Despite this dramatic population increase, population densities in the urban parts of the District have declined in recent years reflecting a diffusion of residential development. The 1972 estimated employment of the District is about 38,150, representing a modest increase of 3 percent over 1970 census employment figures. The economy of the District is oriented to manufacture of durable goods as indicated by such characteristics as the high percentage of blue collar workers in the labor force. The dominant employer of the District is American Motors Corporation which accounts for over 30 percent of total employment, while the seven largest firms account for nearly half of the total employment.
Population groups which exhibit a high dependence on mass transit for mobility in the District include students, the elderly, low income families, minorities, the handicapped, and those with limited access to automobile transportation. Identification of these groups shows the highest concentrations in the older and intensively developed central city, making this area one of high priority in terms of future transit development.
Major trip generators in the District include employment centers, shopping areas, educational institutions, public and medical institutions, and major recreational areas. Identification of these generators indicates that employment, shopping, public and medical facilities, and recreational areas are somewhat concentrated in the highly urbanized areas while educational institutions and recreational areas are scattered throughout the District.
An inventory of existing travel habits and patterns within the Kenosha "effective urban transit service area" is provided by the home interview survey conducted in 1972 by the Southeastern Wisconsin Regional Planning Commission. The survey determined that on an average weekday a total of 286,000 interzonal person trips are made within the transit service area. Of this total 43,000, or 15 percent, are home-based work trips; 47,000, or about 16 percent, are home-based shopping trips; almost 22,000, or about 8 percent, are home-based school trips; 119,000, or almost 42 percent, are homebased other trips; and 55,000, or about 19 percent, are nonhome-based trips. Other information such as the trip distribution patterns and socioeconomic characteristics of tripmakers also was tabulated to aid in local transit system design and evaluation.
This chapter has quantitatively and qualitatively determined the existing demand for travel and specifically the demand for transit travel. The next chapter will complete the analysis by determining the existing supply of transit service.
29

(This page intentionally left blank)

Chapter IV
EXISTING MASS TRANSIT SYSTEMS
INTRODUCTION
An understanding of the existing mass transportation service within the study area is basic to the preparation of any sound transit development program. This understanding must be based upon a thorough inventory of current transit operations and appropriate survey data describing the travel habits and patterns of existing transit ridership.
This chapter documents the findings of such an inventory of mass transit systems in the Kenosha Urban Planning District. A brief history of transit development in the District is included, and the operatIons of the Kenosha Transit Commission, the major supplier of mass transit service in the District, are described. So also are the operations of other organizations offering transit services. Finally, the results of survey data on transit travel habits and patterns are presented, and public opinion of transit operations is described.
HISTORY
Mass transit service in the City of Kenosha was initiated in 1903 when the Kenosha Electric Railway Company began street railway operations with seven cars operating over four miles of track. Although service was expanded in 1907, the inability of the line to make a profit resulted in its sale in 1909 to a British investment firm and again in 1912 to the Milwaukee Electric Railway and Light Company (TMER & L). TMER & L, which also operated the streetcar systems in Milwaukee and Racine, consolidated the Kenosha operation with other traction, gas, and electric utilities in the Racine-Kenosha area to form the Wisconsin Gas and Electric Company (WG & E). The common ownership of the traction properties in the three cities facilitated the introduction of interurban service between Kenosha, Racine, and Milwaukee. This required double tracking of most of the Main Street line which traversed what was formerly Main Street and now is Sixth Avenue in Kenosha to accommodate the interurban cars. The WG & E also completely modernized the system in the early 1920s. By the late 1920s the rapid growth of Kenosha increased demand. to a point where routes were extended into new areas and additional equipment was borrowed from Milwaukee to provide service. The business still remained unprofitable, however, and in 1931, with much of the trackage deteriorating, the company petitioned to abandon streetcar service. The petition was approved by the Wisconsin Public Service Commission and the streetcar service was replaced by a system of four electric "trackless trolley" routes.
The WG & E continued to operate the trolley coaches until 1942 when an independent corporation, Kenosha Motor Coach, Inc. acquired the operation. Following the dramatic increase and then the decline of ridership during and after World War II, Kenosha Motor Coach, Inc., converted the entire system to motorbuses. Despite continually declining ridership during the 1950s, Kenosha Motor Coach operated the bus system until 1962 when Lakeshore Transit, Inc., assumed ownership of the bus operations. The system was sold again in 1969 to Pathfinder City Transit Lines after a drivers' strike which halted bus operations for almost five months. Table 15 shows the trends in ridership and total vehicle miles and hours for urban mass transit service in Kenosha since 1955.
Even before Pathfinder assumed bus operations, it was clear that urban transit service in the area could not be sustained solely from the fare box. For this reason, the Kenosha Common Council on May 20, 1969, approved an ordinance which permitted the use of city parking meter funds to subsidize public transportation. Shortly after Pathfinder began bus operations on August 4, 1969, the Kenosha Parking Commission authorized a $2,500 per month subsidy in an effort to maintain the service. The amount of subsidy was further increased in October 1969 when the Kenosha Common Council also began month-by-month subsidies usually in the range of $7,000 to $10,000 per month. This subsidy arrangement continued until September 1970 when an advisory referendum was held to determine whether subsidies should be continued. Fifty-four percent of referendum voters rejected the continuation of subsidies, prompting the Common Council to discontinue subsidy after September 31, 1970, except for the $2,500 from the Parking Commission. Due in part to the reduction in subsidies, Pathfinder on February 3, 1971, applied to the Wisconsin Public Service Commission for temporary discontinuation of service because of extreme financial difficulties. The application was approved and service was discontinued on February 12, 1971.
During this same period the City of Kenosha, anticipating possible discontinuation of private transit service, devoted much effort and study to determine the feasibility and desirability of establishing a publicly owned and operated transit system. A referendum was held on April 7, 1970, to authorize the issuance of $25,000 worth of bonds to purchase Pathfinder. The referendum was defeated; 57 percent voted against the proposal. In addition, as noted earlier, a technical study was conducted in 1969 to help resolve the transit issues confronting the City. Based upon the recommendations of this study,
31

Table 15
MASS TRANSIT REVENUE PASSENGERS, VEHICLE MILES, AND VEHICLE HOURS IN THE KENOSHA URBAN PLANNING DISTRICT BY YEAR: 1955-1974
Revenue Vehicle Company Year Passengers Miles
Kenosha Motor Coach ................... 1955 3,611,172 882,222 Kenosha Motor Coach ................... 1956 3,116,863 854,063 Kenosha Motor Coach ................... 1957 2,597,727 821.786 Kenosha Motor Coach ................... 1958 2,295,930 780,633 Kenosha Motor Coach ................... 1959 2,340,322 760,379 Kenosha Motor Coach ................... 1960 2,077,064 770,055 Kenosha Motor Coach ................... 1961 2,077,064 766,286 Kenosha Motor Coacha ................... 1962 1,978,135 776,948 Lakeshore Transit, Inc ................. , .. 1963 1,884,416 764,158 Lakeshore Transit, Inc .................... 1964 1,834,120 707,152 Lakeshore Transit, Inc .................... 1965 1,749,836 657,267 Lakeshore Transit, Inc .................... 1966 1,586,755 615,742 Lakeshore Transit, Inc .................... 1967 1,527,553 610,963 Lakeshore Transit, Inc .................... 1968 1,055,509 424,415 Pathfinder City Transit Linesb .............. 1969 175,771 146,607 Pathfinder City Transit Lines ............... 1970 472,839 381,466 Kenosha Parking-Transit Commissionc ......... 1971 187,545 155,525 Kenosha Parking-Transit Commission ......... 1972 503,170 309,870 Kenosha Parking-Transit Commission .......... 1973 572.771 319,590 Kenosha Parking-Transit Commission .. _ ...... 1974 687,871 335,044
a Lakeshore Transit, Inc., assumed operations on October 8, 1962. Totals for both are included in the 1962 figures.
Vehicle Hours
83,358 80,947 76,974 73,710 71,576 72,027 71,561 72,480 70,775 64,134 58,196 55,818 55,122 40,901 12,798 28,725 14,348 32,272 29,496 30,921
b Pathfinder City Transit Lines assumed operations on August 4, 1969. Figures for L{1keshore Transit, Inc., for 1969 were not available.
c Kenosha Parking- Transit Commission assumed operations on September 1. 1971. Totals for both are included in the 1971 figures.
Source: Wisconsin Public Service Commission.
the Kenosha Common Council in May 1971 es~blished a seven.member Transit'Parking Commission to operate the local bus system_ Following the acquisition of capital equipment from Pathfinder, the receipt of federal emergency employment assistance, and the official transfer of the common carrier certificate, the City of Kenosha on September 7, 1971, began local bus service after almost eight months without seJ;'Vice_ Thus it became the first publicly owned and operated transit system in the Southeastern Wisconsin Region. Subsequently a referendum was held on April 4, 1972, to ascertain whether the City of Kenosha should continue to own and operate the bus system. The result was an overwhelming approval in which over 82 percent voted to maintain public ownership and operation of the system.
KENOSHA TRANSIT COMMISSION
The major supplier of transit service in the Kenosha Planning District is the City of Kenosha which, as noted above, has owned and operated the local bus system since September of 1971. In anticipation of taking over the transit system, the Kenosha Common Council on May 17,1971, pursuant to Section 66.943 of the Wisconsin Statutes, established the Kenosha Transit Commission for purposes of "the establishment, maintenance, and operation of a comprehensive unified local transportation system .... " In addition, pursuant to Section 66.068 and 66.079 of the Wisconsin Statutes, the Transit Commission was given responsibility for the management, control, and operation of all municipal parking facilities in the City.
The Kenosha Transit Commission presently operates the local bus system under the common carrier certificate CC·1014 issued by the Public Service Commission of Wisconsin. The following sections describe the existing operations of the Transit Commission in terms of: management structure and personnel, levels of service, capital equipment and maintenance, marketing and public relations, and financial status.
Management Structure and Personnel The policy making body for the local transit system operations is the Kenosha Transit Commission composed of seven members appointed by the Mayor and confirmed by the Common Council. Although the Common Council must give final approval on certain important matters, the powers of the Transit Commission are substantial. They include: the
32

responsibility for receiving and filing complaints and petitions and for holding public hearings on transit matters; the legal authority to extend bus service into adjacent territory of Wisconsin up to 30 miles from the nearest point marking the City of Kenosha corporate limits; the financial authority to collect and maintain as a segregated fund all revenues derived from parking or transit operations; the authority to borrow money or issue revenue bonds for acquisition of facilities and equipment according to the provisions of Section 66.066 of the Wisconsin Statutes; the responsibility for acquiring facilities and equipment for establishment of the comprehensive unified local transportation system subject to Section 66.065 of the Wisconsin Statutes, and the responsibility to study and report to the Common Council on the feasibility of contracting with private organizations or other units of government for the provision of transportation services.
Direct operational responsibility for the bus system has been delegated to the City Department of Transportation established in February 1974. Although the Director of Transportation alsQ is responsible for the management of parking, harbor, and airport facilities, approximately 80 percent of his time is to be devoted to bus system operations. In addition to the regular three-man City Department of Transportation staff, the present bus operation requires a dispatcher, 24 full and four part-time drivers, a garage foreman, and two mechanics.
All bus drivers are required to participate in a continuing driver training Pfogram which is associated with the National Safety Council's "Defensive Driving Course" for professional drivers. For new drivers an in-service program has been developed starting with yard training, part-time driving, and student trips with a driving instructor. Over 335,000 bus miles of service were operated in 1974. Sixteen accidents involving buses occurred, none of them resulting in death or serious injury.
The management and policy making structure is summarized on the organization chart shown in Figure 2. Although relatively new, the division of policy and management functions has proven to be successful in that present relations between the policy-making bodies involved are on the whole excellent.
Levels of Service Local bus services are provided by the Kenosha Transit Commission over two distinct SUbsystems: the regular city routes and the school "tripper" routes. Although all routes are open to use by the general public, the school trippers are specifically designed to accommodate the movement of school children.
The Transit Commission presently (1975) operates five regular city routes which together total 53.9 one-way miles (see Table 16). Of this total, 8.6 miles of streets are covered by more than one route resulting in total route coverage of 45.3 miles of nonduplicated streets and highways.
Hours of operation are from 6:00 a.m. to 7:00 p.m. on Monday through Thursday and on Saturday and from 6:00 a.m. to 9:00 p.m. on Fridays. The system currently offers no service on either Sundays or holidays thereby providing an average of approximately 82 total hours of operation per week. Buses on all five routes operate on a 60 minute headway except for weekday peak hours from 6:00 a.m. to 8:00 a.m. and 3:00 p.m. to 5:00 p.m. when headways are reduced to 30 minutes. Thus each route is traversed in either direction 200 times per week for a weekly revenue route total of 10,780 miles. Nonrevenue, or "dead-head," mileage has varied significantly during the past few years due to changes in the location of the garage site.
Figure 2
ORGANIZATION CHART FOR MANAGEMENT OF THE KENOSHA TRANSIT SYSTEM
>o
cl ..
If) z o
'------' ~ 0: W
~
Source: Kenosha Transit Commission.
Table 16
MILEAGE IN THE KENOSHA TRANSIT SYSTEM BY ROUTE: DECEMBER 1975
Routea One-Way Route Miles
1 , ... . ., .. 11.5 2 • f'" · - 11.0 3 .. . -- 12.5 4 . . · . . . 12.6 5 .. . . . · . 6.3
T9tal 53.9
a See Map 18.
Source: Kenosha Transit Commission.
33

The buses presently are stored outside the Public Works garage which is located at 67th Street and 38th Avenue adjacent to the site of a bus garaging and maintenance facility presently under construction. From this site, dead-head mileage for the five regular routes is 25 miles per day or 150 miles per week, representing 1.4 percent of total weekly revenue and nonrevenue mileage of 10,930 miles. Excluding holidays, then, the total annual vehicle miles of travel under the existing regular city route system are 557,400 miles.
Configurations of the five regular routes are graphically illustrated on Map 18. As can be seen, the five-route system is lineal in design and oriented to the central business district. The schedules are designed so that all routes meet at the central business district (56th Street and Sixth Avenue) at the half hour, thus allowing for convenient transfers between any two routes. The present policy allows any passenger upon request and at no extra charge to receive a transfer ticket to any other specified route. The City of Kenosha has recently completed construction on a three block pedestrian shopping mall along Sixth Avenue between 56th and 59th Streets. As part of this downtown redevelopment project, two transit shelters were built, greatly increasing the comfort of waiting transit patrons. Aside from this facility in the central business district, there are no other waiting shelters. Bus stop signs recently have been erected at all points along the new route structure.
Since City acquisition of the system, the basic adult fare has been 25 cents. Since July 1, 1975, a 10 cent fare has been established for the elderly and the handicapped during nonpeak hours. To take advantage of this reduced fare an individual must present proof of his age or disability and receive a picture ID card from the Transit Commission offices. The Kenosha Department of Transportation recently purchased a camera to take these picture ID cards.
The second subsystem operated by the Kenosha Transit Commission consists of five morning and afternoon school "tripper" routes. Designed primarily to accommodate junior and senior high school students, these routes (shown on Map 19) operate only on school days from 6:45 to 7:45 a.m. and 2:40 to 3:40 p.m. Each route is traversed once in the morning and once in the afternoon for a daily revenue total of 190 miles. The Unified School District comprising the Kenosha Urban Planning District has entered into an agreement with the Transit Commission whereby eligible students in the City of Kenosha are provided with tickets good on both school trippers and the regular routes. These tickets are collected by the bus driver, and the School District reimburses the Transit Commission 25 cents for each ticket collected. Approximately 2,345 students living in the City of Kenosha are eligible for this service in the 1975-76 school year.
Since City acquisition of bus operations in September 1971, ridership has increased steadily. Table 17 shows the combined monthly ridership of both the school tripper and regular City routes since acquisition. As can be seen, ridership declines significantly in the summer months reflecting the absence of the school tripper routes. Except for March 1975, every month has registered a gain over the same month of the preceding year. Although there has been limited experience with the newest route configurations implemented in August 1975, large ridership gains have already been realized as shown by an average 22 percent increase for the four months of September through December. The current distribution of ridership on the City routes is: 17.9 percent on Route 1; 22.4 percent on Route 2; 20.3 percent on Route 3; 26.9 percent on Route 4; and 12.5 percent on Route 5. More specific information concerning characteristics of riders will be presented in a later section on transit travel habits and patterns.
Capital Equipment and Maintenance The City of Kenosha in April 1974, received a federal capital assistance grant of approximately $1.5 million under the provisions of Section 3 of the Urban Mass Transportation Act of 1964, as amended. The funds, provided under UMTA Project No. WI-03-0007, are to be used for:
a. purchase of 24 new 45-passenger diesel transit buses;
b. purchase of a spare diesel engine;
c. purchase of a supervisory vehicle;
d. purchase of 24 electric, locked-type registering fare boxes;
e. purchase of 30 two-way radios;
f. purchase of maintenance tools and equipment;
g. purchase and installation of an automatic bus washer;
h. purchase and installation of an automatic vacuum cleaning system;
i. purchase and installation of a water main;
j. purchase and installation of 550 bus stop signs; and
k. construction of a bus-storage and maintenance facility, including design, site paving, and site lighting.
34

Map 18
CITY ROUTES OPERATED BY THE KENOSHA TRANSIT COMMISSION: DECEMBER 1975
l[J 1
, o ,
I
., < ,
,-....
~I-
I i
+
-+ ......... ·~·~"'1
': """~ /~ "''''~ ~ -'-' ---F~~~:''"~4
1
't
T
I 'I
t
. • - "+ "I ,'---l ______ .J.l_~.",. ""'i"
Source: Kenosha Transi t Commission.
J
" ....... -
", 2.7TH . L E GEND
ROUTE NUMBER
D
,
•
QUARTER-MILE SERV ICE AREA
t 35

1\-)
f ,
, <
0 ,
c , • .. , r
• i , ,
Map 19
SCHOOL TRIPPER ROUTES OPERATED BY THE KENOSHA TRANSIT COMMISSION , SEPTEMBER 1975
(" ·1
----"------L~' -+ , I I ~-'I "
l'H"~ .J ' I 1\ I i
f '---- t I \ ~ f \ ~'
.....
,L., ~ IY""
""
"'/ ';,t • . . ".
1
'"
LEGEND BULLEN-NORTH TRIPPEA
TREMPER - BULLEN- LANCE TRIPPER
ST. JOSEPH -TREMPERLANCE TR IPPER
TREMPER-BULLEN TRIPPER
BRADFORD-TREMPER TRIPPER
Source: Kenosha Transit Commission.
36

Table 17
TRANSIT REVENUE RIDERSHIP BY MONTH IN THE KENOSHA URBAN PLANNING DISTRICT: 1971-1975
Month 1971 1972 1973 1974 1975
January .......... -- 45,797 57,629 72,289 76,487 February ......... -- 50,820 52,559 62,805 69,087 March ........... -- 49,938 60,679 72,116 63,877 April ............ -- 49,274 47,927 65,334 68,770 May ............ -- 49,981 56,470 63,558 70,577 June ............ -- 27,990 31,839 31,671 39,484 July ............ -- 21,760 23,986 27,073 30,244 August .......... -- 23,663 26,231 28,743 27,782 September ........ 12,806 31,300 33,612 60,739 73,532 October .......... 36,590 49,708 65,275 76,938 89,919 November ........ 38,194 52,734 62,892 65,854 75,147 December ........ 42,425 50,205 53,672 60,751 81,861
Total 130,015 503,170 572,771 687,871 766,767
NOTE: Revenue ridership figures begin in September 1971 with start of operations of Kenosha Transit Commission.
Source: Wisconsin Public Service Commission. ,
Although many of the above items have yet to be purchased and the garage is still under construction, it appears that the Kenosha Transit Commission is in a very good position with regard to capital equipment. In addition to the 24 new buses, the Transit Commission also owns six older buses, making a total of 30 buses. As can be seen in Table 18, however, two of these are 1951 GMC buses which ~ave far exceeded their useful lives and cannot be depended upon for regular daily services.
The bus requirements for the peak period on the existing system are as follows. On each of the four longer city routesRoutes 1,2,3, and 4-four buses are required for a total of 16. On the shorter Route 5, two buses are required during peak periods resulting in a total of 18 buses for the regular city route system. The school trippers which also operate during part of the peak period require five buses resulting in a total of 23 buses needed for the entire Kenosha Transit Commission operation. As 30 buses are available, there are enough to provide the current level of service.
Maintenance of buses since the City acquisition has been a major problem. Besides the deteriorated condition of the bus fleet, suitable maintenance facilities for the buses were not available. All maintenance work presently is performed at the City Public Works garage, which also is responsible for maintaining 450 other city vehicles. The resulting lack of sufficient work space and equipment has made even simple preventive maintenance work difficult. Consequently, the costs of maintenance have been very high. On a per mile basis, for example, maintenance expenses have increased from 4.3 cents per mile in 1971 to 21.0 cents per mile in 1974, an increase of approximately 390 percent.
Marketing and Public Relations. There is presently much public interest in and enthusiasm for transit service in the City of Kenosha. Press coverage of the UMT A grant has been extensive and favorable. The new buses recently arrived, and their very presence on the street has vastly improved the image of transit. Recent marketing efforts include a "VIP tour" of the City in the new buses for city, county, school, and civic leaders and a "free-ride" day promotion for all citizens. Although only $1,000 was spent in 1974 for advertising to promote the new route structure and the increased service schedule, up to $6,000 has been appropriated during 1975 for radio and newspaper promotional campaigns. An additional $2,000 will be spent for the printing of new bus schedules and $200 for the printing of new route maps.
Presently route maps and schedules are published periodically in the local newspaper. A pocket schedule, showing individual routes and the times that a bus is due at key intersections, is available to the general public although no system route maps are published. Information on service can be obtained by calling the Transit Commission office on Monday through Friday between the hours of 8:00 a.m. to 5:00 p.m. Students receive schedule information on school trippers primarily through the news media. RFT! ~ON T(J
, -(' - "I ,j~' ·,..,.;.,L/·.i~ SOUT~!'!\"'~~~~\ ~) ",.1,
ct:(,r-,r,,:'., t"-" " .. ···,IiSSION ,''- , • ...J/;1!l- 1-
Pu\"h.x,-, ... ,,,;,AhY 37

Table 18
SelECTED CHARACTERISTICS OF BUSES OWNED BY THE KENOSHA TRANSIT COMMISSION: 1975
Fleet Seating Purchase Number Make Used Engine Type Year Capacity Date or New
532 Twin Coach Gas 1971 25 9/71 New 533 Twin Coach Gas 1971 31 9/71 New 534 Twin Coach Gas 1971 31 9/71 New 535 Twin Coach Diesel 1971 31 9/71 New 541 GMC Diesel 1951 45 11/71 Used 542 GMC Diesel 1951 45 9/71 Used 501 GMC Diesel 1975 45 4175 New 502 GMC Diesel 1975 45 4175 New 503 GMC Diesel 1975 45 4175 New 504 GMC Diesel 1975 45 4175 New 505 GMC Diesel 1975 45 5175 New 506 GMC Diesel 1975 45 4175 New 507 GMC Diesel 1975 45 4175 New 508 GMC Diesel 1975 45 4175 New 509 GMC Diesel 1975 45 4175 New 510 GMC Diesel 1975 45 4175 New 511 GMC Diesel 1975 45 4175 New 512 GMC Diesel 1975 45 5175 New 513 GMC Diesel 1975 45 4175 New 514 GMC Diesel 1975 45 4175 New 515 GMC Diesel 1975 45 4175 New 516 GMC Diesel 1975 45 4175 New 517 GMC Diesel 1975 45 4175 New 518 GMC Diesel 1975 45 4175 New 519 GMC Diesel 1975 45 5175 New 520 GMC Diesel 1975 45 5175 New 521 GMC Diesel 1975 45 5175 New 522 GMC Diesel 1975 45 5175 New 523 GMC Diesel 1975 45 5175 New 524 GMC Diesel 1975 45 5175 New
Source: Kenosha Department of Transportation.
Financial Status The Kenosha Transit Commission operated on a profitable basis for the first 16 months of municipal ownership due primarily to a grant of Federal Emergency Employment Act (EEA) monies to pay 90 percent of the wages of the drivers and one clerical position. Excluding the federal EEA grant which expired in September 1973, the Transit Commission experienced an operating deficit of $157,499 for calendar year 1973. The 1974 operating deficit increased to $213,592. Pursuant to Section 85.05 of the Wisconsin Statutes, however, the Transit Commission received a State operating assistance grant of approximately two-thirds of this deficit or $130,500 for 1974. A complete tabulation of operating expenses and revenues for the years 1971 through 1974 can be found in Appendix B of this report.
Costs of operation have increased dramatically since the City acquired the system. The total operating cost per bus mile has increased steadily from 53 cents in 1971 to $1.18 in 1974, representing a relative increase of 123 percent in operating cost per mile between 1971 and 1974. Operating cost per passenger has increased from 47 cents in 1971 to 57 cents in 1974, a 21 percent increase. The smaller increase in costs per passenger can be attributed to the steady growth in ridership since 1971. A summary of operating costs can be found in Table 19. The cost increases reflect an increase of 18 percent in drivers' wages, the near tripling of the cost of fuel, and, as noted earlier, an increase of 390 percent in maintenance costs.
During the same period, operating revenue also has increased but not so rapidly as costs. As can be seen in Table 19, operating revenue per mile has doubled: from 26 cents in 1971 to 54 cents in 1974. Operating revenue per passenger, however, has remained relatively stable, increasing only 3 cents: from 23 to 26 cents between 1971 and 1974. As the basic adult fare has remained at 25 cents, this slight revenue increase can be attributed to greater charter and advertising revenues.
38

Table 19
OPERATING COSTS AND REVENUES OF THE KENOSHA TRANSIT COMMISSION: 1971-1974
Operating Operating Revenue Cost Revenue Per Cost Per Year Revenue Cost Miles Passengers Per Mile Per Mile Passenger Passenger
1971 29,965 60,773 113,852 130,015 $0.26 $0.53 $0.23 $0.47 1972 117,943 287,010 309,870 503,170 0.38 0.93 0.23 0.57 1973 147,508 305,007 319,590 572,771 0.46 0.95 0.26 0.53 1974 180,656 394,248 335,044 687,871 0.54 1.18 0.26 0.57
Source: Wisconsin Public Service Commission, Kenosha Transit Commission, and SEWRPC.
A comparison between costs and revenue indicates that the absolute deficit for operations has increased between 1971 and 1974. The deficit per mile has increased from 27 cents in 1971 to 64 cents in 1974 while the deficit per passenger has increased from 24 cents in 1971 to 31 cents in 1974. Figures 3 and 4 graphically illustrate the comparison between costs and revenue per mile and between costs and revenue per passenger, respectively.
It is clear that with present fares and levels of service the bus operation cannot be expected to be self sufficient. Recom· mendations for decreasing operating deficits and finding alternative sources of revenue will be explored in later sections of this report. .
Figure 3
OPERATING COST AND REVENUE PER MILE FOR THE KENOSHA TRANSIT SYSTEM: 1971-1975
1.30
1.20
1.10
1.00
.90
.80
!Q .70 <t .J .J 8 .so
• 50
.40
.30
.20
.10
/ /
/ /
.,,/ ",.,
/ /
V -COST/MII.E
............
~ V
REVENUE/MILE
o 1971 1972 1973
YEAR 1974
Source: Wisconsin Public Service Commission.
1.30
1.20
1.10
1.00
.90
.80
.70
.60
.50
.40
.30
.20
.10
0 1975
VI II: <t .J .J 0 0
UI
!1i .J .J g
Figure 4
OPERATING COST AND REVENUE PER PASSENGER FOR THE KENOSHA TRANSIT SYSTEM: 1971-1975
.70
.60
.50
/
.40
.30
.20
.10
o 1971
/ ~~
1972
COST/PASSENGER
REVENUE / PASSENGER
1973
YEAR
1974
70
60
.50
.40
.30
.20
.10
o 1975
Source: Wisconsin Public Service Commission.
39

OTHER BUS SERVICES
In addition to the tertiary level, urban bus service provided publicly by the City of Kenosha, a number of private concerns provide secondary level (suburban) or specialized bus service in the Kenosha area.
Suburban or intercity bus service in the Kenosha Planning District is provided on a regularly scheduled basis by Greyhound Lines-West and Wisconsin Coach Lines, Inc. Greyhound, a licensed interstate carrier, operates three local bus runs daily in each direction between Milwaukee and Chicago, making an intermediate stop in the City of Kenosha. Wisconsin Coach Lines, which is limited primarily to intrastate service, operates nine weekday bus runs in each direction between the Cities of Kenosha and Milwaukee with an intermediate stop in the City of Racine. They also operate eight buses each direction on Saturdays and six buses on Sundays and holidays. The two companies share common terminal facilities near the uptown business district, and the terminal is directly served by the local bus system. Map 20 identifies the intercity routes of the two companies.
The majority of contract and charter bus service in the Planning District is provided by Jelco Buses, Incorporated, from a bus terminal located at 6015 52nd Street in the City of Kenosha. Pursuant to Sections 121.51-58 of the Wisconsin Statutes, Jelco has a contract with the Kenosha Unified School District Number One to bus eligible public and parochical students who are not served by the Kenosha Transit Commission school tripper routes. The Company presently provides bus transportation to and from public and private schools within the District for 5,571 students of which 3,108 reside in the Town of Pleasant Prairie, 1,827 reside in the Town of Somers, and 636 reside in the City of Kenosha. Using state approved 66-passenger school buses, Jelco operates 232 morning and afternoon daily regular bus routes and 19 daily routes for 1/2 day kindergarten students. The planning and preparation of all school bus routes are the responsibility of the school district Pupil Transportation Office which often receives assistance from Jelco. The routes vary from year to year depending on changes in school hours and student locations. The above figures represent the 1975-76 school year.
Jelco Buses, Incorporated, also provides bus transportation by special contract for 590 handicapped and Head Start students, 90 percent of whom live in the City of Kenosha. This service includes 90 morning and afternoon routes for handicapped students and 20 morning and afternoon routes for Head Start students. The Head Start program is federally financed through the School District.
The vehicle needs for the above services include 64-66 passenger school buses for regular students and 42 smaller van-type buses for handicapped and Head Start students. Presently the rates for regular school buses are $31.60 per bus per day plus $5.30 for each additional route per vehicle. The rates for the special education programs are $8.42 per hour per bus with the routes averaging one hour. For the total 1974-75 school year, the school district paid Jelco $489,831 for regular school bus services and $196,272 for special education bus services. Jelco, Inc., also provides charter bus service on a onetime contract basis for such things as church or special school activities.
COMMUTER RAIL SERVICE
Commuter rail service to the City of Kenosha is provided by the Chicago and Northwestern Transportation Company (C & NW) operating nine trains in each direction Monday through Friday between the Cities of Kenosha and Chicago. Presently trains leave the City of Kenosha,for Chicago ,at 6:00 a.m., 6:20 a.m., 6:55 a.m., 7:15 a.m., 7:53 a.m., 8:49 a.m., 2:49 p.m., 5:49 p.m., and 11:30 p.m. Trams leave ChIcago for Kenosha at 6:35 a.m., 12:35 p.m., 4:15 p.m., 5:07 p.m., 5:10 p.m., 5:35 p.m., 6:31 p.m., 9:35 p.m., and 12:35 a.m. Depending on the number of intermediate stops in lllinois which range from eight to twenty-four, the trip between Kenosha and Chicago takes approximately 90 minutes with a fare of $2.60. There also are six trains in each direction on Saturdays and three on Sundays and holidays.
The City of Kenosha is now the only Wisconsin stop on this line. The rail terminal at 11th Avenue and 59th Streets (see Map 20) provides very convenient turn-around and storage facilities for the railroad, making continued service to Kenosha attractive to the railroad even if not profitable. If commuter service were limited to lllinois, not only would the Kenosha ridership be lost but the last train at night would run to Winthrop Harbor and then have to dead-head back to WaUkegan for storage. As Kenosha is closer than Waukegan to Winthrop Harbor it is expected that the C & NW will continue the Kenosha to Chicago service. As noted earlier, however, the recently established Northeastern lllinois Regional Transportation Authority, while interested in continued commuter service to Northeastern Illinois, will not act to assure continued service to Kenosha without some sort of cooperative action by an agency in Wisconsin. It is appropriate, therefore, to analyze the need and desirability of this commuter service within the context of the Kenosha Transit Development Program. The inventory necessary to facilitate such an analysis should include an examination of past ridership trends and appropriate survey data qualifying the demand for such service.
Although the overall trend in commuter rail ridership over the past twenty years has been one of continual decline, the ridership from Kenosha has tended to stabilize over the last five years. Based upon ticket sales, the average weekday ridership boarding at Kenosha was: 243 in 1970; 229 in 1971; 213 in 1972; 206 in 1973; and 208 in 1974. To further qualify the demand for this commuter service, the Southeastern Wisconsin Regional Planning Commission as part of its
40

Map 20
INTERCITY BUS AND COMMUTER TRAIN ROUTES IN THE KENOSHA URBAN PLANNING DISTRICT, 1975
, , , ; -
J 1\--
Source: SEWRPC.
H ..... l. I ,-
1 .... 1 ""U~ If\.\.
.J
, ,
.,~
, --_\
LEGEND
BUS LINE
GREYHOUND ,-INES WEST
WISCONSIN COACH UNES . INC_
PASSENGER TRA IN LINE
- - CHICAGO AND NORTHWESTERN TR4NSPORTAT IDN COMPANY
TERMINAL FACILITY
• • BUS
TRA IN
t w 'W ry oooo'n'
41

major reinventory of travel conducted as interregional bus, rail, and ferry survey. On October 10, 1972, all passengers boarding the train at Kenosha were provided with mail-back questionnaires. Of the 194 questionnaires distributed, 94, or 48 percent, were returned in usable form. Boarding counts also were taken so that appropriate factors could be applied to the sample in order to derive figures for the total universe. The purpose of the questionnaire was to provide information related to trip purposes and user characteristics.
Travel data relevant to this study include trip origins and destinations, trip purpose, and trip frequency. The survey indicated that of those trips boarding in Kenosha, the majority (64 percent) originated in the Kenosha Planning District, primarily in the City of Kenosha. An additional 18 percent originated in Racine County and 6 percent, came from the remainder of Kenosha County. The major destination was the City of Chicago in that 71 percent of riders surveyed left the train in downtown Chicago. Other popular destinations were Evanston and Lake Forest, each accounting for 9 percent of detraining passengers. The major trip purpose was work, accounting for 82 percent of responses. The service is truly commuter oriented in that 97 percent of the passengers indicated that they made a round-trip. This observation is further reinforced by the frequency of trips. Sixty-two percent of respondents indicated that the trip was made five times per week while an additional 9 percent made the trip more than five times per week. Only 13 percent made the trip twice a week or less.
User characteristics deemed relevant were sex, age, income, and choice of ridership. Unlike local bus user characteristics, the majority of commuter train riders was male, accounting for 63 percent. The age and income distributions of riders were relatively uniform and closely paralleled those of the general public. Finally, in terms of choice of ridership, 63 percent of respondents indicated that they took the train by choice; an alternative mode of travel was available. The reasons cited most often for taking the train were the high cost of auto travel and the ability to relax during the train trip.
EXISTING TRANSIT TRAVEL HABITS AND PATTERNS
To permit evaluation of the adequacy of present local transit facilities, it is necessary to examine the characteristics of the existing local transit ridership. On May 4, 1972, the Southeastern Wisconsin Regional Planning Commission conducted an on-board mass transit user survey to ascertain transit user characteristics and travel patterns in the Kenosha area. Of the 1,385 qUestionnaires distributed to revenue passengers boarding regular city transit buses, 598, or approximately 43 percent, were returned in usable form. Information gathered included user characteristics, trip purposes and transfer movement. The following sections summarize the results of this survey. As the route structure was different at the time of the survey, Map 21 is provided for reference, showing the six routes which operated on May 4, 1972.
User Characteristics User characteristics considered most relevant to the transit planning process were sex, race, age, income, and vehicle driver license status. For the purposes of the socioeconomic summaries each individual rider was counted only once regardless of the number of trips that rider made on the survey day.
As indicated in Table 20, the vast majority-69 percent-of riders presently using the Kenosha Transit Commission routes is female. Of those riders responding to the survey, nearly 93 percent belonged to the Caucasian (white) race. Members of the Negroid (black) race made up 2.5 percent of the ridership, r~ughly equal to their proportion of the total population. The remainder of those surveyed either belonged to a relatively small racial group or gave no response. A complete tabulation of route ridership by race can be found in Table 21.
The plurality of the Kenosha Transit riders was between the ages of 16 and 24 years, comprising over 34 percent of total ridership. The second largest age group was the elderly with over 21 percent of total riders being 65 years or older. A complete tabulation of ridership by age bracket can be found in Table 22. It is interesting to note that only 18 percent of the riders was between the ages of 25 and 55, the age bracket which represents the bulk of the labor force.
The family income of the average transit rider was found to be well below that of the total population. Almost 22 percent of those responding had a family income of less than $4,000 per year or below the established federal poverty level. Another 18 percent reported an income of between $4,000 and $8,000 per year, while only 10 percent reported an income of $15,000 or greater. A complete tabulation of ridership by income can be found on Table 23. It is significant to note that over 17 percent of the riders responding to the survey chose to give no reply to the income questions.
Of those riders responding to the survey, 71 percent indicated that they did not possess a drivers' license, 27 percent indicated that they did, and 2 percent gave no response. A somewhat higher percentage of females than males did not possess a license. These figures tend to indicate a large percentage of "captive riders," those who are unable to use other means of transportation.
From the above socioeconomic data, one can generalize to develop the profile of the typical mass transit rider. In the City of Kenosha, then, the typical transit rider would be a white female, either under 24 or over 65 years of age, having a family income less than $8,000 per year, and not possessing a driver's license.
42

J
-~-t
.f :
<.~~ __ ,_ i . 1
,
~ '<"
-< , !
c "\ • • ~ • .~
• " "
Map 21
CITY ROUTES OPERATED BY THE KENOSHA TRANSIT SYSTEM : MAY 4, 1972
1 I I ,
'I
~'\ L
I I ~
I I t~
LEGEND
ROUTE N UMBER
-- ,
-- , 4
-- 5
6
•· .. ·'t " .... "- pc><> -003 !T ..- ....
Source: Kenosha Transit Commission.
43

Table 20
PERCENTAGE DISTRIBUTION OF RIDERSHIP ON THE KENOSHA TRANSIT SYSTEM BY SEX BY ROUTE
MAY 4,1972
City Transit Male Female Percent of Route (Percent) (Percent) No Response
1 26.0 74.0 --2 30.6 68.5 0.9 3 34.7 64.0 1.3 4 35.5 64.6 --5 24.4 74.4 1.3 6 30.9 69.1 --
System 30.4 69.0 0.6
NOTE: Totals may not add to 100 percent because of rounding.
Source: SEWRPC.
Table 22
Table 21
PERCENTAGE DISTRIBUTION OF RIDERSHIP ON THE KENOSHA TRANSIT SYSTEM BY RACE BY ROUTE
MAY4,1972
American Spanish- No Black White Indian American Other Response
Route (Percentl (Percentl (Percentl (Percentl (Percentl (Percentl
1 2.0 91.0 -- -- -- 7.0 2 1.9 92.6 -- -- 2.8 2.8 3 5.3 88.0 -- -- 1.3 5.3 4 2.7 93.6 0.9 1.8 -- 0.9 5 2.6 92.3 -- 1.3 2.6 1.3 6 -- 100.0 -- -- -- --
System 2.5 92.6 0.2 0.6 1.1 3.0
NOTE: Totals may not add to 100 percent because of rounding.
Source: SEWRPC.
PERCENTAGE DISTRIBUTION OF RIDERSHIP ON THE KENOSHA TRANSIT SYSTEM BY AGE BY ROUTE: MAY 4,1972
Age Range No
1-15 16-24 25-34 35-44 45-54 55-64 65 & Over Response Route (Percent) (Percent) (Percent) (Percent) (Percent) (Percent) (Percent) (Percent)
1 12.0 41.0 3.0 5.0 12.0 11.0 14.0 2.0 2 3.7 19.4 5.6 3.7 11.1 16.7 38.9 0.9 3 9.3 52.0 4.0 1.3 10.7 8.0 13.3 1.3 4 19.1 36.4 2.7 3.6 9.1 5.5 20.9 2.7 5 10.3 35.9 5.1 3.9 12.8 15.4 14.1 2.6 6 12.7 20.0 3.6 1.8 10.9 27.3 21.8 1.8
System 11.2 34.2 4.0 3.4 11.0 12.9 21.3 1.9
NOTE: Totals may not add to 100 percent because of rounding.
Source: SEWRPC.
Table 23
PERCENTAGE DISTRIBUTION OF RIDERSHIP ON THE KENOSHA TRANSIT SYSTEM BY INCOME BY ROUTE: MAY 4,1972
Income Range
$4,000- $ 8,000- $12,000- $15,000- $20,000- No $4,000 7,999 11,999 14,999 19,999 24,999 $25,000 Response
Route (Percent) (Percent) (Percent) (Percent) (Percent) (Percent) (Percent) (Percent)
1 19.0 17.0 22.0 22.0 4.0 2.0 3.0 11.0 2 27.8 25.9 18.5 11.1 4.6 1.9 -- 10.2 3 16.0 14.7 17.3 17.3 8.0 -- 4.0 22.7 4 22.8 10.0 16.4 17.3 10.9 4.6 0.9 17.3 5 18.0 21.8 23.1 5.1 2.6 2.6 -- 26.9 6 27.3 23.9 10.9 5.5 5.5 1.8 3.6 21.8
System 21.9 18.4 18.4 13.9 6.1 2.3 1.7 17.3
NOTE: Totals may not add to 100 percent because of rounding.
Source: SEWRPC.

Trip Characteristics In addition to information on the characteristics of the transit riders, the survey contained questions concerning their trips. Specifically, for each trip the origin and destination and the purpose were determined. Tables 24 and 25 summarize the results of those questions concerning trip characteristics. Of particular interest is the small percentage of riders using the bus for work. Only 17 percent of those surveyed used the bus to go to work, and only 9 percent used the system after leaving work. Despite the fact that school tripper routes were not included in the survey, the home-based school trip still comprised the plurality (27 percent) of the trip purposes.
Transfer Movement In conjunction with the May 4,1972, on-bus survey, information on transfers was collected. As noted earlier, free transfer is allowed between any two different bus routes. Tables 26, 27, and 28 summarize the results of this survey for the morning, afternoon, and entire day, respectively. The transfers are expressed in passengers which have been factored to account for sample size.
Of the 1,385 revenue passengers surveyed 332, or approximately 24 percent, transferred from one route to another. The highest number of transfers occurred from Route 1 to Route 2 with 36 passengers, while no transfers were recorded from Route 3 to Route 6, Route 5 to Route 6, or Route 6 to Route 5. It should be noted that transfer abuses were reported on Routes 2, 3, and 4. Present Transit Commission policy does not allow transferring to the same route.
PUBLIC OPINION CONCERNING MASS TRANSIT
Because the majority of transit service in the Kenosha Planning District is publicly owned, operated and supported, it is essential that the opinions and attitudes of the public on transit services be given due consideration in the transit development planning process. It is appropriate, therefore, to examine existing survey data which indicate the attitudes of citizens in the Planning District on the extent and methods of providing public transit service. In 1972, the Southeastern Wisconsin Regional Planning Commission conducted, as part of its continuing land use-transportation planning effort, an extensive public opinion survey. It sought to determine opinions, preferences, and attitudes toward certain aspects of existing and possible future public and private transportation facilities and services. The results of this survey, which also included questions on housing and recreation, are set forth in SEWRPC Technical Report No. 13, A Survey of Public Opinion in Southeastern Wisconsin-1972. The following sections describe the results of this survey as they relate to transit operations in the Kenosha Planning District.
A fundamental question for planners and officials in transit planning involves the primary elements influencing the personal decision to use or not use transit service. The first two questions of the questionnaire addressed this issue by asking respondents to indicate the three most important perceived advantages of daily automobile travel over daily public transportation travel and, conversely, the three most important perceived advantages of daily public transportation travel over daily automobile travel.
Accounting for nearly 72 percent of total responses to the first question, the three perceived advantages of auto travel most commonly cited by survey respondents were the ability to: 1) go at any time (30 percent); 2) go directly (26 percent); and 3) reduce travel time (16 percent). Privacy, comfort, cost, and personal safety were considered major advantages by a relatively small percentage of respondents. With regard to the perceived advantages of public transit the three most common responses were: 1) freedom from tensions of driving (24 percent); 2) freedom from worry about parking (21 percent), and 3) reduction of environmental damage (18 percent). A relatively small percentage of respondents (8 percent) believed that public transportation is a less expensive means of travel although it should be noted that the survey was conducted prior to common knowledge of the 1974 gasoline shortages. It also is interesting to note that while only 5 percent failed to respond to the advantages of auto travel, over 15 percent failed to respond to the advantages of public transportation, probably indicating a lesser interest in and lower availability of public transportation in an auto-oriented society.
A second important area of concern in transit planning involves the questions of financing a public transportation system. The two survey questions which addressed this issue were: Who should bear the total cost of public transportation and, if local matching funds are required, which local tax revenues, if any, should be used? With regard to the first questions, the plurality (36 percent) of the District citizens believed that public transportation should be funded partly by the riders and partly by state or federal funding. Other popular responses were partly by the riders and partly by the respective community (28 percent) and completely by the riders who use the system (24 percent). Only a small percentage (4 percent) believed that the community should be totally responsible while 1 percent indicated that public transportation should be eliminated. Assuming that some local support is required, 32 percent of respondents felt it. should come from a local vehicle tax. Other responses included local sales tax (20 percent), local income tax (15 percent), and local property tax (4 percent).
An issue closely related to the financing of mass transit is the fare structure. When asked whether public transportation fares should be reduced for certain segments of the population, only 20 percent of the District citizens felt that fares should be reduced for all public transportation riders. In regard to special groups, there was strong support for fare subsidies
45

Table 24
PERCENTAGE DISTRIBUTIONS OF TRIP ORIGINS AND TRIP DESTINATIONS ON THE KENOSHA TRANSIT SYSTEM
MAY4,1972
Origin of Trip Percent of Total Transit Trips
From Home 55 Work 9 School 19 Shopping 5 Other or Unknown 12
Destination of Trip Percent of Total Transit Trips
To Home 33 Work 17 School 12 Shopping 10 Other or Unknown 28
Source: SEWRPC.
Table 26
MORNING TRANSFERS (6 A.M. TO 12 NOON) ON THE KENOSHA TRANSIT BY ROUTE: MAY 4,1972
From To Route
Route 1 2 3 4 5 6
1 0.0 9.8 16.8 6.8 8.4 2.3 2 4.7 1.5 1.7 0.0 4.1 2.0 3 2.3 6.2 2.2 1.0 4.3 0.0 4 2.0 13.3 1.7 0.0 15.9 13.2 5 11.0 6.3 2.7 2.7 0.0 0.0 6 0.0 1.7 1.5 6.0 0.0 0.0
Source: SEWRPC.
Table 28
Table 25
PERCENTAGE DISTRIBUTION OF TRIPS ON THE KENOSHA TRANSIT SYSTEM BY TRIP PURPOSE
MAY4,1972
Trip Purpose Percent of Total Trips
Home·Based Work 23 Home·Based School 27 Home·Based Shopping 10 Home-Based Othera 18 Nonhome·Based 6 Unknown 16
a "Other" includes "social activity," "recreational activity," "conducting personal business," and "other" categories on the survey form.
Source: SEWRPC.
Table 27
AFTERNOON TRANSFERS (12 NOON TO 9 P.M.) ON THE KENOSHA TRANSIT SYSTEM BY ROUTE: MAY 4, 1972
From To Route
Route 1 2 3 4 5 6
1 0.0 26.0 9.6 0.0 10.8 0.0 2 4.5 4.3 3.7 8.4 9.3 2.3 3 2.0 16.7 4.0 0.0 0.0 0.0 4 2.0 10.0 0.0 3.5 10.1 3.0 5 10.5 6.0 1.0 10.6 0.0 0.0 6 3.6 7.0 0.0 11.1 0.0 0.0
Source: SEWRPC.
TOTAL DAILY TRANSFERS ON THE KENOSHA TRANSIT SYSTEM BY ROUTE: MAY 4,1972
From To Route
Route 1 2 3 4 5 6
1 0.0 35.8 26.4 6.8 19.2 2.3 2 9.2 5;8 5.3 8.4 13.3 4.3 3 4.3 22.9 6.2 1.0 4.3 0.0 4 4.0 23.3 1.7 3.5 26.0 16.2 5 21.5 12.3 3.7 13.3 0.0 0.0 6 3.6 8.7 1.5 17.1 0.0 0.0
Source: SEWRPC.
46
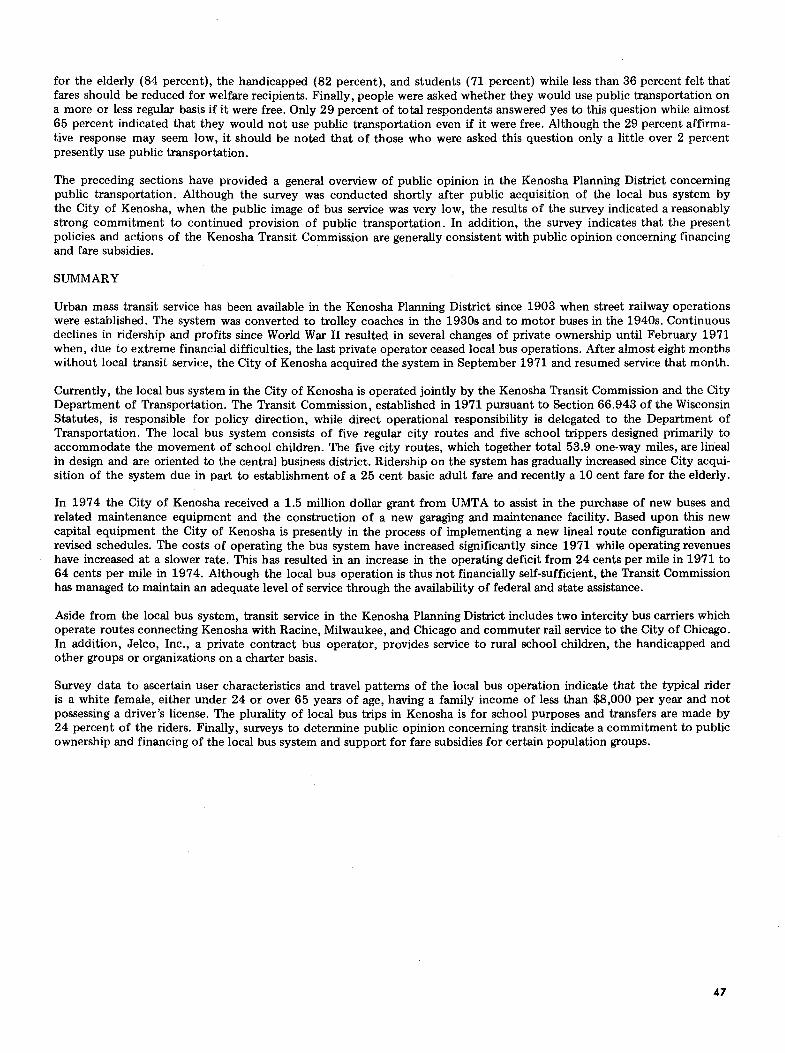
for the elderly (84 percent), the handicapped (82 percent), and students (71 percent) while less than 36 percent felt that fares should be reduced for welfare recipients. Finally, people were asked whether they would use public transportation on a more or less regular basis if it were free. Only 29 percent of total respondents answered yes to this question while almost 65 percent indicated that they would not use public transportation even if it were free. Although the 29 percent affirmative response may seem low, it should be noted that of those who were asked this question only a little over 2 percent presently use public transportation.
The preceding sections have provided a general overview of public opinion in the Kenosha Planning District concerning public transportation. Although the survey was conducted shortly after public acquisition of the local bus system by the City of Kenosha, when the public image of bus service was very low, the results of the survey indicated a reasonably strong commitment to continued provision of public transportation. In addition, the survey indicates that the present policies and actions of the Kenosha Transit Commission are generally consistent with public opinion concerning financing and fare subsidies.
SUMMARY
Urban mass transit service has been available in the Kenosha Planning District since 1903 when street railway operations were established. The system was converted to trolley coaches in the 1930s and to motor buses in the 1940s. Continuous declines in ridership and profits since World War II resulted in several changes of private ownership until February 1971 when, due to extreme financial difficulties, the last private operator ceased local bus operations. After almost eight months without local transit service, the City of Kenosha acquired the system in September 1971 and resumed service that month.
Currently, the local bus system in the City of Kenosha is operated jointly by the Kenosha Transit Commission and the City Department of Transportation. The Transit Commission, established in 1971 pursuant to Section 66.943 of the Wisconsin Statutes, is responsible for policy direction, while direct operational responsibility is delegated to the Department of Transportation. The local bus system consists of five regular city routes and five school trippers designed primarily to accommodate the movement of school children. The five city routes, which together total 53.9 one-way miles, are lineal in design and are oriented to the central business district. Ridership on the system has gradually increased since City acquisition of the system due in part to establishment of a 25 cent basic adult fare and recently a 10 cent fare for the elderly.
In 1974 the City of Kenosha received a 1.5 million dollar grant from UMTA to assist in the purchase of new buses and related maintenance equipment and the construction of a new garaging and maintenance facility. Based upon this new capital equipment the City of Kenosha is presently in the process of implementing a new lineal route configuration and revised schedules. The costs of operating the bus system have increased significantly since 1971 while operating revenues have increased at a slower rate. This has resulted in an increase in the operating deficit from 24 cents per mile in 1971 to 64 cents per mile in 1974. Although the local bus operation is thus not financially self-sufficient, the Transit Commission has managed to maintain an adequate level of service through the availability of federal and state assistance.
Aside from the local bus system, transit service in the Kenosha Planning District includes two intercity bus carriers which operate routes connecting Kenosha with Racine, Milwaukee, and Chicago and commuter rail service to the City of Chicago. In addition, Jelco, Inc., a private contract bus operator, provides service to rural school children, the handicapped and other groups or organizations on a charter basis.
Survey data to ascertain user characteristics and travel patterns of the local bus operation indicate that the typical rider is a white female, either under 24 or over 65 years of age, having a family income of less than $8,000 per year and not possessing a driver's license. The plurality of local bus trips in Kenosha is for school purposes and transfers are made by 24 percent of the riders. Finally, surveys to determine public opinion concerning transit indicate a commitment to public ownership and financing of the local bus system and support for fare subsidies for certain population groups.
47

(This page intentionally left blank)

Chapter V
EXISTING TRANSIT LEGISLATION AND REGULATIONS
INTRODUCTION
This chapter summarizes legislation and regulations existing at the federal, state, and local levels affecting the provision of mass transit service in the Kenosha Planning District. Federal legislation and administrative rules provide for and regulate the availability and distribution of federal aid for research and demonstration projects, capital improvement projects, and operating subsidies. State legislation specifies the institutional structure for public mass transit systems and tax relief measures and provides for direct operating and demonstration project assistance. Local ordinances provide certain regulations affecting transit service and define the local role in the provision of mass transit service.
FEDERAL LEGISLATION1
Federal assistance for urban mass transportation was first provided in 1961 through a modestly funded section of the federal Housing and Urban Development Act. The section authorized federal expenditures for demonstration projects and for low interest emergency loans for transit system development. CUrrently federal transit aid is available under two basic laws and their subsequent amendments: the Urban Mass Transportation Act and the Federal Aid Highway Act.
The landmark Urban Mass Transportation Act of 1964 represented the first significant federal attempt at transit assistance through establishment of a comprehensive program of matching grants for preserving, improving, and expanding urban mass transit service. The stated purposes of the Act were: "(1) to assist in the development of improved mass transportation facilities, equipment, techniques, and methods, with the cooperation of mass transportation companies both public and private; (2) to encourage the planning and establishment of areawide urban mass transportation systems needed for economical and desirable urban development, with the cooperation of mass transportation companies both public and private; and (3) to provide assistance to state and local governments and their instrumentalities in financing such systems, to be operated by public or private mass transportation companies as determined by local needs." The 1964 Act was subsequently amended, most significantly by the Urban Mass Transportation Assistance Act of 1970 and the National Mass Transportation Assistance Act of 1974. In addition to increasing the size of federal appropriations for mass transportation assistance, the two major amendments expanded the number of assistance programs available. Although authority to administer the Act was originally vested with the U. S. Department of Housing and Urban Development, Reorganization Plan No.2 of 1968 transferred responsibility to the U. S. Department of Transportation through the establishment of the Urban Mass Transportation Administration (UMTA).
Two major categories of federal assistance presently are available from UMTA pursuant to the Urban Mass Transportation Act. The larger category is the capital matching grants authorized by Section 3 of the Act. Section 3 grants, which provide up to 80 percent of eligible project costs, are to be used for financing "(1) the acquisition, construction, reconstruction and improvement of facilities and equipment for use, by operation or lease or otherwise, in mass transportation service in urban areas and in coordinating such service with highway and other transportation within such areas, and (2) the establishment and organization of public or quasi-public transit corridor development corporations or entities." Section 3 grants are approved on a project-by-project basis at the discretion of the Secretary of the U. S. Department of Transportation. They are intended primarily for state or local public agencies that operate or assist in the operation of transit systems in urbanized areas of more than 50,000 population, but about 6.5 percent of Section 3 funds has been set aside for small urban areas of less than 50,000 population. In addition to matching grants, Section 3 funds also may be used as loans for the acquisition of real property and interests in real property for use as rights-of-way, station sites, and related purposes. The $1.5 million capital improvement grant received by the City of Kenosha in 1974 was a Section 3 grant.
The other major category of assistance is the formula grant program authorized by Section 5 of the 1964 Act as amended by the National Mass Transportation Act in November of 1974. Urbanized areas, as defined by the U. S. Bureau of the Census, have the option of using Section 5 funds either to defray operating expenses on a 50 percent federal-50 percent local matching basis or for capital improvements on the same basis as Section 3 funds (80 percent federal). Unlike Section 3 funds, the distribution of Section 5 funds for urbanized areas of over 200,000 population is based upon a formula
1 Urban Mass Transportation Act of 1964, Urban Mass Transportation Assistance Act of 1970, National Mass Transportation Act of 1974, and Federal Aid Highway Act of 1973.
49

considering 1970 population and 1970 population density. Amounts available to urbanized areas with populations under 200,000 such as the Kenosha Urban Planning District are apportioned directly to the Governor of the State who in tum distributes the funds. In Wisconsin, Governor Lucey has delegated his recipient status to the Secretary of Transportation who in tum has designated the City of Kenosha as a recipient agency of applicable Section 5 monies. The Secretary of Transportation has indicated that he will review his delegation of recipient status on an annual basis. The funds have been allocated to urbanized areas of less than 200,000 population on the federal formula which included urbanized area population and population density. The total amount appropriated for the Section 5 formula grant program for the six fiscal years of 1975 to 1980 is $3.975 billion. The City of Kenosha has been allocated $288,881 for fiscal year 1975 and may expect about $505,544 annually over the next six years.
Besides Sections 3 and 5, there are other smaller, more specialized categories of aid available to the Kenosha Urban Planning District through UMT A. Section 6 of the Urban Mass Transportation Act provides funds for demonstration projects and the research and development associated with such projects. Intended to assist in the reduction of urban transportation needs, improvement of the mass transportation service, and the reduction of urban travel costs, these demonstration projects may be funded at up to 100 percent of the project cost. A notable amendment to this section was approved in 1974 authorizing $20 million over the next six fiscal years for fare-free mass transit demonstration projects. Intended for metropolitan areas with decaying central cities and marginal transit service, fare-free demonstration projects may receive Section 6 funds for up to 80 percent of capital and operating costs. Technical studies relating to the management, operations, capital requirements, or economic feasibility of transit services may receive federal funds under Section 9 of the Act. As noted earlier, the City of Kenosha received such a grant in 1969 to study the feasibility of public ownership. This transit development program effort is funded under a technical study grant from UMT A under the Commission's continuing transportation planning program. Finally, Section 16 provides for capital grants to equip a transit system to meet the transportation needs of the elderly and handicapped. Under this program, UMTA may provide up to 80 percent of capital costs but no operating assistance.
The second major area of federal legislation that assists mass transportation is the Federal Aid Highway Act. Originally intended as a segregated fund for highway use only, the Highway Trust Fund has been a potential source of transit assistance since enactment of the Federal Aid Highway Act of 1970. This Act allowed for the funding of mass transit support facilities on any of the federal aid systems. Its funding objectives include the construction of exclusive or preferential bus lanes, highway traffic control devices, bus passenger loading areas and facilities including shelters, and fringe and transportation corridor parking facilities to serve bus and other public mass transportation passengers. The Federal Aid Highway Act of 1973 further expanded the availability and scope of transit assistance by allowing the use of federal aid urban system funds for the purchase of buses or capital improvements for fixed rail facilities. Unlike UMT A capital grants, this "urban system" assistance has a matching fund requirement of 70 percent federal share and 30 percent local share. Finally, the 1973 Act allows for the funding of transit demonstration projects in rural and small urban areas.
The availability of federal funds pursuant to both the Urban Mass Transportation Act and the Federal Aid Highway Act are constrained by a number of administrative regulations. The more important of these are:
so
1. No grants will be made unless the facilities and equipment proposed are a part of a program for the development of a unified or officially coordinated urban transportation system as part of the comprehensively planned development of the urban area.
2. All applications for Section 5 funds must be based upon a transit development program setting forth a staged, multiyear program of federally and nonfederally funded mass transportation improvements. The multiyear program must include an annual program of projects incorporating Section 5 funds.
3. When federal funds provide part of the cost of a project, the remaining local share must come from sources other than federal funds, except when specifically permitted by law.
4. All applications for Section 3 capital grant funds for assistance in annual or periodic bus replacement programs must describe, as an element of the project justification, the efforts made to use Section 5 funds and federal aid urban system funds to meet replacement needs.
5. All applicants for Section 5 funds must guarantee that current levels of nonfederal mass transportation funding will be maintained. That level must be equal to the average amount of state and local government funds and non fare box mass transportation revenues expended on the operation of mass transportation service during the two years preceding the application.
6. Mass transportation facilities receiving federal assistance must be planned and designed so that they meet the special needs of the elderly and handicapped. To be eligible for funding of projects, capital and operating, under Section 5, the transit system fare structure must be such that elderly and handicapped persons riding during nonpeak hours be charged no more than one-half the regular peak-hour adult cash fare.

7. Each project application must include a detailed statement on the environmental impact of the proposed project. Buses acquired with federal assistance must meet the emission standards under Section 202 of the Clean Air Act and Section 6 of the Noise Control Act and, whenever possible, must meet special criteria for low-emission vehicles and low-noise emission products. In addition, Section 5 projects must include an analysis of the potential effects on such factors as:
a) Air, noise, and water pollution
b) Destruction or disruption of manmade and natural resources, aesthetic values, community cohesion, and the availability of public facilities and services.
c) Adverse employment effects; tax and property value losses.
d) Injurious displacement of people, businesses, and farms.
e) Disruption of desirable community and regional growth.
8. All applicants for Section 5 funds must submit short-range, staged plans to conserve the use of energy and improve transit efficiency. No project for fiscal year 1977 will be approved without evidence of reasonable progress in the implementation of the staged plan.
9. All projects must provide fair and equitable arrangements for the protection of employees affected by federal assistance. This requirement includes a continuation of collective bargaining rights and preservation of existing rights, privileges, and benefits.
10. No federal assistance may be provided for any construction project unless an adequate housing relocation program is being conducted for any families displaced by the project. Federal assistance to defer relocation costs and the concomitant regulations are specified in the Uniform Relocation Assistance and Real Property Acquisition Policies Act of 1970.
11. All applications for federal assistance must certify that they have afforded an adequate opportunity for public hearings on each proposed project. For Section 5 projects, notice for the hearing must be given at least thirty days in advance and must inform the public of all significant economic, social, or environmental issues and invite the public to examine all project documents.
12. No federal assistance may be provided for the purchase of buses unless the applicant first agrees not to engage in charter bus operations in competition with private bus operators outside of the area where the applicant provides regularly scheduled service.2
13. No federal assistance may be provided for the purchase of buses unless the applicant agrees not to engage in school bus operations for the exclusive transportation of students and school personnel in competition with private school bus operators? This rule does not apply to the transportation of school children along with other passengers by regularly scheduled bus service at either full or reduced fares.
14. Beginning July 1, 1978, all accounting systems for all transit systems eligible for federal aid must conform to a uniform system of account and record keeping. This new system, entitled "Uniform Financial Accounting and Reporting Element" (FARE), is intended to facilitate a clear definition of the economics and operating conditions of transit systems in the interest of more efficient planning, administration, and operation.
STATE LEGISLATION3
Legislation enacted by the State of Wisconsin which affects urban mass transit operations falls into two general categories: provision of financial assistance to the state's urban mass transit systems and administrative regulations and controls governing the establishment and operation of transit authorities. Financial assistance includes indirect aid, principally in
2 UMTA is currently promulgating new standards which would permit charter bus and school bus operations by federally aided systems outside the regularly scheduled service area. Basically to engage in such operations the aided carrier would be required to charge a rate such that revenues equalled or exceeded costs as documented by a certification of costs and a cost allocation plan. A complete listing of the proposed regulations and requirements can be seen in the Federal Register, Volume 40, Number 115 (June 13, 1975).
3 Wisconsin Department of Transportation, Division of Planning; Wisconsin State Statutes; and Wisconsin Administrative Code, Rules of Public Service Commission, Chapters PSC 40 and PSC 41.
51
the form of tax relief, and direct aid in the form of operating subsidies and demonstration grants. The Wisconsin Statutes define the organizational alternatives for the public ownership or subsidy of the urban mass transit systems and the authority over routes, schedules and fares, which authority is vested with the Wisconsin Public Service Commission.
Indirect aid to urban mass transit systems in Wisconsin was introduced in 1955 on the basis of findings and recommendations of the 1954 Governor's Study Commission on Urban Mass Transit. The most significant of the 1955 measures is Section 71.18 of the Wisconsin Statutes which provides a special method for privately owned urban mass transit organizations to calculate their state income tax. To encourage urban bus systems to invest their profits in new capital facilities and stock, the formula provides that net income after payment of federal income taxes is taxed by the state on the following basis:
a. An amount equivalent to 8 percent of the depreciated cost of carrier operating property is exempt from the tax; and
b. The remaining portion of the net income is taxed at a rate of 50 percent.
Other 1955 Wisconsin Statutes giving urban mass transportation systems tax relief are:
1. Section 76.54 which prohibits cities, villages, and towns from imposing a license tax on vehicles owned by urban transit companies.
2. Section 78.01(2)(d) which excludes vehicles engaged in urban mass transportation from the $0.07 per gallon gasoline tax imposed upon gasoline used in vehicle operation.
3. Section 78.40(2)(c) which excludes vehicles engaged in urban mass transportation from the $0.07 per gallon special fuel tax imposed upon the special fuel used in vehicle operation.
4. Section 85.01(4)(dm) which established an annual registration fee of only $1 for each vehicle engaged in urban mass transportation.
Direct financial aid for mass transit became available with passage on August 5, 1973, of the 1973 State Budget Act which created two transit aid programs to be administered by the Wisconsin Department of Transportation. The first, set forth in Section 85.05 of the Wisconsin Statutes, provided $5 million in general purpose revenue funds during the 1973-1975 biennium for operating assistance; the second, set forth in Section 85.06 of the Wisconsin Statutes, provided $2 million in general purpose revenue funds for planning and demonstration projects. Passage of the 1975 State Budget Act on July 31, 1975, continued funding for both programs by allocating $6.478 million for operating assistance and $521,200 for planning and demonstration projects during the 1975-1977 biennium.
Under the operating assistance program, local governments in urban areas having mass transit services on August 5, 1973, are eligible to be reimbursed by the State of Wisconsin for up to two-thirds of the operating deficit-not to include return on investment-incurred on their local transit system. Only those local units of government that will provide financial operating assistance to, or which will actually operate, an urban mass transit system are eligible applicants for state operating assistance. Other restrictions of the state operating assistance program include the following:
1. Projections of operating revenues and expenses must be based on an approved one-year "management plan" governing the operations of the participating transit system during the contract period.
2. The commitments of state funds and quarterly payments are based upon projections of operating revenues and operating expenses for a calendar year contract period.
3. Departmental audits of each participating transit system are required to determine the actual operating deficit of the system during the contract period.
4. If the recipient government is eligible for federal operating assistance, state payments are limited to two-thirds of the nonfederal share of operating deficits.
5. Contracts between the Wisconsin Department of Transportation and recipients may not exceed on year in duration.
Under the state mass transit planning and demonstration program, the Department of Transportation may fund projects designed to demonstrate the effect of improved mass transit service by: 1) reducing urban vehicular travel; 2) meeting total transportation needs at a minimum cost, and 3) reducing urban highway and parking facility requirements. Although state statutes permit the Department to fund 100 percent of eligible project costs, the present policy is to require at least a 10 percent local share. The demonstration phases of all projects are limited to one year or less, and the project sponsor is
52

responsible for continuation of successful projects beyond the demonstration period. Project continuation typically will be accomplished through integration of the demonstrated improvement into the area's basic transit system. The cost of continuing the demonstration improvement then will be incorporated into the total system operating revenue and expense calculations and, hence, be eligible for continued state reimbursement under the operating assistance program.
In addition to the provision of financial assistance, state legislation also provides for various rules and regulations concerning the establishment and operation of transit authorities. Presently Wisconsin Statutes define a number of organizational alternatives to local governmental units for operation of an urban mass transit system. These alternatives range from a city contract with a private transit operator to the establishment of a special metropolitan transit authority with powers of taxation. As noted earlier, the City of Kenosha upon public acquisition of the local bus system selected the option of a joint City Transit-Parking Commission pursuant to Sections 66.068, 66.079, and 66.943 of the Wisconsin Statutes. The specifics associated with this alternative structure have been discussed in an earlier section of this report dealing with the Kenosha Transit Commission.
Further regulation of urban mass transit systems is the responsibility of the Wisconsin Public Service Commission. The Wisconsin Administrative Code (PSC 8.05) requires that any public or private organization wishing to provide urban mass transit services must file an application with the Public Service Commission in order to receive a common carrier certificate. The application may be either for original authority or for the transfer of assignment from an existing authority. In the City of Kenosha, the latter situation applied; authority to operate the bus system was transferred from Pathfinder City Transit Lines to the Kenosha Transit Commission. Generally, before a common carrier certificate is assigned, a public hearing is held to assure that the assignee is fit, willing, and able to provide the service and that the assignment is in the public interest.
The Public Service Commission also regulates the fare structure, route configuration, and schedules of urban mass transit systems. No changes in the base fare, route structure, or schedule may be made without the approval or order of the Public Service Commission. Present procedure requires that a transit operator file with the Public Service Commission and with the clerk of the affected municipality at least five days in advance of the proposed change. Depending on the circumstances, the extent of the change, and the evidence presented at the time of the request, the Public Service Commission may approve the change, disapprove the change, or order a public hearing. The Public Service Commission does have the power of special approval, as the public interest may require, to authorize changes on less notice than required by the guidelines set above, especially when the affected municipality has no objections. Any action by the Public Service Commission on an informal basis is subject to reconsideration or public hearing if a proper complaint or protest is made. Finally, all urban mass transit systems are required to file annual and monthly reports with the Public Service Commission that inclUde such information as revenues, expenses, vehicle miles of travel, and vehicle hours of operation. To assure strict compliance with this function the Commission may also upon demand inspect the accounts and records of all common motor carriers.
LOCAL LEGISLATION
The most significant legislation affecting transit on the local level is found in Section 1.06, City Boards and Commissions, of the Code of General Ordinances for the City of Kenosha. This section establishes the Kenosha Transit Commission, defines its function, specifies the term and qualifications of Commissioners, and defines its powers. These specifics have been fully discussed in the earlier section dealing with the Transit Commission. The only other mention of transit in local ordinances is in Section 1.02(P) of the Code of General Ordinances which prohibits eating, drinking, or smoking on city buses.
LEGISLATIVE ANALYSIS
Publically owned and operated urban mass transit systems, like the current Kenosha system, have not been able to support their operations from passenger revenue alone. This is particularly true when fares are kept low for the general public and even lower for special groups such as the elderly or handicapped. To avoid lowering the levels of service, or causing undue financial burden on the City of Kenosha, it is essential to explore all possible sources of state or federal funding. As noted earlier, the City of Kenosha already has taken advantage of a number of federal funding sources including Sections 3 and 9 of the Urban Mass Transportation Act providing monies for capital improvements and a technical study. The City of Kenosha also is receiving assistance under the state operating assistance program. Aside from special programs, then, the only untapped source of general revenue is that operating assistance available under Section 5 of the Urban Mass Transportation Act, as amended. To become eligible for this program the City of Kenosha must fulfill a number of federal requirements. This transit development program is intended to meet all planning requirements in that later sections of this report will identify a five year program of projects including an environmental impact statement, an energy efficiency plan, and a program to deal with the needs of the handicapped and elderly. It must be emphasized that the City of Kenosha cannot expect to reduce its level of transit spending through the receipt of Section 5 funds. The "maintenance of effort" clause in the UMT A Act requires that the current level of local spending be maintained. Finally, to become eligible for federal operating assistance the City of Kenosha must conform to the federally promulgated uniform accounting system, FARE.
53
With regard to State funding and regulation, the City of Kenosha is already complying with all requirements. It should be noted, however, that a number of proposed changes in state programs are currently pending. Included in the proposals is a substantial increase in transit assistance and transfer of regulatory responsibility from the Public Service Commission to the Department of Transportation. It is, therefore, incumbent upon the City of Kenosha to maintain close relations with state officials and agencies in the event of changes in requirements.
Finally, with regard to local legislation, there are several specific measures including designation of bus loading zones or safety inspection requirements which, if enacted, could serve to improve local bus operations. Specific recommendations to this purpose will be developed in later chapters of this report.
SUMMARY
A working knowledge of existing transit legislation and regulation is essential for program planning and for managing an urpan mass transit system. Currently federal legislation concerning transit is embodied in two major pieces of legislation and their amendments: the Urban Mass Transportation Act and the Federal Aid Highway Act. Assuming that all federal requirements are met, the Urban Mass Transportation Act provides federal funding to urban mass transit systems of 80 percent of capital improvement costs, 50 percent of operating deficits, 80 percent of technical study costs, 80 percent of capital costs for projects aimed at the elderly and handicapped, and up to 100 percent of demonstration project costs. The Federal Aid Highway Act provides capital improvement assistance for certain specific transit and transit related purposes up to 70 percent of project costs.
The State of Wisconsin currently provides tax relief, demonstration project assistance, and operating assistance to urban mass transit systems meeting state requirements. The operating assistance program provides funds to cover up to twothirds of the nonfederal share of the operating deficit. Regulation of urban mass transit systems is the responsibility of the Public Service Commission which must approve any changes in routes, schedules, or fares.
Local legislation pertaining to transit consists primarily of the establishment of the Kenosha Transit Commission pursuant to state statutes defining organizational alternatives for public ownership and operation of an urban mass transit system.
54

Chapter VI
EVALUATION OF EXISTING SYSTEMS
INTRODUCTION
In Chapter I of this report it was indicated that a transit development program involved a seven-step planning process. The fourth step of this process, proceeding logically from the inventory findings presented in the past four chapters, is an evaluation of the existing transit system. Such an analysis should use objectives and standards expressly designed for transit evaluation. These objectives and standards as adopted by the Technical Coordinating and Advisory Committee for the Kenosha transit development planning process constitute the first section of this chapter.
Evaluation of the local transit system will cover management structure and personnel, levels of service, capital equipment and maintenance, marketing and public relations, and financial status. In addition, an analysis of other transit services such as commuter rail will be presented with particular emphasis given to coordination with the local bus system. Finally, a discussion of alternative patterns for future transit system development will be presented.
OBJECTIVES AND STANDARDS
Planning is a rational process for formulating and meeting objectives. Because of the values inherent in the formulation of objectives, soundly conceived development objectives should incorporate the combined knowledge of many people who are informed about the study area and its problems and who, through their elective or appointive positions, are legally responsible for this important task. The following objectives and standards used in the conduct of the Kenosha transit development program have been fully evaluated and unanimously approved by the Technical Coordinating and Advisory Committee, composed of elected and appointed public officials and of leading citizens of the Kenosha Urban Planning District. These adopted objectives and standards are consistent with others formulated under other regional and local planning programs.
Since the terms "objectives" and "standards" are subject to a wide range of interpretations, the following definitions have been established to provide a common frame of reference within the Kenosha transit planning effort:
OBJECTIVE: a goal or end toward the attainment of which plans and policies are directed.
STANDARD: a criterion used as a basis of comparison to determine the adequacy of plan proposals to attain objectives.
Presented in Table 29 is a complete list of objectives and standards adopted by the Advisory Committee for the transit development program study.
Table 29
OBJECTIVES AND STANDARDS FOR KENOSHA TRANSIT DEVELOPMENT PLANNING STUDY
OBJECTIVE NO.1
Transit facilities should be located and coordinated so as to effectively serve the existing land use pattern and promote the implementation of adopted land use plans.
STANDARDS
1. Intraregional mass transit facilities should be provided as warranteda to connect noncontiguous urban development with the urban center of an urban area, and within urbanized areas to serveb all residential neighborhoods regardless of the race, color, culture, or national origin of those individuals residing in the neighborhoods, and to connect such neighborhoods to the following land areas:
a. Transportation terminal facilities, including interregional and intraregional primary and secondary transit service loading and unloading points.
b. Regional, community, and neighborhood shopping areas.
55

c. Industrial centers.c
d. Regional, community, and neighborhood recreational sites, including special recreational use areas such as zoological and botanical gardens, fairgrounds, arenas, and stadiums.
e. Institutions such as universities, colleges, vocational and technical schools, secondary schools, community libraries, hospitals, rehabilitation and medical centers, and seats of state, county, and local governments.
f. Senior citizen centers.
g. Cultural and religious centers.
2. Circulation-distribution local mass transit service should be provided as warranted within an urban center or other extensive land use complex to distribute passengers from automobiles or other mass transit facilities throughout the land use complex to be served.
3. Urban residential land shall be considered as served by intraregional mass transit when such land is within the distance of the various types of intraregional mass transit service as set forth in the following:
Maximum Distance
Service Type Walking Driving
Primary .. __ ............. 1/2 mile 1 1/2 miles Secondary ............... 1/2 mile 1 1/2 miles Tertiary ................. 1/4 mile 1 1/2 miles
4. The total amount of land used for mass transit and mass transit terminal facilities should be minimized.
OBJECTIVE NO_ 2
Transit facilities should promote total transportation flexibility allowing mass transit service to be readily adapted to changes in the requirements of, or the balance between, personalized and mass transportation and to be adapted to changes in mass transit technology.
STANDARDS
1. Intraregional mass transit facilities should be located, designed, and scheduled so as readily to permit the extension of service to developing residential and employment areas.
2. Interregional and intraregional mass transit facilities should be adaptable to serving a variety of transportation functions, such as carrying small packages, in addition to the movement of people.
OBJECTIVE NO.3
Transit facilities should provide a means of access to areas of employment and essential service for all segments of the population, but especially for low-to-middle income families, the elderly and handicapped,a and others who do not or cannot operate an automobile.
STANDARDS
1. Intraregional mass transportation systems should provide levels of service commensurate with potential demand. Service should be such that during peak and midday periods all residents of each subarea of the urban area, regardless of race or income, are within:
a. 30 minutes overall transit travel time of at least 50 percent of the employment opportunities in the urban area.
b. 35 minutes overall transit travel time of a regional retail shopping and service center.
c. 30 minutes overall transit time of a hospital and/or medical or public health center.
d. 40 minutes overall transit time of a public outdoor regional or community recreational area.
e. 40 minutes overall transit time of vocational and higher educational centers.
2. Urban mass transit fixed routes should be provided at intervals of no more than one-half mile in high density residential areas.e
S6
3. Primary and secondary intraregional mass transit service should be extended as warranted to perform a collection and distribution function in order to maximize the convenience of the mass transit service.
4. Demand·responsive mass transit service may be providedf as warranteda to low density urban and rural areas or other selected areas as a sup' plement or complement to fixed route mass transit service and as a specialized service to improve the mobility of elderly and handicapped.
5. Adequate capacity and a sufficiently high level of geometric design and traffic management of transportation facilities should be provided to achieve the following overall travel speeds in miles per hour based on average weekday conditions for the mass transit component of the trans· portation system:
Area
Interregional Mass Transit Central Business District Urban
Primary (Bus) ............ 10-20 mph 40-50 mph Secondary .............. 10-20 mph 20-35 mph Tertiary ................ 5-15 mph 10-20 mph
OBJECTIVE NO.4
Transit facilities should be located and designed to provide user convenience, comfort, and safety, thereby promoting transit utilization.
1. , ntraregional mass transit facilities should be located and desiglieCl to provide adequate capacity to meet existing and projected travel demand between the various land uses. The average maximum load factorg should not exceed the following:
Average Maximum Load Factor
Service Type Peak Period Ten Minute Poi nth Off·Peak Period
Primary (Rapid Bus) ........ 1.00 1.00 1.00 Secondary (Bus) ........... 1.00 1.00 1.00 Tertiary ................. 1.25 1.00 1.00
2. Operating headways for intraregional fixed route tertiary mass transit services within urban areas shall be designed to provide service at headways capable of accommodating passenger demand at or below recommended load standards but shall not exceed 30 minutes during week· day peak periods nor 60 minutes during other time periods.
3. The transit system should be designed and operated to achieve, at a minimum, the following percent "on time"i schedule adherence.
Adherence to Minimum Acceptable Schedule by
Percent of Total Time
Transit Service Level Off'Peak Period Peak Period
Headways less than 10 minutes .. , ............ 85 75 Headways between 10 and 30 minutes ........... 95 85 Headways grea~er than 20 minutes ............. 95 95 Special Service! .......................... 95 95
4. Intraregional fixed·route mass transit stops within urban areas should be located as follows:
Service Type Location of Stops
Primary ................ At terminal areas and one mile or more on line·haul sections.
Secondary .............. At terminal areas, intersections with other mass transit routes, and major traffic generators.
Tertiary ................ 600 to 1 ,200 feet apart.
57

5. Urban mass transit routes should be located sufficiently near concentrations of demand in the central business districts so that 90 percent of the urban mass transit users need walk no more than one block (600 feetl.
6. Mass transit routes should be direct in alignment with a minimum number of turns and arranged to minimize transfers and duplication of service.
7. Parking should be provided at park-and-ride mass transit terminals to accommodate the total parking demand generated by trips which change from other vehicles to mass transit modes at such terminals.
8. Overall transit travel time on circulation·distribution urban mass transit facilities should not exceed 10 minutes.
9. To provide protection from the weather, bus passenger shelters of an attractive design shall be constructed at all park-ride terminals and other primary transit service load points and shall be constructedk at major secondary and tertiary service loading areas.
10. Paved passenger loading areas shall be provided at all fixed route transit loading and unloading points, and all such points shall be marked by attractive bus stop signs.
". Each urban mass transit vehicle should be retired and replaced at the end of its maximum service life; and, in this respect, maximum service life for buses with a seating capacity of over 25 passengers and powered by a diesel engine shall generally be considered to average:
a. 12 years for buses averaging more than 50,000 miles per year.
b. 15 years for buses averaging less than 50,000 miles per year.
Maximum service life for buses with a seating capacity of less than 25 passengers, powered by a gasoline engine, and averaging more than 20,000 miles per year shall generally be considered to average six years.
12. Preventive rnaintenance program standards should be established to achieve a minimum of 6,000 miles without an in-service breakdown.
OBJECTIVE NO.5
Mass transit facilities should be located and designed for the urban environment so as to minimize any harmful effects they may have on the surrounding physical environment and to assist in improvement of the design of the total urban environment.
STANDARDS
1. All mass transit vehicles should be washed and cleaned daily and be painted in an aesthetically pleasing manner.
2. All mass transit faCilities should be located and designed so as to create a minimum of noise disturbance.
3. Air pollution produced by the mass transit system should be minimized and emissions from buses must meet U. S. Environmental Protection Agency standards.
4. All mass transit facilities should be located so as to avoid destruction of visually pleasing buildings, structures, and natural features, and to avoid interferences with vistas to such features.
OBJECTIVE NO.6
The transit system should be economical and efficient, meeting all other objectives at the lowest possible costs.
STANDARDS
1. The sum of the mass transit facilities operating and capital investments costs should be minimized over the plan design period. This includes consideration of the following factors:
a. Cost of vehicles.
b. Cost of yards and shops.
c. Operating costs.
2. The amount of energy utilized in operating the transportation system, particularly the petroleum-based fuels, should be minimized.
58

a Maintenance of existing or provision of new mass transit service may be considered warranted under any of the following conditions:
1. The mass transit service produces operating revenues that exceed operating costs. Operating costs used in the analysis shall include drivers' wages and fringe benefits; and fuel, lubrication, and maintenance costs.
2. The mass transit service produces operating revenues that equal at least 50 percent of the operating cost. In this case, operating revenues used in the analysis shall be based upon an equivalent full base fare per passenger rather than attempting to account for any reduced fare programs for special groups. The operating deficit must be paid by the community or special group receiving the mass transit service. The community involved could be an individual local unit of government or an entire metropolitan area.
3. The mass transit service provides a significant contribution to the revenue of connecting mass transit service or to the total mass transit system, or provides improved total system continuity, system efficiency, and passenger convenience.
b Intraregional mass transit facilities shall be considered to serve urban land uses when a mass transit route or terminal is within the walking or driving distances identified in Objective Number 1, Standard 3.
c An industrial center shall be defined as an existing or officially designated concentration of manufacturing, wholesaling, and related-use establishments providing employment for over 100 persons.
d The elderly shall be defined as those persons age 65 or older. The handicapped shall be defined as any individual who, by reason of illness, injury, age, congenital malfunction, or other permanent or temporary incapacity or disability, including those who are nonambulatory wheelchair-bound and those with semi ambulatory capabilities, is unable without special facilities or special planning or design to utilize mass transit facilities.
e High density residential development is defined as development at a gross density ranging from 10,000 to 25,000 persons per square mile (4.8 to 11.8 dwelling units per gross acre).
f Provision of demand·responsive mass transit service may be applicable under the following general conditions:
• Urban area population density at least 2,000 to 6,000 persons per square mile.
• Service area population between 4,000 and 20,000.
• Passenger demand between 20 and 60 per square mile per hour. Lesser demands can be better served by taxi and greater demands can be better served by fixed route service when street systems and topography permit.
• High proportion of potential riders in the age groups between 5 and 18 and over 65.
• Transit travel times to the major trip generators, such as shopping centers, employment centers, schools and transit stations from within the service area range between 10 and 20 minutes.
g The average maximum load factor is calculated by dividing the number of patrons passing the maximum load point of a route by the number of seats past that point, during the operating period.
h The ten-minute point is located ten minutes travel time from the maximum loading point on a route. This means that passengers should not have to stand on-board the mass transit vehicle for longer than ten minutes.
i "On-time" is defined as schedule adherence within the range of zero minutes early and three minutes late.
j Tripper, demand-responsive and similar services.
k Construction of bus passenger shelters at major secondary and tertiary mass transit loading points may follow the following priority schedule:
Number of Boarding Peak Period Transit Service Level Passengers-A verage Weekday Priority
All Service Levels ...................... 300 or more 1 Headways greater than 15 minutes . . . . . . . . . . . 150-299 2
100 - 149 3 Headways between 5 and 15 minutes . . . . . . . . . 200-299 2
100 - 199 3 Headways less than 5 minutes . ............. 100 - 199 4
Source: SEWRPC.
59

While the standards identified in Table 29 are used to guide. design of mass transit system service and facility improvements and to assist in measuring the adequacy of proposed improvements, several overriding considerations must be recognized in the application of the planning standards in preparation of the transit development program. First, alternative transit plans must be evaluated for cost. Such an analysis may show that attainment of one or more of the standards is beyond the economic capability of the community and, therefore, the standards cannot be met and must either be reduced or eliminated. Second, it is unlikely that anyone plan proposal 'will meet all the standards completely; the extent to which each standard is met, exceeded, or violated must serve as a measure of the ability of each alternative plan proposal to achieve the specific objectives which a given standard complements. Finally, certain objectives and standards may be in conflict, requiring resolution through compromise. Meaningful alternative plan evaluation can only take place through a comprehensive assessment of each of the alternative plans against all the development standards.
MANAGEMENT STRUCTURE AND PERSONNEL
Dynamic management is essential for successful operation of an urban transit system. A continual effort to improve management techniques and efficiency is necessary, especially in a public operation where the profit motive is lacking.
As noted earlier, management of the Kenosha local transit system is the cooperative responsibility of the Kenosha Transit Commission and the City Department of Transportation. The Commission, composed essentially of citizens, is primarily responsible for policy determination. Most of the responsibility for the planning and operation of the transit system, in accordance with the policies determined by the Commission, rests with the Kenosha Department of Transportation.
Although the overall structure has proven successful, the City Department of Transportation does not have sufficient staff to perform all the necessary functions involved in transit systems management. The vast majority of staff time is devoted to day-to-day operations of the bus system, such as dispatching, scheduling, and answering calls for route information. With the added responsibilities of airport, harbor, and parking facilities management, little time is left for any longerterm transit management or planning tasks. These tasks include updating of transit development plans, formulation and conduct of a unified marketing program, planning and implementation of special projects for the elderly and handicapped, conduct and analysis of ridership surveys, preparation of grant applications, preparation of federal and state reporting forms, forecasting of costs and revenues to facilitate budget preparation, and coordination of programs with related departments such as public works or traffic engineering. If these essential tasks are not done, no amount of hardware can provide an adequate level of service at a reasonable public expense. Thus need exists for an additional staff member in the Department of Transportation who is capable of fulfilling these functions.
Otherwise, there are no other obvious deficiencies in either the management structure or the level of staffing for present levels of service. If service is to be increased, however, additional bus operators and perhaps maintenance personnel will be needed in the future.
LEVELS OF SERVICE
Although experience with the new routes and schedules is limited, certain evaluative measures can be applied to test the adequacy of the levels of service. It is already apparent that the new route structure and service levels instituted on August 11, 1975, are superior to the system of six looping routes which was replaced. The new routes are more straightforward and efficient in design. They cover more miles of streets and highways and have resulted in greater ridership than the old system.
Basically there are two measures of the level of transit route coverage: the length of streets and highways provided with direct service and the extent of the area served by the routes. In terms of streets covered, as shown on Map 18, the major arterials in the City of Kenosha are well served by bus lines. There are, however, notable exceptions including: Washington Road (STH 142), Sheridan Road, 75th Street, 80th Street, and 39th Avenue. The worst of these definitely is Washington Road which had service under the old system but does not under the new system. The others all have partial service but require additional service to be considered adequately covered.
According to the adopted standard set forth earlier in this chapter, a land use is considered to be served by an urban mass transit system if it is within a quarter-mile walking distance of a transit line. Using this criterion, the effective service area of the existing regular city route structure can be delineated as shown on Map 18. As can be seen, the only important areas within the City of Kenosha which are not inside the quarter-mile service area are a small section just east of Anderson Park, a section in southern Kenosha centered at the intersection of 80th Street and 36th Avenue, a section in central Kenosha centered at the intersection of 63rd Street and 37th Avenue, and the northwestern comer of the City of Kenosha near the intersection of Washington Road and 47th Avenue. Although further analysis indicates that no major travel generators are located in these areas, they should be afforded high priority for route modification and expansion.
60

Given a criterion for determining areas served, it is possible to expand the analysis of the level of service. Specifically an examination will be made of service to priority population groups, service to major trip generators, and service provided relative to existing travel habits and patterns.
Service to Priority Population Groups In Chapter III segments of the popUlation were identified whose dependence on and use of mass transit service are greater than that of the population as a whole. These groups included school children, the elderly, low income families, minorities, the handicapped, and those who do not have access to an automobile. Based upon analysis of the locations of these priority population groups, a high priority transit service area (shown on Map 9) was identified, consisting primarily of the older central city areas of the Kenosha Urban Planning District. Although the priority area represents less than 10 percent of the total land area of the Kenosha Urban Planning District and 32 percent of its population, over 41 percent of the elderly, 57 percent of low income persons, 67 percent of minorities, and 68 percent of households without automobiles live in this area. An examination of transit service to this high priority area indicates that all residential areas are within the desired quarter-mile of a transit route. In addition, almost 40 percent of the route miles of service are contained within the priority service area. It may be concluded, then, that the residents of the high priority service area are adequately served by transit.
As noted in Chapter III, however, the residential concentrations of the handicapped could not be explicitly ascertained. Instead, the facilities most often used by the handicapped for residential, health care, and educational purposes were identified. Of the twenty-one locations identified in Table 7, 17 are within the quarter-mile service area. In terms. of the severely handicapped, however, only direct service can .really be considered adequate. Of the 21 locations, only 11, or just over half, are directly served by a transit route. Due to the dispersion of facilities for the handicapped, then, the service of the regular transit system must be considered less than adequate. In addition, many handicapped persons are physically unable to ride the regularly equipped buses. Accordingly, special plans must be formulated utilizing the adopted objectives and standards so as to extend transit service to a greater number of the handicapped through the provision of specially equipped buses or vans. The alternative and recommended methods of correcting this deficiency will be presented in the next chapter.
Although the elderly were included in delineation of the priority transit service area, Chapter III also contained further identification of those residential and health care facilities used by the elderly. Of the 12 facilities identified in Table 6, all are within the quarter-mile service area, while 10 receive direct service. In accordance with the adopted objectives and standards, however, specialized transportation service should be available to those elderly unable to use the regular city system either because they do not live close enough to a bus line or because they are physically unable to board or ride a regularly equipped bus. However, the locations and even the number of these elderly persons cannot presently be determined. Although a general need for special service to the elderly and handicapped can be identified, sufficient data are not available to formulate the most cost effective means of meeting this need. Thus the most urgent need is data collection to identify the specific needs of the elderly and handicapped to facilitate development of an effective service to meet these needs.
Service to Major Trip Generators In Chapter III of this report, the major trip generators in the Kenosha Urban Planning District were identified. They included employment centers, shopping areas, educational institutions, public and medical institutions, and recreational areas.
Of the 23 major employment centers identified in Table 8 all but one, the Ladish Company plant, are located within the quarter-mile service area of the Kenosha Transit Commission. The Ladish Company, which recently moved to its new location in the Town of Pleasant Prairie, currently is negotiating with the Kenosha Transit Commission for special extension of a bus line to connect its new plant with the parking lot of the old company location in the City of Kenosha, thus providing a park-and-ride facility for its employees. Of the 22 remaining employment centers, 21 are directly served by transit. The employment center located within the quarter-mile service area but not directly served is Arneson Foundry. Thus, it may be concluded that the major employment centers in the Kenosha Urban Planning District are well served by transit.
All eleven of the major shopping areas identified in Table 9 are not only within the quarter-mile service area but are directly served by a bus line. At a shopping center the bus usually loads and discharges within the shopping center complex. The major shopping areas, then, also are well served by transit.
Of the 17 educational institutions identified in Table 10, 14 are directly served by the regular city bus routes. The three not directly served-McKinley Junior High, Our Lady of Mt. Carmel elementary school, and St. Mary's elementary schoolare, however, located within the quarter-mile service area. In addition, the school tripper routes provide service expressly designed to accommodate school children. The service to major educational institutions is thus adequate.
61

Of the 14 public and medical institutions identified in Table 11, all but two are located within the quarter-mile service area and are directly served by a bus line. The two locations not served are the Town Halls of the Towns of Somers and Pleasant Prairie. As most of the other locations are near the central business district, the majority of public and medical institutions is served by two or more routes.
The final category of major generators consists of recreational facilities. Of the 19 major recreational areas identified in Table 12, 12 are within the quarter-mile service area. Of those 12, six are directly served by a bus route. Although not exceptional, the transit service to recreational areas is adequate.
A final evaluative measure of service to major generators is found in Objective 3. According to the adopted standards, all residents of the Kenosha urban area should be within 30 minutes overall transit travel time of at least 50 percent of the employment opportunities, 35 minutes of a major retail or shopping center, 30 minutes of a hospital or medical center, 40 minutes of a public outdoor recreational area, and 40 minutes of a vocational or higher educational center. Analysis indicates that this standard is generally met for the peak periods. During midday periods when the operating heMwa:ys are one hour, however, the standard is rarely met. The problem involves the long wait time and inconvenient transfers\,inherent in a system with long head ways and transfer coordinated only at a single point. The route coverage is adequate but the travel time standards can only be met with a reasonable reduction in headways.
Service Relative to Existing Travel Habits and Patterns The preceding sections have evaluated the transit service to points; that is, the residential locations of priority population groups and the locations of major generators. To complete the analysis it is necessary to examine the service relative to existing travel patterns as documented in Chapter III.
An analysis of travel patterns indicates that the greatest demand for service is to the Central Business District (CBD). The three zones comprising the central business district, while representing less than one percent of the land. area within the transit service area, account for over 7 percent of total person attractions. Only one other zone, in fact, exceeds the number of attractions of any of the three central business district zones. The fact that all buses go downtown means that service to this particular travel pattern is exceptionally good. There are other substantial patterns of travel demand that suffer, however, from this total orientation to the CBD. The rationale behind this orientation is straightforward. Due to the predominant one hour head ways, coordinating transfers is very difficult. Even with the optimal solution, there will be certain transfer points which have nearly an hour of transfer time. The simplest solution is to have all routes meet simultaneously in the CBD. Assuming the users are not concerned with travel time, this radial route design allows for complete access. The time involved with nonCBD travel, however, is prohibitive to crosstown ridership.
A case in point is the main American Motors Corporation plant which has been identified as a significant attractor of work trips. Superficially, it would appear that service to the plant is good through the CBD transfer. Because the first shift begins at 6:30 a.m., however, only the northern branch of Route 2 and the southern branches of Routes 3 and 4 are of any value to the worker who cannot afford to be late. Although the major generator survey indicated that a significant concentration of American Motor Company employees lived in the northern section of the City of Kenosha, these people are excluded from transit use by configuration of the present system. Those workers identified by the City of Kenosha survey who live in the south side and work in the north side of Kenosha are similarly discouraged due to the time it takes to enter and leave the CBD.
A need exists for the incorporation of one or more crosstown routes which completely avoid the central business district. In practical terms, the only way this can be accomplished is to sufficiently reduce headways so that coordinated transfers are possible. In addition, the proper design of a crosstown route requires current and detailed information on the travel habits and patterns of transit ridership. Unfortunately, this data does not now exist. Once again, a data collection effort is essential to solution of the identified deficiencies.
CAPITAL EQUIPMENT AND MAINTENANCE
As documented in Chapter IV, the Kenosha Transit Commission recently acquired a number of large capital items including new buses, a new storage and maintenance garage, and a supervisors' automobile. Consequently, at the present level of service, there are no major capital deficiencies. If service levels are significantly increased, however, the Kenosha Transit Commission may need more buses within five years. Based upon the deficiencies identified in the preceding section on levels of service, the next chapter will contain ,recommendations for the number and type of buses needed to meet the requirements of route addition and expansion.
In the immediate Situation, there are two deficiencies which require relatively minor capital investments. The first of these involves bus access to the new garage and maintenance facility. Presently the buses enter the area by the same driveway as all the other city vehicles. This requires that the buses weave in and out of the other city vehicles and go through a parking lot before reaching the transit garage. At certain times of day this results in traffic congestion, sometimes threatening the schedule adherence of the buses. A need exists, then, for another driveway access with exclusive bus use.
62

The second deficiency involves the comfort associated with transit use. Presently, with the exception of the CBD, no passenger shelters are available for waiting transit patrons. Without any shelter even a short wait during inclement weather is extremely discouraging to transit ridership. It is, therefore, imperative that comfortable, attractive transit shelters be provided at a number of major loading and transfer points outside of the central business district. The exact locations will be specified in the recommendations of the next chapter.
MARKETING AND PUBLIC RELATIONS
The value of marketing cannot be overemphasized in promoting transit use. Most people make the choice of auto or transit based upon the costs they perceive for each mode. Unfortunately, the perceived costs for the auto are usually much lower than the real costs, and the costs perceived for transit, especially in terms of discomfort and inconvenience, are much greater than the real costs. As a result, transit comes out very badly in the comparison. It is the role of marketing to change the prevailing negative attitude toward transit use and to convince people at least to try the bus service. It should be possible to recapture the two million yearly ridership levels of the early 1960s if people are informed that the deterioration of transit service in Kenosha has ended and that improvements have been and will continue to be made.
The most important goal of marketing is to acquaint people with the bus operations. A person who has never ridden the bus and does not know the system may be hesitant to try it. For this reason the "free fare day" held by the Transit Commission on June 14, 1975, was so beneficial; it was an open invitation expressly for those who had never ridden the bus. Programs like this, designed to acquaint people with all the facets of transit use, should be continued.
At this time the marketing program of the Kenosha Transit Commission consists primarily of newspaper advertisements in the local paper. Although beneficial, this is not enough. There must be a continuous and unified campaign of route and schedule information dissemination and of promotion of transit advantages. Also, it often is helpful to improve recognition of the transit system by adopting some sort of symbol or logo which appears on everything relating to transit. It may be desirable to hire a marketing expert who can help the system management formulate a program of marketing and advertisement. Specific recommendations concerning this very crucial function will be presented in the next chapter.
FINANCIAL STATUS
The Kenosha Transit Commission, like most public transit operations, is constantly facing financial problems in attempts to expand or even maintain service. The findings of the financial inventory set forth in Chapter IV and Appendix B indicate that the Kenosha transit operation is not self-supporting and that public subsidies are required. With a constant fare, even greatly increased ridership cannot offset the rapid increases in operating and capital expenses. Any alternative plans must, therefore, be carefully scrutinized for financial feasibility before adoption and implementation.
As major capital investments are not envisioned for the next five years, the most important figure in the financial report of the Kenosha Transit Commission is the operating deficit. This deficit has increased from about $25,000 in 1971, to about $196,000 in 1974. The operating deficit for 1975 is expected to further increase to over $342,000. As noted in Chapter V, the sources of nonlocal operating assistance include Section 5 funds from UMT A which will pay one-half of the operating deficit and the State operating assistance program which will pay for two-thirds of the remaining deficit after federal funds. This means that the City of Kenosha must contribute annually at least one-sixth of the operating deficit. For the projected 1975 deficit this would amount to just over $44,000. As this is $20,000 less than the City contributed in 1974, it appears that at current levels of service, the transit operation should not place an undue burden on the City of Kenosha. Even with a reasonable increase in levels of service, the local share of the operating deficit should be well within the resources of'the City of Kenosha. It must be noted, however, that uncertainty now cloaks the future of the State's operating assistance program. The financial analysis based upon the recommended transit improvements of the next chapter will include contingency plans should this program end.
OTHER TRANSIT SERVICES
Aside from the Kenosha Transit Commission, mass transit service in the Kenosha Planning District is offered by: Wisconsin Coach Lines, Inc., and Greyhound Lines West, both providing intercity bus service; the Chicago and Northwestern Transportation Company, providing commuter rail service to Chicago; and Jelco Buses, Inc., providing rural school and charter bus services. As all four of these are private enterprises and three; excepting Jelco, are not based in Kenosha, it is beyond the scope of this report to analyze their internal operations. The primary emphasis will be on coordination of operations with the local system.
As noted earlier, the two intercity bus companies share common terminal facilities at 2105 Roosevelt Road and are thus directly served by Kenosha Transit Commission Routes 1 and 2. The Chicago and Northwestern Depot is located at 5410 13th Avenue and is directly served by Route 3. The bus does not always pull into the depot due to the difficulty in access. As noted on the public bus schedule, however, and as is usually mentioned by the operator on this route, the bus
63
will enter the depot area if a specific request is made. Although no particular effort to do so has been made, the schedules of these three interurban services and that of the local system are reasonably coordinated. Some of the earlier and later interurban runs arrive and leave when the local system is not operating. At other times, however, the time involved in transferring from one system to another is reasonably minor.
With regard to Jelco Buses, Inc., the major question is not one of coordination but one of whether the Kenosha Transit Commission should expand its transit operations to serve all school children living within the Kenosha Unified School District. The urban transit service provided by the Kenosha Transit Commission, supplemented by school trippers, provides transportation services for school children living within the City of Kenosha. The Kenosha Unified School District, under an agreement with the Kenosha Transit Commission, pays the Commission the full fare of those children living two or more miles from the school and thus fulfills the District's statutory responsibility of providing school bus service at no cost to all pupils living two or more miles beyond the school. Jelco Buses, Inc., as described in Chapter IV, provides school bus services to the children living in areas of the school district beyond the City of Kenosha and provides specialized transportation for handicapped children throughout the district with a fleet of 64 regular school and 42 specially equipped buses. As noted in Chapter V, recently promulgated federal Urban Mass Transportation Administration regulations would permit the Kenosha Transit Commission to bid for the contract to provide school bus service beyond the City. The federal requirements associated with such action are quite strict to assure equity in this area of private versus public enterprise in the provision of public service. Since the Kenosha Transit Commission would need to have on hand a bus fleet and driver capability to provide the total school bus service, the quest for expanded school bus service beyond the City of Kenosha does not appear a feasible course of action in this stage of transit service development within the existing Kenosha transit service area. As the provision of urban transit service matures, negotiations between the Kenosha Transit Commission and the Kenosha Unified School District for offering full transportation services may become both feasible and desirable.
ALTERNATIVES
As noted in Chapter I of this report, the plan design phase of a transit development planning effort includes the postulation and evaluation of a number of feasible transit alternatives. Although a complete description and evaluation of all alternatives considered will not be presented, it must be noted that such an investigation of alternatives was an integral part of the Kenosha transit development planning effort. The recommended plan, set forth in the next chapter, represents a synthesis of the most desirable elements of those alternatives investigated. The high level of local involvement in development of the recommended transit improvement program further assures its acceptability and precludes the need for presenting the rejected alternatives in their entirety.
Initially, the scope of feasible alternatives was relatively small in light of existing conditions in the City of Kenosha. This is true because of the decisions and commitments already made based upon previous planning efforts. The management structure, for example, was the major topic of the Simpson and Curtin study in 1971. The recommended structure subsequently was adopted by the Kenosha Common Council and has adequately served the transit needs of the City of Kenosha.
The interim transit development program prepared in 1974 also established the general level of transit service desired in the City of Kenosha. Within the context of this study, alternatives of no and minimal service were fully evaluated and rejected by the City of Kenosha. The desirability of these alternatives were reinvestigated during the present study, and the situation was found unchanged. Since the policymakers of the City of Kenosha are still in favor of significant improvements in the level of transit service, the alternative of continuing the status quo was investigated and rejected.
Finally, the five routes established in August 1975 in accordance with recommendations contained in the interim transit development program and refined in response to public hearings and further technical analysis should not now be significantly changed. The primary reason is very practical: Transit riders are creatures of habit, and to radically change this system so soon would have a negative impact on the image of transit in Kenosha and on the ridership. Fortunately, the evaluation has shown the five routes to be reasonable. Initial ridership response has been excellent. This does not mean that minor modifications cannot be made or routes added. Nor does it preclude a major route restructuring after a reasonable period of experience-at least a year-with the current structure. It must be reiterated, however, that additional data, such as a current ridership survey, should be collected before attempting a major change in route configuration.
The foremost alternatives facing the City of Kenosha involve the extent of headway reduction. A wide range of alternative approaches to increasing the frequency of service was evaluated primarily in terms of their financial feasibility. The provision of fifteen minute head ways throughout the operating day is very desirable, for example, from the standpoint of the levels of service and ease of transfers. An analysis of this alternative showed, however, that it would effectively require doubling the bus fleet and nearly quadrupling the driver's hours. At the present time this alternative appears beyond the financial capabilities of the City of Kenosha. The alternative of thirty minute head ways throughout the operating day also was investigated. Although financially feasible, it was determined that this alternative did not provide an adequate level of service during peak periods. The recommendations of the next chapter are thus the result of a thorough investigation of alternatives from which the course of action best suited to the needs, desires, and abilities of the Kenosha urban area was chosen.
64

SUMMARY
The evaluation of existing transit systems was an essential step in preparation of the Kenosha transit development program. This evaluation was based on objectives and standards formulated and adopted by the Technical Coordinating and Advisory Committee for the Kenosha transit development process.
Based on these adopted objectives and standards a complete evaluation of the operations of the Kenosha Transit Commission was made. It was determined that the primary deficiency in terms of management and personnel was the lack of adequate professional staff within the Kenosha Department of Transportation. The levels of service also were examined on the bases of providing direct service and delineating the quarter-mile service area. Priority population groups in general were found to be well served by the local bus system. The only notable deficiency was service to the elderly and handicapped owing to their dispersion and to their frequent inability to ride the regularly equipped buses. In this context a need was established for additional data on requirements of the elderly and handicapped. Major travel generators including employment centers, shopping areas, educational institUtions, public and medical institutions, and recreational areas were determined to be well served by the current local bus route structure. A notable deficiency was found in service relative to existing travel habits and patterns. The primary requirements are for a shortening of head ways to facilitate better route coordination, placement of one or more crosstown bus routes, and collection of current ridership data to achieve the effective design of such routes.
With regard to capital equipment, a need has been demonstrated for better access to the new transit garage and the provision of transit shelters. In addition, should levels of service be increased, more regular city buses will be needed.
A need for greater emphasis on marketing and public relations has been identified. The primary objective must be to devise a unified and consistent marketing program which acquaints people with all facets of the transit operation and which forcefully advances the advantages of transit use.
The financial status of the Kenosha Transit Commission is similar to those of most public transit operations. Although the operating deficit continues to increase, it has not yet placed an undue financial burden on the City of Kenosha.
With regard to intercity bus and commuter rail transit service, an adequate level of coordination with the local system has been shown to exist. Although the Kenosha. Transit Commission could conceivably provide rural school bus service, this action woulcl have limited benefits as a private enterprise currently supplies this service at a reasonable cost.
Finally, the alternatives of transit development in the Kenosha Planning District were investigated. Although the range of alternatives is somewhat constrained by the commitments made as a result of previous planning efforts, all reasonable possibilities were evaluated and from that evaluation the recommended plan set forth in the next chapter was formulated.
6S

(This page intentionally left blank)

Chapter VII
RECOMMENDED TRANSIT IMPROVEMENTS
INTRODUCTION
Based upon the analysis documented in Chapter VI, a five-year coordinated schedule of capital and operating improvements can be identified to provide the Kenosha Urban Planning District with the maximum practical level of public mass transit service. The first five sections of this chapter deal with specific categories of transit improvements required including route and schedule improvements, capital improvements, operating improvements, noncapital intensive improvements, and special projects for the elderly and handicapped. These improvements are summarized in a "program of projects" intended to guide the development of transit facilities and services in the Kenosha area over the five-year period from 1976 through 1980. Finally, a financial evaluation of this program of projects is presented and the environmental and energyconservation implications of the program described.
ROUTES AND SCHEDULES
As noted in the previous chapter, the recently established route and schedule structure constituted a major improvement in the level of transit service in the Kenosha area. Although analysis indicates that the present route configuration satisfies the majority of the transit planning objectives, there are certain changes and additions that, if implemented over the next five years, would provide an even higher level of service. Such improvements are minor route adjustments, major route additions, increased frequency of service, and extension of the hours of operation.
Minor Adjustments Although experience with the new five-route structure has been limited, a number of minor adjustments can be identified which would increase total route coverage, eliminate unnecessary duplication of service, and provide essential service to certain important travel generators. These modifications which are described below and shown on Map 22 concern changes in Routes 2, 3, and 4. All are immediately implementable.
Changes are recommended in both the northern and southern branches of Route 2. On the northern branch it is recommended that the segment of route which presently travels east-west along 45th Street between 40th and 43rd Avenues be dropped and the route be extended north along 45th and 39th Avenues, and then east-west along Washington Road. Not only would this addition provide service to a portion of the urban area identified in the preceding chapter as lying outside the recommended quarter-mile service area, but it also would provide service to new housing developments along 39th and 45th Avenues, the medical center located at 47th Avenue and Washington Road, Reuther Alternate High School located at 39th Avenue and Washington Road, and Bullen Junior High School. Since the schedule for Route 2 presently has a certain amount of slack time, no shortening of the northern branch is necessary. On the southern branch it is recommended that the route go directly east-west along 63rd Street from Sheridan Road to 14th Avenue instead of jogging south to 65th Street. This change, which is contingent upon the addition of a sixth route to be described later, is intended to avoid duplication of service and to decrease the travel time of the southern branch.
The recommended changes in Route 3 occur exclusively on the southern branch. Instead of traveling east-west along 85th Street and making the turn around on 83rd Place and 84th Street at the end of this route, the route would be extended north-south along 39th Avenue to 80th Street. This change would not only provide a much better turn-around and layover point, but would also provide better service to Lance Junior High. In addition, on the inbound trip, it is recommended that the Route 3 bus continue south along 39th Avenue to 93rd Street, east on 93rd Street to 32nd Avenue, then north again to meet its existing path. This additional loop would provide service to the seminary at 39th Avenue and 93rd Street and to a new housing development located on 32nd Avenue.
Minor modifications are recommended for the north and south branches of Route 4. On the north end, a loop consisting of 15th Avenue, 15th Street, 19th Avenue and Birch Road would be added to the existing route. This would increase the service area by providing direct service to new housing developments along 15th Avenue and 15th Street and to the new City Park at the intersection of these two streets. On the southern end of Route 4, the present small turn around would be replaced by a larger loop consisting of 51st Avenue, 85th Street, 39th Avenue and 80th Street. This change eliminates the present inconvenient turn around and layover point and maintains the service along 85th Street lost due to the proposed change in Route 3. It is important also to note that the combined changes in Routes 3 and 4 would provide service to the area centered on the intersection of 80th Street and 39th Avenue which was identified in Chapter VI as being outside the quarter-mile service area. The present slack time in the schedules for both Routes 3 and 4 allow these changes to be made with no effect on schedule adherence.
67

Map 22
MODIFICATIONS AND ADDITIONS RECOMMENDED TO THE ROUTE STRUCTURE OF THE KENOSHA TRANSIT SYSTEM
, , I
; •
;: , , • • <
• -
L
I
, 0.
l i ,
' . . ,
r
E.... ~ .... trl.1
0" §.
, .
....
Source: Kenosha Transit Commission.
68
.'
I" n,
• , , "
LEGEND
ROUTE EXISTING PROPOSED NUMBER SEGMENT SEGMENT
, <'O NE
<> ~ 2
~ , 4
• NONE
" 6 NONE
" TRANSIT SHELTER
0 E XIS T IN G .5 PROPOSED (SEE T A B L E ,OJ
D OUA RTI::::R - MIL E SERV ICE AREA
< ~
t 5

The preceding paragraphs describe changes to increase the level of service which can be implemented readily and immediately. Other minor adjustments which cannot be readily made under existing conditions but which should be considered over the next five years concern primarily increased emphasis on crosstown routing. As noted in the preceding chapter, because of the predominant one-hour head ways provided by the present system, it is necessary to have all routes converge on downtown at the same time to facilitate transfers between any two routes. It is thus a matter of chance whether transfers are convenient at any other transfer point within the transit service area. Although it has been demonstrated that a demand exists for direct crosstown oriented (noncentral business district) service, the present route and schedule structure make integration of such a crosstown route into the system difficult. The solution to this problem will require a reduction in headways, eliminating the need for having all runs on all routes meeting at the same time in the central business district. It is, therefore, recommended that before introducing reduced headways, the Kenosha Department of Transportation in cooperation with the Southeastern Wisconsin Regional Planning Commission conduct an on-board survey in spring 1977 to determine the desirability and placement of one or more crosstown routes. Schedule design for these crosstown routes would be based upon the timing of convenient transfers from and to intersecting routes and the surveyed travel patterns of transit patrons. One possibility would be to realign Route 1 so that, instead of entering the central business district, it would continue north-south along 22nd Avenue with a possible jog around the American Motors Corporation (AMC) plant on 52nd Street, 30th Avenue, and 60th Street. The recommended survey would be helpful also in determining any other desirable modifications in the route configuration necessitated by possible future changes in the location of transit ridership demand.
Route Additions The analysis in the preceding chapter indicated that a nllmber of important arterial streets including Washington Road, Sheridan Road, and 75th Street were without adequate coverage by the local bus system. Also identified were a number of small sections of the urban area not falling within the recommended quarter-mile service area. These include that section centered on the intersection of 63rd Street and 37th Avenue and the northwestern corner of the urban area near the intersection of 47th Avenue and Washington Road. To remedy these deficiencies, it is recommended that a sixth route, shown on Map 22, be added to the present five-route system. While overcoming the service area deficiencies noted above, the proposed sixth route will provide direct service to the following major travel generators: a medical center located near 47th Avenue and Washington Road, the Pershing Plaza Shopping Center, the Town and Country Shopping Center, the AMC downtown plant, St. Catherine's Hospital, Kenosha Hospital, Brookside Senior Citizens Center, Reuther Alternate High School, Bradford High School, St. Mark's School, Washington Junior High School, the Civic Center, the G. M. Simmons Main Library, the U. S. Post Office, and a number of city parks. The above list, while not exhaustive, indicates that the sixth route would indeed serve a large potential demand.
Because some duplication of service would result, as with Route 1 along Sheridan Road, some route adjustments could be made when the new route is added. There are now enough buses to provide service to this route, although additional drivers would be needed. As provision for this route has been included in the 1976 local budget, it is recommended that the route be added by the end of 1976.
Frequency of Service Numerous transit studies have shown that the most discommoding time during transit use is the time spent either waiting for the original bus or waiting for a transfer to another bus. Consequently, greater increases in ridership can be realized through a reduction in this wait time than through an equal reduction in on-bus travel time achieved with such techniques as express buses and reservation of exclusive use lanes. Given a particular route structure, there are two ways to reduce this wait time: a reduction of headways and better coordination of route schedules. As noted earlier, the level of coordination which can be achieved depends partly upon the route head ways.
Since a reduction in head ways implies the need for additional buses and more importantly additional drivers, it is recommended that the Kenosha Transit Commission embark only gradually upon a program of headway reduction. Paralleling this reduction would be an effort to coordinate transfers. It is recommended that the only such change in 1976 be the extension of peak hour headways (30 minute) on all routes to a three-hour morning and afternoon period. Thirty minute headways thus would be in effect from 6:00 a.m.-9:00 a.m. and 3:00 p.m.-6:00 p.m. As a logical next step, it is proposed that following the spring transit user survey in 1977 headways be reduced to 30 minutes on weekdays throughout the transit service day (6:00 a.m. to 6:00 p.m.), thus greatly increasing the potential for schedule coordination. Thirty-minute service also would be provided on Friday nights and Saturdays although this may depend on ridership response. With 30-minute service along all six routes throughout the transit service day, adjustments in schedules to permit coordination of transfers at locations other than the central business district can be made to further reduce travel time. Which routes should be provided with coordinated transfers can best be decided following the on-board ridership survey previously recommended for spring 1977. Finally, it is recommended that peak hour headways be reduced to 20 minutes in 1978. Such an action would require purchase of a probable 10 buses for the proposed six-route system. Specific requirements will have to be determined for preparation of a capital grant application to the Federal Urban Mass Transportation Administration (UMT A), and these requirements would be based upon results of ridership studies and schedule and routing experience existing at that time. The staging of headway reductions, as proposed, not only would allow for orderly acquisition of needed manpower and vehicles but also would provide sufficient time to assure the availability of necessary financial resources.
69

Hours of Operation No apparent demand exists now for extension of the hours of operation from 6:00 a.m. to 7:00 p.m. on Monday through Thursday and Saturday and from 6:00 a.m. to 9:00 p.m. on Friday. In fact, the late buses on Fridays now operate with far less than average loads. It is recommended for the next two years, barring any significant changes in travel habits and patterns, that the present hours of operation be maintained. In 1977 a detailed examination should be made to determine whether a need exists for later hours of operation on weekdays or any operation on Sunday. Based upon survey results, ridership trends, and comments from the public, a decision can be made then on any extension of operating hours.
CAPITAL IMPROVEMENTS
With receipt in 1974 of the initial federal UMTA capital grant for purchase of 24 new buses and construction of a maintenance and storage facility, a large proportion of the immediate capital needs of the Kenosha Transit Commission was satisfied. The analysis presented in Chapter VI, however, indicates that some additional capital expenditures will be required to remedy deficiencies.
The first such capital requirement is related to the 1974 capital grant which provided funds for construction of a maintenance and bus storage garage. The facility is nearing completion, with full occupancy planned by the end of 1975. As noted earlier, however, there is a problem involving access to the facility. It is, therefore, recommended that the Kenosha Transit Commission undertake the necessary steps to obtain land and construct an access driveway to provide direct bus access to 39th Avenue. Federal funding in partial support of this improvement may be obtained in the form of a supplement to the UMTA Section 3 Grant No. WI-03-0007 or funding be requested for inclusion in the Section 5 allocation to Kenosha for 1976. The construction project would require purchase of a house and its associated property, thus necessitating relocation of the family presently in residence. The cost of this acquisition and relocation is estimated at $24,000. The cost of construction is estimated at $16,000, making the total project cost $40,000. Further details would be included in the grant application.
The second capital improvement recommended is construction of transit waiting shelters. The sometimes harsh weather in the Kenosha area, the long head ways, and the need for frequent transfers make a single shelter facility located in the central business district incompatible with a high level of service. Eleven locations have been identified as in need of shelter facilities because of their high boarding counts or transfer potential. Of these 11 locations shown in Table 30 and on Map 22, three will require shelters on both sides of the street, resulting in a total of 14 structures. It is recommended that all 14 be constructed in 1976.
Table 30
PROPOSED TRANSIT SHE L TER LOCATIONS ON THE KENOSHA TRANSIT SYSTEM
Code Number of Numbera Location Description Shelters
1 22nd Avenue and Roosevelt Road ..... Major transfer point-routes 1 and 2 1 2 Saxony Manor . . . . . . . . . . . . . . . . . . Major loading point for elderly housing 1
development-routes 1 and 4 3 27th Avenue and Roosevelt Road ...... Major loading point for senior citizens 1
home-route 2 4 22nd Avenue and Washington Road .... Major transfer point-routes 1 and 6 2 5 39th Avenue and 80th Street ......... Major loading point-end of routes 3 and 4 1 6 30th Avenue and 35th Street ......... Major loading point for Gateway Technical 1
Institute-route 3 7 28th Avenue and 60th Street ......... Major loading point for AMC main gate- 2
routes 3 and 4 8 15th Street and Birch Road .......... Major loading point for new apartment 1
developments-route 4 9 39th Avenue and Washington Road ..... Major transfer point-routes 2, 3, and 6 2
10 47th Avenue and Washington Road ..... Major loading point-end of route 6 1 11 30th Avenue and 14th Place ......... Major loading point for new apartment 1
developments-route 1
aSeeMap 22.
Source: Kenosha Transit Commission and SEWRPC.
70

Because comfort in waiting is essential in the effort to attract new ridership, it is recommended that the shelters possess the following amenities: four highly transparent enclosure walls of tempered glass or its equivalent; adequate lighting at reading level; sufficient room and seating to accommodate the anticipated demand; an aesthetically pleasing route map and schedule display, and some type of radiant heat source in either the floor or the ceiling. In the larger shelters, such as that proposed for 22nd Avenue and Roosevelt Road, additional items such as a pay phone or piped-in music may be desired. In general, it is important that the shelters provide the maximum practical comfort and blend into their surroundings in an aesthetically pleasing manner. Cost estimates are $10,000 for the major structure at 22nd Avenue and Roosevelt Road and $6,000 each for the remaining structures. It is important to note that all locations are at major loading and connection points and consequently would be used despite any future changes in bus route pattern.
Finally, as a result of the recommended changes and additions in the routes and headways, the Kenosha Transit Commission will require at least 10 additional regular city buses by the year 1978. No additional buses are required for 1976 or 1977 since, as noted earlier, the Kenosha Transit Commission presently uses only 23 of its 30 buses-18 for the regular city routes and five for the school trippers. The proposed sixth route would require four buses to maintain the 30-minute headway service. Although increasing route lengths, modifications in the existing five routes do not require additional buses. As bus requirements are based upon peak hour headways, the mere extension of the 30-minute peak head ways to three hours in 1976 and then to all day in 1977 also does not require additional buses. Twenty-seven buses, therefore, will be required in 1976 and 1977 to provide the recommended service. Considering the age of the six older buses presently owned by the Kenosha Tran:sit Commission, maintenance may present a problem for those two years with only three spare buses. It is hoped, however, that with the new maintenance facility, these difficulties can be overcome.
When peak hour headways are reduced to 20 minutes in 1978, there will be a need for additional buses. Table 31 indicates the number of buses needed for the proposed 1978 routes and schedules based upon the following assumptions: peak hour headways for the six-route system as proposed for 1976 will be 20 minutes; the buses will average 15 miles per hour with the standard 7 percent layover time; and the reduced head ways will no longer require that all buses meet simultaneously in the central business district, thus allowing for noncycle scheduling. In addition to the 31 buses required for regular city service, five will be needed for school trippers and four will be needed for spares. Thus, a total of 40 buses will be needed in 1978 or 10 more than the Kenosha Transit Commission now owns. A summary of all bus requirements for the years 1976-1980 is found in Table 32.
The exact specification of the type of bus required to best serve the Kenosha area must ultimately be determined by the Kenosha Transit Commission based on many practical considerations. An analysis was, however, conducted to determine the appropriate size of the needed buses. Currently the average load factor on Kenosha Transit Commission 45-passenger buses is less than 0.5, superficially indicating that smaller buses could be called for in any fleet expansion. Transit system capacity, however, must be carefully related to peak period load conditions. Even at the present time there are certain runs during the peak period with half-hour headways which have load factors exceeding the 1.25 maximum specified in the adopted objectives and standards. The provision of twenty minute headways will not necessarily alleviate this problem, as a corresponding increase in demand is expected by 1978. To satisfy this anticipated peak period demand, it is recommended that the ten new buses have a capacity of at least 45 passengers similar to those presently in service. In this respect, it should be noted that labor costs, comprised primarily of driver's wages, represent between 70 and 80 percent of total operating costs. The difference in operating costs for different size buses depends on fuel costs which are negligible for
Table 31
BUSES REQUIRED FOR REGULAR KENOSHA CITY TRANSIT ROUTES WITH 20 MINUTE PEAK HEADWAYS
One-Way One-Way Round Trip Peak Buses Route Mileage Travel Timea Travel Time Headway Required
1 11.5 49.2 98 20 5 2 12.7 54.4 109 20 6 3 13.2 56.5 113 20 6 4 13.4 57.4 115 20 6 5 6.3 27.0 54 20 3 6 9.9 42.4 85 20 5
Total 67.0 -- -- -- 31
a Assumes an average speed of 15 miles per hour and a 7 percent layover time_
Source: Kenosha Transit Commission and SEWRPC.
71

Table 32
BUSES REQUIRED FOR REGULAR CITY AND SCHOOL TRIPPER ROUTES OF KENOSHA TRANSIT SYSTEM: 1976-1980
Bus Requirements 1976 1977 1978 1979 1980
Headway Peak ............... 30 min. 30 min. 20 min. 20 min. 20 min.
Off·Peak ............. 60 min. 30min. 30 min. 30 min. 30 min.
Saturday ............ 60 min. 30 min. 30 min. 30 min. 30 min.
Buses Required Peak ............... 22 22 31 31 31
Off-Peaka ............ (12) (22) (22) (22) (22)
Saturdaya ............ (12) (22) (22) (22) (22)
School Trippers ........ 5 5 5 5 5
Spares .............. 3 3 4 4 4
Total Buses Needed 30 30 40 40 40
a Off.peak and Saturday bus requirements are met if sufficient buses are obtained to meet peak requirements.
Source:- Kenosha Transit Commission and SEWRPC.
a wide range of sizes. The purchase of ten 45-passenger buses would therefore appear prudent, since the operating costs would not be significantly higher and since it would preclude the alternatives of overcrowding or the necessity of adding another bus to an overcrowded bus route. The estimated capital cost associated with this fleet expansion will be presented in the financial analysis by assuming constant 1975 dollars and current bus prices. In addition, it is likely that two specially equipped "mini-buses" will also be needed by 1977 to fill demands of the elderly and handicapped for service. More information on these capital costs will be presented in a later section on special projects.
OPERATING IMPROVEMENTS
Transit operations must improve to take advantage of the proposed capital improvements. The recommended improvements in transit operations are set forth below.
In terms of personnel, implementation of the route and schedule recommendations will require that additional bus drivers be hired. Labor costs are currently the most severe constraint on expanded bus operation in the Kenosha area. The system presently requires 24 full-time drivers. It is anticipated that 11 additional full-time drivers for a total of 35 would be needed during 1976 to provide sufficient manpower for the recommended new route and expanded peak hour operation. In 1977, when all head ways are reduced to 30 minutes, an additional 17 drivers would be needed resulting in a new total of 52 drivers. Finally, eight extra drivers would be needed in 1978 to provide 20 minute peak hour service. Thus, a full complement of 60 full-time drivers would be required to operate the system by 1978. The estimates of driver requirements are based on the following assumptions: All bus drivers will work a standard 40 hour week; full-time drivers will be used for both regular and school tripper routes; a 5 percent margin is added for sick leave; and each bus driver is allowed two weeks of vacation per year. With these assumptions the driver requirement is calculated using the number of bus hours needed to provide the recommended improvements in the level of service. The bus hours of operation per year as well as other relevant operating statistics can be found in Table 33.
The second personnel deficiency identified in the preceding chapter was the lack of adequate management support staff in the Kenosha Department of Transportation. With the increased staff responsibilities entailed in such tasks as scheduling and marketing of transit services, it is essential that additional staff be acquired. Therefore, an additional staff member is recommended for the Kenosha Department of Transportation in January 1977. The position would require either a transit planner or a person experienced in bus operations. The new staff member would either assume or free an existing staff member to assume such duties as preparing grant applications, complying with state and federal reporting procedures, planning for special elderly and handicapped transit services, conducting and analyzing on-board surveys, cooperating with street and highway officials in the preparation of an annual transportation improvement program, and conducting an aggressive marketing and advertising campaign. It is difficult to overemphasize the importance of this recommendation: successful implementation of many other recommendations depends upon adequate staff support.
72

Table 33
PROJECTIONS OF OPERATING DATA FOR THE KENOSHA TRANSIT SYSTEM: 1976-1980
Operating 1974 1975 1976 1977 1978 1979 1980 Data Actual Estimate Projection Projection Projection Projection Projection
Revenue Vehicle Miles ......... 335,044 443,000 744,290 1,057,457 1,408,999 1,408,999 1,408,999 Revenue Vehicle Hours ......... 30,921 32,000 60,438 93,232 107,110 107,110 107,110 Number of Revenue Passengers ... 687,871 766,767 920,000 1,150,000 1,438,000 1,654,000 1,819,000 Passengers/Per Vehicle Mile ...... 2.05 1.73 1.24 1.09 1.02 1.17 1.29 Passengers/Per Vehicle Hour ..... 22.20 24.00 15.20 12.30 13.40 15.40 17.00
Source: SEWRPC.
A particularly important facet of a good transit operations is a marketing program. Many potential riders are passively discouraged from traveling on buses by the mere lack of easily obtainable information. Thus it is recommended that the Kenosha Transit Commission embark upon a vigorous program of route and schedule information dissemination. Pocket sized route maps and schedules should be available at a number of outlets throughout the City. Route information displays should be posted in high activity centers such as supermarkets, libraries, shopping centers, office buildings, and schools. Informational signs should be posted at all bus stops indicating the route, schedule, and points of interest along the route. Color coding of signs may be desirable for identification purposes. As "familiarity breeds ridership," the free ride day should also be repeated periodically with ample pUblicity. If a centralized approach is considered desirable, the Transit Commission may wish to hire a consultant to conduct a marketing study and to formulate a comprehensive advertising campaign complete with logo and jingle. The return in ridership revenue may be expected to be greater than the investment for a broad range of marketing expenditures. Over the next five years, then, it is recommended that a greater emphasis be placed on marketing and public relations activities.
The final area of concern in operations is the method of operations reporting and financial accounting. As noted in Chapter V, all transit systems receiving federal aid must conform to a uniform system of reporting and accounting (FARE) by 1978. Measures have already been initiated at the state and federal levels to gradually introduce this program. It is recommended that the Department of Transportation in cooperation with the City Comptroller's Office begin to revise its format of record keeping and financial bookkeeping to conform with project FARE. The procedure must be initiated no later than mid-1977 to assure that Kenosha's eligibility for federal assistance is not jeopardized.
NON CAPITAL INTENSIVE IMPROVEMENTS
Noncapital intensive improvements are those actions involving little or no expense which can be taken on the local level to encourage increased use of the transit system. These actions usually consist of changes in regulations or special traffic control techniques aimed at increasing the attractiveness of bus travel in relation to automobile travel. The following paragraphs contain a number of suggestions for noncapital intensive improvements which should be considered in collaboration with those officials responsible for street and highway planning and traffic engineering.
The availability and cost of parking have definite effects on the personal choice to use either the bus or the automobile. If the supply of parking were reduced or the cost increased in a high activity area such as the central business district, more people would be inclined to ride the bus. Currently the central business district of Kenosha has an ample supply of low cost parking in comparison with most urban areas. Since transit service to the central business district is good, a reasonable reduction in the number of parking spaces, especially on-street parking spaces, could be made with little detriment to downtown businesses. If an across-the-board decrease is considered undesirable, an alternative would be to increase the cost of long term parking. In this manner, working commuters would be encouraged to ride the bus. Whatever the desired action, implementation is greatly simplified by the fact that the Kenosha Transit Commission also manages the parking facilities.
Other possible noncapital intensive improvements involve the preferential treatment of transit vehicles in traffic. These techniques include reserved or preferential bus lanes, special bus turning and pull-out lanes, exemption of buses from turning restrictions, and bus preemption of traffic signals. More applicable to large urban areas, these techniques do not appear appropriate in the City of Kenosha. The present level of traffic congestion in most areas is simply not high enough for any significant reductions in bus travel time to be realized.
73
SPECIAL PROJECTS
Certain special services above and beyond the provision of regular city transit service should be provided. These special services are primarily to benefit those elderly and handicapped persons who are unable to use the regular scheduled bus service.
The Kenosha Transit Commission and the Department of Transportation have already expended much effort to encourage and facilitate the use of transit among the elderly and handicapped. These efforts include fare reduction in off-peak hours, design of routes to provide direct service, proposed shelters near popular loading locations, and numerous visits to acquaint the elderly and handicapped with the services offered. To continue this effort it is recommended that the Department of Transportation initiate a planning program during 1976 to identify the special transit needs of the elderly and handicapped and to seek solutions to these needs. This planning effort would be concurrent with and coordinated with a similar regional study to be conducted by the Southeastern Wisconsin Regional Planning Commission. Attempts also should be made to coordinate this progr~ with the efforts of any local private nonprofit organizations in the City of Kenosha that are interested in securing transportation equipment for the elderly and handicapped under the provisions of Section 16(b)(2) of the Urban Mass Transportation Act. No agencies in Kenosha have yet applied for these funds but as the program grows more popular, it is anticipated that an agency or agencies in the city will apply. The Kenosha Transit Commission should attempt to discover if any such action is imminent and cooperate with that agency.
It is recommended that a program to serve the needs of the elderly and handicapped be implemented during 1977. According to the adopted standards, the vehicles used in such a program should be specially adapted to accommodate such equipment as wheelchairs. But instead of providing the regular city buses with special equipment, a far cheaper and more feasible approach would be to purchase two specially equipped mini-buses. Funds in support of this purchase are available under Section 16 of the Federal Urban Mass Transportation Act. As the elderly and handicapped in Kenosha are somewhat dispersed and direct service is desired, the program probably should call for the provision of a demand-responsive service such as dial-a-ride. More specific recommendations are not possible until the necessary data have been collected.
Once again, it must be stressed that the successful planning and implementation of this program can only be accomplished with an adequate Kenosha Department of Transportation staff. The recommended retention of an additional staff member is critical given the added responsibility for planning special service to the elderly and handicapped. Finally, two more part-time bus drivers will be needed in 1977 when this special project is operating.
PROGRAM OF PROJECTS
The last several sections have enumerated, in general categories, the transit improvements recommended to provide the Kenosha Urban Planning District with the maximum practical level of transit service. To present these recommendations in a clearer and more systematic manner, Table 34 is provided showing the five-year staging of all capital and operating transit improvements. Proposed improvements for the final two years are purposefully less precise. Because some projects are contingent upon the completion of others within any particular year, the improvements are listed in the order of their priority. The table also includes the estimated cost and probable funding source of capital expenditures, the personnel requirements for operational improvements, and the governmental agencies which must adopt or approve of each transit improvement. As such, the table is intended to provide a working guide to the smooth and expeditious implementation of all capital and operating transit improvement recommendations contained in this report. The only recommended improvement not listed in the table is the technical study to initialize a marketing program in 1976. The study will probably require the retaining of a consultant and will thus be eligible for funding under Section 9 of the Urban Mass Transportation Act.
FINANCIAL EVALUATION
To assure practicality and acceptability, any plan must be evaluated on the basis of financial feasibility. Such an evaluation may show that to attain the objectives expressed in one or more of the criteria for the plan would surpass the financial reach of implementing agencies. Under such circumstances it would be necessary either to revise the criteria on which the plan is based, and thereby revise the plan, or seek new means of financing plan implementation.
To this end, a careful evaluation was made of the financial feasibility of the Kenosha transit development program. Based upon the staging of transit improvements in Table 34, the total capital and operating costs were estimated over the fiveyear implementation period. These costs were then compared to anticipated operating revenues, based upon ridership projections, and the probable operating deficit was determined. Finally the sources of transit assistance were examined to determine whether the estimated operating deficit is within the financial means of the implementing agencies.
Capital Costs The capital expenditures associated with implementation of the recommended five-year Kenosha transit development program are relatively straightforward and can be directly derived from Table 34. The capital expenditures required include construction of a bus garage access driveway, the construction of 14 transit shelters, the purchase of 10 transit buses of
74

45-passenger capacity each, and the purchase of two specially equipped mini-buses. A summary of all recommended capital expenditures for the next five years is shown in Table 35. As can be seen total capital expenditures for the five year implementation period are $808,000, resulting in an average annual capital cost of $161,600.
Table 34
PROJECTS RECOMMENDED IN KENOSHA TRANSIT DEVELOPMENT PROGRAM: 1976-1980
Staging Capital Expenditures Agency Adoption Year Recommended Improvement Item Estimated Cost Funding Source Personnel Requirements or Approval
1976 Construct bus garage accessa Driveway $ 40,000 UMTA Section 5 -- UMTAb, SEWRPCc
, KCCd
, KTCe
Proposed adjustments to - - - -- PSC ,KTC existing routes
Add sixth route - -- -- 4 full·time drivers PSC, KCC, KTC Extend peak hour head ways - -- -- 7 full-time drivers PSC, KeC, KTC Construct bus shelters 14 shelters $ 88,000 UMTA Section 3 -- UMTA, SEWRPC, KCC, KTC Initiate elderly and -- -- -- - KTC handicapped planning - - - -- KTC
1977 Hire additional Kenosha -- - -- Full-time transit KCC,KTC Department of Transportation planner or operator staff member
Conduct on-board bus survey -- - -- , Temporary interviewers --Reduce all headways to -- - - 17 full-time drivers PSC, KCC, KTC 30 minutes
Institute elderly and handicapped 2 mini-buses $ 80,000 UMTA Section 16 2 part-time drivers UMTA, PSC, SEWRPC, KCC, KTC transit program
1978 Reduce peak hour head ways 1045 passenger buses $600,000 UMTA Section 3 8 full-time drivers UMTA, PSC, SEWRPC, KCC, KTC to 20 minutes
Route realignment - - - -- PSC, KTC (if needed)
1979 Extend hours of operation -- - -- -- PSC, KCC, KTC (if warranted)
1980 Extend service area - - -- -- PSC, KCC, KTC (if warranted)
a A request for funding for this project has been included in Kenosha's 1975 Section 5 application.
b Urban Mass Transportation Administration (UMTA).
c Southeastern Wisconsin Regional Planning Commission (SEWRPC).
d Kenosha Common Council (KCC)_
e Kenosha Transit Commission (KTC)_
f Wisconsin Public Service Commission (PSC).
Source: Kenosha Transit Commission and SEWRPC.
It must be noted that the estimates for all capital costs are expressed in 1975 dollars and represent current average industry costs. When actual design specifications for items such as the transit shelters are determined, it is possible that the costs will be slightly higher or lower than estimated. The zero capital costs for 1979 and 1980 must also be qualified, It is quite conceivable that during the next three years deficiencies will be identified which require capital expenditures during 1979 and 1980 for their solution. Continual updating of transit improvement plans is thus essential to prepare for such contingencies. In a later section the actual division of capital expense to each responsible implementing agency will be presented.
Operating Costs The projected operating costs associated with the recommended transit service improvements are shown in Table 36, The categories used correspond to those established by the Wisconsin Department of Transportation, Division of Planning, for the administration of the state operating assistance program. The actual operating costs for the year 1974 are included for comparison purposes and with the exception of depreciation, which is not
Table 35
CAPITAL EXPENDITURES RECOMMENDED IN THE KENOSHA TRANSIT DEVELOPMENT PROGRAM: 1976-1980
Year Item Unit Cost Number Total Cost
1976 Bus Garage Access. _ $40,000 1 $ 40,000 Bus Shelters, _ , . , . 6,000 13 7B,OOO Bus Shelter. .. , , , , 10,000 1 10,000
Subtotal $12B,OOO
1977 Mini-buses, , . , , , . 40,000 2 BO,OOO 197B 45-passenger buses, , 60,000 10 600,000 1979 -- -- -- --19BO -- -- -- --
Total -- -- -- BOB,OOO
5-Year Average -- -- $161,600
Source: Kenosha Transit Commission and SEWRPC-
75

Table 36
PROJECTED OPERATING COSTS OF THE KENOSHA TRANSIT SYSTEM: 1976-1980
1974 1975 1976 1977 1978 1979 1980 Operating Cost Item Actual Estimate Projection Projection Projection Projection Projection
Labor Management, supervisory, etc_ salaries _ .. $ 23,532 $ 25,397 $ 27,175 $ 41,077 $ 43,953 $ 47,029 $ 50,321 Operators' wages ................. 183,160 224,240 458,640 728,998 899,808 962,795 1,030,191 Maintenance personnel wages ......... -- 47,908 51,262 54,850 58,690 62,798 67,194 Other hourly wages ............... -- 30,732 32,883 35,185 37,648 40,283 43,103 Fringe benefits .................. 37,567 61,449 70,000 85,000 95,000 95,000 95,000 Social Security taxes .............. 11,537 19,204 33,343 50,316 60,846 65,105 69,662
Subtotal $255,796 $408,930 $673,303 $ 995,426 $1,195,945 $1,273,010 $1,355,471
Transportation Fuels and lubricants ............... $ 22,214 $ 38,480 $ 63,123 $ 96,972 $ 128,291 $ 134,706 $ 141,441 Other maintenance ................ -- -- 2,000 3,000 3,150 3,308 3,473 Other ........................ 2,168 5,060 3,000 5,000 5,250 5,512 5,788
Subtotal $ 24,382 $ 43,540 $ 68,123 104,972 $ 136,691 $ 143,526 $ 150,702
Maintenance and Utilities Revenue equipment maintenance ...... $ 73,631 $ 35,000 $ 40,000 $ 50,000 $ 55,000 $ 57,000 $ 60,000 Other maintenance ................ 154 1,150 2,000 3,000 3,000 3,000 3,000 Utilities ........................ 1,494 10,100 10,000 14,000 14,000 15,000 16,000
Subtotal $ 75,279 $ 46,250 $ 52,000 $ 67,000 $ 72,000 $ 75,000 $ 79,000
Administrative Management service fees. . . . . . . . . . . . $ -- $ -- $ -- $ -- $ -- $ -- $ --Timetables and tariff expenses ........ 206 3,700 4,000 4,000 4,000 4,000 4,000 Marketing expenses ............... 1,007 6,400 6,000 10,000 10,000 10,000 10,000 Legal and aUditing ................ 1,317 800 1,500 1,500 1,500 1,700 1,700 General office expenses ............. 4,247 2,410 3,000 3,000 3,000 3,000 3,000 Other administrative ............... -- 75 -- -- -- -- --
Subtotal $ 6,777 $ 13,385 $ 14,500 $ 18,500 $ 18,500 $ 18,700 $ 18,700
Insurance and Safety Expenses Public liability and property damage insurance ................ $ 7,449 $ 13,405 $ 15,000 $ 18,000 $ 21,000 $ 21,000 $ 21,000
Injuries and damages .............. 4,756 2,500 3,000 8,000 10,000 10,000 10,000 Workmen's compensation insurance .... -- 1,500 1,750 2,000 2,500 2,500 2,500 Other insurance ....... _ .......... -- - -- -- -- -- --
Subtotal $ 12,205 $ 17,405 $ 19,750 $ 28,000 $ 33,500 $ 33,500 $ 33,500
Operating Taxes Vehicle registration and permit fees ..... $ 78 $ 24 $ 30 $ 30 $ 40 $ 40 $ 40 Federal gasoline, fuel, and oil taxes ..... -- -- -- -- -- -- --Real estate and property taxes ........ -- - -- -- -- -- --Other operating taxes .............. -- 1,000 17,099 25,803 31,203 33,387 35,724
Subtotal $ 78 $ 1,024 $ 17,129 $ 25,833 $ 31,243 $ 33,427 $ 35,764
Other Rents ................. _ .... _ . $ 1,784 $ 4,900 $ -- $ -- $ -- $ -- $ --Miscellaneous .... _ ............ _ . 224 -- 500 500 500 500 500
Subtotal $ 2,008 $ 4,900 $ 500 $ 500 $ 500 $ 500 $ 500
Total $376,525 $535,434 $845,305 $1,240,231 $1,488,379 $1,577,663 $1,673,637
Source: Kenosha Transit Commission and SEWRPC.
76

a legitimate operating expense for any aid program, correspond to the audit in Appendix B. The following assumptions were employed in the estimation of operating costs:
I. Labor
1. The current level of management salaries will be maintained with an average annual increase of 7 percent. The large increase in 1977 represents the hiring of a professional staff member in the Kenosha Department of Transportation.
2. The operators needed for headway reductions and route additions will be hired on January 1 of the respective year. All drivers will work a 40-hour week and will be paid according to the present labor contract with an average annual increase of 7 percent.
3. The present level of staff support for maintenance and other hourly personnel will remain constant with an average annual wage increase of 7 percent.
4. The fringe benefits will increase in proportion with the total number of employees, and the social security tax will remain at 5.85 percent.
II. Transportation
1. Fuel expenses for 1976 are based on an average consumption of five miles per gallon at a cost of $0.39 per gallon. Fuel and lubricant unit costs are expected to total roughly 8 cents per vehicle mile in 1976. A 5 percent increase in the unit cost of fuels and lubricants is anticipated for the years 1977-1980.
2. Total fuel and lubricant costs for the years 1977-1980 will increase in proportion to the total revenue and nonrevenue vehicle miles of travel based on recommended increases in the levels of service. As can be seen, the largest increases occur in 1977 and 1978 when the greatest increases in service levels are implemented.
III. Maintenance and Utilities
1. Maintenance costs for 1975 will decrease significantly due to receipt of the new buses. Despite increases in vehicle miles, the costs are expected to stay relatively low in 1976 as better preventative maintenance is made possible by the new maintenance facility.
2. Maintenance costs, however, will increase gradually for the years 1977-1980 due to the increased number of buses and to the greater use of the buses to provide the recommended improvements in service.
IV. Administrative
1. Marketing costs are expected to increase significantly in 1977 in accord with the unified marketing program to be established by the proposed marketing study. Marketing costs will then be stable for the remainder of the implementation period.
2. Other administrative costs are expected to remain relatively constant.
V. Insurance and Safety Expenses
1. The costs for liability and property damage insurance and for injury and damage compensation will increase in proportion to the number of buses and bus vehicle miles of travel.
2. Workmen's compensation insurance will increase in proportion to the number of nonsalaried transit employees.
3. The "other" insurance represents fire and vandalism insurance deemed necessary for the new buses.
VI. Operating Taxes
1. The present exemption of public transit vehicles from the majority of taxes and license fees will continue through 1980.
2. The "other" operating taxes represent unemployment compensation. This is assumed to remain at 3 percent of the total wages and salaries.
77

VII. Other Operating Expenses
1. With occupancy of the new garage and maintenance facility, rent will no longer be paid.
2. No other significant operating costs are anticipated.
Operating Revenue Estimates of operating revenue are based primarily on projected transit ridership which in tum is based upon past ridership responses to increases in the level of service. As shown in Table 33, revenue ridership is expected to increase 20 percent in 1976, 25 percent in 1977, 25 percent in 1978, 15 percent in 1979, and 10 percent in 1980. The relationship between projected ridership and recommended levels of service for the years 1976-1980 can also be found in Table 33 which shows the estimates of passengers per bus mile and passengers per bus hour. As a matter of comparison, the projected ridership for 1980 is roughly equal to the revenue ridership observed in 1964. As can be seen in Table 15, the 1964 ridership was actually realized with a far lower level of service than that proposed for 1980 in terms of vehicle miles and vehicle hours. Depending, then, on the success of the recommended unified marketing program, the ridership projections may be somewhat conservative.
The resulting passenger fare revenue projections are shown in Table 37 which also includes the actual 1974 figures for comparison purposes. It should be noted that the average passenger fare declines in 1976, reflecting establishment of the 10 cent fare for the elderly and handicapped. The estimated passenger revenue is then added to charter, advertising, and other revenue to determine total operating revenue exclusive of any governmental aids and supplements. The "other" revenue shown for 1974 represents an insurance rebate and is not expected to be so large for any succeeding year.
Sources of Funding The preceding sections have specified the estimated five-year capital costs, operating costs and operating revenues associated with the implementation of the recommended Kenosha transit development program. The final step in the financial evaluation is to determine whether sufficient sources of funding exist to implement the plan fully.
Table 37
OPERATING COSTS, REVENUES, AND DEFICIT OF THE KENOSHA TRANSIT SYSTEM: 1974·1980
Operating Itema
Revenue Passengers ........ Passenger Revenue. . . . . . . . . Advertising Revenue ....... Charter Revenue .......... Other Revenue . . . . . . . . . . .
Total Revenue
Operating Expense ......... Cost Per Passenger ......... Net Operating Deficit ....... Deficit Per Passenger .......
UMT A Section 5 Allocation .. Federal Share of Deficit (1/2) . State Share of Deficit (1/3) ... Local Share of Deficit (1/6). ..
a Assumptions
1976: 23rf Average Fare 35 Bus Operators
1977: 22t/Average Fare 52 Bus Operators
1978·1980: 22tAverage Fare 60 Bus Operators
1974 Actual
687,871 $171,479
120 350
8,707
$180,656
$376,525 0.55
195,869 0.28
$ ..
.. 130,500 65,369
1975 Estimate
766,767 $190,290
..
1,300 1,550
$193,140
$535,434 0.70
342,294 0.45
$228,881 171,147 114,098 57,049
1976 1977 Projection Projection
920,000 1,150,000 $211,600 $ 253,000
.. 2,500 1,500 2,000 1,500 1,500
$214,600 $ 259,000
$845,305 $1,240,231 0.92 1.08
630,705 981,231 0.69 0.85
$381,469 $ 495,910 315,353 490,616 210,235 327,077 105,117 163,538
Source: Wisconsin Public Service Commission, Kenosha Transit Commission, and SEWRPC.
78
1978 1979 Projection Projection
1,438,000 1,654,000 $ 316,360 $ 363,880
2,500 2,500 3,000 4,000 1,500 1,500
$ 323,360 $ 371,880
$1,488,379 $1,577,663 1.04 0.95
1,165,019 1,205,783 0.81 0.73
$ 591,277 $ 648,497 582,509 602,891 388,340 401,928 194,170 200,964
1980 Projection
1,819,000 $ 400,180
2,500 4,000 1,500
$ 408,180
$1,673,637 0.92
1,265,457 0.70
$ 686,644 632,729 421,819 210,909

As noted in Chapter V, pursuant to current federal legislation, all capital expense items identified in Table 35 are eligible for up to 80 percent federal funding. The technical studies are actually eligible for full funding although current policy requires at least a 20 percent local contribution. Based upon this formula, Table 38 indicates the federal and local shares of the recommended capital expenditures. As the capital requirements of the program for 1976 and 1977 are relatively minor, it does not appear that they will impose any major financial hardship on the Kenosha Transit Commission. Although the capital requirements for 1978 are relatively expensive, the fact that no capital expenses are anticipated for either 1970 or 1980 results in a relatively small average annual capital outlay of $32,320. For this purpose the Kenosha Transit Commission can either borrow the funds or issue revenue bonds pursuant to Section 66.066 of the Wisconsin Statutes.
Cost Share
Total Cost Federal share (80%) ..... Local share (20%) .. _ . _ .
Table 38
FEDERAL AND LOCAL SHARES OF PROJECTED CAPITAL COSTS IN THE KENOSHA TRANSIT DEVELOPMENT PROGRAM: 1976-1980
1976 1977 1978 1979
$128,000 $80,000 $600,000 None. 102,400 64,000 480,000 .-
25,600 16,000 120,000 --
Source: Kenosha Transit Commission and SEWRPC.
5-Year 1980 Average
None $161,600 -- 129,280 -- 32,320
Of greater concern is the anticipated operating deficit. Section 5 of the Urban Mass Transportation Act now provides funds to cover up to one-half of the operating deficit. In addition, the operating assistance program of the State of Wisconsin will cover up to two-thirds of the remaining deficit. This leaves one-sixth of the operating deficit to be paid for by local contributions. Based upon the estimated operating costs and revenues, Table 37 indicates the resulting share of the operating deficit for which each agency would be responsible. In addition, the five year allocation of Section 5 monies to the Kenosha urban area is shown. As can be seen, the allocation is sufficient for each year. It is thus possible to use a portion of the allocated Section 5 monies to pay for capital expenditures. Assuming that the necessary State funds will be available during the five-year period, the main question involves the financial ability of the City of Kenosha. Although the necessary local financial commitment represents a sizable increase over past years, it would appear that the funds can be raised. The Kenosha Common Council has already established a ceiling of $115,000 for 1976 transit operations which is not exceeded. The local share of the deficit for 1977 through 1980, while large, is not unusual in comparison with national standards. As the commitment to improved transit service in Kenosha is strong, it appears that the funds can and will be raised.
As noted earlier, however, much uncertainty marks the future of the state operating assistance program. Were this program discontinued, it would represent effectively a tripling of the local share of the operating deficit. Under such circumstances the City of Kenosha would be unable to support much more than the present levels of service. Accordingly, it is incumbent upon officials of the City of Kenosha to monitor closely any legislative or gubernatorial action relating to this program and to be prepared to reduce levels of service quickly should the assistance program be terminated.
ENVIRONMENTAL AND ENERGY CONSIDERATIONS
According to the adopted objectives and standards set forth in Chapter VI of this report, mass transit facilities are to be designed and located so as to minimize detrimental impacts on the surrounding environment. An evaluation must be conducted to determine the extent and severity of environmental impacts of the recommended plan.
Environmental impacts resulting from capital investments include those associated with the garage access driveway and the transit shelters. The proposed site of the access driveway is zoned light industrial. As such, the driveway would be compatible with the surrounding land uses. Since the buses must use some means of access, the only real difference resulting from the proposed driveway would be a reduction in traffic congestion and an increase in bus schedule adherence. The shelters also should have a negligible impact on their surroundings. If, as recommended, the shelters are of sound and aesthetically pleasing construction, and since they would use a minimal amount of land, they should not result in significant negative impact to their surroundings. A more detailed environmental statement will be included in the grant application for both of these projects.
79

The other major environmental concerns are those of air and noise pollution. All the new buses are equipped with the "Environmental Improvement Package" and vertical exhaust stacks, so conforming to requirements of the federal Clean Air Act of 1970. In addition, these vehicles comply with all U. S. Department of Transportation safety standards, exhaust emission controls, and noise level abatement standards for motor buses. Although the increased levels of service will result in greater emissions, this impact will be more than compensated for by a corresponding reduction in automobile emissions.
A concern closely associated with protection of the environment is energy conservation. By its· very nature, improved transit service decreases overall gasoline consumption as it induces people to ride the bus and thus reduce their level of automobile use. Even with relatively light loads the per capita energy consumption of transit is far less than that of the private automobile. In addition, much has been done to increase the energy efficiency of the transit operation. The new buses have already effected an increase in the average miles per gallon of transit vehicles. The preventative maintenance to be made possible by the new facility will result in even greater gains. Finally, the more efficient route design results in greater service from fewer vehicle miles of travel. It can thus be concluded that in addition to having negligible environmental impacts, the recommended transit development program will result in a lessening of energy consumption in the Kenosha urban area.
SUMMARY
This chapter has set forth the recommended program of transit improvements needed to provide the Kenosha Urban Planning District with the maximum practical level of transit service for the years 1976 through 1980. These improvements include construction of a bus garage access driveway, construction of 14 transit shelters at 11 locations, addition of a sixth bus route, gradual reduction of head ways, establishment of a unified marketing program, hiring of a transit planner or manager, the conduct of an on-board bus survey, establishment of demand-responsive service for the elderly and handicapped, and institution of the uniform accounting system FARE. In addition to the driveway and shelters, the· capital expenditures needed for recommended service improvements include the purchase of 10 regular city buses and two specially equipped mini-buses. The recommendations also call for two technical studies relating to marketing and project FARE. Finally, the increased levels of service indicate the need for the hiring of 36 additional full-time bus drivers by 1980.
Based upon the staged implementation of these improvements, a financial evaluation was conducted to assure feasibility. It was determined that given existing transit assistance programs and a reasonable increase in level of transit expenditures, the recommended program of transit improvements is financially feasible. Finally, an evaluation of the environmental and energy conservation implications of the program was made and it was determined that the program could be implemented with insignificant detrimental impacts.
80

Chapter VIII
SUMMARY AND CONCLUSIONS
The urgency in providing an adequate level of mass transportation services in the Kenosha urban area required that a shortrange planning effort directed toward the continuation and improvement of existing urban mass transportation be conducted. The results of that planning effort, documented in this report, are set forth in a Kenosha transit development program representing a five-year coordinated schedule of capital and operating improvements. Its purposes are to .achieve a maximum practical level of public mass transit service. Intended to refine and detail adopted long range transit pI~s, the Kenosha transit development program also is intended to satisfy all state and federal planning requirements for capital and operating assistance.
The Kenosha transit development program was formulated under the established seven step planning process of study design, formulation of objectives and standards, inventory, transit systems analysis, plan design, plan test and evaluation, and plan adoption. The staff needs for the process represented a joint effort of the City of Kenosha, the Southeastern Wisconsin Regional Planning Commission, and the Wisconsin Department of Transportation. In addition, a Technical Coordinating and Advisory Committee representing a broad spectrum of leadership in the Kenosha area was established to increase local involvement and input through a critical review of staff efforts.
The inventories conducted as a necessary part of the Kenosha transit development planning effort consisted of those on past transit planning efforts, relevant characteristics of the urban mass transit service area, the existing transit systems, and pertinent transit legislation and regulation. Existing transit planning in the area included two adopted long-range transportation plans which concern transit in the Kenosha urban area: the 1966 regional land use-transportation plan of the Southeastern Wisconsin Regional Planning Commission and a comprehensive plan for the Kenosha Urban Planning District completed in 1967. Serving as a basic framework, these two adopted long-range plans were further refined and detailed by a technical study in 1969 to determine the feasibility of public transit ownership. An interim Transit Development Plan was formulated in 1974 as partial justification for an Urban Mass Transportation Administration (UMTA) capital grant application. The Kenosha transit development program documented herein is consistent with all these adopted plans and essentially represents a continuation of the transit planning process in the Kenosha urban area. Finally, the Southeastern Wisconsin Regional Planning Commission is in the process of a major regional transportation plan reevaluation. Although the reevaluation is not yet complete, data collected in this effort also was used in the preparation of the Kenosha transit development program.
The study area for this transit development program is the Kenosha Urban Planning District, comprising the eastern urbanized portion of Kenosha County. Special and general purpose units of government with important transportation responsibilities in the District include the City of Kenosha, the Town of Pleasant Prairie, the Town of Somers, Kenosha County, and the Kenosha Unified School District Number One.
Land uses in the District vary greatly from low density agriculture in the Towns of Pleasant Prairie and Somers to high density urban areas in the City of Kenosha. Urbanization has been rapid in recent years, the area devoted to urban land uses increasing over 9 percent between 1963 and 1970. Current estimates indicate a continuation of this trend with the most rapid urbanization occurring southwest of the existing urban areas of the City of Kenosha.
The 1974 popUlation of the District is estimated at about 103,000, an increase of almost 21 percent over 1960 census levels and of about 5 percent over 1970 census levels. Despite this dramatic population increase, population densities in the developed urban areas of the District have declined in recent years reflecting a diffusion of residential development. The 1972 estimated employment of the District is about 38,000, an increase of about 3 percent over the 1970 census employment figures. The economy of the District is oriented to the manufacture of durable goods. This results in a high percentage of blue collar workers in the labor force. The dominant employer of the District is American Motors Corporation. It accounts for over 30 percent of total employment while the seven largest firms account for nearly half of the total employment.
PopUlation groups highly dependent on mass transit for mobility in the District are students, the elderly, low income families, minorities, the handicapped, and those with limited access to automobile transportation. The highest concentrations of these groups live in the older and intensively developed central city, making this area one of high priority in terms of future transit development.
Major trip generators in the District include employment centers, shopping areas, educational institutions, public and medical institutions, and major recreational areas. Employment, shopping, and public and medical facilities and areas were found to be somewhat concentrated in the highly urbanized areas while educational institutions and recreational areas are scattered throughout the District.
81

An inventory of existing travel habits and patterns within the Kenosha effective urban transit service area is provided by a home interview survey conducted in 1972 by the Southeastern Wisconsin Regional Planning Commission. The surve~ determined that an average weekday produced a total of 286,000 interzonal person trips within the transit service area. ()f this total 43,000, or 15 percent, are home-based work trips; 47,000, or 16 percent, are home-based shopping trips; 22,000, or 8 percent, are home-based school trips; 119,000, or 42 percent, are home-based other trips; and 55,000, or 19 percent, are nonhome-based trips. Other pertinent data such as the trip distribution patterns and socioeconomic characteristics of tripmakers also were tabulated to aid in local transit system design and evaluation.
Urban mass transit service has been available in the Kenosha Urban Planning District since 1903 when street railway operations were established. The system was converted to trolley coaches in the 1930s and to motor buses in the 1940s. The continuous declines in ridership and profits since World War II resulted in several changes of private ownership until February 1971 when, because of extreme financial difficulties, the last private operator ceased local bus operations. After almost eight months without local transit service, the City of Kenosha acquired the system in September 1971 and resumed service that month.
Now the local bus system in the City of Kenosha is operated jointly by the Kenosha Transit Commission and the City Department of Transportation. The Kenosha Transit Commission, established in 1971 pursuant to Section 66.943 of the Wisconsin Statutes, is responsible for policy direction, while direct operational responsibility is delegated to the City Department of Transportation. The local bus system consists of five regular city routes and five school trippers which are designed primarily to accommodate the movement of school children. The five city routes, which together total 53.9 route miles, are lineal in design and oriented to the central business district. Ridership on the system has gradually increased since City acquisition of the system due partly to the establishment of a 25 cent basic adult fare and recently to a 10 cent fare for the elderly.
In 1974 the City of Kenosha received a 1.5 million dollar grant from the Federal Urban Mass Transportation Administration (UMTA) to assist in the purchase of new buses and related maintenance equipment and in the construction of a new garaging and maintenance facility. Utilizing this new capital equipment, the City of Kenosha presently is implementing a new lineal route configuration and revised schedules. The costs of operating the bus system has increased significantly since 1971 while operating revenues have increased at a slower rate. This has resulted in an increase in the operating deficit from 24 cents per mile in 1971 to 64 cents per mile in 1974. Although the local bus operation thus is not financially selfsufficient, the Kenosha Transit Commission has managed to maintain an adequate level of service through the use of federal and state assistance.
Aside from the local bus system, transit service in the Kenosha Urban Planning District includes two intercity bus carriers which operate routes connecting Kenosha with Racine, Milwaukee, and Chicago and commuter rail service to the City of Chicago. In addition Jelco, Inc., a private contract bus operator, provides service to rural school children, the handicapped, and other groups or organizations on a charter basis.
Survey data to ascertain user characteristics and travel patterns of the local bus operation indicate that the typical rider is a white female, either under 24 or over 65 years of age, having a family income of less than $8,000 per year, and not possessing a driver's license. The plurality of local bus trips in Kenosha is for school purposes, and transfers are made by 24 percent of the riders. Finally, public opinion surveys concerning transit indicate a firm public commitment to public ownership and financing of the local bus system and support for fare subsidies for certain population groups.
The invent.ory of pertinent transit legislation and regulation identified the federal government and the State of Wisconsin as being the major sources of transit aid and regulation. Pursuant to the Federal Urban Mass Transportation Act, as amended, UMTA will provide funds to urban mass transit systems of up to 80 percent of capital improvement costs, 50 percent of operating deficits, 80 percent of technical study costs, 80 percent of elderly and handicapped capital project costs, and 100 percent of demonstration project costs. In addition, the Federal Aid Highway Act provides capital improvement funds for up to 70 percent of mass transit support facilities on any federal aid highway system. The availability of federal funds is constrained by a number of administrative regulations including the approval of a transit development program, the maintenance of local financial support, special consideration of the elderly and handicapped, the conduct of an environmental and energy conservation program, and the institution by 1978 of a uniform system of account and record keeping.
The State of Wisconsin currently provides tax relief, demonstration project assistance, and operating assistance to urban mass transit systems meeting state requirements. The operating assistance program alone provides funds to cover up to two-thirds of the nonfederal share of the operating deficit. Regulation of urban mass transit systems is a responsibility of the Public Service Commission which must approve any changes in routes, schedules, or fares.
Proceeding from this four part inventory, an evaluation of the existing transit system and service was conducted. This evaluation was based on objectives and standards formulated and adopted by the Technical Coordinating and Advisory Committee for the Kenosha transit development process. The primary deficiency in terms of management and personnel was found to be an inadequate number of professional staff members within the Kenosha Department of Transportation.
82

The levels of service also were examined from the standpoints of direct service and the quarter-mile service area. Priority population groups in general were found to be well served by the local bus system. The only notable deficiency for priority groups was service to the elderly and handicapped, and this resulted from their dispersion and their difficulty in riding regularly equipped buses. A need for collecting additional data on the needs of the elderly and handicapped was established. Major travel generators induding employment centers, shopping areas, educational institutions, public and medical institutions, and recreational areas were determined to be well served by the local bus route structure. Service was found deficient, however, during examination of existing travel habits and patterns. The primary needs are to shorten head ways to facilitate better route coordination, to institute one or more crosstown bus routes, and to collect current ridership data to enable the effective location and scheduling of such routes.
In addition to any capital investments required to correct deficiencies in the levels of service, the evaluation identified the need for better access to the new transit garage and for the provision of transit shelters to increase the comfort of waiting transit patrons. Finally, greater emphasis on marketing and public relations was found needed, primarily to devise a unified and consistent marketing program to increase people's awareness of the operation and benefits of the local bus system.
Based upon deficiencies identified in the evaluation and upon an investigation of all feasible alternatives, a five-year coordinated schedule of capital and operating improvements was recommended. As detailed in Chapter VII, the recommended transit development program calls for:
1. Construction of a bus garage access road (capital cost: $40,000);
2. Adjustments in the configuration and scheduling of the existing five route city bus system;
3. Addition of a sixth city bus route;
4. Construction of fourteen bus shelters (capital cost: $88,000);
5. Extension of 30 minute headways to six peak hours in 1976;
6. Reduction of all head ways to 30 minutes in 1977;
7. Reduction of peak hour headways to 20 minutes in 1978;
8. Hiring of a professional transit planner in the Kenosha Department of Transportation;
9. Establishment of demand-responsive transit service for the elderly and handicapped;
10. The conduct in 1977 of an on-board bus survey;
11. The conduct of a technical study to develop a unified marketing program; and
12. The conduct of a technical study to institute project FARE, a uniform system of account and record keeping required in 1978 by UMTA.
In addition to the access driveway and shelters, the above recommendations require a capital investment to purchase two specially equipped mini-buses in 1977 (capital cost: $80,000) and 10 regular city buses in 1978 (capital cost: $600,000). The proposed operating improvements will require the hiring of 36 additional bus drivers in the next five years.
Based upon the staged implementation of these improvements a financial analysis was conducted to assure feasibility. Capital costs for the five-year period total $808,000. Of this, the City of Kenosha would be responsible for $162,000 or an average annual investment of $32,000. The operating costs and revenues were also projected on the basis of proposed increases in the level of service provided and estimates of probable transit ridership. The local share of the resulting deficit represented a reasonable increase in the level of financial support required to an average annual share of $170,000. Assuming that existing state and federal operating programs continue providing average annual operating subsidies of $340,000 and $510,000 respectively, and that the strong commitment to improved transit in the City of Kenosha continues, it was determined that the recommended program of transit improvements is financially feasible.
Adoption and implementation of the transit development program recommended in this report would provide the Kenosha Urban Planning District with the maximum practical level of mass transit service. It would serve to concentrate appropriate resources and capabilities on the areas of need, assuring a more effective use of total public resources in providing mass transportation. The present urgency in providing continued and improved transit service to the Kenosha urban area requires the speedy implementation of this program by all concerned agencies.
83

(This page intentionally left blank)

APPENDICES

(This page intentionally left blank)

Appendix A
TECHNICAL COORDINATING AND ADVISORY COMMITTEE ON TRANSIT DEVELOPMENT FOR THE KENOSHA PLANNING DISTRICT
Robert F. Kolstad ...................................... Director, Department of Community Development, City of Kenosha Chairman
Frank J. Bennett .•................................................................ Alderman, City of Kenosha Howl!rd J. Blackmon ............................................................... Chairman, Town of Somers Wallace E. Burkee .................................................................... Mayor, City of Kenosha Mrs. Ben Ami Chemerow .............................................................. League of Women Voters John B. Culver .............................................................. Kenosha Manufacturers Association Arne L. Gausmann ............................................ Director, Bureau of Systems Planning, Division of Planning,
Wisconsin Department of Transportation Keith W. Graham .................................................................. Assistant Director, SEWRPC Dr. Thomas N. Harvey ................................... Regional Representative, Urban Mass Transportation Administration Charles W. Haubrich .......................................................... Chairman, Town of Pleasant Prairie John O. Hibbs .................................................... Division Engineer, Federal Highway Administration,
U. S. Department of Transportation Alvin G. Hoffman ................................................................. Alderman, City of Kenosha Edward A. Jenkins ........................................................ Transportation Director. City of Kenosha Thomas R. Kinsey .................................................. District Engineer, District 2, Division of Highways.
Wisconsin Department of Transportation Mrs. lone Kreamer ...................................................... American Association of University Women Dr. William J. Murin ...•......................................................... University of Wisconsin·Parkside Eric H. Olson ..•................................................... Chairman, Kenosha County Board of Supervisors Francis J. Pitts ................................................•........ Vice-Chairman, Kenosha County Board of
Supervisors; Commissioner, SEWRPC
Rev. Robert Rodriquez ........................................................... Director, Latin American Center Eugene Ryshkus ...................................................... Board of Education, Kenosha Unified Schools Mrs. Shirley Schmerling .......................................................... University of Wisconsin·Parkside Donald Taske ..•......•................................................ President, Downtown Kenosha Association Bert Thompson ............................................................................ Senior Citizens Tony Valeo ............................................................. Chairman, Kenosha Transit Commission Elmer F. Wilda ............................................................. Plumbers and Steamfitters Local 182 Charles Woelffer .................................................. Transportation Supervisor, Kenosha Unified Schools
85

(This page intentionally left blank)

Appendix B
KENOSHA TRANSIT COMMISSION FINANCIAL STATEMENT: 1971-1974
Statement of Expenditures-Transit Division
1971 (Note 1) 1972 1973 1974
Operation and Maintenance Salaries and Wages
Administrative $ 13,276.45 $ 15,274.82 $ 23,531.98 Operating $36,744.83 162,400.89 161,848.95 183,159.89
36,744.83 175,677.34 177,123.77 206,691.87 Social Security Tax 1,373.45 8,433.11 9,935.17 11,537.35 Wisconsin Retirement Fund 17,233.93 23,264.71 26,150.71 Employees' Group Insurance 135.47 6,649.08 7,470.55 11.416:20 Repairs and Maintenance 4,935.28 38,117.77 42,668.28 70,342.39 Insurance 7,048.00 8,711.00 6,366.00 7,448.81 Utilities 2,297.66 1,457.98 1,494.43 Depreciation 3,956.00 13,878.00 15,754.00 17,488.00 Gasoline, Diesel Fuel and Oil 4,012.61 12,362.20 11,092.58 22,214.46 Building and Land Rental 1,600.00 4,800.00 1,838.00 1,783.87 Operating Supplies 550.73 547.62 515.40 206.16 Advertising 5,497.46 705.00 1,007.17 Office Supplies 14.44 1,553.85 2,116.86 2,901.35 Laundry and Cleaning 33.60 Printing 232.00 182.35 Bus Washing 3,289.00 Janitorial Supplies 623.23 274.57 153.56 Licenses 116.00 437.50 78.00 Telephone 54.42 200.52 331.28 494.97 Travel and Entertainment 145.62 322.71 101.86 850.91 Legal and Financial Services from City 760.00 500.00 500.00 Audit Fee 445.40 724.88 817.35 Appraisal Services 200.00 Clothing Allowance 250.88 2,168.40 Injuries, Loss and Damages 2,512.51 1,095.07 4,756.08 M iscell aneous 223.70 48.51 664.33 224.00
61,142.55 300,887.85 304,888.67 394,015.04 Outlay
Fare Boxes, Coin Counter 3,888.33 File Cabinet 118.50 Soil Tests 233.00
Total Expenditures $65,030.88 $300,887.85 $305,007.17 $394,248.04
87

Statement of Operating Revenues-Transit Division
1971 (Note 1) 1972 1973 1974
Operating Revenues Student Fares $22,175.00 $ 31,649.50 $ 56,707.75 $ 76,318.25 Bus Collections 17,214.06 79,664.29 87,592.42 95,160.66 Charter Fees 117.50 215.00 292.50 350.00 Advertising 5,705.00 2,196.00 120.00 Insurance Reimbursement 391.73 8,645.27 Miscellaneous 200.00 709.40 327.43 61.46
$39,706.56 $117,943.19 $147,507.83 $180,655.64
Statement of Expenditures and Revenues-Transit Division
1971 1972 1973 1974
Revenues $39,706.56 $117,943.19 $147,507.83 $180,655.64
Expenditures Operation and Maintenance 61,142.55 300,887.85 304,888.67 394,015.04 Outlay 3,888.33 118.50 233.00
65,030.88 300.887.85 305,007.17 394,248.04 Excess (Expenditures Over Revenues) (25,324.32) ( 182,944.66) (157,499.34) (213,592.40)
Other Revenue Grants in Aid (Note 2) 37,738.91 174,379.99 149.543.40 130,500.00 Contribution from City Funds (Note 2) 0.00 65,250.00
$149,543.40 $195,750.00 Excess Revenues Over Expenditures
(Expenditures Over Revenues) 12,414.59 (8,564.67) (7,955.94) (17,842.40)
Notes to Financial Statements
Note 1 - TheTransit Division, which operates the City bus lines, commenced operations in September 1971.
Note 2 - The Transit Division received State and Federal aid under the Emergency Employment Act between September 1971 through November 1973. During 1974 the Transit Division received City and State aids totaling $195,750 for the purpose of jointly financing the transit operations. Under the provision of the Grant, the State of Wisconsin subsidized two·thirds and the City of Kenosha one·third of the deficit operations, excluding depreciation expense.
Source: Earl W. Hammill and Company (Certified Public Accountants) and the Kenosha Transit Commission.
88